2016 outlook for u.s. construction
TRANSCRIPT

1
Dodge Data and Analytics
By: Richard Branch
Senior Economist
Dodge Data & Analytics
August 6, 2015
2016 Outlook
for U.S.
Construction

2
Today’s Agenda
Brief Macroeconomic overview
Nonresidential outlook
Multifamily outlook
Big picture review
Implications for VMA members
Questions

3
Economic growth is expected to pick up in 2015 after a disappointing start.
Key Economic
Forecasts
GDP
2014: 2.4%
2015: 2.3%
2016: 3.2%
Unemployment Rate
2014: 6.2%
2015: 5.3%
2016: 4.9%
CPI
2014: 1.6%
2015: 0.4%
2016: 2.6%
Fed Funds Rate
2014: 0.09%
2015: 0.2%
2016: 1.7%
U.S. Macroeconomic Picture
4
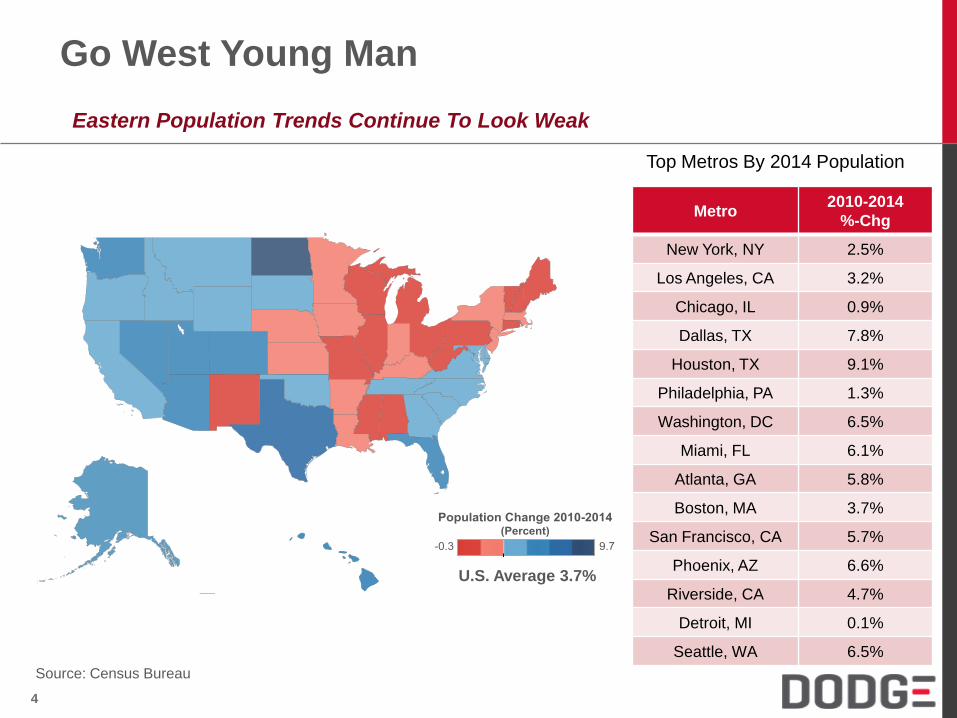
Eastern Population Trends Continue To Look Weak
Go West Young Man
Metro 2010-2014
%-Chg
New York, NY 2.5%
Los Angeles, CA 3.2%
Chicago, IL 0.9%
Dallas, TX 7.8%
Houston, TX 9.1%
Philadelphia, PA 1.3%
Washington, DC 6.5%
Miami, FL 6.1%
Atlanta, GA 5.8%
Boston, MA 3.7%
San Francisco, CA 5.7%
Phoenix, AZ 6.6%
Riverside, CA 4.7%
Detroit, MI 0.1%
Seattle, WA 6.5%
Top Metros By 2014 Population
Source: Census Bureau
U.S. Average 3.7%

5
2014 Size of Market - $591 billion
Relative Size of U.S. Construction Starts Market
.

6
Nonresidential Construction Market Cycles
Recovery in Place, But a Long Road Back
.
*Data is through 2015Q2
7
Commercial
Construction
Outlook
Dodge Data and Analytics

8
Commercial construction has made great progress.
Moderate pace of recovery to continue.
Commercial Construction Starts
Includes stores, offices, warehouses, hotels and auto sector

9
Retail Building Starts
Store construction making very slow progress.
Online sales gaining market share. Extreme discounters expanding.
Store renovations higher share of activity.

10
Retail Building Starts High vacancy rates and urban focus keeps the size of new projects historically low.

11
Retail Building Starts Discounters, dollar stores, supermarkets, and home stores are building the most.
Dodge Data & AnalyticsRetail Chain Construction Starts
First Four Months of 2015
Thous SqFt Thous $
1 Wal-Mart Store 3,521 570,322
2 Kroger Grocery Store 1,181 115,722
3 Wegmans Grocery Store 694 64,000
4 Dollar General 669 62,544
5 Publix Grocery Store 660 54,697
6 CVS Pharmacy 443 54,105
7 IKEA Furniture Store 351 46,041
8 HEB Grocery Store 453 43,700
9 Costco 598 40,716
10 Family Dollar 444 38,967
11 AutoZone Auto Parts Store 438 38,540
12 Nordstrom Store 0 33,150
13 Lowe's Home Center 395 30,060
14 Aldi Grocery Store 296 29,238
15 Dollar Tree 110 29,155
16 Tractor Supply Store 538 28,638
17 Whole Foods 84 28,313
18 Harbor Freight Tools 18 20,657
19 Menards Home Improvement 229 20,000
20 King Soopers 127 19,726
21 Goodwill Store 184 17,853
22 Rite Aid 90 17,589
23 Starbucks 25 17,357
24 Taco Bell Restaurant 41 16,381
25 Texas Roadhouse Restaurant 105 15,500
26 Wendy's Restaurant 38 13,618
27 Chick Fil A Restaurant 31 13,134
28 Food Lion Store 43 13,100
29 McDonalds Restaurant 60 12,606
30 The Fresh Market 74 12,574
# Chains Thous SqFt Thous $
Value Chains 3 4,303 628,891
Grocery Stores 9 3,612 381,070
Home store 5 1,531 145,396
Dollar Stores 3 1,223 130,666
Restaurants 6 299 88,596
Pharmacies 2 534 71,694
Other 2 438 71,690
12
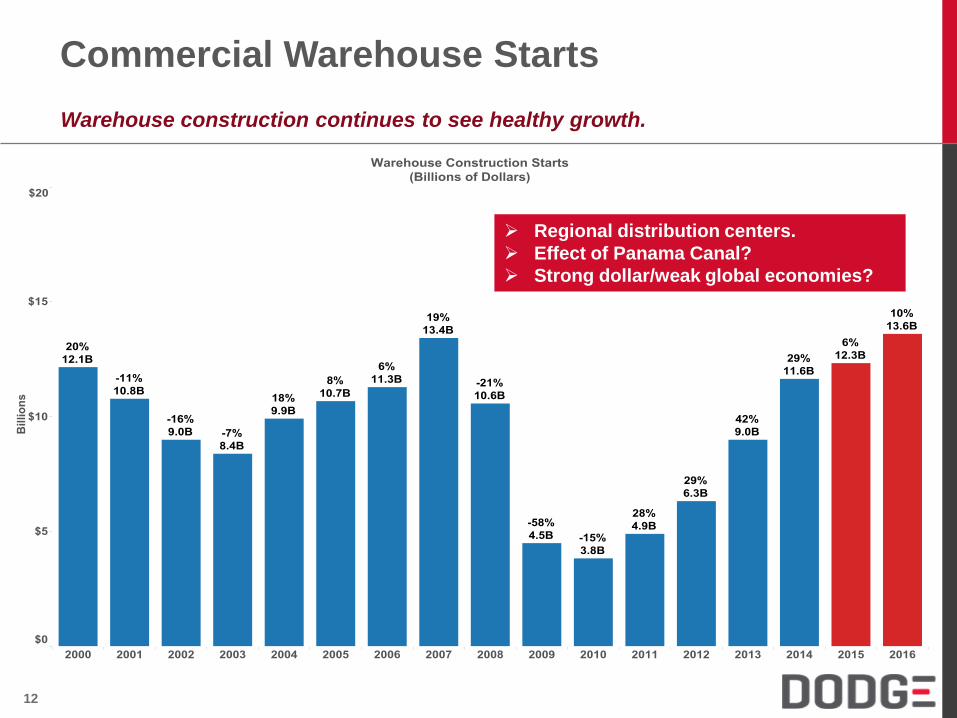
Commercial Warehouse Starts
Warehouse construction continues to see healthy growth.
Regional distribution centers.
Effect of Panama Canal?
Strong dollar/weak global economies?

13
Commercial Warehouse Starts
Warehouse construction continues to see healthy growth.
2015 Q2 = 9.8%
2007 Cyclical Low = 9.8%
Source: CB Richard Ellis Econometric Advisors
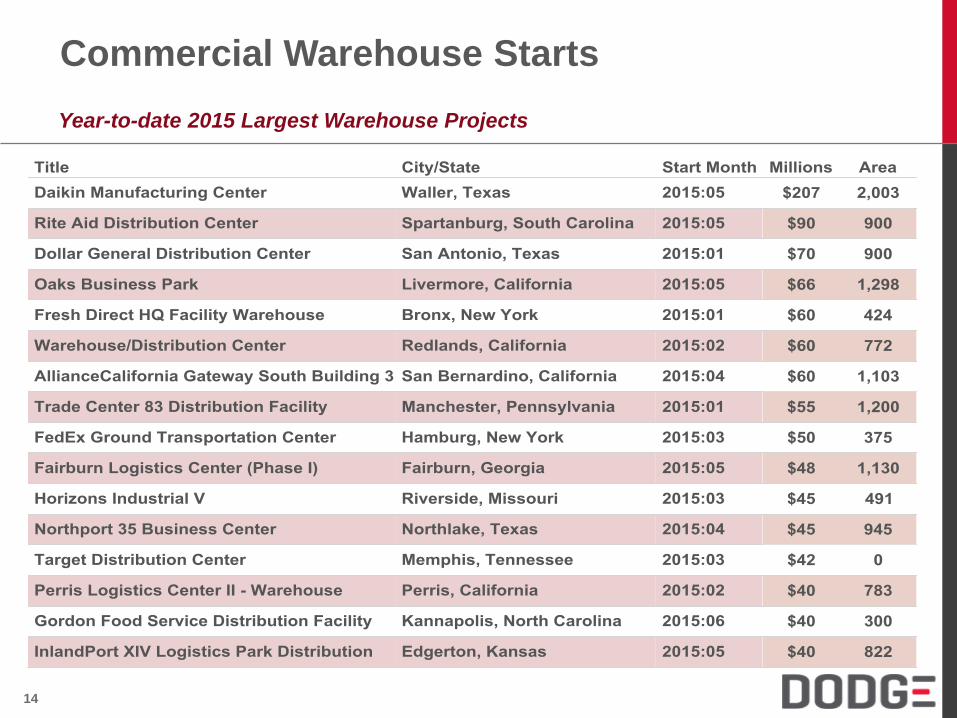
14
Year-to-date 2015 Largest Warehouse Projects
Commercial Warehouse Starts
15
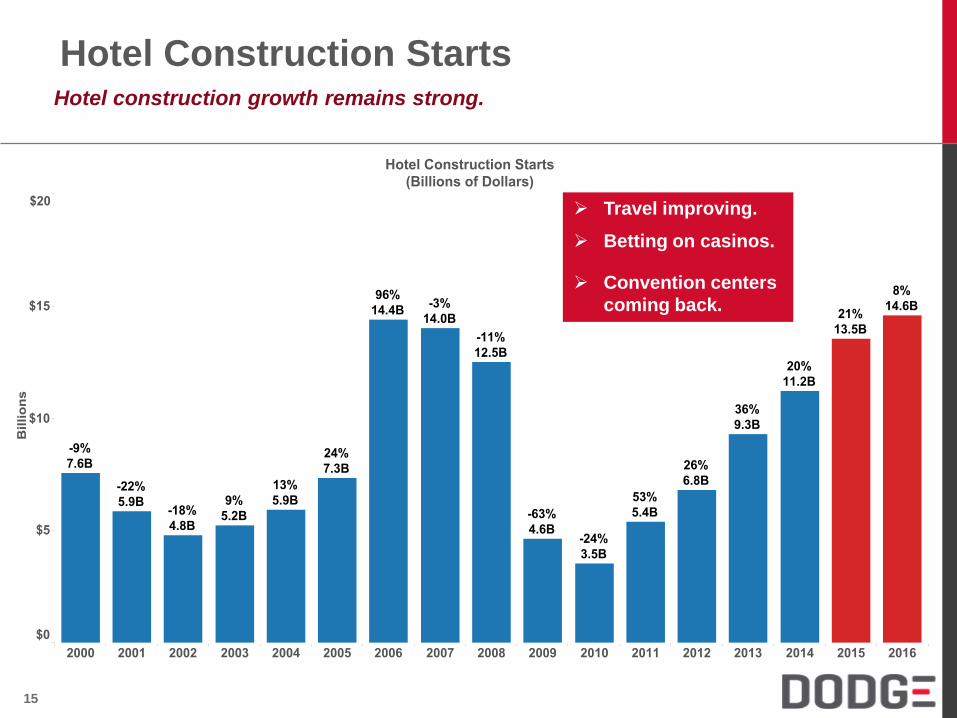
Hotel Construction Starts Hotel construction growth remains strong.
Travel improving.
Betting on casinos.
Convention centers
coming back.

16
Year-to-date 2015 Largest Hotel Projects
Hotel Construction Starts
17
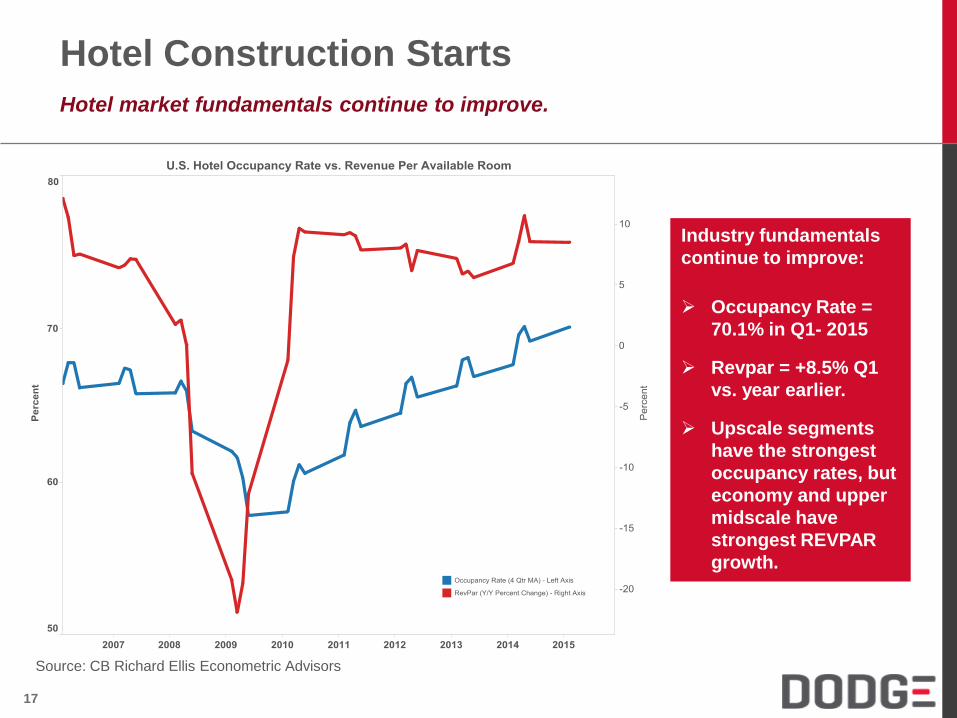
Hotel Construction Starts
Hotel market fundamentals continue to improve.
Industry fundamentals
continue to improve:
Occupancy Rate =
70.1% in Q1- 2015
Revpar = +8.5% Q1
vs. year earlier.
Upscale segments
have the strongest
occupancy rates, but
economy and upper
midscale have
strongest REVPAR
growth.
Source: CB Richard Ellis Econometric Advisors

18
Office Building Starts
Construction expansion was late, but has now begun to take hold.
Gov’t offices,
data centers, HQs
Speculative
development?
Rising office
employment.

19
Year-to-date 2015 Largest Office Projects
Office Construction Starts

20
Office vacancy rates continue to fall.
Overbuilding was less than in past cycles.
Rising employment
helping absorption.
Office market fundamentals (employment, vacancy rates) are improving.
Office Building Starts
2015 Q2 = 13.5%
2007 Cyclical Low = 12.4%
Source: CB Richard Ellis Econometric Advisors

21
Institutional
Construction
Outlook
Dodge Data and Analytics

22
Institutional buildings are beginning to turn the corner.
Stirrings of improving public
finances are enhancing outlook.
Institutional Building Starts
Includes education, dorms, healthcare, recreation, public , religious, and transportation
23
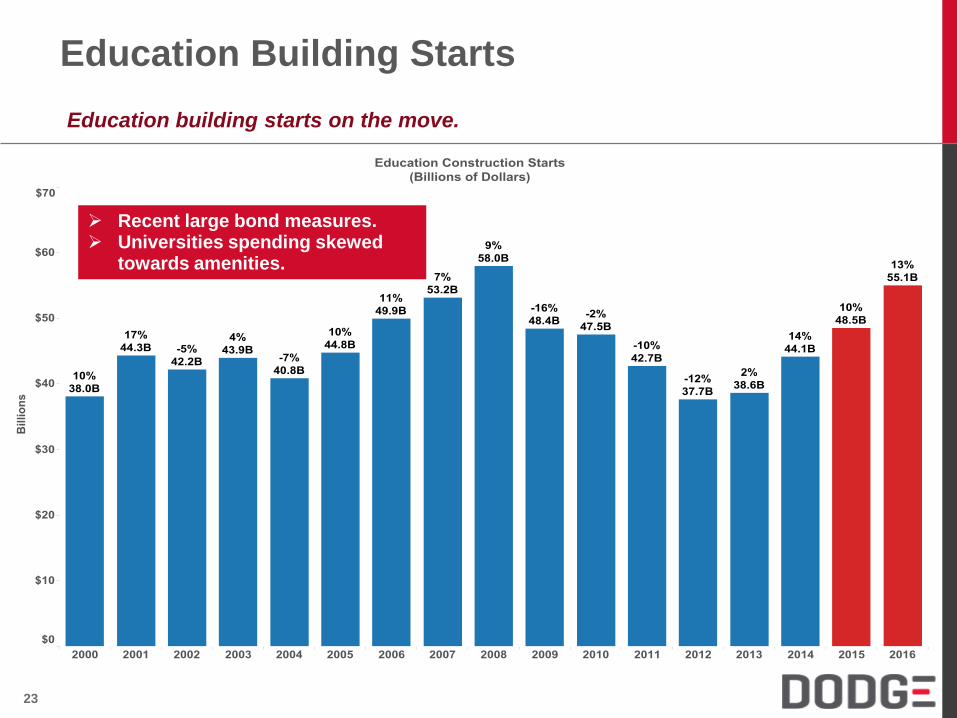
Education building starts on the move.
Recent large bond measures. Universities spending skewed
towards amenities.
Education Building Starts

24
School construction (K-12) is larger, but more volatile than college/univ. starts.
In 2014, sq. ft.
for K-12 school
construction
was 3.5 times
the size of the
post-secondary
market.
Back in the
1990s, it was
more than 7
times the size of
college starts.
Education Building Starts

25
Enrollment growth ultimately drives activity for many segments.
Education Building Starts
Elementary/ junior high school enrollments will grow faster than high school enrollments over the next five years.
College enrollments surged during the recession, but will grow more slowly as job opportunities improve.
13,500
14,000
14,500
15,000
15,500
16,000
16,500
17,000
36,000
37,000
38,000
39,000
40,000
41,000
42,000
Projections of School Enrollments by Grade (Thousands)
K-8 (left)
9-12 (right)
Source: NCES
10,000
12,000
14,000
16,000
18,000
20,000
22,000
24,000
2000 2002 2004 2006 2008 2010 2012 2014 2016 2018 2020
College Enrollment (Thousands)
Source: NCES
Public School Enrollment K-12 by Regionin Thousands
2012 2022 Chg % Chg
US 49,636 52,952 3,316 6.7%
Northeast 7,904 7,972 68 0.9%
Midwest 10,556 10,724 168 1.6%
South 19,090 20,742 1,652 8.7%
West 12,086 13,513 1,427 11.8%
Source: NCES

26
Public school enrollment growth is strongest in the population magnets of the South and West.
Education Construction Starts
Public School Enrollment K-12 by StateLargest Gainers, Biggest Losers
2012 2022 Abs Chg % Chg 2012 2022 Abs Chg % Chg
TX 5,078 5,783 705 13.9% DC 73 69 -4 -5.5%
CA 6,287 6,884 597 9.5% MA 949 943 -6 -0.6%
FL 2,694 3,038 344 12.8% IN 1,037 1,026 -11 -1.1%
AZ 1,090 1,314 224 20.6% LA 706 694 -12 -1.7%
NC 1,515 1,678 163 10.8% NJ 1,347 1,330 -17 -1.3%
WA 1,049 1,193 144 13.7% AL 740 719 -21 -2.8%
GA 1,695 1,821 126 7.4% MS 488 464 -24 -4.9%
VA 1,262 1,384 122 9.7% WV 281 256 -25 -8.9%
MD 858 979 121 14.1% MI 1,558 1,521 -37 -2.4%
MN 846 960 114 13.5% OH 1,728 1,686 -42 -2.4%
Biggest Losers Largest Gainers
Source: National Center for Education Statistics

27
Year-to-date 2015 Largest Education Projects
Education Construction Starts

28
Dorm starts have recovered to pre-recession levels
Colleges & universities in arms race. Endowment growth strong. Military construction budget stable.
Dormitory Building Starts
29
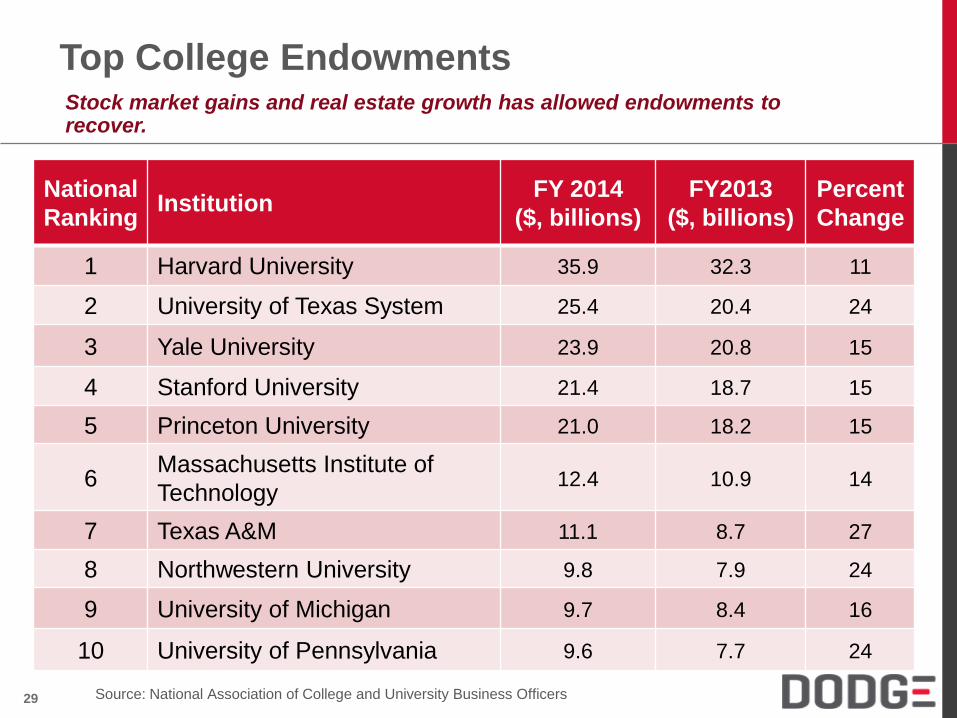
Stock market gains and real estate growth has allowed endowments to recover.
Top College Endowments
National
Ranking Institution
FY 2014
($, billions)
FY2013
($, billions)
Percent
Change
1 Harvard University 35.9 32.3 11
2 University of Texas System 25.4 20.4 24
3 Yale University 23.9 20.8 15
4 Stanford University 21.4 18.7 15
5 Princeton University 21.0 18.2 15
6 Massachusetts Institute of
Technology 12.4 10.9 14
7 Texas A&M 11.1 8.7 27
8 Northwestern University 9.8 7.9 24
9 University of Michigan 9.7 8.4 16
10 University of Pennsylvania 9.6 7.7 24
Source: National Association of College and University Business Officers

30
Year-to-date 2015 Largest Dorm Projects
Dormitory Construction Starts

31
Recovery in healthcare facilities kept on hold.
Uncertainty affecting activity.
Long-term support from
demographics and new
technology.
Healthcare Construction Starts

32
Top states for total and age 65+ population growth from 2013-2030 (based on 2000 Census)
Healthcare Construction Starts
State
Change in
Total
Population
(Thousands)
Percent Change
United States 46,050 15%
Arizona 3,246 49%
Nevada 1,120 40%
Florida 7,673 39%
North Carolina 3,255 33%
Texas 8,285 31%
Utah 803 28%
Georgia 2,602 26%
Colorado 1,271 24%
South Carolina 1,092 23%
Idaho 304 19%
South Dakota 154 18%
Washington 1,224 18%
State
Change in Total
Population > 65
(Thousands)
Percent Change
United States 29,442 66%
Arizona 1,258 123%
Wyoming 84 107%
Florida 3,851 106%
New Mexico 315 103%
Nevada 381 100%
North Dakota 97 95%
Virgin Islands 17 90%
Texas 2,575 87%
South Carolina 617 85%
Montana 139 85%
Alaska 56 84%
South Dakota 106 84%
Source: Economy.com

33
Year-to-date 2015 Largest Healthcare Projects
Healthcare Construction Starts

34
U.S.
Housing
Outlook
Dodge Data and Analytics

35
Multifamily housing turned the corner earlier thanks to rental market demand.
Rental demand on rise
Demographics key
Market improvement to continue
Multifamily Housing Starts

36
Top 20 year-to-date metros in 2015 based on dollar value of starts through June.
Multifamily Housing Starts
37
Dodge Data & Analytics
Total Construction Outlook
38
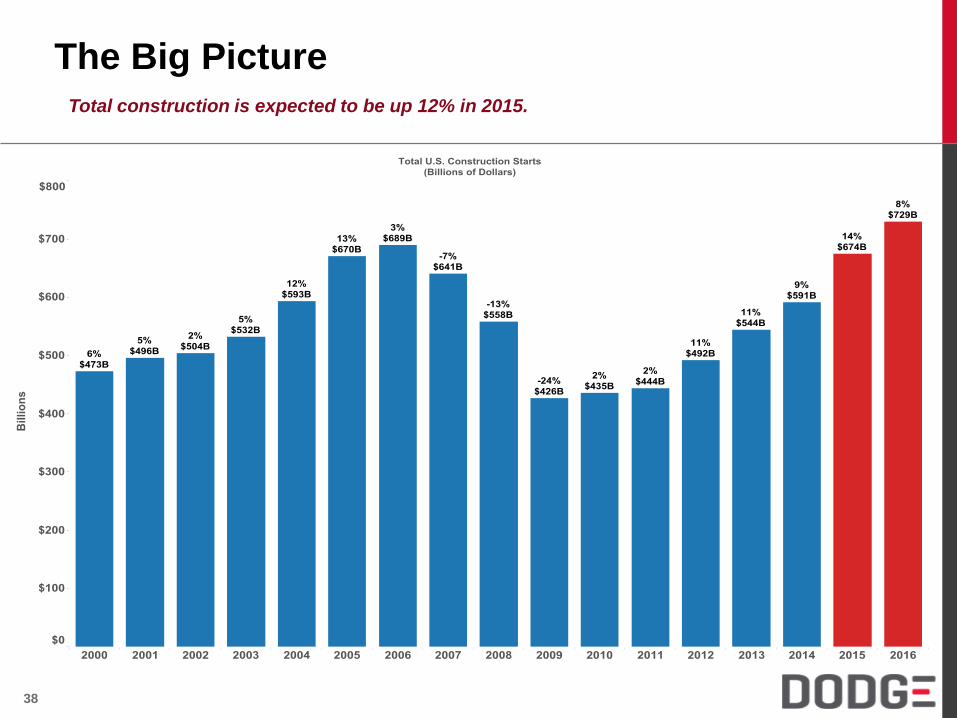
The Big Picture Total construction is expected to be up 12% in 2015.

39
The Big Picture Total construction is expected to be up 12% as the recovery becomes more complete.

40
Implications for Valve Shipments Rising nonresidential construction starts a good sign for valve shipments
Source: Dodge Data & Analytics, Valve Manufacturers Association
41
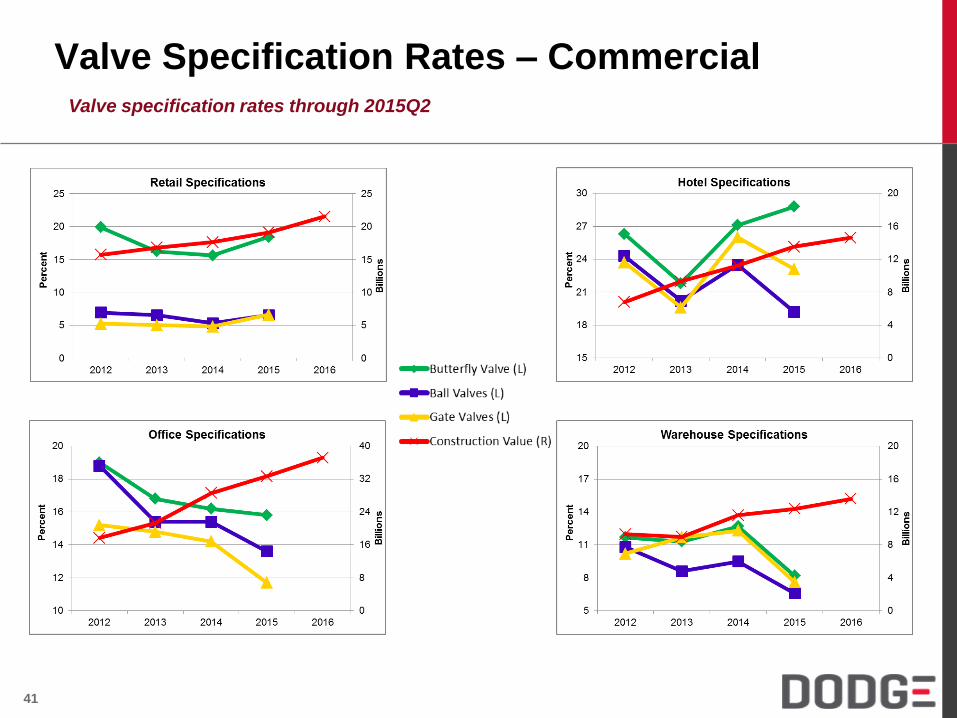
Valve Specification Rates – Commercial Valve specification rates through 2015Q2

42
Valve Specification Rates – Institutional Valve specification rates through 2015Q2
43
Thank You!
Dodge Data and Analytics