2016 national self-storage report v2 - marcus & …officeindustrialcre.com/files/market...
TRANSCRIPT

Research Services
2398 E. Camelback Road | Suite 550 | Phoenix, AZ 85016
(602) 687-6700
Of� ces Throughout the U.S. and Canada
2016
NYSE: MMI
U.S. SELF STORAGE INVESTMENT FORECAST
www.MarcusMillichap.com
Marcus & Millichap is not af� liated with, sponsored by, or endorsed by any commercial tenant or lessee identi� ed in this advertisement. The presence of anycorporation’s logo or name is not intended to indicate or imply af� liation with, or sponsorship or endorsement by, said corporation of Marcus & Millichap,its af� liates or subsidiaries, or any agent, product, service, or commercial listing of Marcus & Millichap, and is solely included for informational purposes only.Marcus & Millichap is a service mark of Marcus & Millichap Real Estate Investment Services, Inc., © 2016 Marcus & Millichap. All Rights Reserved.

1
To Our Valued Clients:
The U.S. economy once again demonstrated its rugged durability last year as it maintained forward traction amid a variety of
headwinds. The harsh winter in the fi rst quarter of 2015 restrained hiring, and weakening international economies joined China’s
currency devaluation to send shock waves through Wall Street. Some headwinds, however, worked to the advantage of the
self-storage sector. Dramatically lower oil prices boosted households’ discretionary income while the stronger dollar increased
American purchasing power, and both placed downward pressure on infl ation. These factors, together with steady job growth
and modest wage gains, heightened self-storage demand.
The outlook for self-storage facilities in 2016 remains strong as broader economic momentum supports household formation and
consumption — both positive demand drivers for these properties. The sector has also benefi ted from limited construction, but
leading indicators point to additional development in the coming year. The favorable supply/demand balance tightened vacancy
rates last year, and current forecasts point to a continuation of that trend, although the pace of contraction could ease. New
hurdles undoubtedly await investors in 2016, but strengthening consumer balance sheets and still-positive economic momentum
will favor self-storage performance.
Investor demand for self-storage assets has placed steady pressure on pricing cap rates through much of the country. The active
investor pool together with readily available capital combined to lift transaction activity. Although Wall Street turbulence and the
prospects of additional Federal Reserve rate hikes cloud the investment activity outlook, the market remains aligned for continued
transactional momentum.
The new opportunities brought by the coming year will be reinforced by the spread of positive dynamics, offering investors a wide
range of options. We hope this report provides useful insights on a variety of trends, markets and investment strategies. Our
investment professionals look forward to assisting you in meeting your goals.
Sincerely,
2016 U.S. Self-Storage Investment Forecast
John ChangFirst Vice President | Research Services
Richard BirdFirst Vice President | National Director

2
Table of Contents
National Perspective
Executive Summary .........................................................................................................................................................................................................................3
National Economy ............................................................................................................................................................................................................................4
Capital Markets ................................................................................................................................................................................................................................4
Regional Overview
Midwest ...........................................................................................................................................................................................................................................5
Southwest ........................................................................................................................................................................................................................................6
West ................................................................................................................................................................................................................................................7
South Atlantic ...................................................................................................................................................................................................................................8
Northeast .........................................................................................................................................................................................................................................9
Markets
Atlanta ...................................................................................................................................................................................................................................10
Austin ....................................................................................................................................................................................................................................11
Baltimore ...............................................................................................................................................................................................................................12
Boston ...................................................................................................................................................................................................................................13
Charlotte ................................................................................................................................................................................................................................14
Chicago .................................................................................................................................................................................................................................15
Cincinnati ...............................................................................................................................................................................................................................16
Cleveland ...............................................................................................................................................................................................................................17
Columbus ..............................................................................................................................................................................................................................18
Dallas ....................................................................................................................................................................................................................................19
Denver ...................................................................................................................................................................................................................................20
Detroit ....................................................................................................................................................................................................................................21
Fort Lauderdale .....................................................................................................................................................................................................................22
Fort Worth .............................................................................................................................................................................................................................23
Houston .................................................................................................................................................................................................................................24
Indianapolis ...........................................................................................................................................................................................................................25
Las Vegas ..............................................................................................................................................................................................................................26
Los Angeles ...........................................................................................................................................................................................................................27
Suburban Maryland ...............................................................................................................................................................................................................28
Memphis ...............................................................................................................................................................................................................................29
Miami .....................................................................................................................................................................................................................................30
Minneapolis-St. Paul ..............................................................................................................................................................................................................31
Nashville ................................................................................................................................................................................................................................32
New York City ........................................................................................................................................................................................................................33
Northern New Jersey .............................................................................................................................................................................................................34
Oakland .................................................................................................................................................................................................................................35
Orange County ......................................................................................................................................................................................................................36
Orlando .................................................................................................................................................................................................................................37
Philadelphia ...........................................................................................................................................................................................................................38
Phoenix .................................................................................................................................................................................................................................39
Portland .................................................................................................................................................................................................................................40
Riverside-San Bernardino ......................................................................................................................................................................................................41
Sacramento ...........................................................................................................................................................................................................................42
Salt Lake City ........................................................................................................................................................................................................................43
San Antonio ...........................................................................................................................................................................................................................44
San Diego ..............................................................................................................................................................................................................................45
San Francisco ........................................................................................................................................................................................................................46
San Jose ...............................................................................................................................................................................................................................47
Seattle ...................................................................................................................................................................................................................................48
St. Louis ................................................................................................................................................................................................................................49
Tampa-St. Petersburg ............................................................................................................................................................................................................50
Suburban Virginia ..................................................................................................................................................................................................................51
West Palm Beach ..................................................................................................................................................................................................................52
Client Services
Offi ce Locations ....................................................................................................................................................................................................................... 54-55
Contact Page .................................................................................................................................................................................................................................56

3
2016 Self-Storage Outlook
Vacancy:
The strong employment outlook will bolster self-storage demand, putting downward
pressure on national vacancy rates. This year vacancy will fall 40 basis points to 10.8
percent, following an 80-basis-point drop registered in 2015.
40 basis point
decrease in vacancy
National Self-Storage Performance Trends
• The self-storage expansion cycle will likely persist through 2016 as steady job growth supports unit-demand. Occu-
pancy and rent levels are both expected to rise in the coming year.
• The positive economic environment and demographics sustaining multifamily demand is also boosting the self-storage
sector. Temporary storage required by more transient residents remains one of the main demand drivers for the sector.
Additionally, the tighter living spaces offered by rental housing, particularly in urban locales, often cannot accommodate
all of a resident’s belongings.
• While positive demand dynamics will remain in place, national vacancy rates will begin to face challenges as self-stor-
age builders begin to fi ll the development pipeline.
• Property operators are aggressively growing rental rates as units continue to fi ll. The average asking rent will reach a
fi ve year high in 2016 for both climate controlled and non-climate controlled space.
Investment Overview
• Historically low rates have equipped self-storage investors with considerable purchasing power and positive leverage,
supporting a steady rise in valuations. Despite substantial buyer interest, the limited volume of available assets has
impeded deal fl ow.
• Public self-storage REITs have outperformed most other investment funds, pulling in consistent returns and steady
stock appreciation.
• Intense investor demand has put downward pressure on fi rst-year yields, particularly in blue-chip coastal markets. Cap
rates may begin to fl atten, however, as escalating values thin the buyer pool.
• A signifi cant volume of pre-recession originated debt will come due over the next couple of years, causing property
owners to consider their fi nancing and capitalization plans. This could lead to additional assets reaching the market.
Climate Controlled Rents:
As available units become increasingly hard to come by, rent growth for climate con-
trolled space will reach a fi ve-year high. Average asking rent rates climbed 3.2 percent
last year and are expected to jump another 4.3 percent to $1.63 per square foot in 2016.
4.3%increase in CC rents
Non-Climate Controlled Rents:
Tight market conditions and steady demand will boost rent for non-climate controlled
units this year. The average asking rate for this subsector will rise to $1.29 per square
foot, an increase of 4.3 percent year over year. This will match rent growth posted
in 2015.
4.3%increase in Non-CC rents
Executive Summary

4
U.S. Economic Overview
The United States economy maintained a steady pace of growth last year,
displaying resiliency and registering solid improvement in several key indi-
cators. Foremost, the domestic labor market remains in sound health, with
job creation advancing for a record-setting 71 consecutive months through
January, despite falling energy prices and volatility in foreign fi nancial mar-
kets. The relative strength of the U.S. dollar coupled with wavering foreign
demand for domestic goods have dampened U.S. exports, although these
forces combined to restrain infl ation and augment the purchasing power of
the U.S. consumer. Choppy yet resilient GDP growth and positive economic
fundamentals encouraged the Federal Reserve to lift its overnight lending
rate at the close of 2015. The move was widely anticipated and will likely
have a limited impact on broader interest rate activity; additional hikes in the
central bank’s benchmark are anticipated in 2016, however.
The waxing and waning pattern of the U.S. economy has mitigated the risk
of overheating as periods of strong GDP growth are followed by a down
round, creating a prolonged and sustained expansionary cycle. This trend is
expected to continue through 2016, indicating another year of modest eco-
nomic growth. Wage improvements and employment levels that have sur-
passed the pre-recession peak have left U.S. consumers poised to lead the
economy in the coming year. Domestic spending on retail goods remains
robust, generating new requirements for storage space when some older
goods are replaced. Rising retail spending coupled with falling homeown-
ership rates indicate a solid base of renters whose mobility and downsizing
households will provide momentum for the self-storage sector this year.
Job Growth Driving SpendingRetail Sales Total Employment
Y-O
-Y C
hang
e in
Ret
ail S
ales
Y-O
-Y C
hange in Em
ploym
ent-10%
-5%
0%
5%
10%
-6%
-3%
0%
3%
6%
141312111009080706 15
Ann
ualiz
ed Q
uart
erly
Cha
nge
in G
DP
U.S. GDP
-10%
-5%
0%
5%
10%
16*141005009590
Capital Markets
Consistent economic growth and strengthening property operations con-
tinue to encourage investment in self-storage properties and intensify com-
petition among debt providers to supply acquisition fi nancing. Self-storage
assets in primary metros still receive funding and leverage of up to 75 per-
cent from most sources, though loan terms and leverage can vary in sec-
ondary and tertiary metros. Investors seeking 10-year funding continue to
tap CMBS lenders, where all-in rates typically start in the 5 percent range.
Spreads here have widened recently, however, as mortgage bond investors
and subordinate bond buyers, specifi cally, demand higher yields. Upward
pressure on CMBS spreads may persist in the coming months as investors
and ratings agencies continue to reassess credit risks in light of activity in
lower-rated corporate bonds issued by energy-sector companies.
Local, regional and national banks remain commonly employed sources of
three- and fi ve-year debt for self-storage property owners and investors.
Leverage tops out at 75 percent, while all-in rates vary over the appropriate
lending benchmarks. First-time buyers, meanwhile, frequently utilize lend-
ing programs from the Small Business Administration, most notably the 7A.
SBA loans are typically indexed to the prime rate, a short-term benchmark,
and can run for a term up to 25 years. Overall, the interest rate environment
remains favorable for commercial real estate borrowers. The 10-year U.S.
Treasury yield remains well below long-term norms, and low interest rates
will likely persist as foreign capital maintains a strong bid for the safe hav-
en of U.S. government securities. At the short end of the yield curve, the
Fed’s recent hike in the overnight lending rate had minimal effect on lending
spread over short-term benchmarks.
Capital Markets
National Economy
* Forecast
Self-Storage Cap Rate vs. 10-Year Treasury
Ave
rage
Rat
e
Cap Rate 10-Year Treasury Rate
0%
3%
6%
9%
12%
1513110907050301
230 bps
Cap RateLong-Term Average 7.9%
10-Yr Long-TermTreasury Average 3.1%
540 bps
490 bps
430 bps
CM
BS
Issu
ance
(bill
ions
)
CMBS Issuance
$0
$75
$150
$225
$300
15141312111009080706050403020100

5
Midwest
The steady Midwestern self-storage market will gather steam in 2016 as
operations continue to improve and the regional economy strengthens. The
area is generally characterized as being resistant to big swings in the nation-
al economy. The member states rarely experience an upsurge during strong
expansions but also do not suffer as bad when recession hits. Other than
the auto-heavy areas near the Great Lakes, the rest of the Corn Belt fared
well during the last down cycle, leaning on the agriculture and manufactur-
ing sectors while also avoiding the housing run-up. Despite regional stability,
self-storage construction has been lackluster in recent years, although devel-
opers are beginning to show signs of confi dence in the larger metros. Overall,
vacancy continues to drop, priming the region for sizable rent improvements
in the coming year.
Market stability coupled with cap rates that trend higher than those in the
Sun Belt draw heavy investor interest to the region, particularly for buyers
with long-term investment strategies. Institutional activity is still prevalent in
many Midwestern metros, although REIT purchasing is wholly focused on
best-in-class product in premier locations. When you move outside the ur-
ban core, cap rates jump as the infl uence of large equity groups begins to
fade. In the Ohio metros, opportunities for non-institutional investors exist for
assets in these fi rst-tier tertiary markets that offer better equity returns com-
pared with other more competitive MSAs. Detroit is poised for a solid year
as the automotive industry is continuing to build momentum. Light vehicle
sales nationwide are expected to grow in 2016, surpassing that of the prior
cycle’s peak. In Chicago, robust population density and intense urbanization
have kept self-storage fundamentals strong, although a lack of available list-
ings have stifl ed transaction velocity. Unremarkable development activity in
St. Louis coupled with steady demand has enabled occupancy rates to see
incremental improvements. The metro continues to boast the lowest vacancy
of all the Midwestern markets observed.
Midwest Region Sales Highlights
** Net Rentable Square Footage
Sources: Marcus & Millichap Research Services; CoStar Group Inc.; REIS Services LLC
Property NameCity, State
Priceper
Sq. Ft.NRSF**
SalesPrice
Regional Overview
Average Price and Cap Rate Trends
$30
$40
$50
$60
$70
Ave
rage
Pric
e p
er S
q. F
t.
11 12 13 1514
Cap
Rate
2%
4%
6%
8%
10%
Ren
ts p
er S
qua
re F
oot
Vacancy and Rent TrendsRents - CCVacancy
$0
$0.5
$1.0
$1.5
$2.0
Vacancy R
ate
Rents - Non CC
0%
5%
10%
15%
20%
16*1514
Average Price Cap Rate
* Forecast
Mini Storage Depot Columbus, OH 418,020 $25,250,000 $60
A-A-A Storage Champaign & Urbana, IL 164,167 $10,000,000 $61
Alsip Self Storage Alsip, IL 103,400 $6,800,000 $66
Tyler Storage Mentor, OH 62,750 $6,074,000 $97
1-800-Mini-Storage Redford, MI 52,442 $5,000,000 $95
Compass Self Storage River Grove, IL 70,000 $4,450,000 $64
All-American Storage Minneapolis, MN 77,000 $3,100,000 $40
Outer Loop Storage Louisville, KY 45,440 $1,840,000 $40

6
Southwest
Southwestern property fundamentals continue to improve with positive net
migration and steady job creation bolstering self-storage demand. Despite
energy-sector dampening, the region boasts one of the lowest overall va-
cancy rates in the country with market conditions expected to tighten fur-
ther in the coming year. The decline in oil prices is undoubtedly having an
impact on energy-reliant markets in the Southwest, particularly Houston.
What this means for the self-storage industry, however, is uncertain. The
asset class is generally know for being resistant to economic contractions
and may receive added use from downsizing households and businesses.
The diversifi ed economies of the other Texas metros have somewhat insu-
lated themselves from energy-sector woes and are continuing to perform
well. The availability of high-quality jobs in Austin, Dallas and Fort Worth
is drawing workers to the state and intensifying household growth. Even
the Oklahoma City market which has the greatest vacancy in the region is
showing resiliency with rates on pace to achieve a drop of more than 100
basis points this year. Although regional development is beginning to ramp
up, the Southwest will realize occupancy and rent increases in 2016.
Demand for self-storage assets in the region is overwhelming with intense
buyer interest outweighing the supply of available listings. As property op-
erations continue to improve, many owners are reluctant to list their as-
sets and would rather rely on the steady cash fl ow their facilities provide.
Yet, outsize pricing may encourage some investors to bring properties to
market with valuations continuing to rise. Institutions are still aggressively
pursuing self-storage assets in the Southwest, focusing on well-located
Class A properties and are willing to pay top dollar for them. Economic
uncertainty and the rising cost of capital present possible risk factors, al-
though these threats have yet to signifi cantly impact deal fl ow.
Southwest Region Sales Highlights
** Net Rentable Square Footage
Sources: Marcus & Millichap Research Services; CoStar Group, Inc.; REIS Services LLC
Average Price and Cap Rate Trends
$20
$35
$50
$65
$80
Ave
rage
Pric
e p
er S
q. F
t.
11 12 13 1514
Cap
Rate
2%
4%
6%
8%
10%
Ren
ts p
er S
qua
re F
oot
Vacancy and Rent TrendsRents - CCVacancy
$0
$0.5
$1.0
$1.5
$2.0
Vacancy R
ate
Rents - Non CC
0%
5%
10%
15%
20%
16*1514
Average Price Cap Rate
* Forecast
Note: CC stands for Climate Controlled
Regional Overview
A-Alamo Storage Houston, TX 76,737 $14,400,000 $188
Blue Llama Storage Alamo Ranch San Antonio, TX 77,930 $6,950,000 $89
All Star Self Storage Celina, TX 66,215 $4,850,000 $73
Water Tower Storage Cedar Park, TX 52,215 $4,320,000 $83
Southside Mini Storage Spulpa, OK 78,267 $4,125,000 $53
StorageMaster USA Self Storage Cedar Park, TX 48,385 $3,150,000 $65
Eagle Self Storage Hobbs, NM 47,300 $2,570,000 $54
Storage Depot Orange, TX 24,643 $2,000,000 $81
Property NameCity, State
Priceper
Sq. Ft.NRSF**
SalesPrice

7
West
Properties in the Western region are benefi ting from strong population growth
and the robust infl uence of the technology sector. The availability of well-paid
jobs and the favorable quality of life have drawn skilled workers to the region,
fostering a favorable demographic backdrop for self-storage operations. Mar-
kets along the Pacifi c Coast lead the nation in terms of occupancy with high
land costs acting as a barrier to new development. This is most evident in Cal-
ifornia, which is home to six of the top seven metros with the tightest vacancy.
The Bay Area in particular has outstanding self-storage operations, benefi ting
from the surging IT sector and constrained housing environment. Other mar-
kets with growing tech hubs are also performing well. Seattle, Portland and
Denver post above average occupancy numbers. Areas that were hit hard by
the Great Recession are seeing improvements with self-storage vacancy in
Phoenix and Las Vegas reaching fi ve-year lows. These factors will contribute
to rising rental rates in the West, although revenue growth is generally lagging
that of the other regions.
The combination of healthy fundamentals, cheap debt and a general lack of
supply-side pressure has created an active investment market. Buyers remain
bullish in the region as equity-fl ushed investors look to deploy capital and cap-
ture yields. Cap rates in the self-storage sector, although highly compressed,
remain above that of many other commercial real estate products, providing a
steady, cash-fl ow-producing asset type. The strong performance of the public
self-storage REITs is also piquing investor interest as non-institutional players
look to take advantage of similar windfalls. Intense competition and outsize
valuations in the multifamily sector is prompting many apartment owners to
cash out and exchange into self-storage assets. The relative ease of operation
and possibility for aggressive revenue management is a driving force for some
apartment owners in search of more passive income.
West Region Sales Highlights
** Net Rentable Square Footage
Sources: Marcus & Millichap Research Services; CoStar Group, Inc.; REIS Services LLC
Average Price and Cap Rate Trends
$40
$55
$70
$85
$100
Ave
rage
Pric
e p
er S
q. F
t.
11 12 13 1514
Cap
Rate
2%
4%
6%
8%
10%
Ren
ts p
er S
qua
re F
oot
Vacancy and Rent TrendsRents - CCVacancy
$0
$0.5
$1.0
$1.5
$2.0
Vacancy R
ate
Rents - Non CC
0%
5%
10%
15%
20%
16*1514
Average Price Cap Rate
* Forecast
Note: CC stands for Climate Controlled
Regional Overview
Double D Storage Turlock, CA 88,488 $5,700,000 $64
EZ - Storage, Inc. Kingsburg, CA 99,172 $5,400,000 $54
Stetson Hills Storage Colorado Springs, CO 49,653 $5,000,000 $101
County Line Self Storage Tacoma, WA 48,924 $4,500,000 $92
Plaza Storage Las Vegas, NV 66,653 $3,900,000 $59
Sahara Mini Storage Las Vegas, NV 52,672 $3,400,000 $65
Affordable Storage Solutions Pueblo, CO 50,807 $3,050,000 $60
Basic Storage Salt Lake City, UT 34,848 $1,900,000 $55
Property NameCity, State
Priceper
Sq. Ft.NRSF**
SalesPrice

8
South Atlantic
Led by the strength of the Florida metros, the South Atlantic self-storage
market remains one of the most robust regions in the nation. Positive net
migration and a highly transient population drive demand in the area, keeping
occupancy rates near 90 percent. Outside of the Sunshine State, growth mar-
kets in Georgia and the Carolinas are also bolstering self-storage operations,
particularly in the dense urban cores where the concentration of apartments
and condos is high. Outside the metro center, in the suburbs of Virginia and
Maryland, revenue prospects are strong with these two markets registering
the highest average rent throughout the region. Moving forward, although
over construction prospects may be looming in 2017 and 2018, the current
development pipeline is not having an effect on property operations or the
investment market. Regionwide vacancy rates will likely compress further this
year, reaching more than 850 basis points below 2011 levels. As market con-
ditions continue to tighten, rent growth will intensify with average asking rates
expected to see a mid-single-digit increase in 2016.
Demand for South Atlantic self-storage properties is vigorous with buyer sen-
timent remaining highly optimistic in the region. Cap rate compression is lev-
eling off, which may be a sign that the market is at or approaching maturity,
although this has not translated into a pullback from investors. Bullish buying
activity coupled with affordable fi nancing has pushed self-storage valuations
to unprecedented levels. Property owners who were skeptical about selling in
the past may cash out and take advantage of record pricing before the cost
of capital rises. On the institutional side, REITs and other large equity funds
are confi dent in the region, leveraging their war chests to aggressively pursue
assets and expand portfolios. These groups have ventured into markets they
would have avoided 18 months ago as they struggle to fi nd quality listings
in the premier metros. Overall, the self-storage investment market shows no
signs of slowing in 2016, but may see some cooling further down the road.
South Atlantic Region Sales Highlights
** Net Rentable Square Footage
Sources: Marcus & Millichap Research Services; CoStar Group, Inc.; REIS Services LLC
Average Price and Cap Rate Trends
$20
$35
$50
$65
$80
Ave
rage
Pric
e p
er S
q. F
t.
11 12 13 1514
Cap
Rate
2%
4%
6%
8%
10%
Ren
ts p
er S
qua
re F
oot
Vacancy and Rent TrendsRents - CCVacancy
$0
$0.5
$1.0
$1.5
$2.0
Vacancy R
ate
Rents - Non CC
0%
5%
10%
15%
20%
16*1514
Average Price Cap Rate
* Forecast
Note: CC stands for Climate Controlled
Regional Overview
US 1 A/C Self Storage Boynton Beach, FL 74,679 $17,900,000 $240
North Miami Storage North Miami, FL 70,374 $11,050,000 $157
Surelock Self-Storage Orlando, FL 61,000 $9,600,000 $157
Fayette Self Storage Fayetteville, GA 151,916 $9,200,000 $61
My Neighborhood Storage Center Orlando, FL 64,480 $8,500,000 $132
Mr. Store-It Wilmington, NC 69,785 $8,500,000 $122
Riverdale Road Self Storage Riverdale, GA 83,805 $5,300,000 $63
Fort Knox Self Storage Greensboro, NC 118,986 $5,300,000 $45
Property NameCity, State
Priceper
Sq. Ft.NRSF**
SalesPrice
9
Northeast
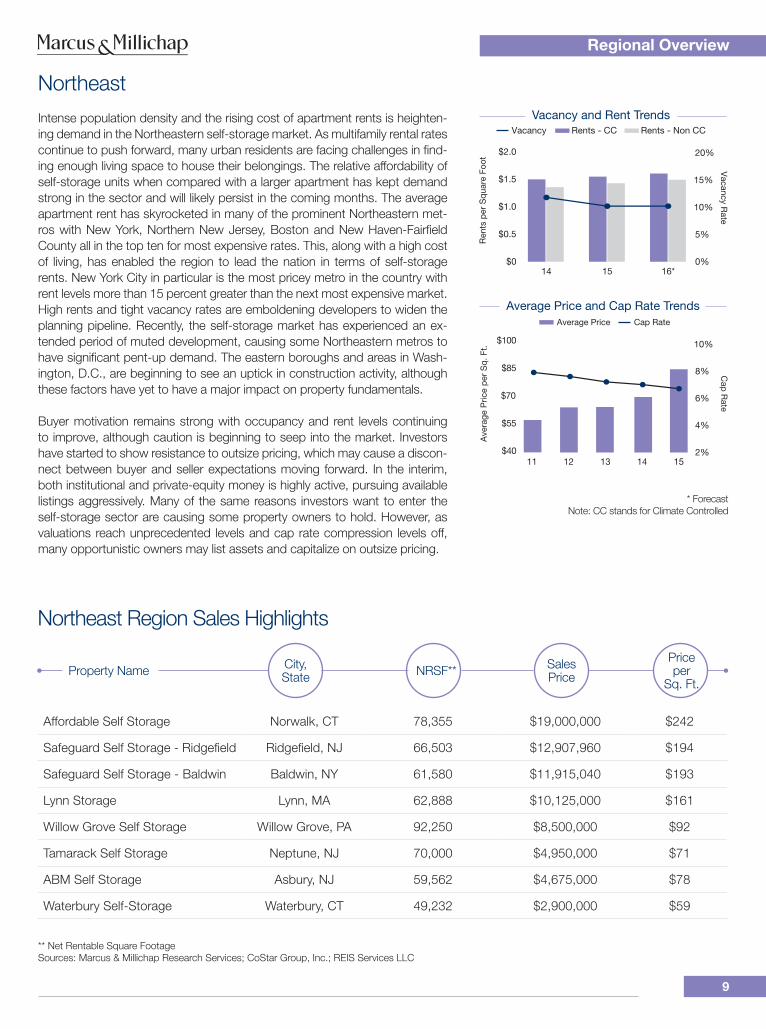
Intense population density and the rising cost of apartment rents is heighten-
ing demand in the Northeastern self-storage market. As multifamily rental rates
continue to push forward, many urban residents are facing challenges in fi nd-
ing enough living space to house their belongings. The relative affordability of
self-storage units when compared with a larger apartment has kept demand
strong in the sector and will likely persist in the coming months. The average
apartment rent has skyrocketed in many of the prominent Northeastern met-
ros with New York, Northern New Jersey, Boston and New Haven-Fairfi eld
County all in the top ten for most expensive rates. This, along with a high cost
of living, has enabled the region to lead the nation in terms of self-storage
rents. New York City in particular is the most pricey metro in the country with
rent levels more than 15 percent greater than the next most expensive market.
High rents and tight vacancy rates are emboldening developers to widen the
planning pipeline. Recently, the self-storage market has experienced an ex-
tended period of muted development, causing some Northeastern metros to
have signifi cant pent-up demand. The eastern boroughs and areas in Wash-
ington, D.C., are beginning to see an uptick in construction activity, although
these factors have yet to have a major impact on property fundamentals.
Buyer motivation remains strong with occupancy and rent levels continuing
to improve, although caution is beginning to seep into the market. Investors
have started to show resistance to outsize pricing, which may cause a discon-
nect between buyer and seller expectations moving forward. In the interim,
both institutional and private-equity money is highly active, pursuing available
listings aggressively. Many of the same reasons investors want to enter the
self-storage sector are causing some property owners to hold. However, as
valuations reach unprecedented levels and cap rate compression levels off,
many opportunistic owners may list assets and capitalize on outsize pricing.
Northeast Region Sales Highlights
** Net Rentable Square Footage
Sources: Marcus & Millichap Research Services; CoStar Group, Inc.; REIS Services LLC
Average Price and Cap Rate Trends
$40
$55
$70
$85
$100
Ave
rage
Pric
e p
er S
q. F
t.
11 12 13 1514
Cap
Rate
2%
4%
6%
8%
10%
Ren
ts p
er S
qua
re F
oot
Vacancy and Rent TrendsRents - CCVacancy
$0
$0.5
$1.0
$1.5
$2.0
Vacancy R
ate
Rents - Non CC
0%
5%
10%
15%
20%
16*1514
Average Price Cap Rate
* Forecast
Note: CC stands for Climate Controlled
Regional Overview
Affordable Self Storage Norwalk, CT 78,355 $19,000,000 $242
Safeguard Self Storage - Ridgefi eld Ridgefi eld, NJ 66,503 $12,907,960 $194
Safeguard Self Storage - Baldwin Baldwin, NY 61,580 $11,915,040 $193
Lynn Storage Lynn, MA 62,888 $10,125,000 $161
Willow Grove Self Storage Willow Grove, PA 92,250 $8,500,000 $92
Tamarack Self Storage Neptune, NJ 70,000 $4,950,000 $71
ABM Self Storage Asbury, NJ 59,562 $4,675,000 $78
Waterbury Self-Storage Waterbury, CT 49,232 $2,900,000 $59
Property NameCity, State
Priceper
Sq. Ft.NRSF**
SalesPrice

* Forecast
Vacancy and Rent Source: REIS Services, LLC
10
Atlanta
Economic Trends
The pace of job growth in the metro will climb 3.2 percent as
employers add 84,000 positions. In 2015, payrolls expanded
by 77,000 jobs, an annual gain of 3.0 percent. Retail sales will
increase 5.6 percent in 2016, following a 4.7 percent gain last
year.
Household Trends
In 2016, the number of new single-family homes will grow 8
percent year over year but will be 56 percent under pre-reces-
sion levels set in 2007. Over the same nine-year period, the
number of total households will rise 14 percent, which will likely
boost demand for self-storage space.
Vacancy Trends
This year, demand will fi ll available storage space as the met-
ro’s vacancy rate will rank lower than the national average. In
2016, vacancy will retreat 40 basis points to 10.6 percent, af-
ter plummeting 190 basis points in the previous year.
Rent Trends
Last year, rents for climate controlled and non-climate con-
trolled facilities rose 6.0 percent to $1.22 per square foot and
4.7 percent to 91 cents per square foot, respectively. Asking
rents will increase 5.7 percent for climate controlled space and
4.4 percent for non-climate controlled facilities in 2016.
Yea
r-ov
er-Y
ear
Cha
nge
Metro Total Employment
Economic Trends
-12%
-6%
0%
6%
12%
16*1514131211100908
Metro Retail Sales
0
20
40
60
80
16*15141312111009080706050403020100
Household Completions
Com
ple
ted
(Th
s.)
Single-Family Homes Multifamily Units
Vac
ancy
Rat
e
United StatesMetro
Vacancy Trends
8%
10%
12%
14%
16%
16*1514
Asking Rent Trends
Ask
ing
Ren
t p
er S
qua
re F
oot
Non-Climate ControlledClimate Controlled
$0
$0.5
$1.0
$1.5
$2.0
16*1514

* Forecast
Vacancy and Rent Sources: REIS Services, LLC
11
Austin
Economic Trends
Austin employers will create 37,500 positions, expanding the
employment level by 3.9 percent in 2016. Last year, 34,600
additional workers were hired, representing an annual increase
of 3.7 percent. This growth is supporting retail sales, which
will expand by 6.9 percent this year after rising 3.9 percent in
2015.
Household Trends
In 2016, single-family home completions will decrease 6 per-
cent while remaining 45 percent below the pre-recession peak
set in 2006. Apartment completions in the metro are 54 per-
cent above 2007 levels. Household formation has advanced
30 percent since 2007. As many move into smaller rental
spaces, self-storage demand will rise.
Vacancy Trends
Jobs and new households supported demand growth for
self-storage facilities in the metro, lowering vacancy 40 basis
points to 12.4 percent in 2015. Vacancy will decrease 100 ba-
sis points year over year in 2016, ending at 11.4 percent as
new households form.
Rent Trends
Asking rents in climate controlled self-storage facilities rose
2.1 percent in 2015 to $1.44 per square foot on average, while
non-climate controlled space gained 2 percent to $1.01 per
square foot. In 2016, demand will support rent gains in climate
controlled and non-climate controlled facilities of 4.4 percent
for both subsectors.
Yea
r-ov
er-Y
ear
Cha
nge
Metro Total Employment
Economic Trends
-12%
-6%
0%
6%
12%
16*1514131211100908
Metro Retail Sales
0
7.5
15.0
22.5
30.0
16*15141312111009080706050403020100
Household Completions
Com
ple
ted
(Th
s.)
Single-Family Homes Multifamily Units
Vac
ancy
Rat
e
United StatesMetro
Vacancy Trends
8%
10%
12%
14%
16%
16*1514
Asking Rent Trends
Ask
ing
Ren
t p
er S
qua
re F
oot
Non-Climate ControlledClimate Controlled
$0
$0.5
$1.0
$1.5
$2.0
16*1514

* Forecast
Vacancy and Rent Source: REIS Services, LLC
12
Baltimore
Economic Trends
Baltimore employment jumped 2.3 percent in 2015 as 30,800
additional workers joined the employment pool. Employers
are set to generate 32,000 jobs this year, maintaining the 2.3
percent increase. This will support retail sales growth of 2.8
percent this year, after also gaining 2.8 percent year over year
in 2015.
Household Trends
Household formation will rise 5 percent above 2007 levels.
To meet housing needs, developers will expand annual sin-
gle-family home completions 34 percent this year, remaining
28 percent below the 2006 peak. Completions of multifamily
housing will remain fl at at 1 percent growth, while simultane-
ously rising 10 percent above the 2006 high.
Vacancy Trends
Vacancy in self-storage spaces tumbled 100 basis points in
2015 as employers added jobs, which unbundled households
in the metro. Many of these households moved into apart-
ments, generating greater demand for storage space. During
2016, the vacancy rate will fall 30 basis points to 13.6 percent.
Rent Trends
Rising demand will accelerate rent gains this year in climate
controlled and non-climate controlled spaces by 2.3 and 2.7
percent to $1.57 and $1.41 per square foot, respectively. This
is an escalation from 2015 when rent in climate controlled fa-
cilities grew 0.4 percent and non-climate-controlled facilities
advanced 1.8 percent.
Yea
r-ov
er-Y
ear
Cha
nge
Metro Total Employment
Economic Trends
-12%
-6%
0%
6%
12%
16*1514131211100908
Metro Retail Sales
0
4
8
12
16
16*15141312111009080706050403020100
Household Completions
Com
ple
ted
(Th
s.)
Single-Family Homes Multifamily Units
Vac
ancy
Rat
e
United StatesMetro
Vacancy Trends
8%
10%
12%
14%
16%
16*1514
Asking Rent Trends
Ask
ing
Ren
t p
er S
qua
re F
oot
Non-Climate ControlledClimate Controlled
$0
$0.5
$1.0
$1.5
$2.0
16*1514

* Forecast
Vacancy and Rent Sources: REIS Services, LLC
13
Boston
Economic Trends
Growth in Boston employment will support the addition of
55,000 workers, a 2.1 percent gain in 2016, on par with the
prior year increase of 53,700 positions. Employees are spend-
ing paychecks, supporting a 3.7 percent gain in retail sales this
year, up from the advance of 3.3 percent in 2015.
Household Trends
Though housing completions are 14 percent below 2006
levels, household formations have grown by 9 percent in the
same period. A construction spree of multifamily units is clos-
ing the gap in completions, which will end the year 8 percent
higher than the 2006 peak. As residents seek smaller spaces
in rentals, self-storage demand is likely to increase.
Vacancy Trends
This year, stronger job growth and demand for housing in
apartments will reduce self-storage vacancy 50 basis points,
ending the year at 11 percent, which is nearly on par with the
national level of 10.8 percent. Boston area vacancy dropped
120 basis points in 2015, as demand was catching up with
supply.
Rent Trends
Asking rent in climate controlled self-storage jumped 5.1 per-
cent to $1.77 per square foot in 2015. This exceeded the 3.4
percent gain to $1.49 per square foot for non-climate con-
trolled space. This year, demand will support increases of 5.1
and 4.7 percent in climate controlled and non-climate con-
trolled spaces, respectively.
Yea
r-ov
er-Y
ear
Cha
nge
Metro Total Employment
Economic Trends
-12%
-6%
0%
6%
12%
16*1514131211100908
Metro Retail Sales
0
4
8
12
16
16*15141312111009080706050403020100
Household Completions
Com
ple
ted
(Th
s.)
Single-Family Homes Multifamily Units
Vac
ancy
Rat
e
United StatesMetro
Vacancy Trends
8%
10%
12%
14%
16%
16*1514
Asking Rent Trends
Ask
ing
Ren
t p
er S
qua
re F
oot
Non-Climate ControlledClimate Controlled
$0
$0.5
$1.0
$1.5
$2.0
16*1514

* Forecast
Vacancy and Rent Source: REIS Services, LLC
14
Charlotte
Economic Trends
Approximately 37,000 jobs will be created in 2016, expand-
ing employment 3.3 percent, which will help support retail
sales growth of 3.6 percent. In 2015, employment in Charlotte
climbed 3.3 percent as employers added 36,100 individuals to
payrolls, increasing retail sales by 3.8 percent.
Household Trends
Single-family home completions will rise 20 percent in 2016
as Charlotte’s housing market continues to build steam since
bottoming out in 2011. Annual apartment completions will also
rise, albeit at a slower pace, with builders accelerating devel-
opment 6.6 percent. Household formations will grow 20 per-
cent from 2007, supporting demand for self-storage as more
residents seek apartments.
Vacancy Trends
An increasing number of new households in the metro will
drive demand for self-storage, supporting an 80-basis-point
drop in the vacancy rate to 10.6 percent in 2016. In the prior
year, the vacancy rate rose 50 basis points, erasing the drop
seen in 2014. Vacancy will dip below national levels on job and
household growth.
Rent Trends
In 2015, rent increased by 3.9 and 3.8 percent in climate con-
trolled and non-climate controlled facilities, respectively. These
gains will continue, as climate controlled facility rent rises 4.2
percent to an average of $1.32 per square foot, followed by
3.6 percent growth to 92 cents per square foot for non-climate
controlled spaces.
Yea
r-ov
er-Y
ear
Cha
nge
Metro Total Employment
Economic Trends
-12%
-6%
0%
6%
12%
16*1514131211100908
Metro Retail Sales
0
7.5
15.0
22.5
30.0
16*15141312111009080706050403020100
Household Completions
Com
ple
ted
(Th
s.)
Single-Family Homes Multifamily Units
Vac
ancy
Rat
e
United StatesMetro
Vacancy Trends
8.0%
9.5%
11.0%
12.5%
14.0%
16*1514
Asking Rent Trends
Ask
ing
Ren
t p
er S
qua
re F
oot
Non-Climate ControlledClimate Controlled
$0
$0.5
$1.0
$1.5
$2.0
16*1514

* Forecast
Vacancy and Rent Sources: REIS Services, LLC
15
Chicago
Economic Trends
This year, employers will generate 54,000 jobs, enhancing
payrolls 1.2 percent. This will support a gain in retail sales of
4.5 percent in 2016, after adding 2.6 percent in 2015. Last
year, total employment gained just 0.6 percent as 26,900 po-
sitions were created in the Chicago metro.
Household Trends
From 2007 to year-end 2016, 4.6 percent new households
will be formed in Chicago. Multifamily completions will drop
16 percent year over year and remain 51 percent below the
2008 peak level. Single-family completions will grow 5 percent
this year. As household formation grows, particularly in smaller
rental space, self-storage demand will expand.
Vacancy Trends
Chicago metro vacancy remained level last year, ending 2015
10 basis points higher than the prior year at 12.7 percent. This
year, the rate is projected to accelerate downward by 90 ba-
sis points on increased job additions and growing retail sales,
ending 2016 at 11.8 percent.
Rent Trends
Average asking rent in climate controlled and non-climate
controlled facilities will each add 3.3 percent year over year,
ending 2016 at $1.65 per square foot and $1.22 per square
foot, respectively. Last year rents rose by 0.2 percent and 1.6
percent for climate controlled and non-climate controlled facil-
ities, respectively.
Yea
r-ov
er-Y
ear
Cha
nge
Metro Total Employment
Economic Trends
-12%
-6%
0%
6%
12%
16*1514131211100908
Metro Retail Sales
0
12.5
25.0
37.5
50.0
16*15141312111009080706050403020100
Household Completions
Com
ple
ted
(Th
s.)
Single-Family Homes Multifamily Units
Vac
ancy
Rat
e
United StatesMetro
Vacancy Trends
8%
10%
12%
14%
16%
16*1514
Asking Rent Trends
Ask
ing
Ren
t p
er S
qua
re F
oot
Non-Climate ControlledClimate Controlled
$0
$0.5
$1.0
$1.5
$2.0
16*1514

* Forecast
Vacancy and Rent Source: REIS Services, LLC
16
Cincinnati
Economic Trends
In 2015, employment in Cincinnati climbed 1.9 percent as
employers added 19,800 workers to payrolls. Approximately
21,000 positions will be created in 2016, expanding employ-
ment 2.0 percent. Retail sales will increase 3.9 percent this
year, slowing from the 5.1 percent rise in 2015.
Household Trends
In 2016, the pace of single-family home construction will drop
to its lowest level this century with only 1,700 completions,
sliding 75 percent from pre-recession levels. The pace of mul-
tifamily completions will also wane, dropping 36 percent from
2015. The rate of household formation will fi nish 2016 up 1.5
percent, on pace with the national rate.
Vacancy Trends
Cincinnati is expected to see a 60-basis-point drop in the va-
cancy rate, ending the year at 10.7 percent, on par with the
national average. Over the past fi ve years vacancy has been
trending down on improved economic conditions, fi lling up 36
percent of available self-storage space.
Rent Trends
As vacancy tightens, asking rents will rise at climate controlled
and non-climate controlled facilities an expected 3.1 percent
to $1.20 per square foot and 4.3 percent to 84 cents per
square foot, respectively. Last year, rents jumped 2.8 percent
for climate controlled spaces and 4.4 percent for non-climate
controlled units.
Yea
r-ov
er-Y
ear
Cha
nge
Metro Total Employment
Economic Trends
-12%
-6%
0%
6%
12%
16*1514131211100908
Metro Retail Sales
0
4
8
12
16
16*15141312111009080706050403020100
Household Completions
Com
ple
ted
(Th
s.)
Single-Family Homes Multifamily Units
Vac
ancy
Rat
e
United StatesMetro
Vacancy Trends
8%
10%
12%
14%
16%
16*1514
Asking Rent Trends
Ask
ing
Ren
t p
er S
qua
re F
oot
Non-Climate ControlledClimate Controlled
$0
$0.5
$1.0
$1.5
$2.0
16*1514

* Forecast
Vacancy and Rent Sources: REIS Services, LLC
17
Cleveland
Economic Trends
This year, employers will generate jobs for 19,000 new work-
ers, adding 1.8 percent to the employment level and support-
ing a 3.2 percent gain in retail sales. Last year, Cleveland’s
unemployment rate plummeted 120 basis points, based on
job gains of 2.2 percent, which added 23,100 positions to the
metro.
Household Trends
Single-family housing completions will increase 10 percent in
2016 while still remaining well below the pre-recession peak.
Builders will bring 22 percent less multifamily units online this
year than in 2015. The number of households in the metro
has remained steady over the past 15 years and will see a 0.8
percent gain this year.
Vacancy Trends
Vacancy will plummet 150 basis points year over year to 11.1
percent in 2016, supported by employment gains. Last year,
the rate jumped 180 basis points to 12.6 percent. Demand
for self-storage will increase as job growth and retail numbers
improve in the local market this year.
Rent Trends
Last year’s strong job growth increased rent by 1.4 percent in
climate controlled spaces and 0.6 percent in non-climate con-
trolled facilities. Continued job gains in 2016 will support ad-
vances of 2.9 percent and 2.3 percent to $1.33 and 96 cents
per square foot in climate and non-climate controlled facilities,
respectively.
Yea
r-ov
er-Y
ear
Cha
nge
Metro Total Employment
Economic Trends
-12%
-6%
0%
6%
12%
16*1514131211100908
Metro Retail Sales
0
3
6
9
12
16*15141312111009080706050403020100
Household Completions
Com
ple
ted
(Th
s.)
Single-Family Homes Multifamily Units
Vac
ancy
Rat
e
United StatesMetro
Vacancy Trends
8%
10%
12%
14%
16%
16*1514
Asking Rent Trends
Ask
ing
Ren
t p
er S
qua
re F
oot
Non-Climate ControlledClimate Controlled
$0
$0.5
$1.0
$1.5
$2.0
16*1514

* Forecast
Vacancy and Rent Source: REIS Services, LLC
18
Columbus
Economic Trends
Employment gains will accelerate in the Columbus metro this
year as businesses expand payrolls 2.4 percent, or by 25,000
workers. During 2015, employers added 19,900 positions to
the local economy, representing growth of 1.9 percent. Em-
ployment will support retail sales gains of 3.9 percent in 2016
after dropping 0.4 percent in 2015.
Household Trends
In 2016, Columbus single-family completions will register a
year-over-year increase of 2.0 percent. Multifamily develop-
ment will slow with annual completions decreasing 1.8 percent
during the same period. With a rate of household formation
of 2.0 percent, Columbus will experience greater household
growth than the rest of the nation, ending the last nine years
up 11.6 percent.
Vacancy Trends
Job gains and household formation this year will boost de-
mand, fi lling available storage space, though the metro vacan-
cy rate will rank higher than the national rate. In 2016, vacancy
will shrink 80 basis points to 12.9 percent, after dropping a
nominal 10 basis points in the previous year.
Rent Trends
Average rent for climate controlled units rose 2.6 percent to
$1.17 per square foot, while non-climate controlled rents also
jumped 2.6 percent to 88 cents per square foot in 2015. This
year, operators will leverage demand to raise rents for climate
controlled and non-climate controlled space 4.6 percent and
4.0 percent, respectively.
Yea
r-ov
er-Y
ear
Cha
nge
Metro Total Employment
Economic Trends
-12%
-6%
0%
6%
12%
16*1514131211100908
Metro Retail Sales
0
4
8
12
16
16*15141312111009080706050403020100
Household Completions
Com
ple
ted
(Th
s.)
Single-Family Homes Multifamily Units
Vac
ancy
Rat
e
United StatesMetro
Vacancy Trends
8%
10%
12%
14%
16%
16*1514
Asking Rent Trends
Ask
ing
Ren
t p
er S
qua
re F
oot
Non-Climate ControlledClimate Controlled
$0
$0.5
$1.0
$1.5
$2.0
16*1514

* Forecast
Vacancy and Rent Sources: REIS Services, LLC
19
Dallas
Economic Trends
Employers in Dallas will add 88,300 workers to their payrolls
in 2016, representing a 3.7 percent year-over-year gain. In
2015, job growth reached 3.9 percent with 88,750 positions
added, nearly the highest amount added in the country. Retail
spending will rise 5.1 percent in 2016 an uptick from last year’s
5.0-percent gain.
Household Trends
In 2016, single-family home completions in Dallas will rise
17.8 percent year over year, while multifamily completions will
increase 48 percent. During the seven-year period from the
pre-recession peak in 2009, multifamily completions will ex-
pand by 54 percent. As rentals are fi lled, demand for self-stor-
age facilities will likely strengthen.
Vacancy Trends
Vacancy will increase 20 points in 2016 to 10.9 percent, plac-
ing the rate nearly on par with the national rate. Last year,
strong employment gains and steady population growth
slashed vacancy 70 basis points. Expanding employment and
robust consumer spending will intensify demand for Dallas
self-storage units.
Rent Trends
This year, average asking rents at climate controlled and
non-climate controlled facilities will rise 3.8 percent to $1.42
per square foot and 4.6 percent to $1.08 per square foot, re-
spectively. Asking rents in 2015 for climate controlled spaces
rose 2.7 percent, and rents for non-climate controlled units
climbed 4.4 percent.
Yea
r-ov
er-Y
ear
Cha
nge
Metro Total Employment
Economic Trends
-12%
-6%
0%
6%
12%
16*1514131211100908
Metro Retail Sales
0
12.5
25.0
37.5
50.0
16*15141312111009080706050403020100
Household Completions
Com
ple
ted
(Th
s.)
Single-Family Homes Multifamily Units
Vac
ancy
Rat
e
United StatesMetro
Vacancy Trends
8.0%
9.5%
11.0%
12.5%
14.0%
16*1514
Asking Rent Trends
Ask
ing
Ren
t p
er S
qua
re F
oot
Non-Climate ControlledClimate Controlled
$0
$0.5
$1.0
$1.5
$2.0
16*1514

* Forecast
Vacancy and Rent Source: REIS Services, LLC
20
Denver
Economic Trends
The Denver metro gained 24,200 new employees last year,
bringing unemployment down 80 basis points to 3.3 percent.
In 2016, employers will add 26,000 workers to payrolls, a year-
over-year increase of 1.9 percent. Strong job creation will lift
retail sales growth to 3.5 percent this year, following a 2.6 per-
cent increase in 2015.
Household Trends
Single- and multifamily completions have recovered well in
Denver as the amount of households increased 20.5 percent
since the beginning of the recession. Single-family completions
are expected to grow 13.5 percent year over year and multi-
family growth will be 7.2 percent. As the number of households
grows, self-storage demand will continue to increase, particu-
larly near new rental properties.
Vacancy Trends
After three years of near-level vacancy, a drop of 110 basis
points to 9.2 percent is expected by the end of 2016. Employ-
ment advances will support household demand for storage
facilities. Tightening conditions will place the metro’s self-stor-
age vacancy more than 160 basis points below the national
vacancy rate.
Rent Trends
Asking rent climbed for climate controlled and non-climate
controlled facilities by 3.8 percent to $1.65 per square foot and
4.8 percent to $1.40 per square foot, respectively, in 2015.
Average rents will increase 4.7 percent for climate controlled
space and 5.6 percent for non-climate controlled facilities in
2016.
Yea
r-ov
er-Y
ear
Cha
nge
Metro Total Employment
Economic Trends
-12%
-6%
0%
6%
12%
16*1514131211100908
Metro Retail Sales
0
8
16
24
32
16*15141312111009080706050403020100
Household Completions
Com
ple
ted
(Th
s.)
Single-Family Homes Multifamily Units
Vac
ancy
Rat
e
United StatesMetro
Vacancy Trends
8.0%
9.5%
11.0%
12.5%
14.0%
16*1514
Asking Rent Trends
Ask
ing
Ren
t p
er S
qua
re F
oot
Non-Climate ControlledClimate Controlled
$0
$0.5
$1.0
$1.5
$2.0
16*1514

* Forecast
Vacancy and Rent Sources: REIS Services, LLC
21
Detroit
Economic Trends
Following the addition of 39,100 new jobs in 2015, the metro’s
unemployment rate shrank 150 basis points to 6.2 percent.
This year, a total of 38,000 positions will be created, a 1.9
percent gain of total metro employment. Retail sales will grow
5.3 percent in 2016, up from 3.0 percent registered in 2015.
Household Trends
Single-family residences have grown at an average rate of 21
percent since the low of 2009; multifamily completions have
increased an average of 57 percent since their low in 2010.
A 1.1 percent rise in households this year will be the great-
est amount so far this century. Rising multifamily completions,
which typically consist of smaller living spaces, will generate
the need for self-storage space.
Vacancy Trends
In Detroit, self-storage vacancy declined 70 basis points in
2015. This year, improving employment and household for-
mation will continue to support demand for space, reducing
vacancy 30 basis points to 11.8 percent. Still, the metro’s end
of the year vacancy rate is forecast to be 100 basis points
above the national level.
Rent Trends
Last year, owners bolstered asking rents for climate controlled
facilities 0.8 percent to $1.33 per square foot, while rents for
non-climate controlled space fl ourished 4.1 percent to $1.01
cents per square foot. By year-end 2016, climate controlled
and non-climate controlled rents will rise 2.4 percent and 4
percent, respectively.
Yea
r-ov
er-Y
ear
Cha
nge
Metro Total Employment
Economic Trends
-12%
-6%
0%
6%
12%
16*1514131211100908
Metro Retail Sales
0
6
12
18
24
16*15141312111009080706050403020100
Household Completions
Com
ple
ted
(Th
s.)
Single-Family Homes Multifamily Units
Vac
ancy
Rat
e
United StatesMetro
Vacancy Trends
8%
10%
12%
14%
16%
16*1514
Asking Rent Trends
Ask
ing
Ren
t p
er S
qua
re F
oot
Non-Climate ControlledClimate Controlled
$0
$0.5
$1.0
$1.5
$2.0
16*1514

* Forecast
Vacancy and Rent Source: REIS Services, LLC
22
Fort Lauderdale
Economic Trends
Fort Lauderdale employment advanced 3.1 percent in 2015 as
24,500 jobs were generated. Strong hiring pushed the unem-
ployment rate down 80 basis points to 4.6 percent, the lowest
rate since 2007. The metro will gain 21,000 positions during
2016, representing a growth rate of 2.6 percent and support-
ing a 5.6 percent gain in retail sales.
Household Trends
In 2016, the number of new single-family homes will grow 92
percent year over year. Multifamily housing will gain 35 percent
on the prior year as the number of households continues to
grow in the area, increasing 2.7 percent this year. The number
of total households has risen 16 percent since 2007.
Vacancy Trends
Growth in jobs and households last year buoyed demand for
storage space in the metro, as the vacancy rate fell 100 ba-
sis points to 10.9 percent. This year vacancy will remain un-
changed, placing the Fort Lauderdale vacancy rate at just 10
basis points above the national rate.
Rent Trends
In 2015, tightening vacancy lifted market rental rates for cli-
mate controlled and non-climate controlled facilities 4.6 per-
cent to $1.74 per square foot and 6.2 percent to $1.47 per
square foot, respectively. Climate controlled rents will jump 4.6
percent, while rents for non-climate controlled space will rise
5.2 percent during 2015.
Yea
r-ov
er-Y
ear
Cha
nge
Metro Total Employment
Economic Trends
-12%
-6%
0%
6%
12%
16*1514131211100908
Metro Retail Sales
0
4
8
12
16
16*15141312111009080706050403020100
Household Completions
Com
ple
ted
(Th
s.)
Single-Family Homes Multifamily Units
Vac
ancy
Rat
e
United StatesMetro
Vacancy Trends
8.0%
9.5%
11.0%
12.5%
14.0%
16*1514
Asking Rent Trends
Ask
ing
Ren
t p
er S
qua
re F
oot
Non-Climate ControlledClimate Controlled
$0
$0.5
$1.0
$1.5
$2.0
16*1514

* Forecast
Vacancy and Rent Sources: REIS Services, LLC
23
Fort Worth
Economic Trends
More than 14,400 jobs will be added to the local workforce
this year, representing a gain of 1.4 percent. Over the same
time period, retail sales will grow 4.8 percent. The employment
level in Fort Worth expanded 2.4 percent in 2015 through the
creation of nearly 23,400 jobs.
Household Trends
The number of multifamily units generated will decrease 11
percent this year. Completions of single-family homes will
grow 10 percent year over year. Over the last nine years, the
number of total households will rise 19 percent in 2016, which
will likely increase demand for self-storage space.
Vacancy Trends
Job growth and household formation in recent years have
generated demand for storage space in the metro. Last year
the vacancy rate increased 50 basis points, ending the year
at 10.2 percent. In 2016, market demand will cut vacancy 80
basis points to 9.4 percent, placing the rate 140 basis points
below the national level.
Rent Trends
Last year’s tightened vacancy supported escalating rents.
Climate controlled and non-climate controlled rents rose 4.7
percent to $1.26 per square foot and 5.7 percent to 90 cents
per square foot, respectively. Climate controlled rents will jump
5 percent, while rents for non-climate controlled space will rise
4.9 percent during 2016.
Yea
r-ov
er-Y
ear
Cha
nge
Metro Total Employment
Economic Trends
-12%
-6%
0%
6%
12%
16*1514131211100908
Metro Retail Sales
0
7
14
21
28
16*15141312111009080706050403020100
Household Completions
Com
ple
ted
(Th
s.)
Single-Family Homes Multifamily Units
Vac
ancy
Rat
e
United StatesMetro
Vacancy Trends
8%
10%
12%
14%
16%
16*1514
Asking Rent Trends
Ask
ing
Ren
t p
er S
qua
re F
oot
Non-Climate ControlledClimate Controlled
$0
$0.5
$1.0
$1.5
$2.0
16*1514

* Forecast
Vacancy and Rent Source: REIS Services, LLC
24
Houston
Economic Trends
Total employment in the Houston Area market is expected to
expand 0.6 percent in 2016 with the creation of 17,000 jobs.
This slowdown mirrors last year’s changes, when employers
generated 23,600 new positions, a 0.8 percent increase. Re-
tail spending is set to rise 3.0 percent this year following a 4.8
percent gain in 2015.
Household Trends
Multifamily residential completions will slow in 2016 after fi ve
years of strong construction, posting a 9 percent year-over-
year decrease. Single-family deliveries will also falter, down 5
percent this year. Household formation on the other hand will
rise 3 percent in 2016, helping drive demand for both climate
and non-climate controlled self-storage space.
Vacancy Trends
As more people move into multifamily units, the need for
self-storage units will increase through 2016. Heightened
demand this year will push vacancy down 40 basis points to
10.2 percent, well below the national vacancy rate. In 2015,
vacancy fell 50 basis points, continuing a fi ve-year trend of
metrowide tightening.
Rent Trends
Rents for climate controlled and non-climate controlled facil-
ities will jump 4.2 percent to $1.37 per square foot and 4.1
percent to 96 cents per square foot, respectively, in 2016. Last
year, asking rents rose 2.3 percent for climate controlled space
and 2.9 percent for non-climate controlled space.
Yea
r-ov
er-Y
ear
Cha
nge
Metro Total Employment
Economic Trends
-12%
-6%
0%
6%
12%
16*1514131211100908
Metro Retail Sales
0
16
32
48
64
16*15141312111009080706050403020100
Household Completions
Com
ple
ted
(Th
s.)
Single-Family Homes Multifamily Units
Vac
ancy
Rat
e
United StatesMetro
Vacancy Trends
8.0%
9.5%
11.0%
12.5%
14.0%
16*1514
Asking Rent Trends
Ask
ing
Ren
t p
er S
qua
re F
oot
Non-Climate ControlledClimate Controlled
$0
$0.5
$1.0
$1.5
$2.0
16*1514

* Forecast
Vacancy and Rent Sources: REIS Services, LLC
25
Indianapolis
Economic Trends
Indianapolis employers generated 27,100 jobs in 2015, ex-
panding payrolls by 2.7 percent. This year, workforce head-
count in the metro will increase 2.4 percent, or by 25,000
positions. Retail sales will increase 6.6 percent in 2016 after
recording a 6.7 percent gain last year.
Household Trends
Multifamily completions in 2016 will continue to grow at 18.5
percent year over year. Developers will decrease the number of
single-family homes completed this year by 4 percent. House-
hold formation in the metro will be 11 percent above the 2007
level, generating demand for self-storage.
Vacancy Trends
Indianapolis vacancy fell 40 basis points in 2015 to 11 percent.
This drop was primarily by strengthening household formation
and the need for additional self-storage space. This year, the
metrowide vacancy rate will hold fi rm at 11 percent, resting
slightly above that of the rest of the nation.
Rent Trends
Asking rents for climate controlled and non-climate controlled
units will each rise 4.2 percent this year to $1.16 per square
foot and 83 cents per square foot, respectively. Last year, ask-
ing rents at climate controlled and non-climate controlled facil-
ities in the metro rose 3 percent and 3.8 percent, respectively.
Yea
r-ov
er-Y
ear
Cha
nge
Metro Total Employment
Economic Trends
-12%
-6%
0%
6%
12%
16*1514131211100908
Metro Retail Sales
0
5
10
15
20
16*15141312111009080706050403020100
Household Completions
Com
ple
ted
(Th
s.)
Single-Family Homes Multifamily Units
Vac
ancy
Rat
e
United StatesMetro
Vacancy Trends
8.0%
9.5%
11.0%
12.5%
14.0%
16*1514
Asking Rent Trends
Ask
ing
Ren
t p
er S
qua
re F
oot
Non-Climate ControlledClimate Controlled
$0
$0.5
$1.0
$1.5
$2.0
16*1514

* Forecast
Vacancy and Rent Source: REIS Services, LLC
26
Las Vegas
Economic Trends
Job growth will accelerate this year as employers generate
29,500 positions, a 3.2 percent increase in total employment.
In 2015, 18,100 jobs were added in the Las Vegas area, a 2
percent growth rate. Retail sales in 2016 will increase 4.8 per-
cent, up from 1.9 percent last year.
Household Trends
Multifamily completions will have continued growth from their
2011 low, posting a 10 percent increase by the end of this
year. Single-family homes will be down 6 percent year over
year as growth remains to be slow since the onset of the re-
cession. Household formations will remain robust, adding 3
percent year over year, stimulating self-storage demand.
Vacancy Trends
Vacancy will decline in the Las Vegas market by 10 basis
points from 13.4 percent in 2015 and will remain far above the
national rate of 10.8 percent. Rates last year declined a stag-
gering 340 basis points to close out the year, demonstrating a
heightened demand for self-storage space.
Rent Trends
Employment growth in 2016 will push up asking rents at cli-
mate controlled and non-climate controlled facilities by 1.7
percent to $1.00 per square foot and 3.6 percent to 95 cents
per square foot, respectively. In 2015, climate controlled and
non-climate controlled rents lifted by 1.2 percent and 4.5 per-
cent, respectively.
Yea
r-ov
er-Y
ear
Cha
nge
Metro Total Employment
Economic Trends
-12%
-6%
0%
6%
12%
16*1514131211100908
Metro Retail Sales
0
10
20
30
40
16*15141312111009080706050403020100
Household Completions
Com
ple
ted
(Th
s.)
Single-Family Homes Multifamily Units
Vac
ancy
Rat
e
United StatesMetro
Vacancy Trends
10%
12%
14%
16%
18%
16*1514
Asking Rent Trends
Ask
ing
Ren
t p
er S
qua
re F
oot
Non-Climate ControlledClimate Controlled
$0
$0.5
$1.0
$1.5
$2.0
16*1514

* Forecast
Vacancy and Rent Sources: REIS Services, LLC
27
Los Angeles
Economic Trends
Employers added 92,700 positions to payrolls last year, repre-
senting a 2.2 percent expansion. In 2016, an additional 65,000
jobs will be generated, a 1.5 percent increase, the slowest rate
of growth since 2011. Retail sales will rise 4 percent in 2016, a
50-basis-point rise from 2015.
Household Trends
Single-family home completions will rise 14 percent year over
year, while multifamily construction will increase 32 percent.
Total completions in the Los Angeles market are expected to
end the year just 7 percent below the pre-recession peak in
2006. Yet, during the same time period, household formation
will have risen by 6 percent, indicating strengthening demand
for storage.
Vacancy Trends
Vacancy fell 130 basis points to 8.6 percent in 2015 on strong
demand, remaining more than 260 basis points lower than the
national level. In 2016, vacancy of self-storage space will re-
main tight as the rate will rise only 20 basis points to 8 percent
helped along by continued growth in the housing market.
Rent Trends
Rent growth for climate controlled and non-climate controlled
facilities last year was at 3.9 and 6.7 percent, respectively. As
demand continues to grow, climate controlled asking rents
will increase 4.2 percent to $2.13 per square foot in 2016.
Non-climate controlled rents will increase 5.4 percent to $1.86
per square foot.
Yea
r-ov
er-Y
ear
Cha
nge
Metro Total Employment
Economic Trends
-12%
-6%
0%
6%
12%
16*1514131211100908
Metro Retail Sales
0
7
14
21
28
16*15141312111009080706050403020100
Household Completions
Com
ple
ted
(Th
s.)
Single-Family Homes Multifamily Units
Vac
ancy
Rat
e
United StatesMetro
Vacancy Trends
6%
8%
10%
12%
14%
16*1514
Asking Rent Trends
Ask
ing
Ren
t p
er S
qua
re F
oot
Non-Climate ControlledClimate Controlled
$0.5
$1.0
$1.5
$2.0
$2.5
16*1514

* Forecast
Vacancy and Rent Source: REIS Services, LLC
28
Suburban Maryland
Economic Trends
Employment growth was steady in 2015, with the creation of
67,400 jobs, a 2.1 percent increase year over year. This year,
organizations will maintain their pace of hiring, expanding the
Washington, D.C., metro workforce by 2.0 percent, or 65,000
new positions. Employment gains will boost retail sales 3.0
percent year over year.
Household Trends
The multifamily market has expanded in recent years with fore-
cast completions in 2016 up 6 percent year over year. The
single-family market will grow at a higher rate this year, up
27.5 percent from 2015. Household formation has remained
steady, increasing 1.8 percent in the past year.
Vacancy Trends
In Suburban Maryland, self-storage vacancy dropped 100
basis points in 2015. This year, demand for space will spur
further tightening, pushing vacancy down another 110 basis
points to 10.2 percent. The metro’s end of the year vacancy
rate is forecast to be below the national average.
Rent Trends
This year, owners will increase asking rents for climate con-
trolled facilities 3.9 percent to $2.02 per square foot, while
rents for non-climate controlled space will gain 3.6 percent to
$1.70 per square foot. In 2015, climate controlled and non-cli-
mate controlled rents rose 2.5 percent each.
Yea
r-ov
er-Y
ear
Cha
nge
D.C. Total Employment
Economic Trends
-12%
-6%
0%
6%
12%
16*1514131211100908
D.C. Retail Sales
0
10
20
30
40
16*15141312111009080706050403020100
Washington, D.C. Household Completions
Com
ple
ted
(Th
s.)
Single-Family Homes Multifamily Units
Vac
ancy
Rat
e
United StatesSuburban MD
Vacancy Trends
8%
10%
12%
14%
16%
16*1514
Asking Rent Trends
Ask
ing
Ren
t p
er S
qua
re F
oot
Non-Climate ControlledClimate Controlled
$0.5
$1.0
$1.5
$2.0
$2.5
16*1514

* Forecast
Vacancy and Rent Sources: REIS Services, LLC
29
Memphis
Economic Trends
Total employment in the Memphis market is expected to ex-
pand 1.6 percent in 2016, or by nearly 10,100 jobs. This is up
from last year, when employers generated 8,400 new posi-
tions, a 1.4 percent increase. Retail spending is set to rise 3.1
percent this year following a 1.7 percent gain in 2015.
Household Trends
Single-family and multifamily completions in Memphis will re-
main 52 percent and 61 percent higher than the 2011 bottom,
respectively. Household formations will rise a modest 4 per-
cent, over the same time period. As households continue to
grow at a steady pace, self-storage demand will rise also.
Vacancy Trends
Continued employment and household growth will increase
demand for self-storage units across the Memphis metro. Va-
cancy will fall 110 basis points this year to 13 percent, placing
the rate 220 basis points above the national level. In 2015, the
metro vacancy rose 80 basis points to 14.1 percent.
Rent Trends
As vacancy tightens this year, operators will raise asking rents
at climate controlled and non-climate controlled facilities 3.9
percent to $1.21 per square foot and 2.6 percent to 80 cents
per square foot, respectively. Last year, rents jumped 2.9 per-
cent for climate controlled spaces and 0.7 percent for non-cli-
mate controlled units.
Yea
r-ov
er-Y
ear
Cha
nge
Metro Total Employment
Economic Trends
-6%
0%
6%
12%
18%
16*1514131211100908
Metro Retail Sales
0
3
6
9
12
16*15141312111009080706050403020100
Household Completions
Com
ple
ted
(Th
s.)
Single-Family Homes Multifamily Units
Vac
ancy
Rat
e
United StatesMetro
Vacancy Trends
8%
10%
12%
14%
16%
16*1514
Asking Rent Trends
Ask
ing
Ren
t p
er S
qua
re F
oot
Non-Climate ControlledClimate Controlled
$0
$0.5
$1.0
$1.5
$2.0
16*1514

* Forecast
Vacancy and Rent Source: REIS Services, LLC
30
Miami
Economic Trends
In 2015, employers will add 23,700 workers to payrolls, a 2.1
percent increase to the Miami workforce. During the last year,
Miami gained 15,900 new employees. Retail spending in the
market is projected to be up 4.9 percent for 2016. Last year,
retail sales expanded by 4.4 percent.
Household Trends
Year-over-year, single- and multifamily completions will expand
by 55 percent and 9 percent, respectively. Yet, total household
completions will remain 50 percent below the pre-recession
peak of 2006. Household formation is set to rise 2 percent this
year, increasing the need for self-storage units.
Vacancy Trends
Following a 120-basis-point trim in 2015 from a 10.2 percent
metrowide vacancy rate, operations will slow modestly this
year as the rate rises by 50 basis points to 9.5 percent. The
metro’s self-storage vacancy will remain 130 basis points be-
low the national vacancy rate.
Rent Trends
Last year, rents rose for climate controlled and non-climate
controlled facilities 2.7 percent to $1.84 per square foot and
3.3 percent to $1.51 per square foot, respectively. Asking rents
will increase 5 percent for climate controlled space and 3.7
percent for non-climate controlled facilities in 2016.
Yea
r-ov
er-Y
ear
Cha
nge
Metro Total Employment
Economic Trends
-12%
-6%
0%
6%
12%
16*1514131211100908
Metro Retail Sales
0
5
10
15
20
16*15141312111009080706050403020100
Household Completions
Com
ple
ted
(Th
s.)
Single-Family Homes Multifamily Units
Vac
ancy
Rat
e
United StatesMetro
Vacancy Trends
6%
8%
10%
12%
14%
16*1514
Asking Rent Trends
Ask
ing
Ren
t p
er S
qua
re F
oot
Non-Climate ControlledClimate Controlled
$0
$0.5
$1.0
$1.5
$2.0
16*1514

* Forecast
Vacancy and Rent Sources: REIS Services, LLC
31
Minneapolis-St. Paul
Economic Trends
Minneapolis-St. Paul employers will again create 1.8 percent
more positions as they add 35,000 staff to the local workforce.
Last year payrolls expanded by 33,700 workers. Rising em-
ployment will lift retail sales by 2.7 percent to close out the year
while in 2015 sales grew by 2.1 percent.
Household Trends
Developers completed 22 percent more single-family homes
last year and are on track to add another 22 percent this year.
Multifamily builders will increase the pace of completions this
year by 3 percent. Household formation will stand 12.6 percent
above 2007 levels, spurring additional demand for self-storage
space.
Vacancy Trends
As households are added to the metro, self-storage demand
will remain strong, though it won’t keep pace with supply.
Headwinds will add 40 basis points to vacancy this year, end-
ing 2016 at 13.8 percent. The change was nominal in 2015,
increasing by only 20 basis points to end the year at 13.4 per-
cent.
Rent Trends
Asking rents at climate controlled and non-climate controlled
facilities will rise 3 percent to $1.55 per square foot and 3.4
percent to $1.27 per square foot, respectively. Last year, rents
grew by 3.5 percent for climate controlled spaces, while ask-
ing rents rose 2.9 percent for non-climate controlled units.
Yea
r-ov
er-Y
ear
Cha
nge
Metro Total Employment
Economic Trends
-12%
-6%
0%
6%
12%
16*1514131211100908
Metro Retail Sales
0
7
14
21
28
16*15141312111009080706050403020100
Household Completions
Com
ple
ted
(Th
s.)
Single-Family Homes Multifamily Units
Vac
ancy
Rat
e
United StatesMetro
Vacancy Trends
8%
10%
12%
14%
16%
16*1514
Asking Rent Trends
Ask
ing
Ren
t p
er S
qua
re F
oot
Non-Climate ControlledClimate Controlled
$0
$0.5
$1.0
$1.5
$2.0
16*1514

* Forecast
Vacancy and Rent Source: REIS Services, LLC
32
Nashville
Economic Trends
During 2015, local employers added 28,900 workers to pay-
rolls, signifying growth of 3.2 percent. Employers will slow
down the rate of hiring to 2.9 percent this year through the
creation of 27,000 positions. In 2016, retail sales will grow 3.3
percent compared with 3.8 percent last year.
Household Trends
Household formation in the Nashville market has grown 17
percent from its 2007 pre-recession level. In the same nine-
year period, single-family completions have decreased by 15.6
percent, while multifamily completions have skyrocketed with
annual completions up 326 percent. This growth will intensify
demand for metro self-storage space.
Vacancy Trends
In 2015, Nashville’s self-storage vacancy fell 200 basis points
to 8.8 percent due to steady growth in employment and
households. This year, demand will level out, causing vacancy
to rise 20 basis points to 9 percent, keeping the metro’s va-
cancy rate below the national level.
Rent Trends
Asking rents for climate controlled facilities increased 5.5
percent to $1.37 per square foot while rents for non-climate
controlled jumped 4.8 percent to 91 cents per square foot in
2015. In 2016, improving conditions will support rent growth
of 4.6 and 3.9 percent in climate controlled and non-climate
controlled facilities, respectively.
Yea
r-ov
er-Y
ear
Cha
nge
Metro Total Employment
Economic Trends
-12%
-6%
0%
6%
12%
16*1514131211100908
Metro Retail Sales
0
5
10
15
20
16*15141312111009080706050403020100
Household Completions
Com
ple
ted
(Th
s.)
Single-Family Homes Multifamily Units
Vac
ancy
Rat
e
United StatesMetro
Vacancy Trends
6%
8%
10%
12%
14%
16*1514
Asking Rent Trends
Ask
ing
Ren
t p
er S
qua
re F
oot
Non-Climate ControlledClimate Controlled
$0
$0.5
$1.0
$1.5
$2.0
16*1514

* Forecast
Vacancy and Rent Sources: REIS Services, LLC
33
New York City
Economic Trends
Payrolls in the New York City metro will expand 2.1 percent
this year with the addition of 90,000 jobs. In 2015, total em-
ployment also grew 2.1 percent as 86,100 positions were cre-
ated. Retail sales are expected to rise 3.5 percent in 2016
following a 3.4 percent gain in the previous year.
Household Trends
Multifamily unit completions will rise 47 percent in 2015, while
single-family home completions will expand by 12.9 percent.
Household formations have been increasing, with a 1.1 per-
cent expansion year over year. As this growth continues, new
demand for self-storage space will increase.
Vacancy Trends
Self-storage demand is expected to pick up in 2016 as vacan-
cy is projected to drop 90 basis points to 13.7 percent during
the year. This trend is expected to continue as space is leased
by the growing demand created from new households moving
into smaller multifamily units.
Rent Trends
Asking rents at climate controlled and non-climate controlled
facilities will climb 4.6 percent to $3.11 per square foot and
4.8 percent to $2.69 per square foot, respectively. In 2015,
rents for climate controlled spaces increased 3.3 percent while
non-climate controlled units climbed 4.9 percent.
Yea
r-ov
er-Y
ear
Cha
nge
Metro Total Employment
Economic Trends
-12%
-6%
0%
6%
12%
16*1514131211100908
Metro Retail Sales
0
12.5
25.0
37.5
50.0
16*15141312111009080706050403020100
Household Completions
Com
ple
ted
(Th
s.)
Single-Family Homes Multifamily Units
Vac
ancy
Rat
e
United StatesMetro
Vacancy Trends
8%
10%
12%
14%
16%
16*1514
Asking Rent Trends
Ask
ing
Ren
t p
er S
qua
re F
oot
Non-Climate ControlledClimate Controlled
$0
$0.8
$1.6
$2.4
$3.2
16*1514

* Forecast
Vacancy and Rent Source: REIS Services, LLC
34
Northern New Jersey
Economic Trends
Employment in the Northern New Jersey area will rise by 0.9
percent this year as 18,000 positions are generated. Last year,
24,400 jobs were created, resulting in a 1.2 percent rise in total
employment. Retail spending in the Newark metro will rise to
3.4 percent in 2016, after a 1.1 percent gain last year.
Household Trends
Single-family construction has been moderate since the reces-
sion. This year single-family deliveries will decrease 1.2 percent
while multifamily properties continue to see growth, increasing
completions by 17 percent year over year. As more rentals
are fi lled, the demand for self-storage facilities will strengthen.
Vacancy Trends
Vacancy in the Northern New Jersey market will continue a
downward trend by tightening even further than last year. Va-
cancy will drop by 70 basis points to 10.6 percent to close
2016. The rate will remain 20 basis points below the national
level. In 2015, vacancy declined 10 basis points.
Rent Trends
In 2016, rents for climate controlled and non-climate controlled
units will rise 4 percent to $1.99 per square foot and 4.6 per-
cent to $1.88 per square foot, respectively. Last year, rents
at climate controlled facilities increased 3.2 percent, while at
non-climate controlled locations rents ticked up 4.6 percent.
Yea
r-ov
er-Y
ear
Cha
nge
NNJ Total Employment
Economic Trends
-12%
-6%
0%
6%
12%
16*1514131211100908
Newark Metro Retail Sales
0
3
6
9
12
16*15141312111009080706050403020100
Newark MSA Household Completions
Com
ple
ted
(Th
s.)
Single-Family Homes Multifamily Units
Vac
ancy
Rat
e
United StatesNNJ
Vacancy Trends
8%
10%
12%
14%
16%
16*1514
Asking Rent Trends
Ask
ing
Ren
t p
er S
qua
re F
oot
Non-Climate ControlledClimate Controlled
$0
$0.6
$1.2
$1.8
$2.4
16*1514

* Forecast
Vacancy and Rent Sources: REIS Services, LLC
35
Oakland
Economic Trends
In 2016, the East Bay market is projected to expand by 2.5
percent as it adds 27,600 more people to the local workforce.
This is up from last year when 21,100 jobs were generated.
Following suit, retail spending is set to rise 3.9 percent this year
following a 4.1 percent gain in 2015.
Household Trends
Household formation in Oakland has increased by 12 percent
from pre-recession levels in 2007. In the same time period,
total single- and multifamily completions have dropped by 24
percent. Yet, year over year, multifamily unit completions will
grow 31.6 percent in 2016, which will result in strong demand
for self-storage space.
Vacancy Trends
Vacancy has remained very tight in the Oakland area since
2014 on high demand for space. The vacancy rate fell 70 basis
points to 8.2 percent in 2015. Vacancy will rise 10 basis points
to 8.3 percent this year, keeping the metro vacancy well below
the national rate of 10.8 percent.
Rent Trends
In 2015, climate controlled facilities posted rent growth of 6.6
percent. Rents at non-climate controlled facilities grew 4.9
percent. This year, rents for climate controlled facilities will in-
crease another 5.4 percent to $2.11 per square foot, while
non-climate controlled facilities will climb 4.7 percent to $1.76
per square foot.
Yea
r-ov
er-Y
ear
Cha
nge
Metro Total Employment
Economic Trends
-12%
-6%
0%
6%
12%
16*1514131211100908
Metro Retail Sales
0
4
8
12
16
16*15141312111009080706050403020100
Household Completions
Com
ple
ted
(Th
s.)
Single-Family Homes Multifamily Units
Vac
ancy
Rat
e
United StatesMetro
Vacancy Trends
6%
8%
10%
12%
14%
16*1514
Asking Rent Trends
Ask
ing
Ren
t p
er S
qua
re F
oot
Non-Climate ControlledClimate Controlled
$0.5
$1.0
$1.5
$2.0
$2.5
16*1514

* Forecast
Vacancy and Rent Source: REIS Services, LLC
36
Orange County
Economic Trends
Employment in the Orange County market will increase by 2.9
percent this year as 45,200 positions are generated. Last year,
employment grew by 2.7 percent with the addition of 40,800
jobs. In 2016, retail sales are anticipated to increase 3.6 per-
cent, following a gain of 3.4 percent last year.
Household Trends
Total housing completions are 32 percent above the pre-re-
cession peak of 2006. In the same time period, multifamily unit
completions increased dramatically, by 115 percent, while sin-
gle-family completions decreased by 16 percent. Household
formation will remain steady, expanding 2 percent year over
year.
Vacancy Trends
Vacancy fell 150 basis points to 9.1 percent in 2015 on strong
demand, remaining 210 basis points lower than the nation-
al level of 11.2 percent. In 2016 vacancy will continue to de-
crease, dropping by 50 basis points to 8.6 percent as the
housing market continues to grow.
Rent Trends
Rent growth for climate controlled and non-climate controlled
facilities last year increased by 6.8 percent and 5.5 percent,
respectively. As demand continues to grow, climate controlled
asking rents will increase 4.3 percent to $1.99 per square foot
in 2016. Non-climate controlled rents will advance 4.9 percent
to $1.73 per square foot.
Yea
r-ov
er-Y
ear
Cha
nge
Metro Total Employment
Economic Trends
-12%
-6%
0%
6%
12%
16*1514131211100908
Metro Retail Sales
0
4
8
12
16
16*15141312111009080706050403020100
Household Completions
Com
ple
ted
(Th
s.)
Single-Family Homes Multifamily Units
Vac
ancy
Rat
e
United StatesMetro
Vacancy Trends
6%
8%
10%
12%
14%
16*1514
Asking Rent Trends
Ask
ing
Ren
t p
er S
qua
re F
oot
Non-Climate ControlledClimate Controlled
$0.5
$1.0
$1.5
$2.0
$2.5
16*1514

* Forecast
Vacancy and Rent Sources: REIS Services, LLC
37
Orlando
Economic Trends
Total employment in the Orlando metro will increase by 3.1
percent with the addition of 36,000 individuals to the work-
force. Last year 37,600 positions were generated, a 3.3 per-
cent rise. Retail sales will increase 7 percent in 2016, up from
the 5.4 percent gain recorded last year.
Household Trends
Household formation in Orlando has risen by 24 percent since
2007. In the same nine-year time period, single-family home
completions have dropped by 22 percent, while multifamily
unit completions have increased by 36 percent. The growing
number of households bode well for self-storage demand.
Vacancy Trends
Strong demand for storage space in the metro last year sup-
ported a 60-basis-point drop in the vacancy rate to 13 per-
cent. In 2016, market demand will cut vacancy an addition-
al 100 basis points to 12 percent, placing the rate 120 basis
points higher than the national vacancy rate.
Rent Trends
Last year, tighter vacancy lifted market rental rates for climate
controlled and non-climate controlled facilities 6.8 percent to
$1.29 per square foot and 8.2 percent to $1.02 per square
foot, respectively. Climate controlled rents will jump 4.9 per-
cent, while rents for non-climate controlled space will rise 5.1
percent during 2016.
Yea
r-ov
er-Y
ear
Cha
nge
Metro Total Employment
Economic Trends
-12%
-6%
0%
6%
12%
16*1514131211100908
Metro Retail Sales
0
10
20
30
40
16*15141312111009080706050403020100
Household Completions
Com
ple
ted
(Th
s.)
Single-Family Homes Multifamily Units
Vac
ancy
Rat
e
United StatesMetro
Vacancy Trends
8%
10%
12%
14%
16%
16*1514
Asking Rent Trends
Ask
ing
Ren
t p
er S
qua
re F
oot
Non-Climate ControlledClimate Controlled
$0
$0.5
$1.0
$1.5
$2.0
16*1514

* Forecast
Vacancy and Rent Source: REIS Services, LLC
38
Philadelphia
Economic Trends
Staffi ng in the Philadelphia market will rise by 1.1 percent this
year with the addition of 30,000 jobs. Last year, employment
increased by 1.3 percent with the creation of 35,100 positions.
Retail spending will increase 2.9 percent this year, up from the
2.6 percent growth recorded last year.
Household Trends
Single-family and multifamily completions will increase by 20
percent each this year. Though the total number of new res-
idences is 34 percent below its pre-recession peak in 2006,
multifamily unit completions have risen by 41 percent during
this time frame. Simultaneously, household formation in-
creased 5 percent since 2006, refl ecting a strong self-storage
demand as apartments are occupied.
Vacancy Trends
Last year, the vacancy rate in Philadelphia dropped 110 ba-
sis points from 12.7 percent in 2014 on continued demand
growth. Vacancy is forecast to fall 20 basis points this year,
closing out 2016 at 11.4 percent, 60 basis points above the
national vacancy rate of 10.8 percent.
Rent Trends
Asking rental rates for climate controlled and non-climate con-
trolled facilities increased 2.8 and 2.9 percent, respectively, last
year. As demand rises, climate controlled rents will climb 3.8
percent to $1.41 per square foot, while non-climate controlled
rents will rise 3.5 percent to $1.22 per square foot this year.
Yea
r-ov
er-Y
ear
Cha
nge
Metro Total Employment
Economic Trends
-12%
-6%
0%
6%
12%
16*1514131211100908
Metro Retail Sales
0
5
10
15
20
16*15141312111009080706050403020100
Household Completions
Com
ple
ted
(Th
s.)
Single-Family Homes Multifamily Units
Vac
ancy
Rat
e
United StatesMetro
Vacancy Trends
8%
10%
12%
14%
16%
16*1514
Asking Rent Trends
Ask
ing
Ren
t p
er S
qua
re F
oot
Non-Climate ControlledClimate Controlled
$0
$0.5
$1.0
$1.5
$2.0
16*1514

* Forecast
Vacancy and Rent Sources: REIS Services, LLC
39
Phoenix
Economic Trends
In 2016, payrolls in the metro will increase 2.9 percent with the
creation of 56,000 positions. Employers in the Phoenix metro
generated 54,600 jobs in 2015, expanding payrolls 2.9 per-
cent. Retail sales will rise 3.3 percent in 2016, after recording
a 3.7 percent gain last year.
Household Trends
Multifamily completions will grow in 2016, with forecasted
completions up nearly 18 percent year over year. Single-family
homes will also post strong completion numbers, increasing
26 percent this year. Household formation has advanced at a
steady pace in recent years and will fi nish 2016 up 3.5 percent
year over year.
Vacancy Trends
Steady job growth and healthy multifamily construction have
put downward pressure on vacancy. After falling 100 basis
points in 2015, vacancy in Phoenix will slide another 40 basis
points this year to 15.4 percent. This year’s vacancy rate is well
above the U.S. metro average.
Rent Trends
Asking rents for climate controlled units will rise 2.9 percent
this year to $1.28 per square foot. Meanwhile, non-climate
controlled rents will rise 4 percent to $1.08 per square foot.
Last year, asking rents at climate controlled and non-climate
controlled facilities in the metro rose 1.6 percent and 4.2 per-
cent, respectively.
Yea
r-ov
er-Y
ear
Cha
nge
Metro Total Employment
Economic Trends
-12%
-6%
0%
6%
12%
16*1514131211100908
Metro Retail Sales
0
16
32
48
64
16*15141312111009080706050403020100
Household Completions
Com
ple
ted
(Th
s.)
Single-Family Homes Multifamily Units
Vac
ancy
Rat
e
United StatesMetro
Vacancy Trends
10%
12%
14%
16%
18%
16*1514
Asking Rent Trends
Ask
ing
Ren
t p
er S
qua
re F
oot
Non-Climate ControlledClimate Controlled
$0
$0.5
$1.0
$1.5
$2.0
16*1514

* Forecast
Vacancy and Rent Source: REIS Services, LLC
40
Portland
Economic Trends
Employers in the Portland metro will boost payrolls by 44,000,
or 3.9 percent, as more individuals are added to the workforce
in 2016. Last year, a 3.8 percent increase brought 41,600 jobs
to the metro. Rising employment will increase retail sales vol-
ume by 3.6 percent in 2016, a slight drop from 3.9 percent
last year.
Household Trends
Despite a 19 percent increase in single-family home comple-
tions this year, deliveries are down nearly 41 percent from their
pre-recession peak in 2006. Multifamily properties are expect-
ed to realize a 76 percent gain over the same ten-year period,
a good indicator for the self-storage market. Household for-
mation will grow 2.4 percent year over year.
Vacancy Trends
An increase in demand for self-storage units in the Portland
market will drive vacancy down 20 basis points to 9.1 percent
by year-end 2016. The metro’s vacancy rate will be 190 basis
points tighter than the nationwide rate. In 2015, the metro va-
cancy rate recorded a 90-basis-point drop year over year.
Rent Trends
As vacancy drops this year, asking rents at climate controlled
and non-climate controlled facilities will rise 4.1 percent to
$1.55 per square foot and 4.2 percent to $1.34 per square
foot, respectively. Last year, rents grew by 4.3 percent for cli-
mate controlled spaces, while asking rents rose 5.5 percent
for non-climate controlled units.
Yea
r-ov
er-Y
ear
Cha
nge
Metro Total Employment
Economic Trends
-12%
-6%
0%
6%
12%
16*1514131211100908
Metro Retail Sales
0
5
10
15
20
16*15141312111009080706050403020100
Household Completions
Com
ple
ted
(Th
s.)
Single-Family Homes Multifamily Units
Vac
ancy
Rat
e
United StatesMetro
Vacancy Trends
8%
10%
12%
14%
16%
16*1514
Asking Rent Trends
Ask
ing
Ren
t p
er S
qua
re F
oot
Non-Climate ControlledClimate Controlled
$0
$0.5
$1.0
$1.5
$2.0
16*1514

* Forecast
Vacancy and Rent Sources: REIS Services, LLC
41
Riverside-San Bernardino
Economic Trends
Job growth will accelerate in the Inland Empire this year as
employers boost hiring 3.8 percent with the addition of 52,000
positions. In 2015, employment grew 3.6 percent as 46,800
jobs were created. Retail sales will increase 2.7 percent in
2016, after recording a 2.1 percent rise the previous year.
Household Trends
A surge of single-family completions was registered in 2015,
up 12 percent year over year. Multifamily followed suit, with
a year-over-year increase of 25 percent. However, multifamily
growth will end 2016 at half of what it was at the pre-recession
peak set in 2005. Household formation, however, is expected
to be up 17 percent during the same 11-year period.
Vacancy Trends
Vacancy in the market will fi nish 2016 well above the national
vacancy level of 10.8 percent. After a strong performance in
2015, with vacancy dropping 310 basis points to 12.1 per-
cent, 2016 is expected to level out, showing a slight rise of 30
basis points to close the year.
Rent Trends
Housing completions will push up asking rents at non-climate
controlled and climate controlled facilities by 3.6 percent this
year to $1.03 per square foot and $1.39 per square foot, re-
spectively. Last year, non-climate controlled rents increased
3.2 percent, and rents for climate controlled spaces rose 2.6
percent.
Yea
r-ov
er-Y
ear
Cha
nge
Metro Total Employment
Economic Trends
-12%
-6%
0%
6%
12%
16*1514131211100908
Metro Retail Sales
0
6
12
18
24
16*15141312111009080706050403020100
Household Completions
Com
ple
ted
(Th
s.)
Single-Family Homes Multifamily Units
Vac
ancy
Rat
e
United StatesMetro
Vacancy Trends
8%
10%
12%
14%
16%
16*1514
Asking Rent Trends
Ask
ing
Ren
t p
er S
qua
re F
oot
Non-Climate ControlledClimate Controlled
$0
$0.5
$1.0
$1.5
$2.0
16*1514

* Forecast
Vacancy and Rent Source: REIS Services, LLC
42
Sacramento
Economic Trends
During the last year, 22,700 jobs were created in the metro,
representing growth of 2.5 percent in the local workforce. Pay-
rolls are expected to expand 2.9 percent during 2016, adding
27,000 new positions. Retail sales growth will be 3.9 percent
in 2016, the same rate of growth as the previous year.
Household Trends
Single- and multifamily completions are set to increase at
greater amounts than in the previous eight years. Multifamily
production will rise 112 percent year over year and single-fam-
ily deliveries will increase 23 percent annually. Households are
expected to grow by 1.9 percent in 2016.
Vacancy Trends
Strong demand in the Sacramento area for self-storage space
pulled the vacancy rate down 280 basis points last year to
10.1 percent. This year, vacancy will rise by 20 basis points
to end 2016 at 10.3 percent. Sacramento’s vacancy rate will
remain below the national level of 10.8.
Rent Trends
In 2015, operators increased asking rents 6.5 percent for cli-
mate controlled facilities, while rents for non-climate controlled
units advanced 7.2 percent. This year, rents will rise 4.4 per-
cent to $1.37 per square foot and 5.1 percent to $1.14 per
square foot for climate controlled and non-climate controlled
facilities, respectively.
Yea
r-ov
er-Y
ear
Cha
nge
Metro Total Employment
Economic Trends
-12%
-6%
0%
6%
12%
16*1514131211100908
Metro Retail Sales
0
6
12
18
24
16*15141312111009080706050403020100
Household Completions
Com
ple
ted
(Th
s.)
Single-Family Homes Multifamily Units
Vac
ancy
Rat
e
United StatesMetro
Vacancy Trends
8%
10%
12%
14%
16%
16*1514
Asking Rent Trends
Ask
ing
Ren
t p
er S
qua
re F
oot
Non-Climate ControlledClimate Controlled
$0
$0.5
$1.0
$1.5
$2.0
16*1514

* Forecast
Vacancy and Rent Sources: REIS Services, LLC
43
Salt Lake City
Economic Trends
Employment levels along the Wasatch Front will expand by
3.3 percent this year with the creation of 38,100 jobs. In 2015,
staffi ng rose by 3.1 percent as 34,772 positions were added.
Retail sales will increase 4.6 percent in 2016, after recording a
3.4 percent rise the previous year.
Household Trends
Single-family completions will grow 29 percent in 2016 as mul-
tifamily units increase by 59 percent. Household formations
will end the year with a 2 percent gain. Multifamily unit comple-
tions have risen 211 percent in the past nine years, boding well
for self-storage facility demand.
Vacancy Trends
Vacancy of self-storage spaces in Salt Lake City dropped
metrowide from 12.6 to 10.9 percent in 2015, a 170-ba-
sis-point decline. This year the vacancy rate will drop 30 basis
points, closing out 2016 at 10.6 percent, 20 basis points be-
low the national average of 10.8 percent.
Rent Trends
As vacancy tightens, asking rents at non-climate controlled
facilities will rise 4.7 percent this year to 92 cents per square
foot, while rents at climate controlled facilities rise 2.3 percent
to $1.04 per square foot. Last year, non-climate controlled
rents increased 6.7 percent, and rents for climate controlled
spaces advanced 1.1 percent.
Yea
r-ov
er-Y
ear
Cha
nge
Metro Total Employment
Economic Trends
-12%
-6%
0%
6%
12%
16*1514131211100908
Metro Retail Sales
0
3
6
9
12
16*15141312111009080706050403020100
Household Completions
Com
ple
ted
(Th
s.)
Single-Family Homes Multifamily Units
Vac
ancy
Rat
e
United StatesMetro
Vacancy Trends
8%
10%
12%
14%
16%
16*1514
Asking Rent Trends
Ask
ing
Ren
t p
er S
qua
re F
oot
Non-Climate ControlledClimate Controlled
$0
$0.5
$1.0
$1.5
$2.0
16*1514

* Forecast
Vacancy and Rent Source: REIS Services, LLC
44
San Antonio
Economic Trends
Job growth will accelerate in 2016 as employers expand staff-
ing 3.6 percent, or by 36,000 positions. Last year, employment
jumped 3.5 percent on 33,300 new hires. Retail spending this
year will increase 2.9 percent. A rise in consumer spending on
retail goods will positively impact the self-storage market.
Household Trends
Single-family home completions will jump 7 percent from the
previous year. Multifamily housing will decrease completions
in 2016 by 27 percent after strong growth in 2015. House-
hold formation will advance 2.6 percent this year, up from 1.9
percent in 2015. An increase in these trends the past year will
support new self-storage demand across the metro.
Vacancy Trends
Healthy job growth and heightened residential construction ac-
tivity will decrease vacancy in the San Antonio metro this year,
with an expected drop of 120 basis points to 11.1 percent,
slightly above the national average. In 2015, the rate climbed
90 basis points to end the year at 12.3 percent.
Rent Trends
Average asking rent will grow 4.1 percent to $1.37 per square
foot and 4.3 percent to 97 cents per square foot at climate
controlled and non-climate controlled facilities, respectively.
In 2015, asking rents rose 3.6 percent for climate controlled
spaces and 4.1 percent for non-climate controlled units.
Yea
r-ov
er-Y
ear
Cha
nge
Metro Total Employment
Economic Trends
-12%
-6%
0%
6%
12%
16*1514131211100908
Metro Retail Sales
0
6
12
18
24
16*15141312111009080706050403020100
Household Completions
Com
ple
ted
(Th
s.)
Single-Family Homes Multifamily Units
Vac
ancy
Rat
e
United StatesMetro
Vacancy Trends
8%
10%
12%
14%
16%
16*1514
Asking Rent Trends
Ask
ing
Ren
t p
er S
qua
re F
oot
Non-Climate ControlledClimate Controlled
$0
$0.5
$1.0
$1.5
$2.0
16*1514

* Forecast
Vacancy and Rent Sources: REIS Services, LLC
45
San Diego
Economic Trends
In 2016, employment levels in the San Diego metro will rise 2.8
percent with the addition of 39,000 individuals to the work-
force. Last year, total employment increased by 37,400 work-
ers, or 2.7 percent. Retail spending in the metro will jump 4.1
percent this year after rising 3.4 percent in 2015.
Household Trends
Household formation will continue to climb steadily with an in-
crease of 2 percent in 2016. Single-family home completions
will expand by 13 percent, while multifamily unit completions
will rise by 9 percent. As metro residents increasingly pur-
sue renter lifestyles, demand for self-storage space will likely
strengthen.
Vacancy Trends
San Diego’s steady climb in population will maintain demand for
self-storage units in the market, holding vacancy unchanged in
2016 at 8.3 percent. Vacancy will be 250 basis points below
the national rate of 10.8 percent. Last year, vacancy tumbled
by 150 basis points.
Rent Trends
As occupancy rises, asking rents will push up this year at cli-
mate controlled and non-climate controlled facilities 4.4 per-
cent to $1.84 per square foot and 4.6 percent to $1.56 per
square foot, respectively. In 2015, asking rents for climate
controlled units rose 4.9 percent, while non-climate controlled
units climbed 5.9 percent.
Yea
r-ov
er-Y
ear
Cha
nge
Metro Total Employment
Economic Trends
-12%
-6%
0%
6%
12%
16*1514131211100908
Metro Retail Sales
0
5
10
15
20
16*15141312111009080706050403020100
Household Completions
Com
ple
ted
(Th
s.)
Single-Family Homes Multifamily Units
Vac
ancy
Rat
e
United StatesMetro
Vacancy Trends
6%
8%
10%
12%
14%
16*1514
Asking Rent Trends
Ask
ing
Ren
t p
er S
qua
re F
oot
Non-Climate ControlledClimate Controlled
$0
$0.5
$1.0
$1.5
$2.0
16*1514

* Forecast
Vacancy and Rent Source: REIS Services, LLC
46
San Francisco
Economic Trends
Employers in San Francisco will add 42,000 workers to pay-
rolls during 2016, representing a 3.9 percent year-over-year
gain. Staffi ng rose 3.7 percent last year on 38,100 new hires.
In 2015, retail sales rose 9.1 percent, but spending growth is
anticipated to slow this year to 7,0 percent.
Household Trends
Multifamily completions will grow by 14 percent this year, rising
54 percent above the previous peak in 2009. A robust mul-
tifamily market bodes well for the self-storage industry. Sin-
gle-family homes will jump 37 percent in 2016. Household for-
mation is forecast to post a 1 percent year-over-year increase.
Vacancy Trends
Strengthening demand for self-storage space will cause va-
cancy to fall 20 basis points this year to 6.7 percent, one of
the tightest metros in the nation. Last year, strong employment
gains and heavy consumer spending on retail goods slashed
vacancy 40 basis points.
Rent Trends
As vacancy tightens this year, asking rents at climate con-
trolled and non-climate controlled facilities will rise 3.2 percent
to $2.69 per square foot and 3.6 percent to $2.28 per square
foot, respectively. Last year, rents jumped 3.8 percent at cli-
mate controlled space and 3.1 percent in non-climate con-
trolled units.
Yea
r-ov
er-Y
ear
Cha
nge
Metro Total Employment
Economic Trends
-12%
-6%
0%
6%
12%
16*1514131211100908
Metro Retail Sales
0
1.3
2.6
3.9
5.2
16*15141312111009080706050403020100
Household Completions
Com
ple
ted
(Th
s.)
Single-Family Homes Multifamily Units
Vac
ancy
Rat
e
United StatesMetro
Vacancy Trends
6%
8%
10%
12%
14%
16*1514
Asking Rent Trends
Ask
ing
Ren
t p
er S
qua
re F
oot
Non-Climate ControlledClimate Controlled
$0
$0.8
$1.6
$2.4
$3.2
16*1514

* Forecast
Vacancy and Rent Sources: REIS Services, LLC
47
San Jose
Economic Trends
Employment in the San Jose area accelerated 4.4 percent last
year as 45,300 jobs were created, pushing the unemployment
rate down to 4 percent. The market will gain 48,000 positions
in 2016, a 4.5 percent year-over-year jump. Retail sales will
advance 4.5 percent this year, an increase from 2015 when a
3.4 percent boost was registered.
Household Trends
Multifamily completions surged over the last few years, indicat-
ing a bright outlook for self-storage space. In 2016, apartment
completions will slow, down 2.7 percent year over year, while
simultaneously more than doubling the number of completions
that occurred in 2007. Single-family growth will also decline,
down 4.8 percent year over year. Household growth will hit 1.5
percent this year.
Vacancy Trends
This year, steady demand for storage space will pull down va-
cancy 30 basis points to close out 2016 at 6.3 percent, posi-
tioning the metro 450 basis points below the national rate of
10.8 percent. Operations in San Jose posted solid improve-
ments in 2015 as vacancy fell 70 basis points.
Rent Trends
Last year, asking rents for climate controlled facilities rose 3.4
percent while non-climate controlled units jumped 2.6 percent.
In 2016, rents for climate controlled facilities and non-climate
controlled space will rise 4.9 percent to $2.05 and 4.0 percent
to $1.84 per square foot, respectively.
Yea
r-ov
er-Y
ear
Cha
nge
Metro Total Employment
Economic Trends
-8.0%
-1.5%
5.0%
11.5%
18.0%
16*1514131211100908
Metro Retail Sales
0
2.5
5.0
7.5
10.0
16*15141312111009080706050403020100
Household Completions
Com
ple
ted
(Th
s.)
Single-Family Homes Multifamily Units
Vac
ancy
Rat
e
United StatesMetro
Vacancy Trends
5%
7%
9%
11%
13%
16*1514
Asking Rent Trends
Ask
ing
Ren
t p
er S
qua
re F
oot
Non-Climate ControlledClimate Controlled
$0.5
$1.0
$1.5
$2.0
$2.5
16*1514

* Forecast
Vacancy and Rent Source: REIS Services, LLC
48
Seattle
Economic Trends
In 2016, Seattle employment will expand 3 percent for the sec-
ond year in a row as local employers create 57,750 jobs. Last
year 56,800 positions were added to the metro. Consumer
spending on retail goods will grow 7.2 percent this year, a de-
celeration from 2015 when an increase of 8.3 percent was
measured.
Household Trends
The single-family housing market will grow in 2016, with com-
pletions up 1.4 percent year over year. The multifamily market
on the other hand, will take off with nearly 25 percent more de-
liveries expected this year compared with last year. Household
formation will accelerate more than 2 percent year over year.
Vacancy Trends
Strong demand in the metro pushed down vacancy 270 basis
points in 2015. Vacancy will increase this year, rising 40 basis
points annually to 10.3 percent. The Seattle market performs
well; its vacancy will end the year 50 basis points below the
national vacancy rate of 10.8 percent.
Rent Trends
In 2016, asking rents will climb 3.7 percent to $1.77 per square
foot for climate controlled facilities and surge 4.8 percent to
$1.49 per square foot for non-climate controlled space. Last
year, operators increased climate controlled and non-climate
controlled rents by 2.3 and 5.3 percent, respectively.
Yea
r-ov
er-Y
ear
Cha
nge
Metro Total Employment
Economic Trends
-8%
-2%
4%
10%
16%
16*1514131211100908
Metro Retail Sales
0
7
14
21
28
16*15141312111009080706050403020100
Household Completions
Com
ple
ted
(Th
s.)
Single-Family Homes Multifamily Units
Vac
ancy
Rat
e
United StatesMetro
Vacancy Trends
8%
10%
12%
14%
16%
16*1514
Asking Rent Trends
Ask
ing
Ren
t p
er S
qua
re F
oot
Non-Climate ControlledClimate Controlled
$0
$0.5
$1.0
$1.5
$2.0
16*1514

* Forecast
Vacancy and Rent Sources: REIS Services, LLC
49
St. Louis
Economic Trends
In 2016, approximately 12,000 jobs will be created, represent-
ing a 0.9 percent expansion of the workforce. Employment
growth in 2015 was slightly better, as the metro gained 15,600
new positions, marking a 1.2 percent year-over-year increase.
Retail sales growth is expected to increase 2.5 percent this
year, up from a 0.3 percent contraction in 2015.
Household Trends
The multifamily market will register moderate growth in 2016,
with completions up 4.3 percent year over year. Single-family
housing construction will increase by 8 percent to close out
the year. Household formation will climb by 1 percent this year,
the greatest gain since 2006.
Vacancy Trends
Vacancy fell by 90 basis points in 2015, dropping the year-end
vacancy rate to 10.6 percent. Behind continued demand for
self-storage space, vacancy will drop 20 basis points to 10.4
percent in 2016, placing the metro’s vacancy 40 basis points
below the national level of 10.8 percent.
Rent Trends
This year, asking rents for climate controlled facilities will grow
5.7 percent to $1.42 per square foot and average rent will
climb 4.4 percent to 94 cents per square foot for non-climate
controlled space. In 2015, operators lifted rents for climate
controlled and non-climate controlled units 5.7 percent and
4.0 percent, respectively.
Yea
r-ov
er-Y
ear
Cha
nge
Metro Total Employment
Economic Trends
-12%
-6%
0%
6%
12%
16*1514131211100908
Metro Retail Sales
0
5
10
15
20
16*15141312111009080706050403020100
Household Completions
Com
ple
ted
(Th
s.)
Single-Family Homes Multifamily Units
Vac
ancy
Rat
e
United StatesMetro
Vacancy Trends
8%
10%
12%
14%
16%
16*1514
Asking Rent Trends
Ask
ing
Ren
t p
er S
qua
re F
oot
Non-Climate ControlledClimate Controlled
$0
$0.5
$1.0
$1.5
$2.0
16*1514

* Forecast
Vacancy and Rent Source: REIS Services, LLC
50
Tampa-St. Petersburg
Economic Trends
Employment in Tampa Bay increased 3.1 percent in 2015 as
employers added 38,500 workers. In 2016, the metro will post
3.3 percent job growth, expanding payrolls through the cre-
ation of 42,000 jobs. Retail sales grew 4.2 percent in 2015 and
will continue expanding at 5.9 percent in 2016 as employers
ramp up hiring.
Household Trends
Both single-family and multifamily housing completions will re-
alize sizable year-over-year gains in 2016, up 21.6 percent and
13.5 percent, respectively. Meanwhile, household formation
will also grow at a healthy clip, expanding 2.6 percent. Strong
residential construction and the formation of new living units
will drive self-storage demand in 2016.
Vacancy Trends
Heavy demand for self-storage space pushed vacancy down
300 basis points in 2015 from 12.8 percent. Need will continue
through 2016 as the Tampa market remains steady, increasing
only 10 basis points to 9.9 percent. The metro will close 2016
below the national average, sitting 90 basis points lower than
the U.S. rate.
Rent Trends
In 2015, asking rents for climate controlled facilities will rise
4.1 percent higher to $1.48 per square foot, while non-climate
controlled rents will climb 4.4 percent to $1.13 per square
foot. Last year, operators lifted rents for climate controlled and
non-climate controlled facilities 4.6 percent and 5.6 percent,
respectively.
Yea
r-ov
er-Y
ear
Cha
nge
Metro Total Employment
Economic Trends
-12%
-6%
0%
6%
12%
16*1514131211100908
Metro Retail Sales
0
10
20
30
40
16*15141312111009080706050403020100
Household Completions
Com
ple
ted
(Th
s.)
Single-Family Homes Multifamily Units
Vac
ancy
Rat
e
United StatesMetro
Vacancy Trends
8%
10%
12%
14%
16%
16*1514
Asking Rent Trends
Ask
ing
Ren
t p
er S
qua
re F
oot
Non-Climate ControlledClimate Controlled
$0
$0.5
$1.0
$1.5
$2.0
16*1514

* Forecast
Vacancy and Rent Sources: REIS Services, LLC
51
Suburban Virginia
Economic Trends
Additions of 67,400 jobs fostered employment growth of 2.1
percent in 2015. This year, organizations will maintain their
pace of hiring in the metro, expanding the Washington, D.C.,
workforce by 2.0 percent, or 65,000 new positions. Employ-
ment gains will boost retail sales 3.0 percent year over year.
Household Trends
Single-family home completions will remain below pre-reces-
sion highs but will increase by 27.5 percent from 2015. Multi-
family completions will be 22 percent higher than the previous
peak in 2006 as apartment builders ramp up construction ef-
forts. The rate of household formation will reach 1.8 percent
this year.
Vacancy Trends
In 2015, Suburban Virginia’s self-storage vacancy climbed 160
basis points to 12.4 percent. This year, demand will rise, caus-
ing vacancy to drop 100 basis points to 11.4 percent, keeping
the metro’s vacancy rate above the national level of 10.8 per-
cent by 60 basis points.
Rent Trends
This year continued growth will support rent hikes of 4.8 and
4.5 percent in climate controlled and non-climate controlled
facilities, respectively. In 2015, asking rents for climate con-
trolled facilities increased 2.5 percent to $2.03 per square foot,
while rent for non-climate controlled units jumped 2.3 percent
to $1.78 per square foot.
Yea
r-ov
er-Y
ear
Cha
nge
D.C. Total Employment
Economic Trends
-12%
-6%
0%
6%
12%
16*1514131211100908
D.C. Retail Sales
0
10
20
30
40
16*15141312111009080706050403020100C
omp
lete
d (
Ths.
)
Single-Family Homes Multifamily Units
Washington, D.C. Household Completions
Vac
ancy
Rat
e
Vacancy Trends
8%
10%
12%
14%
16%
16*1514
United StatesSuburban Virginia
Asking Rent Trends
Ask
ing
Ren
t p
er S
qua
re F
oot
Non-Climate ControlledClimate Controlled
$0.5
$1.0
$1.5
$2.0
$2.5
16*1514

* Forecast
Vacancy and Rent Source: REIS Services, LLC
52
West Palm Beach
Economic Trends
Job growth will remain steady through 2016 with the cre-
ation of 15,100 jobs, expanding the workforce 2.6 percent.
Last year, total employment grew 2.4 percent, when rough-
ly 13,800 people were added to payrolls. Retail sales will in-
crease 3.5 percent in 2016 after a 2.4 percent advance was
registered last year.
Household Trends
Both single-family and multifamily home construction will stay
robust through 2016, rising 57 percent and 7 percent, respec-
tively. Though the number of new residential completions re-
mains well below previous peaks, the total number of house-
hold is up 17.4 percent since 2007.
Vacancy Trends
Tenant demand for self-storage space in the West Palm Beach
market will push vacancy down 10 basis points to 9.4 per-
cent this year. The rate will remain 140 basis points below the
national rate of 10.8 percent. In 2015, vacancy declined 170
basis points from 11.2 percent in 2014.
Rent Trends
In 2016, rents for climate controlled and non-climate controlled
units will rise 5.3 percent to $1.67 per square foot and 4.5
percent to $1.36 per square foot, respectively. Last year, rents
at climate controlled facilities increased 6.2 percent, while at
non-climate controlled locations rents jumped 5.6 percent.
Yea
r-ov
er-Y
ear
Cha
nge
Metro Total Employment
Economic Trends
-12%
-6%
0%
6%
12%
16*1514131211100908
Metro Retail Sales
0
5
10
15
20
16*15141312111009080706050403020100
Household Completions
Com
ple
ted
(Th
s.)
Single-Family Homes Multifamily Units
Vac
ancy
Rat
e
United StatesMetro
Vacancy Trends
8%
10%
12%
14%
16%
16*1514
Asking Rent Trends
Ask
ing
Ren
t p
er S
qua
re F
oot
Non-Climate ControlledClimate Controlled
$0
$0.5
$1.0
$1.5
$2.0
16*1514

[This page is intentionally left blank.]

54
Offi ce Locations
United States
Corporate HeadquartersMarcus & Millichap
23975 Park Sorrento
Suite 400
Calabasas, CA 91302
(818) 212-2250
www.MarcusMillichap.com
Atlanta500 Northpark Town Center
1100 Abernathy Road, N.E.
Building 500, Suite 600
Atlanta, GA 30328
(678) 808-2700
Michael J. Fasano
Austin8310-2 N. Capital of Texas Highway
Suite 110
Austin, TX 78731
(512) 338-7800
Craig R. Swanson
Bakersfi eld4900 California Avenue
Tower B, 2nd Floor
Bakersfi eld, CA 93309
(661) 377-1878
Adam Christofferson
BirminghamThe Steiner Building
15 Richard Arrington Jr.
Boulevard North
Suite 300
Birmingham, AL 35203
(205) 747-3722
Jody McKibben
Boise800 W. Main Street
Suite 1460
Boise, ID 83702
(208) 401-9321
Richard A. Bird
Boston100 High Street
Suite 1025
Boston, MA 02110
(617) 896-7200
Tim Thompson
Brooklyn16 Court Street
Floor 2A
Brooklyn, NY 11241
(718) 475-4300
John Horowitz
Charleston151 Meeting Street
Suite 450
Charleston, SC 29401
(843) 952-2222
Raj Ravi
Charlotte405 Eagle Bend Drive
Waxhaw, NC 28173
(704) 443-0600
Gary R. Lucas
Charlotte Uptown201 S. Tryon Street
Suite 1220
Charlotte, NC 28202
(704) 831-4600
Raj Ravi
Chicago Downtown333 W. Wacker Drive
Suite 200
Chicago, IL 60606
(312) 327-5400
John Przybyla
Chicago Oak BrookOne Mid America Plaza
Suite 200
Oakbrook Terrace, IL 60181
(630) 570-2200
Steven Weinstock
Chicago O’Hare8750 W. Bryn Mawr Avenue
Suite 650
Chicago, IL 60631
(773) 867-1500
Steve Rachman
Cincinnati600 Vine Street
10th Floor
Cincinnati, OH 45202
(513) 878-7700
Ryan Sarbinoff
Cleveland5005 Rockside Road
Suite 1100
Independence, OH 44131
(216) 264-2000
Michael L. Glass
Columbia1320 Main Street
Suite 300
Columbia, SC 29201
(803) 678-4900
Raj Ravi
Columbus230 West Street
Suite 100
Columbus, OH 43215
(614) 360-9800
Michael L. Glass
Corpus Christi15217 S. Padre Island Drive
Suite 203
Corpus Christi, TX 78418
(361) 949-3300
J. Michael Watson
Dallas5001 Spring Valley Road
Suite 100W
Dallas, TX 75244
(972) 755-5200
Tim Speck
Denver1225 17th Street
Suite 1800
Denver, CO 80202
(303) 328-2000
Richard A. Bird
DetroitTwo Towne Square
Suite 450
Southfi eld, MI 48076
(248) 415-2600
Steven Chaben
EncinoFirst Financial Plaza
16830 Ventura Boulevard
Suite 100
Encino, CA 91436
(818) 212-2700
Adam Christofferson
Fort Lauderdale5900 N. Andrews Avenue
Suite 100
Fort Lauderdale, FL 33309
(954) 245-3400
Ryan Nee
Fort Worth300 Throckmorton Street
Suite 1500
Fort Worth, TX 76102
(817) 932-6100
Hernando Perez
Fresno8050 N. Palm Avenue
Suite 108
Fresno, CA 93711
(559) 476-5600
Adam Christofferson
Greensboro324 S. Elm Street
Suite 300
Greensboro, NC 27401
(336) 450-4600
Raj Ravi
Houston3 Riverway
Suite 800
Houston, TX 77056
(713) 452-4200
David H. Luther
Indianapolis600 E. 96th Street
Suite 500
Indianapolis, IN 46240
(317) 218-5300
Josh Caruana
Iowa425 Second Street S.E.
Suite 610
Cedar Rapids, IA 52401
(319) 333-7743
Matthew Fitzgerald
Jacksonville5220 Belfort Road
Suite 120
Jacksonville, FL 32256
(904) 672-1400
Kirk A. Felici
Kansas City7400 College Boulevard
Suite 105
Overland Park, KS 66210
(816) 410-1010
Matthew Fitzgerald
Knoxville1111 Northshore Drive
Suite S-301
Knoxville, TN 37919
(865) 299-6300
Jody McKibben
Lafayette1812 W. Pinhook Road
Suite 202
Lafayette, LA 70508
(337) 231-5174
David H. Luther
Las Vegas3800 Howard Hughes Parkway
Suite 1550
Las Vegas, NV 89169
(702) 215-7100
John Vorsheck
Little Rock5507 Ranch Drive
Suite 201
Little Rock, AR 72223
(501) 228-9600
Matthew Fitzgerald
Long BeachOne World Trade Center
Suite 2100
Long Beach, CA 90831
(562) 257-1200
Damon Wyler
Los Angeles515 S. Flower Street
Suite 500
Los Angeles, CA 90071
(213) 943-1800
Enrique Wong
Louisville9300 Shelbyville Road
Suite 1012
Louisville, KY 40222
(502) 329-5900
Matthew Fitzgerald
Manhattan260 Madison Ave, 5th Floor
New York, NY 10016
(212) 430-5100
J.D. Parker

55
Memphis5100 Poplar Avenue
Suite 2505
Memphis, TN 38137
(901) 620-3600
Jody McKibben
Miami5201 Blue Lagoon Drive
Suite 100
Miami, FL 33126
(786) 522-7000
Kirk A. Felici
Milwaukee13890 Bishops Drive
Suite 300
Brookfi eld, WI 53005
(262) 364-1900
Matthew Fitzgerald
Minneapolis1350 Lagoon Avenue
Suite 840
Minneapolis, MN 55408
(952) 852-9700
Craig Patterson
MobilePelican Square
101 Lottie Lane
Suite 3
Fairhope, AL 36532
(251) 929-7300
Jody McKibben
Nashville6 Cadillac Drive
Suite 100
Brentwood, TN 37027
(615) 997-2900
Jody McKibben
New Haven265 Church Street
Suite 210
New Haven, CT 06510
(203) 672-3300
J.D. Parker
New JerseyRiver Drive Center 3
611 River Drive
4th Floor
Elmwood Park, NJ 07407
(201) 582-1000
Brian Hosey
Newport Beach19800 MacArthur Boulevard
Suite 150
Irvine, CA 92612
(949) 419-3200
Robert Osbrink
Oakland555 12th Street
Suite 1750
Oakland, CA 94607
(510) 379-1200
Christopher J. Economou
Oklahoma City9120 N. Kelley Avenue
Suite 100
Oklahoma City, OK 73131
(405) 254-2200
J. Michael Watson
OntarioOne Lakeshore Center
3281 E. Guasti Road
Suite 800
Ontario, CA 91761
(909) 456-3400
Kevin Boeve
Orlando300 South Orange Avenue
Suite 700
Orlando, FL 32801
(407) 557-3800
Justin West
Palm Springs777 E. Tahquitz Canyon Way
Suite 200-27
Palm Springs, CA 92262
(909) 456-3400
Kevin Boeve
Palo Alto2626 Hanover Street
Palo Alto, CA 94304
(650) 391-1700
Steven J. Seligman
Philadelphia101 W. Elm Street
Suite 600
Conshohocken, PA 19428
(215) 531-7000
Brenton Baskin
Phoenix2398 E. Camelback Road
Suite 550
Phoenix, AZ 85016
(602) 687-6700
Don Morrow
Pittsburgh204 Fifth Avenue
Suite 502
Pittsburgh, PA 15222
(412) 360-7777
Michael L. Glass
Portland111 S.W. Fifth Avenue
Suite 1550
Portland, OR 97204
(503) 200-2000
Adam Lewis
Raleigh101 J Morris Commons Lane
Suite 130
Morrisville, NC 27560
(919) 674-1100
Raj Ravi
Reno241 Ridge Street
Suite 200
Reno, NV 89501
(775) 348-5200
Ryan DeMar
Sacramento3741 Douglas Boulevard
Suite 200
Roseville, CA 95661
(916) 724-1400
Ryan DeMar
Salt Lake City36 South State Street
Suite 2650
Salt Lake City, UT 84111
(801) 736-2600
Gary K. Mangum
San Antonio8200 IH-10 W
Suite 603
San Antonio, TX 78230
(210) 343-7800
J. Michael Watson
San Diego4660 La Jolla Village Drive
Suite 900
San Diego, CA 92122
(858) 373-3100
John Vorsheck
San Francisco750 Battery Street
5th Floor
San Francisco, CA 94111
(415) 963-3000
Jeffrey M. Mishkin
SeattleTwo Union Square
601 Union Street
Suite 2710
Seattle, WA 98101
(206) 826-5700
Joel Deis
Southern Virginia999 Waterside Drive
Suite 2600
Norfolk, VA 23510
(801) 736-2600
David Bradley
St. Louis7800 Forsyth Boulevard
Suite 710
St. Louis, MO 63105
(314) 889-2500
Matthew Fitzgerald
Tampa4030 W. Boy Scout Boulevard
Suite 850
Tampa, FL 33607
(813) 387-4700
Richard Matricaria
The Woodlands2441 High Timbers
Suite 130
The Woodlands, TX 77380
(832) 442-2800
David H. Luther
Tulsa7633 East 63rd Place
Suite 300
Tulsa, OK 74133
(918) 294-6300
J. Michael Watson
Ventura2775 N. Ventura Road
Suite 101
Oxnard, CA 93036
(805) 351-7200
Adam Christofferson
Washington, D.C.7200 Wisconsin Avenue
Suite 1101
Bethesda, MD 20814
(202) 536-3700
Bryn Merrey
West Los Angeles12100 W. Olympic Boulevard
Suite 350
Los Angeles, CA 90064
(310) 909-5500
Tony Solomon
Westchester50 Main Street
Suite 925
White Plains, NY 10606
(914) 220-9730
J.D. Parker
Canada
Calgary602-16 Ave. NW
Suite 211
Calgary, AB T2M 0J7
(587) 349-1302
Gary R. Lucas
Ottawa343 Preston Street
Suite 1142
Ottawa, ON K15 1N4
(343) 291-1018
Gary R. Lucas
Toronto20 Queen Street W
Suite 2300
Toronto, ON M5H 3R3
(416) 585-4646
Mark A. Paterson
Vancouver400 Burrard Street
Suite 1020
Vancouver, BC V6C 3A6
(604) 675-5200
Rene H. Palsenbarg
Offi ce Locations

56
Contact Page
National Self-Storage Group
Richard Bird | First Vice President, National Director
(303) 328-2000 | [email protected]
Written and Edited by:
John Chang | First Vice President, Research Services
Connor Devereux | Research Associate
National Research Team
John Chang | First Vice President, Research Services
James Reeves | National Production Manager
Peter Tindall | Research Operations Manager
Tamarah Calderon | Research Administrator
Rosesetti Celis | Data Analyst
Connor Devereux | Research Associate
Maria Erofeeva | Graphic Designer
Marette Flora | Copy Editor
Art Gering | Senior Analyst
Jessica Hill | Research Analyst
Gregory Leight | Research Associate
Aaron Martens | Research Analyst
Michael Murphy | Research Associate
Mridul Nanda | Research Associate
Nancy Olmsted | Market Research Analyst
Caitlyn Rogers | Research Coordinator
Spencer Ryan | Research Associate
Catherine Zelkowski | Research Associate
Communications/Graphic Design
Michelle Cocagne | Senior Vice President, Communications
Contact:
John Chang | First Vice President, Research Services
2398 E. Camelback Road, Suite 550
Phoenix, Arizona 85016
(602) 687-6700 | [email protected]
Statistical Summary Note: Metro-level data are year-end fi gures and are based on the most up-to-date information available as of February 2016. Average
prices and cap rates are a function of the age, class and geographic area of the properties trading and therefore may not be representative of the market as a
whole. Forecasts for employment data is made during the fi rst quarter and represent estimates of future performance. No representation, warranty or guarantee,
express or implied may be made as to the accuracy or reliability of the information contained herein.
Sources: Marcus & Millichap Research Services; Bureau Labor Statistics; Economy.com; Moody Analytics; CoStar Group, Inc.; REIS Services, LLC.; U.S.
Census Bureau.
© Marcus & Millichap 2016
Media Contact:
Gina Relva | Public Relations Manager
2999 Oak Road, Suite 210
Walnut Creek, CA 94597
(925) 953-1716 | [email protected]
Senior Management Team
John J. Kerin | President and Chief Executive Offi cer
(818) 212-2250 | [email protected]
Hessam Nadji | Senior Executive Vice President
(818) 212-2250 | [email protected]
Gene A. Berman | Executive Vice President
(954) 245-3400 | [email protected]
Steven R. Chaben | Senior Vice President
(248) 415-2600 | [email protected]
Adam Christofferson | Senior Vice President
(818) 212-2700| [email protected]
William E. Hughes | Senior Vice President
Marcus & Millichap Capital Corporation
(949) 419-3200 | [email protected]
Martin E. Louie | Senior Vice President, Chief Financial Offi cer
(818) 212-2250 | [email protected]
Gary R. Lucas | Senior Vice President
(415) 963-3000 | [email protected]
Paul S. Mudrich | Senior Vice President, Chief Legal Offi cer
(650) 391-1700 | [email protected]
J.D. Parker | Senior Vice President
(212) 430-5100 | [email protected]
Alan L. Pontius | Senior Vice President
(415) 963-3000 | [email protected]
Kent R. Williams | Senior Vice President
(858) 373-3100 | [email protected]

Research Services
2398 E. Camelback Road | Suite 550 | Phoenix, AZ 85016
(602) 687-6700
Of� ces Throughout the U.S. and Canada
2016
NYSE: MMI
U.S. SELF STORAGE INVESTMENT FORECAST
www.MarcusMillichap.com
Marcus & Millichap is not af� liated with, sponsored by, or endorsed by any commercial tenant or lessee identi� ed in this advertisement. The presence of anycorporation’s logo or name is not intended to indicate or imply af� liation with, or sponsorship or endorsement by, said corporation of Marcus & Millichap,its af� liates or subsidiaries, or any agent, product, service, or commercial listing of Marcus & Millichap, and is solely included for informational purposes only.Marcus & Millichap is a service mark of Marcus & Millichap Real Estate Investment Services, Inc., © 2016 Marcus & Millichap. All Rights Reserved.