2016 laborshed executive summary for greater burlington
TRANSCRIPT

This table includes all respondents without consideration of employment status or willingness to change/enter employment.
**Insufficient survey data/refused
Some Level Beyond
High SchoolAssociate Degree
Undergraduate
Degree or HigherAnnual Salary Hourly Wage
Agriculture, Forestry & Mining 64.3% 21.4% 14.3% ** **
Construction 66.7% 19.0% 9.6% ** $21.00
Education 95.0% 7.5% 67.5% $50,000 $13.78
Entertainment & Recreation 50.0% 0.0% 0.0% ** $9.75
Finance, Insurance & Real Estate 76.5% 17.6% 47.1% $38,500 $14.00
Healthcare & Social Services 80.0% 24.4% 26.6% $50,000 $14.50
Manufacturing 67.1% 19.2% 19.2% $60,000 $16.20
Personal Services 89.7% 31.0% 24.1% $34,000 $28.50
Professional Services 83.3% 22.2% 33.4% $46,500 $11.00
Public Administrat ion & Government 92.9% 28.6% 46.5% $68,500 $21.00
Transportat ion, Communication & Ut ilit ies 55.9% 11.8% 17.6% $47,500 $25.82
Wholesale & Retail Trade 60.0% 16.9% 16.9% $45,000 $10.00
Education Median Wages
75.1% (132,637)
7.4% (13,069) 7.9% (13,953) 9.6% (16,955)
22.9%
63.3%
40.6%
21.1%
0%
20%
40%
60%
80%
100%
Employed *Unemployed Homemakers Retired
Percent Likely to Change/Accept Employment
** Insufficient survey data/refused
Industry % of
Employed
Est imated # of
Employed
% Employed within
the Industry
% Likely to Change
Employment
% Unemployed*
within the Industry
Manufacturing 18.4% 24,405 75.3% 23.6% 5.5%
Wholesale & Retail Trade 15.7% 20,824 72.3% 36.2% 13.8%
Healthcare & Social Services 11.4% 15,121 75.6% 17.6% 2.2%
Education 10.7% 14,192 80.0% 25.8% 2.5%
Transportat ion, Communication & Ut ilit ies 9.0% 11,937 79.4% 18.5% 5.9%
Personal Services 8.4% 11,142 86.2% 28.0% 0.0%
Public Administrat ion & Government 7.0% 9,285 75.0% 9.5% 0.0%
Finance, Insurance & Real Estate 5.0% 6,632 88.2% 20.0% 5.9%
Construction 4.7% 6,234 66.7% 14.3% 23.8%
Agriculture, Forestry & Mining 4.0% 5,305 85.7% 8.3% 0.0%
Professional Services 3.7% 4,908 61.1% 9.1% 11.1%
Other 1.3% 1,724 ** ** **
Entertainment & Recreation 0.7% 889 ** ** **
† Individuals may be underemployed for more than one reason, but are counted only once for to tal estimated underemployment.
% UnderemployedEst imated
Underemployed
Inadequate Hours 0.7% 157
Mismatch of Skills 0.5% 112
Low Income 0.7% 157
†Total Underemployment 2.0% 448
Underemployment
Networking,
10.6%
IowaWORKS
Centers,
27.3%
Newspapers,
36.4%
Internet,
80.3%
E m p l o y m e n t L e v e l s a n d S t a t u s b y I n d u s t r y
Underemployment
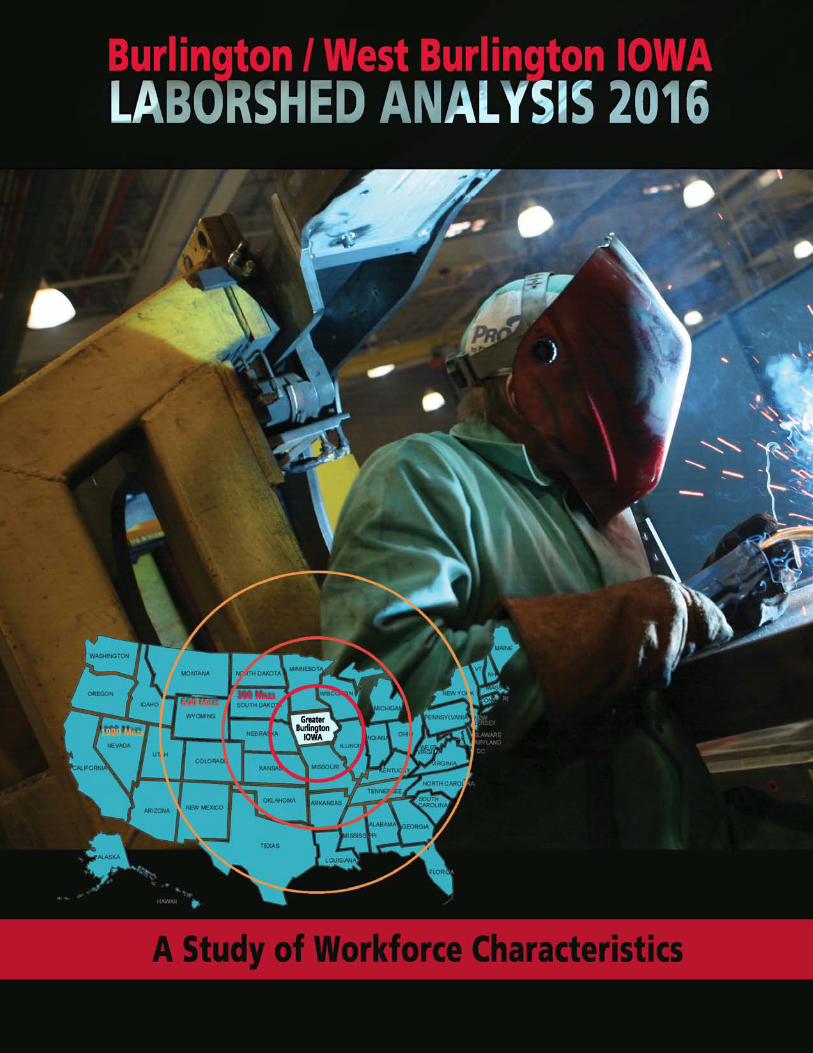
A Laborshed is the area or region from which an employment center draws its commuting workers. To determine the approximate boundaries of a Laborshed area, local employers supply the residential ZIP codes of each of their employees. This Laborshed analysis addresses the workforce characteristics of the Greater Burlington Laborshed area.
E m p l o y m e n t S t a t u s (estimated total)*
Estimated Population 18-64: 176,614 (entire Laborshed area)
Estimated Number of Individuals Very Likely or Somewhat Likely to Change or Accept Employment in Burlington/West Burlington (25,890):
22,384 Employed 1,176 Unemployed 1,153 Homemakers 1,177 Retired
Employed - likely to change employment
25.4% are actively seeking new employment 20.3% are working multiple jobs Currently working an average of 43 hrs/week Average age is 46 years old 33.9% currently working within the production,
construction & material handling occupational category followed by 21.0% within the professional, paraprofessional & technical occupational category
Most frequently identified job search resources:
Greater Burlington Laborshed Analysis
www.indeed.com www.monster.com
The Hawk Eye - Burlington (IA) The Register Mail - Galesburg (IL)
The underemployed are individuals who are working fewer than 35 hours per week but desire more hours; are working in positions that do not meet their skill or education level, or have worked for higher wages at previous employment; or are working at wages equal to or less than the national poverty level and work 35 or more hours per week.
*Employment status is self-identified by the survey respondent. The unemployment percentage above does not reflect the unemployment rate published by the U.S. Bureau of Labor Statistics, which applies a stricter definition.
Survey respondents from the Greater Burlington Laborshed area were asked to identify the industry in which they are currently working. The largest concentration of workers are employed in the manufacturing industry.

This table includes all respondents without consideration of employment status or willingness to change/enter employment.
**Insufficient survey data/refused
Some Level Beyond
High SchoolAssociate Degree
Undergraduate
Degree or HigherAnnual Salary Hourly Wage
Agriculture, Forestry & Mining 64.3% 21.4% 14.3% ** **
Construction 66.7% 19.0% 9.6% ** $21.00
Education 95.0% 7.5% 67.5% $50,000 $13.78
Entertainment & Recreation 50.0% 0.0% 0.0% ** $9.75
Finance, Insurance & Real Estate 76.5% 17.6% 47.1% $38,500 $14.00
Healthcare & Social Services 80.0% 24.4% 26.6% $50,000 $14.50
Manufacturing 67.1% 19.2% 19.2% $60,000 $16.20
Personal Services 89.7% 31.0% 24.1% $34,000 $28.50
Professional Services 83.3% 22.2% 33.4% $46,500 $11.00
Public Administrat ion & Government 92.9% 28.6% 46.5% $68,500 $21.00
Transportat ion, Communication & Ut ilit ies 55.9% 11.8% 17.6% $47,500 $25.82
Wholesale & Retail Trade 60.0% 16.9% 16.9% $45,000 $10.00
Education Median Wages
94.0%
77.1%
56.2%
41.3%
28.9%
19.4%
11.9%10.4%
7.5% 6.5%
Health/Medical Insurance
Pension/Retirement/401K
Dental Coverage
Vision Coverage
Paid Vacation
Life Insurance
Paid Holidays
Disability Insurance
Paid Sick Leave
Paid Time Off
Networking,
10.6%
IowaWORKS
Centers,
27.3%
Newspapers,
36.4%
Internet,
80.3%
The survey provides the respondents an opportunity to identify employment benefits they currently are offered. The chart at left provides the percentage of responses from those that are currently employed full-time.
The majority (68.5%) of these respondents state they are currently sharing the cost of health/medical insurance premiums with their employer. However, 13.5 percent indicate their employer pays the entire cost of insurance premiums.
C o m m u t i n g S t a t i s t i c s
The map at the right represents the concentration of those who are likely to commute into Burlington/West Burlington from their home ZIP for an employment opportunity.
Those who are likely to change/accept employment in the Greater Burlington Laborshed area are willing to commute an average of 24 miles one-way for employment opportunities.
The out commute for Burlington/West Burlington is estimated at 28.1 percent—approximately 4,056 people living in Burlington/West Burlington work in other communities.
Most of those who are out commuting are working in Fort Madison, Mediapolis, Mount Pleasant or Wapello.
Over one-fifth (14.8%) of out commuters are likely to change employment (approximately 600 people).
E d u c a t i o n L e v e l s a n d M e d i a n W a g e s b y I n d u s t r y
The Hawk Eye - Burlington (IA) The Register Mail - Galesburg (IL)
T o p C u r r e n t B e n e f i t s o f t h e F u l l - T i m e E m p l o y e d
10 Mile Radius Between Rings
Area Shown
Likely to Change/Accept Employment
by Place of Residence (per ZIP Code)
2 - 209
210 - 585
586 - 1,184
1,185 - 2,737
2,738 - 7,692
Legend
Mississippi River
Interstates
4 Lane Highways
U.S. Highways
State Highways
Illinois County
Iowa County
Missouri County
Concentration of Those Likely to Change/Accept Employment in Burlington/West Burlington

Degree/
Certification Not
Obtained, 10.6%
Trade Certified,
15.8%
Associate
Degree, 10.5%
Undergraduate
Degree, 10.5%
Newspapers,
23.5%
IowaWORKS
Centers, 35.3%
Networking,
41.2%
Internet, 47.1%
Unemployed - likely to accept employment 43.8% are actively seeking employment An estimated 1,176 unemployed individuals are likely
to accept employment in Burlington/West Burlington. Average age is 44 years old 68.4% are male; 31.6% are female Education:
47.4% are educated beyond high school
Vision Coverage,
8.3%
Prescription Drug
Coverage, 8.3%
Pension/Retirement
/401K, 8.3%
Paid Holidays, 8.3%
Disability Insurance,
8.3%
Paid Sick Leave,
16.7%
Dental Coverage,
16.7%
Paid Vacation,
33.3%
Health/Medical
Insurance, 91.7%
Top Unemployed Job Search Resources
f o r m o r e i n f o r m a t i o n r e g a r d i n g t h e g r e a t e r b u r l i n g t o n l a b o r s h e d a n a l y s i s , c o n t a c t :
Data compiled and analyzed by: Iowa Workforce Development
Labor Market Information Division 1000 E. Grand Avenue, Des Moines, Iowa 50319
Phone: (515) 281-7505 | Email: [email protected] www.iowalmi.gov
s p o n s o r e d i n p a r t n e r s h i p w i t h :
D e s i r e d B e n e f i t s
Wages: $10.00/hr - to attract 66% of applicants $11.00/hr - to attract 75% of applicants $9.50/hr - lowest median wage willing to accept
Willing to commute an average of 23 miles one way for the right opportunity
68.4% expressed interest in seasonal and 63.2% in temporary employment opportunities
68.4% expressed interest in working varied shifts
The Hawk Eye - Burlington Daily Democrat - Fort Madison
Greater Burlington Partnership 610 North 4th Street, Suite 200
Burlington, IA 52601 Phone: 319-752-6365
Fax: 319-752-6454 www.greaterburlington.com