2016 - inova health system behalf of our 16,000 employees, ... (cms) partnership for ... fairfax...
TRANSCRIPT

Quality Matters
2016

2
Dear Neighbor,
At Inova, we strive to ensure our patients and our communities have quality of care information available to them to make their health care decisions easier. We take this opportunity to reflect on the past 12 months and share our progress with you. 2016 was a year of significant achievements in many ways across Inova, including in quality and safety.
Inova continues to build a high reliability culture. The concept of a “high reliability organization” is drawn from other industries, such as manufacturing and aviation, and refers to an organization that, essentially, is able to avoid accidents. In healthcare’s complex environment, high reliability principles can be used to help hospitals achieve patient safety goals. The Agency for Healthcare Research and Quality (AHRQ) has led the way in adapting high reliability concepts for use in healthcare. Inova has embraced these principles as a new way of thinking about how to approach quality and safety. This type of culture also helps us design programs and protocols that will make a difference for patients.
This year’s report summarizes year-end data in many key quality, safety, and patient experience categories. We are particularly proud of the gains we made this year in reducing patient harm, improving patient experience, and reducing the number of patients who experience unplanned hospital readmissions. Inova hospitals have continued to maintain their excellent performance in a range of other categories, including patient safety indicators (PSIs), and severity-adjusted patient death rates.
For the rest of 2017 and going forward, we will continue to focus on some areas, including infection prevention and patient harm.
As you read the examples of the effective quality improvement programs across Inova this year, know that our programs success depend on the people who implement them. Their focus on maintaining quality and safety standards for every patient, every day is what makes a difference. We are fortunate to have an outstanding group of people at Inova, and we thank them for their commitment to our patients and our community.
Sincerely yours,
Loring S. Flint, MD Deneen M. Richmond Executive Vice President Vice President, Performance Improvement Chief Medical Officer & Outcomes
inova.org
3
Acknowledgements Thank you to the following Inova staff for their contributions to this report:
Creative Services: Rachel Arnold, Nancy Johnston and Jayne Catullo Clinical Effectiveness & Outcomes: Pooja Kumar, Leslie Caspersen and Sonali Pakala Internal Communications: Lisa Klein Infection Prevention: Jeremy Stiefel and Holly Taylor Care Coordination: Sarah Gordon Patient Experience: Heather Hunn and Christine Rust Nursing Excellence: Patricia S. Brodfuehrer Photography: Debra Troell and Anne Talley

4
Quality Matters 2016
Overview 5 Quality highlights for 2016 6 Section 1: Patient Harm Indicators 7
Healthcare-associated infections 7
Hand Hygiene Compliance 11
Complications of Care 14
Serious Harm Events 17
Section 2: Patient Outcomes 19
Severity-Adjusted Patient Death Rates 19
Unplanned Hospital Readmissions 21
Patient Experience 26
Section 3: Quality in Action- Iams Awards Winners 33
Finding D-Lite in Pain Control 33
Is This Stool Taken? Reducing C. Difficile 34
Can You C the DIFFerence? 34
Blood Transformers 35
Get Me Out The Door On Time 35
Conclusion 36

5
Overview On behalf of our 16,000 employees, we are pleased to present Inova’s 2016 Quality Matters
report to our community. This is Inova’s sixth annual public report on key quality and safety
metrics. As an organization on a high reliability journey and a culture of safety, Inova places a
high value on transparency and accountability.
Healthcare organizations are continuing to zero in on the issue of patient harm. The issue of
patient harm and patient safety first gained national attention in 1999 after a study published
by the National Institute of Medicine of the National Academies concluded that 98,000 patients
die each year as a result of preventable medical errors, adverse events, infections, and other
instances in which patients are harmed. Later studies put the number much higher.
National initiatives like the Center for Medicare and Medicaid Services (CMS) Partnership for
Patients, which aims to reduce hospital-acquired conditions by 20 percent, are helping
healthcare organizations focus their energies within the complex and dynamic healthcare
environment. The first step toward solving this problem is engaging all stakeholders – patients,
families, hospitals, doctors, nurses, government agencies, and private sector partners – in the
issue. We hope that this quality report helps to continue this important national conversation.
The report’s organization reflects our focus on outcomes-related data covering patient safety,
clinical care and patient satisfaction. Section 1 of this year’s report covers various types of
patient harm, including infections, measures of serious complications, serious reportable events
and hand hygiene compliance. Additionally, this year we have included are covering adverse
drug events. Section 2 includes patient outcomes, including readmissions, patient mortality,
and patient experience. In section 3, we highlight examples of improvement-focused changes
Inova teams made in 2016, including quality award-winning programs as well as additional
system wide programs.
To give readers a broader context to understand the data’s importance, each of Inova hospital’s
performance is placed alongside relevant external benchmarks, either government issued
statistics or reliable comparative data from the Premier healthcare alliance, which includes
1,195 hospitals across the country. Data from previous years is also included in this report for
comparison. Following each section’s data summaries are details about where Inova is focusing
improvement efforts moving forward.

6
Quality Highlights for 2016
7
Section 1: Patient Harm Indicators
Healthcare-associated infections What they are:
Healthcare-associated infections (HAIs) are infections that a person contracts while receiving medical care for another condition. Nationwide, HAIs are a significant cause of patient harm and patient deaths. Low HAI numbers indicate that a hospital is doing a good job of preventing infections. Why it matters: HAIs cause patient harm and may unnecessarily extend the need to remain in the hospital to be treated. HAIs can, in most cases, be prevented by following guidelines for safe care. How HAIs are calculated: HAls are reported using a standardized infection ratio (SIR), which is a calculation that compares the actual number of infections in a hospital to an expected number, based on national benchmarks and adjusted for risk factors about the type of care the patient is receiving as well as other patient risk factors. The CMS SIR benchmarks will be different for each infection type and are based on national performance for that type of infection. Lower SIRs represent better-than-expected infection rates. A score of zero — meaning no infections — is best. When the number of expected infections is less than one, a SIR is not calculated. In those instances, the graph will note this by indicating the SIR is “Not Reported” (NR).
In this year's report, Inova has divided HAI data into four charts that report data for three of the most common and costly HAls: central line-associated blood stream infections (CLABSIs), catheter-associated urinary tract infections (CAUTIs), Clostridium difficile (C. diff) and surgical site infections (SSI) after colon surgery and abdominal hysterectomy.
Notes on HAI data In comparing data points on these infection charts, it is helpful to remember that the Inova Fairfax Medical Campus is the largest hospital in the Inova system and the only tertiary care center. The Inova Fairfax Medical Campus has higher patient volume and a greater complexity of cases, and is expected have a higher number of infections. Other Inova hospitals have low expected numbers of infections relative to the Inova Fairfax Medical Campus. Therefore, a single infection at, for example, Inova Loudoun Hospital can result in an SIR higher than the CMS benchmark. The goal across Inova is always zero infections.

8
CLABSI: Central Line Blood Stream Infections
What they are:
A central line is a tube that is inserted into a large vein of a patient’s neck or chest to deliver
medications. Central lines can be an easy way for germs to enter the body when they are not
put in correctly or maintained clean, or are left in for a long period of time.
How they are prevented:
CLABSIs can be largely prevented by using central lines only when they are needed, using good
infection control steps to insert them, keeping them as clean as possible, and removing them as
soon as they are no longer needed.
Goal: 0.369
Lower is better

9
CAUTI: Catheter-Associated Urinary Tract Infections What they are:
A urinary catheter is a tube inserted into a patient’s urinary bladder that is left in place to
collect urine. When a urinary catheter is incorrectly inserted, not maintained properly, or left in
for long periods of time, it can become an easy way for germs to enter the body and cause a
urinary tract infection. In those cases, the infection counts as an HAI because the catheter
contributed to it.
How they are prevented:
Like CLABSIs, CAUTIs can be largely prevented by using catheters only when they are needed,
using good infection control steps to insert them, keeping them as clean as possible, and
removing them as soon as they are no longer needed.
Goal: 0.906
Lower is better

10
Clostridium difficile (C. diff) What they are:
C. diff is a type of bacteria that causes inflammation of the colon. Many people have these
bacteria in their intestines and never have any symptoms. However, if they are taking strong
antibiotics for too long, the antibiotics may kill enough of the healthy bacteria inside of the
body and allow C. diff. to grow unchecked and make you sick. C.diff infections can also occur
without taking antibiotics if you are exposed to the bacteria, especially for people who have a
weakened immune system.
How they are prevented:
C. diff is contagious and can be spread from person-to-person by touch or by direct contact
with contaminated objects and surfaces. C. diff infections can be prevented by strict hand
washing, appropriately sanitizing all medical equipment and the environment, and using
isolation precautions for patients with signs and symptoms of a C. diff infection. C.diff can also
be prevented by using the right antibiotics for only as long as necessary.
Lower is better

11
Surgical Site Infections (SSIs) What they are:
Surgical site infections occur when germs enter the body following surgery and cause serious
infections to the skin, tissues under the skin, body organs or implanted material. SSIs can be
especially high after colon surgeries.
How they are prevented:
The risk of an SSI can be prevented by following evidence-based processes of care, appropriate
use and timing of preventive antibiotics, following pathways to enhance a patient’s early
recovery after surgery, and other basic prevention strategies.
Chart 5: With the exception of Inova Fairfax, all of the other Inova hospitals had SIRs Not
Reported (NR) due to the lower volume of abdominal hysterectomy procedures.
Goal: 0.824
Goal: 0.710
Lower is better Lower is better

12
Hand Hygiene Compliance Hand hygiene is the single most important thing healthcare providers can do to prevent an infection. In 2015, Inova began a system wide hand hygiene campaign aimed at improving hand hygiene compliance through accountability. What we are doing:
In 2016, Inova remains committed to improving hand hygiene through peer-to-peer coaching as
well as patient feedback. In addition to compliance observations and reporting, Inova uses
internal checks and real-time coaching to improve compliance. Staff are trained in the World
Health Organization’s “5 Moments for Hand Hygiene” protocol, which requires proper
handwashing at five points: before patient contact, before an aseptic task, after body fluid
exposure risk, after patient contact and after contact with a patient’s surroundings.1
Inova’s improvement focus for healthcare-associated infections Infection prevention depends on many things because there are many contributing factors
that must be taken into account. Each Inova hospital has implemented process
improvements and strategies that are widely known to reduce infections. Prevention
bundles are groups of evidence-based guidelines and best practices from the content experts
at the Centers for Disease Control and Prevention (CDC) and other agencies. Prevention
measures for each type of infection are bundled together to form a consistent, evidence-
based infection prevention practice. For example, a bundle to prevent a CAUTI includes only
inserting an indwelling catheter when needed, using sterile technique to insert the catheter,
keeping the area around the catheter clean, positioning the drainage bag below the level of
the bladder at all times, and removing the catheter as soon as it is no longer medically
needed.
1 World Health Organization. “Your 5 Moments for Hand Hygiene.”
http://www.who.int/gpsc/tools/5momentsHandHygiene_A3.pdf?ua=1 Accessed April 22, 2016.
Higher is better

13
Inova's infection prevention experts work with the doctors, nurses and other staff to
educate, train and monitor that we are following the prevention bundles and all evidence-
based practices to prevent infections. We regularly review each piece of the process to
assess how we can improve and "hardwire" the practices into the way we deliver care.

14
Measures of Complication of Care
There are a number of patient safety indicators (PSIs) that were developed by the Agency for
Healthcare Research and Quality (AHRQ),2 that measure how often patients had serious
complications that are potentially preventable. Examples include blood stream infections after
surgery, blood clots in the lung or a large vein after surgery, and pressure ulcers or bed sores.
Why it matters:
When a patient develops a complication during their care, it can cause pain and suffering, may
require a transfer to a higher level of care and can lead to a longer hospitalization.
What is in the PSI-90 composite:
The PSI-90 Composite is a weighted average of the observed-to-expected ratios for 8 patient
safety indicators, or complications:3
Pressure Ulcer Rate – Pressure ulcers, commonly known as bed sores, are injuries to a patient’s skin and tissue resulting from constant pressure over an extended period of time. People who are not mobile or who have trouble changing position are at greater risk of developing pressure ulcers, including hospitalized patients and people in wheelchairs. PSI-3 measures the percentage of patients who develop severe pressure ulcers while in the hospital.
Iatrogenic Pneumothorax Rate – An iatrogenic pneumothorax is a lung injury, which can occur as a result of certain medical procedures. It occurs when air leaks into the space between the lungs, causing chest pain, pressure and shortness of breath. PSI-6 measures the percentage of patients who experience this complication.
Central Venous Catheter-Related Blood Stream Infection Rate -- Sometimes a patient may have a catheter inserted into a vein to make it easier to administer fluids or medicine. Another name for a central venous catheter is a “central line.” If the catheter’s insertion site becomes infected, it can cause serious blood infections, called central line-associated blood stream infections, or CLABSIs. PSI-7 measures a hospital’s CLABSI rate per AHRQ specifications. Note that AHRQ’s definition differs from the surveillance definition developed by the Centers for Disease Control and Prevention (CDC) that is used in the healthcare-associated infections section above.
Postoperative Hip Fracture Rate – Patients can be susceptible to fractures after surgery. However with proper care, most fractures can be avoided. PSI-8 measures how many surgical patients break a hip after surgery.
Perioperative Pulmonary Embolism or Deep Vein Thrombosis Rate – A pulmonary embolism (PE) is a life-threatening condition that occurs when a blood clot breaks off,
2 AHRQ is a federal agency dedicated to improving healthcare quality, safety, efficiency and effectiveness. For
more information, visit ahrq.gov. 3 Full information on each of these patient safety indicators is available at www.qualitymeasures.ahrq.gov.

15
travels through the blood stream and becomes lodged in the lungs. Deep vein thrombosis (DVT) is a blood clot in a deep vein. PSI-12 measures these two serious complications that can largely be avoided through proper preventative measures.
Postoperative Sepsis Rate – Sepsis is a life-threatening condition that arises when the body’s response to an infection injures its own tissues and organs. PSI-13 measures postoperative sepsis, a rare complication of surgery when sepsis occurs shortly after surgery and affects one or more body organs.
Postoperative Wound Dehiscence Rate – PSI-14 measures how often patients’ surgical wounds in the abdominal or pelvic area re-open after surgery. Good post-surgical care should prevent wound dehiscence.
Accidental Puncture or Laceration Rate – PSI-15 measures how often patients are harmed by an accidental puncture or cut (laceration) during surgeries or procedures.
Chart 7 Patient Safety Indicators for All Patients
Chart 8 Patient Safety Indicators for Medicare patients only
Goal: 0.63
Goal: 0.71
Lower is better
Lower is better

16
Inova’s improvement focus for patient safety indicators Two of the PSIs (PSI-12 PE/DVT & PSI-15 Accidental Puncture/Laceration) are heavily weighted
in the composite score. Most of each hospital’s PSI rate can be attributed to a single indicator:
PSI-12, blood clots that develop after surgery and become lodged in the lungs or clots that
develop in a deep vein. To reduce these blood clots, Inova has focused on the following:
- Assessing each patient’s unique risk for developing a blood clot and making the results of these assessments easily visible in the electronic health record to everyone on the care team so that the right treatment plans are followed
- Making sure that patients wear special stockings and use sequential compression devices to improve circulation in the legs
- Increasing how quickly patients are out of bed and walking after surgery

17
Serious Harm Events A serious harm event4 is an adverse event in which a patient suffers death or serious harm because of an error that is usually preventable. They include injuries that occurred during the patient’s care (not due to the patient’s disease) as well as harm that occurred because a healthcare worker did not follow standard care or hospital protocols.
It is important to note that an increase in the number of serious harm events is not likely to be
the result of an increase in events. Rather, because of Inova’s system wide focus on increased
reporting, increased numbers are more likely the result of better data capture.
Inova’s improvement focus for serious reportable events Falls Most of the serious harm events at Inova in 2016 were falls. Improvement teams made several changes to the process for assessing each patient’s risk of falling while in the hospital, using a valid and reliable tool. We have identified fall risk interventions customized to the patient’s risk for falls. These interventions include things like bed alarms and mats around the patient’s bed. In addition, we round more frequently on patients, assist patients to the bathroom, and share our findings and best practices across the system.
High reliability culture Since 2015, Inova has focused on developing each hospital’s culture of reliability. To that end, Inova’s current safety initiatives have several components, including regular safety checks and a redesigned safety event workflow. Reporting great catches and serious safety events are critical to developing a high reliability organization.
4 The serious harm event measurement was developed by the National Quality Forum (NQF). The NQF’s mission is
to improve healthcare quality across the country by establishing and promoting shared quality standards. For more information, visit qualityforum.org.
Lower is better

18
Great Catches Senior leadership and representatives from various departments meet every day to briefly discuss “great catches” (i.e., near misses) and safety events/concerns that have occurred in the last 24 hours and review the anticipated needs for the next 24 hours. The goal is to create an environment of open communication to mitigate risks and system failures that could potentially lead to events of patient and employee harm. Reporting great catches, precursor safety events and serious safety events are critical to a high reliability culture. Creating a user-friendly process to report safety events is one component of this process. Another part is streamlining the workflow and creating a process to notify leaders of high harm safety events in real time. The real time element is essential to ensure teams deploy adequate resources right away.
19
Section 2: Patient Outcomes
In healthcare, we are shifting away from some process measures – that look at the things
healthcare providers should do, to outcome measures – that look at what happened to a
patient as a result of the care he or she received. For example, patients coming in with a heart
attack should expect certain processes to always occur, such as receiving intervention within a
certain amount of time and receiving certain medications during and after hospitalization.
Patient death rates and readmissions are two important outcome measures. For both of these
measures, Inova benchmarks its results against the performance of the Premier healthcare
alliance. A score of 1.0 indicates that there is no difference between the hospital’s actual rate
and the expected rate. A score of less than 1.0 means hospital performance is better than
expected based on patients’ medical condition and risk profile. A score of greater than 1.0
means that the hospital performance was worse than expected based on the same risk
parameters.
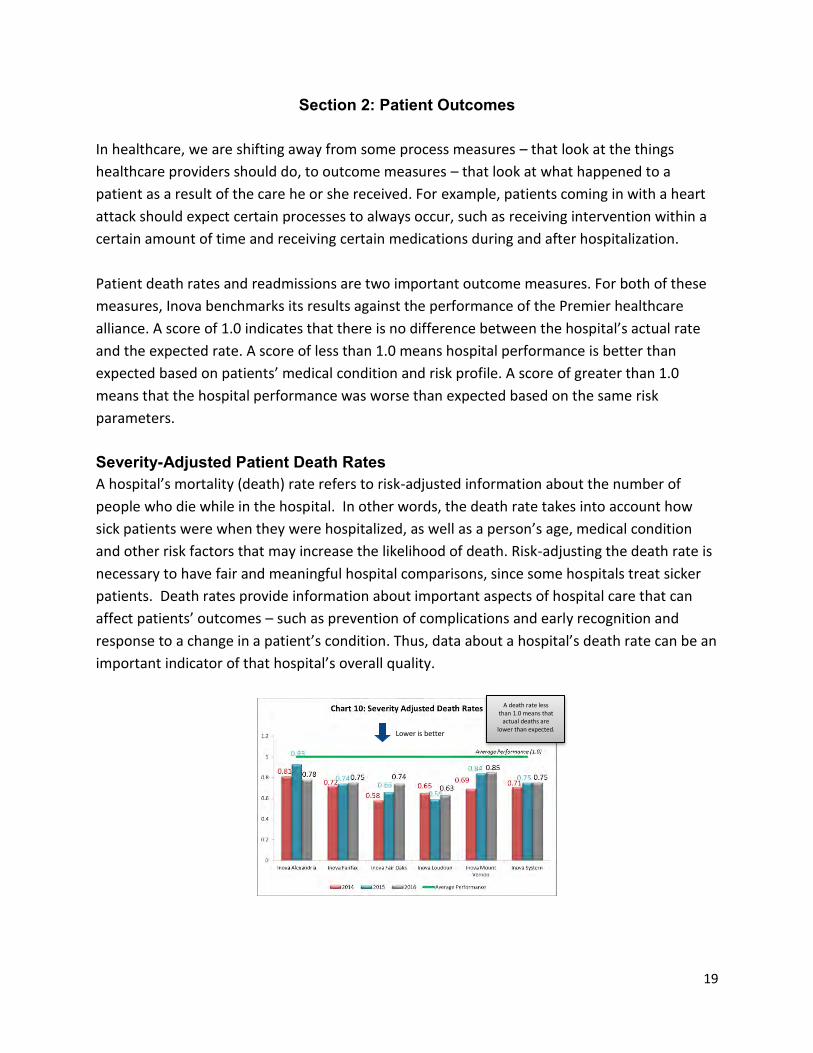
Severity-Adjusted Patient Death Rates A hospital’s mortality (death) rate refers to risk-adjusted information about the number of
people who die while in the hospital. In other words, the death rate takes into account how
sick patients were when they were hospitalized, as well as a person’s age, medical condition
and other risk factors that may increase the likelihood of death. Risk-adjusting the death rate is
necessary to have fair and meaningful hospital comparisons, since some hospitals treat sicker
patients. Death rates provide information about important aspects of hospital care that can
affect patients’ outcomes – such as prevention of complications and early recognition and
response to a change in a patient’s condition. Thus, data about a hospital’s death rate can be an
important indicator of that hospital’s overall quality.
A death rate less than 1.0 means that
actual deaths are lower than expected.
Lower is better
20
Inova’s Improvement Focus for Severity-Adjusted Death Rates In 2016, even though all five Inova hospitals performed better than expected on severity
adjusted death rates, we are continuing to focus on reducing our death rates even further.
Inova created a proactive plan to reduce sepsis deaths by early identification and management
of sepsis patients. This plan includes new screening tools and order sets, metrics and reporting
that help with early identification to aid in earlier treatment. The identification and treatment
plans include patients in the Emergency Department, Critical Care, and Inpatient non-Critical
Care. Treatment of sepsis is very time sensitive and the use of standardized screening tools will
help to reduce sepsis death rates.

21
Unplanned Hospital Readmissions
Why it matters:
A hospital’s 30-day readmission rate is a quality indicator of whether a patient received high
quality care while in the hospital and had an effective transition to care after the
hospitalization. When a patient has an unplanned readmission to the hospital a short time after
being discharged, it can indicate a problem that a patient developed as a result of the care they
received, or it can indicate that the problem for which a patient was treated was not fully
resolved. It could also indicate that the patient did not have the support they needed once they
left the hospital, with follow up care, medications or community resources, and thus did not
transition to the outpatient setting successfully.
In other cases, the readmission is unrelated to the care the patient received during a previous
hospital stay. For example, a heart failure patient who is discharged from the hospital and
breaks a leg in an automobile accident two weeks later would be counted, even though the
trauma is unrelated to the previous admission for heart failure.
How it is measured:
The risk-adjusted rate takes into account risk factors such as a patient’s age, medical history,
and other medical conditions that may make a readmission more likely. Accounting for
differences in patients’ risk profiles ensures that hospitals are compared with each other fairly.
Readmission data is presented as a ratio of a hospital’s observed readmission rate to its
expected readmission rate (often called the observed-to-expected, or o/e, ratio) as mentioned
previously.
Inova benchmarks its performance using Premier healthcare alliance data. Chart 11 shows
three years of 30-day readmission data for all inpatients, all payers. In 2016, Inova’s system-
wide rate (0.96) was better than expected. Four of the five Inova hospitals performed better
than expected on all inpatient, all payers readmission.

22
30-day risk-adjusted readmission rates: all inpatients, all causes
Charts 12 – 17 show three years of 30-day readmission data for focused Medicare populations
of individuals age 65 or older. For all of these charts, a rate less than 1.0 indicates that the
hospital/system performed better than expected.
Heart attack readmissions
Chronic obstructive pulmonary disease readmissions
Lower is better
Lower is better
Lower is better

23
Heart failure readmissions
Pneumonia readmissions
Hip and knee joint replacement readmissions
Lower is better
Lower is better
Lower is better

24
Coronary Artery Bypass Graft (CABG) readmissions CABG procedures are only performed at two of the Inova hospitals.
Inova’s improvement focus for readmissions
Inova remains focused ensuring the quality of discharge from the hospital and the transition to home, with particular attention to making sure patients are taking the right medications after they leave the hospital. Specific steps include:
Identifying a patient with a high readmission risk at admission, using a predictive analysis tool in EpicCare, so that the right treatment plans can be put in place.
Staffing each hospital’s emergency department with case management staff to make sure that patients who don’t need to be admitted get connected with the right level of care and services.
Having our pharmacy team work with the patient and the rest of our care team to make sure we know all of the medications a patient is taking before coming to the hospital so that we can continue the medications they need; and make sure the patient knows which medications to start, continue or stop after they leave the hospital.
Educating patients about their health conditions and early warning signs that they may be getting worse so that they can seek treatment early and hopefully avoid the need for another hospital stay
Connecting the patient to the right resources in the community after they leave the hospital to help them better manage their medical condition
Conducting an analysis and audit of each readmission that occurs so that we can continue learning and get better at preventing future readmissions.
Lower is better

25
The graphic below shows how we are focusing our efforts to prevent readmissions:

26
Patient Experience
Inova is committed to making each patient’s experience the best it can be. The Healthcare
Consumer Assessment of Healthcare Providers and Systems (HCAHPS)5 is a CMS-mandated
survey that tracks patients’ perception of their hospital experience. Using a standardized
patient experience survey like HCAHPS allows Inova to compare its results directly with other
hospitals.
To collect this data, each Inova hospital sent thousands of surveys to recently discharged
patients: in 2016, Inova collected more than 13,000 survey responses system wide. It is
important to note that even if there are multiple positive answer choices – for example, some
questions ask the patient to rate on a scale that includes “never,” “sometimes,” “usually,” or
“always” – only the most positive “top-box” answer counts. In this example, only a rating of
“always” would count as a positive answer. In other words, if a patient reports that the
hospital’s staff “usually” responded quickly to the call bell, that answer would count as a
negative score.
The charts in this section show our patient experience results for the last three years, 2014 –
2016, with the CMS national average indicated for reference purposes by the green line on each
chart.
Note on patient experience charts: although patient experience data is calculated to one
decimal place, the charts in this report use data labels with whole percentage values. Slight
differences in bar heights represent slight differences in percentages.
5 HCAHPS was developed by CMS and AHRQ. Please note that these results may differ slightly from the official CMS
HCAHPS results, because the case-mix adjustment that CMS applies to survey results may vary slightly from the simulated case-mix adjustment Inova has used to generate this data.

27
Nursing communication The HCAHPS survey has three questions covering patients’ opinions of how well a hospital’s nurses communicated, including:
how often nurses treated them with courtesy and respect,
how often nurses listened carefully to them and
how often nurses explained things in a way they could understand
Doctor communication In the doctor communication category, patients were asked to rate the hospital on three aspects, including:
how often doctors treated them with courtesy and respect,
how often doctors listened carefully to them and
how often doctors explained things in a way they understood.
Higher is better
Higher is better

28
Responsiveness of staff The HCAHPS survey collects data on two aspects of staff responsiveness, measuring patients’ opinion of whether:
their call bell was always answered quickly and
they always received help right away when they needed to use the bathroom.
Pain management In this HCAHPS category, patients were asked to rate their hospital’s effectiveness in managing their pain during their stay, including:
how often their pain was well controlled and
how often the hospital staff did everything they could to help relieve pain
Higher is better
Higher is better

29
Communication about medications In this category, patients were asked about how well hospital staff explained medicines to patients before administering them, including:
how often hospital staff explained what a new medicine was for before giving it to the patient and
how often hospital staff clearly explained possible side effects of any new medicine before giving it to the patient
Cleanliness and Quietness
The subsets of question 23 are below
Higher is better
Higher is better
Higher is better
Higher is better

30
Discharge instructions The discharge instructions portion of the survey collects data about whether patients felt they were appropriately prepared for discharge. In contrast to the previous categories, patients are asked to answer “yes” or “no” as to:
whether someone on their healthcare team asked whether they had the help they needed when they left the hospital and
whether they were given written information about symptoms or problems to look for after they left the hospital
Higher is better

31
Care transitions This category asks patients to rate how well the hospital prepared them to transition home from the hospital, including:
whether staff took their preferences and those of their family or caregiver into account in deciding what my health care needs would be when they left,
whether they had a good understanding of the things they were responsible for in managing their health and
whether they clearly understood the purpose for taking each of their medications when they left
As Chart 25 shows, four out of five Inova hospitals had rates that were better than the national
average.
Overall rating This HCAHPS category asks patients to rate the hospital overall on a scale from 0 (worst possible hospital) to 10 (best possible hospital). Chart 26 depicts what percentage of respondents selected the highest scores (9 or 10) in response to this question.
Higher is better
Higher is better

32
Inova’s improvement focus for Patient Experience Inova continued to demonstrate significant improvement in HCAHPS scores throughout 2016.
Overall, we focused on the quality and consistency of how we provide care and interact with
each other and with our patients every day. This improved teamwork and better aligned
everyone on the care team (physicians, nurses, pharmacists, etc.) and all departments that
deliver care and services to our patients. Some specific actions include:
creating standard processes that happen daily where the nurse and doctor connect
face-to-face in the room with the patient/family to discuss plans for care and when the
patient can go home.
Seeking input from patients on how we can better deliver our care and services through
their participation on patient and family advisory councils, as well as hospital
committees
Providing coaching and using simulation environments with cameras and actions to help
our care team practice ways to better communicate.

33
Section 3: Quality in Action/Iams Awards
Franklin P. Iams was the visionary founder of the Fairfax Hospital Association, the founding
organization of Inova Health System.
Long before Inova was bricks and mortar, Mr. Iams envisioned a distinct, multi-hospital
healthcare system with a single standard of quality, a single medical staff and a single approach
to the patient experience. He inspired Inova’s commitment to continuous innovation, and
established teaching and education as integral parts of Inova’s mission.
Named in his honor, the Iams Memorial Quality Leadership Awards reflect Frank Iams’ ideals and
Inova’s focus on new ideas and new approaches. Applicants must demonstrate a measurable
improvement in clinical quality, service or patient safety.
We are proud to showcase our 2016 Iams awards winners: Finding D-Lite in Pain Control Awardee: Inova Alexandria Hospital Emergency Department In the emergency department (ED), patients need rapid, effective and safe pain control. Opioids are among the most effective treatments for acute pain, but they can cause addiction. In light of the national opioid epidemic, clinicians wanted to ensure they were providing optimized pain control for patients while not contributing to this problem.
A multidisciplinary team of physicians, nursing, pharmacy and clinical technicians came together
to review prescribing practices and seek opportunities for improvement. Data revealed that
Dilaudid (hydromorphone), a potent opioid analgesic, was prescribed more often than safer
alternatives.
Within a few months, the team not only successfully changed ordering patterns, but also
transformed the culture when it comes to hydromorphone prescribing. Dilaudid orders dropped
precipitously, from 54 percent to 3 percent. Overall opioid orders fell 25 percent.
Collaboration outside the ED was important. The team worked closely with the admitting
physicians, as well as pain specialists and internal medicine specialists, to align everyone’s
interests. They improved patient safety and physician satisfaction, and had annual savings of
more than $40,000.
Inova HealthPlex Springfield has implemented a similar program and achieved impressive results,
and the program has been shared with all Inova emergency departments and hospitals. Watch a video summary of Finding D-Lite in Pain Control.

34
Is This Stool Taken? Reducing C. Difficile Awardee: Inova Loudoun Hospital In 2015, Inova Loudoun Hospital had 35 cases of hospital-acquired C.difficile, a potentially life-
threatening bacterial infection that can cause severe diarrhea and abdominal pain. The hospital
convened a multidisciplinary team – including physicians, nurses, lab techs, pharmacists, infection
control specialists, and representatives from informatics and environmental services – to address
the problem. A root cause analysis revealed a number of areas for improvement, chief among
them hand hygiene, patient history, environmental management and antibiotic use.
The team developed 11 strategies to reduce C.difficile infections. These included better hand
washing compliance, process changes for terminal cleaning, use of the Diarrhea Decision Tree to
identify C.difficile cases, appropriate order management, improved patient history review, and
improved physician education around antibiotic use. Together, these strategies resulted in a 54
percent improvement, exceeding Inova’s system wide goal of 25% reduction.
Currently, the team is developing ways to engage patients in hand hygiene efforts throughout the
hospital. This will not only improve the patient experience, but also keep patients safer during
their stay. Watch a video summary of Is This Stool Taken?
Can You C the DIFFerence? Awardee: Inova Mount Vernon Hospital Inova Mount Vernon Hospital was another Inova facility with high rates of C.difficile. In 2015, 33 patients acquired the bacterial infection. The hospital assembled a multidisciplinary team to determine the cause and work toward achieving Inova’s system-wide goal of reducing C.difficile cases by 25%. The team found that, despite the Diarrhea Decision Tree, clinicians were still sending samples to the lab for testing that did not meet the standard. Over-testing can lead to higher rates of C.difficile because the test is so sensitive it may read positive even if the patient does not have an active infection.
Through staff education and standardization, the hospital reduced C.difficile tests by nearly 40
percent, and the number of C.difficile cases by 45 percent, far surpassing the System goal of 25
percent.
Multidisciplinary collaboration was vital for success. Staff from Laboratory and Pharmacy worked
together to improve the process from the start. In addition, the team made sure the process was
not dependent on a single person, but was tied to shifts, and everyone working those shifts was
fully trained for smooth functioning around the clock. Watch a video summary of Can You C the DIFFerence?

35
Blood Transformers Awardee: System-wide Joint Replacement improvement team In 2012, a high percentage of Inova primary joint replacement patients were receiving post-
operative blood transfusions to control anemia. This contributed to longer hospital stays, higher
costs and lower patient satisfaction.
A system wide joint replacement outcomes team set a goal to reduce the percentage of patients
receiving transfusions across all Inova hospitals. Innovative reduction strategies were developed,
shared and implemented to address root causes and drive down blood utilization rates.
Strategies included stopping the common practice of pre-surgical autologous blood donation,
stopping NSAIDs two weeks prior to surgery to reduce excessive blood loss in the ER and
establishing an anemia prevention standard to give patients oral iron.
By the end of 2016, these strategies had reduced blood transfusion rates for hip replacement
patients from 17.4 percent to 3.8 percent, and for knee replacement patients from 11.8 percent
to 1.6 percent. Outcomes were well below the initial goal of 5 percent or below for hip patients
and 3 percent or below for knee patients, and surpassed the Premier top quartile benchmarks.
Watch a video summary of Blood Transformers.
In the addition to the four award winners showcased above, we had one team that was
recognized with an honorable mention:
Get Me Out The Door On Time Awardee: Inova Fair Oaks Hospital – Department of Surgery The Inova Fair Oaks Hospital Surgical Unit was struggling to maintain patient throughput. Patients would often board in the Post-Anesthesia Care Unit (PACU) for hours, which would further back up the operating rooms (ORs) and reduce the amount of time patients worked with therapy, prolonging length of stay. An analysis revealed the problem stemmed from patients not being discharged from the Surgical
Unit in a timely manner. A further root cause analysis found discharge delays resulted from:
No ride home
Lack of a standard nursing process to prepare patients for discharge
Delays in obtaining durable medical equipment from Case Management
A delay in surgeons writing discharge orders
And a delay in getting prescriptions filled at the pharmacy The unit created a discharge appointment program and piloted it with joint replacement patients before expanding it to other service lines. After implementation:
More than 80 percent of patients are discharged within an hour of their appointment time
PACU boarder minutes dropped 89 percent – from nearly 4,000 per month to just 442
Patient satisfaction with the discharge process improved from the 82nd percentile to percentiles in the mid-to-high 90

36
Conclusion We welcome your questions, comments, and suggestions about this report. To contact the Quality Matters team, please email us through the web link at www.inova.org/contactus.