2016 half-year results - william hill...
TRANSCRIPT

12016 half-year results26 weeks ended 28 June 2016 | 5 August 2016

2
NOT FOR PUBLICATION OR DISTRIBUTION IN WHOLE OR IN PART IN, INTO OR FROM ANY JURISDICTION WHERE TO DO SO WOULD CONSTITUTE A VIOLATION OF THE RELEVANT LAWS OR REGULATIONS OF THAT JURISDICTION
This presentation has been prepared by William Hill PLC (“William Hill”). This presentation includes statements that are, or may be deemed to be, “forward-looking statements”. These forward-looking statements can be identified by the use of forward-looking terminology, including the terms "believes", "estimates", "anticipates", "expects", "intends", "plans", "goal", "target", "aim", "may", "will", "would", "could" or "should" or, in each case, their negative or other variations or comparable terminology. These forward-looking statements include all matters that are not historical facts. They appear in a number of places throughout this presentation and the information incorporated by reference into this presentation, and include statements regarding the intentions, beliefs or current expectations of the directors, William Hill or the Group concerning, amongst other things, the results of operations,financial condition, liquidity, prospects, growth, strategies and dividend policy of William Hill and the industry in which it operates.
By their nature, forward-looking statements involve risks and uncertainties because they relate to events and depend on circumstances that may or may not occur in the future and may be beyond William Hill's ability to control or predict. Forward-looking statements are not guarantees of future performance and hence may prove to be erroneous. The Group's actual results of operations, financial condition, liquidity, dividend policy and the development of the industry in which it operates may differ materially from the impression created by the forward-looking statements contained in this presentation and/or the information incorporated by reference into this presentation. In addition, even if the results of operations, financial condition, liquidity and dividend policy of the Group and the development of the industry in which it operates are consistent with the forward-looking statements contained in this presentation and/or the information incorporated by reference into this presentation, those results or developments may not be indicative of results or developments in subsequent periods.Other than in accordance with its legal or regulatory obligations (including under the Market Abuse Regulation (596/2014), the Listing Rules, the Disclosure Guidance and Transparency Rules and the Prospectus Rules), William Hill does not undertake any obligation to update or revise publicly any forward-looking statement, whether as a result of new information, future events or otherwise.
Disclaimer
3
Agenda
Welcome Gareth Davis, Chairman
Operating and Philip Bowcock, Interim CEOfinancial review
Q&A Philip Bowcock, Interim CEOCrispin Nieboer, MD, OnlineNicola Frampton, Director, UK Retail

4
Operating and financial review Philip Bowcock | Interim CEO

5
Performance overview
• Trading in line with operating profit guidance of £260-280m1
• Strong EURO 2016 mitigates impact of Cheltenham losses• Early progress on Online turnaround:
– Sportsbook mobile user experience redesigned in time for EURO 2016– Mobile web and apps localised for four markets
• Revenue and profit growth in Retail, ahead of target with SSBT roll-out• 12% turnover growth in Australia, profit improvement expected to follow• 49% profit growth in US• Investing in technology strategy
– c£90m invested in NYX with new OpenBet agreement to deliver enhanced technology platform – £13.6m acquisition of Grand Parade brings award-winning digital development and user
experience expertise in-house• Net debt for covenant purposes increased to £586.2m, 1.7x EBITDA• £60m share buyback• Interim dividend maintained at 4.1p per share reflecting the Board’s confidence in the
business
1. For further information, refer to the ‘Further information in relation to Guidance’ section in the 2016 half-year results announcement
Notes: Numbers are presented on an adjusted basis. Definitions are provided in the glossary at the back of the presentation.
6
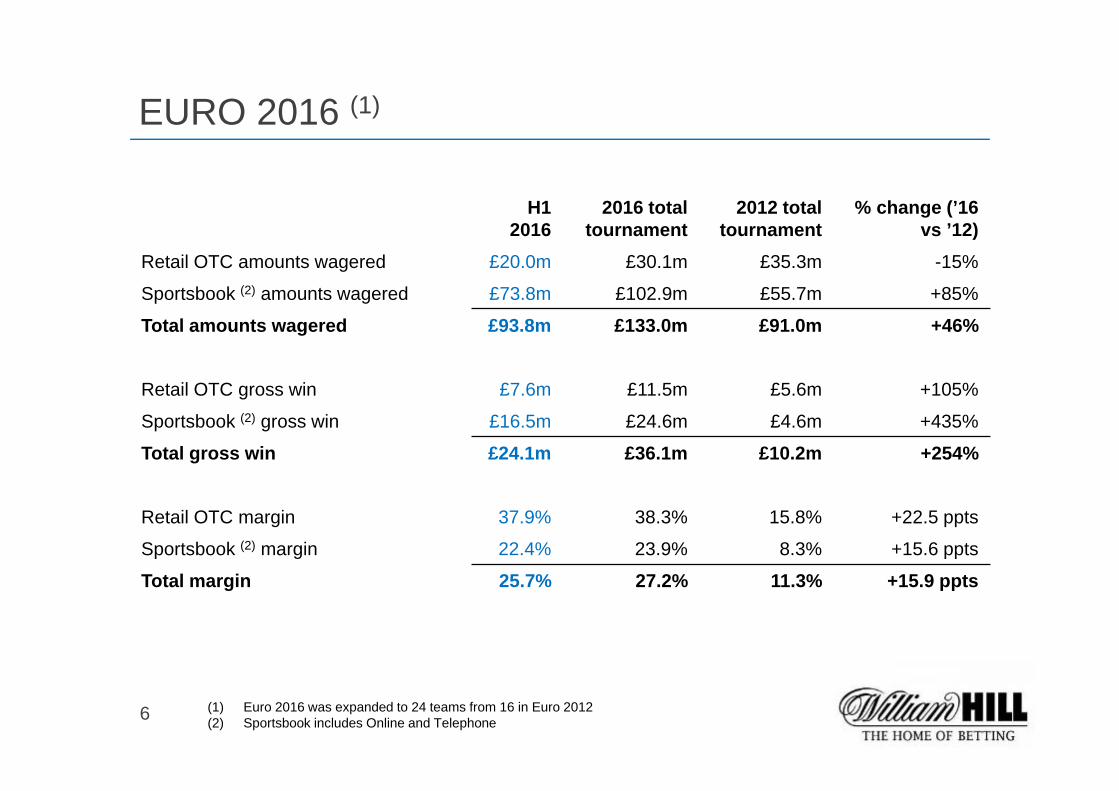
H1 2016
2016 totaltournament
2012 total tournament
% change (’16 vs ’12)
Retail OTC amounts wagered £20.0m £30.1m £35.3m -15%
Sportsbook (2) amounts wagered £73.8m £102.9m £55.7m +85%
Total amounts wagered £93.8m £133.0m £91.0m +46%
Retail OTC gross win £7.6m £11.5m £5.6m +105%
Sportsbook (2) gross win £16.5m £24.6m £4.6m +435%
Total gross win £24.1m £36.1m £10.2m +254%
Retail OTC margin 37.9% 38.3% 15.8% +22.5 ppts
Sportsbook (2) margin 22.4% 23.9% 8.3% +15.6 ppts
Total margin 25.7% 27.2% 11.3% +15.9 ppts
EURO 2016 (1)
(1) Euro 2016 was expanded to 24 teams from 16 in Euro 2012(2) Sportsbook includes Online and Telephone

7
Group income statement
H1 2016£m
H1 2015£m
% change
Net revenue 814.4 808.1 +1%Operating profit 131.1 155.7 -16%Net finance costs (21.8) (19.9) +10%Profit before tax 109.3 135.8 -20%Tax (16.8) (26.2) -36%Adjusted profit after tax 92.5 109.6 -16%
Exceptional items and adjustments (net of tax)
(7.8) (40.1) -81%
Basic, adjusted EPS (p) 10.5 12.5 -16%Basic EPS (p) 9.7 7.9 +23%Dividend per share (p) 4.1 4.1 0%
Throughout this presentation, numbers are presented on an adjusted basis unless otherwise stated. Definitions are provided in the glossary at the back of the presentation.
• Net revenue +1%, operating costs +6%
• Effective tax rate of 15.4%
• £350m corporate bond issued in May
• Includes restructuring charges, amortisation of intangibles recognised on acquisitions, gains on early settlement of certain shop closure provisions and NYX investment fair value charges
• 2015 included Australian brand accelerated amortisation

8
Online income statement and KPIs
H1 2016 £m
H1 2015£m
% change
Sportsbook amounts wagered 2,235.9 2,256.8 -1%- Sportsbook gross win margin 7.3% 7.2% +0.1ppts
Sportsbook net revenue 139.9 141.0 -1%Gaming net revenue 137.3 145.6 -6%- Vegas product suite 83.0 83.6 -1%- Playtech Casino 40.2 44.5 -10%- Poker 3.4 5.5 -38%- Bingo 10.7 12.0 -11%
Net revenue 277.2 286.6 -3%Cost of sales (62.0) (64.1) -3%Gross profit 215.2 222.5 -3%Operating costs (171.8) (157.9) +9%- Employee costs (32.0) (28.3) +13%
- Marketing (69.7) (62.4) +12%
- Finance charges (12.6) (13.9) -9%
- Depreciation and amortisation1 (19.1) (15.7) +22%
- Other costs incl. recharges (38.4) (37.6) +2%
Operating profit 43.4 64.6 -33%
Online (excluding Telephone) H1 2016 H1 2015 %
Unique actives (’000) 1,772.2 1,849.2 -4%
Revenue / unique active (£) 153.5 151.4 +1%
New accounts (’000) 615.1 742.1 -17%
Ave. cost per acquisition (£) 111.7 82.8 +35%
1. Excludes £0.7m of Online amortisation relating to acquired intangibles (H1 2015: £0.7m)
• Marketing 25% of net revenue, H1 weighting for EURO 2016
• UK wagering -0.7%• Italy and Spain wagering +22%, total net revenue +26%
• Improving gross win margin: P1-4 6.3%, P5-6 9.3%
• Staff costs includes headcount for UX, BI, international

9
Online update
Underlying wagering performance• Tennis -2 ppts• Market closures -1 ppt• Time-outs/automatic self-exclusions -1 ppt• Underlying growth rate +3%• UK underlying growth rate +3%
Other operating updates• Gaming performance
– Focus for next phase of UX improvements – lobby, funnel, cross-sell– Impact of market closures and regulatory changes
• Time-outs / automatic self-exclusions– Slight changes to average weekly accounts and return rates
325,272
319,584
Apr 2015 Jun 2016
Sportsbook UK weekly average accounts (six-month rolling basis)

10
Retail income statement and KPIsH1 2016
£m H1 2015
£m%
change
OTC amounts wagered 1,184.7 1,229.9 -4%
OTC gross win 225.0 219.7 +2%
- OTC gross win margin 19.0% 17.9% +1.1ppts
Machines gross win 242.3 229.3 +6%
Total gross win 467.3 449.0 +4%
Net revenue 467.2 448.9 +4%
Cost of sales (116.4) (110.7) +5%
Gross profit 350.8 338.2 +4%
Operating costs (256.4) (247.7) +4%
- Employee costs (97.4) (92.5) +5%
- Property costs (52.6) (51.8) +2%
- Content costs (36.2) (35.4) +2%
- Depr. and amortisation (14.8) (14.7) +1%
- Other costs incl. recharges (55.4) (53.3) +4%
Operating profit 94.4 90.5 +4%
• Restructured Gaming Operations team driving strong growth, better content management
H1 2016 H1 2015 % change
Average no. of LBOs 2,371 2,362 +0%Average no. of machines 9,336 9,294 +0%Machine density 3.94 3.93 +0%Gross win / machine / week1 £998 £949 +5%Machine gross win margin 3.55% 3.47% +0.08 ppts
1. Excludes free bets
• Wagering impacted by higher than average gross win margin

11
Proprietary self-service betting terminal rolling out
• Only major operator with proprietary SSBT• 800 rolled out, ahead of 500 target for EURO 2016• Performing in line with expectations• Roll-out further 1,200 before year-end• Focus on content roadmap from H2

12
Australia income statement and KPIs
H1 2016A$m
H1 2015A$m
% change
Amounts wagered 1,156.6 1,022.9 +13%Gross win 114.2 114.2 0%- Gross win margin 9.9% 11.2% -1.3 ppts
Net revenue 93.2 103.4 -10%Cost of sales (24.3) (23.9) +2%Gross profit 68.9 79.5 -13%Operating costs (61.6) (60.3) +2%- Employee costs (20.4) (17.2) +19%
- Marketing (24.4) (26.0) -6%
- Depreciation and amortisation (6.0) (4.9) +22%
- Other costs incl. recharges (10.8) (12.2) -11%
Operating profit in A$m 7.3 19.2 -62%Operating profit in £m 3.9 9.8 -60%
• Double-digit growth in turnover
• Industry-wide poor horseracing results in H1
• Australian Open sponsorship in H1 2016• William Hill brand launch in H1 2015
H1 2016
H1 2015
%change
Unique active players (’000) 190.9 204.7 -7%Revenue/unique active (A$) 488 505 -3%New accounts (’000) 52.0 40.6 +28%Cost per acquisition (A$) 468 641 -27%

13
-12%
-7%
-2%
3%
8%
13%
Jan Feb Mar Apr May Jun
Rapid product delivery• 31 product initiatives delivered in H1
Focus on William Hill brand• William Hill (ex-Centrebet) turnover +28% and new accounts +38% • Successful tomwaterhouse.com migration • Centrebet migration to be completed in H2
Australia update
Ahead of market growth rates
H1 turnover exit rate was +18%
Six-month rolling turnover growth rates
Regulatory risks are increasing the importance of scale
• NT ‘click to call’ ban temporarily on hold• New government’s position on ‘click to call’ and
credit betting to be confirmed• SA POCT July 2017• Greyhound ban: New South Wales and ACT

14
US income statement
H1 2016$m
H1 2015$m
% change
Amounts wagered 465.0 355.5 +31%
Gross win 26.5 24.3 +9%- Gross win margin 5.7% 6.8% -1.1 ppts
Net revenue 26.5 24.3 +9%
Cost of sales (2.3) (2.0) +15%
Gross profit 24.2 22.3 +9%
Operating costs (15.0) (15.8) -5%
Operating profit $m 9.2 6.5 +42%
Operating profit £m 6.4 4.3 +49%
• Continued strong growth in wagering
• Gross win margin affected by weaker baseball results
• First to launch Virtual Racing• Working on next generation kiosk, leveraging SSBT
development

15
William Hill today
• Trusted brand, The Home of Betting• International resonance
Iconic brand
• Highly cash generative• Complementary to Online
Retail resilience
• Large-scale UK business• High-quality revenues• Improved mobile offering• Underpinned by bespoke / proprietary technology
Online leadership
• Top three operator in Australia, Italy, Spain• Optionality from leading US position
International growth
• Modernising Retail’s operating model• Other potential efficiencies across the Group
Opportunity for ‘self-help’

16
Our focus areas
1. Maintain the pace of Online’s turnaround2. Deliver our technology roadmap3. Drive increased efficiencies across the Group4. Refocus the international growth and expansion

17
1. Online UX and product – H1 delivery
Increased velocity 7 app releases115 sports releases19 account releases
‘Close the gap’ Faster app load timesPartial Cash InFastest live score push notificationsRedesigned betslipMarket templates, stronger acca journeys
Differentiating features
Search functionality on the bottom menuWatch-and-bet with William Hill Betting TVNew football scoreboardsEnhanced betsPush bet suggestion on in-play event pagesIn-app messagingCash In 90-minute availability
International Four language sitesFour translated iOS Sportsbook appsLaunch in German App Store

18
1. Online UX and product: Q2 Sportsbook redesign
After: EURO 2016
redesign
Before: Oct 2015

19
1. Online UX and product – next priorities
• Landing pages• Registration conversion• Deposit conversion• Password reset• Speed• Navigation
• Enhanced content release schedule• Lobby redesign• Cross-sell journey• Single wallet
• Additional streaming• Partial Cash In on other sports
Further Sportsbook enhancements
Focus on gaming
Focus on keycustomer experiences

20
1. Online: digital marketing
Operating efficiencies improved• Strong progress on account management• Loss-leading campaigns removed, refocusing affiliates• Reducing bonus abuse and improving margin
– Sportsbook FVAs halved from 1.3% of turnover in Q1 to 0.8% in Q2
• New data platform being implemented
What’s next?• Automate more account management processes in H2• Further FVA optimisation – gaming and sports• Optimise PPC spend• Change the marketing mix, e.g., programmatic
marketing• Focus on ‘retrial’ in early stages of the football season

21
2. Deliver our technology roadmap
• Three-year plan to develop ‘OpenBet 2’ back-end platform
• ‘One platform’ approach for the Group • Supports international expansion• 6% ‘implied’ coupon on NYX convertible
and potential upside
Developing the best UX in the market
Delivering our new, flexible platform
• Expertise used by many major operators• Team of 200 developers / UX experts,
‘backfilling’ existing resource gaps• Leverages Trafalgar platform• Initial priorities
– Catch up on product pipeline– ‘OpenBet 2’ project– Desktop refresh– One-minute markets UX– Omni-wallet
Ten-year commercial agreement with OpenBet and c£90m NYX investment to support acquisition
£13.6m Grand Parade acquisition

22
3. Drive increased efficiencies across the Group
Modernising Retail’s operating model• First major organisational change in a decade• Increasing focus on the customers• Bringing management support closer to shop teams• c£12m exceptional cost• Consultation process underway,
implementation planned for 1 Jan 17• Staff cost increases remain within
manageable levels for the medium term
Other opportunities• Identify ‘self-help’ measures to improve
efficiency and drive cost savings, e.g., optimise back office functions
Staff
PropertyContent
Finance charges
IT hosting and comms
Other
c£250m cost base1
1. Excludes marketing, depreciation, Retail shop costs, Australia and US costs

23
4. Refocus the international growth and expansion
Diversify sources of revenue internationally• Reduce reliance on UK• Reduce impact of fiscal, regulatory and economic
changes
Optimising current international businesses• Ensure appropriate focus and resources• Right product, marketing, management team• Optimise returns, e.g., localisation
New market opportunities• Risk-based approach to evaluating markets• Regulated and less developed markets• Maintain capital discipline• Flexible approach: technology platforms, organic growth,
bolt-on acquisitions
UK, 84%
Australia, 6%
Italy and Spain, 4%
US, 2% RoW, 4%

24
Summary
• Four profitable divisions with strong fundamentals• Significant amount of work delivered in H1• Robust balance sheet and strong cash generation• Clear priorities in place• Motivated team determined to be market-leading again

25
Q&APhilip Bowcock | Interim CEOCrispin Nieboer | MD, OnlineNicola Frampton | Director, UK Retail

26
Appendices

27
Cash flow and net debt
Capex 2016 £m 2015 £m
Online 19.4 16.5Retail 5.7 5.3Australia 8.1 2.5US 0.6 0.2IT / other 9.8 3.0Total capex 43.6 27.5
1. For covenant purposes
Cash Restricted cash
Debt Net debt (1)
£m £m £m £m
Opening Position at 29 December 2015 282.1 (95.3) (675.0) (488.2)
Profit before interest and tax 122.0 122.0Depreciation & Amortisation 41.4 41.4Share remuneration 3.1 3.1Pension contribution (4.9) (4.9)Interest & Tax (23.1) (23.1)Working Capital 25.5 25.5FV movements on derivatives 5.0 5.0Ante post liabilties (1.5) (1.5)Other (1.2) (1.2)
Net cash generated from operations 166.3 166.3
Purchase of own shares (60.2) (60.2)Issue of £350m Guaranteed notes due 2023 350.0 (350.0) 0.0Investments (90.7) (90.7)Capital expenditure (43.6) (43.6)Dividends paid (73.4) (73.4)Foreign exchange 4.3 4.3Other 1.1 (1.8) (0.7)
Closing Position at 28 June 2016 535.9 (97.1) (1,025.0) (586.2)

28
Glossary
Adjusted results Adjusted results means results before exceptional items and adjustments, as described in note 3 to the half-year statement.
Amortisation Where operating expenses, operating profit or EPS are adjusted for amortisation, this pertains to amortisation of intangiblesrecognised on acquisition.
Amounts wagered In this presentation, this represents the gross takings in Retail OTC, Telephone, US, Australia and Online Sportsbook.
ARPU Average net revenue per user.
Basic, adjusted EPS This is based upon adjusted profit for the period.
Cost per acquisition (CPA) Marketing costs (including affiliates but excluding FVAs) divided by the number of new accounts recorded in the period.
EBITDA Earnings before interest, tax, depreciation and amortisation. EBITDA for covenant purposes is adjusted earnings before depreciation and amortisation, and share remuneration charges.
FVAs Fair value adjustments. These are principally free bets, which are recorded as a cost between gross win and net revenue.
Gross win and net revenue Gross win is calculated as the total amount that the Group retains from customers’ stakes after paying out any winnings. Net revenue is the primary measure for all divisions. This is gross win less fair-value adjustments for free bets, promotions and bonuses, which are used extensively in digital operations but less so in Retail.
Gross win margin / net revenue margin
This is a measure, inter alia, of the effect of sporting results on the business. The margin is defined as gross win/net revenueas a percentage of amounts wagered. The margin is also affected by the mix of products with different margins and the amount of concessions or free bets offered to customers.
Operating profit Adjusted profit before interest and tax.
OTC Retail over-the-counter, which includes self-service betting terminals, largely constitutes bets placed on sporting events, virtual events and lottery-style numbers games.
Net debt for covenant purposes Borrowings plus counter-indemnity obligations under bank guarantees less cash adjusted for customer funds and other restricted balances. For further explanation, refer to p125 of the 2015 Annual Report and Accounts.
New accounts Customers who registered and deposited within the reporting period.
PBIT Profit before interest and tax.
Unique active players Customers who placed a bet within the reporting period.