2016 ehs annual report - fpc usa - formosa plastics · api 754 standard. a tier 1 pse is an...
TRANSCRIPT
2016 EHS Annual
Report
Quality, Value and Performance
Corporate EHS Policy
The company is committed to the protection of our environment, the safety and health of our employees and the community.
This is accomplished through the use of clear and well-documented systems and procedures, proper training and qualification, high performance expectations, continual improvement in pollution
prevention, minimization and recycling, as well as workplace hazard analysis and prevention.
Through the joint efforts of every employee, we shall maintain full compliance with all applicable environmental and safety laws and
regulations, conserve natural resources, reduce wastes and keep our environment clean and our workplace free of health and safety
hazards, for ourselves, for the community and for future generations.

Message from the Executive Vice President..................................................2
Our Sustainable Development Principles Introduction................................................................................................3 Production and Operations..........................................................................6 Safety Performance
Personnel Safety Performance...............................................................8 Process Safety Performance...................................................................8 Environmental Performance
Maintaining Compliance.....................................................................12 Citations and Penalties Paid.................................................................12 Resource Management........................................................................13 Air Emissions.......................................................................................14 Social Performance
Employee Turnover..............................................................................16 Corporate Contributions ..................................................................... 16 Corporate Citizenship.........................................................................17
Economic Performance .............................................................................20
Carbon Footprint Performance..................................................................20
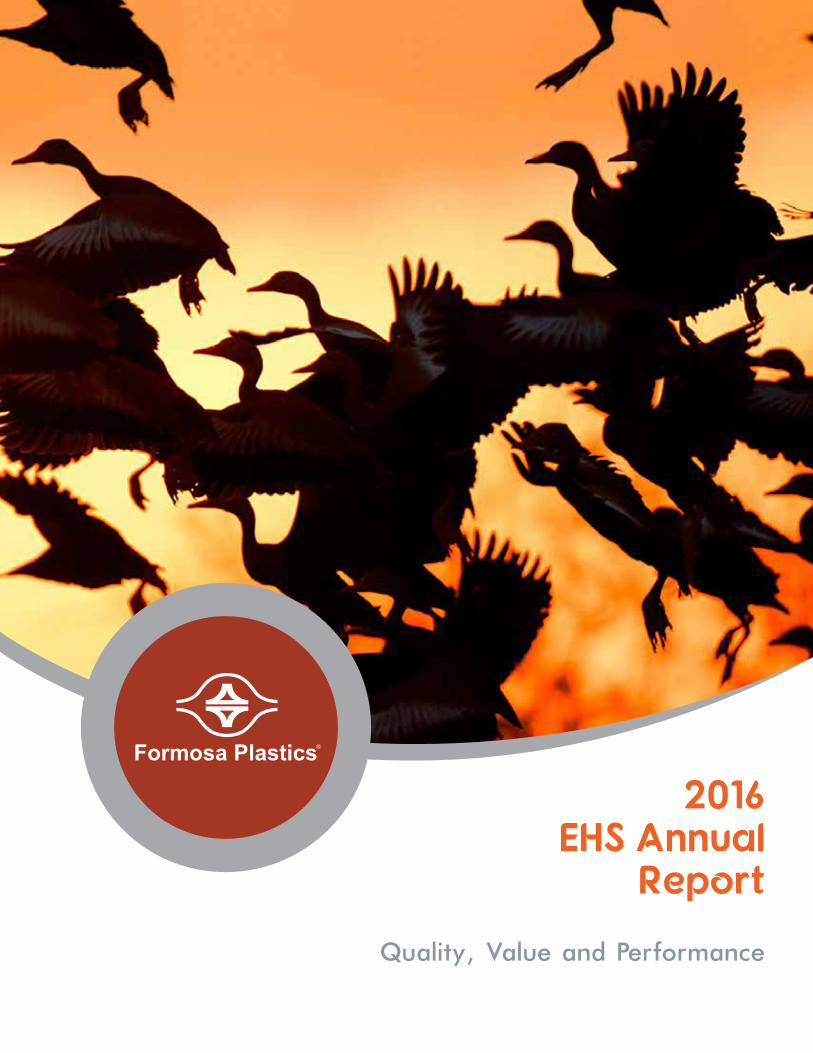
About the cover photo:
Title: Whistling Ducks at Sunset Canon 7D Mark II
500 mm lens F/4 1/2500 sec
Photo credit: Dean Johnstone
Table of Contents
Copyright © 2017; Formosa Plastics Corporation, U.S.A.

2016 Environment, Health and Safety Annual Report 1
“Our main focus is on excellence in operations and maintaining our financial discipline, while seeking new opportunities to create value for customers and contributing to society.”
Our efforts are guided by our sustainable development principles: • Embrace continual improvement in all aspects of our work.
• Respect and comply with all environmental and safety laws and regulations.
• Instill the concept of safety and health in all our activities.
• Conserve resources, prevent pollution, protect and enhance the environment wherever possible.
• Be a force of positive change in communities where we work and do business.
• Promote an engaging workplace for diverse and talented people who want to make a difference.
• Establish a connection between financial success and contributing to society.
• Learn from our experiences, listen to the ideas of others, and regularly report our progress to the public.
Message from the Executive Vice President
I am pleased to report that Formosa made excellent
progress toward our business objectives in 2016.
Revenue and earnings were strong and profitability at
record levels. Operating rates were among the best in
the industry and the company remains well positioned
to continue to grow. Formosa’s expansion projects
are laying the foundation for the company to become
a major global supplier in the Olefins, Polyolefins and
Vinyl markets.
Our commitment is to deliver sustainable, long-term
value to our customers, communities and employees
by focusing on three key elements: operational
excellence, financial strength and customer focus.
The rate of change in our business is increasing.
Formosa is able to keep pace with that change with
the help of our dedicated employees. I am grateful for
their amazing efforts and contributions to build this
company into a global leader.
Sincerely,
Mr. Walter Chen Executive Vice President, Formosa Plastics Corporation, U.S.A.
2016 Environment, Health and Safety Annual Report 2

Introduction from the Environment, Safety and Communications Division Head.
.
Each year offers opportunities to challenge our people
and our processes. In 2016, Formosa’s employees rose
to the challenge and for the third straight year pushed
our injury rate lower. Our largest facility, Formosa Plastics
Corporation, Texas, achieved a near record 0.43 recordable
injury rate, while the overall FPC USA injury rate improved
to 0.72. While these numbers are well below the chemical
industry average, we know there is always room to
improve.
Eliminating injuries relies on personal accountability,
planning, training and precise execution of assignments.
These are our strengths as a business, and that strength
must be applied to our safety program.
Our success also extended to our environmental
performance, where Formosa reduced the number of
reportable releases for the second straight year and
wastewater permit violations are at a record low. This
performance is all the more remarkable given that during
the same period of time, Formosa completed an extensive
turnaround schedule while also advancing aggressively
on future expansion projects.
To all our employees, thank you and congratulations on a
notable achievement.
I would also like to take this opportunity as we reflect on
the year-end performance to recognize the department
and unit managers, employees, contractors and the
EHS Health and Safety professional for their efforts
to work toward our safety goal. While the number of
injuries is significantly lower, nobody should accept an
injury as inevitable, or “part of doing business”. With
the performance improvements achieved in the last
three years, we can begin to visualize an accident-free
workplace.
I trust you will find this year’s report informative, it has also
been redesigned to highlight major areas of concern and
to be more readable. It is our goal to create a report that
presents concise information with sufficient context to
allow comparisons to our peer companies in the chemical
industry and beyond. Transparency and openness
regarding our operations is essential to maintaining a
dialogue with the public and the communities in which
we operate.
John Pastuck Division Head, Environment, Safety and Communications
2016 Environment, Health and Safety Annual Report 3

2016 Environment, Health and Safety Annual Report 4
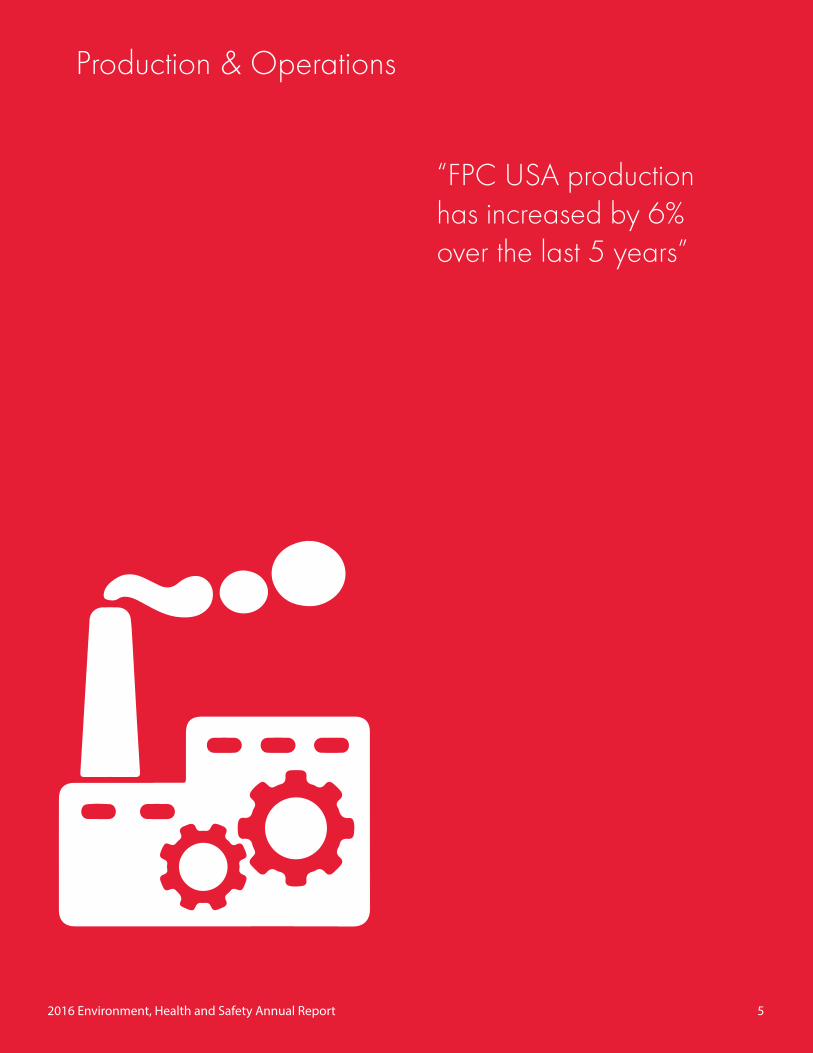
Production & Operations
“FPC USA production has increased by 6% over the last 5 years”
2016 Environment, Health and Safety Annual Report 5
TerminologyFormosa Plastics Corp., U.S.A.
Formosa Plastics Corp., Texas
Formosa Plastics Corp., Louisiana
Formosa Plastics Corp., Delaware
Formosa Hydrocarbons Co., Inc.
Circulating Fluidized Bed Energy Unit
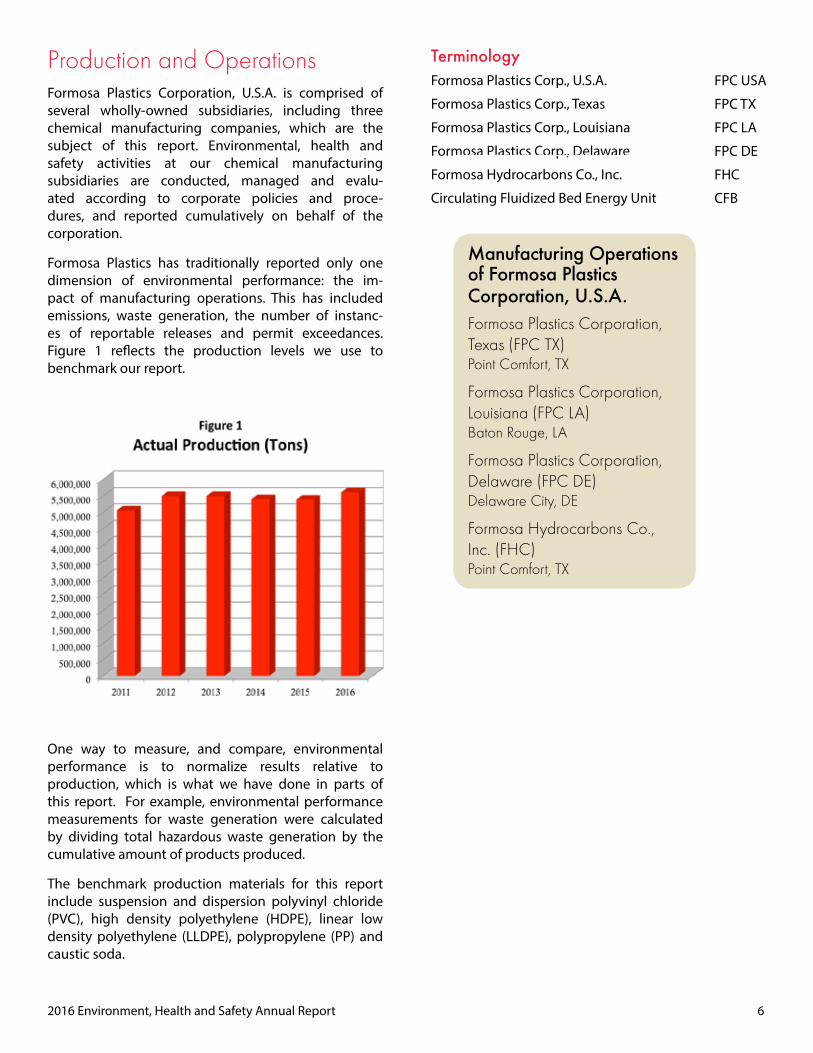
Production and OperationsFormosa Plastics Corporation, U.S.A. is comprised of several wholly-owned subsidiaries, including three chemical manufacturing companies, which are the subject of this report. Environmental, health and safety activities at our chemical manufacturing subsidiaries are conducted, managed and evalu-ated according to corporate policies and proce-dures, and reported cumulatively on behalf of the corporation.
Formosa Plastics has traditionally reported only one dimension of environmental performance: the im-pact of manufacturing operations. This has included emissions, waste generation, the number of instanc-es of reportable releases and permit exceedances. Figure 1 reflects the production levels we use to benchmark our report.
One way to measure, and compare, environmental performance is to normalize results relative to production, which is what we have done in parts of this report. For example, environmental performance measurements for waste generation were calculated by dividing total hazardous waste generation by the cumulative amount of products produced.
The benchmark production materials for this report include suspension and dispersion polyvinyl chloride (PVC), high density polyethylene (HDPE), linear low density polyethylene (LLDPE), polypropylene (PP) and caustic soda.
Manufacturing Operations of Formosa Plastics Corporation, U.S.A.Formosa Plastics Corporation, Texas (FPC TX) Point Comfort, TX
Formosa Plastics Corporation, Louisiana (FPC LA) Baton Rouge, LA
Formosa Plastics Corporation, Delaware (FPC DE) Delaware City, DE
Formosa Hydrocarbons Co., Inc. (FHC) Point Comfort, TX
2016 Environment, Health and Safety Annual Report 6
FPC USA
FPC TX
FPC LA
FPC DE
FHC
CFB

Safety Performance
“In the last three years, the FPC USA injury rate has decreased by 42%.”
2016 Environment, Health and Safety Annual Report 7

Safety PerformancePersonnel Safety PerformanceOur Recordable Injury Rate (RIR) in 2016 decreased from 2015. As shown in Figure 2, our RIR was 0.72 injuries per 200,000 hours worked across the corporation. In comparison, the BLS Plastics Materials average for 2015 was 1.7 and the ACC Responsible Care average was 0.76.
The Lost Work Day Case Rate across the corp- oration held steady at about 0.47. See Figure 3.
Process Safety PerformanceFormosa Plastics, along with industry partners at the American Fuel & Petrochemical Manufacturers (AFPM), has modified annual safety data reporting programs to align with the ANSI Standard - API 754 “Process Safety Performance Indicators for the Refining and Petrochemical Industries.” Companies benchmark using AFPM Tier 1 Process Safety Event (PSE) and/or a Tier 2 PSE.
Figures 4 and 5 represent our performance under the new API 754 standard.
A Tier 1 PSE is an unplanned or uncontrolled release of any material, including non-toxic and non-flammable materials (e.g. steam, hot condensate, nitrogen, compressed CO2 or air) from a process that results in one or more of the following consequences:
• an employee, contractor or subcontractor “days away from work” injury and/or fatality;
• a hospital admission and/or fatality of a third-party;
• an officially declared community evacuation or third-party; community shelter-in-place;
• a fire or explosion resulting in $25,000 or more direct cost to the company;
Comparison of Injury Rates - 2016
Formosa Plastics 0.72
American Chemistry Council 0.76Responsible Care Companies Average (2015) – most recent data
U.S. Labor Statistics Avg. 1.7NAICS 325211 Plastics Material(2015) – most recent data
2016 Environment, Health and Safety Annual Report 8

• a pressure relief device (PRD) discharge to atmosphere, whether directly or via a down-
stream destructive device, with a discharge quantity greater than a threshold quantity listed in the standard in any one hour period that results in one or more of the following four consequences: liquid carryover, discharge to a potentially unsafe location, an on-site shelter-in-place location or public protective measures (e.g., road closure).
The number of process safety events is divided by total man-hours in a year to generate a rate, much like a recordable injury rate reported to OSHA. Each event is also scored for “severity” using a point system between 1 - 108 points, with 1 point being a relatively low risk -
2016 Environment, Health and Safety Annual Report 9
low severity event and 108 points being a very severe event with substantial impacts to employee health, off-site consequences and national media attention.
24 companies, representing 121 petrochemical facilities, participated in the Tier 1 PSE Survey.
• 16 of these companies, representing 40 facilities, submitted at least one Tier 1 PSE.
• 81 petrochemical facilities reported zero Tier 1 events during 2014.
• AFPM reported a Tier 1 PSE rate of 0.093 per 200,000 workforce hours during 2015, meaning there was one recordable PSE for approximately - every 2.35 million workforce hours.

2016 Environment, Health and Safety Annual Report 10

2015 Environment, Health and Safety Annual Report 7
Environmental Performance
“Since our 1995 base-line we have reduced and achieved a long-term goal of 95% reduction in hazardous waste generation.”
2016 Environment, Health and Safety Annual Report 11

Environmental PerformanceMaintaining Compliance
During 2016, FPC USA reported few releases and experienced only one permit nonconformance. As Figure 6 indicates, Formosa continues to manage permit compliance successfully. Over the past ten years, permit nonconformance events have declined by approximately 90 percent. The nonconformance data shown in the figure are mainly related to state authorized wastewater dis- charge permits. This figure does not typically include individual air permit excursions, self-reported to state agencies under the Federal Air Permit program (Title V). Air permit deviations, for example, are more often related to missing data and downtime for air pollution control instruments with little or no impact on the environment. The purpose of the chart is to track permit nonconformance incidents (NCRs) that involve an actual impact on the environment.
Federal regulations require certain facilities to report information to the National Response Center (NRC) immediately after an accidental releasethat is greater than a certain threshold quantity. Inthe event that an accidental release occurs at one of our facilities, immediate action is taken to notify the NRC, as well as state agencies, and an investigation is promptly launched. The investigation team identifies the fundamental cause of the release, determines whether the incident demon- strates a trend and recommends corrective actions to prevent the release from recurring. Release events that do not reach the reportable quantity (RQ) threshold are also investigated as near miss incidents.
As Figure 7 shows, Formosa has made steady progress in achieving a low number of events.
Citations and Penalties Paid
Notices of Violation (NOVs), or citations, are official doc-uments received from state or federal regulatory agen-cies regarding air, water or waste regulations. A citation or NOV typically describes an allegation of non-compli-ance with an environmental or safety regulation.
Notices of violation, citations, warning letters, consent orders and enforcement notices are tracked by FPC USA‘s Corporate Environment, Safety and Communica-tions Division and reported through our Environmen-tal Management System (EMS) to ensure that senior management addresses every item in a timely and effective manner. Figure 8 shows the number of NOVs we received from 2011-2016.
2016 Environment, Health and Safety Annual Report 12

Figure 9 presents the penalties paid during the same period. In 2016, Formosa Texas and Formosa Delaware settled claims with the TCEQ, DNREC and OSHA. Please note that this figure identifies the penalties in the year they are actually paid, not the year in which the violation occurred or the citation was received.
Resource Management
Hazardous waste generation as a function of produc-tion remained near the all-time low, as shown in Figure 10. This reduction was achieved mainly by a continued effort to reclassify materials and a focused program to reuse resources. More importantly, the company has met its long-term goal of a 95% reduction in hazardous waste generation from our 1995 baseline level.
Future efforts will focus on the remaining waste streams at our operations and new methods to reduce, reuse or recycle materials. In 2007, Formosa completed the installation and start-up of a multi- million dollar project to utilize the Catoxid® tech-nology, a proprietary reuse technology for a major process by-product. The use of this new process enhances resource recovery and eliminates emissions associated with transporting the material.
For the past several decades, energy supply and de-mand have been at the center of many major environ-mental and sustainability debates. While Formosa is a major producer of energy, we are committed to de-mand-side management. Better energy management reduces the cost of our products, as well as the energy demand of our production processes. Formosa’s opera-tions employ modern combined-cycle co-generation plants that produce some of the lowest cost, lowest emission electricity in the region. See Figure 11.
As shown in Figure 12, our operations continue to assess and implement new methods to reduce water use even as we increase production, equipment and employees.
2016 Environment, Health and Safety Annual Report 13

Air Emissions
Federal regulations require that manufacturers who use threshold quantities of listed chemicals report a variety of information to local communities and to state and fed-eral governments. One of the most substantive means to report this information is through the annual Toxic Release Inventory (TRI).
As shown in the table above1, our total TRI air emissions decreased slightly, due to a variety of factors. Emission data are subject to year-to-year variability, caused by factors such as production rates (higher or lower emis-sions), unit shutdowns (lower emissions) and start-ups (one-time, higher emission events).
Overall, our TRI air emissions were within this expected variability, with some increasing and some decreasing. Vinyl emissions (Figure 13) continued an essentially even trend. EDC emissions (Figure 14) remained at their historical levels following a one-time emission event.
Benzene emissions (Figure 15) continue to decrease, due to our improved leak detection and repair program, as well as fewer process upsets.
Chloroform emissions (Figure 16) jumped unexpect- edly in 2012, primarily the result of a one-time emis-sion event. Otherwise, chloroform emissions also continue to decrease due to improved operational procedures and controls.
1 The TRI data is typically not available for each year’s report until about the middle of the following year. To accommodate this delay, we typically publish two editions of our EHS Annual Report. The first edi- tion is published during the first half of each year to report on the information available at that time, including data on our environmental and safety performance and carbon fooprint. It’s reissued later in the the year to include the previous year’s TRI emission data.
2016 Environment, Health and Safety Annual Report 14
Total TRI Air Emissions, Pounds
FPC TX FPC LA FPC DE FPC USA
2016
861,044
189,743
104,372
1,155,159
2014
969,006
159,405
65,942
1,194,353
2015
978,674
195,439
78,226
1,252,339

Social Performance
“Formosa values its employees, turnover is
less than 50% compared to the industry average”
2016 Environment, Health and Safety Annual Report 15

Social PerformanceEmployee Turnover Formosa Plastics offers competitive salaries and ben-efits that meet the changing needs of our employees.
Our annual employee turnover remains low, at about 2.4%, as shown in Figure 17. In comparison, the average for all manufacturing (durable goods) was over 10.7%. This demonstrates our success at motivating and retain-ing a highly skilled, experienced workforce.
Factors contributing to this success include:
• Formosa incurs the full cost of health, dental, life and long-term disability insurance premiums for each eligible employee and dependents.
• Company sponsored training is available to all employees. For example, the new training center in Texas will help employees stay abreast of changing technologies and assist in the development of new operators and technicians for our production facilities.
• Formosa offers a range of work/life benefits, such as flextime and a Life Assistance Program.
Corporate ContributionsIn 2016, as in past years, our corporate contributions focused on supporting key programs and services that improve the lives, health and education of people who live in the communities in which we operate. Figure 18 presents our results through 2016.
The sharp rise in 2012 reflects contributions in response to Superstorm Sandy emergency relief donations and efforts.
In addition, we increased the annual stipend award to those students who receive a National Merit® Formosa Plastics Corporation, U.S.A. Scholarship.
2016 Environment, Health and Safety Annual Report 16

• Supported the Baton Rouge Community College Process Technology program via service on its Advisory Board, classroom instruction and scholarships.
• Served on the Student Advisory Board at Southern University.
Point Comfort, Texas• Sponsored a sporting event that raised $150,000 for The United Way of Calhoun and Victoria Counties (see photo).
• Partnered with Calhoun County and Victoria County school districts for field trips to the plant to encourage students to stay in school and consider a career in industry.
• Provided funding to the Calhoun County Independant School District to conduct environ- mental education classes at the Formosa Tejano Wetlands Outdoor Classroom.
• Held four blood drives that yielded 242 units of blood.
In 2015, the site established a monarch butterfly migratory “way-station”, propagation habitat and milk- weed research/distribution program. We raised over 200 mature plants that attracted an excellent mon-arch butterfly population; new caterpillars were on the plants within about a week of planting. Oth-er plots contain native Spider Milkweed, which is being used to produce seeds that will be donatedwithin the community.
Livingston, New Jersey• Continued our National Merit® Formosa Scholar- ships Program, providing renewable annual stipends for up to four years of full-time under-graduate study.
• Held its Annual Food Drive, resulting in donations of nearly 39, 804 lbs. of food and 470 turkeys to the Community Foodbank of New Jersey.
Formosa Plastics’ late founder, Y.C. Wang, established five foundation trusts to fund community programs in the Point Comfort, Texas area:
1. Formosa Environmental Trust;2. Calhoun County ISD Scholarship Trust;3. Formosa Religious Trust;4. Memorial Hospital Equipment Trust; and5. Edna School Trust.
Each year these trusts provide about $200,000 in grants to schools and community organizations in Calhoun and Jackson Counties.
Corporate Citizenship
Formosa Plastics is proud to be a member of the com-munities in which we operate and is committed to mak-ing substantive contributions in each of them.
Over the past thirty-seven years, we’ve worked with local organizations to improve education, health, civic growth, spiritual development and environmental protection. Donations of time and money are only the beginning.For example, we initiated a 3-year program of supporting educational opportunities to encourage students to pursue engineering degrees and occupational trade craft certifications. Efforts support engineering schools at Louisiana State University, Lehigh University, Texas A&M and Manhattan College.
Delaware City, Delaware• Silver Level sponsor of the 10th Annual Hazardous Materials Training Workshop. This training workshop provides valuable annual training to the State’s First Responders.
• Supported local fire and police departments, Lions Club and Mayor’s Ball.
Baton Rouge, Louisiana• Sponsored Our Lady of the Lake Children’s Hospital Foundation and The United Way through company and employee donations.
“FPC USA employees are generous–donating more than $500,000
to charities over the last 3 years.”
2016 Environment, Health and Safety Annual Report 17

2016 Environment, Health and Safety Annual Report 18

Economic Performance & Carbon Footprint Performance
“We continue to invest in our plants and equipment, ensuring that Formosa has some of the most technolog-ically advanced production capacity in the industry”
2016 Environment, Health and Safety Annual Report 19

Carbon Footprint Performance
Figure 20 presents our carbon dioxide equi- valent emissions, or carbon footprint, from 2011 through 2016, as reported to the U.S. EPA.2
From 2010 through 2012, our carbon footprint shrank about 30%, despite increased production. In 2013, however, the substantial reductions achieved by the Point Comfort site’s Marine Traffic operations were more than offset by emissions from the startup of a new utility and production areas at the site.
In 2014 and 2015 we again had many major plant maintenance startups, an on-going source of additional, atypical process emissions. These main-tenance efforts have been completed, so we began a return to more normal carbon emission patterns in 2016. The completion of modifications to the second CFB power/steam generation unit to operate on natural gas aided this progress.
New plants are expected to startup and begin operations in the 2018-2020 timeframe, which may again increase these emissions.
Our Future OpportunityOur future opportunity is how to achieve sufficient energy efficiencies to offset carbon emissions from production unit start-ups and expansions that will come online in the near future.
June 2016
Economic Performance
In 2016 we had revenues of over $4 billion, on slightly lower volume and improved profitability. Our employee count increased modestly. See Figure 19.
We again demonstrated the strength of our business strategy. You can expect that in the futrure we will follow the same principles that have guided our success thus far.
For example, we continue to invest in our plants and equipment, ensuring that Formosa has some of the most technologically advanced production capacity in the industry. This includes completing construction and startup of the new Olefins III, LDPE and PE units in Texas. A new state-of-the-art medical facility will provide on-site employee wellness and urgent care services. (See photo below).
As we move forward, a key success factor of our com-pany strategy is making sure that we are positioned in the right markets to deliver growth. Part of this involves our continued exports to South America, Europe and other regions.
We will stay focused on excellence in operations and maintain our financial discipline while seeking new opportunities to create value for customers and contributing to society.
2 Please note that GHG emissions are reported to the U.S. EPA as absolute Carbon Dioxide Equivalent (CO2e) units, rather than absolute, or normalized, Carbon Equivalent (CE) units.
New Health and Wellness Center at our Point Comfort, TX site.
2016 Environment, Health and Safety Annual Report 20
9 Peach Tree Hill Road, Livingston, NJ 07039 • www.fpcusa.com
©2017 Formosa Plastics Corporation, U.S.A.
The information and recommendations in this publication are, to the best of our knowledge, reliable. Suggestions concerning uses or applications are only the opinion of FORMOSA PLASTICS CORPORATION, U.S.A. and users should perform their own tests to determine the suitability of these products for their own particular purposes. However, because of numerous factors affecting results, FORMOSA PLASTICS CORPORATION, U.S.A. MAKES NO WARRANTY OF ANY KIND, EXPRESS OR IMPLIED, INCLUDING THOSE OF MANUFACTURING AND FITNESS FOR PURPOSE, other than that the material conforms to the applicable current Standard Specifications Statements herein, therefore, should not be construed as representations or warranties. The responsibility of FORMOSA PLASTICS CORPORATION, U.S.A. for claims arising out of breach of warranty, negligence, strict liability, or otherwise is limited to the purchase price of the material. Statements concerning the use of the products or formulations described herein are not to be construed as recommending the infringement of any patent and no liability for infringement arising out of any such use is assumed.