2016 edelman trust barometer - energy results
TRANSCRIPT

Global Report + Energy Sector
2016 Edelman Trust Barometer

Informed Public
‣ 8 years in 20+ markets
‣ Represents 15% of total global population
‣ 500 respondents in U.S. and China; 200 in all other countries
Must meet 4 criteria:
‣ Ages 25-64
‣ College educated
‣ In top 25% of household income per age group in each country
‣ Report significant media consumption and engagement in business news
General Online Population
‣ 5 years in 25+ markets
‣ Ages 18+
‣ 1,150 respondents per country
Methodology
28-country global data margin of error: General Population +/-0.6% (N=32,200), Informed Public +/- 1.2% (N=6,200), Mass Population +/- 0.6% (26,000). Country-
specific data margin of error: General Population +/- 2.9 ( N=1,150), Informed Public +/- 6.9% (N = min 200, varies by country), China and U.S. +/- 4.4% (N=500),
Mass Population +/- 3.0 to 3.6 (N =min 740, varies by country), half sample Global General Online Population +/- 0.8 (N=16,100).
‣ 16 years of data
‣ 33,000+ respondents total
‣ All fieldwork was conducted between October 13th and November 16th, 2015
Online Survey in 28 Countries
Mass Population
‣ All population not including Informed Public
‣ Represents 85% of total global population
2
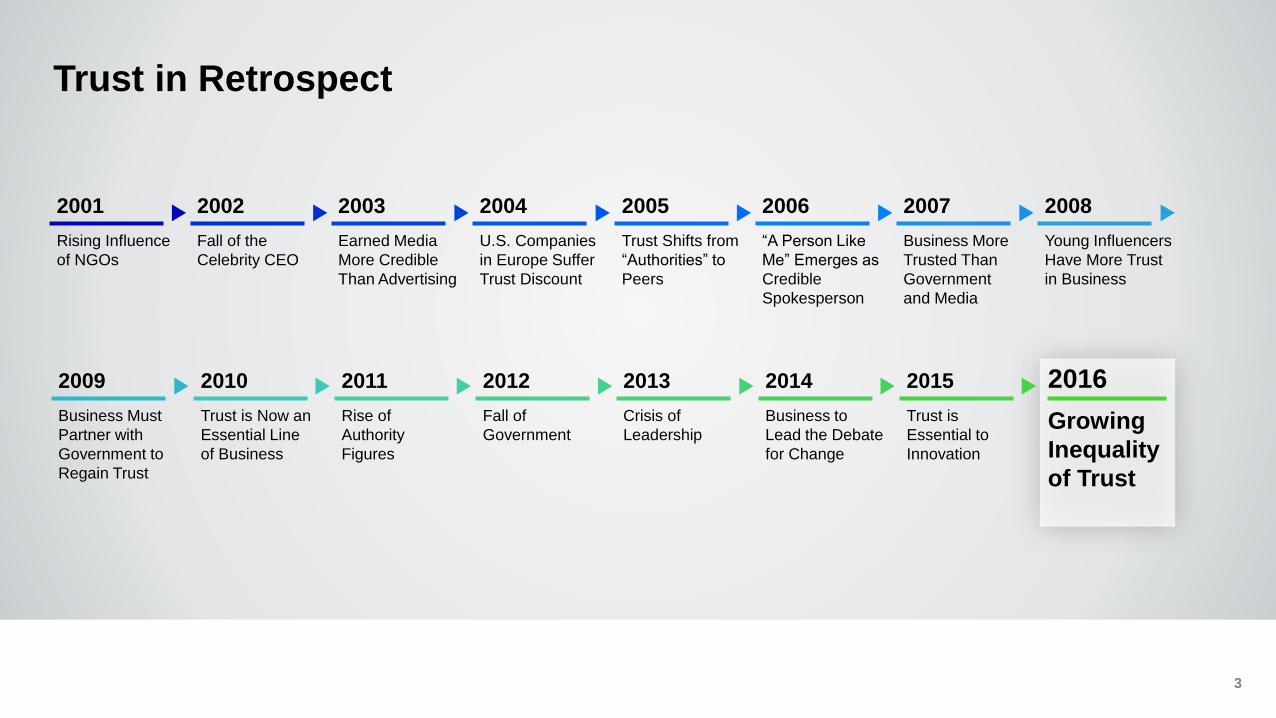
Trust in Retrospect
3
Rising Influence
of NGOs
2001
Business Must
Partner with
Government to
Regain Trust
2009
Fall of the
Celebrity CEO
2002
Earned Media
More Credible
Than Advertising
2003
U.S. Companies
in Europe Suffer
Trust Discount
2004
Trust Shifts from
“Authorities” to
Peers
2005
“A Person Like
Me” Emerges as
Credible
Spokesperson
2006
Business More
Trusted Than
Government
and Media
2007
Young Influencers
Have More Trust
in Business
2008
Trust is Now an
Essential Line
of Business
2010
Rise of
Authority
Figures
2011
Fall of
Government
2012
Crisis of
Leadership
2013
Business to
Lead the Debate
for Change
2014
Trust is
Essential to
Innovation
2015
Growing
Inequality
of Trust
2016

48
42
26
35
20
12
Trust Matters
4
Percent who engage in each behavior based on trust
68
59
41
38
37
18
Behaviors for Distrusted Companies Behaviors for Trusted Companies
Refused to buy products/services
Criticized companies
Shared negative opinions
Disagreed with others
Paid more than wanted
Sold shares
Chose to buy products/services
Recommended them to a friend/colleague
Shared positive opinions online
Defended company
Paid more
Bought shares
General
Population
Source: 2016 Edelman Trust Barometer Q371-589. Thinking back over the past 12 months, have you taken any of the following actions in relation to companies that you trust? Please
answer yes or no to each action. General Population, 28-country global total, questions asked of half the sample. Q377-380. Still thinking about the past 12 months, have you taken any of
the following actions in relation to companies that you do not trust? Please answer yes or no to each action. General Population, 28-country global total, question asked of half the sample.
most trusted content creators: #1
Friends and Family
most trusted media source: #1
Online Search Engines

1 State of Trust

60
6465
63
66
50
5354
51
55
46
48
45
48
51
38
41
39
4243
2012 2013 2014 2015 2016
54
58 5856
62
47
5049 49
53
2012 2013 2014 2015 2016
Source: 2016 Edelman Trust Barometer Q11-14. Below is a list of institutions. For each one, please indicate how much you trust that institution to do what is right
using a nine-point scale, where one means that you “do not trust them at all” and nine means that you “trust them a great deal.” (Top 4 Box, Trust) Informed Public
and General Population, 25-country global total.
6
Percent trust in the four institutions of government, business, media and NGOs, 2012 vs. 2016
53
57
53
51
56
46
4948
46
49
NGOs
Government
Media
Business
Post-Recession Highs
Informed
Public
General
Population

2 Trust Inequality

53
58
56 56
60
44
47
46 46
48
2012 2013 2014 2015 2016
A Significant Divide
Source: 2016 Edelman Trust Barometer Q11-14. Below is a list of institutions. For each one, please indicate how much you trust that institution to do what is right
using a nine-point scale, where one means that you “do not trust them at all” and nine means that you “trust them a great deal.” (Top 4 Box, Trust) Informed Public
and Mass Population, 25-country global total.
GDP 5 = U.S., China, Japan, Germany, U.K. 8
Percent trust in the four institutions of
government, business, media and NGOs, 2012 to 2016Informed
Public
Mass
Population
12pt
Gap
9pt
Gap
in trust inequality--
which jumps to a
5-point increase
among the GDP5
3-point increase

A Global Phenomenon
Source: 2016 Edelman Trust Barometer. The Trust Index is an average of a country’s trust in the institutions of government, business, media and NGOs,
28-country global total.
9
Trust Index, Informed Public vs. Mass Population,
15 countries with double-digit trust gaps in 2016
Country
Informed
Public
Mass
Population Gap
U.S. 64 45 19
U.K. 57 40 17
France 55 39 16
India 78 62 16
Australia 63 47 16
Mexico 72 57 15
Italy 58 47 11
China 82 71 11
Brazil 58 48 10
Ireland 49 39 10
Netherlands 62 52 10
Sweden 46 36 10
S. Africa 54 44 10
S. Korea 50 40 10
Singapore 72 62 10

3 Inversion of Influence
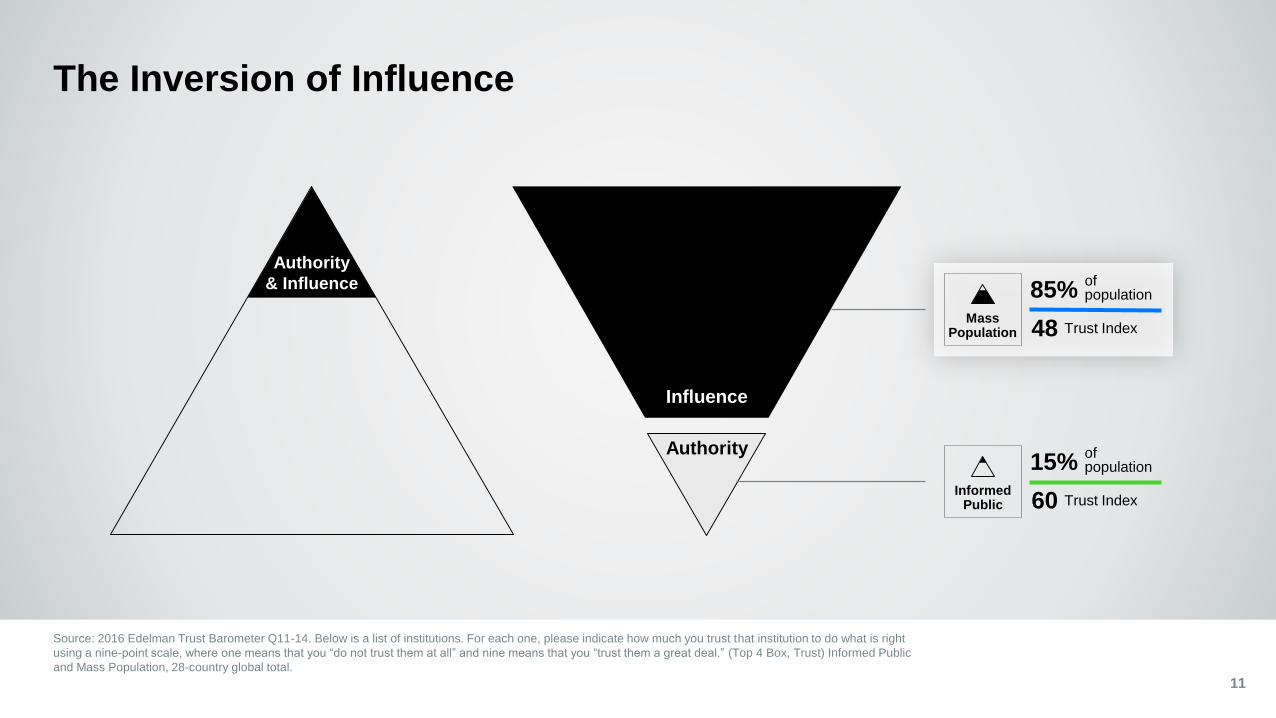
MassPopulation
The Inversion of Influence
11
Authority
& Influence
Influence
Authority
Source: 2016 Edelman Trust Barometer Q11-14. Below is a list of institutions. For each one, please indicate how much you trust that institution to do what is right
using a nine-point scale, where one means that you “do not trust them at all” and nine means that you “trust them a great deal.” (Top 4 Box, Trust) Informed Public
and Mass Population, 28-country global total.
85%of population
48 Trust Index
15%of population
60 Trust IndexInformed
Public

71
69
67
45
32
28
Search
TV
Social
Newspapers
Magazines
Blogs
Influence of Peer-Driven Media
Source: 2016 Edelman Trust Barometer - How often do you read, view, click on or engage with the following types of content, media or information sources? Online
search engines, such as Google… (Q285), Television news and information (Q287), Social networking sites, such as Facebook, LinkedIn, Instagram, Twitter,
etc.(Net of Q278 Social Networking, Q279 Blogs, Q289 Online message boards, forums or newsgroups), articles in printed newspapers (Q284), articles in printed
magazines(Q283), Blogs (Q279) (Several times a week+) General Population, 28-country global total, question asked of half the sample. 12
Percent who use each media source several times a week or more
2 of top 3 most-used
sources of news and
information are peer-
influenced media
General
Population

6364
57
5048
41
50
39
33
67
6463
5352
4948
44
35
Peers Rise to Level of Experts
Employees More Credible than Leaders
Source: 2016 Edelman. Trust Barometer Q130-587. Below is a list of people. In general, when forming an opinion of a company, if you heard information about a
company from each person, how credible would the information be—extremely credible, very credible, somewhat credible, or not credible at all? (Top 2 Box,
Very/Extremely Credible) General Population, 27-country global total.
13
Percent who rate each spokesperson as extremely/very credible2015 2016
+8
Technical
expert
Academic
expert
A person
like
yourself
Financial
industry
analyst
Employee CEO NGO
representative
Board of
DirectorsGovernment
official/regulator
CEO credibility
increased the most
General
Population
+6

4 An Opportunity for Business

6357
5148
6763
5751
6369
62
47
5148
4541
5553
48
42
5561
56
41
NGOs Business Media Government
Business Most Trusted to Keep Pace
15
Percent trust, 2015 and 2016, and percent who trust each
institution to keep up with the changing times, 2016
Informed
Public
General
Population
Trust
2016
Trusted to
keep pace
Source: 2016 Edelman Trust Barometer Q11-14. Below is a list of institutions. For each one, please indicate how much you trust that institution to do what is right
using a nine-point scale, where one means that you “do not trust them at all” and nine means that you “trust them a great deal.” (Top 4 Box, Trust), Informed Public
and General Population, 27-country global total. Q441-444 Below is a list of institutions. For each one, please indicate how much you trust that institution to keep
up with the changing times using a 9-point scale where one means that you “do not trust them at all to keep up with change” and nine means that you “trust them a
great deal to keep up with change”. (Top 4 Box, Trust) Informed Public and General Population, 28-country global total.
Business in the lead
Trust
2015
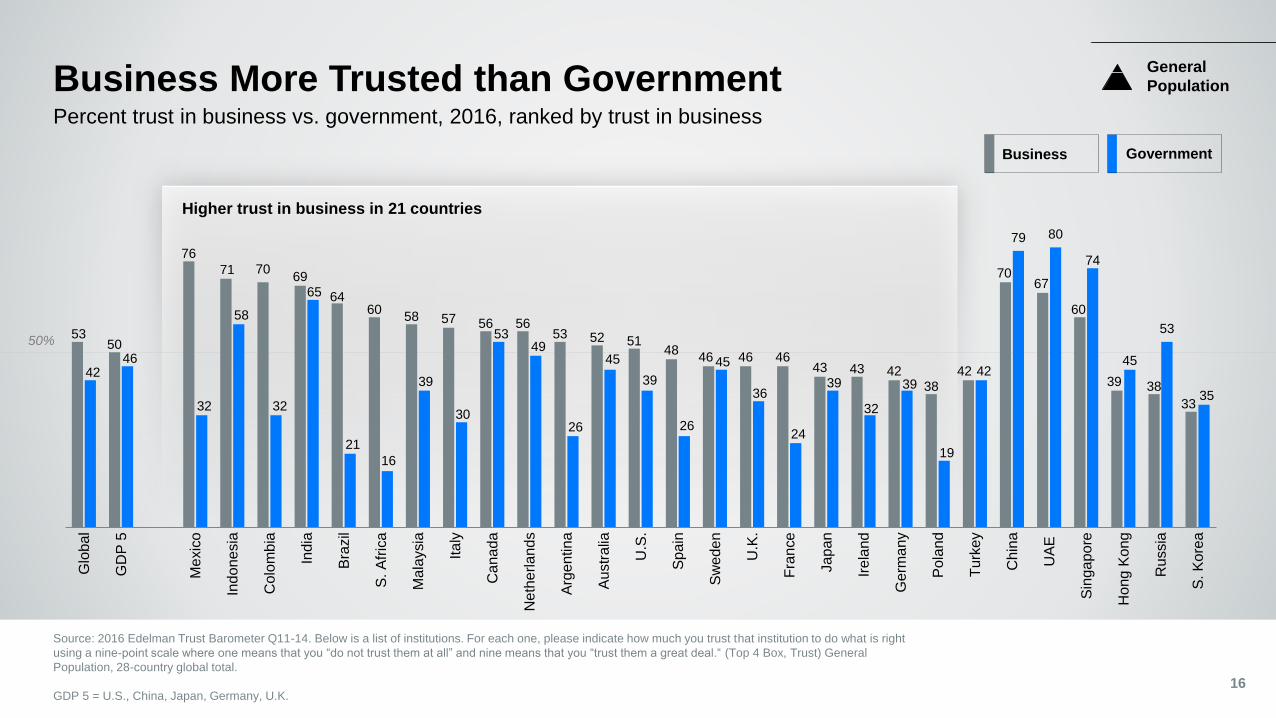
Higher trust in business in 21 countries
5350
76
71 7069
6460
58 57 56 5653 52 51
4846 46 46
43 43 4238
42
7067
60
39 38
33
4246
32
58
32
65
21
16
39
30
5349
26
45
39
26
45
36
24
39
32
39
19
42
79 80
74
45
53
35
Glo
ba
l
GD
P 5
Me
xic
o
Indo
ne
sia
Co
lom
bia
India
Bra
zil
S. A
fric
a
Ma
laysia
Ita
ly
Ca
na
da
Ne
the
rla
nd
s
Arg
en
tin
a
Au
str
alia
U.S
.
Sp
ain
Sw
ede
n
U.K
.
Fra
nce
Ja
pa
n
Ire
land
Ge
rma
ny
Po
lan
d
Turk
ey
Ch
ina
UA
E
Sin
ga
po
re
Ho
ng
Ko
ng
Ru
ssia
S. K
ore
a
50%
Business More Trusted than Government
Source: 2016 Edelman Trust Barometer Q11-14. Below is a list of institutions. For each one, please indicate how much you trust that institution to do what is right
using a nine-point scale where one means that you “do not trust them at all” and nine means that you “trust them a great deal.“ (Top 4 Box, Trust) General
Population, 28-country global total.
GDP 5 = U.S., China, Japan, Germany, U.K. 16
Percent trust in business vs. government, 2016, ranked by trust in business
Business Government
General
Population

Greater or equal trust in public companies in 21 countries
50%
Public-Listed Companies More Trusted than State-Owned
17
Percent trust in public companies vs. state-owned companies, 2016, ranked by trust in public companies
Public
CompaniesState-Owned
General
Population
Source: 2016 Edelman Trust Barometer Q15-17C. Thinking about different types of businesses, please indicate how much you trust each type of business to do
what is right using a nine-point scale, where one means that you “do not trust them at all” and nine means that you “trust them a great deal.” (Top 4 Box, Trust)
General Population, 28-country global total.
GDP 5 = U.S., China, Japan, Germany, U.K.
5249
79
72 70
6563
60 59 58
53 52 51 50 49 47 4745 45 44 43 42
40
67
61
44 4339
34
24
46 46
73
61
68
53
3943
40
23
38
4744
4649
39 38
4339 39
33
42
29
74
65
47
62
4142
35
Glo
ba
l
GD
P 5
Ch
ina
Indo
ne
sia
India
Me
xic
o
Bra
zil
Ma
laysia
Co
lom
bia
S. A
fric
a
Ho
ng
Ko
ng
U.S
.
Turk
ey
Ca
na
da
Au
str
alia
Ita
ly
Po
lan
d
U.K
.
S. K
ore
a
Ire
land
Ja
pa
n
Sw
ede
n
Arg
en
tin
a
UA
E
Sin
ga
po
re
Ne
the
rla
nd
s
Ru
ssia
Sp
ain
Fra
nce
Ge
rma
ny

Business Must Lead to Solve Problems
Source: 2016 Edelman Trust Barometer Q249. Please indicate how much you agree or disagree with the following statement? (Top 4 Box, Agree).
General Population, 27-country global total, question asked of half the sample.
.
80% agree
“A company can take
specific actions that both
increase profits and improve
the economic and social
conditions in the community
where it operates.”
up from 74% in 2015
General
Population
18

Purpose Impacts Trust
19
Percent who cite each as a reason for why their trust in business has increased or decreased
Source: 2016 Edelman Trust Barometer Q328-329. For which of the following reasons, if any, has your trust in each institution listed below increased over the past year? Q330-331. For which
of the following reasons, if any, has your trust in each institution listed below decreased over the past year? General Population, 28-country global total.
Reasons Trust in Business Has Increased
Reasons Trust in Business Has Decreased
Produces
economic growth
Contributes to the
greater good
Allows me to be a productive
member of society
Fails to contribute
to the greater good
Lacks economic growth
No public services
59%
45%
40%
50%
39%
36%
General
Population

5 Building Leadership in a Time of Turbulence Energy Sector
40%
45%
50%
55%
60%
65%
70%
75%
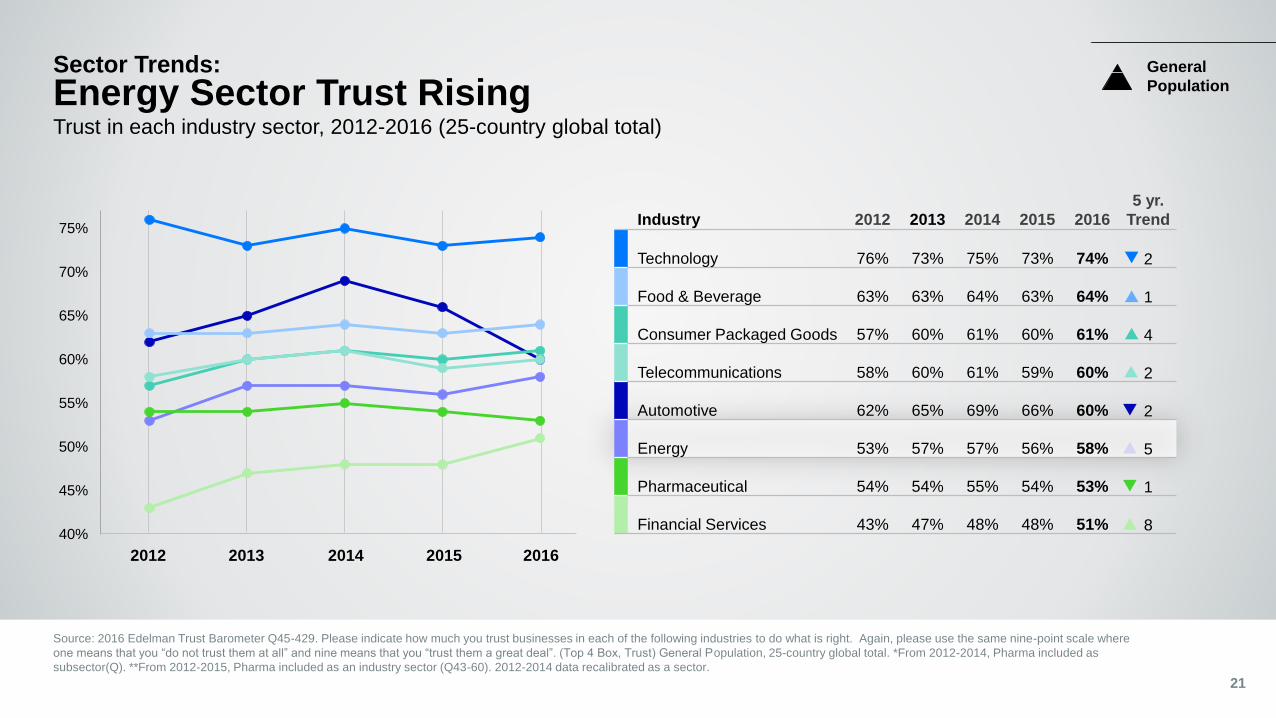
Sector Trends:
Energy Sector Trust Rising
Source: 2016 Edelman Trust Barometer Q45-429. Please indicate how much you trust businesses in each of the following industries to do what is right. Again, please use the same nine-point scale where
one means that you “do not trust them at all” and nine means that you “trust them a great deal”. (Top 4 Box, Trust) General Population, 25-country global total. *From 2012-2014, Pharma included as
subsector(Q). **From 2012-2015, Pharma included as an industry sector (Q43-60). 2012-2014 data recalibrated as a sector.
Trust in each industry sector, 2012-2016 (25-country global total)
2012 2013 2014 2015 2016
General
Population
21
Industry 2012 2013 2014 2015 2016
5 yr.
Trend
Technology 76% 73% 75% 73% 74% 2
Food & Beverage 63% 63% 64% 63% 64% 1
Consumer Packaged Goods 57% 60% 61% 60% 61% 4
Telecommunications 58% 60% 61% 59% 60% 2
Automotive 62% 65% 69% 66% 60% 2
Energy 53% 57% 57% 56% 58% 5
Pharmaceutical 54% 54% 55% 54% 53% 1
Financial Services 43% 47% 48% 48% 51% 8
40%
45%
50%
55%
60%
65%
70%
75%
2013 2014 2015 2016
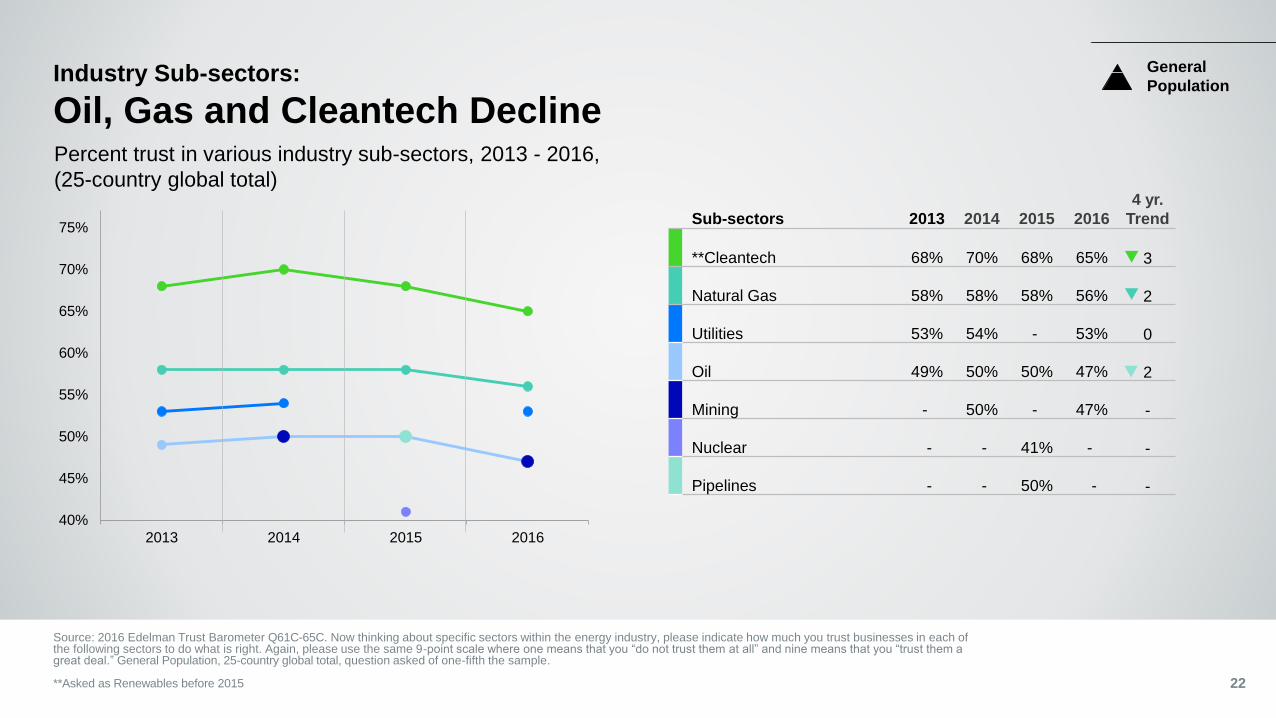
Sub-sectors 2013 2014 2015 2016
4 yr.
Trend
**Cleantech 68% 70% 68% 65% 3
Natural Gas 58% 58% 58% 56% 2
Utilities 53% 54% - 53% 0
Oil 49% 50% 50% 47% 2
Mining - 50% - 47% -
Nuclear - - 41% - -
Pipelines - - 50% - -
Industry Sub-sectors:
Oil, Gas and Cleantech Decline
22
Source: 2016 Edelman Trust Barometer Q61C-65C. Now thinking about specific sectors within the energy industry, please indicate how much you trust businesses in each of the following sectors to do what is right. Again, please use the same 9-point scale where one means that you “do not trust them at all” and nine means that you “trust them a great deal.” General Population, 25-country global total, question asked of one-fifth the sample.
**Asked as Renewables before 2015
General
Population
Percent trust in various industry sub-sectors, 2013 - 2016,
(25-country global total)

53%56%
46% 47%
63%
46%43% 45%
35%
56%55%59%
62%
46%
61%65% 67%
69%
61%
67%
45%49%
44%
38%
52%
23
Source: 2016 Edelman Trust Barometer Q61C-65C. Now thinking about specific sectors within the energy industry, please indicate how much you trust businesses in each of the following sectors to do what is right. Again, please use the same 9-point scale where one means that you “do not trust them at all” and nine means that you “trust them a great deal.” General Population, 28-country global total and regions, question asked of one-fifth the sample.
Utilities
Oil
Natural Gas
Cleantech
Mining
General
PopulationIndustry Sub-sectors:
Cleantech Leads in All Regions, Europe Most Skeptical Across Sector
Trust in various industry sub-sectors, global and regional
Latin AmericaGlobal North America European Union APAC
86 India
85 UAE
84 China
80 Indonesia
75 Singapore
73 Malaysia
69 Brazil
68 Russia
66 Hong Kong
65 Mexico
63 S. Korea
60 Italy
60 Global 64 Global
91 India
88 China
83 UAE
81 Mexico
77 Indonesia
77 Singapore
75 Malaysia
72 U.S.
71 Colombia
66 Brazil
63 Italy
63 Hong Kong
63 S. Korea
62 France
61 Australia
60 Russia
60 Turkey
47 Japan
46 Sweden
45 South Africa
43 Spain
40 Germany
49 Australia
49 Canada
49 Japan
48 Poland
47 Turkey
46 Spain
46 Ireland
44 Sweden
42 Argentina
38 U.K.
37 Germany
59 Netherlands
58 Poland
54 Ireland
52 Argentina
52 Canada
51 U.K.
59 U.S.
57 France
56 Netherlands
50 South Africa
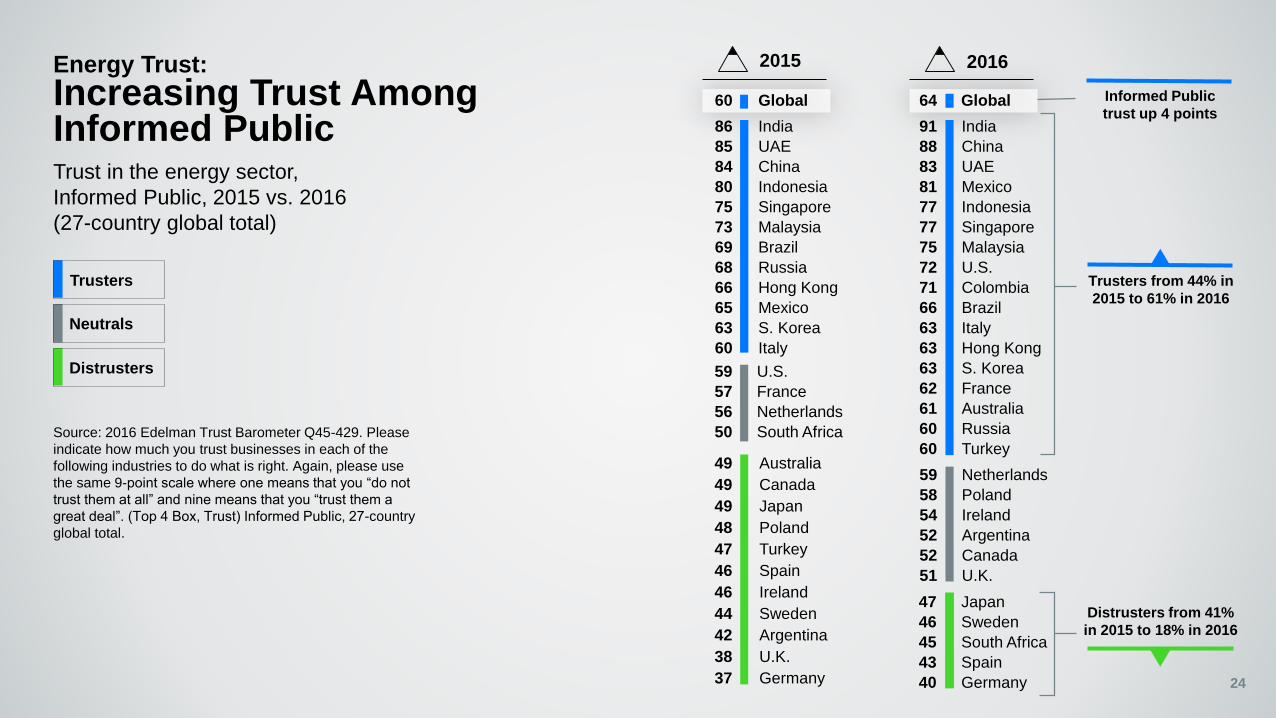
Energy Trust:
Increasing Trust Among Informed PublicTrust in the energy sector,
Informed Public, 2015 vs. 2016
(27-country global total)
2015 2016
Informed Public
trust up 4 points
Trusters from 44% in
2015 to 61% in 2016
Distrusters from 41%
in 2015 to 18% in 2016
Trusters
Neutrals
Distrusters
24
Source: 2016 Edelman Trust Barometer Q45-429. Please
indicate how much you trust businesses in each of the
following industries to do what is right. Again, please use
the same 9-point scale where one means that you “do not
trust them at all” and nine means that you “trust them a
great deal”. (Top 4 Box, Trust) Informed Public, 27-country
global total.

46 Japan
44 Germany
43 U.K.
42 S. Africa
39 Spain
39 Sweden
82 China
79 India
79 UAE
74 Indonesia
70 Mexico
69 Singapore
68 Malaysia
65 Colombia
61 U.S.
59 Hong Kong
59 S. Korea
57 Russia
56 Brazil
56 Italy
55 France
54 Netherlands
53 Poland
52 Canada
52 Turkey
51 Argentina
51 Australia
50 Ireland
Energy Trust:
General Population Is In Neutral TerritoryTrust in the energy sector,
Informed Public vs.
General Population, 2016
Only 3 in 10 countries
are trusters among the
General Population
Source: 2016 Edelman Trust Barometer Q45-429. Please
indicate how much you trust businesses in each of the
following industries to do what is right. Again, please use
the same 9-point scale where one means that you “do not
trust them at all” and nine means that you “trust them a
great deal”. (Top 4 Box, Trust) Informed Public and
General Population, 28-country global total.
InformedPublic
GeneralPopulation
57 Global
25
Trusters
Neutrals
Distrusters
65 Global
91 India
88 China
83 UAE
81 Mexico
77 Indonesia
77 Singapore
75 Malaysia
72 U.S.
71 Colombia
66 Brazil
63 Italy
63 Hong Kong
63 S. Korea
62 France
61 Australia
60 Russia
60 Turkey
47 Japan
46 Sweden
45 South Africa
43 Spain
40 Germany
59 Netherlands
58 Poland
54 Ireland
52 Argentina
52 Canada
51 U.K.

58 Hong Kong
57 Russia
57 S. Korea
57 U.S.
55 Italy
54 Brazil
54 France
54 Netherlands
53 Poland
52 Canada
51 Argentina
51 Turkey
49 Australia
49 Ireland
45 Japan
44 Germany
42 U.K.
42 South Africa
38 Spain
38 Sweden
81 China
78 UAE
77 India
75 Indonesia
68 Mexico
67 Malaysia
67 Singapore
64 Colombia
Energy Trust:
Mass Population Trust Lags
Trust in energy sector,
Informed Public vs. General
Population vs. Mass Population
For the mass
population,
8 of 28 countries
are distrusters
Source: 2016 Edelman Trust
Barometer Q45-429. Please indicate
how much you trust businesses in
each of the following industries to do
what is right. Again, please use the
same 9-point scale where one means
that you “do not trust them at all” and
nine means that you “trust them a
great deal”. (Top 4 Box, Trust)
Informed Public, General Population,
and Mass Population, 28-country
global total.
MassPopulation
56 Global
26
Trusters
Neutrals
Distrusters
InformedPublic
GeneralPopulation
46 Japan
44 Germany
43 U.K.
42 S. Africa
39 Spain
39 Sweden
82 China
79 India
79 UAE
74 Indonesia
70 Mexico
69 Singapore
68 Malaysia
65 Colombia
61 U.S.
59 Hong Kong
59 S. Korea
57 Russia
56 Brazil
56 Italy
55 France
54 Netherlands
53 Poland
52 Canada
52 Turkey
51 Argentina
51 Australia
50 Ireland
57 Global65 Global
91 India
88 China
83 UAE
81 Mexico
77 Indonesia
77 Singapore
75 Malaysia
72 U.S.
71 Colombia
66 Brazil
63 Italy
63 Hong Kong
63 S. Korea
62 France
61 Australia
60 Russia
60 Turkey
47 Japan
46 Sweden
45 South Africa
43 Spain
40 Germany
59 Netherlands
58 Poland
54 Ireland
52 Argentina
52 Canada
51 U.K.

Informed 72 91 81 61 66 77 60 51 62 63 75 46 88 71 63 63 54 59 58 43 83 60 45 77 47 52 52 40
Mass 57 77 68 49 54 67 51 42 54 55 67 38 81 64 57 58 49 54 53 38 78 57 42 75 45 51 52 44
Gap 15 14 13 12 12 10 9 9 8 8 8 8 7 7 6 5 5 5 5 5 5 3 3 2 2 1 0 -4
Gap
10-15
5-9
1-4
0
Below 0
Trust in energy sector, Informed Public
vs. Mass Population
A Disparity Across All Regions
Source: 2016 Edelman Trust Barometer. Q45-429. Please indicate how much you trust businesses in each of the following industries to do what is right. Again,
please use the same 9-point scale where one means that you “do not trust them at all” and nine means that you “trust them a great deal”. (Top 4 Box, Trust)
Informed Public, General Population and Mass Population.
27
Fra
nce
U.K
.
U.S
.
Sp
ain
Me
xic
o
Sin
ga
po
re
S.
Ko
rea
Ma
laysia
Ind
ia
Chin
a
Bra
zil
Ge
rma
ny
Au
str
alia
Ire
lan
d
Russia
Po
lan
d
Can
ad
a
Ja
pa
n
Ind
on
esia
Ita
ly
Arg
en
tin
a
UA
E
Hon
g K
on
g
Neth
erla
nds
Sw
ed
en
Tu
rkey
Colo
mb
ia
S. A
fric
a

A Widening Trust Gap
28
Percent trust in business vs trust in energy, 2012 to 2016 (25-country global total)Informed
Public
Mass
Population
7pt
Gap
Trust in Energy
4pt
Gap9pt
Gap
Trust in Business
11pt
Gap54
58 58
56
62
45
4948
47
51
2012 2013 2014 2015 2016
Source: 2016 Edelman Trust Barometer Q11-14. Below is a list of institutions. For each one, please indicate how much you trust that institution to do what is right
using a nine-point scale, where one means that you “do not trust them at all” and nine means that you “trust them a great deal.” (Top 4 Box, Trust). Q45-429.
Please indicate how much you trust businesses in each of the following industries to do what is right. Again, please use the same 9-point scale where one means
that you “do not trust them at all” and nine means that you “trust them a great deal”. (Top 4 Box, Trust) Informed Public and Mass Population, 25-country global
total.
56
5960 60
63
52
56 5655
56
2012 2013 2014 2015 2016

50%
Energy More Trusted Than Government
Source: 2016 Edelman Trust Barometer Q11-14. [GOVERNMENT IN GENERAL] Below is a list of institutions. For each one, please indicate how much you trust that institution to do what is
right using a nine-point scale where one means that you “do not trust them at all” and nine means that you “trust them a great deal.“ (Top 4 Box, Trust) Q45-429. Please indicate how much
you trust businesses in each of the following industries to do what is right. Again, please use the same 9-point scale where one means that you “do not trust them at all” and nine means that
you “trust them a great deal”. (Top 4 Box, Trust) General Population, 28-country global total.
GDP 5 = U.S., China, Japan, Germany, U.K.
29
Percent trust in energy vs. trust in government, 2016, ranked by trust in energy
General
Population
Greater trust in 24 countries
Energy Government
5755
8279
7470
6865
6159 59
57 56 56 55 54 53 52 51 51 5046
44 43 4239
79
69
52
3942
46
79
65
58
32
39
32
39
45
35
53
30
2124
49
19
4245
26
32
39 3936
16
26
80
74
53
45
Glo
ba
l 2
8
GD
P 5
Ch
ina
India
Indo
ne
sia
Me
xic
o
Ma
laysia
Co
lom
bia
U.S
.
Ho
ng
Ko
ng
S. K
ore
a
Ru
ssia
Ita
ly
Bra
zil
Fra
nce
Ne
the
rla
nd
s
Po
land
Turk
ey
Au
str
alia
Arg
en
tin
a
Ire
land
Ja
pa
n
Ge
rma
ny
U.K
.
S. A
fric
a
Sp
ain
UA
E
Sin
ga
po
re
Ca
na
da
Sw
ede
n
6 Leadership in aDivided World

Addressing Trust Inequality
31
Actions
ValuesEmployee
Advocacy
EngagementTrust

Actions:
Trust-Building Behaviors
Leadership in a Divided World:
Energy Sector

Trust-Building Behaviors:
Largest Gaps For Energy in Transparency,
Leadership and Data Importance vs. performance of behavior in building trust in a company
%
Performance
%
Importance Gap
General
Population
33
Source: 2016 Edelman Trust
Barometer. Q335-440 How important is
each of the following behaviors to
building your TRUST in a company?
Use a 9-point scale where one means
that behavior is “not at all important to
building your trust” and nine means it is
“extremely important to building your
trust” in a company. (Top 4 Box,
Importance) Q346A-J How well do you
think the energy industry is performing
on the behaviors listed below. Use a 9-
point scale where one means they are
“performing extremely poorly” and nine
means they are “performing extremely
well”. (Top 4 Box, Performing) General
Population, 28-country global total.
Protects consumer data 86 62 24
Ensures quality control 85 62 23
Keeps me and my family safe 81 61 20
Is transparent in reporting progress on company’s social responsibilities 80 54 26
Makes my life easier 80 68 12
Embraces sustainable business practices 80 58 22
Has leadership that effectively represents the interests of all stakeholders 79 54 25
Supports local charities and good causes 75 53 22
Develops intellectual property 74 57 17
Makes me feel connected to something bigger 70 51 19

Trust-Building Behaviors:
Tech Outperforms Where Energy ShouldGeneral
Population
Source: 2016 Edelman Trust Barometer Q335-440. How important is each of the following factors to building your TRUST in a company? Use a 9-point scale where
one means that action is “not at all important to building your trust” and nine means it is “extremely important to building your trust” in a company. (Top 4 Box, Trust)
General Population, 28-country global total. Q344-348. How well do you think the [INSERT SECTOR BEING RATED] industry is performing on the behaviors listed
below. Use a 9-point scale where one means they are “performing extremely poorly” and nine means they are “performing extremely well”. General Population, 28-
country global total. 34
Gap in importance of behaviors in building trust vs. percent who
agree each industry is performing well against these behaviors
Technology Energy
Protects consumer data 19 24
Ensures quality control 11 23
Keeps me and my family safe 15 20
Is transparent in reporting progress on company’s social responsibilities 18 26
Makes my life easier 1 12
Embraces sustainable business practices 14 22
Has leadership that effectively represents the interests of all stakeholders 14 25
Supports local charities and good causes 15 22
Develops intellectual property 1 17
Makes me feel connected to something bigger 4 19
AVERAGE GAP 11 21
Values: Trust and the CEOEnergy Sector
Leadership in a Divided World:
46 46
28 2930 31 33 34 34
35 36 38 40 41 41 42 42 43 4546
4953 53 55 56
60
68
7679
83
Glo
ba
l
GD
P 5
Russia
Sw
ede
n
Germ
any
Spa
in
Ja
pa
n
Ire
land
S. A
fric
a
Cana
da
U.K
.
Austr
alia
Arg
en
tin
a
Fra
nce
Italy
Pola
nd
S. K
ore
a
Tu
rke
y
Neth
erla
nds
Bra
zil
U.S
.
Hong
Kon
g
Ma
laysia
Colo
mb
ia
Sin
ga
po
re
Me
xic
o
Ind
one
sia
UA
E
Ind
ia
Ch
ina
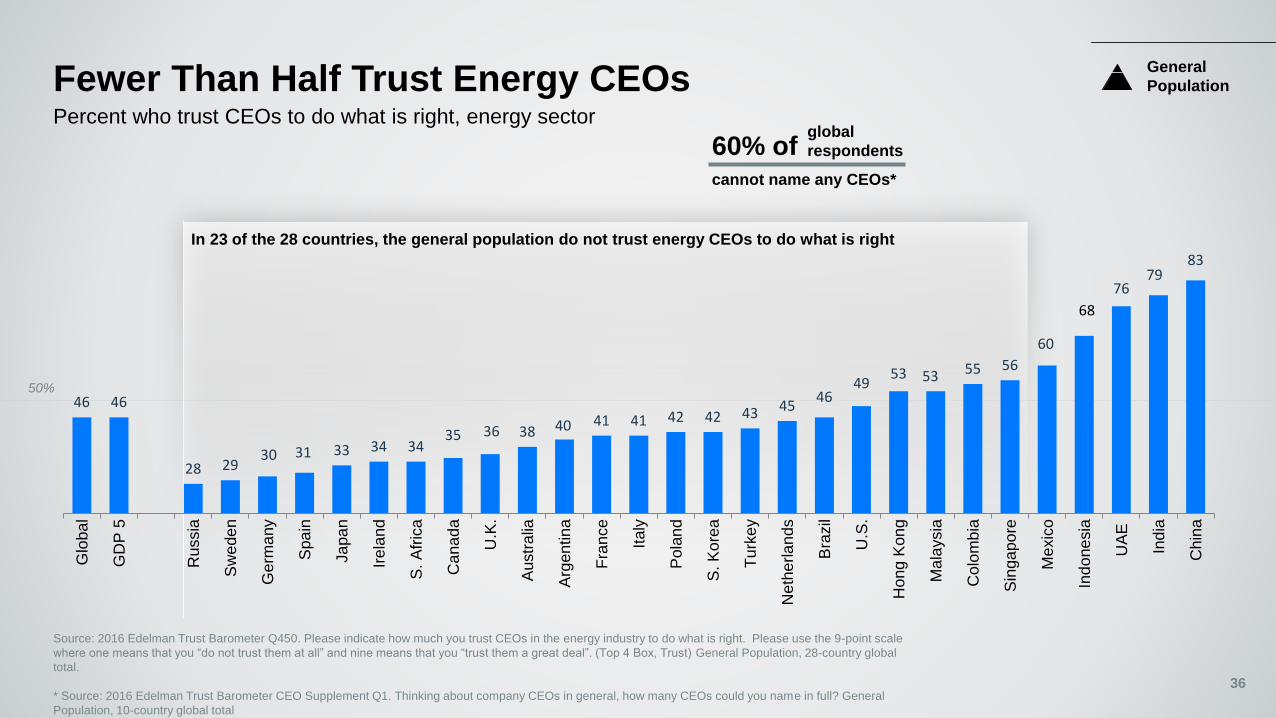
Fewer Than Half Trust Energy CEOsPercent who trust CEOs to do what is right, energy sector
Source: 2016 Edelman Trust Barometer Q450. Please indicate how much you trust CEOs in the energy industry to do what is right. Please use the 9-point scale
where one means that you “do not trust them at all” and nine means that you “trust them a great deal”. (Top 4 Box, Trust) General Population, 28-country global
total.
* Source: 2016 Edelman Trust Barometer CEO Supplement Q1. Thinking about company CEOs in general, how many CEOs could you name in full? General
Population, 10-country global total
36
General
Population
50%
In 23 of the 28 countries, the general population do not trust energy CEOs to do what is right
cannot name any CEOs*
60% of global
respondents
61%
54%51%
48%46%
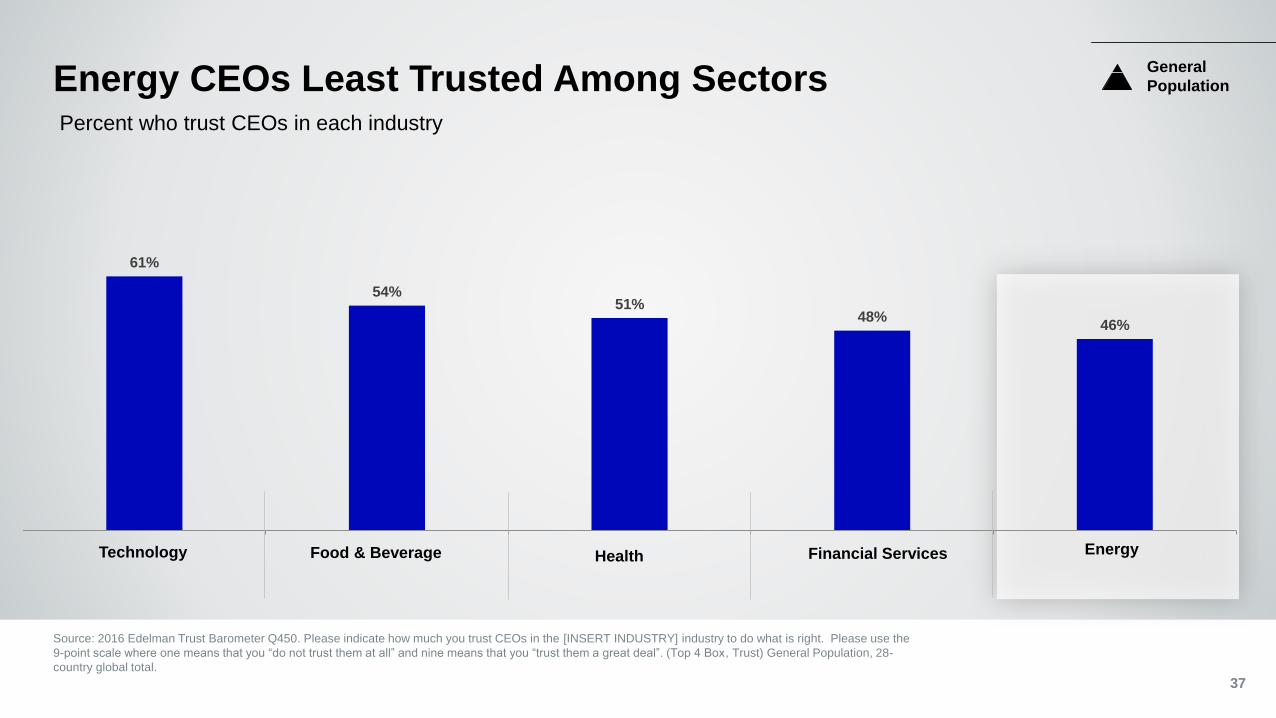
Energy CEOs Least Trusted Among Sectors
Source: 2016 Edelman Trust Barometer Q450. Please indicate how much you trust CEOs in the [INSERT INDUSTRY] industry to do what is right. Please use the
9-point scale where one means that you “do not trust them at all” and nine means that you “trust them a great deal”. (Top 4 Box, Trust) General Population, 28-
country global total.
37
Percent who trust CEOs in each industry
Financial ServicesHealth EnergyTechnology Food & Beverage
General
Population

Purpose and Profits Matter
Source: 2016 Edelman Trust Barometer Q496-506. How visible do you think a CEO should personally be in these different types of business situations? Please
use a 9-point scale where one means that it is “not visible at all” and nine means that it is “extremely visible”. (Top 4 Box, V isible) General Population, 28-country
global total, question asked of half the sample.
38
Percent who agree that CEOs should be personally visible in discussing…
8 in10Societal Issues
‣ Income inequality
‣ Public policy discussions
‣ Personal views on societal issues
7 in10Financial Results
General
Population

62%65%70%
79%
Their education andhow it shaped them
Their personalsuccess story
The obstaclesthey have overcome
Their personalvalues
Personal Values and History Matter
Source: 2016 Edelman Trust Barometer Q507-514. Thinking about how a CEO communicates with a variety of groups and individuals, how important are each of the following activities a CEO could engage in?
Please use a nine-point scale where one means that attribute is “not at all important to building your trust” and nine means it is “extremely important to building your trust”. [Media Engagement net = Q507
‘Interviews with the media,’ and ‘Q512 ‘Sharing their views on a blog or on social media.’ Direct Engagement net = Q508 ‘Communications with employees,’ and ‘Participation in industry conferences.’] Q516-524.
For you to trust a CEO, how important is it that you have information on each of the following aspects of the CEO’s personal life outside of their business? Please use a nine-point scale where one means that
attribute is “not at all important to building your trust” and nine means it is “extremely important to building your trust. (Top 4 Box, Important) General Population, 28-country global total, question asked of half the
sample.
Percent who agree that each type of information
is important in building trust in a CEO
both directly (86%)
and via media (75%)
General
Population
39
CEOs must engage

Employee Advocacy:Your Greatest Asset
Leadership in a Divided World:
Energy Sector

2527
19
2528
33
27 28
24
28
37
313230
48
24 25 26
21 21 22 2320
1619 19
14
19 18 18
8 9 8
1310 11
Employees are Essential Advocates
Source: 2016 Edelman Trust Q610 Who do you trust MOST to provide you with credible and honest information about a company's financial earnings and operational performance, and top leadership’s accomplishments?
Q611 a company’s business practices, both positive and negative, and its handling of a crisis? Q612 a company’s employee programs, benefits and working conditions, and how a company serves its customers and
prioritizes customer needs ahead of company profits? Q613 a company’s partnerships with NGOs and effort to address societal issues, including those to positively impact the local community? Q614 a company’s
innovation efforts and new product development? Q615 Who do you trust MOST to provide you with credible and honest information about a company’s stand on issues related to the industry in which it operates? General
Population, 28-country global total.41
Most trusted spokesperson to communicate each topic
Innovation effortsFinancial earnings &
operational
performance
Business practices/
crisis handling
Treatment of
employees/customerPartnerships/
Programs to address
societal issues
Views on
industry issues
Employees Most Trusted
General
Population
Company CEO
Senior executive
Employee
Activist consumer
Academic
Media spokesperson

74
83
68
7782
91
Global GDP 5 APAC European Union Latin America North America
1 in 4 Energy Workers Do Not Trust Their Employer
Source: 2016 Edelman Trust Barometer Q525-526. Thinking about your own company and other companies in your industry, please indicate how much you trust
each to do what is right using a nine-point scale where one means that you “do not trust them at all” and nine means that you “trust them a great deal”. (Top 4 Box,
Trust) General Population, 28-country global total, question was asked of half the sample.
GDP 5 = U.S., China, Japan, Germany, U.K. 42
Percent who trust the company for which they work, energy sector
General
Population

Integrity 54 31 23
Has Ethical Business Practices 51 31 24
Takes Responsible Actions To Address An Issue Or A Crisis 54 31 23
Has Transparent And Open Business Practices 55 31 24
Engagement 55 32 23
Treats Employees Well 58 33 25
Listens To Customer Needs And Feedback 58 33 25
Places Customers Ahead Of Profits 55 31 24
Communicates Frequently And Honestly On The State Of Its Business 48 29 19
Products 49 34 15
Offers High Quality Products Or Services 58 35 23
Is An Innovator Of New Products, Services Or Ideas 41 32 9
Purpose 43 28 15
Works To Protect And Improve The Environment 50 30 20
Creates Programs That Positively Impact The Local Community 44 29 15
Addresses Society's Needs In Its Everyday Business 45 29 16
Partners With NGOs, Government And Third Parties To Address Societal Issues 34 24 10
Operations 37 28 9
Has Highly-Regarded And Widely Admired Top Leadership 39 27 12
Ranks On A Global List Of Top Companies, Such As Best To Work For Or Most Admired 36 27 9
Delivers Consistent Financial Returns To Investors 36 28 8
Trust-Building AttributesCompany Importance vs. Performance
%
Performance
%
Importance Gap
General
Population
43
Source: 2016 Edelman Trust
Barometer Q80-95 How important is
each of the following attributes to
building your TRUST in a company?
Use a 9-point scale where one means
that attribute is “not at all important to
building your trust” and nine means it
is “extremely important to building
your trust” in a company. (Top 2 Box,
Importance) Q114-129 Please rate
businesses in general on how well
you think they are performing on each
of the following attributes. Use a 9-
point scale where one means they are
"performing extremely poorly" and
nine means they are "performing
extremely well". (Top 2 Box,
Performance) General Population, 28-
country global total.

Engagement:
Every Voice Matters
Leadership in a Divided World:

58
53
44
63
46
2012 2013 2014 2015 2016
Transformed Media Landscape
Source: 2016 Edelman Trust Barometer Q178-182. When looking for general news and information, how much would you trust each type of source for general news and information? Please use a
nine-point scale where one means that you “do not trust it at all” and nine means that you “trust it a great deal.” (Top 4 Box, Trust) General Population and Millennials, 25-country global total.
*From 2012-2015, “Online Search Engines” were included as a media type. In 2016, this was changed to “Search Engines.”
**From 2012-2015, “Hybrid Media” was included as a media type. In 2016, this was changed to “Online-Only media.”
Percent trust in each source for general news and information
Millennials
even more trusting
of digital media than
general population
2012 2013 2014 2015 2016
Search engines* 61 58 61 62 63
Traditional media 62 59 61 57 58
Online-only media** 46 44 47 45 53
Owned media 41 40 43 43 46
Social media 44 41 44 45 44
General
Population
45
Millennials Gap
66 3
58 0
58 5
51 5
51 7

50%
6761
53
46
39
4640
3430
26
78
6562
5549
44 4237
32 31
My friendsand family
An academicexpert
Companiesthat I use
Employees ofa company
A companyCEO
A journalist A well-knownonline
personality
Electedofficials
Celebrities Companies I don’t use*
Every Voice Matters
Source: 2016 Edelman Trust Barometer Q598-609. Thinking about the information you consume, how much do you trust the information from each of the following
authors or content creators? (Top 4 Box, Trust) General Population, 27-country global total, question asked of half the sample.
* Asked as “Brands I don’t use” in 2015. 46
Percent who trust information created by each author on social networking
sites, content sharing sites and online-only information sources, 2015 vs. 2016
+11
General
Population
+10
2015 2016
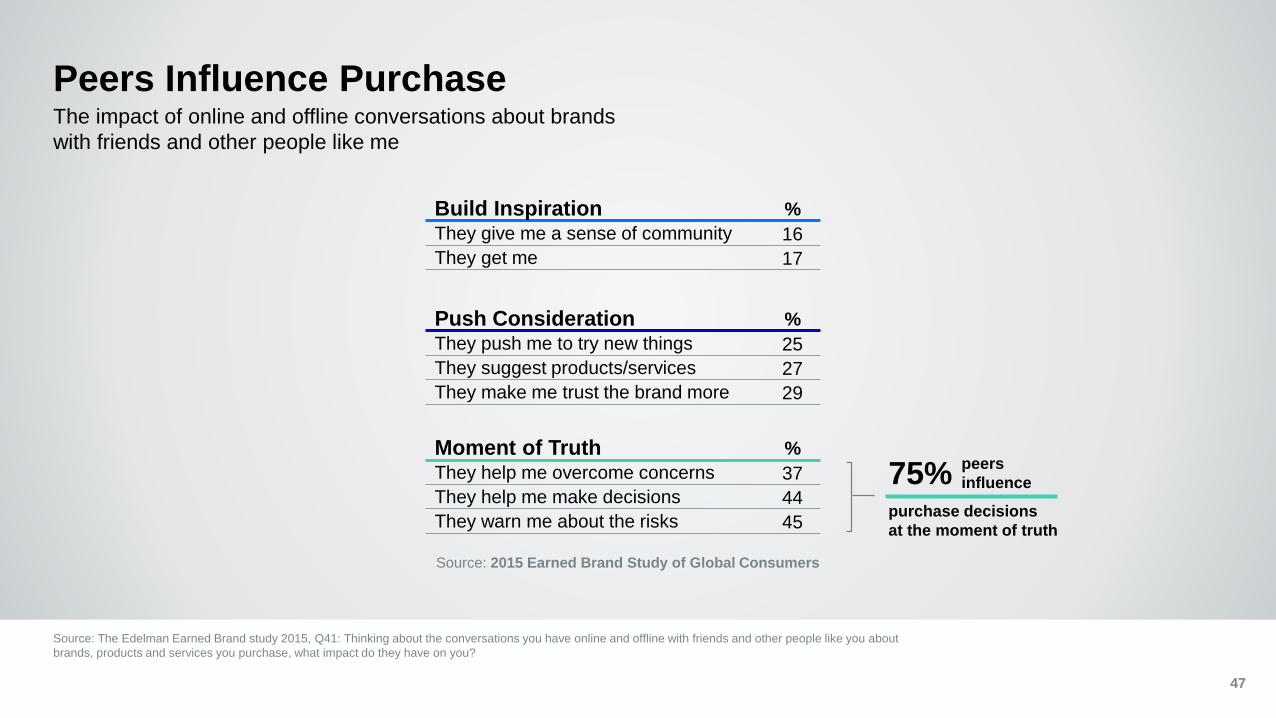
Peers Influence Purchase
Source: The Edelman Earned Brand study 2015, Q41: Thinking about the conversations you have online and offline with friends and other people like you about
brands, products and services you purchase, what impact do they have on you?
The impact of online and offline conversations about brands
with friends and other people like me
Source: 2015 Earned Brand Study of Global Consumers
purchase decisions
at the moment of truth
75%
Build Inspiration %
They give me a sense of community 16
They get me 17
Push Consideration %
They push me to try new things 25
They suggest products/services 27
They make me trust the brand more 29
Moment of Truth %
They help me overcome concerns 37
They help me make decisions 44
They warn me about the risks 45
peers
influence
47

Opportunities to Connect
7
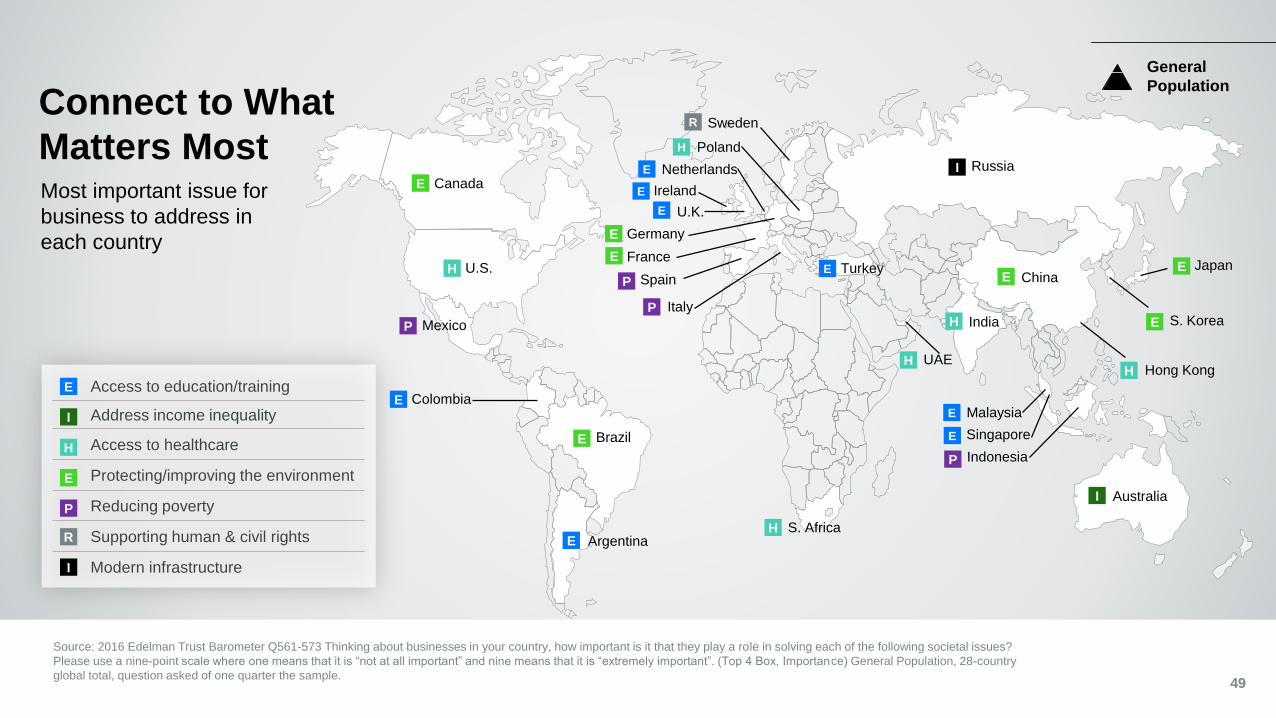
Access to education/training
Address income inequality
Access to healthcare
Protecting/improving the environment
Reducing poverty
Supporting human & civil rights
Modern infrastructure
E
E
P
H
Source: 2016 Edelman Trust Barometer Q561-573 Thinking about businesses in your country, how important is it that they play a role in solving each of the following societal issues?
Please use a nine-point scale where one means that it is “not at all important” and nine means that it is “extremely important”. (Top 4 Box, Importance) General Population, 28-country
global total, question asked of one quarter the sample.
Connect to What
Matters Most
49
Most important issue for
business to address in
each country
Canada
Brazil
Germany
France
ChinaU.S.
Poland
Argentina
Sweden
Mexico
U.K.
Ireland
Netherlands
Turkey
Singapore
Hong Kong
MalaysiaColombia
Japan
Australia
Russia
S. KoreaItaly
Spain
Indonesia
UAE
S. Africa
India
General
Population
R
I
I
E
E
R
H
E
E
E
E
E
P
P
E
H
P
E
H
H
H
E
E
E
E
E
P
I
H
E
I

Actions
ValuesEmployee
Advocacy
Engagement
Embracing the New Reality of Influence to Address Trust Inequality
‣ Create societal impact in addition to profits through
purposeful action
‣ Express your values through honest, ethical
engagement in which you share your story
‣ Ignite your most powerful advocate, your employees
‣ Engage cross channel to meet stakeholders, where
they are, about what most interests/concerns them
Influence
TRUST
50
Leadership
TRUST

Thank You
For more information, please contact
Amy Hemingway, Global Chair, Energy
1-202-350-6661