2016 construction forecast
TRANSCRIPT

Presented toASPE
March 28, 2016
2016 Construction Forecast

2
1. US Construction2. California 3. Santa Clara County4. Employment
Table of Contents

3
Self Portrait Working on Presentation

4
Annual Rate of Construction Spending US (Billions)1
Public ($) Private ($) Total ($)2005 256.3 904.3 1160.6
2006 280.9 896.8 1177.7
2007 297.8 842.4 1140.2
2008 319.6 737.1 1053.7
2009 309.6 593.0 902.5
2010 301.0 486.9 787.9
2011 286.6 529.7 816.4
2012 270.1 614.9 885.0
2013 266.5 663.9 908.4
2014 283.5 698.6 982.1
2015 294.3 828.2 1122.5
1Numbers come from December Annual Construction Report for the US Census Bureau, except for 2015 numbers which came from the November Report.
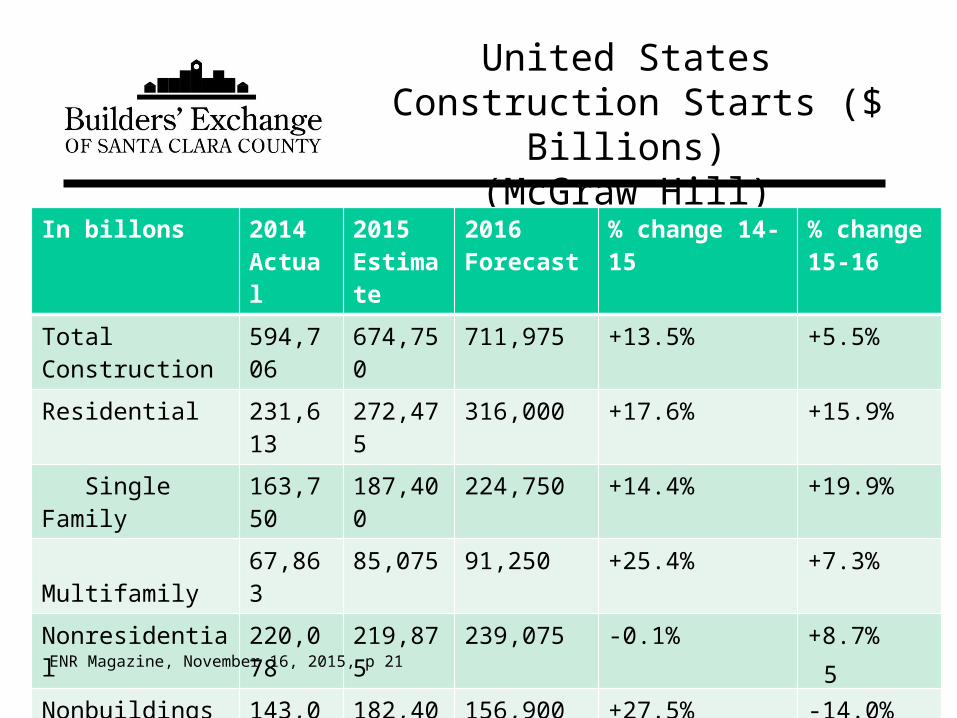
United States Construction Starts ($ Billions)
(McGraw Hill)
In billons 2014Actual
2015Estimate
2016Forecast
% change 14-15 % change 15-16
Total Construction 594,706 674,750 711,975 +13.5% +5.5%
Residential 231,613 272,475 316,000 +17.6% +15.9%
Single Family 163,750 187,400 224,750 +14.4% +19.9%
Multifamily 67,863 85,075 91,250 +25.4% +7.3%
Nonresidential 220,078 219,875 239,075 -0.1% +8.7%
Nonbuildings 143,015 182,400 156,900 +27.5% -14.0%
5ENR Magazine, November 16, 2015, p 21

FMI Construction Put In Place Forecast 2016 ($ Billions)
In billons 2014Actual
2015Estimate
2016Forecast
% change 14-15 % change 15-16
Total Construction 964,303 1,025,941 1,093,490 +6.4% +6.6%
Total Residential 345,993 375,691 408,538 +8.6% +8.7%
Total Nonresidential
388,896 423,964 452,247 +9.0% +6.7%
Non-buildings 229,414 226,286 232,705 -1.4% +2.8%
6ENR Magazine, November 16, 2015, p 21

7
Dodge Construction Growth Forecast
Annual % Change for $Volume of Construction Starts
1998 1999 2000 2001 2002 2003 2004 2005 2006 2007
+12.0 +10.0 +6.0 +5.0 +2.0 +5.0 +12.0 +13.0 +3.0 -7.0
2008 2009 2010 2011 2012 2013 2014 2015 2016
-13.0 -24.0 +2.0 +1.0 +12.0 +11.0 +9.0 +13.0 +6.0
ENR Magazine, November 16, 2015, p 20

8
Dodge ConstructionUS Outlook-2016
• Total Construction up 6% in dollars to $712 Billion• Multi Family Housing up 7% in dollars & 9% in units• Single Family Housing up 20% in dollars & 17% in units• Commercial Buildings up 11% in dollars• Public Works flat in 2016.• Electric Utilities down -43% in dollars• Institutional Buildings up +9% in dollars• Manufacturing Plant down -1% in dollarsData is based on Construction Starts
Dodge and Data Analytics, Press Release Nov. 2, 2015

9
Pattern of US Construction Starts 2016 (in billions $)
2011 2012 2013 2014 2015 2016
Total Construction
441.3 492.5 545.2 594.7 674.7 712.0
Single FamHousing
97.3 125.8 159.2 163.8 187.4 224.8
Multi FamHousing
29.7 40.6 51.5 67.9 85.1 91.2
Commer. Build 48.3 55.1 67.3 81.2 84.3 93.7Instit. Build 100.3 91.8 92.0 103.6 110.2 120.3Manuf.Build 17.3 13.1 18.8 35.3 25.3 25.0Pub. Works 106.9 112.3 126.7 119.8 122.4 122.9
Elec. Utilities 41.5 53.8 29.7 23.2 60.0 34.0
Dodge and Data Analytics, Press Release Nov. 2, 2015

10
California Building Permits 2015 through November
New Commercial New Industrial Alters/Additions
$7,342,509,409 $1,074,922,745 $10,880,234,291
New Other Total Non Residential Total All Construction(including Res)
$3,909,705,070 $23,207,371,515 $49,882,506,068
Information from the California Building Industry Foundation. 2015 data is through November 2015
Single Family Valuation New Multi Family Valuation
Residential Alterations
$13,029,225,070 $7,892,729,667 $5,753,178,956

11
California Housing Starts-2004-2015
New Housing Units0
50000
100000
150000
200000
250000212960
208972
164280
113034
64962
36209 44762 4733659638
8531085846
107586
2004 2005 2006 2007 2008 20092010 2011 2012 2013 2014 2015
Information from the California Building Industry Foundation. 2015 data is through November 2015

12
California New Housing Starts Forecast (thousands)
Housing Starts0
50
100
150
200
78.999.8
132.5148.3 153.1 158.5
2014 2015 2016 2017 2018 20191Eberhard School of Business, Metro Forecast, September 2015

San Jose, Sunnyvale, Santa Clara Construction Starts
In millions ($) 2011Actual
2012Actual
2013Actual
2014Actual
2015 Forecast
Total Construction 2,391 4,153 4,257 5,509 4,211
Residential 828 1,047 1,154 954 1,232
Non Residential 790 1,603 2,120 4,158 2,496
Comm/Manuf 259 475 692 3,684 1,944
Office/Bank 168 284 302 3,054 1,451
Institutional 531 1,128 1,427 474 552
Nonbuildings 773 1,503 983 397 482
13ENR Magazine, November 23/30, 2015, pCA4
14
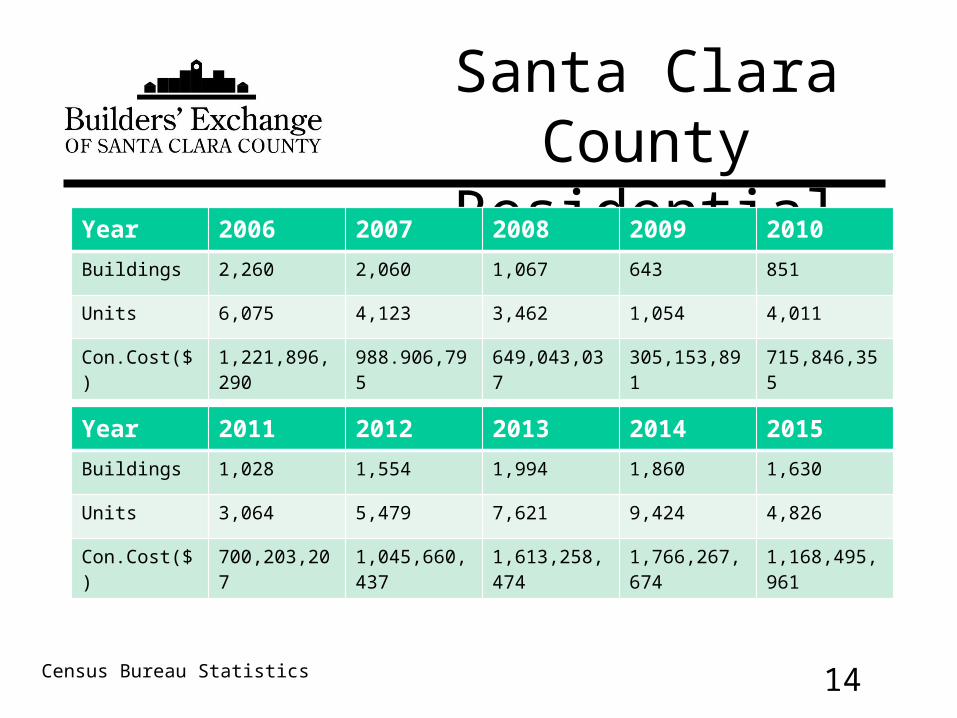
Santa Clara County Residential Permits
Year 2006 2007 2008 2009 2010Buildings 2,260 2,060 1,067 643 851
Units 6,075 4,123 3,462 1,054 4,011
Con.Cost($) 1,221,896,290 988.906,795 649,043,037 305,153,891 715,846,355
Year 2011 2012 2013 2014 2015Buildings 1,028 1,554 1,994 1,860 1,630
Units 3,064 5,479 7,621 9,424 4,826
Con.Cost($) 700,203,207 1,045,660,437 1,613,258,474 1,766,267,674 1,168,495,961
Census Bureau Statistics
15
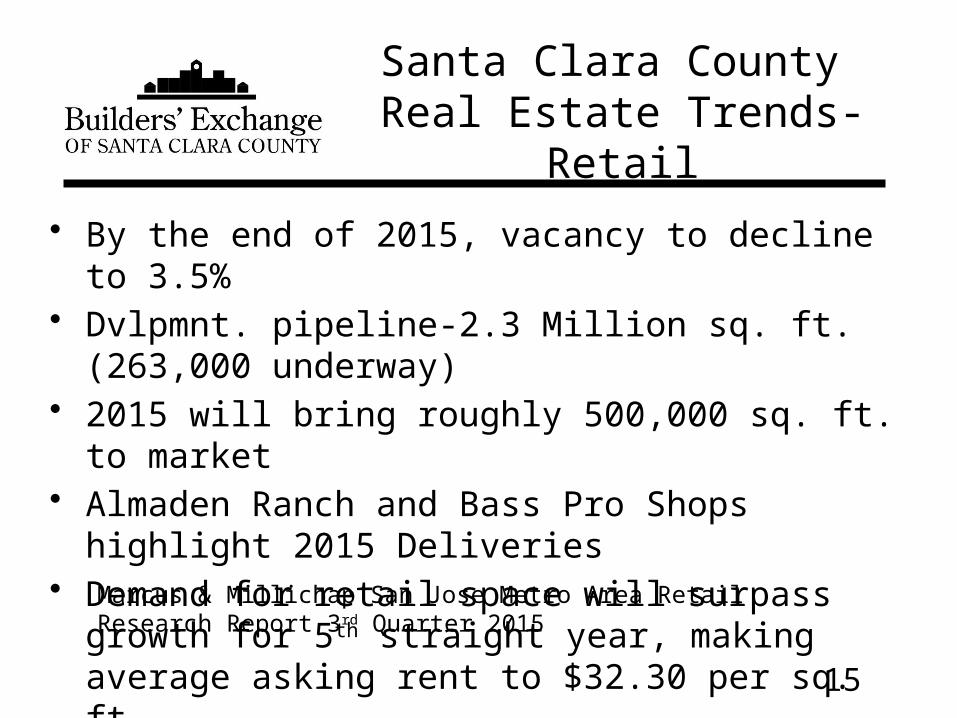
Santa Clara County Real Estate Trends-Retail
• By the end of 2015, vacancy to decline to 3.5%• Dvlpmnt. pipeline-2.3 Million sq. ft. (263,000 underway)• 2015 will bring roughly 500,000 sq. ft. to market• Almaden Ranch and Bass Pro Shops highlight 2015
Deliveries• Demand for retail space will surpass growth for 5th straight
year, making average asking rent to $32.30 per sq. ft.
Marcus & Millichap San Jose Metro Area Retail Research Report 3rd Quarter 2015

16
Santa Clara County Real Estate Trends-Commercial
• 4.5 million sq. ft. will be completed in 2015.• 1.6 million sq. ft completed in 2014• Asking rents will rise to $39.11 per sq. ft• Vacancy down to 9.7% in 2015
Marcus & Millichap San Jose Metro Area Commercial Research Report 2nd Quarter 2015
17
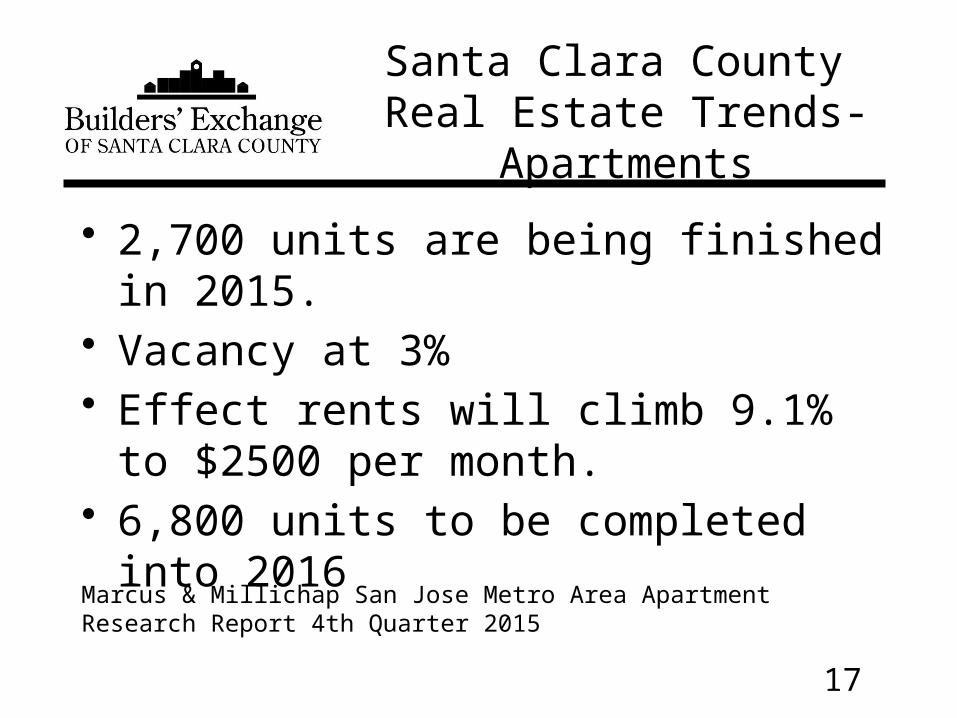
Santa Clara County Real Estate Trends-Apartments
• 2,700 units are being finished in 2015.• Vacancy at 3%• Effect rents will climb 9.1% to $2500 per
month.• 6,800 units to be completed into 2016
Marcus & Millichap San Jose Metro Area Apartment Research Report 4th Quarter 2015

18
Santa Clara County Trends-Commercial pt. 2
• 15% increase in office rents in 2015• 10% increase in office rents in 2016• 3.11 million sq. ft. under construction or to be
completed in 2016• 2015 was the best recorded year in history for
commercial real estate leasing in Silicon Valley. No repeat performance in 2016.
“Valley Party Isn’t Over,” Feb. 19, San Jose Mercury News, p. B7
19
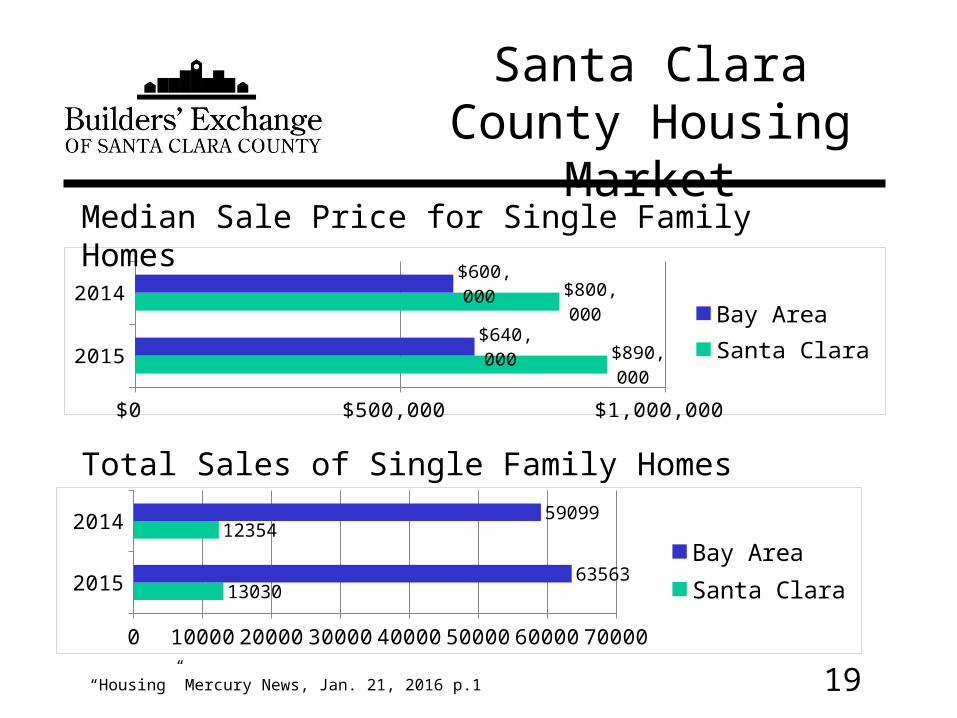
Santa Clara County Housing Market
2015
2014
$0 $200,000 $400,000 $600,000 $800,000 $1,000,000
$890,000
$800,000
$640,000
$600,000
Bay AreaSanta Clara
Median Sale Price for Single Family Homes
Total Sales of Single Family Homes
2015
2014
0 10000 20000 30000 40000 50000 60000 70000
13030
12354
63563
59099
Bay AreaSanta Clara
“Housing” Mercury News, Jan. 21, 2016 p.1
20
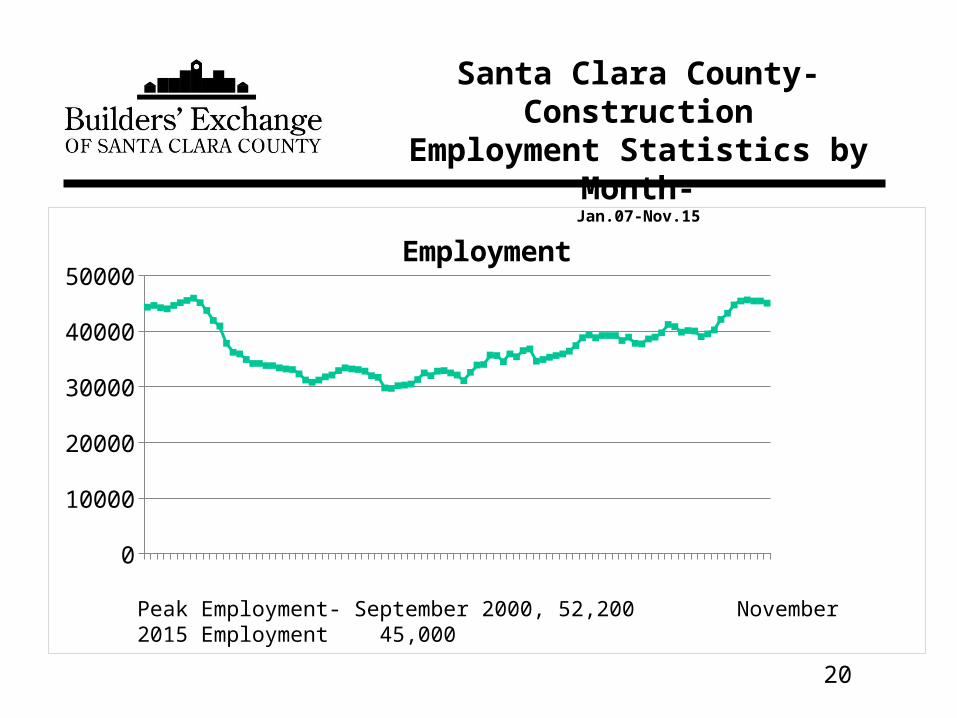
Santa Clara County-ConstructionEmployment Statistics by Month-
Jan.07-Nov.15
Peak Employment- September 2000, 52,200 November 2015 Employment 45,000
05000
100001500020000250003000035000400004500050000
Employment
21
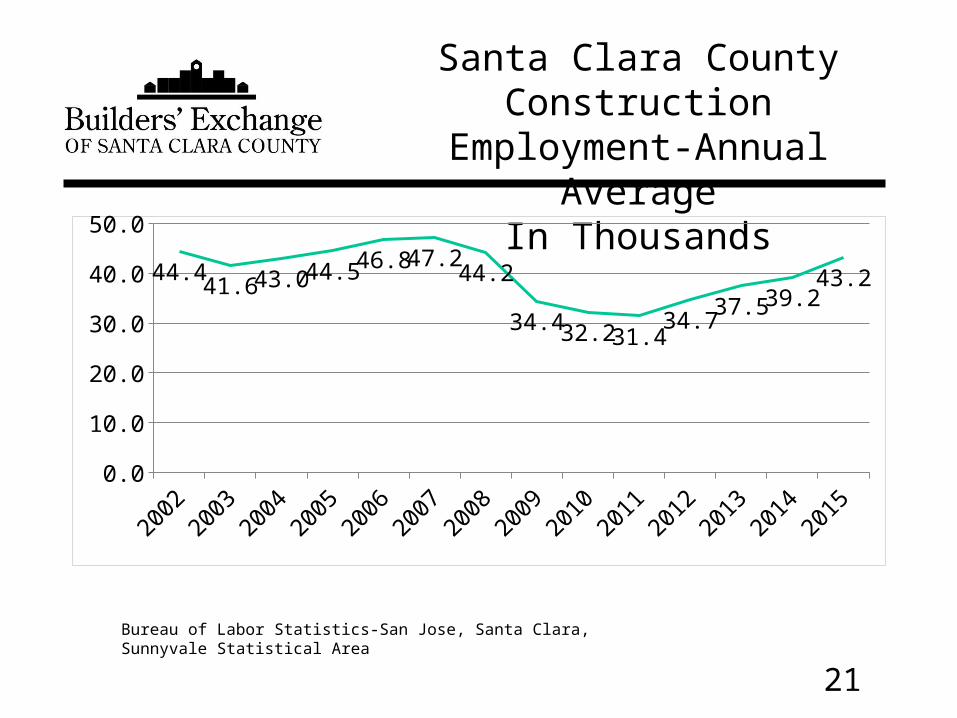
Santa Clara County Construction Employment-Annual Average
In Thousands
2002 2003 2004 2005 2006 2007 2008 2009 2010 2011 2012 2013 2014 20150.05.0
10.015.020.025.030.035.040.045.050.0
44.441.6 43.0 44.5 46.8 47.2
44.2
34.4 32.2 31.434.7
37.5 39.243.2
Bureau of Labor Statistics-San Jose, Santa Clara, Sunnyvale Statistical Area

22
Estimated California Construction Unemployment Rates %
2004 2005 2006 2007 2008 2009 2010 2011 2012 2013 2014 20150.0
5.0
10.0
15.0
20.0
25.0
30.0
7.25.2
6.9 7.8
16.9
24.2
25.2
17.4
13.8
9.1 8.56.5
Bureau of Labor Statistics

23
Bay Area Forecast-Unemployment (%)
Metro Area 2014 2015 2016 2017 2018
San Francisco 4.3 3.5 3.1 2.9 2.7
San Jose 5.3 4.2 3.9 3.5 3.4
Oakland 6.0 4.9 4.5 4.1 3.9
California 7.5 6.3 5.7 5.3 5.1
Eberhardt School of Business, September 2015, Metro Forecast

24
Largest Metro Private Economies 2015
San Jo
seAust
in
Grand R
apids
San A
ntonio
Portlan
d
Tampa
Riversi
de
Charlo
tte
Nashvil
le
Orland
o
US Ave
0123456
4.8 4.4 4.1 4 4 3.8 3.6 3.6 3.5 3.5
2.3
1 Year Employment Growth (%)

25
Other Trends
•An average of 40,000 new Construction jobs will be created each year over the next five year forecast. By 2020, Construction jobs will still remain 30,000 jobs shy of the peak in the mid 2000’s.1
•Construction material prices fell for the sixth consecutive month in December, losing 1.2 percent on a monthly basis and 4 percent on a yearly basis. Construction input prices have fallen 7.2 percent since peaking in August 2014, and have fallen in eleven of the previous sixteen months. industry has recovered just 30% of the 2.2 million jobs it lost during the sub-prime mortgage crisis from 2006 to 2010. In 2015, however, it gained jobs at more than twice the rate of the overall labor market. 3
•According to the Wall Street Journal, Santa Clara County fully recovered from the recession in 2015 based on four metrics-GDP, Jobs Recovered, Unemployment Rate and Home Prices•Wells Fargo Construction Optimism Quotient for 2016 is 108, down from a high of 130 in 2015. Lowest number was 42 in 2009.4
•Total available space in the Silicon Valley now measures 23.8 million square feet, translating into an overall availability rate of 7.2% for all product types throughout the Valley.5
1 Eberhardt Economic Forecast, Sept. 30, 20152 ABC Press Release, Jan. 15, 20163 Wall Street Journal Economics Blog, Jan. 12, 20164 Wells Fargo Construction Industry Forecast 2016.5“Valley Party Isn’t Over,” Feb. 19, San Jose Mercury News, p. B7