2016 citozen's committee for children of new york - community risk ranking
TRANSCRIPT

C I T I Z E N S ’ C O M M I T T E E F O R C H I L D R E N O F N E W YO R K
Community Risk RankingChild Well-being in New York City’s 59 Community Districts
December 2016

Data can be a powerful tool in capturing the conditions within a community. For more than 20 years, CCC has been collecting and analyzing data on the well-being of children in New York City. With the Community Risk Ranking, we look at 18 different indicators across six domains of child well-being—economic security, housing, health, education, youth, and family and commu-nity—to determine where risks to child well-being are concentrated. We then rank New York City’s 59 community districts from highest to lowest risk, within each domain and overall, and place community districts into one of five risk catego-ries: highest risk, moderate-high risk, moderate risk, moderate-low risk, and lowest risk.
The risk ranking tells us basic things about child well-being in New York City, while also raising questions that we at CCC—and we hope users of the risk ranking—will explore further. The first thing one might notice when looking at the overall risk ranking map is that communities that rank highest risk tend to cluster in upper Manhattan, the south Bronx and central Brooklyn. The ability to identify where risks concentrate is important, as research tells us that multiple risk factors have cumulative negative effects on child development and child well-being. As we discuss later, this geographic concentration of risk reveals significant disparities in child well-being across racial and ethnic lines.
On the specific domain pages, we see the vast disparities that exist between communities that rank highest and lowest risk. The child poverty rate in Brownsville (K16) is more than 20 times the child poverty rate in Murray Hill/Stuyvesant (M06). In Mott Haven (B01), the teen birth rate is nearly 30 times higher than in Battery Park/ Tribeca (M01). These disparities exist within nearly every indicator in every domain.
The risk ranking also shows how risks are in-terrelated. In many cases, community districts that rank high risk in one domain are high risk in several others. Of the ten community districts in the highest risk category in the overall ranking, four—Mott Haven (B01), Hunts Point (B02), East Tremont (B06), and Brownsville (K16)—are in the highest risk category in five out of the six domains. The rankings across domains for these and other community districts underscore the multiple challenges children and families face.
There are, however, instances where risk levels are not consistent across domains. These situations require a deeper level of analysis to determine why districts seem to be thriving in some areas, but struggling in others. For exam-ple, Central Harlem (M10) ranks as one of the 15 highest risk districts in every domain with the ex-ception of housing, where it is ranked #38, falling within the moderate-low risk category. Williams-burg/Greenpoint (K01) ranks as relatively low risk in every domain with the exception of economic security, where it is ranked #11, falling in the moderate-high risk category.
CCC Community Risk Ranking: Child Well-Being in New York City’s 59 Community Districts
levels of risk
In each domain and overall, we have ranked New York City’s 59 community districts from highest risk (#1) to lowest risk (#59).
1 59Highest
RiskModerate High Risk
Moderate Risk
Moderate Low Risk
Lowest Risk

Citizens’ Committee for Children of New York, Inc. 1
To help users better understand the risk rank-ings, we have included a series of community district profiles that dig deeper into a communi-ty district’s ranking in a given domain. We look more closely at the data that informs a commu-nity district’s ranking, and examine trends over time to see why risk levels might have changed.
The risk ranking tells us which communities are facing the greatest level of risk to child well-being, and in which issue areas—economic security, housing, health, education, youth, family and community—those risks are most prevalent. We also hope it raises as many ques-tions as it answers. For example, what contrib-utes to a community district being ranked low risk in the health domain while being among the highest risk in the economic security and hous-ing domains? What might influence improved outcomes in a community district over time? What is working to ameliorate or address risk in community districts that can be replicated in other parts of the city? To answer these ques-tions, CCC will be using the risk ranking analysis to inform qualitative work within communities, including talking to service providers and resi-dents about the needs and resources available to them. We are also bringing the risk ranking online—as part of our Keeping Track database—along with a new asset mapping tool that will allow users to overlay community resources onto the risk ranking maps. These features will allow users to identify potential areas where community resources are—or are not—meeting the needs of a community and impacting risk levels.
We hope the Community Risk Ranking will inspire more work that attempts to explain why things are the way they are, and identify solutions that will improve outcomes in commu-nities facing the greatest risks to well-being, so that all children in New York City have the opportunities they deserve to be healthy, housed, educated and safe.
Community Risk Ranking Domains and Indicators
▼ ECONOMIC SECURITY ▼
Child Poverty RateMedian Income for
Families with ChildrenParental Employment Instability
▼ HOUSING ▼
Rent BurdenRental Overcrowding
Families Entering Homeless Shelters
▼ HEALTH ▼
Infant Mortality RateLow Birth Weight Babies
Children without Health Insurance
▼ EDUCATION ▼
Early Education EnrollmentElementary and Middle School
Reading and Math Test Pass RateHigh School Graduation Rate
▼ YOUTH ▼
Teen Birth RateTeen Idleness
Youth Unemployment
▼ FAMILY AND COMMUNITY ▼
Children in Single-Parent FamiliesAdults without a High School Degree
Violent Felony Rate
To explore these and other indicators of child well-being in New York City, visit
data.cccnewyork.org.
2 CCC Community Risk Ranking
HIGHEST RISK COMMUNITY
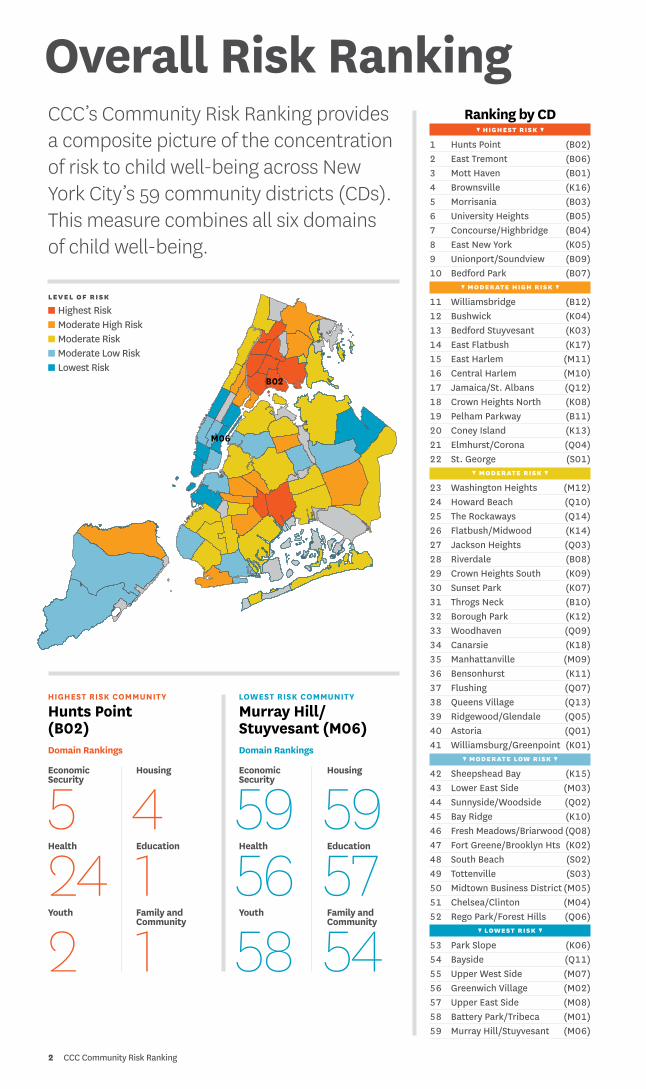
Hunts Point (B02) Domain Rankings
Economic Security
5Health
24 Youth
2
Housing
4 Education
1Family and Community
1
LOWEST RISK COMMUNITY
Murray Hill/ Stuyvesant (M06) Domain Rankings
Economic Security
59Health
56Youth
58
Housing
59Education
57Family and Community
54
CCC’s Community Risk Ranking provides a composite picture of the concentration of risk to child well-being across New York City’s 59 community districts (CDs). This measure combines all six domains of child well-being.
Overall Risk RankingRanking by CD
▼ highest risk ▼
1 Hunts Point (B02)2 East Tremont (B06)3 Mott Haven (B01)4 Brownsville (K16)5 Morrisania (B03)6 University Heights (B05)7 Concourse/Highbridge (B04)8 East New York (K05)9 Unionport/Soundview (B09)10 Bedford Park (B07)
▼ moderate high risk ▼
11 Williamsbridge (B12)12 Bushwick (K04)13 Bedford Stuyvesant (K03)14 East Flatbush (K17)15 East Harlem (M11)16 Central Harlem (M10)17 Jamaica/St. Albans (Q12)18 Crown Heights North (K08)19 Pelham Parkway (B11)20 Coney Island (K13)21 Elmhurst/Corona (Q04)22 St. George (S01)
▼ moderate risk ▼
23 Washington Heights (M12)24 Howard Beach (Q10)25 The Rockaways (Q14)26 Flatbush/Midwood (K14)27 Jackson Heights (Q03)28 Riverdale (B08)29 Crown Heights South (K09)30 Sunset Park (K07)31 Throgs Neck (B10)32 Borough Park (K12)33 Woodhaven (Q09)34 Canarsie (K18)35 Manhattanville (M09)36 Bensonhurst (K11)37 Flushing (Q07)38 Queens Village (Q13)39 Ridgewood/Glendale (Q05)40 Astoria (Q01)41 Williamsburg/Greenpoint (K01)
▼ moderate low risk ▼
42 Sheepshead Bay (K15)43 Lower East Side (M03)44 Sunnyside/Woodside (Q02)45 Bay Ridge (K10)46 Fresh Meadows/Briarwood (Q08)47 Fort Greene/Brooklyn Hts (K02)48 South Beach (S02)49 Tottenville (S03)50 Midtown Business District (M05)51 Chelsea/Clinton (M04)52 Rego Park/Forest Hills (Q06)
▼ lowest risk ▼
53 Park Slope (K06)54 Bayside (Q11)55 Upper West Side (M07)56 Greenwich Village (M02)57 Upper East Side (M08)58 Battery Park/Tribeca (M01)59 Murray Hill/Stuyvesant (M06)
level of risk
n Highest Risk n Moderate High Riskn Moderate Riskn Moderate Low Riskn Lowest Risk
B02
M06

Citizens’ Committee for Children of New York, Inc. 3
Below, we take a closer look at Hunts Point, which is ranked highest risk in the overall ranking for the fifth straight year, and Murray Hill/Stuyvesant, which ranks as the lowest risk community district in this year’s overall ranking.
Murray Hill/Stuyvesant (M06)Murray Hill/Stuyvesant in Manhattan ranks #59 in overall risk, making it the community dis-trict with the lowest level of risk for children in New York City. Just over 7 percent—or around 10,600—of the community district’s residents are children, the smallest share of children in the city. By comparison, 21 percent of the population citywide are children. Nearly seven out of ten residents in the community district are white, 16 percent are Asian, 8 percent are Latino, and 3 percent are black.
Murray Hill/Stuyvesant is ranked lowest risk in both the economic security and housing domains, and is among the five lowest risk community districts in the health, education and youth domains. It has the lowest rates of child poverty, parental employment instability, adults without a high school diploma, and children without health insurance out of the city’s 59 community districts.
CHILD POPULATION BY COMMUNITY DISTRICT
% OF TOTAL POPULATION UNDER 18
n 26.7–37.4 n 22.1–26.6n 17.3–22.0n 11.9–17.2n 7.4–11.8
Community District M06 Child Population: 10,608Child share of total population: 7.4%
Community District B02Child Population: 17,717Child share of total population: 29.2%
Hunts Point (B02)For the fifth straight year, Hunts Point in the Bronx is ranked #1 in the overall risk ranking, making it the community district with the highest level of risk for children in New York City. There are over 17,000 children in Hunts Point, repre-senting nearly three out of every ten residents in the district. The share of population under the age of 18 is among the highest across community districts. Two-thirds of residents are Latino, and nearly one-third are black.
Hunts Point has among the poorest outcomes in the city for several indicators used in our risk rankings; for example, over half of children are growing up in poverty and only one-third of stu-dents graduate from Hunts Point high schools. As a result, it is in the highest risk category in every domain with the exception of health, where there has been some improvement in recent years. The infant mortality rate and share of low birth-weight babies have both declined, moving Hunts Point from moderate-high risk the previous two years to moderate risk in this year’s rankings in the health domain. The infant mortality rate has declined from 8.7 infant deaths per 1,000 live births in 2012, to 6.0 in 2014. And the share of low birthweight babies has decreased from a high of 11 percent in 2009 to 8 percent in 2014.
RACIAL/ETHNIC BREAKDOWN BY GEOGRAPHY
n White n Black n Asian n Latino n Other
0.00.10.20.30.40.50.60.70.8
M06B02 NEW YORK CITY0%20%20%30%40%50%60%70%80%
32%
70%
1%
31%
1% 1%
67%
3%
16%8% 4%
22%14%
29%
3%

4 CCC Community Risk Ranking
Black, Latino or white children represent a majority—over 50 percent of the child popula-tion—in 34 of the city’s 59 community districts. In many other districts, the combined black and Latino child population is well over 50 percent. Our analysis reveals that black and Latino children are disproportionately exposed to higher levels of risk.
Nine of the ten commu-nity districts designat-ed as highest risk have child populations that are at least 50 percent black or 50 percent Latino, and the lone exception—East New York (K05)—has a child population that is a combined 94 percent black and Latino. In the
12 community districts ranked moderate-high risk, eight have either black or Latino majorities and three others have combined black and Lati-no child populations over 50 percent. Of the 22 community districts in the highest or moderate high-risk categories in our overall ranking, only Coney Island (K13) has a child population that is less than 50 percent black and Latino.
On the other side of the spectrum, of the seven community districts designated as lowest risk, six have a child population that is more than 50 percent white. Of the 11 community districts in the moderate-low risk category, three commu-nity districts have white majorities. In the re-maining community districts within these lower risk categories, there is no racial/ethnic majority among children, and the combined black and Latino child population is not above 50 percent in any of them. In other words, of the 35 districts where more than half of the child population is black or Latino, none ranked in the lowest or moderate-low risk categories for overall risk.
While New York City’s child population is incred-ibly diverse, clear population patterns emerge when looking at level of risk to child well-being. Despite being roughly a quarter of New York City’s child population, white children make up 61 percent of children living in community dis-tricts falling in the lowest risk category. Blacks and Latinos—who make up 58 percent of the city’s child population—are 94 percent of the population living in community districts in the highest risk category. Black children represent just 2 percent of the child population in the com-munity districts designated as lowest risk, and 8 percent in community districts categorized as moderate-low risk.
Overall Risk RankingHow Risk and Race Are Tied TogetherNew York City is home to the largest—and among the most diverse—child populations in the United States. Of the nearly 1.8 million children in New York City, 12 percent are Asian, 23 percent are black, 35 percent are Latino, and 26 percent are white. However, these citywide statistics do not reflect the reality in many of the city’s community districts, where there are clear majorities of a particular racial or ethnic group.
Of the 35 districts where more than half of the child population is black or Latino, none ranked in the lowest or moderate-low risk categories for overall risk.

Citizens’ Committee for Children of New York, Inc. 5
Overall Risk Rankinglevel of risk
n Highest Risk n Moderate High Riskn Moderate Riskn Moderate Low Riskn Lowest Risk
Race/Ethnicity of Childrenn Black or Latino majorityn No majority black + Latino > 50%n No majority black + Latino < 50%n White majority
Race/ethnicity of Children by Overall Risk Categoryn White n Black n Asian n Latino n Other
HIGHEST RISK COMMUNITY DISTRICTS
2.1%
35.0%
2.5%
58.9%
1.5%
MODERATE HIGH RISK COMMUNITY DISTRICTS
11.5%
40.1%
8.0%
36.1%
4.4%
MODERATE RISK COMMUNITY DISTRICTS
30.0%
18.0%15.2%
32.7%
4.1%
LOWEST RISK COMMUNITY DISTRICTS
60.5%
1.7%
14.2%
14.2%
9.4%
MODERATE LOW RISK COMMUNITY DISTRICTS
47.4%
7.7%
18.4%
21.6%
5.0%

6 CCC Community Risk Ranking
HIGHEST RISK COMMUNITY
Brownsville (K16)Child Poverty Rate
52.8%Median Income, Families w/ Children
$24,144Parental Employment Instability
56.9%
LOWEST RISK COMMUNITY
Murray Hill/ Stuyvesant (M06)Child Poverty Rate
2.3%Median Income, Families w/ Children
$199,946Parental Employment Instability
10.2%
Ranking by CD▼ highest risk ▼
1 Brownsville (K16)2 University Heights (B05)3 Morrisania (B03)3 East Tremont (B06)5 Mott Haven (B01)5 Hunts Point (B02)7 East Harlem (M11)8 Unionport/Soundview (B09)9 Coney Island (K13)10 Concourse/Highbridge (B04)
▼ moderate high risk ▼
11 Williamsburg/Greenpoint (K01)12 Borough Park (K12)13 Bedford Park (B07)14 Bedford Stuyvesant (K03)15 Central Harlem (M10)16 Lower East Side (M03)17 East New York (K05)18 Bushwick (K04)19 St. George (S01)20 Washington Heights (M12)21 Crown Heights North (K08)22 Manhattanville (M09)23 Riverdale (B08)24 Astoria (Q01)25 Flatbush/Midwood (K14)26 Sunset Park (K07)27 Elmhurst/Corona (Q04)28 Williamsbridge (B12)29 East Flatbush (K17)30 Pelham Parkway (B11)
▼ moderate risk ▼
31 Crown Heights South (K09)32 Bensonhurst (K11)33 The Rockaways (Q14)34 Jamaica/St. Albans (Q12)35 Canarsie (K18)36 Bay Ridge (K10)37 Jackson Heights (Q03)38 Howard Beach (Q10)39 Fort Greene/Brooklyn Hts (K02)40 Woodhaven (Q09)41 Sheepshead Bay (K15)42 Ridgewood/Glendale (Q05)43 Flushing (Q07)44 Sunnyside/Woodside (Q02)45 Chelsea/Clinton (M04)45 Midtown Business District (M05)47 Tottenville (S03)48 Throgs Neck (B10)
▼ moderate low risk ▼
49 Fresh Meadows/Briarwood Q08)50 Queens Village (Q13)51 Bayside (Q11)52 South Beach (S02)53 Rego Park/Forest Hills (Q06)
▼ lowest risk ▼
54 Park Slope (K06)55 Battery Park/Tribeca (M01)55 Greenwich Village (M02)57 Upper West Side (M07)58 Upper East Side (M08)59 Murray Hill/Stuyvesant (M06)
Children’s well-being is tied closely to the economic security of their families and communities. This domain illustrates whether children live in households where resources are adequate to meet their basic material needs. Indicators: Child Poverty, Median Household Income for Families with Children, Parental Employment Instability
Above, we see the stark differences between the communities that rank highest and lowest risk in the economic security domain. Children in Brownsville are nearly 23 times more likely to live in poverty, and the median income for families with children is nearly $176,000 less than in Murray Hill/Stuyvesant.
level of risk
n Highest Risk n Moderate High Riskn Moderate Riskn Moderate Low Riskn Lowest Risk
Economic Security
M06
K01
K16
K13

Citizens’ Committee for Children of New York, Inc. 7
Below, we take a closer look at Williamsburg/Greenpoint, where poor outcomes in one neighborhood are driving the district’s risk ranking in economic security, and Coney Island, which experienced a significant increase in risk level in the economic security domain this year.
Williamsburg/Greenpoint (K01)Williamsburg/Greenpoint is in the lowest risk or moderate-low risk category in every domain, with the exception of economic security, where it is ranked #11 (moderate-high risk). Williamsburg/Greenpoint has the 13th highest child poverty rate in the city, along with low household incomes and high rates of parental employment instability.
However, one out of the community district’s four neighborhoods is leading to the higher risk designation in the economic security domain. As the map below shows, child poverty rates vary widely when looking within the Williamsburg/Greenpoint community district, with the neigh-borhood of Williamsburg experiencing extremely high rates of child poverty compared to other neighborhoods. Similarly, income and employ-ment are much lower in Williamsburg than in the community district’s other neighborhoods. It should be noted that the child population of Williamsburg is almost equal to the combined child population of the other three neighbor-hoods in the district. While poor outcomes in Williamsburg impact the risk ranking for the Williamsburg/Greenpoint community district in the economic security domain, this does not seem to be occurring in the other domains.
WILLIAMSBURG/GREENPOINT BY NEIGHBORHOOD
Number Child Median Employ- of Children Poverty Family ment Rate Income Rate*Greenpoint 3,217 12.5% $80,235 69.7%Northside-Southside 8,857 39.5% $49,034 69.7%East Williamsburg 4,311 28.3% $46,164 62.4%Williamsburg 15,025 64.1% $24,197 45.8%All K01 31,410 47.0% $46,490 64.2%
*it is not possible to obtain the parental employment instability rate byneighborhood, so we use the overall employment rate for this analysis.
CHILD POVERTY RATE IN WILLIAMSBURG/GREENPOINT
n 42.1%–71.8% n 28.1%–42% n 20.8%–28% n 10.5%–20.7% n 0%–10.4%
Coney Island (K13) After four consecutive years of being ranked moderate risk in the overall risk ranking, Coney Island in Brooklyn fell into the moderate-high risk category with a rank of #20 this year. This is largely due to an increase in risk in the economic security domain; Coney Island ranked #9 in risk in the economic security domain this year, after falling between #22 and #31 in previous years. The median income for families with children has been declining gradually over the past five years, and the child poverty and parental employment instability rates had dramatic increases from 2013 to 2014. The child poverty rate increased to 45 percent after hovering around 31 percent the previous three years. The parental employ-ment instability rate—the share of children in families where no parent worked full-time in the last year—increased from 24 percent in 2013 to over 50 percent in 2014. Interestingly, when we look at additional data, we see that employment overall in the district did not decrease, but there were changes in employment among families with children. For example, in 2013 among mar-ried-couple families with children, 81 percent of householders worked full-time, year-round; in 2014, that number dropped to 59 percent. Householders and their spouses were far more likely to work part-time or part-year.
MEDIAN INCOME FOR FAMILIES WITH CHILDREN (2014 $)
n K13 n Brooklyn n New York City
CHILD POVERTY AND PARENTAL EMPLOYMENT INSTABILITY IN CONEY ISLAND
n Child Poverty Rate n Parental Employment Instability
North Side South Side
Greenpoint
East WilliamsburgWilliamsburg
20000
30000
40000
50000
60000
$20,000
$30,000
$40,000
$50,000
$60,000
2009 2010 2011 2012 2013 2014
0.0
0.1
0.2
0.3
0.4
0.5
0.6
2009 2010 2011 2012 2013 20140%
10%
20%
30%
40%
50%
60%

8 CCC Community Risk Ranking
HIGHEST RISK COMMUNITY
University Heights (B05) Rent Burden
42.5%Rental Overcrowding
17.2%Families Entering Homeless Shelters
9.5
LOWEST RISK COMMUNITY
Murray Hill/ Stuyvesant (M06)Rent Burden
17.2%Rental Overcrowding
2.6%Families Entering Homeless Shelters
0.2
Ranking by CD▼ highest risk ▼
1 University Heights (B05)2 Morrisania (B03)3 Concourse/Highbridge (B04)4 Hunts Point (B02)5 East Tremont (B06)6 Mott Haven (B01)7 Borough Park (K12)
▼ moderate high risk ▼
8 East New York (K05)9 Elmhurst/Corona (Q04)10 Brownsville (K16)11 Bedford Park (B07)12 Sunset Park (K07)13 Williamsbridge (B12)14 Bedford Stuyvesant (K03)15 Unionport/Soundview (B09)16 Jackson Heights (Q03)
▼ moderate risk ▼
17 Jamaica/St. Albans (Q12)18 Flatbush/Midwood (K14)19 St. George (S01)20 Flushing (Q07)21 East Flatbush (K17)22 Bushwick (K04)23 Bay Ridge (K10)24 Howard Beach (Q10)25 Bensonhurst (K11)26 Crown Heights South (K09)27 Washington Heights (M12)28 Fresh Meadows/Briarwood (Q08)29 Pelham Parkway (B11)30 The Rockaways (Q14)31 Coney Island (K13)32 Crown Heights North (K08)33 East Harlem (M11)34 Sheepshead Bay (K15)35 Riverdale (B08)36 Woodhaven (Q09)37 Sunnyside/Woodside (Q02)
▼ moderate low risk ▼
38 Central Harlem (M10)39 Williamsburg/Greenpoint (K01)40 Tottenville (S03)41 Manhattanville (M09)42 Queens Village (Q13)43 Canarsie (K18)44 Ridgewood/Glendale (Q05)45 South Beach (S02)
▼ lowest risk ▼
46 Astoria (Q01)47 Rego Park/Forest Hills (Q06)48 Bayside (Q11)49 Throgs Neck (B10)50 Fort Greene/Brooklyn Hts (K02)51 Lower East Side (M03)52 Park Slope (K06)53 Chelsea/Clinton (M04)54 Midtown Business District (M05)55 Battery Park/Tribeca (M01)56 Greenwich Village (M02)57 Upper West Side (M07)58 Upper East Side (M08)59 Murray Hill/Stuyvesant (M06)
A safe and stable home environment is key to children’s healthy development. The housing domain contains indicators that measure housing affordability, condi-tions and stability within a community. Indicators: Rent Burden, Rental Overcrowding, Families Entering Homeless Shelters
Above, we see that more than four out of ten households in University Heights—ranked highest risk in the housing domain— spend at least half of their income on rent. And 9.5 out of every 1,000 families entered a homeless shelter in 2014, compared to only 1 out of every 5,000 families in Murray Hill/Stuyvesant.
level of risk
n Highest Risk n Moderate High Riskn Moderate Riskn Moderate Low Riskn Lowest Risk
Housing
K11
K04
B05
M06

Citizens’ Committee for Children of New York, Inc. 9
Below, we look at Bushwick, where fewer families are entering homeless shelters than in previous years, leading to an improved risk ranking in the housing domain, and Bensonhurst, where housing has become the domain with the highest level of risk in the community.
Bushwick (K04)Bushwick’s rank in the housing domain has been consistently improving, going from #4 in 2009 to #22 in 2014. Housing is now the lowest risk do-main for the community district, which ranks #12 in overall risk. Rent burden rates have remained relatively steady, but significant decreases in families entering homeless shelters and rental overcrowding have led to an improvement in the level of housing risk. However, as the map below shows, rental overcrowding remains an issue, particularly in the northern part of the community district. The rental overcrowding rate in Bushwick North is 20 percent, compared to 12 percent in Bushwick South.
When we look at additional data on possible contributing factors, we see that Bushwick has undergone a significant shift in racial/ethnic demographics over the last ten years. In 2005, 4 percent of residents were white and 72 percent were Latino; in 2014, 17 percent of residents were white and 59 percent were Latino. The data tell us that white households in Bushwick experience less overcrowding, so the improvement in rental overcrowding rates may be partly explained by the changing demographic composition within the community district.
RENTAL OVERCROWDING IN BUSHWICK
n 22.7%–32.1% n 17.7%–22.6% n 13%–17.6% n 9.1%–12.9% n 5.4%–9%
RENTAL OVERCROWDING RATES
n White n Latino
Bensonhurst (K11)Bensonhurst has become increasingly high risk in the housing domain, going from a rank of #40 (moderate-low risk) in 2009 to a rank of #24 (moderate risk) in 2014. For two years in a row, housing has been the domain with the highest level of risk for the community district. Rates of family homelessness have remained very low, but rent burden and rental overcrowding rates have increased in the last five years. One-third of households were paying more than 50 percent of their income on rent in 2014, compared to 22 percent in 2009. And 17 percent of rental house-holds were overcrowded in 2014, compared to 10 percent in 2009. The racial/ethnic make-up of the community has also changed dramatical-ly in the last ten years. In 2005, 63 percent of residents were white and 26 percent were Asian; in 2014, 44 percent of residents were white and 40 percent were Asian. Data tell us that Asian households in Bensonhurst are slightly more likely to be rent burdened compared to white households, and are twice as likely to experience rental overcrowding, suggesting that changing demographics may play a role in the increased rate of rental overcrowding in Bensonhurst.
RENT BURDEN AND RENTAL OVERCROWDING IN BENSONHURST
n Rental Overcrowding n Rent Burden
RENTAL OVERCROWDING RENT BURDEN
n White n Asian n White n Asian
Bushwick North
Bushwick South
0.00
0.05
0.10
0.15
0.20
0.25
0.30
0.35
2009 2010 2011 2012 2013 20140%5%10%15%20%25%30%35%
0.00
0.05
0.10
0.15
0.20
0.25
0.30
0.000.050.100.150.200.250.300.350.40
K11 BROOKLYN NYC K11 BROOKLYN NYC
30%
25%
20%
15%
10%
5%
0%
40%35%30%25%20%15%10%5%0%
0.00
0.05
0.10
0.15
0.20
K04 BROOKLYN NYC
20%
15%
10%
5%
0%
8.6%
19.2%
9.1%
17.8%
5.4%
16.0%

10 CCC Community Risk Ranking
HIGHEST RISK COMMUNITY
Brownsville (K16) Infant Mortality Rate
6.1Low Birthweight Babies
11.6%Children Without Health Insurance
6.4%
LOWEST RISK COMMUNITY
Borough Park (K12)Infant Mortality Rate
1.9Low Birthweight Babies
5.4%Children Without Health Insurance
1.2%
Ranking by CD▼ highest risk ▼
1 Brownsville (K16)2 Jamaica/St. Albans (Q12)3 Crown Heights North (K08)4 Williamsbridge (B12)5 East Flatbush (K17)6 East Tremont (B06)7 Howard Beach (Q10)
▼ moderate high risk ▼
8 Pelham Parkway (B11)9 East New York (K05)10 Coney Island (K13)11 Morrisania (B03)12 Queens Village (Q13)13 St. George (S01)14 The Rockaways (Q14)15 Central Harlem (M10)16 Unionport/Soundview (B09)17 East Harlem (M11)18 Throgs Neck (B10)
▼ moderate risk ▼
19 Bushwick (K04)20 University Heights (B05)21 Mott Haven (B01)22 Concourse/Highbridge (B04)23 Canarsie (K18)24 Hunts Point (B02)25 Flatbush/Midwood (K14)26 Flushing (Q07)27 Sunnyside/Woodside (Q02)28 Bedford Park (B07)29 Elmhurst/Corona (Q04)30 Woodhaven (Q09)
▼ moderate low risk ▼
31 Manhattanville (M09)32 Chelsea/Clinton (M04)33 Riverdale (B08)34 Fort Greene/Brooklyn Hts (K02)35 Fresh Meadows/Briarwood (Q08)36 Crown Heights South (K09)37 Midtown Business District (M05)38 Jackson Heights (Q03)39 Rego Park/Forest Hills (Q06)40 South Beach (S02)41 Upper East Side (M08)42 Bensonhurst (K11)43 Astoria (Q01)44 Bayside (Q11)45 Bedford Stuyvesant (K03)46 Tottenville (S03)47 Sheepshead Bay (K15)48 Washington Heights (M12)49 Ridgewood/Glendale (Q05)50 Upper West Side (M07)51 Bay Ridge (K10)52 Lower East Side (M03)
▼ lowest risk ▼
53 Battery Park/Tribeca (M01)54 Park Slope (K06)55 Williamsburg/Greenpoint (K01)56 Murray Hill/Stuyvesant (M06)57 Greenwich Village (M02)58 Sunset Park (K07)59 Borough Park (K12)
A child’s physical, mental and emotional health is critical to his or her overall well-being. The health domain contains indicators that reflect both health outcomes and access to healthcare. Indicators: Infant Mortality Rate, Low Birthweight Babies, Children without Health Insurance
Above, we see that infants are over three times more likely to die before their first birthday in Brownsville, which ranks highest risk in the health domain, compared with Borough Park, which ranks lowest risk. Geographically, the two districts are separated by a little over three miles.
level of risk
n Highest Risk n Moderate High Riskn Moderate Riskn Moderate Low Riskn Lowest Risk
Health
M12
K16
K12

Citizens’ Committee for Children of New York, Inc. 11
Below, we look at Washington Heights, which has experienced significant improvement in the health domain thanks in large part to more children having health insurance, and Borough Park, which ranks lowest risk in the health domain despite poor outcomes in the economic security and housing domains.
Washington Heights (M12)Washington Heights has improved dramatically in the health domain, going from a rank of #22 (moderate risk) in 2009 to a rank of #48 (mod-erate-low risk) in 2014. Health is the lowest risk domain for Washington Heights, which ranks among the 21 highest risk community districts in every other domain and ranks #23 (moderate risk) in the overall risk ranking.
The infant mortality rate in Washington Heights is below the citywide average but has not improved since 2009, as it has citywide and in many other districts. And the share of low birthweight babies has remained relatively steady, increasing only minimally. However, Washington Heights has made significant progress in reducing the share of children without health insurance. In 2012, 8.5 percent of children did not have health insurance, the second highest rate in the city. In 2013 and 2014, that number had been reduced to less than one percent, among the lowest rates in the city.
WASHINGTON HEIGHTS RISK RANKINGS BY DOMAIN
2014 Risk Risk Domain Ranking CategoryEconomic Security 20th Moderate High RiskEducation 13th Moderate High RiskHealth 48th Moderate Low RiskHousing 17th Moderate RiskYouth 21st ModerateFamily and Community 17th Moderate RiskOverall 23rd Moderate Risk
RISK RANKING IN HEALTH DOMAIN— WASHINGTON HEIGHTS
Borough Park (K12)Borough Park ranks as the lowest risk community district in the health domain this year, and has ranked among the five lowest risk districts in health each of the past five years. This is the case despite Borough Park being ranked in the mod-erate-high risk category in economic security and in the highest risk category in housing, two areas where poor outcomes can impact health. Interestingly, Borough Park is also in the lowest risk category in the Family and Community do-main, where it has the lowest rate of children in single-parent families.
Borough Park has among the best outcomes in the city for each of the indicators we look at to measure risk in the health domain. The infant mortality rate has been reduced from 3.6 deaths per 1,000 births in 2009—18th highest in the city—to 1.9 in 2014. The share of low birthweight babies has been between 5 and 6 percent the last five years, always among the lowest rates in the city. And the share of children without health insurance has also been consistently low, be-tween 1 and 3 percent. Borough Park joins Battery Park/Tribeca (M01) and Williamsburg/Greenpoint (K01) as the only districts ranked in the lowest risk category in the health domain in each of the past five years.
LOW BIRTHWEIGHT BABIES AND CHILDREN WITHOUT HEALTH INSURANCE
n K12 n Brooklyn n New York City
INFANT MORTALITY RATE
n K12 n Brooklyn n New York City
0
10
20
30
40
50
60
2009
22
2010
31
2011 2012 2013 20140102030405060
17
45 48
25
0
1
2
3
4
5
0
5
4
3
2
1
1.9
3.84.5
0.00
0.02
0.04
0.06
0.08
0.10
LOW BIRTHWEIGHT BABIES CHILDREN W/OUT HEALTH INSURANCE
10%
8%
6%
4%
2%
0%
5.4%
7.4%8.2%
1.2%
3.3% 3.4%

12 CCC Community Risk Ranking
HIGHEST RISK COMMUNITY
Hunts Point (B02) Early Education Enrollment
50.7%ELA/Math Test Pass Rate
9.6%/13.2%High School Graduation Rate
33.8%
LOWEST RISK COMMUNITY
Battery Park/Tribeca (M01)Early Education Enrollment
83.1%ELA/Math Test Pass Rate
57.6%/66.3%High School Graduation Rate
76.8%
Ranking by CD▼ highest risk ▼
1 Hunts Point (B02)2 Mott Haven (B01)3 Unionport/Soundview (B09)4 Brownsville (K16)5 East Tremont (B06)6 Concourse/Highbridge (B04)
▼ moderate high risk ▼
7 Morrisania (B03)8 East New York (K05)9 Bedford Park (B07)10 Bushwick (K04)11 Elmhurst/Corona (Q04)12 Ridgewood/Glendale (Q05)13 Washington Heights (M12)14 Central Harlem (M10)15 Pelham Parkway (B11)16 Bedford Stuyvesant (K03)17 Woodhaven (Q09)18 Howard Beach (Q10)19 Williamsbridge (B12)20 Jamaica/St. Albans (Q12)21 University Heights (B05)22 Throgs Neck (B10)
▼ moderate risk ▼
23 St. George (S01)24 Jackson Heights (Q03)25 East Flatbush (K17)26 Canarsie (K18)27 Crown Heights North (K08)28 Flushing (Q07)29 Queens Village (Q13)30 Borough Park (K12)31 Astoria (Q01)32 East Harlem (M11)33 Sunset Park (K07)34 Riverdale (B08)35 Bensonhurst (K11)36 Manhattanville (M09)37 The Rockaways (Q14)38 Coney Island (K13)39 Crown Heights South (K09)40 Flatbush/Midwood (K14)
▼ moderate low risk ▼
41 Sheepshead Bay (K15)42 Sunnyside/Woodside (Q02)43 Williamsburg/Greenpoint (K01)44 Lower East Side (M03)45 Fresh Meadows/Briarwood (Q08)46 Tottenville (S03)47 South Beach (S02)48 Bay Ridge (K10)49 Park Slope (K06)50 Rego Park/Forest Hills (Q06)51 Fort Greene/Brooklyn Hts (K02)52 Chelsea/Clinton (M04)53 Midtown Business District (M05)
▼ lowest risk ▼
54 Greenwich Village (M02)55 Bayside (Q11)56 Upper West Side (M07)57 Murray Hill/Stuyvesant (M06)58 Upper East Side (M08)59 Battery Park/Tribeca (M01)
Quality educational programming is critical for children’s academic and social development. The indicators in the education domain provide data along the developmental continuum from early education to high school completion. Indicators: Early Education Enrollment, Elementary and Middle School Reading and Math Test Pass Rate, High School Graduation Rate
Above, we see the vast disparities in educational outcomes between Hunts Point, ranked highest risk in the education domain, and Battery Park/Tribeca, ranked lowest risk. These disparities exist at every level of education, from pre-school through high school graduation.
level of risk
n Highest Risk n Moderate High Riskn Moderate Riskn Moderate Low Riskn Lowest Risk
Education
M10
M01
Q14
B02

Citizens’ Committee for Children of New York, Inc. 13
Below, we look at Central Harlem, where declining early education enrollment and high school graduation rates have moved it into the moderate-high risk category, and the Rockaways, which has improved dramatically in the education domain over the last five years.
Central Harlem (M10)In previous years of the risk ranking data, the education domain had been something of a bright spot for Central Harlem, which is ranked #16 in this year’s overall ranking and is regularly in the moderate-high risk category. In 2009, for example, Central Harlem ranked #15 in overall risk, but was only #39 in the education domain. However, Central Harlem is #14 in the education domain in this year’s rankings, moving it to the moderate-high risk category.
Early education enrollment in the district is right around the city average, but declined to 65 per-cent in 2014 from a high of 74 percent in 2010. The graduation rate has also been declining over the past five years; it was 13 points above the citywide rate in 2009, but 6 points below it in 2014. ELA pass rates for 3rd-8th graders have always been below the citywide average, but are now among the lowest in the city; the Math pass rate has been the lowest in the city for two years in a row. These factors have all combined to move Central Harlem from the moderate risk to moderate-high risk category in the education domain.
HIGH SCHOOL GRADUATION RATE
n M10 n Manhattan n New York City
MATH AND ELA TEST PASS RATES
n M10 n Manhattan n New York City
The Rockaways (Q14)The Rockaways have made significant gains in the education domain, going from the highest risk category in 2009 and 2010, to the moderate- high risk category the following three years, to the moderate risk category in this year’s rankings. There has been a significant increase in early education enrollment, from 50 percent of 3-and 4-year-olds enrolled in early education programs in 2009 to 65 percent enrolled in 2014. While English Language Arts and Math test scores have been relatively steady—slightly below the citywide average—there has been a big jump in the graduation rate, from 51 percent of students graduating within four years in 2009 to 70 per-cent in 2014. The borough and citywide gradua-tion rates have improved during that time, but the improvement has been more pronounced in the Rockaways.
RISK RANK IN EDUCATION DOMAIN— THE ROCKAWAYS
EARLY EDUCATION ENROLLMENT AND HIGH SCHOOL GRADUATION IN THE ROCKAWAYS
n Early Education Enrollment n HS Graduation Rate
0.4
0.5
0.6
0.7
0.8
2009 2010 2011 2012 2013 2014
80%
70%
60%
50%
40%
0
10
20
30
40
50
2009
8
2010
11
2011 2012 2013 201401020304050
2429
37
18
0.4
0.5
0.6
0.7
0.8
2009 2010 2011 2012 2013 2014
80%
70%
60%
50%
40%
0.000.050.100.150.200.250.300.350.40
ELA MATH
13.5%
34.8%
28.4%
12.8%
39.8%34.2%
40%
30%
20%
10%
0%

14 CCC Community Risk Ranking
HIGHEST RISK COMMUNITY
Mott Haven (B01) Teen Birth Rate
34.8Teen Idleness
20.7%Youth Unemployment
24.3%
LOWEST RISK COMMUNITY
Battery Park/Tribeca (M01)Teen Birth Rate
1.2Teen Idleness
2.0%Youth Unemployment
10.6%
Ranking by CD▼ highest risk ▼
1 Mott Haven (B01)2 Hunts Point (B02)3 Bedford Park (B07)4 University Heights (B05)5 Brownsville (K16)
▼ moderate high risk ▼
6 Morrisania (B03)7 Concourse/Highbridge (B04)8 East Tremont (B06)9 Bedford Stuyvesant (K03)10 Unionport/Soundview (B09)11 East New York (K05)12 Central Harlem (M10)13 Williamsbridge (B12)14 Flatbush/Midwood (K14)15 Bushwick (K04)
▼ moderate risk ▼
16 Jamaica/St. Albans (Q12)17 East Flatbush (K17)18 Throgs Neck (B10)19 Crown Heights North (K08)20 Crown Heights South (K09)21 Washington Heights (M12)22 Pelham Parkway (B11)23 Riverdale (B08)24 The Rockaways (Q14)25 Coney Island (K13)26 St. George (S01)27 Ridgewood/Glendale (Q05)28 East Harlem (M11)29 Sunset Park (K07)30 Sheepshead Bay (K15)31 Howard Beach (Q10)32 Astoria (Q01)33 Jackson Heights (Q03)
▼ moderate low risk ▼
34 Williamsburg/Greenpoint (K01)35 Elmhurst/Corona (Q04)36 Canarsie (K18)37 Woodhaven (Q09)38 Fort Greene/Brooklyn Hts (K02)39 Borough Park (K12)40 Bensonhurst (K11)41 Queens Village (Q13)42 Bay Ridge (K10)43 Flushing (Q07)44 Park Slope (K06)45 Rego Park/Forest Hills (Q06)46 Fresh Meadows/Briarwood (Q08)47 Manhattanville (M09)48 South Beach (S02)49 Sunnyside/Woodside (Q02)
▼ lowest risk ▼
50 Lower East Side (M03)51 Upper West Side (M07)52 Tottenville (S03)53 Chelsea/Clinton (M04)54 Midtown Business District (M05)55 Bayside (Q11)56 Upper East Side (M08)57 Greenwich Village (M02)58 Murray Hill/Stuyvesant (M06)59 Battery Park/Tribeca (M01)
The period between childhood and adulthood presents a unique set of challenges for young people and their families. The youth domain focuses on specific risks that children and youth face as they transition to adulthood. Indicators: Teen Birth Rate, Teen Idleness, Youth Unemployment
Above, we see the challenges faced by young people in Mott Haven, which ranked highest risk in the youth domain, compared to Battery Park/Tribeca, which ranked lowest risk. Teen girls are 29 times more likely to have a baby; and 16-19 year olds are much more likely to be out of school and out of the labor force.
level of risk
n Highest Risk n Moderate High Riskn Moderate Riskn Moderate Low Riskn Lowest Risk
Youth
B01M11
M01
K14

Citizens’ Committee for Children of New York, Inc. 15
Below we look at East Harlem, which improved its ranking considerably in the youth domain after years in the moderate-high risk category, and Flatbush/Midwood, which has become increasingly high risk in the youth domain.
East Harlem (M11)For the sixth year in a row, East Harlem ranks in the moderate-high risk category in the overall ranking, but has improved its ranking in the youth domain. After being ranked #6 in the youth domain in 2010, East Harlem ranked #28 this year, falling into the moderate risk category. The improvement is due in large part to a significant reduction in the teen birth rate, from 57.1 births per 1,000 teenage girls in 2009 to 27.4 births per 1,000 teenage girls in 2014. While the teen birth rate has dropped considerably citywide during that time, it has decreased at a faster rate in East Harlem. Youth unemployment has also decreased in East Harlem from 19.9 percent in 2009 to 13.8 percent in 2014. Citywide, the unemployment rate among 20-24 year olds has increased in that time. It is worth noting that additional data tell us that fewer young people in East Harlem are looking for work, which could be contributing to the lower unemployment rate.
TEEN BIRTH RATE (BIRTHS PER 1,000 TEENAGE GIRLS)
n M11 n Manhattan n New York City
YOUTH UNEMPLOYMENT RATE
n M11 n Manhattan n New York City
Flatbush/Midwood (K14)From 2009 to 2014, Flatbush/Midwood has gone from a rank of #33 (moderate-low risk) to a rank of #14 (moderate-high risk) in the youth domain. The youth domain is the only domain where the community district has experienced such a dramatic change in ranking. In Flatbush/Midwood, the teen birth rate increased from 2009 to 2012 before returning to its 2009 level in 2014; by com-parison, in Brooklyn and New York City as a whole, the teen birth rate has been steadily declining and was significantly lower in 2014 than it was in 2009. The share of teens who are not in school or the labor force (teen idleness rate) decreased slightly from 2013 to 2014 in Flatbush/Midwood, but was still nearly four points higher than in 2009, and higher than the borough and citywide rate. While the youth unemployment rate has increased borough and citywide, it has increased more dramatically in Flatbush/Midwood, from 14 percent in 2009 to 25 percent in 2014.
TEEN BIRTH RATE (BIRTHS PER 1,000 TEENAGE GIRLS)
n K14 n Brooklyn n New York City
YOUTH UNEMPLOYMENT RATE
n K14 n Brooklyn n New York City
CHANGE IN RISK RANKING FOR FLATBUSH/MIDWOOD BY DOMAIN 2009 2014 ChangeYouth #33 #14 -19Economic Security #22 #25 +3Housing #17 #18 +1Education #42 #40 -2Health #30 #25 -5Family and Community #35 #35 0Overall #28 #26 -2
10
20
30
40
50
60
2009 2010 2011 2012 2013 2014
60
50
40
30
20
10
0
0
5
10
15
20
25
30
35
2009 2010 2011 2012 2013 2014
35302520151050
0.00
0.05
0.10
0.15
0.20
0.25
0.30
2009 2010 2011 2012 2013 2014
30%
25%
20%
15%
10%
5%
0%
0.10
0.15
0.20
0.25
2009 2010 2011 2012 2013 2014
25%
20%
15%
10%
5%
0%

16 CCC Community Risk Ranking
HIGHEST RISK COMMUNITY
Hunts Point (B02) Children in Single-Parent Families
71.7%Adults Without a High School Degree
40.4%Violent Felony Rate
10.3
LOWEST RISK COMMUNITY
Upper East Side (M08)Children in Single-Parent Families
13.1%Adults Without a High School Degree
2.9%Violent Felony Rate
1.1
Ranking by CD▼ highest risk ▼
1 Hunts Point (B02)2 East Tremont (B06)3 Mott Haven (B01)4 Morrisania (B03)5 Concourse/Highbridge (B04)6 University Heights (B05)7 East New York (K05)8 Brownsville (K16)
▼ moderate high risk ▼
9 East Harlem (M11)10 Bedford Park (B07)11 Unionport/Soundview (B09)12 Bedford Stuyvesant (K03)13 Bushwick (K04)14 Williamsbridge (B12)15 Central Harlem (M10)
▼ moderate risk ▼
16 East Flatbush (K17)17 Washington Heights (M12)18 The Rockaways (Q14)19 Jackson Heights (Q03)20 Crown Heights North (K08)21 Lower East Side (M03)22 Jamaica/St. Albans (Q12)23 Elmhurst/Corona (Q04)24 Manhattanville (M09)25 Sunset Park (K07)26 Crown Heights South (K09)27 Coney Island (K13)28 Pelham Parkway (B11)
▼ moderate low risk ▼
29 Howard Beach (Q10)30 Throgs Neck (B10)31 Riverdale (B08)32 St. George (S01)33 Woodhaven (Q09)34 Midtown Business District (M05)35 Flatbush/Midwood (K14)36 Canarsie (K18)37 Fort Greene/Brooklyn Hts (K02)38 Bensonhurst (K11)39 Sunnyside/Woodside (Q02)40 Astoria (Q01)41 Williamsburg/Greenpoint (K01)42 Ridgewood/Glendale (Q05)43 Chelsea/Clinton (M04)44 Queens Village (Q13)45 Flushing (Q07)46 Sheepshead Bay (K15)47 Bay Ridge (K10)
▼ lowest risk ▼
48 Borough Park (K12)49 South Beach (S02)50 Fresh Meadows/Briarwood (Q08)51 Park Slope (K06)52 Rego Park/Forest Hills (Q06)53 Greenwich Village (M02)54 Murray Hill/Stuyvesant (M06)55 Upper West Side (M07)56 Bayside (Q11)57 Tottenville (S03)58 Battery Park/Tribeca (M01)59 Upper East Side (M08)
Children’s development is greatly influenced by the families and communi-ties that surround them. The indicators in the family and community domain capture critical influences in children’s environments. Indicators: Children in Single-parent Families, Adults Without a High School Degree, Violent Felony Rate
Above, we see that children in Hunts Point, ranked highest risk in the family and community domain, are 5.5 times more likely to live in a single-parent household compared to children in the Upper East Side. Hunts Point also experiences far higher rates of crime and has far more adults without a high school degree.
level of risk
n Highest Risk n Moderate High Riskn Moderate Riskn Moderate Low Riskn Lowest Risk
Family and Community
B01 B02
M08

Citizens’ Committee for Children of New York, Inc. 17
Below, we look more closely at the Upper East Side, which is consistently among the lowest risk districts overall and in the family and community domain, and Mott Haven, which consistently ranks among the highest risk community districts both overall and in the family and community domain.
Upper East Side (M08)For the fifth consecutive year, the Upper East Side ranks as the lowest risk community district in the family and community domain. It also ranks among the five lowest risk community districts in overall risk and in every domain with the ex-ception of health. In 2014, only 3 percent of adult residents on the Upper East Side lacked a high school diploma, the second lowest rate in the city. The share of children in families headed by a single parent was only 13 percent, the fifth lowest rate in the city, and the violent felony rate of 1.1 violent felonies per 1,000 residents was the third lowest rate in the city. The Upper East Side has consistently had either the lowest or among the lowest rates in these indicators over the last five years.
EDUCATIONAL ATTAINMENT AND HOUSEHOLD TYPE
n M08 n Manhattan n New York City
VIOLENT FELONY RATE
n M08 n Manhattan n New York City
Mott Haven (B01)Mott Haven ranks #3 this year in the family and community domain, after ranking #2 when ex-amining each of the past five years. It has ranked among the four highest risk districts overall the past five years, and is consistently in the highest risk category in several domains. Though the share of adults without a high school diploma has decreased over the last five years—from 47 percent in 2009 to 40 percent in 2014—it still had the highest rate of adults without a high school diploma in the city. Mott Haven also had the second highest rate of children in single- parent households at 72 percent; 2014 was the first year it did not have the highest rate in that category (it was surpassed by Brownsville). Though the violent felony rate has dropped from 10.0 violent felony crimes reported per 1,000 residents in 2010 to 8.6 in 2014, that is still the 8th highest violent felony rate in the city.
EDUCATIONAL ATTAINMENT AND HOUSEHOLD TYPE
n B01 n Bronx n New York City
VIOLENT FELONY RATE
n B01 n Bronx n New York City
0.000.050.100.150.200.250.300.350.40
ADULTS WITHOUT A HSD
2.9%
13.2%19.5%
36.4%
CHILDREN IN SINGLE PARENT FAMILIES
40%
30%
20%
10%
0%
38.2%
13.1%
0
2
4
6
8
10
12
2009 2010 2011 2012 2013 2014
12
10
8
6
4
2
0
0.00.10.20.30.40.50.60.70.8
ADULTS WITHOUT A HSD CHILDREN IN SINGLE PARENT FAMILIES
80%
70%
40%
20%
0%
40.4%29.5%
19.5%
60.9%
38.2%
71.7%
0
1
2
3
4
5
6
2009 2010 2011 2012 2013 2014
6
5
4
3
2
1
0
18 CCC Community Risk Ranking
*In the inaugural year of the Community Risk Ranking publication, we ranked community districts from lowest risk (# 1) to highest risk (#59). In this and future editions of the Community Risk Ranking, while our method for calculating risks and weighting of indicators did not change, we felt it more appropriate to label the highest risk community district as #1 and lowest risk as #59.
Indicator Criteria CCC based the following indicator criteria on best practices for composite well-being index construction, combined with CCC’s institutional knowledge of the unique issues impacting child well- being in New York City. See references for more information on other well-being indices that informed our work.
• Data must be from a reliable source
• Data must be reliable and comparable at the NYC community district, borough, and city levels
• Data should be available on an annual basis with a reasonable assumption that it will be available (and comparable) in the future
• Indicators should include measurements of well-being for children, families, and the communities in which they live
• All stages of child and youth development should be represented, as well as the conditions that may affect children and youth in those various stages
• Indicators should be easily understandable and replicable
• Indicators should be normalized, i.e. data should be presented as percentages, rates, etc. which take into account variations in population sizes across geographies
• Disaggregation of indicators by racial/ethnic group at the citywide level is preferred for further citywide analysis, but not a mandatory condition for selection
• Comparability to states, other large U.S. cities, and the nation is preferred for further comparison purposes, but not a mandatory condition for selection
Indicator Definitions, Notes, and Sources Following is a detailed descrip-tion and source information for the indicators included in the CCC Community Risk Ranking, grouped by domain. Indicators that are presented as rates per population are calculated using population data from the U.S. Census Bureau’s American Community Survey 1-Year Estimates, unless otherwise stated. Best efforts were made to collect data from roughly the same time period in order to provide a “snap-shot” of risks to child well-being at a given point in time. Data presented in this report are primarily from calendar year 2014. For some indicators, where sample sizes or numbers of events were small, data from the three-year period (2012-2014) or five-year period (2010-2014) were used to provide more reliable estimates. Such instances are noted below. Educational outcome data are for the 2014 school year, rather than calendar year 2014, and data for families entering homeless shel-ters is for fiscal year 2014.
Notes on Methodology, Indicator Definitions, and Sources

Citizens’ Committee for Children of New York, Inc. 19
Economic ConditionsChild Poverty Rate—The share of children who live in households with incomes below the federal poverty level. At the heart of under-standing the economic conditions faced by New York City’s children and families is whether children live in households with enough resources to provide the basic necessities. While not a perfect metric, the poverty rate as measured by the federal poverty level provides a reliable and consistent indicator of income adequacy. Child poverty rates are available through the Census Bureau at a variety of geographic levels and disaggregated by racial and ethnic groups. Source: U.S. Census Bureau, American Community Survey 1-Year Estimates (2014), Summary Table S1701. http://factfinder.census.gov/.
Median Income for Families with Children—The median annual income for families with children. Median income provides another reliable and consistent measure of family resources. This measure includes the income of every resident in a household over the age of 15, and is considered a reliable indicator of a household’s economic condi-tion. Median incomes are available through the Census Bureau at a variety of geographic levels and disaggregated by racial and ethnic groups. Source: U.S. Census Bureau, American Community Survey 5-Year Estimates (2010-2014), Summary Table S1903. http://factfinder. census.gov/.
Parental Employment Instability—The share of children living in house-holds where neither the householder nor a spouse worked full-time in the last year. In a vast majority of cases, this refers to the child’s parents. The parental employment instability measure adds yet another layer to our understanding of the economic conditions faced by families with children. Even if they earned a reasonable income, families with unstable employment situations may face additional economic stressors, such as the need to find additional (supplemental or new) employment and the lack of stabilizing benefits like employer-provided health insurance and sick leave. Information on parental employment status is available through the Census Bureau at a variety of geographic levels and
disaggregated by racial and ethnic groups. Source: U.S. Census Bureau, American Community Survey 1-Year Estimates (2014), Public Use Micro-data Sample File. http://factfinder.census.gov/.
Health
Infant Mortality Rate—The number of babies who died within one year of birth per 1,000 babies born in that year. The infant mortality rate is widely used as a proxy for overall health and well-being. High infant mortality rates often signal problems in healthcare provision and access, while low infant mortality rates sug-gest that quality medical care is both available and accessed by residents of a given area. Local infant mortality rates for New York City are available through the New York City Depart-ment of Health and Mental Hygiene. Because of small numbers of events in some geographies, 3-year averages are used. Infant mortality data can be disaggregated by racial and ethnic groups. Nationally, the Centers for Disease Control and Prevention provides statistics at the state and local levels on infant mortality rates. Source: New York City Department of Health and Mental Hygiene, Summary of Vital Statistics, 3-year data aver-ages (2012-2014).
Low Birth Weight Babies—The share of babies born weighing less than 2,500 grams. This indicator quantifies a major risk factor that is measurable at birth. Like the infant mortality rate, this measure may reflect the quality and accessibility to medical (especially prenatal) care for a par-ticular population. It also indicates how many babies may be at risk for other medical problems both during infancy and throughout their devel-opment. Local statistics on low birth weight babies for New York City are available through the New York City Department of Health and Mental Hygiene and can be disaggregated by racial and ethnic groups. Nationally, the Centers for Disease Control and Prevention provides statistics at the state and local levels on the prev-alence of low birth weight babies. Source: New York City Department of Health and Mental Hygiene, Summary of Vital Statistics (2014).
Children without Health Insur-ance—The share of children who do not have health insurance. This indicator provides a reasonable esti-mation of how many children
do not have affordable access to health care. Since 2008, health insur-ance coverage has been reported by the Census Bureau at a variety of geo-graphic levels and disaggregated by racial and ethnic groups. Source: U.S. Census Bureau, American Community Survey 1-Year Estimates (2014), Sum-mary Table B27001. http://factfinder.census.gov/.
Housing
Rent Burden—The share of house-holds that spend more than 50 percent of their annual income on rent. While imperfect, this measure provides an estimate of housing affordability within communities. Households that spend more than half of their income on rent may be at risk of losing their housing because it is (or may become) unaffordable. Data on housing costs and household income come from the Census Bureau and are available at a variety of geo-graphic levels and disaggregated by racial and ethnic groups. Source: U.S. Census Bureau, American Community Survey 1-Year Estimates (2014), Sum-mary Table B25070. http://factfinder.census.gov/.
Rental Overcrowding—The share of occupied rental housing units that have more than one person per room. This indicator provides an approxima-tion of the living conditions in a com-munity’s rental housing. Crowded conditions with little room for privacy may create stress for families and children. Rental overcrowding may also suggest greater housing insta-bility, as families settle for housing that is not sufficient for their needs or double up with other families to afford housing costs. Data on housing conditions and occupancy come from the Census Bureau and are available at a variety of geographic levels and disaggregated by racial and ethnic groups. Source: U.S. Census Bureau, American Community Survey 1-Year Estimates (2014), Summary Table B25014. http://factfinder.census.gov/.
Families Entering Homeless Shelters—The number of families entering Department of Homeless Services family shelters per 1,000 households. Another measure of housing instability, this indicator tells us how many families have actually lost their homes and entered an emergency shelter. The New York City Department of Homeless Services tracks homeless families by origin, as well as by racial and ethnic group.

20 CCC Community Risk Ranking
Data on entries to homeless shelters for other geographies outside of New York City may be available from other local agencies, although compara-bility may be an issue. Source: New York City Department of Homeless Services, unpublished data (fiscal year 2014).
Education
Early Education Enrollment— The share of 3- and 4-year-olds enrolled in early education programs (may include public or private pre-school or nursery school or child care programs). Research suggests that early education is critical to a child’s long-term academic success. Educational enrollment data come from the Census Bureau and are available at a variety of geographic levels and disaggregated by racial and ethnic groups. Source: U.S. Census Bureau, American Community Survey 5-Year Estimates (2010-2014), Summary Table S1401. http://fact-finder.census.gov/.
Elementary and Middle School Reading and Math Test Pass Rate—The share of public school children in grades 3 through 8 who pass New York State reading (English Language Arts or ELA) and math tests. Results of the state standardized reading and math tests, released annually by the New York City Department of Educa-tion (DOE), provide a performance benchmark for public elementary and middle school students that can be compared across geographies and demographic groups and over time. CCC used school-level results to aggregate data to the commu-nity-district level. New York City’s elementary and middle school test results are comparable to other New York State geographies. Nationally, elementary and middle school test results are available through indi-vidual school districts as well as the National Assessment of Educational Progress (NAEP), although compa-rability may be limited. Source: New York City Department of Education, New York State English Language Arts & Mathematics Tests Grades 3-8 School-Level Results (SY2014). http://schools.nyc.gov/ Accountabil-ity/data/TestResults/ ELAandMathT-estResults.
High School Graduation Rate— The percentage of the cohort of pub-lic school students who entered 9th grade in a given year that graduated within four years (as of June). The
high school graduation rate provides a benchmark for public school students that is comparable across geographies and demographic groups and over time, both within New York City and in other parts of the country. High school graduation rates for city public school students are reported annually by the New York City Department of Education. CCC used school-level results to aggregate data to the community-district level. In some years, certain community districts had no public high schools; in these cases, borough graduation rates were used. New York City’s graduation results are comparable to other New York State geographies. Nationally, graduation results are available through individual school districts as well as the National Center for Education Statistics (NCES), although comparability may be limited. Source: New York City Department of Education, Cohort Graduation Outcomes (SY2014). http://schools.nyc.gov/Accountabil-ity/data/GraduationDropoutReports/default.htm.
Youth
Teen Birth Rate—The number of babies born to teenage girls (ages 15 to 19) per 1,000 teenage girls. Teen-age pregnancy and births present risks for both mother and baby and also can reflect the presence of other risky behavior in teens, like unpro-tected sexual activity. The number of teen births are reported by the New York City Department of Health and Mental Hygiene through its Vital Sta-tistics program, and CCC uses popu-lation data from the American Com-munity Survey to calculate the rate per 1,000 teenage girls. Nationally, the Centers for Disease Control and Prevention provides statistics at the state and local levels on teen births. Source: New York City Department of Health and Mental Hygiene, Summary of Vital Statistics (2012-2014).
Teen Idleness—The share of teen-agers (ages 16 to 19) who are not in school and not in the labor force. These teens are sometimes called “disconnected youth,” referring to a disconnection in the transition from education to career that should occur during this critical time. Data on educational enrollment and labor force participation are reported by the Census Bureau and are available at a variety of geographic levels and disaggregated by racial and ethnic groups. Source: U.S. Census Bureau,
American Community Survey 5-Year Estimates (2010-2014), Summary Table B14005. http://factfinder. census.gov/.
Youth Unemployment—The share of young adults (ages 20 to 24) who are unemployed (in the labor force but not working). This indicator provides additional information about the critical stage where youth transition to be self-sufficient and productive adults. Young adults must secure employment in order to become financially self-sufficient and also to build skills that will lay the ground-work for successful professional careers. A high youth unemployment rate signals trouble for both young adults and the teens that will soon be entering the labor market. Data on labor force participation are reported by the Census Bureau and are avail-able at a variety of geographic levels and disaggregated by racial and ethnic groups. Source: U.S. Census Bureau, American Community Survey 5-Year Estimates (2010-2014), Sum-mary Table S2301. http://factfinder. census.gov/.
Family & Community Children in Single-Parent Families—The share of children living in families headed by a single parent. We exclude children who live with neither parent or in non-family households. This indicator is common among child well-being indices, as research suggests that children growing up in single-parent families may face elevated levels of risk. Single parents may experience the economic hard-ship of raising a family on a single income or the time constraints of bal-ancing work, family, and other com-mitments. Data on family structure are reported by the Census Bureau and are available at a variety of geo-graphic levels and disaggregated by racial and ethnic groups. Source: U.S. Census Bureau, American Community Survey 5-Year Estimates (2010-2014), Summary Table B09002. http://fact-finder. census.gov/.
Adults Without a High School Degree—The share of adults ages 25 and older who have less than a high school diploma or equivalent degree. This indicator was previously referred to as Adult Educational Attainment, but the name has been changed to provide greater clarity. This indicator serves as a proxy for human capital

Citizens’ Committee for Children of New York, Inc. 21
available in the community. Com-munity members who have achieved academic and professional success can have significant influence on the children in their community. Data on educational attainment are reported by the Census Bureau and are avail-able at a variety of geographic levels and disaggregated by racial and ethnic groups. Source: U.S. Census Bureau, American Community Survey 1-Year Estimates (2014), Summary Table C15002. http://factfinder.census.gov/.
Violent Felony Rate—The number of violent felony crimes reported per 1,000 residents. Children need safe communities in which to play and engage with the world around them. Children living in communities plagued with high crime rates may have limited places to play outside and may even face safety risks as they travel from home to school. Crimes are reported by police precinct by the New York City Police Department and CCC uses a popu-lation weighting formula to convert police precinct data to community district data. For racial and ethnic group disaggregation at the city level, arrests for violent felonies may be used. Crime data are available nationally from the FBI’s Uniform Crime Reporting system, as well as from local law enforcement agencies, although comparability may be an issue. Source: New York City Police Department, Historical New York City Crime Data (2014). http://www.nyc.gov/html/nypd/html/analysis_and_planning/historical_nyc_crime_ data.shtml
Composite Index Construction CCC’s Community Risk Ranking ranks communities based on risk within six domains of child well-being and overall using a composite index of 18 indicators, as well as indices for each of the six domains. The methodology for the construction of the indices is described below. The 18 indicators are grouped within six domains of well-being, with three indicators in each domain. Indicators in the risk ranking are first standardized using Linear Scaling Technique (LST), which calculates the difference between the value of a given Community District and that of the lowest value Community District, and divides this
number by the difference between the highest value Community District and the lowest value Community District:
Value-Min/Max-Min
Standardized values are then adjusted so that they are all scaled from low to high with regard to increasing risks to well-being. The standardized and scaled values are then averaged within their domains using equal weighting to produce domain indices for each Community District. The domains indices are averaged using equal weighting to produce an overall index of risk to well-being for each Community Dis-trict. Community Districts are then ranked based on their domain index and overall index values to identify the highest and lowest levels of risk. Community Districts are also placed into one of five risk level categories, for each domain and overall, using equal intervals of the raw index scores.
References
Below is a list of the well-being indices reviewed, followed by a list of other resources referenced in the development of the CCC community risk ranking.
Well-being Indices:
Annie E. Casey Foundation, Kids Count Index (2012-2014). http:// www.aecf.org/work/kids-count/.
Colorado Children’s Campaign, Colorado Child Well-being Index (2012-2014). http://www.colora-dokids.org/data/kidscount/well- being_index.html.
Foundation for Child Development, National and State Child Well-being Index (2004-2013). http://fcd-us. org/our-work/previous-initiatives/ child-well-being-index-cwi.
Gallup Healthways, Well-Being Index (2008-2014). http://info. healthways.com/wellbeingindex.
Organization for Economic Co- operation and Development (OECD), Better Life Index (2011-2014). http:// www.oecdbetterlifeindex.org/.
Unicef, Child Well-being in Rich Countries (April 2013). http:// www.unicef.org/policyanalysis/index_68637.html.
U.S. Census Bureau, SIPP Child Well-being Index (working, May 2012). https://www.census.gov/ hhes/socdemo/children/data/sipp/ Child_Well_Being_Index-FINAL.pdf.
Decode Inc., Youthful Cities (2014). http://www.youthfulcities.com/.
Other References and Resources:
Aryeh, A. (2009). Indicators of children’s well-being: Theory and practice in a multi-cultural perspec-tive. Dordrecht: Springer.
Brown, B., & Moore, K. (2003). Child and Youth Well-Being: The Social Indicators Field. In Handbook of Applied Developmental Science (Vol. 1, pp. 437-467). Thousand Oaks, CA: Sage Publications.
Land, K., Lamb, V., & Mustillo, S. (2001). Child and Youth WellBeing in the United States, 1975- 1998: Some Findings from a New Index. Social Indicators Research, 56(3), 241-318.
Land, K. (2012). The well-being of America’s children: develop-ing and improving the child and youth well-being index. Dordrecht: Springer.
Lippman, L. (2007). Indicators and Indices of Child Well-Being: A Brief American History. Social Indicators Research, 83(1), 39-53.
Salzman, J. (2003). Methodolog-ical Choices Encountered in the Construction of Composite Indices of Economic and Social WellBeing. Cen-ter for the Study of Living Standard
14 Wall Street, Suite 4ENew York, NY 10005(212) 673-1800www.cccnewyork.org

14 W
all S
tree
t, S
uite
4E
New
Yor
k, N
Y 10
005
( 212
) 673
-180
0w
ww
.ccc
new
york
.org
Non
-Pro
fit O
rg.
U.S.
Pos
tage
PA
IDN
ew Y
ork,
NY
Perm
it N
o. 2
883
CIT
IZE
NS
’ C
OM
MIT
TE
E F
OR
CH
ILD
RE
N O
F N
EW
YO
RK
Com
mun
ity R
isk
Rank
ing
Child
Wel
l-bei
ng in
New
Yor
k Ci
ty’s
59 C
omm
unity
Dis
tric
ts