2016 annual report - san diego · the lives of san diegans through energy and water efficiency...
TRANSCRIPT

2016 Annual ReportClimate Action Plan

Today, the world is facing tangible impacts of a changing climate — increasingly frequent heat waves, rising sea levels, and flooding — that can affect San Diego’s economy and the quality of life that we are proud of and enjoy. By engaging San Diego’s talented workforce and innovative economy, the city is committed to tackling these challenges head-on and turning them into opportunities.
The City's Climate Action Plan (or CAP) presents a bold vision for our future. By reducing our city's carbon footprint, we can ensure a clean, sustainable, thriving San Diego for generations to come. A carbon footprint is calculated by estimating greenhouse gas emissions associated with various activities. We will reduce these emissions primarily by using less carbon-based fuels and energy. The Plan — unanimously approved by a bipartisan City Council on December 15, 2015 — aims to cut our City’s carbon footprint in half by 2035.
The Climate Action Plan is based on five bold strategies that will help us achieve our targets:
1 Energy&waterefficientbuildings
2 Clean & renewable energy
3 Bicycle,walking,transit&landuse
4 Zero waste
5 Climate resilienceThe environmental challenges of the 21st Century directly affect the quality of life of all San Diegans. The City’s bold Climate Action Plan, adopted last December, is a roadmap for ensuring that we create a sustainable future serving all citizens. As a result of its implementation, this year alone San Diego directed $127 million to projects and programs that will help achieve our Climate Action Plan goals.
In addition to meeting state and federal greenhouse gas reduction targets, this report demonstrates San Diego’s commitment to protecting our environment and improving the lives of San Diegans through energy and water efficiency measures, Smart City technologies that improve access to data and city services, and investment in alternative transportation infrastructure like transit, bicycle, and pedestrian facilities. These are just some of the strategies we are utilizing to achieve our goal of cutting greenhouse gas emissions in half by 2035.
Letter from the Mayor
Successful implementation of the Climate Action Plan will help the State of California achieve its carbon footprint reduction targets and have a positive impact on our regional economy. Reducing emissions often generates cost savings through operational efficiencies, reduced maintenance, and lower utility bills. These savings keep money in residents' pockets and provide local businesses with money that they can reinvest into our economy.
Our Plan is setting the standard in the nation. It is tied to our General Plan, making it a firm commitment to do what we say we're going to do. That’s more than most cities can say. This 2016 Annual Report is just the beginning of our journey. The Climate Action Plan is a living, long-term plan. It will take time, innovation, and dedication to achieve our goals, but we are committed to seeing them through.
While we’re excited to be on the right course to our 2020 targets and beyond, there are a few things we will continue making progress on to ensure our Plan is adaptable:
• Developing new or improved sources of data to better track our progress (e.g., installing sensor technology or conducting surveys to better understand behaviors)
• Revising city policies, ordinances, and procedures to streamline implementation of the Climate Action Plan
• Evaluating new technologies, regulation, and opportunities that may not have been available when the Plan was written that will contribute to our goals
Table of Contents
Where We Are and Where We’re Headed
page 2
Energy and Water Efficiency in Buildings
page 4
Clean and Renewable Energy
page 7
Bicycle, Walking, Transit, and Land Use
page 10
Zero Waste
page 12
Resiliency
page 14
Conclusion
page 17
This report represents the first step toward improving the lives of every San Diegan and building a better future for our children. While the results of this first report are positive, we still have years of hard work ahead of us and I look forward to continuing to work with my colleagues on the City Council and in the community to achieve our goals. I am proud to present the results of this comprehensive and cohesive effort as our city rises to the task of meeting our nationally acclaimed Climate Action Plan goals.
Sincerely,
“As the largest U.S. city to adopt a 100% renewable electricity goal, San Diego’s Climate Action Plan has received national and international attention and support — demonstrating the benefits of nonpartisan climate leadership.”
Kevin L. Faulconer Mayor, City of San Diego
1
2016 Annual Report: Climate Action Plan

Where We Are and Where We’re HeadedWhat gets measured gets managed. Measuring our progress each year will tell us what’s working and where we need to adjust course. Some actions will have better-than-expected results and some will have less. Also, some efforts will take several years to implement so progress may take time. The graph to the right illustrates citywide greenhouse gas emissions – the 2010 baseline, 2015 update, and 2020 and 2035 projections.
Funding the PlanSustainability and climate action are going to require funding to build and sustain projects and initiatives associated with accomplishing our goal. In fact, $127M in new funds were committed in Fiscal Year 2017. San Diego sees this as an investment in our future. The savings we earn from these actions will be reinvested back into the city, and the costs we would incur with inaction would be much greater. Even without a Climate Action Plan, investments such as energy-efficient streetlights, solar panels, bike lanes, and trees are good for our city.
San Diego’s Greenhouse Gas Emissions
2010 Baseline 2015 Update 2020 Target 2035 Target
Communitywidegreenhouse gas emissions (MMTCO2e*)
Progressandtargets
10.8
17% below 2010baseline, ahead of 2020 target
12.9
N/A
11.0
15% below 2010 baseline
6.5
50% below 2010 baseline
*MMTCO2e – Million metric tons of carbon dioxide equivalents, a standard unit of measurement for greenhouse gas emissions *Does not include GHG emissions from air travel; shipping; off-road vehicles and equipment; existing closed landfills; other high global warming potential gases in use in the City.
Towards a Low Carbon Economy
Carbon Footprint Per Capita
San Diego Citywide Emissions
MTCO2e/$ millions Gross Domestic
Product
91
2010 2015
MTCO2e/$ millions Gross Domestic
Product
137
10 MTCO2eper year*
2.1 cars per year
7.9 MTCO2eper year*
1.6 cars per year
2010
2015
2010 Emissions (MMT CO2e) 2015 Emissions (MMT CO2e)
Electricity NaturalGas
Transportation Water Wastewater& Solid Waste
Total
3.12.6
2.12.1
7.1
0.3 0.10.4 0.3
10.8
12.9
5.8
We'repleasedtoreportSanDiego'sgreenhousegasemissionsreductionsareaheadofschedule.While we are making excellent progress (even better than anticipated in some areas), we recognize that our trajectory won't always be smooth. Changes in carbon measurements can be attributed to a few different things. Citywide actions can absolutely reduce emissions in a quantifiable way. However, other factors such as refining methodologies can also affect measurements — either positively or negatively. While we are ahead of schedule right now, we need to continue our efforts to ensure we remain on the right track.
Forecasted Business as Usual
2015 Update
2010 Baseline
Statewide Reduction Targets
Projected Citywide Results
GH
G e
mis
sion
s (M
MTC
O2e
)
Year
2010 2015 2020 2025 2030 2035
2
4
6
8
10
12
14
16
18
2010 Baseline 12.9
2015 Update10.8
Keeping on Target
3
2016 Annual Report: Climate Action Plan
2

► Advancing the Pure Water program to create an independent, drought-proof local water supply through water recycling — providing one-third of City’s water supply by 2035
► Beginning research, outreach, and development of a residential and commercial energy ordinance
► Supporting Property Assessed Clean Energy (PACE) financing to facilitate affordable residential and commercial energy and water upgrades; two additional PACE implementers authorized in 2016
► Continuing installation of City facilities energy efficiency retrofits (audits have identified 33 sites for future retrofits with estimated annual savings of 810 kW, 3,070 MWh, and $649,502)
► Installing ~14,000 energy efficient and smart outdoor lighting and streetlights
► Developing a Municipal Energy Strategy, a long-term energy vision for the City
► Launching a new round of water conservation rebates for efforts such as sustainable landscapes and rainwater harvesting
► Expanding express permitting incentives for businesses to include energy and water efficient projects
Energy and Water Efficiency in BuildingsSmarter buildings are more energy and water efficient which means savings for local businesses and residents. San Diego is dedicated to conserving energy, water, and money by upgrading our own buildings and infrastructure, and ensuring residents and businesses are able to do the same through equipment upgrades, operational changes, and data collection.
The population has increased 5% since 2010 but our carbon footprint from electricity use has gone down 17%.
Actions + Progress
Reduceenergyuseinresidentialhousing units
Reducemunicipalenergy use
Reducedailyper capita water consumption
16% reduction 5000 kWh, 300 therms
205 million kWh, 3 million therms
151 gallons per capita per day*
15% reduction in 20% of homes
15% reduction in 50% of homes
6% reduction 15% reduction 25% reduction
Reduce 11 gallons per capita
Reduce 23 gallons per capita
112 gallons per capita (16 gallon per capita reduction from corrected baseline)
As a fast-growing company, Renovate America is competing for talent with cities like San Francisco and New York. San Diego’s Climate Action Plan demonstrates that our city is forward-thinking and solutions-oriented, and it demonstrates the need for our core mission — helping property owners afford energy and water savings systems. We have been able to attract a talented and innovative team. Our employees are excited to live in a community that is showing the world you can have a vibrant economy while protecting the environment.
Josh BrockRenovate America
T E S T I M O N I A L
What We’re Working On
2010 Baseline 2015 Update 2020 Target 2035 Target
*Recent data indicates the 2010 baseline was closer to 128 gallons per capita per day. GHG reductions are based on gallons reduced, not used.
4 5
2016 Annual Report: Climate Action Plan

Our beaches, mountains, and canyons make San Diego a beautiful city. But there are brains behind our beauty. We are home to world-renowned biotech and engineering firms, leading universities generating cutting-edge research, and a highly talented workforce. The City is a sandbox full of streetlights, buildings, and even trees that can become
“smarter.” With added technology like Wi-Fi-enabled sensors, we can better monitor and manage our use of resources while increasing the functionality of our existing infrastructure. Making our city smarter supports our climate goals and leads to new business opportunities for our workforce.
Hackathon
To spur this innovation, the city partnered this year to create a Smart City Hackathon. Offering City data, climate challenges, and food, participants were able to create new solutions for city challenges. Tech firms and UC San Diego mentored the participants to help them turn ideas into marketable products and services.
The Future of Smart Cities
The Metrolab Network was launched as part of the White House’s Smart Cities Initiative in September 2015. City/university partnerships are mutually-beneficial relationships in which the university serves as a city’s R&D department and the city provides a test-bed for innovation. The City and UC San Diego formalized our partnership as one of 35 Metrolabs around the country and are now developing a work plan.
A Smart City — Where Technology, Data, and Sustainability Meet
Clean and Renewable EnergyOne of our most audacious goals is striving for 100% renewable electricity for all San Diegans by 2035. While clean and renewable energy is an excellent way to address climate change, it also leads to financial benefits: creating green jobs, encouraging investments in the clean technology sector, and long-term cost savings.
Committed to using 100% renewable electricity by 2035, one of the largest cities to set this goal
Home to 6 universities and over 80 research institutions
I M P A C T S T O R Y
Why is San Diego a Smart City?
TE
ST
IMO
NIA
L
The theme of the hackathon was to help San Diego come up with ideas for how to deliver on its Climate Action Plan. The City just released a ton of infrastructure data to the public and was interested in whether these kinds of data could be used to address some of the city’s environmental challenges. It turns out that people who are highly technically competent like to solve these kinds of problems just for fun on a weekend, basically for free.
Torben NotoNeuroscience PhD candidate
No. 2
No. 2
No. 5
in the clean tech industry among U.S. metro areas
in the nation for solar installations
in the nation’s share of engineering degree recipients
in the nation in patent intensity
No. 3
2035
2016 Annual Report: Climate Action Plan
76

San Diegans are already ahead of the game when it comes to renewable energy. In addition to achieving 35% renewable electricity on the grid in 2015 (due to the work of San Diego Gas & Electric), San Diego is ranked #2 in solar installations in the country.
Actions + Progress
Achieve 100% renewable electricity citywidethroughCommunity Choice Aggregation or another program
Increase municipal zero emissions vehicles
Convert waste collection trucks to low-emissions fuel
35% renewable electricity
157 MW of rooftop photovoltaics (solar) energy
22,098 installed photovoltaic systems
5,000 electric vehicles
11% citywide
0% zero emissions vehicles in municipal fleet
0% conversion to compressed natural gas or other alternative low emission fuel
N/A 100% renewable electricity
In progress
43 hybrids in City fleet
50% zero emissions vehicles in municipal fleet
90% zero emissions vehicles in municipal fleet
20% of waste collection fleet converted to CNG or other low- emission fuel
100% conversion from diesel to compressed natural gas or other alternative low- emission fuel for municipal solid waste collection trucks
3 CNG-powered waste collection trucks have been purchased and prepared for service
► Community Choice Aggregation feasibility study underway
► A Request for Information released in September 2016 will inform additional avenues to increase renewable energy use
► Installation of solar panels is planned for 20 City-owned sites starting in 2017, totaling approximately 7 MW
► Assisting solar photovoltaic installers with plan review and inspection process, creating solar permit templates
► Reduced solar permit processing time to two working days
► Developing a municipal fleet implementation road map to be completed late in 2017
How Clean Technology Creates JobsTackling climate change has created an opportunity for San Diego to commit to our environment while also boosting our economy. The Climate Action Plan’s five strategies will positively impact key industry sectors of the San Diego job market, within both the local and regional economy.
Utilizing workforce data from the Bureau of Labor Statistics (BLS), 74 industries in San Diego County were categorized into the five CAP strategies. These results are presented in the graph to the right, showing the total number of jobs for each strategy for the years 2010-2015.
The BLS shows San Diego’s overall regional job market has grown by 9.5% between 2010 and 2015. Job growth in industries related to climate strategies have grown at a slightly higher rate of 10.2%. This baseline analysis shows that climate-related jobs have more potential for growth than many others in the region. Continued analysis of these trends should help understand impacts of the Climate Action Plan on job growth and the economy in the future.
Key Facts
• There are currently over 800 clean technology companies in San Diego
• Clean energy has been named AS top 5 field prime for job growth in San Diego
• San Diego was ranked #2 in total solar energy installed in 2015, which translates to an increase in solar jobs
2010-2015 Jobs by Climate Action Plan Strategies
I M P A C T S T O R Y
It was really important that we install solar to not only lower our costs, but to lower our carbon footprint. We probably say to each other once a week how much we love our home because it is our safe haven, our little oasis. Because of PACE financing, we were able to make improvements and make our house exactly what we want it to be.
JohnHurrellandRichardHogan Kearny Mesa residents and PACE customers
TE
ST
IMO
NIA
L
► Working with SDG&E to site and install electric vehicle charging infrastructure on City property, multifamily housing, and disadvantaged communities
► Adding 20 new compressed natural gas refuse/recycling collection trucks that will run on landfill gas and replace diesel trucks by 2020
► Implemented two professional certification programs to save customers time and money in the permitting process
► Hosted three free seminars, allowing 54 solar PV contractors to obtain installation permits without going through plan review
2010 Baseline 2015 Update 2020 Target 2035 Target
What We’re Working On
Energy and Water Efficient Buildings
Clean and Renewable Energy
Climate Resilience
Transportation
Zero Waste
2010
111,235 109,371
2011
111,174
2012
114,338
2013
116,586
2014
122,573
2015
59,353
25,903
14,301
5,487
6,102
57,977
25,076
14,366
5,069
5,884
59,115
25,697
14,785
5,610
5,967
62,024
25,002
15,065
5,819
6,429
63,662
24,259
15,748
6,087
6,830
67,857
24,987
16,147
6,231
7,351
+ 10.2%2010–2015
Change
2016 Annual Report: Climate Action Plan
98
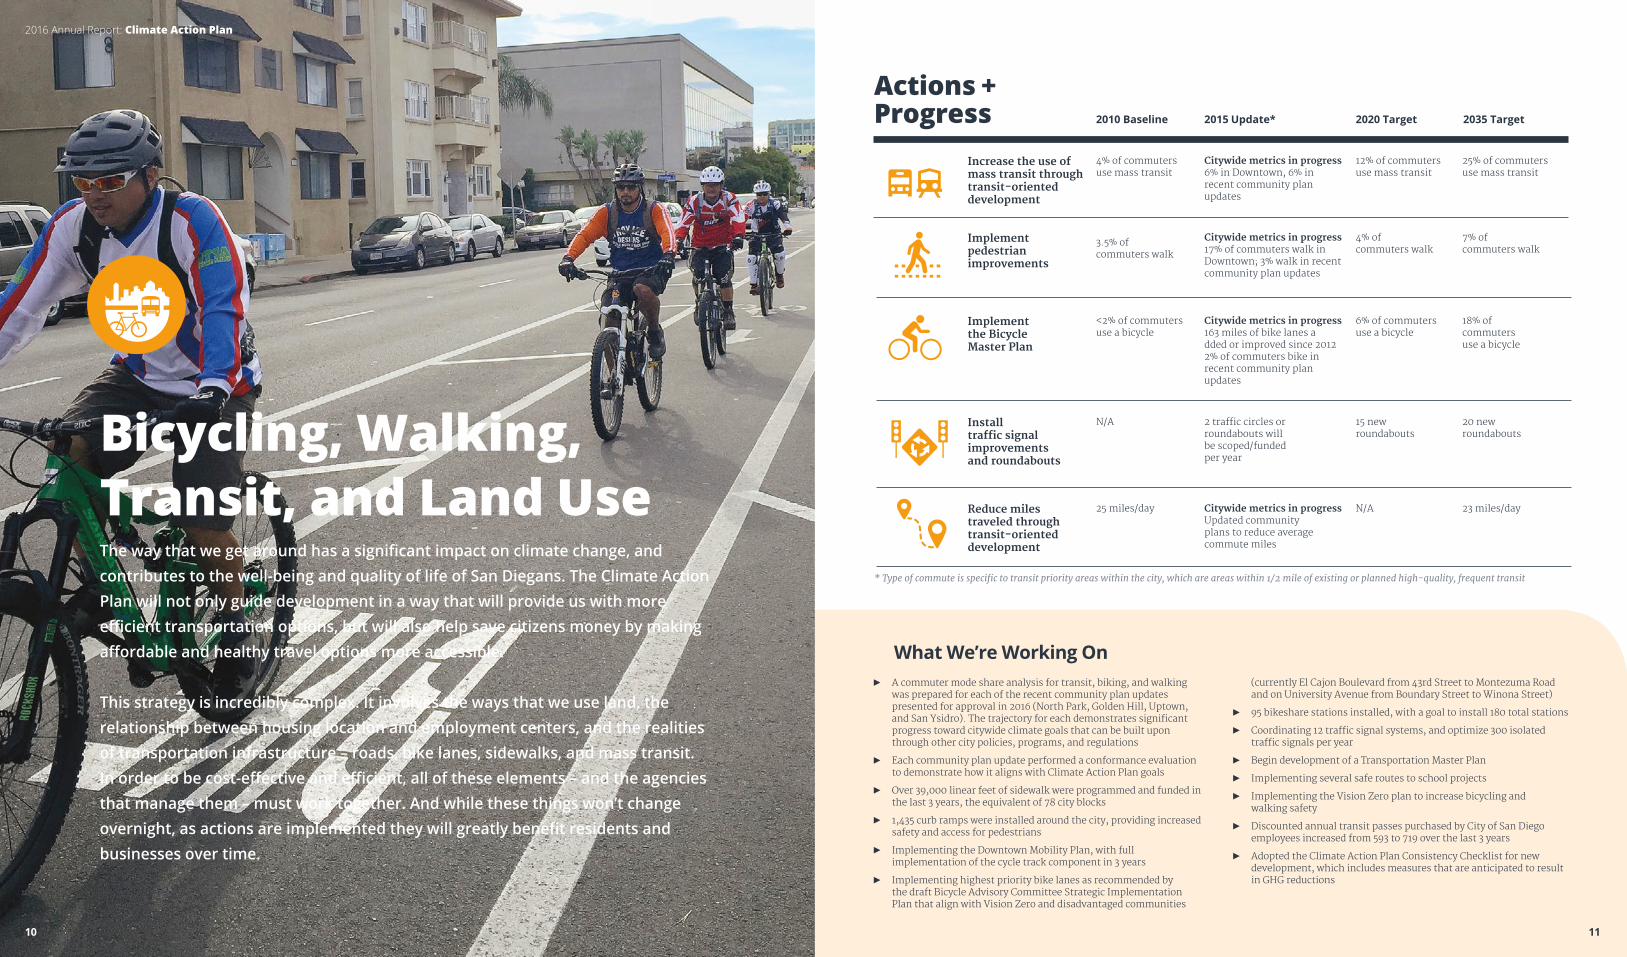
Bicycling, Walking, Transit, and Land UseThe way that we get around has a significant impact on climate change, and contributes to the well-being and quality of life of San Diegans. The Climate Action Plan will not only guide development in a way that will provide us with more efficient transportation options, but will also help save citizens money by making affordable and healthy travel options more accessible.
This strategy is incredibly complex. It involves the ways that we use land, the relationship between housing location and employment centers, and the realities of transportation infrastructure – roads, bike lanes, sidewalks, and mass transit. In order to be cost-effective and efficient, all of these elements – and the agencies that manage them – must work together. And while these things won’t change overnight, as actions are implemented they will greatly benefit residents and businesses over time.
Actions + Progress
Increase the use of mass transit through transit-orienteddevelopment
Implement pedestrianimprovements
Implement the Bicycle Master Plan
Install trafficsignalimprovements androundabouts
Reducemilestraveledthroughtransit-orienteddevelopment
Citywidemetricsinprogress6% in Downtown, 6% in recent community plan updates
4% of commuters use mass transit
3.5% of commuters walk
<2% of commuters use a bicycle
N/A
25 miles/day
12% of commuters use mass transit
25% of commuters use mass transit
Citywidemetricsinprogress 17% of commuters walk in Downtown; 3% walk in recent community plan updates
4% of commuters walk
7% of commuters walk
6% of commuters use a bicycle
15 new roundabouts
N/A
18% of commuters use a bicycle
20 new roundabouts
23 miles/day
Citywidemetricsinprogress163 miles of bike lanes a dded or improved since 20122% of commuters bike in recent community plan updates
2 traffic circles or roundabouts will be scoped/funded per year
CitywidemetricsinprogressUpdated community plans to reduce average commute miles
► A commuter mode share analysis for transit, biking, and walking was prepared for each of the recent community plan updates presented for approval in 2016 (North Park, Golden Hill, Uptown, and San Ysidro). The trajectory for each demonstrates significant progress toward citywide climate goals that can be built upon through other city policies, programs, and regulations
► Each community plan update performed a conformance evaluation to demonstrate how it aligns with Climate Action Plan goals
► Over 39,000 linear feet of sidewalk were programmed and funded in the last 3 years, the equivalent of 78 city blocks
► 1,435 curb ramps were installed around the city, providing increased safety and access for pedestrians
► Implementing the Downtown Mobility Plan, with full implementation of the cycle track component in 3 years
► Implementing highest priority bike lanes as recommended by the draft Bicycle Advisory Committee Strategic Implementation Plan that align with Vision Zero and disadvantaged communities
(currently El Cajon Boulevard from 43rd Street to Montezuma Road and on University Avenue from Boundary Street to Winona Street)
► 95 bikeshare stations installed, with a goal to install 180 total stations
► Coordinating 12 traffic signal systems, and optimize 300 isolated traffic signals per year
► Begin development of a Transportation Master Plan
► Implementing several safe routes to school projects
► Implementing the Vision Zero plan to increase bicycling and walking safety
► Discounted annual transit passes purchased by City of San Diego employees increased from 593 to 719 over the last 3 years
► Adopted the Climate Action Plan Consistency Checklist for new development, which includes measures that are anticipated to result in GHG reductions
* Type of commute is specific to transit priority areas within the city, which are areas within 1/2 mile of existing or planned high-quality, frequent transit
2010 Baseline 2015 Update* 2020 Target 2035 Target
What We’re Working On
10
2016 Annual Report: Climate Action Plan
11

Zero WasteSan Diegans spend a lot of money producing and purchasing things that just end up in the landfill. The concept of Zero Waste seeks to eliminate unnecessary waste, and put the things that we usually throw away back to work for us – through recycling, composting, reuse, resale, and other technologies.
The City of San Diego aims to divert all solid waste from going into the landfill through our Zero Waste Policy. We are also capturing the gases produced as part of trash decomposition in the landfills and turning them into energy. San Diego currently has a number of recycling programs designed to reuse materials and divert waste from the Miramar Landfill. We are creating a Resource Recovery Center and “one-stop shop” at Miramar Landfill that provides opportunities to maximize waste diversion. We will also increase curbside recycling and curbside greenery collection throughout the City, and allow kitchen scraps to be added to greenery.
Actions + Progress
Enact Zero Waste anddiverttrashfromthelandfill
Implement landfillgascollection
Capture methane from wastewater treatment
64% total solid waste diversion
52% total solid waste diversion
75% landfill gases captured
71% of methane captured
75% total solid waste diversion
90% total solid waste diversion (100% by 2040)
75% landfill gases captured
80% landfill gases captured
90% landfill gases captured
98% of methane captured
98% of methane captured
93% of methane captured and utilized
► Construction is in progress for Miramar Landfill Resource Recovery Center, which will separate organic materials for renewable energy production
► Point Loma Wastewater Treatment Plant and North City Water Reclamation Plant became self-sufficient with on-site renewable electricity generation
► West Miramar landfill gas improvement project to be completed by 2018 which will lead to over 80% gas capture efficiency
► Diverting ~11% of commercial food waste from the landfill to compost, saving 63 days of landfill space
Our City leads the way in diverting green waste from the landfill by recycling an estimated 104,000 tons of it annually at Miramar Greenery. We collect and convert it to quality compost, mulch, and wood chips that are for sale to the public. This creates revenue and saves valuable landfill space.
Ewert BurtonBiologist, City of San Diego
T E S T I M O N I A L
Waste from citywide sewage is being turned back into energy, saving about $10 million each year.
2010 Baseline 2015 Update 2020 Target 2035 Target
What We’re Working On
12 13
2016 Annual Report: Climate Action Plan

ResilienceWe’ve already begun to feel the effects of climate change – increased heat waves, more flooding, and prolonged drought. This means that we need to begin to adapt and manage further risks in order to protect our quality of life and ensure we remain a thriving, vibrant, resilient city. For example, a flooded road impacts the businesses that are dependent on it, and costs a lot of money to repair. Today, our efforts include actions such as researching strategies for rising sea levels, expanding our urban tree canopy cover, and increasing our water independence by recycling water in San Diego.
Increasing urban tree canopy cover is an explicit action in our Climate Action Plan because it provides a quantifiable carbon footprint reduction. But trees also provide many other benefits, such as:
• Increasing property values
• Shading nearby buildings and reducing energy costs from cooling
• Capturing storm water
• Improving air quality
• Creating more walkable streets
Actions + Progress
Increase urban tree canopy coverage
13% urban tree canopy cover
6.8% urban tree canopy cover
15% urban tree canopy cover
35% urban tree canopy cover
To go farther, go together Some efforts are better addressed as a group. The City of San Diego is a founding member of the San Diego Regional Climate Collaborative, an alliance between the City of San Diego and other local governments and organizations in the region. This collaborative addresses climate change research needs, technical support, and training for all public agencies in the region. Together, the region addresses these complex issues more efficiently, demonstrating what collaboration and national leadership look like.
► Planting 2,000 new trees, and maintaining and preserving existing ones
► Updating tree maintenance and preservation procedures
► Conducting urban forest inventory and analysis with the U.S. Forest Service to establish baseline assessment of all trees within the City of San Diego
► Developing greening plans for communities
► Developing Parks Master Plan that includes tree canopy growth
► Developing 20-year canopy cover implementation plan
► Continuing progress on water purification system (Pure Water Program)
► Upgrading stormwater system to increase capacity, function, and stormwater capture
► Increasing the use of green infrastructure to manage stormwater
► Continuing and expanding sea level rise and coastal flooding planning efforts in partnership with the San Diego Regional Climate Collaborative (~$700,000 in shared grant funding for 2016-17)
► Increasing brush management efforts to mitigate fire risk
► $195,000 of rebates for 2,620 rain barrels with a total capacity of 259,987 gallons were issued in 2015-16
► Over $810,000 in rebates for turf replacement were issued in 2015-16 for 575,000 square feet of sustainable landscaping and 58,000 square feet of micro-irrigation
San Diegans are preparing for climate change by planting, caring for, and learning about trees. Trees shade city streets, cool neighborhoods, and encourage walking to local shops, schools, and transit stops. And trees in schoolyards help students and teachers learn about the benefits of city trees.
AnneS.Fege,Ph.D.Chair, Community Forest Advisory Board, City of San Diego
T E S T I M O N I A L
2010 Baseline 2015 Update 2020 Target 2035 Target
What We’re Working On
2016 Annual Report: Climate Action Plan
1514

Develop new or improved sources of data
to better track our progress
(e.g., installing sensor
technology or conducting
surveys to better
understand behaviors)
Revise city policies, ordinances, and procedures
to streamline
implementation of the
Climate Action Plan
Evaluate new technologies, policies, and opportunities
that may not have been
available when the Plan
was written that can
contribute to our goals
• v
How Climate Action Creates Social EquityThere is a natural synergy that exists between climate action and social equity. The effects of climate change can disproportionately affect disadvantaged communities. It is therefore important to consider those communities while formulating and implementing solutions. Equity is fundamental for inclusive economic growth and development. A regional economy performs best when economic benefits are shared by all. When a San Diegan with a low or moderate income has better access to affordable transportation and lower utility bills, their resources can be redirected to other necessities, increasing economic activity throughout the region. By beginning to quantify the investments that bridge equity and sustainability, the City of San Diego will identify ways to implement the Climate Action Plan in an inclusive and equitable manner, and to maintain a focus on social equity throughout implementation. With this inaugural Annual Report, the City has developed pilot metrics to be used as a social equity lens in Climate Action Plan implementation. This first-year effort makes use of the City’s Community Development Block Grant (CDBG) Program, a grant program for lower income San Diegans, to test this new means of monitoring. Community stakeholders helped the City determine the best approach for collecting, quantifying, and reporting data for this pilot assessment. It is important to note that CDBG funds are just a portion of the City budget. The pilot metrics below do not represent all City actions or expenditures.
Recent Actions in Disadvantaged Communities
► Over $450,000 of Community Development Block Grant (CDBG) Program funds invested to support the installation of photovoltaic solar systems for lower income households
► $236,285 of CDBG funds allocated improvements to increase the safety and energy efficiency for San Diego’s lower income homeowners
► Over 335 improvements were completed (e.g., smoke and carbon monoxide alarms, water efficiency improvements, water heater replacements, efficient lighting upgrades, etc.)
Tony Dominguez, an 83-year old veteran and grandfather, and his family went solar this year. The new solar system is expected to save the Dominguez family over $200 a month. “Getting to the cash register at the grocery store won’t be as scary now. Truly, every little bit helps."
TonyDominguezSan Diego homeowner
T E S T I M O N I A L
We are excited about the opportunities that the Climate Action Plan will create for the future of our city. We understand that we are only at the beginning of our journey. This 2016 Annual Report is just one step toward our ultimate goal of cutting our carbon footprint by 50% by 2035. The Climate Action Plan is a long term, living plan — it will take time, innovation, and commitment to achieve our goals.
Looking Ahead
I M P A C T S T O R Y
We Will:
As we work toward the future, we will continue to refine our approach and ensure that we continue to make progress.
► $2,816,000 of CDBG funds invested in street improvements (e.g., new walkways/sidewalks, pedestrian countdown timers, traffic calming, curb ramps and traffic signal modifications) in the City’s lower income communities
► Over 9,500 solar projects planned (based on permit applications)*
► 3.6 miles of cast iron water pipes replaced*
► 13.3 miles of sewer pipeline replaced or rehabilitated*
68 photovoltaic solar systems were installed in homes owned by lower income residents
* Not funded by CDBG
2016 Annual Report: Climate Action Plan
16 17

v
For more information or data, please see the 2016 Climate Action Plan Annual Report Appendix or visit www.sandiego.gov/sustainability.
This report was partially funded by California utility ratepayers under the auspices of the California Public Utilities Commission.