2016 annual report - bot.com.t · pdf filebank of taiwan 2016 annual report published by: bank...
TRANSCRIPT


2016 ANNUAL REPORT

Bank of Taiwan 2016 Annual Report
Published by: Bank of Taiwan
Address: No. 120, Sec. 1, Chongqing S. Rd., Zhongzheng
Dist., Taipei City 10007, Taiwan (R.O.C.)
Tel: 886-2-2349-3456
Website: http://www.bot.com.tw
Date of publication: June 2017
Date of publication of the first BOT Annual Report: June 1953
E-publication: This Annual Report may be accessed on the Bank’s
website (http://www.bot.com.tw)
Cost of production: NT$635
GPN: 2004200003
ISSN: 0496-7267

CONTENTS
7 Letter to Shareholders
15 A Brief Introduction of the Bank
17 Corporate Governance Report
17 Ⅰ. Organization
19 Ⅱ. Directors, Supervisors, and Top Management
27 Ⅲ. Implementation of Corporate Governance
39 Ⅳ. CPA Information
41 Ⅴ. Numbers of Shares in the Same Reinvested Enterprises Held by the BOT and Its Directors, Supervisors, President, Executive Vice Presidents, Heads of Departments and Branches, and Enterprises Controlled Directly or Indirectly by the Bank, and Ratios of Consolidated Shareholding
43 Capital Overview
43 Ⅰ. Capital and Shares
44 Ⅱ. Issuance of Financial Bonds
45 Ⅲ. Comments on Implementation of Capital Allocation Plan
47 Operational Highlights
47 Ⅰ. Business Activities
56 Ⅱ. Human Resources
57 Ⅲ. Corporate Responsibility and Ethical Behavior
57 Ⅳ. Numbers of Non-managerial Employees, Average Annual Benefit Expenditures per Employee, and Changes from the Preceding Year
57 Ⅴ. Information Equipment
59 Ⅵ. Labor Relations

61 Financial Information
61 Ⅰ. Five-Year Financial Summary
68 Ⅱ. Five-Year Financial Analysis
76 Ⅲ. Statement by the Audit Committee
76 Ⅳ. Financial Statements of Recent Years, and Independent Auditors’ Report
194 V. Individual Financial Statements of Recent Years, and Independent Auditors’ Report
207 Review of Financial Conditions, Operating Results, and Risk Management
207 Ⅰ. Analysis of Financial Status
207 Ⅱ. Financial Performance
208 Ⅲ. Analysis of Cash Flow
209 Ⅳ. Investment Policy in Last Year
210 Ⅴ. Risk Management
220 Ⅵ. Crisis Management Mechanism
222 Special Disclosure
222 Ⅰ. Information on Affiliated Enterprises
224 Directory of Head Office and Branches
224 Ⅰ. Domestic Business Units
224 Ⅱ. Overseas Units

Letter to Shareholders
A Brief Introduction of the Bank

2016 ANNUAL REPORT
BANK FTAIWAN
76
ChairmanLyu, Jye-Cherng
BANK FTAIWAN

Letter to Shareholders
76
Letter to ShareholdersGlobal economic performance fell short of expectations in 2016 due to slow growth in global trade
and falling commodity prices. In the United States, where economic fundamentals were relatively strong, a moderate economic expansion continued, and labor markets and wages posted stable growth. In the eurozone, the European Central Bank (ECB) pursued an easy money policy that supported steady economic growth. In Japan, economic activity remained sluggish amidst weak growth in private consumption and corporate investment. In mainland China, where the economy has entered into a period of restructuring, the country is dealing with excess productive capacity, excess corporate debt, and growing uncertainty regarding foreign trade. The economy there faces many different challenges. On the whole, global economic growth was weaker in 2016 than in the previous year.
Taiwan saw its foreign trade decline due to sluggishness in the global economy and the mainland Chinese policy of pursuing supply chain self-sufficiency, which has had the effect of crowding out Taiwan suppliers. Beginning in the latter half of the year, however, exports rebounded each quarter as semiconductor markets perked up and the prices of agricultural and industrial raw materials bottomed out and began climbing once again. In addition, continued moderate growth in private consumption and fixed investment supported overall economic growth. As a result, GDP growth became stronger with each successive quarter in 2016, and the preliminary estimate of the growth rate for the year came to 1.50%, far better than the previous year’s figure of 0.72%.
Over the past year, thanks to the combined efforts of all employees, the Bank of Taiwan (BOT) ranked among the industry leaders in terms of deposits and loans, the gold and trust businesses, total assets, and shareholders’ equity. BOT was the number one lead arranger and bookrunner for syndicated loans in Taiwan. Pre-tax earnings for 2016 came to NT$19.4 billion, an outstanding figure that far exceeded the annual target. Asset quality was once again outstanding, with a non-performing loan ratio of 0.26% and a coverage ratio of 552.53%. In addition, to respond to rapidly changing conditions in the financial industry in recent years, BOT upgraded its Training Institute to a level-one unit to cultivate the talents of promising employees, and under its Department of Compliance established a Money Laundering Prevention Center to administer its system for preventing money laundering and financing of terrorism. These measures have been taken to build up a safe and legally compliant financial transactions environment.
In addition to this outstanding performance, BOT also earned numerous accolades. The bank was named a winner in the Reader’s Digest Trusted Brands survey in the “banking” category, and was the number one financial holding company or bank on Cheers magazine’s list of the “most admired companies in the new age.” Wealth magazine in 2016 handed BOT a prize for excellence in its “best digital bank” category. BOT was named a “stellar enterprise” in the Corporate Social Responsibility YearBook 2016 published by Economic Daily News, and also won the Joint Credit Information Center’s Golden Quality Award and Golden Security Award, while the Bank received the “award for best trust services” at the 8th awards for financial industry excellence of the Taiwan Academy of Banking and Finance, and the Ministry of Economic Affairs gave BOT “Direct Guarantee Outstanding Performance Award” and “Young Entrepreneur Assistance Award.” For these honors, I want to express our deepest gratitude to all of our friends and customers.

2016 ANNUAL REPORT
BANK FTAIWAN
98
PresidentWei, Jan-Lin
BANK FTAIWAN

Letter to Shareholders
98
While seeking to increase profits, BOT is also mindful of the need to fulfill its corporate social responsibility, and to give related matters due consideration during the product design phase. For example, the Bank has established charitable trusts and retirement trusts, and in 2005 launched the Guide Dog Affinity Card that has generated NT$30 million in donations to support the Taiwan Guide Dog Association. The bank includes the Equator Principles among the factors considered when evaluating loan interest rates. In addition, BOT is also quite active in community service activities. Examples include visits to children’s homes and nursing homes throughout Taiwan, donations to support relief efforts after an earthquake in Tainan City and a typhoon in Taitung County, and donations to a variety of social service institutions. BOT also joined hands with the Taiwan Guide Dog Association to organize a fair to promote concern for the blind and greater appreciation of guide dogs. In addition, the Bank also showed concern and support for the elderly by taking part in a special exhibit on ageing, holding an activity focusing on how to enjoy life to the fullest in old age, and conducting a seminar on financial planning for older adults. BOT further raised the level of its participation in corporate social responsibility activities in 2017 by holding the Bank of Taiwan Arts Festival, a series of events intended to encourage youth to engage in artistic creation. The ultimate aim is to further build up locally rooted culture and create a more beautiful society.
I. Operating Results for 2016
1. Organizational Change
(1) To expand our wealth management service network, the Bank set up two new wealth management branches in 2016—Lioujiading Branch and Rende Branch—bringing the total number of such branches to 145, nine of which are wealth management flagship branches.
(2) In order to expand operations, BOT established the Fuzhou Branch in mainland China on June 6, 2016.
2. Results of Implementation of Business Plan and Operating Strategy
Unit: NT$ Billion; US$ Billion (Foreign Exchange); %
YearMajor Operation Category 2016 2015 2016 Growth Rate
Deposits 3,880.7 3,712.6 4.53
Loans 2,332.9 2,324.8 0.35
Guarantees 78.3 80.3 (2.48)
Foreign Exchange 383.9 403.3 (4.81)
Procurement 30.8 35.2 (12.54)
Precious Metals 115.7 126.6 (8.64)
Government Employees Insurance 22.8 20.9 8.89
Agency (Insurance Brokerage) 43.6 33.1 31.63

2016 ANNUAL REPORT
BANK FTAIWAN
1110
3. Budget Implementation
The volume of deposits during the year was NT$3.88 trillion, giving a target achievement rate of 114.74%. Loans amounted to NT$2.33 trillion, for a target achievement rate of 105.38%. Foreign exchange operations undertaken in 2016 totaled US$383.85 billion, amounting to 121.33% of the target figure, and income after tax reached NT$17,649 million, achieving 268.18% of the target.
4. Revenues, Expenditures and Profits
(1) Net interest income for 2016 amounted to NT$26,035 million; non-interest income (net) totaled NT$18,658 million; bad debt expenses and reserve for guarantees amounted to NT$5,183 million, and operating expenses totaled NT$20,075 million. Income before tax reached NT$19,435 million; income tax amounted to NT$1,786 million, leaving a net income after tax of NT$17,649 million.(Preferential interest deposits for pensions and veteran benefits reduced earnings by NT$8,975 million. When the impact of these preferential interest deposits is factored out, income before tax comes to NT$28,410 million.)
(2) The year’s NT$17,649 million income after tax was NT$11,068 million more than the budgeted income of NT$6,581 million, an increase of 168.18%.
BOT held a ceremony to mark the upgrading of its Training Institute to a level-one unit at the head office. BOT Chairman Lyu Jye-Cherng and senior management from the Taiwan Financial Holdings Group were on hand for the ceremony.

Letter to Shareholders
1110
(3) Pre-tax Return on Assets (ROA) for 2016: 0.41%(When the impact of preferential interest deposits for pensions and veteran benefits is factored out, pre-tax ROA comes to 0.63%.)
(4) Pre-tax Return on Equity (ROE) for 2016: 7.34%(When the impact of preferential interest deposits for pensions and veteran benefits is factored out, pre-tax ROE comes to 10.47%.)
5. Research and Development
In response to changes in the financial environment and the needs of business development, the Bank continued collecting and analyzing information on domestic and overseas economic and financial conditions as well as the status of major domestic industries. In addition to the compilation of regular analytical reports related to economics, financial markets and major industries, special reports on important economic and financial issues related to overall banking operations were compiled on an unscheduled basis for use as reference in expanding the Bank’s business.
II. Business Plans for 2017
1. Business Strategy and Major Operating Policies
In order to act upon our corporate values and principles, BOT intends to act in accordance with its 5P business operating policy of being people-centered, portfolio-sound, performance-driven, prospection-oriented, and principle-based, and has adopted the following operating policies with an eye to achieving sustainable development and maintaining stable business operations. The Bank will:
(1) Continue cooperating with government policy by supporting industrial development and expanding the scope of services, and improving overall business performance.
(2) Strengthen the functions of the Training Institute in order to provide a diversified learning environment that is cross-sectional, cross-spatial, and cross-time, thereby raising the level of employee professionalism.
(3) Optimize credit structure; strengthen management of credit, market, operational, and legal risks; and give balanced consideration to both risks and returns.
(4) Integrate group resources in order to: build a sales platform for diversified financial products; provide a full range of financial products and services; reap the benefits of group synergy; and improve the Bank’s business prowess.
(5) Develop and provide forward-looking, value-added, practical, and sustainable financial services, taking customer needs as our starting point.
(6) Pay close attention to internal controls, internal auditing, legal compliance, and risk management; strengthen legal compliance and risk management systems; improve the Bank's AML/CFT mechanisms; and establish a healthy legal compliance culture.

2016 ANNUAL REPORT
BANK FTAIWAN
1312
2. Business Targets
The BOT’s Business Targets for 2017 were formulated in accordance with the business plan approved by the Ministry of Finance, with consideration given to past performance as well as to future trends of development.
(1) Deposits: NT$3.49 trillion(2) Loans: NT$2.29 trillion(3) Foreign Exchange: US$342.3 billion(4) Income Before Tax: NT$7.7 billion
Ⅲ. Development Strategies
1. In response to the trend toward digitization in the financial industry and increasingly stringent financial legislation, BOT intends to improve its developmental momentum and bolster its competitive strength by bolstering its hiring and training of personnel with cross-sectional skills in digital finance, credit, foreign exchange, insurance, trust business, wealth management, international finance, and AML/CFT.
2. Closely monitor the state of the global economy; continue observing political and economic conditions in Asian nations and assess their market access policies; coordinate closely with the investment activities of Taiwanese firms by searching for countries that offer good business opportunities and development potential; and actively support the government’s New Southbound Policy by targeting the ASEAN region as a key focus of future market development efforts.
3. Continue improving the Bank’s digital R&D capabilities; launch innovative new lines of business; take advantage of completely new digital services to build a cloud-based bank that offers online-to-offline connectivity; and move toward achieving our goal of ubiquitous banking services.
4. Address the various problems that threaten the ability of senior citizens to enjoy a financially secure old age amidst the ongoing ageing of society; integrate group resources and derive maximum benefit from integration across company and divisional lines; exercise our professional expertise to launch innovative new lines of business; actively develop financial products and related services designed for retirees (e.g. by launching insurance and trust products designed to facilitate the building of a retirement nest egg); and provide a more diversified range of senior citizen-oriented financial products and services.
5. Strengthen internal controls, internal audits, risk management, legal compliance, and other corporate governance activities; complete building of the Bank’s AML/CFT mechanisms; and instill a heightened awareness of legal compliance in all employees by adopting high-standard rules for compliance with the competent authority’s legislation and rules adopted by international supervisory bodies, and by holding compliance awareness activities and asking employees to attend compliance and legal affairs training courses.

Letter to Shareholders
1312
Chairman
President
Ⅳ. Credit Ratings
Items
Rating CompanyRating Date
Assigned RatingOutlook
Long-term Short-term
Standard & Poor’s Oct. 2016 A+ A-1 Stable
Moody’s Dec. 2016 Aa3 P-1 Stable
Taiwan Ratings Oct. 2016 twAAA twA-1+ Stable
In the face of uncertain global economic and financial conditions, in addition to actively seeking to achieve outstanding business performance, BOT will continue working to strengthen its internal audit, internal control, and legal compliance mechanisms. Moreover, the Bank will also continue taking steps to improve customer satisfaction and implement customer-driven services. By developing an even more conscientious attitude toward customer service, we can give back to consumers and lay a more solid foundation for sustainable business operations. Looking ahead to 2017, in addition to fulfilling the Bank’s corporate social responsibility, BOT will do everything it can to support the government’s policy of supporting the real economy with financial resources, and will actively facilitate development of the “5+2+2+1” innovative industries to achieve the goals of spurring development of the real economy and creating a win-win situation for both finance and industry.

2016 ANNUAL REPORT
BANK FTAIWAN
1514
Front Row (left to right): Chiou, Ye-Chin, Executive Vice President; Lyu, Jye-Cherng, Chairman; Wei, Jan-Lin, President; Hsieh, Chuan-Chuan, Executive Vice PresidentBack Row (left to right): Lin, Su-Lan, Executive Vice President and Chief Compliance Officer; Yeh, Shiou-Jsu, Executive Vice President;
Chang, Hong-Chi, Executive Vice President; Chiang, Shih-Tien, Executive Vice President; Huang, Jui-Mu, Executive Vice President and General Auditor
BANK FTAIWAN

1514
A Brief Introduction of the Bank
A Brief Introduction of the Bank
Ⅰ. Date of Establishment: May 20, 1946
Ⅱ. Brief HistoryT h e B a n k f i r s t o p e r a t e d u n d e r t h e
admin is t ra t ion o f the Ta iwan Prov inc ia l Government. When that government was downsized on Dec. 21, 1998, however, it was taken over by the Central Government and placed under the administration of the Ministry of Finance to be operated in accordance with the regulations governing government-owned financial institutions. On July 1, 2003 the Bank was registered as a corporation and reorganized into a company limited by shares in accordance with the provisions of the Company Act. On Sept. 16, 2004 the Bank received permission from the Financial Supervisory Commission to become a public company. The Bank completed merger with Central Trust of China on July 1, 2007. The Taiwan Financial Holding Co., Ltd. was established on Jan. 1, 2008. On Jan. 2, 2008, the Bank split its Department of Securities and Department of Life Insurance to organize the other two subsidiaries of Taiwan Financial Holdings, namely, BankTaiwan Securities Co., Ltd. and BankTaiwan Life Insurance Co., Ltd. The Bank further expanded its business scope on Feb. 6, 2013 by reinvesting in the establishment of a subsidiary, the BankTaiwan Insurance Brokers Co., Ltd.
In every stage of Taiwan’s economic development, the Bank of Taiwan has always firmly pursued the goals of stabilizing Taiwan’s finance, assisting with economic construction, and developing industrial and commercial enterprises, devoting its full efforts in coordination with government policies in order to fulfill the mission entrusted to it by the government. In past years, the BOT served as agency for Central Bank of the Republic of China (Taiwan) in carrying out most of the Central Bank’s business, including the issuance of the New Taiwan Dollar currency, implementation of monetary reform, and providing financial support for economic construction plans. Today, the BOT keeps handling businesses in line with government policy, including preferential-rate deposits, agency for the public treasury in adjusting fiscal receipts and expenditures, businesses associated with the issuance of New Taiwan Dollar currency, agency for procurement of government institutions, and the insurance for government employees and staffs in schools. The BOT’s position throughout the progress of Taiwan’s economic and financial development has been of primary importance.
At the end of 2016, the capital of the BOT was NT$95 billion and its assets amounted to over NT$4.7 trillion. Its deposits and loans accounted for 10.91% and 8.82%, respectively, of the entire Taiwan market. According to The Banker magazine’s Top 1000 World Banks 2016, as published in its July 2016 issue, the BOT ranked 124th in total assets and ranked 204th in terms of Tier 1 capital in the global banking industry.

1716
Corporate Governance Report
17 Ⅰ. Organization
19 Ⅱ. Directors, Supervisors, and Top Management
27 Ⅲ. Implementation of Corporate Governance
39 Ⅳ. CPA Information
41 Ⅴ. Numbers of Shares in the Same Reinvested Enterprises Held by the BOT and Its Directors, Supervisors, President, Executive Vice Presidents, Heads of Departments and Branches, and Enterprises Controlled Directly or Indirectly by the Bank, and Ratios of Consolidated Shareholding

1716
Corporate Governance Report
Corporate Governance Report
Ⅰ. OrganizationAt the end of March 2017, the BOT’s management organization consisted of Board of Directors, Audit
Committee, Secretariat (Board of Directors), Department of Auditing (Board of Directors), 29 departments, 163 domestic branches, Offshore Banking Branch, and 13 overseas units (including Los Angeles Branch, Hong Kong Branch, New York Branch, London Branch, Tokyo Branch, Singapore Branch, South Africa Branch, Shanghai Branch, Guangzhou Branch, Fuzhou Branch, Shanghai JiaDing Sub-Branch, Mumbai Representative Office, and Yangon Representative Office).
Organization Chart
Board of DirectorsChairman of the Board
AuditCommittee
EVP & ChiefCompliance Officer
EVP & General Auditor
PresidentExecutive Vice President
Department of Corporate Finance
Department of Credit Management
Department of Loan Assets Management
Department of Planning
Department of Circulation
Department of Public Treasury
Department of Risk Management
Department of Business
Department of International Banking
Department of Trusts
Department of Electronic Banking
Department of Domestic Operations
Department of Consumer Finance
Department of Treasury
Department of Real Estate Management
Department of Credit Analysis
Department of Precious Metals
Department of Procurement
Department of Government Employees Insurance
Secretariat,Board of Directors
Department of Auditing, Board of Directors
Department of General Affairs
Secretariat
Department of Human Resources
Department of Ethics
Department of Accounting
Department of Economic Research
Department of Information Management
Domestic Branches (163)Offshore Banking Branch (1)Overseas Units (13)
Department of Compliance
Department of Wealth Management
Training Institute
Note: BOT upgraded its Training Institute to a level-one unit on Jan. 6, 2017.

2016 ANNUAL REPORT
BANK FTAIWAN
1918
Functions of Major Departments
Department Functions
Secretariat, Board of Directors Handles important matters and documentary affairs related to the Board of Directors.Department of Auditing, Board of Directors
Takes care of planning, implementation, and examination of internal auditing matters, and participates in the formulation and revision of operating and management regulations.
Department of Planning Responsible for articles of incorporation, organization regulations, annual operating plans, evaluation of departments, and public relations.
Department of Corporate Finance
Handles matters of designing new products, planning for and promoting corporate finance business, and the supply of consulting assistance services to operating branches.
Department of Credit Management Handles planning, supervision, examining, consulting assistance services, and management for loan business.
Department of Loan Assets Management
Takes care of planning, examination, supervision, and management related to non-performing loans, loans for collection, and the clearing up of bad loans.
Department of Wealth Management Handles planning, marketing, evaluation, administration and training of wealth management.
Department of Circulation Handles the collection and payment, transport, adjustment of supply and demand, and the recovery of worn bills associated with the issuances of New Taiwan currency.
Department of Public Treasury
Handles agency operations for public treasuries at all levels, and direction and supervision of the business of branch treasuries.
Department of Risk Management
Responsible for the planning and revision of risk management, handles formulation and integration of risk management regulations.
Department of Business Takes care of general deposit, loan, remittance, and agency businesses.Department of International Banking
Takes care of foreign exchange operations, foreign banking and overseas branch businesses, correspondent banking relations, and operational planning and management for the foreign exchange business.
Department of Trusts Controls trust businesses and auxiliary businesses.Department of Electronic Banking
Responsible for planning, study, marketing, integration, supervision, management and examination of the electronic banking business.
Department of Consumer Finance
Takes care of planning, promotion, management, and consultation assistance services for the consumer finance, credit card, and bank card business.
Department of Treasury Handles allocation, planning, and utilization of New Taiwan Dollar and foreign currency, and securities investment.Department of Real Estate Management Takes care of maintenance of buildings and general management of real estate.
Department of Procurement Handles procurement matters under concentrated system for government institutions, public schools and public enterprises.
Department of Domestic Operations
Handles matters of deposit business, ATMs, planning and evaluation of domestic branches, and customer complaints.
Department of Government Employees Insurance
Handles under the Government’s authorization, the general life insurance for civil servants and staffs in public or in private schools.
Department of Precious Metals
Handles the precious metals and customs quotas business.
Department of Credit Analysis Responsible for the collection, surveying, and editing of data related to the credit investigation, as well as overseas credit investigation services.
Department of General Affairs Handles general affairs, cashier affairs, and procurement of articles and appliances in office.Secretariat Takes care of important affairs, documentation, chop management, meetings, and editing.Department of Human Resources Carries out the planning, study, and implementation of personnel affairs.
Department of Ethics Looks after the propagation of ethics laws and regulations, and the formulation and revision of ethics regulations.
Department of Accounting Responsible for the planning and formulation of accounting systems, budgets, statistics, internal auditing, and inter-branch settlement.
Department of Economic Research
Carries out the analysis of domestic and overseas economic and financial, banking business research, and the compilation of economic publications.
Department of Information Management In charge of research, analysis, planning and implementation of information operations.
Department of Compliance Handles the planning, management, and execution of the regulatory compliance system, anti-money laundering, and countering terrorism.
Training Institute Responsible for the planning and implementation of personnel training and advanced training.

1918
Corporate Governance Report
Ⅱ. Directors, Supervisors, and Top Management
1. Directors and Supervisors
Information on Directors and Supervisors (1) Mar. 20, 2017
Title Name Gender Date Elected
Date First
ElectedEducation and Career Positions Currently Held in the BOT
and Other Companies
Chairman LYU, JYE-CHERNG Male Aug. 31, 2016
Aug. 31, 2016
Master of Management, Kellogg School, Northwestern University
Minister without Portfolio, Executive Yuan
Minister, Ministry of Finance
Board Director, Central Bank of the Republic of China
Chairman of the Board, Mega Financial Holdings & Mega International Commercial Bank
Chairman of the Board, Bank of Taiwan
President & CEO, Land Bank of Taiwan
Vice Chairman, State-owned Enterprise Commission, Ministry of Economic Affairs
Vice President, Bank of New York, New York Headquarter
Chairman, The Bankers Association of the Republic of China
Chairman, The Bankers Association of Taiwan
Board Director, Taiwan Stock Exchange Corporation (TWSE)
Board Director, Taiwan Futures Exchange Corporation (TAIFEX)
Board Director & Vice President, Chunghwa Telecom Co., Ltd.
Board Director, China Steel Cooperation
Distinguished Chair Professor, School of Management, National Sun Yat-Sen University
Adjunct Professor, School of Technology Management, National Tsing Hua University
Chairman, Taiwan Financial Holding Co., Ltd
Chairman, The Bankers Association of the Republic of China
Board Director, Taiwan Stock Exchange Corporation (TWSE)
Board Director, Taiwan Futures Exchange Corporation (TAIFEX)
Board Director, Taiwan External Trade Development Council (TAITRA)
Distinguished Chair Professor, School of Management, National Sun Yat-Sen University
Adjunct Professor, School of Technology Management, National Tsing Hua University
Managing
DirectorWEI, JAN-LIN Male Oct. 28,
2016Oct. 28, 2016
Master of Economics, Soochow University
Executive Vice President, Bank of Taiwan
Executive Vice President, Central Trust of China
SVP & General Manager, Dept. of Treasury, Bank of Taiwan
SVP & General Manager, Dept. of Public Treasury, Bank of Taiwan
Executive Secretary, Taipei Interbank Money Center, The Bankers Association of the Republic of China
Managing Director of Trust Association of R.O.C.
Director, Mega Financial Holding Co., Ltd.
Supervisor, Mega Financial Holding Co., Ltd.
Supervisor, Taiwan Futures Exchange
Supervisor, Hua Nan Financial Holdings Co., Ltd.
Supervisor, Hua Nan Commercial Bank
Adjunct Assistant Professor Rank Specialist, Department of Financial Engineering and Actuarial Mathematics, Soochow University
President, Bank of Taiwan
Director, Taiwan Financial Holding Co., Ltd.
Director, Taiwan Small Business Integrated Assistance Center
Director, Taipei Interbank Money Center, The Bankers Association of the Republic of China
Director, The Bankers Association of the Republic of China
Adviser, The Bankers Association of Taipei
Independent Managing
DirectorHSU, YI-HSIUNG Male July 31,
2015July 31, 2009
M.A. in Economics, National Taiwan University
Deputy Governor, Central Bank of the Republic of China (Taiwan)
Director General, Dept. of Financial Inspection, Central Bank of the Republic of China (Taiwan)
Director, Audit Committee, Bank of Taiwan

2016 ANNUAL REPORT
BANK FTAIWAN
2120
Title Name Gender Date Elected
Date First
ElectedEducation and Career Positions Currently Held in the BOT
and Other Companies
Managing Director SU, JAIN-RONG Male June 24,
2016June 23, 2016
Ph.D. in Economics, Pennsylvania State University, USA
Commissioner, Department of Finance, Taipei City Government
Dean of Academic Affairs, National Taipei University
Dean of College of Public Affairs, National Taipei University
Professor, Department of Public Finance, National Taipei University
Political Deputy Minister, Ministry of Finance
Managing Director
YANG, CHENG-CHEN Male July 31,
2015Aug. 31, 2007
Ph.D. in Economics, Virginia Polytechnic Institute and State University, U.S.A.
Research Fellow, Institute of Economics, Academia Sinica
Associated Research Fellow, Institute of Economics, Academia Sinica
Teaching Assistant, Department of Economics, Virginia Polytechnic Institute and State University, U.S.A.
Instructor, Department of Economics, Tunghai University
Distinguished Research Fellow, Institute of Economics, Academia Sinica
Independent Director
CHEN, MING-CHIN Male July 31,
2015July 31, 2012
Ph.D. in Accounting, Arizona State University, U.S.A.
Chairperson, Department of Accounting, National Chengchi University
International Exchange of Scholar, J. William Fulbright Foreign Scholarship Board, U.S.A.
Commissioner, Administrative Appeals Commission, Taipei City Government
Member, Audit Committee, Bank of Taiwan
Professor, Department of Accounting, National Chengchi University
Independent Director, TaiMed Biologics Inc.
Commissioner, Administrative Appeals Commission, Ministry of Finance
Independent Director, Ruentex Materials Co., Ltd.
Board Director, Taiwan Stock Exchange Corporation (TWSE)
Independent Director
YEH, KUANG-SHIH Male July 31,
2015July 31, 2015
Ph.D. in Organization Theory and Policy Analysis, Carnegie Mellon University, USA
Professor, Department of Business Management, National Sun Yat-sen University
Minister, Ministry of Transportation and Communications, R.O.C.
Chairman, China Aviation Development Foundation
Deputy Minister, Ministry of Transportation and Communications, R.O.C.
Deputy Minister, Research Development and Evaluation Commission, R.O.C.
Member, Audit Committee, Bank of Taiwan
Professor, Graduate Institute of Technology Innovation & Intellectual Property Management, National Chengchi University
Independent Director, Pacific Construction Co., Ltd.
Director YANG, MING-SHYANG Male July 31,
2015July 31, 2009
B.A. of Accounting, National Chengchi University
Resident Supervisor, Bank of Taiwan
Comptroller and Chief Executive Officer, Accounting Management Center, Directorate-General of Budget, Accounting and Statistics, Executive Yuan
Comptroller, Department of Accounting, Ministry of Economic Affairs
Comptroller and Director, Department of Special Fund Budget, Directorate-General of Budget, Accounting and Statistics, Executive Yuan
Supervisor, Small and Medium Enterprise Credit Guarantee Fund of Taiwan
Director YANG, CHIN-LONG Male July 31,
2015July 31, 2015
Ph.D. in Economics, the University of Birmingham, UK
Director General of Department of Banking, Deputy Director General of Department of Banking, Adviser, Chief Representative of London Representative Office, Central Bank of the Republic of China (Taiwan)
Deputy Governor, Central Bank of the Republic of China (Taiwan)
2120
Corporate Governance Report
Title Name Gender Date Elected
Date First
ElectedEducation and Career Positions Currently Held in the BOT
and Other Companies
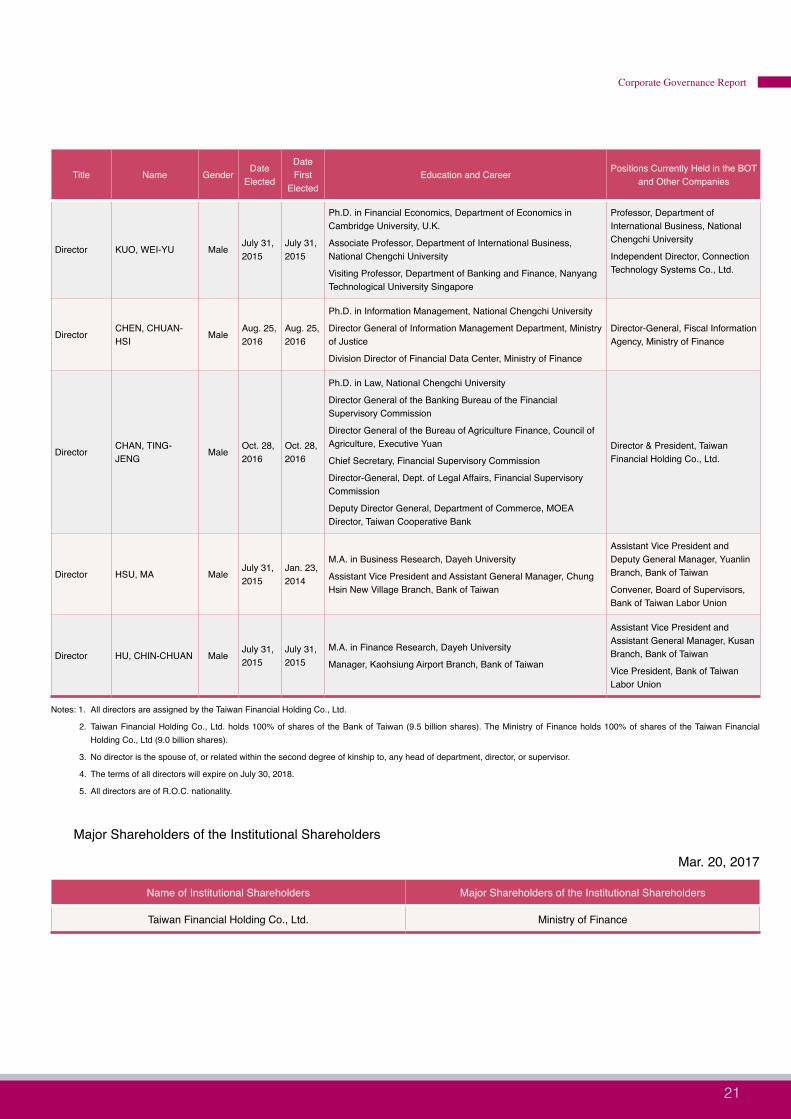
Director KUO, WEI-YU Male July 31, 2015
July 31, 2015
Ph.D. in Financial Economics, Department of Economics in Cambridge University, U.K.
Associate Professor, Department of International Business, National Chengchi University
Visiting Professor, Department of Banking and Finance, Nanyang Technological University Singapore
Professor, Department of International Business, National Chengchi University
Independent Director, Connection Technology Systems Co., Ltd.
Director CHEN, CHUAN-HSI Male Aug. 25,
2016Aug. 25, 2016
Ph.D. in Information Management, National Chengchi University
Director General of Information Management Department, Ministry of Justice
Division Director of Financial Data Center, Ministry of Finance
Director-General, Fiscal Information Agency, Ministry of Finance
Director CHAN, TING-JENG Male Oct. 28,
2016Oct. 28, 2016
Ph.D. in Law, National Chengchi University
Director General of the Banking Bureau of the Financial Supervisory Commission
Director General of the Bureau of Agriculture Finance, Council of Agriculture, Executive Yuan
Chief Secretary, Financial Supervisory Commission
Director-General, Dept. of Legal Affairs, Financial Supervisory Commission
Deputy Director General, Department of Commerce, MOEA
Director, Taiwan Cooperative Bank
Director & President, Taiwan Financial Holding Co., Ltd.
Director HSU, MA Male July 31, 2015
Jan. 23, 2014
M.A. in Business Research, Dayeh University
Assistant Vice President and Assistant General Manager, Chung Hsin New Village Branch, Bank of Taiwan
Assistant Vice President and Deputy General Manager, Yuanlin Branch, Bank of Taiwan
Convener, Board of Supervisors, Bank of Taiwan Labor Union
Director HU, CHIN-CHUAN Male July 31, 2015
July 31, 2015
M.A. in Finance Research, Dayeh University
Manager, Kaohsiung Airport Branch, Bank of Taiwan
Assistant Vice President and Assistant General Manager, Kusan Branch, Bank of Taiwan
Vice President, Bank of Taiwan Labor Union
Notes: 1. All directors are assigned by the Taiwan Financial Holding Co., Ltd.
2. Taiwan Financial Holding Co., Ltd. holds 100% of shares of the Bank of Taiwan (9.5 billion shares). The Ministry of Finance holds 100% of shares of the Taiwan Financial Holding Co., Ltd (9.0 billion shares).
3. No director is the spouse of, or related within the second degree of kinship to, any head of department, director, or supervisor.
4. The terms of all directors will expire on July 30, 2018.
5. All directors are of R.O.C. nationality.
Major Shareholders of the Institutional Shareholders
Mar. 20, 2017
Name of Institutional Shareholders Major Shareholders of the Institutional Shareholders
Taiwan Financial Holding Co., Ltd. Ministry of Finance

2016 ANNUAL REPORT
BANK FTAIWAN
2322
Professional Qualifications and Independence Analysis of Directors and Supervisors (2) Mar. 20, 2017
Criteria
Name
Meet One of the Following Professional Qualification Requirements, Together with at Least Five Years Work Experience
Independence Criteria (Notes)
Number of Other Public Companies in
Which the Individual is Concurrently Serving as an Independent
Director
An Instructor or Higher Position in a Department of Commerce, Law, Finance,
Accounting, or Other Academic Department
Related to the Business Needs of the Bank in a Public or Private Junior
College, College or University
A Judge, Public Prosecutor, Attorney, Certified Public
Accountant, or Other Professional or Technical
Specialist Who Has Passed a National Examination and Been Awarded a Certificate in a Profession Necessary
for the Business of the Bank
Have Work Experience in the Areas of Commerce,
Law, Finance, Accounting, or Others
Necessary for the Business of
the Bank
1 2 3 4 5 6 7 8 9 10
LYU, JYE-CHERNG V V V V V V V V V
Taiwan Financial Holding Co., Ltd. holds 100% of shares of the Bank and assigned all directors.
0
WEI, JAN-LIN V V V V V V V V V 0
HSU, YI-HSIUNG V V V V V V V V V V 0
SU, JAIN-RONG V V V V V V V V V V 0
YANG, CHENG-CHEN V V V V V V V V V V 0
CHEN, MING-CHIN V V V V V V V V V V V V
2
(TaiMed Biologics Inc. & Ruentex Materials
Co., Ltd.)
YEH, KUANG-SHIH V V V V V V V V V V1
(Pacific Construction Co., Ltd.)
YANG, MING-SHYANG V V V V V V V V V V 0
YANG, CHIN-LONG V V V V V V V V V V V V 0
KUO, WEI-YU V V V V V V V V V V
1
(Connection Technology Systems
Co., Ltd.)
CHEN, CHUAN-HSI V V V V V V V V V V 0
CHAN, TING-JENG V V V V V V V V V 0
HSU, MA V V V V V V V V V V 0
HU, CHIN-CHUAN V V V V V V V V V 0
Notes: A tick in the corresponding boxes indicates that the director or supervisor meets the following qualifications during the two years prior to being elected or during the term of office.
1. Not an employee of the Bank or any of its affiliates.
2. Not a director or supervisor of its affiliates. The same does not apply, however, in cases where the person is an independent director of the Bank, its parent company, or any subsidiary, as appointed in accordance with the Securities and Exchange Act or with the laws of the country of the parent or subsidiary.
3. Not a natural-person shareholder who holds shares, together with those held by the person’s spouse, minor children, or held by the person under others’ names, in an aggregate amount of 1% or more of the total number of outstanding shares of the Bank or ranking in the top 10 in holdings.
4. Not a spouse, relative within the second degree of kinship, or lineal relative within the third degree of kinship, of any of the persons in the preceding three subparagraphs.
5. Not a director, supervisor, or employee of a Bank shareholder that directly holds 5% or more of the total number of outstanding shares of the Bank or that holds shares ranking in the top five in holdings.
6. Not a director, supervisor, officer, or shareholder holding 5% or more of the shares, of a specified company or institution that has a financial or business relationship with the Bank.
7. Not a professional individual who, or an owner, partner, director, supervisor, or officer of a sole proprietorship, partnership, company, or institution that, provides commercial, legal, financial, accounting services or consultation to the Bank or to any affiliate of the Bank, or a spouse thereof; however, members of the Remuneration Committee carrying out their duties in accordance with Article 7 of the Regulations Governing the Appointment and Exercise of Powers by the Remuneration Committee of a Company Whose Stock is Listed on the Stock Exchange or Traded Over the Counter are not limited by this restriction.
8. Not having a marital relationship, or a relative within the second degree of kinship to any other director of the Bank.
9. Not a person of any conditions defined in Article 30 of the Company Act.
10. Not a governmental, juridical person or its representative as defined in Article 27 of the Company Act.

2322
Corporate Governance Report
2. Top Management
Mar. 20, 2017
Title Name Gender Date Effective Education Other Position
President WEI, JAN-LIN Male Oct. 28, 2016 Master of Economics,
Soochow University
Director, Taiwan Financial Holding Co., Ltd.Director, Taiwan Small Business Integrated Assistance CenterDirector, Taipei Interbank Money Center, The Bankers Association of the Republic of ChinaDirector, The Bankers Association of the Republic of ChinaAdviser, The Bankers Association of Taipei
Executive Vice President
CHIANG, SHIH-TIEN Male Nov. 23, 2007
Dept. of International Trade, Tamkang University
Director, Hua Nan Financial Holdings Co., Ltd.Director, Hua Nan Commercial BankDirector, BankTaiwan Insurance Brokers Co., Ltd.Chairperson, General Banking Committee, The Bankers Association of the Republic of ChinaDeputy Minister, Certificate Policy Management Committee, The Bankers Association of the Republic of China
Executive Vice President
CHANG, HONG-CHI Male July 16, 2011
Master of Agricultural Economics, National Chung Hsing University
Acting Executive Vice President, Taiwan Financial Holding Co., Ltd.Director, Bills Finance Association of the Republic of ChinaManaging Director, Taiwan Business Bank
Executive Vice President
CHIOU, YE-CHIN Female July 16, 2011 Dept. of Economics,
National Taiwan UniversityDirector, Taipei Forex Inc.Director, Mega Financial Holding Co.
Executive Vice President
HSIEH, CHUAN-CHUAN
Female Aug. 6, 2014 Master of Finance, National Taiwan University
Director, Cathay United BankDirector, Small & Medium Enterprise Credit Guarantee Fund of Taiwan
Executive Vice President
YEH, SHIOU-JSU Female Dec. 30, 2016
Dept. of Business Administration, National Taiwan University
Director, First Financial Holding Co., Ltd.Director, United Taiwan Bank S.A.
Executive Vice President and General Auditor
HUANG, JUI-MU Male Aug. 6, 2014
Dept. of Technology Mechanical Engineering, Ming Chi Institute of Technology
Executive Vice President and Chief Compliance Officer
LIN, SU-LAN Female Apr. 29, 2015
Master of Laws, The University of New South Wales
Chief Compliance Officer of Taiwan Financial Holding Co., Ltd.Member of Financial Regulations and Disciplinary Committee, The Bankers Association of the Republic of China
Senior Vice President and Chief Secretary
LIN, CHUN-LIANG Male Sep. 2, 2016
Dept. of Banking and Insurance, Tamkang College of Arts and Sciences
SVP and Chief Secretary, Taiwan Financial Holding Co., Ltd.Director, The Taiwan Payments Clearing System Development FoundationDirector, Taiwan Fire & Marine Insurance Co., Ltd.
Notes: 1. Taiwan Financial Holding Co., Ltd. holds 100% of shares of the Bank of Taiwan.
2. All the senior officials are of R.O.C. nationality.
3. Other than Huang Jui-Mu (who is EVP and General Auditor and the spouse of Su Su-Chen, a VP & General Manager at the Nan HsinChuang Branch), no senior official is the spouse of, or related within the second degree of kinship to, any head of department.

2016 ANNUAL REPORT
BANK FTAIWAN
2524
3. Remuneration of Directors, Supervisors, President, and Executive Vice Presidents for 2016
(1) Remuneration of Directors Unit: NT$1,000
Title Name
Remuneration Ratio of Total Remuneration (A+B+C+D)
to Net Income After Tax (%)
Relevant Remuneration Received by Directors Who are Also Employees
Ratio of Total Compensation
(A+B+C+D+E+F+G) to Net Income After
Tax (%)
Reinvested Enterprises other than the Bank’s Subsidiary
Base Compensation
(A)
Severance Pay(B)
Bonus to Directors
(C)
Allowances(D)
(Note)
Salary, Bonuses, and Allowances (E)
Severance Pay(F)
Employee Bonus(G)
The Bank
Com
panies in the Consolidated Financial Statem
ents
The Bank
Com
panies in the Consolidated Financial Statem
ents
The Bank
Com
panies in the Consolidated Financial Statem
ents
The Bank
Com
panies in the Consolidated Financial Statem
ents
The Bank
Com
panies in the Consolidated Financial Statem
ents
The Bank
Com
panies in the Consolidated Financial Statem
ents
The Bank
Com
panies in the Consolidated Financial Statem
ents
The Bank
Com
panies in the Consolidated
Financial Statements
The Bank
Com
panies in the Consolidated Financial Statem
ents
Cash
Stock
Cash
Stock
Chairman LYU, JYE-CHERNG
5,906 5,906 0 0 None 4,171 4,171 0.06% 0.06% 3,908 3,908 216 216 None 0.08% 0.08% 35
Chairperson LEE, JIH-CHU
President WEI, JAN-LIN
President SHIAU, CHANG-RUEY
Independent ManagingDirector
HSU, YI-HSIUNG
Managing Director
SU, JAIN-RONG
Managing Director
CHANG, FANG
Managing Director
YANG, CHENG-CHEN
Independent Director
CHEN, MING-CHIN
Independent Director
YEH, KUANG-SHIH
Director YANG, MING-SHYANG
Director YANG, CHIN-LONG
Director KUO, WEI-YU
Director CHEN, CHUAN-HSI
Director CHANG, CHIH-HUNG
Director CHAN, TING-JENG
Director LIU, YU-CHIH
Director SU, JAIN-RONG
Director HSU, MA
Director HU, CHIN-CHUAN
Notes: 1. Chairperson Lee Jih-Chu relieved on Aug. 31, 2016, the monthly rental for the chairperson’s residence is NT$86,333. In view of the fact that Chairman Lyu Jye-Cherng was not provided with an official residence, a monthly supplemental home rental stipend of NT$5,000 was provided (per the Ministry of Finance Letter (67) Tai-Cai-Ren-Zi No. 32021).
2. President Shiau Chang-Ruey relieved on Aug. 31, 2016, the monthly rental for the president’s residence is NT$101,667; the president’s sedan was purchased in November of 2011 at a cost of NT$573,604, and the monthly expense for the chauffeur is NT$40,695; and the gasoline fee is NT$16,867 (Jan. ~ Aug. 2016). In view of the fact that President Wei Jan-Lin was not provided with an official residence, a monthly supplemental home rental stipend of NT$5,000 was provided (per the Ministry of Finance Letter (67) Tai-Cai-Ren-Zi No. 32021); and the gasoline fee is NT$5,415 (Nov. ~ Dec. 2016).

2524
Corporate Governance Report
Bracket
Name of Directors
Total of (A+B+C+D) Total of (A+B+C+D+E+F+G)
The BankCompanies in the
Consolidated Financial Statements
The Bank The Bank and Reinvested Enterprises
Under NT$2,000,000
LYU, JYE-CHERNGWEI, JAN-LINHSU, YI-HSIUNGSU, JAIN-RONGCHANG, FANGYANG, CHENG-CHENCHEN, MING-CHINYEH, KUANG-SHIHYANG, MING-SHYANG YANG, CHIN-LONGKUO, WEI-YUCHEN, CHUAN-HSICHANG, CHIH-HUNGCHAN, TING-JENGLIU, YU-CHIHHSU, MAHU, CHIN-CHUAN
LYU, JYE-CHERNGWEI, JAN-LINHSU, YI-HSIUNGSU, JAIN-RONGCHANG, FANGYANG, CHENG-CHENCHEN, MING-CHINYEH, KUANG-SHIHYANG, MING-SHYANG YANG, CHIN-LONGKUO, WEI-YUCHEN, CHUAN-HSICHANG, CHIH-HUNGCHAN, TING-JENGLIU, YU-CHIHHSU, MAHU, CHIN-CHUAN
LYU, JYE-CHERNGWEI, JAN-LINHSU, YI-HSIUNGSU, JAIN-RONGCHANG, FANGYANG, CHENG-CHENCHEN, MING-CHINYEH, KUANG-SHIHYANG, MING-SHYANG YANG, CHIN-LONGKUO, WEI-YUCHEN, CHUAN-HSICHANG, CHIH-HUNGCHAN, TING-JENGLIU, YU-CHIHHSU, MAHU, CHIN-CHUAN
LYU, JYE-CHERNGWEI, JAN-LINHSU, YI-HSIUNGSU, JAIN-RONGCHANG, FANGYANG, CHENG-CHENCHEN, MING-CHINYEH, KUANG-SHIHYANG, MING-SHYANG YANG, CHIN-LONGKUO, WEI-YUCHEN, CHUAN-HSICHANG, CHIH-HUNGCHAN, TING-JENGLIU, YU-CHIHHSU, MAHU, CHIN-CHUAN
NT$2,000,000 ~ NT$5,000,000 LEE, JIH-CHUSHIAU, CHANG-RUEY
LEE, JIH-CHUSHIAU, CHANG-RUEY
LEE, JIH-CHUSHIAU, CHANG-RUEY
LEE, JIH-CHUSHIAU, CHANG-RUEY
NT$5,000,000 ~ NT$10,000,000
NT$10,000,000 ~ NT$15,000,000
NT$15,000,000 ~ NT$30,000,000
NT$30,000,000 ~ NT$50,000,000
NT$50,000,000 ~ NT$100,000,000
Over NT$100,000,000
Total (Unit: NT$1,000) 10,077 10,077 14,201 14,236

2016 ANNUAL REPORT
BANK FTAIWAN
2726
(2) Compensation of President and Executive Vice Presidents Unit: NT$1,000
Title Name
Salary (A) Severance Pay (B)
Bonuses and Allowances (C)
Employee Bonus (D)
Ratio of Total Compensation
(A+B+C+D) to Net Income After Tax
(%)
Reinvested Enterprises other than the Bank’s
SubsidiaryThe Bank
Com
panies in the Consolidated
Financial Statements
The Bank
Com
panies in the Consolidated
Financial Statements
The Bank
Com
panies in the Consolidated
Financial Statements
The Bank
Com
panies in the C
onsolidated Financial Statem
ents
The Bank
Com
panies in the Consolidated
Financial StatementsC
ash
Stock
Cash
Stock
President SHIAU, CHANG-RUEY
14,268 14,268 1,035 1,035 10,057 10,153 None 0.14% 0.14% 528
President WEI, JAN-LIN
Executive Vice President WEI, JAN-LIN
Executive Vice President CHIANG, SHIH-TIEN
Executive Vice President CHANG, HONG-CHI
Executive Vice President CHIOU, YE-CHIN
Executive Vice President HSIEH, CHUAN-CHUAN
Executive Vice President TSAI, TZONG-RONG
Executive Vice President CHEN, HUNG
Executive Vice President YEH, SHIOU-JSU
EVP & General Auditor HUANG, JUI-MU
EVP & Chief Compliance Officer LIN, SU-LAN
BracketName of President and Executive Vice Presidents
The Bank The Bank and Reinvested Enterprises
Under NT$2,000,000YEH, SHIOU-JSU
TSAI, TZONG-RONG
YEH, SHIOU-JSU
TSAI, TZONG-RONG
NT$2,000,000 ~ NT$5,000,000
SHIAU, CHANG-RUEY
WEI, JAN-LIN
CHIANG, SHIH-TIEN
CHIOU, YE-CHIN
CHANG, HONG-CHI
HSIEH, CHUAN-CHUAN
HUANG, JUI-MU
LIN, SU-LAN
CHEN, HUNG
SHIAU, CHANG-RUEY
WEI, JAN-LIN
CHIANG, SHIH-TIEN
CHIOU, YE-CHIN
CHANG, HONG-CHI
HSIEH, CHUAN-CHUAN
HUANG, JUI-MU
LIN, SU-LAN
CHEN, HUNG
NT$5,000,000 ~ NT$10,000,000
NT$10,000,000 ~ NT$15,000,000
NT$15,000,000 ~ NT$30,000,000
NT$30,000,000 ~ NT$50,000,000
NT$50,000,000 ~ NT$100,000,000
Over NT$100,000,000
Total (Unit: NT$1,000) 25,360 25,984

2726
Corporate Governance Report
Ⅲ. Implementation of Corporate Governance
1. Board of Directors
A total of 11 meetings of the Board of Directors were held in 2016 (A). Director attendance was as follows:
Title Name Attendance in Person (B) By Proxy
Attendance Rate(%)
[B/A](Note)Remarks
Chairman LYU, JYE-CHERNG 4 0 100 Assumed on Aug. 31, 2016
Chairperson LEE, JIH-CHU 7 0 100 Relieved on Aug. 31, 2016
Managing Director WEI, JAN-LIN 3 0 100 Assumed on Oct. 28, 2016
Managing Director SHIAU, CHANG-RUEY 7 0 100 Relieved on Aug. 31, 2016
Independent Managing Director HSU, YI-HSIUNG 11 0 100
Managing Director SU, JAIN-RONG 4 3 58 Assumed on June 24, 2016
Managing Director CHANG, FANG 4 0 100 Relieved on May 20, 2016
Managing Director YANG, CHENG-CHEN 11 0 100
Independent Director CHEN, MING-CHIN 10 1 91
Independent Director YEH, KUANG-SHIH 7 4 64
Director YANG, MING-SHYANG 11 0 100
Director YANG, CHIN-LONG 8 3 73
Director KUO, WEI-YU 10 1 91
Director CHEN, CHUAN-HSI 4 0 100 Assumed on Aug. 25, 2016
Director CHANG, CHIH-HUNG 6 0 100 Relieved on July 16, 2016
Director CHAN, TING-JENG 3 0 100 Assumed on Oct. 28, 2016
Director LIU, YU-CHIH 8 0 100 Relieved on Oct. 28, 2016
Labor Director HSU, MA 11 0 100
Labor Director HU, CHIN-CHUAN 11 0 100
Other mentionable items:1. The dates of meetings, sessions, contents of motions, all independent directors’ opinion and the Company’s response to independent
directors’ opinion should be specified, if there are (1) circumstances referred to in Article 14-3 of Securities and Exchange Act or (2) resolutions of the directors’ meetings objected to by independent directors or subject to qualified opinion and recorded or declared in writing: None.
2. If there is directors’ avoidance of motions in conflict of interest, the directors’ names, contents of motions, causes for avoidance and voting should be specified: At the 5th meeting of the 5th Board of Directors on Feb. 26, 2016, a proposal to confer awards of 2014 for outstanding oversight of the Bank’s operating performance: Chairperson Lee Jih-Chu and Managing Director Shiau Chang-Ruey exercised recusal because they were interested people in the matter (it affected their personal interests). All 12 directors in attendance agreed to pass the amendment.
Note: The actual ratio of attendance (%) is calculated as the ratio (%) of the number of Board of Directors meetings attended to the total number held during the term in office.

2016 ANNUAL REPORT
BANK FTAIWAN
2928
2. Audit Committee
A total of 10 Audit Committee meetings were held in 2016 (A). Independent Director attendance was as follows:
Title Name Attendance in Person (B) By Proxy Attendance Rate (%)
[B/A](Note) Remarks
Independent Managing Director HSU, YI-HSIUNG 10 0 100
Independent Director CHEN, MING-CHIN 9 1 90
Independent Director YEH, KUANG-SHIH 8 2 80
Other mentionable items:
1. The dates of meetings, sessions, contents of motions, resolutions of Audit Committee and the Company’s response to Audit Committee’s opinion should be specified, if there are (1) circumstances referred to in Article 14-5 of Securities and Exchange Act or (2) resolutions which were not approved by the Audit Committee but were approved by two thirds or more of all Directors: None
2. If there is Independent Directors’ avoidance of motions in conflict of interest, the Independent Directors’ names, contents of motions, causes for avoidance and voting should be specified: None
3. Communication between the Independent Directors, internal auditing authorities and CPAs (including major items, mode and results of discussion about the Bank’s finance and business)
(1) Communication with internal auditing authorities was carried out as follows to reinforce the Bank’s internal auditing work:
a. Meetings of the Audit Committee that were held during this fiscal year discussed (1) a report on auditing work for the second half of 2015; (2) Internal Control Statement in 2015; (3) a report on auditing work for the first half of 2016; and (4) auditing work plan for 2017.
b. Seminars were held with the internal auditing authorities to discuss the topics of anti-money laundering and countering terrorism financing, risk-based internal auditing, and risk management mechanism in conformity with international norms.
(2) Communication with CPAs was carried out as follows to reinforce the content of the Bank’s external auditing work:
a. Meetings of the Audit Committee that were held during this fiscal year discussed (1) internal control auditing in 2015; (2) financial reports of 2015; (3) the financial report for the first quarter of 2016; (4) the financial report for the second quarter of 2016; and (5) the financial report for the third quarter of 2016.
b. Seminars were held to discuss the Bank’s financial report checking and review matters.
(3) In order to reinforce regulatory compliance, risk management, finance, accounting, and business operations, the Bank’s communication with regulatory compliance, risk management, finance, accounting, and business units were carried out as follows:
a. Meetings of the Audit Committee discussed important regulatory compliance, risk management, finance, accounting, and business matters.
b. Numerous seminars were held to discuss the Bank’s important related issues.
c. Relevant executives were invited to the Audit Committee’s office on an irregular basis, and talks were held via telephone, to discuss important issues.
(4) A total of 10 Audit Committee meetings were called, 16 seminars were held during this year.
Note: The actual ratio of attendance (%) is calculated as the ratio (%) of the number of Audit Committee meetings attended to the total number held during the term in office.
3. Corporate Governance Execution Status and Deviations from “Corporate Governance Best-Practice Principles for the Banking Industry”
Matters EvaluatedImplementation Status
Y N Summary Description
1. Shareholding Structure & Shareholders’ Rights(1) Has the Bank adopted internal procedures
for the handling of shareholder suggestions, questions, disputes, and litigation? Does the Bank act in accordance with such procedures?
(2) Does the Bank know the identities of the main controlling shareholders, and of the ultimate controlling shareholder?
(3) Has the Bank established a risk management mechanism and “firewall” between the Bank and its affiliates? Is it implementing them?
V
V
V
(1) The Bank currently has only one institutional shareholder: The Taiwan Financial Holding Co., Ltd. (which is 100% owned by the Ministry of Finance). All related matters are carried out in accordance with regulations, and channels of communication are clear.
(2) The Bank is a subsidiary of the state-owned Taiwan Financial Holding Co., Ltd. (whose sole owner is the Ministry of Finance).
(3) Business having to do with related enterprises is all carried out in accordance with the provisions of the Banking Act and the regulations of the competent authority as well as the Bank’s own internal control charter.

2928
Corporate Governance Report
Matters EvaluatedImplementation Status
Y N Summary Description
2. Composition and Responsibilities of the Board of Directors(1) In addition to the Remuneration Committee
and the Audit Committee, is the Bank willing to establish other function-specific committees?
(2) Does the Bank carry out regular evaluations of CPA independence?
V
V (1) The Bank established an Audit Committee on July 31, 2009 and formulated an Audit Committee Charter. The committee is made up of all the Bank’s Independent Directors. The BOT is a 100% government-owned bank. As such, its employees’ salary points are handled in accordance with regulations issued by the Ministry of Finance, and it does not have a Remuneration Committee.
(2) The Bank commissioned independent, reputable, and professional international certified public accountants of appropriate scale to carry out verification and certification of the Bank’s accounts.
3. Is the Bank a TWSE/TPEx listed company? If so, does the Bank set up a full- (or part-) time corporate governance unit or personnel to be in charge of corporate governance affairs and designate a senior officer to be in charge of supervision?
V The Bank is not a TWSE/TPEx listed company.
4. Has the Bank established a communication channel with interested parties?
V The Bank maintains a mailbox for complaints and suggestions on its website, as well as a customer service telephone hotline, providing materially interested persons with a diversity of communication channels. Its internal website also contains a Chairperson’s Mailbox, President’s Interchange, and employees’ discussion area as channels for employee suggestions.
5. Information Disclosure(1) Has a corporate website been established
to disclose information regarding the Bank’s financial, business, and corporate governance status?
(2) Has the Bank established other information disclosure channels?
V
V
(1)The Bank’s website (http://www.bot.com.tw) regularly discloses information on finance, business, and corporate governance.
(2)The Bank’s website has an English page that provides information on the Bank’s finance, business, and corporate governance. To circulate publicly reports and announcements in accordance with the requirements of the competent authority, the units in charge of different areas of business carry out the collection and disclosure of relevant information. To strengthen liaison and communication with the news media, the Bank makes timely and accurate reports on its major policies, business measures, and services, establishes “Bank of Taiwan News Issuance and News Liaison Guidelines,” and appoints spokespersons.
6. Does the Bank have other important information that would contribute to a better understanding of the Bank’s corporate governance operations (e.g., including but not limited to employee rights, employee wellness, investor relations, rights of stakeholders, directors’ and supervisors’ training records, the implementation of risk management policies and risk evaluation measures, the implementation of customer relations policies, purchasing insurance for d i rectors and supervisors, and donations to political parties, stakeholders, and charity organizations)?
V 1. The BOT is a government-run financial institution. The interests of its employees are handled in accordance with the provisions of the “Labor Standards Act,” other labor legislation, and regulations issued by the competent authorities.
2. Advanced Education for Directors and Supervisors: The Bank provides Directors with information on advanced courses on law, finance, and accounting related to issues of corporate governance on an irregular basis, and arranges for them to attend courses in accordance with the regulations and their individual wishes.
3. Attendance of Directors and Supervisors at Board of Directors Meetings: The Bank’s Directors attend meetings of the Board of Directors (Board of Managing Directors) in accordance with the “BOT Articles of Incorporation,” “BOT Board of Directors Organizational Charter” and “BOT Board of Directors Rules of Procedure.”

2016 ANNUAL REPORT
BANK FTAIWAN
3130
Matters EvaluatedImplementation Status
Y N Summary Description
6. Does the Bank have other important information that would contribute to a better understanding of the Bank’s corporate governance operations (e.g., including but not limited to employee rights, employee wellness, investor relations, rights of stakeholders, directors’ and supervisors’ training records, the implementation of risk management policies and risk evaluation measures, the implementation of customer relations policies, purchasing insurance for d i rectors and supervisors, and donations to political parties, stakeholders, and charity organizations)?
4. Implementation of Risk Management Policy and Risk Measurement Standards:(1) The Bank has established a Risk Management Committee
mapped out risk strategies and considered risk monitoring. The Bank has also set up an independent dedicated risk control unit, carries out matters related to risk identification, assessment, monitoring, and management, and submits regular reports on the status of implementation to the Risk Management Committee.
(2) In compliance with FSC rules, the Bank has implemented Pillars 1, 2, and 3 of Basel Accord.
(3) The Bank has worked out a risk management policy, regulations for the establishment of a Risk Management Committee, internal criteria for capital adequacy management, criteria for credit risk management, criteria for market risk management, criteria for operational risk management, criteria for national risk quota management, and regulations for the disclosure of risk management information.
(4) The Bank carries out the risk management mechanism under advanced approach in accordance with the New Basel Accord.
5. Consumer Protection(1) To protect the interests of customers and assure observance of
the competent authority’s regulations, the Bank has established rules for the wealth management business including “Operating Regulations for the Sale of Financial Products,” “Management Guidelines for Financial Product Salespersons,” “Operating Instructions for a Full Understanding of Customers in the Sale of Financial Products, and “Manual of Customer Rights for the Sale of Financial Products.”
(2) To protect consumer interests, the contracts signed with customers for the extension of consumer loans are drawn up according to the “Items to Be Included and Not Included in Personal Auto and Home Loan Model Contracts” as formulated by the competent authority in accordance with the Consumer Protection Act and other relevant laws and regulations.
(3) The Bank has established “Standards for Exemption from Risk due to Loss or Theft of International Credit Cards” and “Regulations for Writing Off Losses due to Fraudulent Use of International Credit Cards,” so as to protect the users of international credit cards.
(4) In response to the promulgation and implementation of the Financial Consumer Protection Act and its subsidiary Regulations Governing Financial Services Companies Engaged in Advertising for Business Solicitation or Business Marketing, the Bank has established its “Management Instructions for Engaging in Advertising for Business Solicitation and Business Marketing.”
6. Abstention of Directors from Cases in Which They Have a Material Interest:
(1) Article 9 of the Board of Directors Organizational Charter, and Article 17 of the Board of Directors Rules of Procedure, both stipulate that Directors should, at the current Board of Directors meeting, explain the major content of their relationships of material interest and, in case of any concern that those relationships might do harm to the Company’s benefit or if there is any relationship of material interest of its own, they may not participate in discussions or voting and should remove themselves during discussion and voting, nor may they act as proxy for other Directors in exercising their voting rights.
(2) Directors have to fill out the “Parties of Material Interest” Form as stipulated in Article 33-1 of the Banking Act, and the Form is managed by the Department of Credit Management.

3130
Corporate Governance Report
Matters EvaluatedImplementation Status
Y N Summary Description
7. Purchase of Liability Insurance for Directors and Supervisors: The Bank has not purchased liability insurance for its Directors. The Bank set up an Audit Committee to take over the functions of the supervisors.
8. Donations to Polit ical Parties, Stakeholders, and Charity Organizations:The Bank provides charity donations in accordance with the “Rules for the Handling of Funding (Donations) from the Bank of Taiwan to Private Organizations.”
4. Information on Members of the Remuneration Committee, and Its Operation
The BOT has not established a Remuneration Committee.
5. Social Responsibility
Matters EvaluatedImplementation Status
Y N Summary Description
1. Implementation of Corporate Governance(1) Has the Bank adopted a corporate social
responsibility policy or system? Does the Bank review the effectiveness of its implementation thereof?
(2) Does the Bank periodically hold social responsibility education and training sessions?
(3) Does the Bank have a unit (dedicated or otherwise) that is charged with responsibility for promoting corporate social responsibility? Does the board of directors specifically authorize senior management to handle corporate social responsibility matters, and does senior management report back to the board of directors on its handling of such matters?
(4) Has the Bank adopted a policy on reasonable remuneration? Are corporate social responsibility matters factored into employee performance evaluations? Are there clear and effective rewards and sanctions?
V
V
V
V
(1) Public-benefit donations are given to civic groups in accordance with the “Bank of Taiwan Rules for the Granting of Subsidies (Donations) to Private Groups.”
(2) The Bank uses internal education and training programs as well as online learning websites to provide employees with online courses in corporate governance. Employees are required to attend a prescribed number of hours of such coursework.
(3) The BOT has not yet established a unit (dedicated or otherwise) to handle corporate social responsibility matters. However, the Bank’s Directors all take part in corporate governance courses, and when there are government directives and other such matters, the Bank notifies each Director.
(4) The BOT is a 100% government-owned bank. As such, its employees’ salary points are handled in accordance with regulations issued by the Ministry of Finance. Corporate social responsibility policies are not currently factored into employee performance evaluations.
2. Development of a Sustainable Environment(1) Does the Bank make efforts to enhance the
efficiency of resource utilization, and use recyclable materials with a low environmental burden?
(2) Has the Bank established an appropriate environmental management system that is suited to the characteristics of the banking industry?
(3) Does the Bank pay attention to the impact of climate change on operating activities? Does it prepare greenhouse gas inventory reports? Has it adopted strategies for energy conservation and reduction of carbon and other greenhouse gases?
V
V
V
(1) The Bank stepped up efforts to conduct green purchasing operations in order to implement the “Government Procurement Act” and the “Resource Recycling Act.” Of all designated procurement items, 95.07% were obtained in line with green purchasing principles in 2016.
(2) The BOT has established an Environmental Management System for the environmental beautification and maintenance of cleanliness.
(3) The Bank continued implementing the government’s policy of energy conservation and carbon reduction, the reductions during the year amounted to 0.20% for electricity and 2.53% for fuel consumption.

2016 ANNUAL REPORT
BANK FTAIWAN
3332
Matters EvaluatedImplementation Status
Y N Summary Description
3. Community Service Work(1) Has the Bank adopted policies and procedures
in accordance with applicable legislation and international human rights conventions?
(2) Has the Bank establ ished an employee complaint system, including a channel for lodging complaints? Is the system being properly implemented?
(3) Does the Bank provide a safe and healthy working environment for its employees, and offer them regular safety and health education?
(4) Has the Bank established a channel for periodic communication with employees? Does the Bank use reasonable methods to notify employees of operational changes with a potentially major impact upon them?
(5) Has the Bank established a career skills development program for its employees?
(6) Has the Bank adopted consumer protection policies and complaint procedures for its R&D, purchasing, operational, and service processes?
(7) In its marketing and labeling of products and services, does the Bank comply with applicable legislation and international standards?
(8) Before entering into a business relationship with a supplier, does the Bank first consider whether the supplier has previously harmed the environment or the interests of society?
(9) Do the Bank’s contracts with major suppliers include a provision that allows for the Bank to terminate or rescind at any time if the supplier violates its corporate social responsibility policy in such a manner as to harm the environment or the interests of society?
V
V
V
V
V
V
V
V
V
(1) In order to safeguard the rights and interests of both management and labor, the Bank has adopted work rules in compliance with the “Labor Standards Act” and other legislation governing civil servants.
(2) Employees can lodge complaints in hardcopy form, via telephone or email, or via the Chairperson’s Mailbox on the company intranet.
(3) In order to prevent workplace accidents and protect the safety and health of employees, the Bank has adopted the “Bank of Taiwan Best Practice Principles for Occupational Safety and Health.” This measure is intended to ensure a safe and healthy environment for employees. The Bank also offers employees regular safety and health education.
(4) The Bank issues official notices to inform employees of important operating policies related to employee’s rights.
(5) The Bank adopts an employee training program each year, which includes courses and lectures focusing on various professional and managerial topics. In addition, the Bank also dispatches employees to attend external training, as needed.
(6) The Bank has adopted rules to ensure adequate safeguarding of the interests of customers, and compliance with applicable requirements issued by the competent authority. These rules are amended as necessary in response to changes to legislation. In order to properly handle customer complaints, for example, the Bank has adopted a set of “Rules Governing the Handling of Customer Criticisms and Complaints.”
(7) The Bank has adopted a set of “Management Instructions for Engaging in Advertising, Business Solicitation, and Sales Promotion Activities” to regulate its advertising, business solicitation, and sales promotion activities, and to safeguard the interests of financial consumers.
(8) The Bank handles purchasing matters in compliance with the “Government Procurement Act”, environmental protection and labor safety & health legislation, and related legislation. Qualification requirements for suppliers and manufacturers, and the content of contracts, must all be set in accordance with the law.
(9) The Bank’s goods and services procurement contracts expressly provide that if a supplier violates environmental protection or labor safety & health legislation, the Bank reserves the right to terminate or suspend the contract.
4. Strengthening of Information DisclosureDoes the Bank disclose relevant and reliable in format ion regarding i ts corporate socia l responsibility on its own website and the Market Observation Post System (MOPS) website?
V Related information is disclosed in the Corporate Social Responsibility Report area of the global information web page, in such areas as corporate governance, customer commitments, employee care, environmental protection, and social participation, and sent to the Bank’s various units for reference.

3332
Corporate Governance Report
Matters EvaluatedImplementation Status
Y N Summary Description
5. If the Bank has compiled its own corporate social responsibility rules in accordance with the “Corporate Social Responsibility Best-Practice Principles for TWSE/GTSM Listed Companies,” please explain their operation and their divergences: The BOT is not a TWSE/GTSM listed company, and has not compiled its own corporate social responsibility rules.
6. Other important information that would aid in understanding the operation of corporate social responsibility:(1) As a 100% government-owned bank, the Bank makes every effort to attain the budget targets set by the government, and
coordinates with the government’s major construction plans and participates actively in the financing of infrastructure projects as well as large private investment projects in order to promote overall national economic development.
(2) In order to give back to society and act upon the company’s commitment to caring, the Bank continues to hold community service activities designed to benefit the underprivileged and enhance its image as an enterprise that cares about the public good. The Bank also supports government policy by providing student loans.
(3) The BOT carried out the following social benefit activities in 2016:a. 4 January 2016: The Bank held a concert to celebrate the 70th anniversary of its establishment, and established Bank of
Taiwan Charity Trust.b. In support of the disaster relief effort after an earthquake in Tainan City, the Bank donated NT$500,000 to a government-
designated bank account, suspended the collection of processing fees for customers who made donations, and provided multiple channels via which to make donations.
c. 27 February 2016: The Bank invited children and volunteers from the Yilan Branch of Taiwan Fund for Children and Families to attend the 13th Super Basketball League game — Bank of Taiwan Basketball Team vs. Fubon Braves Basketball Team at the Banqiao Stadium.
d. The Bank showed concern and support for the elderly by taking part in “Dialogue With Time” exhibit about the art of ageing.
e. 28 April 2016: The Bank held an activity with Taipei City Community College focusing on how to enjoy life to the fullest in old age.
f. 30 April and 1 May 2016: The Bank conducted a seminar on financial planning for older adults in the National Taiwan Science Education Center.
g. 7 May 2016: The Bank held a “sweep the mountain” hiking activity for employees and their family members on the Bihu hiking trail in Taipei.
h. Following a powerful typhoon in Taitung, in order to fulfill its corporate social responsibility, the Bank wired NT$100 thousand to an account designated by the Government for donations to help with the relief and reconstruction.
i. 16-17 July 2016: The Bank invited student athletes from several junior high school baseball teams in Yilan and children from the Good Shepherd Social Welfare Foundation and Wanhua District Children’s Service Center to attend the Chinese Professional Baseball League all-star game at the Xinzhuang Baseball Stadium in New Taipei City, and took part in a community service event together with baseball stars from the Chinese Professional Baseball League (CPBL). For each ball hit out of the park during the home run contest, the Bank made a 5-gram “gold passbook” donation to the Taiwan Foundation For Rare Disorders and the Taiwan Fund for Children and Families. A total of 200 grams of passbook gold were donated.
j. 24 August 2016: The Bank held an investment and charity activity in Taipei and invited children from the World Peace Association to take part in the event, along with wealth management guests and their families, in fulfillment of the Bank’s corporate social responsibility.
k. 21 November 2016: The Bank made a charitable contribution with Taiwan Financial Holdings and BankTaiwan Life Insurance to RENYOU SANATORIUM and Erhlin Happy Christian Homes.
7. If the Bank’s corporate social responsibility reports include passage of certification standards by relevant certification agencies, please explain:The Bank has prepared Corporate Social Responsibility Reports for 2013, 2014 and 2015 which have not been certificated yet.

2016 ANNUAL REPORT
BANK FTAIWAN
3534
6. Status of the Bank’s Ethical Management, and Measures Adopted
Matters EvaluatedImplementation Status
Y N Summary Description
1. Establishment of Ethical Management Policies and Programs(1) Is an ethical management pol icy clearly
expressed in the Bank’s charter and public documents? Are i t s board o f d i rec tors and management committed to vigorous implementation of that policy?
(2) Has the Bank adopted programs for the prevention of unethical behavior? Does each of these programs expressly set out operating procedures and a code of conduct, provide for punishment of unethical behavior, and establish a system for lodging complaints? Are the programs being properly implemented?
(3) Has the Bank adopted preventive measures to ensure that the unethical behaviors set out in Article 7, paragraph 2 of the “Ethical Corporate Management Best Practice Principles for TWSE/GTSM Listed Companies” will not occur, and that the Bank will not engage in business activities that pose a relatively high risk of unethical conduct?
V
V
V
(1) The BOT holds to an attitude of sincerity in guaranteeing the principle of putting customer rights first and providing professional services that meet the needs of its customers, and puts “sincerity” at the head of the list of its operating principles.
(2) The Bank conducts all matters in compliance with the “Civil Servant Service Act,” abides by civil ethics rules, carries out all required registrations, and in order to prevent unethical conduct, the Bank has adopted a rule explicitly requiring that important financial transactions with interested parties must be reported to the Board of Directors for discussion and approval.
(3) a. All purchasing transactions, donations, and sponsorships must be reported to the authorization level for review and approval, so compliance with applicable legislation and internal operating procedures is assured.
b. The Bank has established the “Instructions for Professional Ethics and Behavior by Bank of Taiwan Investment Personnel,” Article 7 of which clearly prohibits the Bank’s investment personnel from recommending, giving, seeking, or accepting a bribe in any form. Also, the code of conduct set out in Article 3 of the “Instructions for Prevention of Insider Trading and Conflicts of Interest in the Wealth Management Business of the Bank of Taiwan” explicitly prohibits wealth management personnel from seeking, under any guise, either a commission or assistance with the payment of activity expenses. Such personnel are also not allowed to take advantage of their job duties to funnel interests to themselves or to another person, or to accept improper gifts or entertainment.
2. Implementation of Ethical Management(1) Does the Bank evaluate the ethics track record
of parties with which it does business? Do the contracts that it enters into with such parties expressly set out provisions governing ethical conduct?
(2) Does the Bank have a unit (dedicated or otherwise) that reports to the board of directors and is responsible for promoting ethical business practices? If so, does this unit report periodically to the board of directors on the status of its work?
(3) Has the Bank adopted a conflict-of-interest policy, and provided an appropriate complaint channe l? I s the po l i cy be ing p roper l y implemented?
(4) Has the Bank established effective accounting and internal control systems designed to achieve eth ica l management? Does i ts internal audit unit carry out periodic audits, or if not, does the Bank retain a certified public accountant to carry out audits?
V
V
V
V
(1) Before carrying out a public procurement operation, the Bank always visits the website of the Ministry of Economic Affairs to check on the current status of the counterparty, or asks the counterparty to provide tax returns. In addition, purchasing contracts include penal provisions that require the supplier to provide compensation if it acts in breach of contract.
(2) The Bank has not yet established a unit (dedicated or otherwise) that reports to the Board of Directors and is responsible for promoting ethical business practices. The BOT follows the operating principles of “Integrity, Care, Efficiency, and Prudence,” and propagates an understanding of these core values to employees during regular and irregular meetings at the different units. The principles are also printed in publications to incorporate them into all operations and services.
(3) The BOT’s Charter, Organization Rules of the Board of Directors, and Rules and Procedures of Board of Directors Meetings clearly stipulate rules for the recusal of Directors.
(4) The Bank has established a rigorous accounting system and a dedicated accounting unit. All financial reports are audited by a certifying CPA to ensure the fairness of financial statements, and the Bank has established an internal audit system, a self-audit system, a chief compliance officer system, and a risk management system as required by the “Regulations Governing the Implementation of Internal Control and Audit Systems by Financial Holding Companies and Banking Enterprises.”

3534
Corporate Governance Report
Matters EvaluatedImplementation Status
Y N Summary Description
(5) Does the Bank periodically hold in-house or out-of-house education and training sessions that focus on business ethics?
V (5) a. At periodic brainstorming sessions between management and staff, ethics officers acquaint participants with legal compliance issues.
b. Ethics-related legislation and articles are posted on the Department of Ethics section of the Bank's website so that employees can consult them at any time. In 2016 the Bank held 17 in-house training courses for Ethics Guidelines and discipline rules with a total of 862 trainees participating.
c. The Bank reminds all personnel on these occasions that they are required to comply with the “Ethics Guidelines for Civil Servants” and in principle refuse any gift or entertainment offered to them by any individual, juristic person, or group that is an interested party with respect to the Bank’s business, and personnel are required to establish a file if such a party approaches them with a request or seeks to influence them.
3. Whistleblower System(1) Has the Bank established a whistleblower
system that prov ides for whis t leb lower incentives? Is there a convenient channel for whistleblowers to raise their concerns? Does the Bank assign appropriate personnel who are exclusively tasked with responsibility for interfacing with the persons against whom whistleblowers lodge complaints?
(2) Has the Bank adopted a standard operating procedure and a confidentiality regime for invest igat ions launched in response to whistleblower complaints?
(3) Has the Bank adopted measures to protect whistleblowers from retaliation?
V
V
V
(1) The Bank shows on its website how to lodge whistleblower complaints via telephone, fax, post box, and e-mail. A dedicated unit assigns personnel to process whistleblower complaints.
(2) The Bank’s ethics unit processes whistleblower complaints in accordance with the “Procedures for Handling Whistleblower Complaints and Providing Whistleblower Incentives and Protections (Including Confidentiality)” issued by the Ministry of Justice.
(3) The Bank is subject to the provisions of the “Labor Standards Act,” Article 74 of which prohibits an employer from discharging, transferring, or taking any other unfavorable measure against a worker who files a complaint.
4. Strengthening of Information DisclosureDoes the Bank disclose the content of its ethical best practice standards, and the state of their implementation, on its website and the Market Observation Post System (MOPS) website?
V The Bank discloses the state of its business ethics work on its website, the Market Observation Post System (MOPS) website, and its annual reports.
5. Please describe any differences in operations and rules of ethical management regulations that the Bank has established in accordance with the “Ethical Corporate Management Best Practice Principles for TWSE/GTSM Listed Companies”:The BOT is not a TWSE/GTSM listed company, so this item is not applicable.
6. Other important information that would aid in understanding the Bank’s ethical management operations (such as the Bank’s review and revision of ethical management regulations):The Bank’s ethical management operations have met with approval through the following:(1) A winner in the Reader’s Digest Trusted Brands survey in the banking category.(2) The number one financial holding company or bank on Cheers magazine’s list of the “most admired companies in the new
age” in 2016.(3) A prize for excellence in its "best digital bank" category from Wealth magazine in 2016.(4) A “stellar enterprise” in the Corporate Social Responsibility YearBook 2016 published by Economic Daily News.
(5) The Joint Credit Information Center’s Golden Quality Award and Golden Security Award.(6) The “award for best trust services” at the 8th awards for financial industry excellence of the Taiwan Academy of Banking
and Finance.(7) “Direct Guarantee Outstanding Performance Award” and “Young Entrepreneur Assistance Award” from the Ministry of
Economic Affairs.

2016 ANNUAL REPORT
BANK FTAIWAN
3736
7. Corporate Governance Guidelines and Regulations
Please refer to the Bank’s website at http://www.bot.com.tw, and click on “Corporate Governance.”
8. Internal Control System
(1) Internal Control StatementPlease refer to page 43 and 44 of the Chinese annual report.
(2) Independent Auditors’ ReportPlease refer to page 45 of the Chinese annual report.
9. Major Resolutions of Board Meetings
(1) Report by the 25th meeting of the 5th Board of Managing Directors on Jan. 8, 2016: Board members approved the Bank’s “2015 Table of Funding (Donations) from the Bank of Taiwan to Private Organizations and How the Funds Have Been Used” and the “2015 Table of Funding (Donations) from the Bank of Taiwan to Local Governments.”
(2) Report by the 26th meeting of the 5th Board of Managing Directors on Jan. 15, 2016: “Directions Governing Management of Bank of Taiwan for the risk assessment of Anti-Money Laundering and Countering Terrorism Financing.”
(3) Passed by the 26th meeting of the 5th Board of Managing Directors on Jan. 15, 2016: The Bank’s 2017 Business Plan (including the subsidiary).
(4) Passed by the 6th meeting of the 5th Board of Directors on Mar. 18, 2016: a. Audited 2015 individual and consolidated statements, Business Report, Statement of Income
Appropriation, and List of Major Properties. b. Audited 2015 Internal Control System Recommendations.
(5) Passed by the 7th meeting of the 5th Board of Directors on May 13, 2016: a. “Report on the Bank’s capital increase plan for 2017.” b. MOU for cooperation on business with the China Gold Coin Incorporation.
Outstanding BOT employees singled out for recognition at the Joint Credit Information Center’s Golden Quality Award and Golden Security Award Ceremony pose for a group photo with BOT Chairman Lyu Jye-Cherng (3rd from left) and Chairman Hu Fu-Hsiung of the Joint Credit Information Center (center).

3736
Corporate Governance Report
c. “Bank of Taiwan Operational Guidelines for the Conduct of Discretionary Securities Investment Services.” d. Plan to apply to the Central Bank for permission to conduct “non-discretionary individually
managed foreign-currency money trust services.”(6) Passed by the 45th meeting of the 5th Board of Managing Directors on June 17, 2016: “Assessment
of Money Laundering and Terrorism Financing Risks and Related Control Programs by Bank of Taiwan Operating an Electronic Payment Institution as a side business.”
(7) Report by the 4th extraordinary meeting of the 5th Board of Directors on June 24, 2016: A meeting of the Board of Directors of the Taiwan Financial Holding Co., Ltd. approved the departure of Managing Director Chang Fang from the BOT’s Board of Directors, effective May 20, 2016, and the filling of the vacancy by Su Jain-Rong.
(8) Passed by the 4th extraordinary meeting of the 5th Board of Directors on June 24, 2016: “Business Plan for Cooperating with or Assisting Foreign Institutions in Engaging in Activities Associated with Electronic Payment Business within the Territory of the Republic of China.”
(9) Passed by the 51st meeting of the 5th Board of Managing Directors on July 29, 2016: “Business Plan for the Bank of Taiwan HCE mobile credit card.”
(10) Report by the 6th extraordinary meeting of the 5th Board of Directors on Aug. 31, 2016: The departure of Directors of the BOT Lee Jih-Chu and Shiau Chang-Ruey was approved, effective Aug. 31, 2016. Lyu Jye-Cherng was in turn appointed as Director of BOT, which was left by Lee Jih-Chu, and elected as Managing Director.
(11) Passed by the 1st extraordinary meeting of the 5th Board of Managing Directors on Aug. 31, 2016: Managing Director Lyu Jye-Cherng was elected as Chairman of the BOT.
(12) Passed by the 6th extraordinary meeting of the 5th Board of Directors on Aug. 31, 2016: The departure of Acting president of the BOT Shiau Chang-Ruey was approved, effective Aug. 31, 2016. The position left vacant was in turn filled by Executive Vice President Wei Jan-Lin on a temporary basis.
(13) Passed by the 59th meeting of the 5th Board of Managing Directors on Sep. 30, 2016: a. Cooperation agreement on interbank lending between the Bank and the Bank of Tokyo-
Mitsubishi UFJ.b. “Control Programs by Bank of Taiwan for Money Laundering and Terrorism Financing Risks.”
(14) Report by the 7th extraordinary meeting of the 5th Board of Directors on Oct. 28, 2016: The Board of Directors of the Taiwan Financial Holding Co., Ltd. discussed and approved the appointment of the company’s President Chan Ting-Jeng as Director of the BOT, which was left by the company’s Executive Vice President Liu Yu-Chih. Wei Jan-Lin was appointed as Director of BOT and elected as Managing Director.
(15) Passed by the 7th extraordinary meeting of the 5th Board of Directors on Oct. 28, 2016: Wei Jan-Lin was promoted from his position as Executive Vice President to the position of President of the BOT.
(16) Passed by the 9th meeting of the 5th Board of Directors on Nov. 11, 2016: a. The Audit Plan of 2017 by the Department of Auditing, Board of Directors. b. Bank of Taiwan 2017 Compliance Program.c. Established a Money Laundering Prevention Center under Department of Compliance.

2016 ANNUAL REPORT
BANK FTAIWAN
3938
d. BOT upgraded its Training Institute to a level-one unit.e. Plan to apply to the competent authority for permission to conduct “trust services for the capital
contributions of shareholders.”(17) Passed by the 66th meeting of the 5th Board of Managing Directors on Nov. 18, 2016: Plan to
use the Old Bank of Taiwan Dormitory in Beitou (after it has been refurbished as a Taipei City historic site) as the Bank’s Center for the Development of Employee Potential.
(18) Report by the 68th meeting of the 5th Board of Managing Directors on Dec. 2, 2016: “Report on Establishment by the Bank of Taiwan of a Working Group on Urban Renewal Financing.”
(19) Passed by the 8th extraordinary meeting of the 5th Board of Directors on Dec. 30, 2016: EVP & Chief Compliance Officer Lin Su-Lan was appointed as Head of Anti-Money Laundering and Countering Terrorism Financing.
(20) Report by the 73rd meeting of the 5th Board of Managing Directors on Jan. 6, 2017: Board members approved the Bank’s “2016 Table of Funding (Donations) from the Bank of Taiwan to Private Organizations and How the Funds Have Been Used” and the “2016 Table of Funding (Donations) from the Bank of Taiwan to Local Governments.”
(21) Passed by the 75th meeting of the 5th Board of Managing Directors on Jan. 20, 2017: Kaohsiung City Government invited the Bank to participate in the Alliance of Asian New Bay Area, and the Bank has signed the letter of intent for cooperation.
(22) Report by the 78th meeting of the 5th Board of Managing Directors on Feb. 17, 2017: The Bank of Taiwan on Feb. 15, 2017 adopted a plan and on that same day established a “Working Group on Financing to Support the New Southbound Policy.”
(23) Report by the 10th meeting of the 5th Board of Directors on Feb. 24, 2017: “Report on the Bank’s Promotions System and Human Resource Training” and a “Human Resources Training Plan.”
(24) Passed by the 10th meeting of the 5th Board of Directors on Feb. 24, 2017: a. The Bank’s 2018 Business Plan (including the subsidiary).b. “Bank of Taiwan 2017 Compliance/Anti-Money Laundering and Countering Terrorism Financing Plan.”c. “Establishment Regulations for Anti-Money Laundering and Countering Terrorism Financing
Committee of Bank of Taiwan.”d. Feasibility Study for the Bank of Taiwan to Establish a Ho Chi Minh City Representative Office
in Vietnam, a Bangkok Representative Office in Thailand, and a Jakarta Representative Office in Indonesia.
(25) Passed by the 11th meeting of the 5th Board of Directors on Mar. 17, 2017: a. Audited 2016 individual and consolidated statements, Business Report, Statement of Income
Appropriation, and List of Major Properties.
b. Audited 2016 Internal Control System Recommendations.
10. Major Issues of Record or Written Statements Made by Any Director or Supervisor Dissenting to Important Resolutions Passed by the Board of Directors
None

3938
Corporate Governance Report
11. Resignation or Dismissal of Personnel Related to the BankMar. 31, 2017
Title Name Date of Appointment Date of Termination Reasons for Resignation or Dismissal
Chairperson Lee, Jih-Chu Aug. 9, 2013 Aug. 31, 2016 Personnel changes
President Shiau, Chang-Ruey Mar. 3, 2014 Aug. 31, 2016 Personnel changes
Executive Vice President Wei, Jan-Lin July 1, 2007 Oct. 28, 2016
Applying for Retirement, and being promoted as President of the BOT on
Oct. 28, 2016
Executive Vice President Chen, Hung Jan. 15, 2016 Dec. 30, 2016 Personnel changes
Note: “Personnel related to the Bank” refers to the chairperson, president, finance executive, accounting executive and chief internal auditor.
Ⅳ. CPA Information
1. Audit Fee
Name of Accounting Firm Name of CPA Period of Audit Notes
KPMG Certified Public Accountants Yen-Ling Fang Feng-Hui Lee Jan. 1, 2016 ~ Dec. 31, 2016
ItemsAmount Auditing Fees Non-Auditing Fees Total
Under NT$ 2,000,000
NT$2,000,000 ~ NT$4,000,000 3,548,000 2,491,000 6,039,000
NT$4,000,000 ~ NT$6,000,000
NT$6,000,000 ~ NT$8,000,000
NT$8,000,000 ~ NT$10,000,000
Over NT$10,000,000

2016 ANNUAL REPORT
BANK FTAIWAN
4140
2. Replacement of CPA
A. Regarding the former CPA
Replacement Date February 19, 2016
Replacement reasons and explanations Adjustment of Internal Organization in the KPMG Certified Public Accountants
Describe whether the Company terminated or the CPA did not accept the appointment
PartiesStatus
CPA The Company
Termination of appointment Not applicable Not applicable
No longer accepted (continued) appointment Not applicable Not applicable
Other issues (except for unqualified issues) in the audit reports within the last two years None
Differences with the company
Yes
Accounting principles or practices
Disclosure of Financial Statements
Audit scope or steps
Others
None Ⅴ
Remarks/specify details
Other Revealed Matters None
B. Regarding the successor CPA
Name of accounting firm KPMG Certified Public Accountants
Name of CPA Yen-Ling Fang, Feng-Hui Lee
Date of appointment February 19, 2016
Consultation results and opinions on accounting treatments or principles with respect to specified transactions and the company’s financial reports that the CPA might issue prior to the engagement
None
Succeeding CPA’s written opinion of disagreement toward the former CPA None

4140
Corporate Governance Report
Ⅴ. Numbers of Shares in the Same Reinvested Enterprises Held by the BOT and Its Directors, Supervisors, President, Executive Vice Presidents, Heads of Departments and Branches, and Enterprises Controlled Directly or Indirectly by the Bank, and Ratios of Consolidated Shareholding
Consolidated Shareholding RatiosDec. 31, 2016
Unit: Share; %
Reinvested Enterprise(Note)
Investment by the BOT
Investment by Directors, Supervisors, President, Executive
Vice Presidents, Heads of Departments and Branches, and Enterprises Directly or Indirectly
Controlled by the BOT
Consolidated Investment
No. of Shares Ratio of Shareholding No. of Shares Ratio of
Shareholding No. of Shares Ratio of Shareholding
First Financial Holding Co., Ltd. 892,854,588 7.45 326,746,334 2.73 1,219,600,922 10.18
Taiwan Business Bank 820,083,572 13.74 118,352 0.00 820,201,924 13.74
Cathay Financial Holding Co., Ltd. 63,521,565 0.51 12,619,136 0.10 76,140,701 0.61
Mega Financial Holding Co. 334,951,379 2.46 4,717,915 0.03 339,669,294 2.49
Taiwan Fire & Marine Insurance Co., Ltd. 64,608,278 17.84 998,866 0.28 65,607,144 18.12
China Development Financial Holding Corporation 238,729,496 1.59 1,564,802 0.01 240,294,298 1.60
Yuanta Financial Holding Co., Ltd. 242,813,206 2.01 3,982,701 0.03 246,795,907 2.04
CTBC Financial Holding Co., Ltd. 299,632,426 1.54 42,474,277 0.22 342,106,703 1.76
Taiwan Sugar Corporation 16,658,992 0.30 8,006,499 0.14 24,665,491 0.44
Taiwan Power Company 865,191,972 2.62 148,281,465 0.45 1,013,473,437 3.07
Taiwan Stock Exchange Corporation 67,762,619 10.01 20,305,056 3.00 88,067,675 13.01
China Trade & Development Corp. 1,250,110 1.91 0 0.00 1,250,110 1.91
China Daily News 62,882 0.14 0 0.00 62,882 0.14
Central Motion Picture Corporation 15,869,677 14.39 0 0.00 15,869,677 14.39
United Taiwan Bank S.A. 146,250 4.99 0 0.00 146,250 4.99
Taipei Forex Inc. 1,400,000 7.06 700,000 3.53 2,100,000 10.59
Taiwan Futures Exchange Corporation 6,273,007 2.05 6,019,019 1.97 12,292,026 4.02
Taiwan Asset Management Corporation 75,000,000 5.68 150,000,000 11.35 225,000,000 17.03
BankPro E-Service Technology Co., Ltd. 450,000 3.33 0 0.00 450,000 3.33
Taiwan Financial Asset Service Corporation 10,000,000 5.88 5,000,000 2.94 15,000,000 8.82
Financial Information Service Co., Ltd. 13,917,825 2.67 6,022,575 1.15 19,940,400 3.82
Financial eSolution Co., Ltd. 1,268,688 5.77 404,936 1.84 1,673,624 7.61
Sunny Asset Management Corporation 15,531 0.26 69,740 1.16 85,271 1.42
International Property & Finance Co., Ltd. 14,658 0.92 0 0.00 14,658 0.92
Taiwan Chung Hsing Paper Corporation 25,035,822 9.54 0 0.00 25,035,822 9.54
Taiwan Mobile Payment Co., Ltd. 1,200,000 2.00 600,000 1.00 1,800,000 3.00
Hua Nan Financial Holdings Co., Ltd. 2,233,632,741 21.23 404,345,061 3.84 2,637,977,802 25.07
Tang Eng Iron Works Co., Ltd. 74,802,414 21.37 16,074,512 4.59 90,876,926 25.96
Taiyi Real Estate Management Co., Ltd. 1,500,000 30.00 0 0.00 1,500,000 30.00
BankTaiwan Insurance Brokers Co., Ltd. 2,000,000 100.00 0 0.00 2,000,000 100.00
Note: Investment according to Article 74 of the Banking Act.

4342
Capital Overview
43 Ⅰ. Capital and Shares
44 Ⅱ. Issuance of Financial Bonds
45 Ⅲ. Comments on Implementation of Capital Allocation Plan

4342
Capital Overview
Capital Overview Ⅰ. Capital and Shares
1. Source of Capital
Month/Year Par ValueAuthorized Capital Paid-in Capital Remark
Shares Amount Shares Amount Sources of Capital Others
Dec. 2016 NT$10 9.5 billion NT$95 billion 9.5 billion NT$95
billion
Appropriation from the National Treasury, and a capital increase of NT$5 billion due to a merger with the Central Trust of China. A capital increase of NT$25 billion was carried out in 2010, and another NT$25 billion capital increase (from capital surplus) was carried out in 2014.
2. Net Worth, Earnings, and Dividends Per Share Unit: NT$; Share
Year Items 2016 2015
Net Worth Per ShareBefore Appropriation 28.89 26.83
After Appropriation 28.84 26.78
Earnings Per ShareWeighted Average Issued Shares 9,500,000,000 9,500,000,000
Earnings Per Share (After Tax) 1.86 0.93
Dividends Per Share Cash Dividends 0.05 0.04
Notes: Figures for 2015 are approved by the National Audit Office; figures for 2016 are CPA approved.
3. Dividend Policy and Implementation Status
(1) Dividend PolicyThe BOT Charter stipulates that if the final annual accounts show a profit, the profit will be distributed as follows:A. Payment of the income tax;B. Making up of losses for previous years;C. Allocation of 30% for legal reserve;D. Allocation of 20~40% of the surplus, and allocation of special reserve according to rule.Any remaining profits will be distributed, together with undistributed profits from the previous year, in accordance with the relevant laws and regulations.Until the legal reserve reaches the total amount of capital, the maximum distribution of profits in the form of cash may not exceed 15% of the capitalization.
(2) Current Distribution of Stock DividendsFollowing the write-down or offset of losses (remeasurements (losses) of defined benefit plans) through allocation of legal reserve and special reserve from the audited after-tax profit for 2016, the Bank decided to distribute a cash dividend of NT$0.5 billion, or NT$0.05 per share. Under Article 50 of the Audit Act, however, the final determinant of the BOT’s profit is the National Audit Office. Since the Bank’s 2016 final budget is still under examination by the National Audit Office, the actual amount of cash dividends distributed will be determined after the National Audit Office completes its examination.
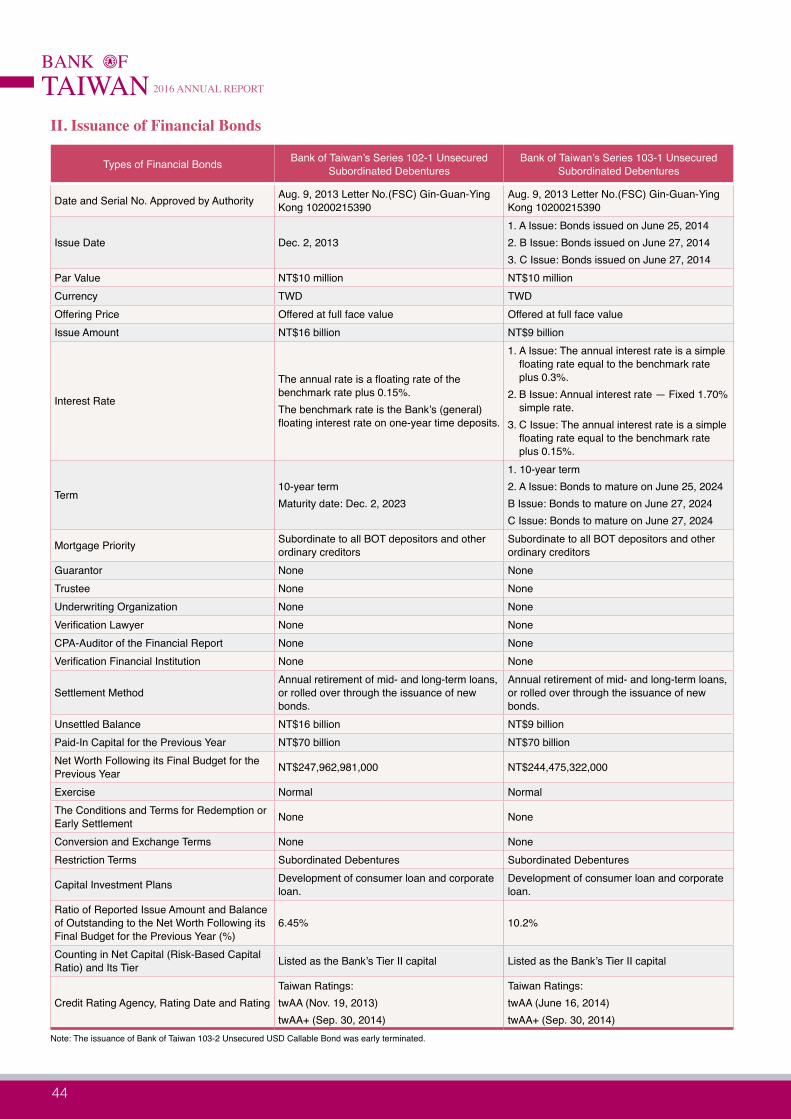
2016 ANNUAL REPORT
BANK FTAIWAN
4544
Ⅱ. Issuance of Financial Bonds
Types of Financial Bonds Bank of Taiwan’s Series 102-1 Unsecured Subordinated Debentures
Bank of Taiwan’s Series 103-1 Unsecured Subordinated Debentures
Date and Serial No. Approved by Authority Aug. 9, 2013 Letter No.(FSC) Gin-Guan-Ying Kong 10200215390
Aug. 9, 2013 Letter No.(FSC) Gin-Guan-Ying Kong 10200215390
Issue Date Dec. 2, 20131. A Issue: Bonds issued on June 25, 20142. B Issue: Bonds issued on June 27, 20143. C Issue: Bonds issued on June 27, 2014
Par Value NT$10 million NT$10 millionCurrency TWD TWDOffering Price Offered at full face value Offered at full face valueIssue Amount NT$16 billion NT$9 billion
Interest Rate
The annual rate is a floating rate of the benchmark rate plus 0.15%.The benchmark rate is the Bank’s (general) floating interest rate on one-year time deposits.
1. A Issue: The annual interest rate is a simple floating rate equal to the benchmark rate plus 0.3%.
2. B Issue: Annual interest rate — Fixed 1.70% simple rate.
3. C Issue: The annual interest rate is a simple floating rate equal to the benchmark rate plus 0.15%.
Term10-year termMaturity date: Dec. 2, 2023
1. 10-year term2. A Issue: Bonds to mature on June 25, 2024B Issue: Bonds to mature on June 27, 2024C Issue: Bonds to mature on June 27, 2024
Mortgage Priority Subordinate to all BOT depositors and other ordinary creditors
Subordinate to all BOT depositors and other ordinary creditors
Guarantor None NoneTrustee None NoneUnderwriting Organization None NoneVerification Lawyer None NoneCPA-Auditor of the Financial Report None NoneVerification Financial Institution None None
Settlement MethodAnnual retirement of mid- and long-term loans, or rolled over through the issuance of new bonds.
Annual retirement of mid- and long-term loans, or rolled over through the issuance of new bonds.
Unsettled Balance NT$16 billion NT$9 billionPaid-In Capital for the Previous Year NT$70 billion NT$70 billionNet Worth Following its Final Budget for the Previous Year NT$247,962,981,000 NT$244,475,322,000
Exercise Normal NormalThe Conditions and Terms for Redemption or Early Settlement None None
Conversion and Exchange Terms None NoneRestriction Terms Subordinated Debentures Subordinated Debentures
Capital Investment Plans Development of consumer loan and corporate loan.
Development of consumer loan and corporate loan.
Ratio of Reported Issue Amount and Balance of Outstanding to the Net Worth Following its Final Budget for the Previous Year (%)
6.45% 10.2%
Counting in Net Capital (Risk-Based Capital Ratio) and Its Tier Listed as the Bank’s Tier II capital Listed as the Bank’s Tier II capital
Credit Rating Agency, Rating Date and RatingTaiwan Ratings:twAA (Nov. 19, 2013)twAA+ (Sep. 30, 2014)
Taiwan Ratings:twAA (June 16, 2014)twAA+ (Sep. 30, 2014)
Note: The issuance of Bank of Taiwan 103-2 Unsecured USD Callable Bond was early terminated.

4544
Capital Overview
Ⅲ. Comments on Implementation of Capital Allocation Plan
1. Description of Plan
(1) In order to keep the BIS ratio at a proper level, and to meet mid- to long-term credit capital needs, the Bank filed a debt issue plan with the competent authority in 2013. On 9 August 2013, the competent authority approved (per Aug. 9, 2013 Letter No. (FSC) Gin-Guan-Ying Kong 10200215390) the issuance of NT$25 billion in unsecured subordinated debentures.
(2) In order to bolster its foreign-currency funds, the Bank filed a debt issue plan with the competent authority, which approved the plan on 23 August 2016 (per Aug. 23, 2016 Letter No. (FSC) Gin-Guan-Ying Kong 10500198980). Under the plan, BOT will issue US$1 billion in foreign-currency revolving debt at an appropriate time.
2. Status of Implementation
(1) On 2 December 2013, the Bank of Taiwan issued NT$16 billion in its Series 102-1 Unsecured Subordinated Debentures. The debentures have a 10-year term, the annual rate is a floating rate of the benchmark rate plus 0.15%, and will all be retired at maturity.
(2) On 25 June 2014, the Bank of Taiwan issued NT$5.5 billion in its Series 103-1 Unsecured Subordinated Debentures (A Issue). The debentures have a 10-year term, the annual rate is a simple floating rate of the benchmark rate plus 0.3%, and will all be retired at maturity.
(3) On 27 June 2014, the Bank of Taiwan issued NT$2 billion in its Series 103-1 Unsecured Subordinated Debentures (B Issue). The debentures have a 10-year term, the annual rate is a fixed 1.70% simple rate, and will all be retired at maturity.
(4) On 27 June 2014, the Bank of Taiwan issued NT$1.5 billion in its Series 103-1 Unsecured Subordinated Debentures (C Issue). The debentures have a 10-year term, the annual rate is a simple floating rate of the benchmark rate plus 0.15%, and will all be retired at maturity.
3. Effect of Implementation
The proceeds from the aforementioned debt issue raised the Bank’s BIS ratio from 10% at end-November 2013 to 10.73% at end-December 2013, and from 10.89% at end-May 2014 to 11.14% at end-June 2014. The capital thus raised has been used for mid- and long-term credit capital.

4746
Operational Highlights
47 Ⅰ. Business Activities
56 Ⅱ. Human Resources
57 Ⅲ. Corporate Responsibility and Ethical Behavior
57 Ⅳ. Numbers of Non-managerial Employees, Average Annual Benefit Expenditures per Employee, and Changes from the Preceding Year
57 Ⅴ. Information Equipment
59 Ⅵ. Labor Relations

4746
Operational Highlights
Operational Highlights Ⅰ. Business Activities
1. Main Areas of Business Operations
(1) DepositsTotal deposits in the Bank at the end of December 2016 amounted to NT$3,874.8 billion, equal to 81.22% of the NT$4,771.0 billion in the Bank’s total assets and representing an increase of 0.95% over the previous year. Demand deposits in 2016 grew by 3.17%, and public treasury deposits increased by 4.53% over the year before.
(2) Corporate BankingThe amount of the Bank’s total loans outstanding at the end of December 2016 (including general loans as well as import and export negotiations) stood at NT$2,302.3 billion, equal to 48.26% of the Bank’s total assets and reflecting a decrease of 4.47% over a year earlier. Corporate loans outstanding at the end of 2016 (including loans to government agencies and government-owned enterprises) amounted to NT$1,450.9 billion, accounting for 30.41% of the Bank’s total assets and representing a decrease of 8.08% from the previous year. SME loans outstanding at the end of 2016 amounted to NT$341.4 billion, reflecting an increase of 1.70% from a year earlier. According to statistics from the specialized syndicated loan magazine Basis Point, the BOT’s performance as lead bank for syndicated loans in 2016, calculated as market share, mandated lead arranger and quota bookrunner, placed it first in the Taiwan’s domestic market for the fifth consecutive year.
Balance of Deposits Structure of Deposits
Unit: NT$ Billion
(Year-end)2,000
2,400
2,800
3,200
3,600
4,000
2009 2010 2011 2012 2013 2014 2015 2016
3,222.1 3,189.3 3,220.8
3,410.93,552.7
3,297.6
3,838.5 3,874.8
Demand Deposits33.31%
Public Treasury Deposits6.67%
Time Deposits60.02%
Dec. 31, 2016
Unit: NT$ Billion
(Year-end)2009 2010 2011 2012 2013 2014 2015 2016
2,041.3 2,079.12,163.3 2,185.0
2,251.72,318.0
2,410.12,302.3
1,000
1,400
1,800
2,200
2,600
Private Enterprises31.64% Government Agencies
15.63%
Government Enterprises6.88%
Individuals36.98%
Foreign8.85%
Other0.02%
Dec. 31, 2016
Balance of Loans Structure of Loans

2016 ANNUAL REPORT
BANK FTAIWAN
4948
(3) Consumer Banking
Consumer loans outstanding at the end of 2016 amounted to NT$799.1 billion, NT$24.3 billion more than a year earlier for a growth of 3.13%. This occurred mainly because the Bank worked in line with market development trends, launching different types of preferential loans for different customers and areas in an active effort to solicit the business of high-quality buyers of owner-occupied homes. And in support of government policy, the Bank continued to offer various kinds of policy-driven personal loans to help consumers buy homes, start businesses, and further their education.
(4) Foreign Exchange and International Banking
The amount of foreign exchange transactions undertaken during the year reached US$383.85 billion. A total of 158 branches were designated to handle foreign exchange services and 446 foreign-currency exchange bureaus at the end of 2016. The Bank has established correspondent banking relationships with 2,307 financial institutions in a web that covers major cities throughout the world.The Bank also had an Offshore Banking Branch and overseas branches in New York, Los Angeles, Hong Kong, Tokyo, Singapore, South Africa, London, Shanghai, Guangzhou, and Fuzhou. In addition to the deposit, loan, remittance, and import and export trade financing businesses, the Bank participated in international syndicated loans and engaged in international bond investment. The Bank has also set up representative offices in Mumbai (India) and Yangon (Myanmar) to collect information on local business conditions and take advantage of business opportunities as they arise throughout Asia. At the end of 2016, the total assets of these overseas branches and OBU amounted to US$19.37 billion.
Foreign Exchange Operations
Unit: US$ Billion
(Year)2009 2010 2011 2012 2013 2014 2015 2016100
150
200
250
300
350
400
450
372.52
403.25
228.54217.96
339.34
410.80 413.32
383.85
Innolux Corporation signs an agreement for a syndicated loan of NT$35 billion from BOT and 14 other banks.

4948
Operational Highlights
(5) Electronic BankingAt the end of 2016, the accumulated number of internet banking transfer accounts stood at 3.22 million. Transfers carried out during the year stood at 11.02 million. The number of internet forex transactions amounted to 2.38 million. Online purchase requests for funds amounted to 1.76 million. Gold Passbook internet transactions numbered 0.69 million. The number of Corporate e-Banking Site accounts stood at 63.3 thousand. Transfer transactions undertaken via the Bank’s Corporate e-Banking site in 2016 numbered 5.53 million, up 4.93% from 2015, while corporate online foreign exchange transactions came to 0.20 million (up 6.88% from 2015). As of year-end 2016, the Bank’s BOTPay service, an online transaction collection and payment platform, had more than 8,800 authenticated members. In addition, the Bank received a Superior Government Service Quality Award from the Ministry of Finance for its digital banking services.
(6) Trust BusinessAt the end of 2016, the average principal of trust property amounted to NT$405.5 billion, down 0.76% from the previous year. At the end of December 2016, the amount of assets under custodianship by the BOT totaled NT$1,570.2 billion, for an increase of 18.76% over the year earlier. Of this total, the outstanding amount of foreign assets under custodianship for investment in domestic securities was NT$575.0 billion, for a growth of 33.13% over the previous year; discretionary investment assets amounted to NT$375.8 billion, and boosted the BOT to first place in market share in the fourth quarter of 2016. In addition, 177,793 enterprise units opened worker retirement fund accounts with total deposits of NT$1,661.4 billion, retirement payments amounting to NT$908.4 billion, and trust funds outstanding of NT$753.0 billion.
(7) InvestmentA. Bills Finance
Short-term bills transactions by the Bank in 2016 totaled NT$8,765.0 billion, a growth of NT$563.0 billion over a year earlier. The outstanding amount of bills dealing at the end of the year stood at NT$883.0 billion, of which Central Bank negotiable certificates of deposit (NCD) accounted for NT$847.7 billion and foreign currency NCD accounted for US$0.1 billion (1 USD = 32.22 TWD). Due to the impact of an interest rate cut by the Central Bank, money market interest rates declined and bills finance business volume rose from the previous year. However, gains from bills trading came to NT$4.6 billion, lower than the previous year.
B. Bond(a) Proprietary Bond Dealing
The Bank’s dealing in government bonds amounted to a total of NT$49.55 billion in 2016, of which government bonds purchased amounted to NT$43.72 billion and government bonds sold totaled NT$5.83 billion. Repurchase agreements amounted to NT$341.98 billion, and reverse repo agreements totaled NT$50 million.
(b) Bond UnderwritingThe Bank in 2016 acted as the underwriter for Formosa Bonds issued by the Crédit Agricole CIB and Hitachi Capital (UK) PLC. In addition, the Bank was also the underwriter for International Bonds issued by Arab Petroleum Investments Corporation, Central American Bank for Economic Integration, The Bank of Tokyo-Mitsubishi UFJ, Ltd., BNP Paribas, Banco Santander Chile, and Morgan Stanley.

2016 ANNUAL REPORT
BANK FTAIWAN
5150
(c) Bond InvestmentsThe Bank expanded its foreign currency bond positions in 2016 to put free capital to use and achieve better capital efficiency, and also invested in bond funds to diversify its investment channels.
C. ReinvestmentAt the end of 2016, the Bank had investments in 30 enterprises with the book value of the investments totaling NT$65.37 billion, a decrease of NT$0.59 billion, or 0.9%, from the year before, due primarily to liquidation of an investment in Kaohsiung Ammonium Sulfate Co. Profit on long-term equity investments amounted to NT$19.02 billion in 2016, derived mainly from stock dividends and the benefit from booking by the equity method (including a one-time real-estate asset revaluation gain of NT$13.31 billion following the liquidation of Kaohsiung Ammonium Sulfate Co.).
D. Short-term Investment (in Stocks and Funds)At the end of 2016, the costs of the Bank’s investment in stocks were NT$5.78 billion, and the operating volumes were NT$5.99 billion, and the total return on investment (including unrealized gains or losses) was 13.07%. At the end of 2016 the costs of the Bank’s investment in NT Dollar dominated equity funds certificates were NT$0.28 billion, the operating volumes were NT$0.35 billion, and the return on investment was 0.31%; the costs of the Bank’s investment in foreign-currency equity funds certificates were US$8.6 million, the operating volumes were US$8.5 million, and the return on investment was 4.13%. The costs of the Bank’s investment in foreign-currency overseas ETFs were US$30 million, the operating volumes were US$37 million, and the return on investment was 6.95%.
(8) Business Derived from the Issuance of NT Dollar Currency for the Central BankAs mandated by the Central Bank, the BOT handles collection and payment, transport, regulation of supply and demand, and the recovery of worn bills associated with the issuance of NT currency. The average amount of currency in circulation in 2016 was NT$1,902.4 billion, an increase of 6.25% over the previous year. The peak amount in circulation was NT$2,233.9 billion, also an increase of 5.04% over the 2015 peak. The amount in circulation at the end of the year was NT$1,938.1 billion, 7.40% more than year-end 2015.
(9) Government Employees InsuranceAt the end of 2016, there were 7,438 insured units and 578,724 insured persons, and income on insurance premiums in 2016 amounted to NT$22.78 billion, and 53,387 claims totaling NT$29.85 billion were paid that year. For 2016, the balance of civil servants’ and teachers’ insurance was NT$18.84 billion, as well as the balance of retirement insurance was NT$1.14 million, the full amount of which was allocated to reserves respectively.
(10) Procurement BusinessThe primary mission of the BOT’s procurement business is to execute the government’s centralized procurement policy in carrying out procurement on behalf of government agencies, public schools, as well as government enterprises. The Bank also coordinates with government policy in carrying out special procurement projects designated by the government. The volume of the procurement business in 2016 amounted to NT$30.77 billion.

5150
Operational Highlights
(11) Wealth Management ServiceThe fee income of the wealth management business in 2016 amounted to NT$2.16 billion (not including fee income earned by BankTaiwan Insurance Brokers Co.), for a growth of 5.99% over the year earlier. At the end of 2016, a total of 145 business units were handling wealth management, nine of them were flagship units, and 221 wealth-management agents were in place to serve high-net-worth customers.
(12) Precious Metals BusinessThe operating volume of the precious metals business in 2016 was NT$115.7 billion, down by 8.6% year-on-year. Fee income from the handling of tariff-rate quotas and outsourced business services came to NT$48 million, down by 2.1% year-on-year.
2. Operating Plans for 2017
(1) DepositsThe Bank w i l l con t inue to op t im ize deposit structure; implement cross-selling mechanism; strengthen risk management; strengthen internal audits and controls; and reduce operational risks.
(2) Corporate BankingLoans to pr ivate enterpr ises wi l l be promoted continuously and loan r isk controls will be reinforced. The Bank will seek opportunities to lead or participate in syndicated loans at home and abroad; strengthen outsourced handling of OBU services, and actively expand overseas credit business; promote e-Loan and factoring businesses to increase credit and fee income; step up participation in the Project for Provision of Special Loans and Credit Guarantees by Financial Institutions to Non-SMEs Under the Economic Stimulus Plan; support government policy initiatives, including the New Southbound Policy, urban renewal, and the "five plus two" innovative industries by establishing a task force on special loans, drawing up plans to support the "five plus two" key innovative industries, and building up our corporate finance business.
(3) Consumer BankingThe Bank will continue to promote high-quality loans for owner-occupied homes; carry out overall promotion of student loan
The Chiayi City Government and BOT sign an agreement regarding a Chiayi City program to encourage loans to young entrepreneurs and small & medium businesses. The agreement was signed by Chiayi City Mayor Twu Shiing-jer (5th from right) and BOT Chairman Lyu Jye-Cherng (5th from left).

2016 ANNUAL REPORT
BANK FTAIWAN
5352
portal functions; actively undertake "Young Entrepreneur and Start-up Loans" and "Micro-business Start-up Phoenix Loans"; continue promoting HCE (host card emulation) credit cards; actively participate in efforts to build up mobile payments services and Fintech applications; and carry out public service activities in cooperation with the Taiwan Guide Dog Association to familiarize the public with the Bank's Guide Dog Affinity Card.
(4) Foreign Exchange and International BankingPromotion of the Bank’s foreign-currency deposit business and expansion of e-banking service will be continued. At the same time, the BOT will vigorously promote a variety of foreign-currency businesses to provide customers with one-stop shopping for financial services. In overseas operations, cultivation of overseas markets will be deepened, the international syndicated loans and bond investment business will be developed, online banking services will be strengthened; a funds allocation platform for offshore Taiwan-invested firms will be established; risk management mechanisms will be strengthened and the business results of overseas branches will be enforced.
(5) Electronic BankingUnder its Bank 3.0 program, the FSC has decided to allow customers to handle certain types of banking operations online. In response to this policy initiative, the Bank will actively work to launch personalized online banking services; will draw up plans to integrate overseas branch account services into the Corporate e-Banking site in order to reap maximum synergies from the Bank’s digital corporate finance services; will continue building out the electronic payments (BOTPay) system, and drawing up plans for collaboration with e-commerce websites to jointly launch and expand electronic payment services; and will carry out marketing via the Internet and mobile media to deepen consumer identification with the BOT brand.
(6) Trust BusinessThe Bank will continue to launch offshore bond products and add domestic and overseas fund products in combination with the wealth management business to increase the operating scale of fund and trust management products; continuously develop old-age trust products and property management trust of the disabled; and will actively develop the Bank's real estate development trust and escrow businesses and continue promoting its real estate escrow service.
(7) InvestmentThe Bank will continue to focus on the purchase of Central Bank negotiable certificates of deposit in its bills finance business; carry out bond investment under the principle of buying in batches in times of yield rebounds; actively seek opportunities to lead or participate in the underwriting of international bonds and Formosa bonds and continue expanding into Asia, Northern Europe, the US, Australia, and other markets where bank debentures and corporate bonds are relatively highly rated (investing primarily in bonds with international credit ratings of A- or higher); and continue to focus stock portfolio investment on blue chips, high cash dividend stocks, and ETFs. The principle of controlling risk-control positions will be observed, and hedging transactions will be used to lower market risk, and the Bank will continue with the appropriate management of the reinvestment business.

5352
Operational Highlights
(8) Government Employees InsuranceThe Bank will, in line with the policy of the competent authority, actively carry out the pensions business and related measures; improve business processes; continue holding Government Employees Insurance seminars; develop e-banking operations, and plan for expanded functionality; and strengthen the diversified utilization and management of the government insurance reserve.
(9) Wealth Management ServiceWealth management channel deployment will be reinforced to expand the service network of wealth management; the integrated marketing effect will be maximized for holding company products and sales channels; professional manpower training will be strengthened to deeply implant wealth management capability; and the Bank will continue holding financial planning seminars and provide professional advisory services.
(10) Precious Metals BusinessThe Bank will continue promoting new gold-related businesses and products, including precious metal options. It will reinforce customer services, providing the public with abundant and objective gold-related information. As a market maker and custodian bank for the Gold Trading Platform of the Taipei Exchange, the Bank helps investors to diversify their asset allocation.
3. Market Analysis
(1) Business operations areasThe BOT is a 100% government-owned bank, and all of its financial products are marketed to customers through business branches and internet. At the end of 2016, the BOT’s business units included 163 domestic branches and one Offshore Banking Branch, 13 overseas units (including New York Branch, Los Angeles Branch, London Branch, Hong Kong Branch, Singapore Branch, Tokyo Branch, South Africa Branch, Shanghai Branch, Guangzhou Branch, Fuzhou Branch, Shanghai JiaDing Sub-Branch, Mumbai Representative Office, and Yangon Representative Office).
(2) Future market supply and demand as well as growth prospectsLooking ahead to global economic prospects in 2017, despite the increased probability that the US will continue to raise interest rates, the fact remains that most central banks will still maintain accommodative monetary policies in an effort to get global economic growth back to normal. Based on the IMF economic growth forecasts for 2017, the global economy can be expected to perform better than in 2016. Taiwan’s 2017 economic growth rate is forecast to exceed the 2016 growth rate, with Taiwan’s Directorate-General of Budget, Accounting and Statistics (DGBAS) calling for growth of 1.92% while the IMF forecasts growth of 1.7%. Factors pushing in this direction include the fact that the government will continue pursuing financial liberalization, digitization, and internationalization. At the same time, the government will also help bankers to take active steps in the establishment of a stronger presence in the markets covered by the New Southbound Policy.
BOT released the commemorative silver coins and gold bars to mark the Year of the Rooster.

2016 ANNUAL REPORT
BANK FTAIWAN
5554
(3) Competitive NichesA. As the oldest bank in Taiwan, the BOT enjoys an outstanding reputation and the trust of the
public.B. An outstanding brand image and professional financial personnel, along with service channels
spread over the whole country, will facilitate the promotion of business in various areas.C. Financial holding company resources will be integrated to provide a comprehensive financial
product line that will satisfy customers’ diverse needs in financial services.(4) Factors Favorable and Unfavorable to the Bank’s Development Prospects
A. Favorable factors: a. The BOT is a 100% government-owned bank and has the highest credit rating of all domestic
banks; with a solid operating base, it enjoys the trust of the public. The Bank’s huge customer base facilitates efforts to solicit new business.
b. The Bank enjoys a No. 1 position in scale of deposits and loans, leadership among local banks in total assets and shareholders’ equity, and a solid operating strength.
c. The BOT is a subsidiary of Taiwan Financial Holdings, the resource-sharing platform of which reinforces the operation of the primary and cross-sales systems, and realizes the synergies of business integration.
d. The BOT serves as the cover bank for RMB cash in the Taiwan area and the settlement bank for the NT dollar in mainland China. This advantage facilitates the development of RMB-related businesses.
B. Unfavorable factors:a. As a bank that is 100% owned by the government, the BOT has a personnel system, budget,
and procurement that are relatively inflexible. The Bank’s organizational framework makes it difficult to respond to changes of the external environment in a timely manner and grasp early opportunities in the market.
b. Domestic banks in Taiwan have long been dealing with intense competition and a low interest rate spread environment. The BOT, on top of that, also shoulders policy missions, which reduces profitability.
c. Financial supervisory authorities are adopting increasingly stringent capital charge requirements. As a bank that is 100% owned by the government, profits are placed in the national treasury, and capital accumulation is slow; the resulting difficulty of boosting capital through cash injections weakens the Bank’s capital adequacy ratios.
d. The Bank holds massive deposits, a large share of which are time deposits, so the cost of funds is relatively high.
C. Countermeasures:a. The Bank will make optimum use of its big customer base, outstanding brand image, and
the holding company’s complete line of financial products to give full play to its integrated marketing capabilities and take advantage of group-wide market capabilities to generate operating revenues and profits.
b. In support of the government’s New Southbound Policy, the Bank will seek out opportunities to set up new overseas business locations and upgrade the functions of existing ones, thereby strengthening its presence in Asian markets while bolstering the Bank’s overseas business

5554
Operational Highlights
capabilities and international visibility.c. The Bank will adjust the allocation of assets and liabilities and the structure of its equity
investments to enhance capital efficiency; will seek permission to reduce or discontinue its contributions to the national treasury; will raise its retention ratio for special reserves; and will use diverse means, including capital increase by property, to strengthen capital.
d. The Bank will increase customer stickiness with its state-run and private-sector corporate clients, thus improving deposit structure and cutting the cost of funds by increasing demand deposits as a share of total deposits. In addition, the Bank will also improve capital efficiency in order to increase returns and earnings.
4. Financial Product R&D and Business Development
The Bank has established “Guidelines for Handling the Suggestion System,” enabling employees to make suggestions online via the internal global information network. Bonuses are given for suggestions that are adopted following evaluation and approval. The Bank received a total of 394 staff suggestions in 2016, of which 119 were adopted, in whole or in part, and incentives in the amount of NT$64,800 were granted.
(1) Major Financial Products and New Business Units Added in the Past Two Years, and Scale and Profit and Loss Situation Up to Date of Publication of the Annual ReportA. For major financial products during the past two years, refer to “Results of Implementation of
Business Plan and Operating Strategy” on page 9.B. Establishment of new business units:
a. The Shanghai JiaDing Sub-Branch in China was established on July 1, 2015.b. The Guangzhou Branch in China was established on September 1, 2015.c. The Yangon Representative Office in Myanmar opened for business on December 18, 2015.d. The Fuzhou Branch in China was established on June 6, 2016.
(2) R&D Expenditures and Results for the Past Two Years, and Future R&D PlansR&D spending amounted to NT$7,619,000 in 2016 and NT$6,966,000 in 2015. To respond to changes in the financial environment and the needs of business development, and to encourage employees to pursue self-development, the Bank will continue to carry out research related to reform and development of its own business as well as to the financial business in general, and will continue to implement the employee suggestion program as well as self-initiated research and overseas study by employees.
5. Long-term and Short-term Development
(1) Short-term development planA. The government policies will be implemented, and the loan business will be expanded.B. The loan structure will be optimized, and credit risk management will be strengthened.C. The credit card business and service will be reinforced to generate operating revenues.D. Introduce a diverse range of insurance products to satisfy customer needs.E. Financial instruments will be used appropriately to reinforce the performance of asset utilization.F. Promote financial services tailored to the needs of an ageing society, and build up the Bank’s

2016 ANNUAL REPORT
BANK FTAIWAN
5756
business in the market for senior citizens’ business.G. The business opportunities in the New Southbound countries will be grasped to expand the
scope and scale of overseas business.H. The Bank will further build up its digital financial business to consolidate its position as an
industry leader.I. Improve the quality of the Bank’s information services, upgrade information security, and reap
increased benefits from information.J. The channel deployment will be expanded, actively promote wealth management service.
(2) Long-term development planThe Bank will conduct various businesses in line with government policy, and will also actively develop core businesses while cultivating overseas markets and accelerating expansion in Asia-Pacific markets. At the same time, BOT intends to act in accordance with its 5P business operating policy while also implementing a 5S corporate culture (Simple organization, Simple goals, Simple decision making process, Simple strategy, Simple intra-group relationship). This will help us build a more effective organization, establish a high-quality corporate culture, and advance in the direction of becoming an outstanding Asia-Pacific bank.
Ⅱ. Human Resources Employee Statistics
YearItems 2015 2016 As of Mar. 31, 2017
Number of Employees
Staff 7,214 7,203 7,233
Guards 140 138 140
Janitors 636 641 652
Total 7,990 7,982 8,025
Average Age 45.32 45.53 45.33
Average Years of Service 18.32 18.42 18.16
Education (%)
Ph.D. 0.06 0.04 0.04
Master 16.61 17.93 18.21
Bachelor’s Degree 73.52 72.75 72.68
Senior High School 8.52 8.08 7.96
Below Senior High School 1.29 1.20 1.11
Note: The above numbers do not include contract salespersons, contract workers, and overseas locally recruited staff.

5756
Operational Highlights
Ⅲ. Corporate Responsibility and Ethical Behavior
The Bank makes every effort to attain the budget targets set by the government, coordinates with the government’s major construction plans and participates actively in the financing of infrastructure projects as well as large private investment projects in order to promote overall national economic development. Furthermore, the Bank will also participate in public welfare activities to pay back to the public and fulfill corporate social responsibility.
Ⅳ. Numbers of Non-managerial Employees, Average Annual Benefit Expenditures per Employee, and Changes from the Preceding Year
The Bank had 7,809 non-managerial employees in 2015, and 7,801 in 2016. Average benefit expenditures came to NT$1,478,536 per non-managerial employee (baseline date: 31 December 2015) in 2015, and NT$1,495,329 in 2016 (31 December 2016), an increase of NT$16,793 from 2015 to 2016.
Ⅴ. Information Equipment
1. Installation and Maintenance of Hardware and Software for Major Information Systems
The Bank’s core accounts system and overseas system consist of an exclusive server platform for deposit, foreign exchange, loan, and remittance account transactions; an open-system server for the trust, credit card, bonds, and notes businesses; and an operations management support system. These systems are connected to an open-system server through the “Enterprise Application Integration (EAI)” to make up a comprehensive back-office system for financial operations.
The Bank builds up a comprehensive financial service network that, in addition to traditional teller operations, has a front-end system that includes a global information network, ATM system, internet
BOT, Taiwan Financial Holdings and BankTaiwan Life Insurance held a ceremony for the release of funds raised in a joint public service donation drive. BOT Chairman Lyu Jye-Cherng (front row, center) and members of senior management are shown here in a group photo together with representatives of Renyou Sanatorium and Erhlin Happy Christian Homes.

2016 ANNUAL REPORT
BANK FTAIWAN
5958
bank, corporate e-banking site, financial EDI, telephone banking, and mobile banking.
Key aspects of the Bank’s information system operations in 2016 included the following:
(1) The Bank won the Joint Credit Information Center’s Golden Security Award and Golden Quality Award.
(2) The Financial Supervisory Commission is pushing the development of a digitized financial environment (Bank 3.0). The Bank in January 2016 completed development of an online account opening system, began handling online opening of digital deposit accounts, and started issuing chip cards with digital account functionality.
(3) In order to achieve real-time discovery of abnormal exchange rate fluctuations, the Bank added an exchange rate monitoring function to its foreign exchange system in April 2016.
(4) In May 2016, the Bank established “e-Counter” digital services areas and “customer greeter” robots at its business locations to help business units create innovative new facilities where customers can familiarize themselves with some of the latest technologies.
(5) In June 2016, the Bank’s overseas branches added new information system functionality that enables the branches to carry out real-time monitoring of available limits throughout the world, so that the entire group can be updated on card loading transactions and receive other reports.
(6) In August 2016, the Bank launched a new reverse mortgage program to provide senior citizens with access to the funds they need for a happy and fulfilling retirement while remaining in their own homes.
(7) To coordinate with anti-money laundering legislation in overseas jurisdictions where the Bank has branches, BOT in September 2016 established suspicious transactions monitoring systems for its branches in Hong Kong and South Africa, and adopted a set of “goAML” cash data reporting procedures for its South Africa branch.
(8) In November 2016 the Bank established an online query system for questions regarding the old Labor Pension Fund and made it available for use by the Ministry of Labor, county and municipality governments, and entities participating in the old labor pension system so that system users can check on payments into the Labor Pension Fund and make sure whether employers are paying in all they owe.
2. Future Development or Procurement Plans
(1) To coordinate with the counterfeit card liability shift program launched by an international consortium, the Bank updated its ATM software and hardware to make its systems EMV-capable and reduce its liability for fraudulent ATM transactions.
(2) The Bank established an anti-money laundering system to strengthen internal control procedures, maintain compliance with the competent authorities’ regulatory requirements, and fulfill its international corporate social responsibility.
(3) The money market function module in the Bank’s overseas branch core banking system was expanded to include a negative interest rate function. This change will improve efficiency and reduce operational risk at branch locations.
(4) In order to comply with the Best-Practice Principles for the Establishment by Banks of Risk-based

5958
Operational Highlights
Internal Audit Systems, the Bank established various risk factors, monitored changes in the risk factors of different company divisions, and adopted an internal audit quality evaluation mechanism.
3. Emergency Back-up and Security Measures
(1) Emergency BackupThe Bank formally inaugurated its integrated Taoyuan remote backup center to serve as a backup mechanism for the core accounts servers. Establishment of the Bank’s backup systems for open front-end systems that are important and that involve a large volume of transactions is steadily being completed. The outsourcing of the remote backup center, with the leasing of specialized infrastructure facilities, the operation and management of the specialized computer room, and the provision of emergency response management planning services, enhances the availability of the backup center.
(2) Safety ProtectionA. The Bank smoothly passed semi-annual, annual and triennial follow-up audits by the British
Standards Institution (BSI) in 2016, thus maintaining the following certifications: ISO 27001, BS 10012, ISO 22301, and ISO 20000.
B. To enhance information security control, better protect sensitive information, and make continued use of a previously acquired IP Workstation Maximum Authorization Management System, an email sensitive-information detection and protection system, and a Data Endpoint Protection System, the Bank in 2016 further established an Outlook Web Access Control Platform for Email and a Web Domain Workstation Security Screening Platform.
Ⅵ. Labor Relations
1. Employee Welfare Measures, Retirement System and Its Implementation, Labor-Ownership Agreements, and Measures for Protecting Employee Interests
The BOT is a government enterprise in an industry that is subject to the Labor Standards Act. Working conditions, welfare measures, and the retirement system are all handled in accordance with the provisions of the Labor Standards Act and other laws and regulations governing civil servants. The Bank addresses concrete requests raised by employees by establishing a labor-ownership meeting for negotiation and communication and, whenever necessary, by using various other occasions or human resources evaluation committees at various levels to communicate with employees, resolve points of contention, and build consensus. The Bank seeks what is in the best interests of both labor and management, taking care always to cultivate mutual trust and respect.
2. Losses Due to Labor-Ownership Disputes, Estimated Possible Current and Future Amounts that Might Occur, and Countermeasures
A response mechanism to prevent an interruption in case of strikes has been set up to cope with potential disputes and bring about their early resolution. In the event of a large and relatively damaging labor-management dispute, the Bank is prepared to seek personnel support from the competent authority and work with the labor authority, engaging in talks, labor dispute arbitration procedures, or litigation to reach a resolution as quickly as possible and minimize losses.

6160
Financial Information
61 Ⅰ. Five-Year Financial Summary
68 Ⅱ. Five-Year Financial Analysis
76 Ⅲ. Statement by the Audit Committee
76 Ⅳ. Financial Statements of Recent Years, and Independent Auditors’ Report
194 Ⅴ. Individual Financial Statements of Recent Years, and Independent Auditors’ Report

6160
Financial Information
Financial Information Ⅰ. Five-Year Financial Summary
1. Condensed Balance Sheets and Comprehensive Income Statements under IFRS
Condensed Consolidated Balance SheetsUnit: NT$1,000
YearItems 2016 2015 2014 2013 2012
Cash, cash equivalents, placement with Central Bank and call loans to banks 809,634,632 721,386,220 738,816,618 704,709,365 622,440,273
Financial assets measured at fair value through profit or loss 212,560,998 173,005,205 208,646,968 166,714,218 146,534,038
Available-for-sale financial assets 1,037,841,339 1,053,598,710 797,692,802 765,521,333 734,870,751
Hedging financial assets 21,221 15,970 25,613 5,443 3,543
Bills and bonds purchased under resell agreements - 50,040 1,956,563 6,173,451 4,980,621
Receivables, net 63,311,112 72,072,783 62,570,189 82,279,036 89,166,548
Current income tax assets 761,630 1,343,508 1,876,292 2,169,130 2,131,424
Assets held for sale, net - - - - -
Loans and discounts, net 2,274,236,504 2,386,598,795 2,298,237,964 2,240,652,458 2,177,133,260
Held-to-maturity financial assets 138,812,328 113,786,391 77,372,697 73,044,728 62,009,085
Investments under equity method, net 35,055,524 35,855,822 36,989,325 34,791,149 34,652,109
Restricted assets - - - - -
Other financial assets, net 76,578,794 68,891,471 68,466,496 70,317,802 69,668,204
Property and equipment, net 96,695,325 96,733,221 97,108,785 97,502,611 98,086,367
Investment property, net 15,238,207 - - - -
Intangible assets, net 803,225 853,946 941,417 1,048,025 1,164,105
Deferred tax assets, net 297,880 476,040 361,798 241,804 331,086
Other assetsBefore distribution 8,745,962 7,820,322 11,400,793 9,229,150 10,620,513
After distribution 8,745,962 7,820,322 7,750,867 5,630,335 6,026,501
Total assetsBefore distribution 4,770,594,681 4,732,488,446 4,402,464,320 4,254,399,703 4,053,791,927
After distribution 4,770,594,681 4,732,488,446 4,398,814,394 4,250,800,888 4,049,197,915
Deposits of Central Bank and other banks 227,596,814 225,425,517 156,988,830 252,738,244 213,374,465
Financing from Central Bank and banks - - - - -
Financial liabilities measured at fair value through profit or loss 6,709,063 39,224,475 47,915,342 3,999,496 4,876,954
Hedging financial liabilities 144,195 243,967 103,024 225,806 301,390
Bil ls and bonds sold under repurchase agreements 11,337,914 16,336,619 38,018,153 19,036,703 11,998,398

2016 ANNUAL REPORT
BANK FTAIWAN
6362
YearItems 2016 2015 2014 2013 2012
Payables 41,513,445 42,217,119 41,039,673 44,758,616 41,988,683
Current income tax liabilities 654,191 395,504 240,379 162,430 96,083
Liabilities related to assets held for sale - - - - -
Deposits and remittances 3,873,982,764 3,837,520,416 3,554,081,722 3,409,605,226 3,294,903,719
Bonds payable 24,998,082 24,997,826 24,997,612 15,998,240 -
Preferred stock liabilities - - - - -
Other financial liabilities 748,855 1,785,430 1,756,954 1,243,698 8,198,013
Provision 283,367,966 264,199,252 257,745,112 232,874,066 210,325,476
Deferred tax liabilities 18,173,159 18,340,284 18,348,772 18,299,657 18,359,086
Other liabilitiesBefore distribution 6,924,011 6,954,757 7,202,222 7,491,439 7,671,101
After distribution 7,424,011 7,354,757 7,297,671 7,491,439 7,844,210
Total liabilitiesBefore distribution 4,496,150,459 4,477,641,166 4,148,437,795 4,006,433,621 3,812,093,368
After distribution 4,496,650,459 4,478,041,166 4,148,533,244 4,006,433,621 3,812,266,477
Equity attributable to owners of the parent company - - - - -
Capital stockBefore distribution 95,000,000 95,000,000 95,000,000 70,000,000 70,000,000
After distribution 95,000,000 95,000,000 95,000,000 70,000,000 70,000,000
Capital surplus 80,453,034 80,453,034 80,521,742 105,496,092 105,453,034
Retained earningsBefore distribution 75,702,892 59,290,245 54,966,997 50,945,002 48,562,682
After distribution 75,202,892 58,890,245 51,221,622 47,346,187 43,795,561
Other equity 23,288,296 20,104,001 23,537,786 21,524,988 17,682,843
Treasury stock - - - - -
Non-controlling interests - - - - -
Total shareholders’ equity
Before distribution 274,444,222 254,847,280 254,026,525 247,966,082 241,698,559
After distribution 273,944,222 254,447,280 250,281,150 244,367,267 236,931,438
Note: Figures for 2012 are final audit accounts compiled by the CPA in accordance with domestic financial accounting standards and their interpretation fundamentals as stipulated by the National Audit Office, and were recompiled, following adjustment, in line with the International Financial Reporting Standards (IFRS); figures for 2013 and 2014 are readjusted by the CPA in accordance with figures approved by the National Audit Office; figures for 2015 are approved by the National Audit Office ; figures for 2016 are CPA approved.

6362
Financial Information
Condensed Consolidated Statements of Comprehensive IncomeUnit: NT$1,000
YearItems 2016 2015 2014 2013 2012
Interest income 59,402,785 64,758,332 65,232,885 59,252,283 56,039,716
Less: Interest expense 33,367,303 36,352,155 36,453,488 33,364,389 31,952,145
Net interest income 26,035,482 28,406,177 28,779,397 25,887,894 24,087,571
Non-interest income, net 18,658,370 6,807,204 7,274,161 3,609,713 4,786,638
Net Revenue 44,693,852 35,213,381 36,053,558 29,497,607 28,874,209
Bad debt expense and reserve for guarantees 5,183,736 4,404,468 7,284,809 2,625,044 3,107,865
Operating expenses 20,075,500 20,207,363 19,321,701 18,025,012 17,722,916
Income before tax from continued operations 19,434,616 10,601,550 9,447,048 8,847,551 8,043,428
Income tax expenses 1,785,645 1,730,852 1,245,800 1,429,623 862,560
Net income from continued operations 17,648,971 8,870,698 8,201,248 7,417,928 7,180,868
Gain (Loss) from discontinued operations - - - - -
Net income 17,648,971 8,870,698 8,201,248 7,417,928 7,180,868
Other comprehensive income 2,347,971 -4,235,860 1,432,360 3,557,719 3,139,909
Total comprehensive income 19,996,942 4,634,838 9,633,608 10,975,647 10,320,777
Net income attributed to owners of the parent company 17,648,971 8,870,698 8,201,248 7,417,928 7,180,868
Net income attributed to non-controlling interests - - - - -
Total comprehensive income attributed to owners of the parent company 19,996,942 4,634,838 9,633,608 10,975,647 10,320,777
Total comprehensive income attributed to non-controlling interests - - - - -
Earnings per share (NT$) 1.86 0.93 0.86 0.78 0.76
Notes: 1. Figures for 2012 are final audit accounts compiled by the CPA in accordance with domestic financial accounting standards and their interpretation fundamentals as stipulated by the National Audit Office, and were recompiled, following adjustment, in line with the International Financial Reporting Standards (IFRS); figures for 2013 and 2014 are readjusted by the CPA in accordance with figures approved by the National Audit Office; figures for 2015 are approved by the National Audit Office; figures for 2016 are CPA approved.
2. The Bank’s authorized capital was increased to NT$95 billion on October 15, 2014 and the Bank retroactively adjusts annual figures for earnings per share.

2016 ANNUAL REPORT
BANK FTAIWAN
6564
Condensed Individual Balance SheetsUnit: NT$1,000
YearItems 2016 2015 2014 2013 2012
Cash, cash equivalents, placement with Central Bank and call loans to banks 809,634,602 721,386,190 738,816,588 704,709,335 622,440,273
Financial assets measured at fair value through profit or loss 212,560,998 173,005,205 208,646,968 166,714,218 146,534,038
Available-for-sale financial assets 1,037,841,339 1,053,598,710 797,692,802 765,521,333 734,870,751
Hedging financial assets 21,221 15,970 25,613 5,443 3,543
Bills and bonds purchased under resell agreements - 50,040 1,956,563 6,173,451 4,980,621
Receivables, net 63,288,567 72,046,562 62,547,115 82,258,188 89,166,548
Current income tax assets 761,630 1,343,508 1,876,292 2,169,130 2,131,424
Assets held for sale, net - - - - -
Loans and discounts, net 2,274,236,504 2,386,598,795 2,298,237,964 2,240,652,458 2,177,133,260
Held-to-maturity financial assets 138,812,328 113,786,391 77,372,697 73,044,728 62,009,085
Investments under equity method, net 35,497,450 36,178,241 37,241,461 34,940,504 34,652,109
Restricted assets - - - - -
Other financial assets, net 76,578,794 68,891,471 68,466,496 70,317,802 69,668,204
Property and equipment, net 96,691,099 96,728,064 97,103,753 97,497,978 98,086,367
Investment property, net 15,238,207 - - - -
Intangible assets, net 802,989 853,571 940,987 1,047,495 1,164,105
Deferred tax assets, net 293,925 472,085 357,844 237,929 331,086
Other assetsBefore distribution 8,742,952 7,817,258 11,396,056 9,227,485 10,620,513
After distribution 8,742,952 7,817,258 7,746,130 5,628,670 6,026,501
Total assetsBefore distribution 4,771,002,605 4,732,772,061 4,402,679,199 4,254,517,477 4,053,791,927
After distribution 4,771,002,605 4,732,772,061 4,399,029,273 4,250,918,662 4,049,197,915
Deposits of Central Bank and other banks 227,596,814 225,425,517 156,988,830 252,738,244 213,374,465
Financing from Central Bank and banks - - - - -
Financial liabilities measured at fair value through profit or loss 6,709,063 39,224,475 47,915,342 3,999,496 4,876,954
Hedging financial liabilities 144,195 243,967 103,024 225,806 301,390
Bills and bonds sold under repurchase agreements 11,337,914 16,336,619 38,018,153 19,036,703 11,998,398
Payables 41,495,209 42,195,648 41,013,062 44,746,966 41,988,683
Current income tax liabilities 615,264 368,527 213,270 132,072 96,083
Liabilities related to assets held for sale - - - - -

6564
Financial Information
YearItems 2016 2015 2014 2013 2012
Deposits and remittances 3,874,447,418 3,837,851,868 3,554,349,701 3,409,797,342 3,294,903,719
Bonds payable 24,998,082 24,997,826 24,997,612 15,998,240 -
Preferred stock liabilities - - - - -
Other financial liabilities 748,855 1,785,430 1,756,954 1,243,698 8,198,013
Provision 283,367,966 264,199,252 257,745,112 232,850,278 210,325,476
Deferred tax liabilities 18,173,159 18,340,284 18,348,772 18,299,657 18,359,086
Other liabilitiesBefore distribution 6,924,444 6,955,368 7,202,842 7,482,893 7,671,101
After distribution 7,424,444 7,355,368 7,298,291 7,482,893 7,844,210
Total liabilitiesBefore distribution 4,496,558,383 4,477,924,781 4,148,652,674 4,006,551,395 3,812,093,368
After distribution 4,497,058,383 4,478,324,781 4,148,748,123 4,006,551,395 3,812,266,477
Equity attributable to owners of the parent company - - - - -
Capital stockBefore distribution 95,000,000 95,000,000 95,000,000 70,000,000 70,000,000
After distribution 95,000,000 95,000,000 95,000,000 70,000,000 70,000,000
Capital surplus 80,453,034 80,453,034 80,521,742 105,496,092 105,453,034
Retained earningsBefore distribution 75,702,892 59,290,245 54,966,997 50,945,002 48,562,682
After distribution 75,202,892 58,890,245 51,221,622 47,346,187 43,795,561
Other equity 23,288,296 20,104,001 23,537,786 21,524,988 17,682,843
Treasury stock - - - - -
Non-controlling interests - - - - -
Total shareholders’ equity
Before distribution 274,444,222 254,847,280 254,026,525 247,966,082 241,698,559
After distribution 273,944,222 254,447,280 250,281,150 244,367,267 236,931,438
Note: Figures for 2012 are final audit accounts compiled by the CPA in accordance with domestic financial accounting standards and their interpretation fundamentals as stipulated by the National Audit Office, and were recompiled, following adjustment, in line with the International Financial Reporting Standards (IFRS); figures for 2013 and 2014 are readjusted by the CPA in accordance with figures approved by the National Audit Office; figures for 2015 are approved by the National Audit Office; figures for 2016 are CPA approved.

2016 ANNUAL REPORT
BANK FTAIWAN
6766
Condensed Individual Statements of Comprehensive IncomeUnit: NT$1,000
YearItems 2016 2015 2014 2013 2012
Interest income 59,402,785 64,758,332 65,232,885 59,252,283 56,039,716 Less: Interest expense 33,367,745 36,352,682 36,453,834 33,364,505 31,952,145 Net interest income 26,035,040 28,405,650 28,779,051 25,887,778 24,087,571 Non-interest income, net 18,478,694 6,650,585 7,111,700 3,513,757 4,786,638 Net Revenue 44,513,734 35,056,235 35,890,751 29,401,535 28,874,209 Bad debt expense and reserve for guarantees 5,183,736 4,404,468 7,284,809 2,625,044 3,107,865 Operating expenses 19,958,435 20,098,410 19,201,141 17,955,435 17,722,916 Income before tax from continued operations 19,371,563 10,553,357 9,404,801 8,821,056 8,043,428 Income tax expenses 1,722,592 1,682,659 1,203,553 1,403,128 862,560 Net income from continued operations 17,648,971 8,870,698 8,201,248 7,417,928 7,180,868 Gain (Loss) from discontinued operations - - - - - Net income 17,648,971 8,870,698 8,201,248 7,417,928 7,180,868 Other comprehensive income 2,347,971 - 4,235,860 1,432,360 3,557,719 3,139,909 Total comprehensive income 19,996,942 4,634,838 9,633,608 10,975,647 10,320,777 Net income attributed to owners of the parent company 17,648,971 8,870,698 8,201,248 7,417,928 7,180,868
Net income attributed to non-controlling interests - - - - -
Total comprehensive income attributed to owners of the parent company 19,996,942 4,634,838 9,633,608 10,975,647 10,320,777
Total comprehensive income attributed to non-controlling interests - - - - -
Earnings per share (NT$) 1.86 0.93 0.86 0.78 0.76
Notes: 1. Figures for 2012 are final audit accounts compiled by the CPA in accordance with domestic financial accounting standards and their interpretation fundamentals as stipulated by the National Audit Office, and were recompiled, following adjustment, in line with the International Financial Reporting Standards (IFRS); figures for 2013 and 2014 are readjusted by the CPA in accordance with figures approved by the National Audit Office; figures for 2015 are approved by the National Audit Office; figures for 2016 are CPA approved.
2. The Bank’s authorized capital was increased to NT$95 billion on October 15, 2014 and the Bank retroactively adjusts annual figures for earnings per share.
2. Condensed Balance Sheets and Income Statements under Accounting Principles Generally Accepted in the Republic of China (ROC GAAP)
Condensed Balance SheetsUnit: NT$1,000
YearItems 2012
Cash, cash equivalent, placement with Central Bank and call loans to banks 622,440,273
Financial assets measured at fair value through profit or loss 146,534,038 Bonds and bills purchased under resell agreements 4,980,621 Receivables 91,271,394 Loans and discounts 2,177,133,260 Available-for-sale financial assets 734,870,751 Held-to-maturity financial assets 61,999,046 Investments under equity method 35,393,882 Other financial assets 69,672,866 Fixed assets 97,253,304

6766
Financial Information
YearItems 2012
Intangible assets 1,164,105
Other assetsBefore distribution 11,934,505 After distribution 7,340,493
Total assetsBefore distribution 4,054,648,045 After distribution 4,050,054,033
Deposits of Central Bank and other banks 213,374,465 Financial liabilities measured at fair value through profit or loss 4,876,954 Bonds and bills sold under repurchase agreements 11,998,398 Deposits and remittances 3,294,903,719 Borrowed from Central Bank and other banks, and financial bonds payable -
Preferred liability -Accrued pension liability 4,959,970 Other financial liabilities 8,499,403
Other liabilitiesBefore distribution 263,305,034 After distribution 263,478,142
Total liabilitiesBefore distribution 3,801,917,943 After distribution 3,802,091,051
Common stockBefore distribution 70,000,000 After distribution 70,000,000
Capital surplus 105,682,871
Retained earningsBefore distribution 33,697,990 After distribution 28,930,870
Unrealized gain or loss on financial assets 17,929,660 Cumulative translation adjustments - 800,300 Other items in shareholders’ equity 26,219,881
Total shareholders’ equityBefore distribution 252,730,102 After distribution 247,962,982
Note: Figures for 2012 are readjusted by the CPA in accordance with figures approved by the National Audit Office.
Condensed Income StatementsUnit: NT$1,000
YearItems 2012
Net interest income 24,675,639 Non-interest income, net 4,502,274 Bad debt expenses 3,107,865 Operating costs 17,984,064 Income (loss) before tax from continued operations 8,085,984 Income (loss) from continued operations 7,228,241 Gain (loss) from discontinued operations -Extraordinary gain or loss -Cumulative effect of changes in accounting principles -Net income 7,228,241 Earnings per share (after tax) (NT$) 0.76
Notes: 1. Figures for 2012 are readjusted by the CPA in accordance with figures approved by the National Audit Office.
2. The Bank’s authorized capital was increased to NT$95 billion on October 15, 2014 and the Bank retroactively adjusts annual figures for earnings per share.

2016 ANNUAL REPORT
BANK FTAIWAN
6968
CPA-Auditor of Financial ReportYear Name of Accounting Firm Name of CPA Audit Opinion
2012 KPMG Certified Public Accountants Yen-Ling Fang, Derek Hsu Modified Unqualified Opinion2013 KPMG Certified Public Accountants Yen-Ling Fang, Derek Hsu Modified Unqualified Opinion2014 KPMG Certified Public Accountants Yen-Ling Fang, Derek Hsu Modified Unqualified Opinion2015 KPMG Certified Public Accountants Yen-Ling Fang, Derek Hsu Modified Unqualified Opinion2016 KPMG Certified Public Accountants Yen-Ling Fang, Feng-Hui Lee Unqualified Opinion
Ⅱ. Five-Year Financial AnalysisConsolidated Financial Analysis under IFRS
Unit: NT$1,000; %
YearItems 2016 2015 2014 2013 2012
Operating Ability
Ratio of Loans to Deposits 59.42 62.79 65.25 66.02 66.26 Non-Performing Loan Ratio 0.26 0.23 0.31 0.44 0.52 Ratio of Interest Cost to Annual Average Deposits 1.09 1.23 1.27 1.25 1.27
Ratio of Interest Income to Annual Average Loans Outstanding 1.69 1.88 1.89 1.89 1.87
Total Assets Turnover (Times)* (Note 4) 0.94 0.77 0.83 0.71 0.72 Average Revenue per Employee* 5,517 4,343 4,485 3,674 3,596 Average Profit per Employee* 2,179 1,094 1,020 924 894
Profitability*
Return on Tier 1 Capital (%) (Note 4) 10.41 6.06 5.51 5.13 4.61 Return on Assets (%) (Note 4) 0.37 0.19 0.19 0.18 0.18 Return on Shareholders’ Equity (%) (Note 4) 6.67 3.49 3.27 3.03 3.01
Net Income Ratio (%) 39.49 25.19 22.75 25.15 24.87 Earnings per Share (NT$) (Note 8) 1.86 0.93 0.86 0.78 0.76
Financial Structure
Ratio of Liabilities to Assets 94.22 94.59 94.20 94.16 94.02 Ratio of Property and Equipment to Shareholders’ Equity 35.23 37.96 38.23 39.32 40.58
Growth RateRate of Asset Growth* 0.81 7.50 3.48 4.95 2.75 Rate of Profit Growth* (Note 5) 83.32 12.22 6.78 10.00 -
Cash Flow*Cash Flow Ratio (Note 6) 81.26 2.47 16.29 - 25.90 Cash Flow Adequacy Ratio (Note 7) 1,745.34 683.66 674.42 582.05 1,196.38 Cash Flow Satisfied Ratio (Note 6) 1,611.02 244.81 6,178.17 - 20,351.29
Liquidity Reserve Ratio 47.90 44.97 39.90 42.81 40.07 Loans to Parties with Material Relationship with the Bank 42,815,251 38,403,189 34,864,509 34,267,212 20,181,252
Ratio of Loans to Parties with Material Relationship with the Bank to Total Loans 1.79 1.53 1.44 1.45 0.88
Operating Scale
Market Share of Assets 9.50 9.68 9.34 9.83 10.31 Market Share of Net Worth 7.87 7.72 8.39 9.10 9.59 Market Share of Deposits 10.36 10.72 10.59 10.80 11.12 Market Share of Loans 8.29 8.90 8.78 9.06 9.29
*a. Total assets turnover, average revenue/profit per employee, the ratios related to profitability and the growth rate of profit increased, derived mainly from the benefit from booking by the equity method (including a real-estate asset revaluation gain of NT$13.3 billion following the liquidation of Kaohsiung Ammonium Sulfate Co.).
b. The growth rate of assets declined because asset growth in 2016 came to NT$38.1 billion, versus NT$330.0 billion in 2015.c. The ratios related to cash flow increased because the net cash inflow from operating activities in 2016 came to NT$182.9 billion, versus
NT$6.6 billion in 2015.

6968
Financial Information
Notes: 1. Figures for 2012 are final audit accounts compiled by the CPA in accordance with domestic financial accounting standards and their interpretation fundamentals as stipulated by the National Audit Office, and were recompiled, following adjustment, in line with the International Financial Reporting Standards (IFRS); figures for 2013 and 2014 are readjusted by the CPA in accordance with figures approved by the National Audit Office; figures for 2015 are approved by the National Audit Office; figures for 2016 are CPA approved.
2. Formulae used in calculations:
(1) Operating Ability
a. Ratio of loans to deposits = Annual average loans outstanding / Annual average deposits
b. Non-performing loan ratio = Non-performing loans / Total loans outstanding
c. Ratio of interest cost to annual average deposits = Interest cost related to deposits (Note 3) / Annual average deposits
d. Ratio of interest income to annual average loans outstanding = Interest income related to loans outstanding / Annual average amount of loans outstanding
e. Total assets turnover (times) = Net interest and non-interest income / Average Total Assets
f. Average revenue per employee = Net interest and non-interest income / Total number of employees
g. Average profit per employee = Net income / Total number of employees
(2) Profitability
a. Return on Tier 1 capital = Net income before tax / Total amount of Tier 1 capital
b. Return on assets = Net Income / Average total assets
c. Return on shareholders’ equity = Net income / Average net shareholders’ equity
d. Net income ratio = Net income / Net interest and non-interest income
e. Earnings per share = (Income attributable to owners of the parent company – preferred stock dividend) / Weighted average number of shares issued
(3) Financial Structure
a. Ratio of liabilities to assets = Total liabilities / Total assets
b. Ratio of property and equipment to shareholders’ equity = Net property and equipment / Net shareholders’ equity
(4) Growth Rate
a. Rate of asset growth = (Total assets for current year – total assets for previous year) / Total assets for previous year
b. Rate of profit growth = (Before-tax profit or loss for current year – before-tax profit or loss for previous year) / Before-tax profit for previous year
(5) Cash Flow
a. Cash flow ratio = Net cash flow from operating activities / (Call loans and overdrafts from banks + commercial paper + financial liabilities measured at fair value through profit or loss + bonds and bills sold under repurchase agreements + current portion of payables)
b. Cash flow adequacy ratio = Net cash flow from operating activities for the past five years / (Capital expenditures + cash dividends) for the past five years
c. Cash flow satisfied ratio = Net cash flow from operating activities / Net cash flow from investing activities
(6) Liquidity reserve ratio = Liquid assets specified by the Central Bank / Debt items for which liquidity reserves should be allocated
(7) Operating Scale
a. Market Share of Assets = Total assets / Total assets of the major financial institutions
b. Market Share of Net Worth = Net worth / Total net worth of the major financial institutions
c. Market Share of Deposits = Deposits / Total deposits of the major financial institutions
d. Market Share of Loans = Loans / Total loans of the major financial institutions
3. To reasonably express average interest rate, excess interest paid on preferential deposits was added back into total interest expenditures for 2016, 2015, 2014, 2013 and 2012 in the amounts of NT$10,776,622,000, NT$11,006,282,000, NT$10,663,770,000, NT$10,820,906,000 and NT$10,664,322,000, respectively.
4. The Bank began compiling its financial statements in accordance with IFRS in 2013. Figures for 2012 are final audit accounts compiled by the CPA in accordance with domestic financial accounting standards and their interpretation fundamentals as stipulated by the National Audit Office, and were recompiled, following adjustment, in line with the International Financial Reporting Standards (IFRS). The “Rate of Return” for 2012 uses the Jan. 1, 2012 initial amount and 2012 Tier 1 Capital and asset or net value average. For 2013, the average amounts of the preceding items for 2012 and 2013 are used. For 2014, the average amounts of the preceding items for 2013 and 2014 are used. For 2015, the average amounts of the preceding items for 2014 and 2015 are used. For 2016, the average amounts of the preceding items for 2015 and 2016 are used.
5. Result of not using IFRS in compilation of financial statement amounts in 2011.
6. Net cash outflow produced by operating activities in 2013, making it impossible to calculate this ratio.
7. Net cash flow adequacy ratios for 2012 were calculated using net cash flows from operating activities for the current year/(capital expenditures + cash dividends); for 2013 [2014/2015/2016] were calculated using net cash flows from operating activities for past two [three/ four/ five] years/(capital expenditures + cash dividends).
8. The Bank’s authorized capital was increased to NT$95 billion on October 15, 2014 and the Bank retroactively adjusts annual figures for earnings per share.

2016 ANNUAL REPORT
BANK FTAIWAN
7170
Individual Financial Analysis under IFRSUnit: NT$1,000; %
YearItems 2016 2015 2014 2013 2012
Operating Ability
Ratio of Loans to Deposits 59.42 62.79 65.25 66.02 66.26
Non-Performing Loan Ratio 0.26 0.23 0.31 0.44 0.52
Ratio of Interest Cost to Annual Average Deposits 1.09 1.23 1.27 1.25 1.27
Ratio of Interest Income to Annual Average Loans Outstanding 1.69 1.88 1.89 1.89 1.87
Total Assets Turnover (Times) * (Note 4) 0.94 0.77 0.83 0.71 0.72
Average Revenue per Employee* 5,519 4,342 4,481 3,674 3,596
Average Profit per Employee* 2,188 1,099 1,024 927 894
Profitability*
Return on Tier 1 Capital (%) (Note 4) 10.38 6.03 5.49 5.11 4.61
Return on Assets (%) (Note 4) 0.37 0.19 0.19 0.18 0.18
Return on Shareholders’ Equity (%) (Note 4) 6.67 3.49 3.27 3.03 3.01
Net Income Ratio (%) 39.65 25.30 22.85 25.23 24.87
Earnings per Share (NT$) (Note 8) 1.86 0.93 0.86 0.78 0.76
Financial Structure
Ratio of Liabilities to Assets 94.23 94.59 94.20 94.16 94.02
Ratio of Property and Equipment to Shareholders’ Equity 35.23 37.96 38.23 39.32 40.58
Growth RateRate of Asset Growth* 0.81 7.50 3.48 4.95 2.75
Rate of Profit Growth* (Note 5) 83.56 12.21 6.62 9.67 -
Cash Flow*
Cash Flow Ratio (Note 6) 81.26 2.45 16.30 - 25.90
Cash Flow Adequacy Ratio (Note 7) 1,745.42 683.58 674.62 582.05 1,196.38
Cash Flow Satisfied Ratio (Note 6) 1,611.45 247.61 5,980.34 - 20,351.29
Liquidity Reserve Ratio 47.90 44.97 39.90 42.81 40.07
Loans to Parties with Material Relationship with the Bank 42,815,251 38,403,189 34,864,509 34,267,212 20,181,252
Ratio of Loans to Parties with Material Relationship with the Bank to Total Loans 1.79 1.53 1.44 1.45 0.88
Operating Scale
Market Share of Assets 9.50 9.68 9.34 9.83 10.31
Market Share of Net Worth 7.87 7.72 8.39 9.10 9.59
Market Share of Deposits 10.37 10.72 10.59 10.81 11.12
Market Share of Loans 8.29 8.90 8.78 9.06 9.29
*a. Total assets turnover, average revenue/profit per employee, the ratios related to profitability and the growth rate of profit increased, derived mainly from the benefit from booking by the equity method (including a real-estate asset revaluation gain of NT$13.3 billion following the liquidation of Kaohsiung Ammonium Sulfate Co.).
b. The growth rate of assets declined because asset growth in 2016 came to NT$38.2 billion, versus NT$330.0 billion in 2015.c. The ratios related to cash flow increased because the net cash inflow from operating activities in 2016 came to NT$182.9 billion, versus
NT$6.6 billion in 2015.

7170
Financial Information
Notes: 1. Figures for 2012 are final audit accounts compiled by the CPA in accordance with domestic financial accounting standards and their interpretation fundamentals as stipulated by the National Audit Office, and were recompiled, following adjustment, in line with the International Financial Reporting Standards (IFRS); figures for 2013 and 2014 are readjusted by the CPA in accordance with figures approved by the National Audit Office; figures for 2015 are approved by the National Audit Office; figures for 2016 are CPA approved.
2. Formulae used in calculations:
(1) Operating Ability
a. Ratio of loans to deposits = Annual average loans outstanding / Annual average deposits
b. Non-performing loan ratio = Non-performing loans / Total loans outstanding
c. Ratio of interest cost to annual average deposits = Interest cost related to deposits (Note 3) / Annual average deposits
d. Ratio of interest income to annual average loans outstanding = Interest income related to loans outstanding / Annual average amount of loans outstanding
e. Total assets turnover (times) = Net interest and non-interest income / Average Total Assets
f. Average revenue per employee = Net interest and non-interest income / Total number of employees
g. Average profit per employee = Net income / Total number of employees
(2) Profitability
a. Return on Tier 1 capital = Net income before tax / Total amount of Tier 1 capital
b. Return on assets = Net Income / Average total assets
c. Return on shareholders’ equity = Net income / Average net shareholders’ equity
d. Net income ratio = Net income / Net interest and non-interest income
e. Earnings per share = (Income attributable to owners of the parent company – preferred stock dividend) / Weighted average number of shares issued
(3) Financial Structure
a. Ratio of liabilities to assets = Total liabilities / Total assets
b. Ratio of property and equipment to shareholders’ equity = Net property and equipment / Net shareholders’ equity
(4) Growth Rate
a. Rate of asset growth = (Total assets for current year – total assets for previous year) / Total assets for previous year
b. Rate of profit growth = (Before-tax profit or loss for current year – before-tax profit or loss for previous year) / Before-tax profit for previous year
(5) Cash Flow
a. Cash flow ratio = Net cash flow from operating activities / (Call loans and overdrafts from banks + commercial paper + financial liabilities measured at fair value through profit or loss + bonds and bills sold under repurchase agreements + current portion of payables)
b. Cash flow adequacy ratio = Net cash flow from operating activities for the past five years / (Capital expenditures + cash dividends) for the past five years
c. Cash flow satisfied ratio = Net cash flow from operating activities / Net cash flow from investing activities
(6) Liquidity reserve ratio = Liquid assets specified by the Central Bank / Debt items for which liquidity reserves should be allocated
(7) Operating Scale
a. Market Share of Assets = Total assets / Total assets of the major financial institutions
b. Market Share of Net Worth = Net worth / Total net worth of the major financial institutions
c. Market Share of Deposits = Deposits / Total deposits of the major financial institutions
d. Market Share of Loans = Loans / Total loans of the major financial institutions
3. To reasonably express average interest rate, excess interest paid on preferential deposits was added back into total interest expenditures for 2016, 2015, 2014, 2013 and 2012 in the amounts of NT$10,776,622,000, NT$11,006,282,000, NT$10,663,770,000, NT$10,820,906,000 and NT$10,664,322,000, respectively.
4. The Bank began compiling its financial statements in accordance with IFRS in 2013. Figures for 2012 are final audit accounts compiled by the CPA in accordance with domestic financial accounting standards and their interpretation fundamentals as stipulated by the National Audit Office, and were recompiled, following adjustment, in line with the International Financial Reporting Standards (IFRS). The “Rate of Return” for 2012 uses the Jan. 1, 2012 initial amount and 2012 Tier 1 Capital and asset or net value average. For 2013, the average amounts of the preceding items for 2012 and 2013 are used. For 2014, the average amounts of the preceding items for 2013 and 2014 are used. For 2015, the average amounts of the preceding items for 2014 and 2015 are used. For 2016, the average amounts of the preceding items for 2015 and 2016 are used.
5. Result of not using IFRS in compilation of financial statement amounts in 2011.
6. Net cash outflow produced by operating activities in 2013, making it impossible to calculate this ratio.
7. Net cash flow adequacy ratios for 2012 were calculated using net cash flows from operating activities for the current year/(capital expenditures + cash dividends); for 2013 [2014/2015/2016] were calculated using net cash flows from operating activities for past two [three/ four/ five] years/(capital expenditures + cash dividends).
8. The Bank’s authorized capital was increased to NT$95 billion on October 15, 2014 and the Bank retroactively adjusts annual figures for earnings per share.

2016 ANNUAL REPORT
BANK FTAIWAN
7372
Adequacy of CapitalUnit: NT$1,000; %
YearItems 2016 2015 2014 2013
Self-Owned Capital
Common Stocks Equity 196,707,640 176,651,076 173,517,616 169,355,190
Other Total Tier 1 of Non-Common Stocks Equity
Tier 2 Capital 44,259,621 50,075,363 50,204,345 34,157,947
Self-Owned Capital 240,967,261 226,726,439 223,721,961 203,513,137
Total Risk- Weighted Assets
Credit Risk
Standardized Approach 1,845,427,164 1,879,583,822 1,836,910,103 1,768,858,574
Internal Rating Based Approach
Securitization 248,551 4,374,030
Operational Risk
Basic Indicator Approach 56,984,163 51,777,388
Standardized Approach/Alternative Standardized Approach
64,622,213 56,853,725
Advanced Measurement Approach
Market RiskStandardized Approach 90,793,588 89,149,500 86,770,575 71,523,188
Internal Model Approach
Total Risk-Weighted Assets 2,001,091,516 2,025,587,047 1,980,664,841 1,896,533,180
Capital Adequacy Ratio 12.04% 11.19% 11.30% 10.73%
Ratio of Tier 1 Capital to Risk Assets 9.83% 8.72% 8.76% 8.93%
Ratio of Common Stocks Equity to Risk Assets 9.83% 8.72% 8.76% 8.93%
Leverage Ratio 4.08% 3.64% 2.87% 3.58%
Notes: 1. Figures for 2016 are CPA approved.
2. The definition of Self-owned capital, Risk-weighted assets and exposure measure hereby shall be in compliance with the “Regulations Governing the Capital Adequacy and Capital Category of Banks” and “Methods for Calculation the Self-Owned Capital and Risk-Weighted Assets of Banks.”
3. Formulae used in calculations:
a. Self-owned capital = Common stocks equity + other total Tier 1 of non-common stocks equity + Tier 2 capital
b. Total risk-weighted assets = Credit risk-weighted assets + (Operational risk + Market risk) Capital requirement ×12.5
c. Capital adequacy ratio = Self-owned capital / Total risk-weighted assets
d. Ratio of Tier 1 capital to risk assets = (Common stocks equity + Other total Tier 1 of non-common stocks equity) / Total risk-weighted assets
e. Ratio of common stocks equity to risk assets = Common stocks equity / Total risk-weighted assets
f. Leverage ratio = Net Tier 1 capital / Exposure measurement

7372
Financial Information
Financial Analysis under ROC GAAPUnit: NT$1,000; %
YearItems 2012
Operating Ability
Ratio of Loans to Deposits 66.26
Non-Performing Loan Ratio 0.52
Ratio of Interest Cost to Annual Average Deposits 1.27
Ratio of Interest Income to Annual Average Loans Outstanding 1.87
Total Assets Turnover (Times) 0.73
Average Revenue per Employee 3,634
Average Operating Revenue per Employee -
Average Profit per Employee (Note 5) 900
Profitability
Return on Tier 1 Capital 4.64
Return on Assets 0.18
Return on Shareholders’ Equity 2.90
Net Income Ratio 24.77
Earnings per Share (NT$) (Note 7) 0.76
Financial StructureRatio of Liabilities to Assets 93.75
Ratio of Fixed Assets to Shareholders’ Equity 38.48
Growth RateRate of Asset Growth 2.75
Rate of Profit Growth (Note 6) 81.75
Cash Flow
Cash Flow Ratio (Note 4) 5.72
Cash Flow Adequacy Ratio (Note 4) 174.77
Cash Flow Satisfied Ratio (Note 4) -38.43
Liquidity Reserve Ratio 40.07
Loans to Parties with Material Relationship with the Bank 20,181,252
Ratio of Loans to Parties with Material Relationship with the Bank to Total Loans 0.88
Operating Scale
Market Share of Assets 10.31
Market Share of Net Worth 10.03
Market Share of Deposits 11.12
Market Share of Loans 9.29

2016 ANNUAL REPORT
BANK FTAIWAN
7574
Notes: 1. Figures for 2012 are readjusted by the CPA in accordance with figures approved by the National Audit Office.
2. Formulae used in calculations:
(1) Operating Ability
a. Ratio of loans to deposits = Annual average loans outstanding / Annual average deposits
b. Non-performing loan ratio = Non-performing loans / Total loans outstanding
c. Ratio of interest cost to annual average deposits = Interest cost related to deposits (Note 3) / Annual average deposits
d. Ratio of interest income to annual average loans outstanding = Interest income related to loans outstanding / Annual average amount of loans outstanding
e. Total assets turnover (times) = Net interest and non-interest income / Average Total Assets
f. Average revenue per employee = Net interest and non-interest income / Total number of employees
g. Average profit per employee = Net income / Total number of employees
(2) Profitability
a. Return on Tier 1 capital = Net income before tax / Total amount of Tier 1 capital
b. Return on assets = Net Income / Average total assets
c. Return on shareholders’ equity = Net income / Average net shareholders’ equity
d. Net income ratio = Net income / Net interest and non-interest income
e. Earnings per share = (Net income – preferred stock dividend) / Weighted average number of shares issued
(3) Financial Structure
a. Ratio of liabilities to assets = Total liabilities / Total assets
b. Ratio of fixed assets to shareholders’ equity = Net fixed assets / Net shareholders’ equity
(4) Growth Rate
a. Rate of asset growth = (Total assets for current year – total assets for previous year) / Total assets for previous year
b. Rate of profit growth = (Before-tax profit or loss for current year – before-tax profit or loss for previous year) / Before-tax profit for previous year
(5) Cash Flow
a. Cash flow ratio = Net cash flow from operating activities / (Call loans and overdrafts from banks + commercial paper + financial liabilities measured at fair value through profit or loss + bonds and bills sold under repurchase agreements + current portion of payables )
b. Cash flow adequacy ratio = Net cash flow from operating activities for the past five years / (Capital expenditures + inventory increase + cash dividends) for the past five years
c. Cash flow satisfied ratio = Net cash flow from operating activities / Net cash flow from investing activities
(6) Liquidity reserve ratio = Liquid assets specified by the Central Bank / Debt items for which liquidity reserves should be allocated
(7) Operating Scale
a. Market Share of Assets = Total assets / Total assets of the major financial institutions
b. Market Share of Net Worth = Net worth / Total net worth of the major financial institutions
c. Market Share of Deposits = Deposits / Total deposits of the major financial institutions
d. Market Share of Loans = Loans / Total loans of the major financial institutions
3. Total interest costs were switched to “cost of other employee benefits” in line with the revision made by the National Audit Office.
4. Net cash inflow produced by operating activities in 2012.
5. Net income was higher in 2012 than in the previous year.
6. Net income before tax was higher in 2012.
7. The Bank’s authorized capital was increased to NT$95 billion on October 15, 2014 and the Bank retroactively adjusts annual figures for earnings per share.

7574
Financial Information
Adequacy of CapitalUnit: NT$1,000; %
YearItems 2012
Self-Owned Capital
Tier 1 Capital
Common Stocks 70,000,000Non-Cumulative Perpetual Preferred StocksNon-Cumulative Subordinated Debentures Without Maturity DatesAdvanced Receipts for Capital StocksCapital Surplus (Apart from Fixed Assets Appreciation Surplus) 105,682,871Legal Reserves 25,218,428Special Reserves 98,322Accumulated Profit or Loss 8,385,156Minority InterestsOther Items in Shareholders’ Equity -3,947,909Deducted: GoodwillDeducted: Unamortized Loss for Sale of NPL Deducted: Capital Deductions 29,544,165Total Tier 1 Capital 175,892,703
Tier 2 Capital
Perpetual Cumulative Preferred StocksCumulative Subordinated Debentures Without Maturity DatesFixed Asset Appreciation Surplus 27,383,08645% of Unrealized Gain of Available-for-Sale Financial Assets 8,961,329Convertible BondsOperating Reserve and Loan Provision 9,146,517Long-term Subordinated DebenturesNon-Perpetual Preferred StocksThe Aggregate of Non-Cumulative Perpetual Preferred Stocks and Non-Cumulative Subordinated Debentures Without a Maturity Date Exceeding 15% of Total Tier 1 CapitalDeducted: Capital Deductions 29,544,164Total Tier 2 Capital 15,946,768
Tier 3 Capital
Short-term Subordinated Debentures
Non-Perpetual Preferred Stocks
Total Tier 3 Capital
Self-Owned Capital 191,839,471
Total Risk- Weighted Assets
Credit RiskStandardized Approach 1,631,099,532Internal Rating Based ApproachSecuritization 3,646,593
Operational Risk
Basic Indicator Approach 49,219,638Standardized Approach/Alternative Standardized ApproachAdvanced Measurement Approach
Market RiskStandardized Approach 72,726,088Internal Model Approach
Total Risk-Weighted Assets 1,756,691,851Capital Adequacy Ratio 10.92Ratio of Tier 1 Capital to Risk Assets 10.01Ratio of Tier 2 Capital to Risk Assets 0.91Ratio of Tier 3 Capital to Risk AssetsRatio of Common Stock to Total Assets 1.73
Notes: 1. Figures for 2012 are CPA approved.
2. The definition of self-owned capital and risk-weighted assets measure hereby shall be in compliance with the “Regulations Governing the Capital Adequacy of Banks” and “Methods for Calculation the Self-Owned Capital and Risk-Weighted Assets of Banks”.
3. Formulae used in calculations:
a. Self-owned capital = Tier 1 capital + Tier 2 capital + Tier 3 capital
b. Total risk-weighted assets = Credit risk-weighted assets + (Operational risk + Market risk) capital requirement ×12.5
c. Capital adequacy ratio = Self-owned capital / Total risk-weighted assets
d. Ratio of Tier 1 capital to risk assets = Tier 1 capital / Total risk-weighted assets
e. Ratio of Tier 2 capital to risk assets = Tier 2 capital / Total risk-weighted assets
f. Ratio of Tier 3 capital to risk assets = Tier 3 capital / Total risk-weighted assets
g. Ratio of common stock to total assets = Common stock / Total assets

2016 ANNUAL REPORT
BANK FTAIWAN
7776
Ⅳ. Financial Statements of Recent Years, and Independent Auditors’ Report
Independent Auditor’s Report
To the Board of Directors of Bank of Taiwan:
OpinionWe have audited the consolidated financial statements of Bank of Taiwan (“the Bank”) and its
subsidiaries, which comprise the consolidated balance sheets as of December 31, 2016 and 2015, the consolidated statements of comprehensive income, changes in equity and cash flows for the years ended December 31, 2016 and 2015, and notes to the consolidated financial statements, including a summary of significant accounting policies.
In our opinion, based on our audits and the report of other auditors (please refer to Other Matter paragraph), the accompanying consolidated financial statements present fairly, in all material respects, the consolidated financial position of the Bank as of December 31, 2016 and 2015, and the results of its consolidated operations and cash flows for the years then ended in accordance with the “Regulations Governing the Preparation of Financial Reports by Public Banks” and the International Financial Reporting Standards (“IFRSs”), International Accounting Standards (“IASs”), International Financial Reporting interpretations (“IFRICS”), and the Standing Interpretations Committee (“SICs”) as well as related guidelines endorsed by the Financial Supervisory Commission of the Republic of China.Basis for Opinion
We conducted our audit in accordance with the “Regulations Governing Auditing and Certification of Financial Statements of Financial Institutions by Certified Public Accountants” and the auditing standards generally accepted in the Republic of China. Our responsibilities under those standards are further described in the Auditors’ Responsibilities for the Audit of the Consolidated Financial Statements section of our report. We are independent of Bank of Taiwan in accordance with the Certified Public Accountants Code of Professional Ethics in Republic of China (“the Code”), and we have fulfilled our other ethical responsibilities in accordance with the Code. We believe that the audit evidence we have obtained, inclusive of the report from other auditors, is sufficient and appropriate to provide a basis of our opinion.Emphasis of Matter
In accordance with the Audit Act and other governmental regulations of Taiwan, the financial statements of the Bank and its subsidiaries are required to be examined and certified by the Ministry of Audit (the “MoA”). The financial statements of the Bank and its subsidiaries as of, and for year ended December 31, 2015 were restated to reflect the adjustments made by the MoA. For further information, please see Note 52 (2).
Ⅲ. Statement by the Audit CommitteePlease refer to page 87 of the Chinese annual report.

7776
Financial Information
Other MatterAs stated in Note 15, we have not audited the financial statements of Hua Nan Financial Holdings Co.,
Ltd. and Tai Yi Real Estate Co., Ltd. The Bank recognized its investments in Hua Nan Financial Holdings Co., Ltd. and Tai Yi Real Estate Co., Ltd. under equity method amounting to $33,771,463 thousand and $32,515,803 thousand, respectively, constituting 0.71% and 0.69% of the consolidated total assets as of December 31, 2016 and 2015, respectively; and its shares of investment profits in associates accounted for using equity method amounting to $2,994,036 thousand and $2,992,791 thousand, respectively, constituting 15.41% and 28.23% of the related consolidated income before income tax for the year ended December 31, 2016 and 2015, respectively. Those financial statements were audited by other auditors, whose reports have been furnished to us, and our review, insofar as it relates to the amounts included for those companies, is based solely on the reports of the other auditors.
We have also audited the separated financial statements of Bank of Taiwan as of, and for the year ended 2016 and 2015, and issued an unmodified opinion. Key Audit Matters
Key audit matters are those matters that, in our professional judgment, were of most significance in our audit of the consolidated financial statements for the year ended December 31, 2016. These matters were addressed in the context of our audit of the consolidated financial statements as a whole, and in forming our opinion thereon, and we do not provide a separate opinion on these matters.1. The assessment of loans impairment
Please refer to Note 4(12) “Impairment of assets” for related accounting policy, Note 5(1) “Assessments of loans impairment” for the uncertainty of accounting estimation and assumptions, and Note 12 “Loans and discounts, net” for the details of the assessment of loans impairment.Description of key audit mattersWhen conducting credit business, the Bank shall assess whether there is any indication that loans may be impaired because the Bank will assume credit risk if loans are not repaid. The Bank first assesses the impairment loss of loans in accordance with IAS 39, and such amount of allowance for doubtful accounts shall not be lower than the amount calculated in accordance with the “Regulations Governing the Procedures for Banking Institutions to Evaluate Assets and Deal with Non performing/Non accrual Loans”. When the Bank, individually or collectively, assesses its impairment loss of loans according to IAS 39, the uses of assumptions, such as effective interest rates, recovery rates and future cash flows, involved the exercise of judgment, which usually has significant impacts on the results. In addition, the Bank recognized its loans and allowance for doubtful accounts of $2,307,049,291 thousand and $32,812,787 thousand, respectively, as of December 31, 2016. These accounts are material to the Bank. Therefore, the assessment of loans impairment has been identified as a key audit matter in our audit.How the matter was addressed in our auditOur principal audit procedures included (i) testing the internal control procedures over credit operations, and inspecting the meeting minutes of both the Board of Directors and the Assets and Liabilities Management Committee regarding credit business; (ii) executing substantive analytical procedure and analyzing the structure and movement of loans; (iii) inspecting whether the process of determining parameters were conducted in accordance with the related internal guidelines, as well as evaluating the reasonableness of adjusting the parameters; (iv) executing the retrospective testing of last year’s allowance for doubtful accounts which had already been recognized; (v) checking the accuracy of allowance for doubtful accounts calculated in accordance with the “Regulations Governing the Procedures for Banking Institutions to Evaluate Assets and Deal with Non performing/Non accrual Loans”; (vi) assessing whether the disclosures appropriately reflected the Bank’s exposure to credit risk.

2016 ANNUAL REPORT
BANK FTAIWAN
7978
2. The valuation of financial instrumentsPlease refer to Note 4 (6) “Financial instrument” for related accounting policy, Note 5 (2) “The valuation of financial instruments” for the uncertainty of accounting estimation and assumptions, and Note 43 “The fair value and fair value hierarchy of the financial instruments” for the details of the valuation of financial instruments.Description of key audit mattersOf the financial instruments measured at fair value through profit and loss and other comprehensive income held by the Bank, other than those that fair value can be observed in an open market, fair value of the financial instruments classified as level 2 and 3 in the fair value hierarchy shall be calculated via models. The parameters of modeling inputs often involved the exercise of judgment and the uses of different valuation techniques and assumptions that may generate significant different results. The financial assets and liabilities measured at fair value held by the Bank as of December 31, 2016 amounted to $1,448,605,826 thousand and $43,938,109 thousand, respectively. Among them, the financial assets and liabilities measure at fair value other than those classified as level 1 were $1,045,142,592 thousand and $6,853,258 thousand, respectively. The amounts are material to the Bank. Therefore, the valuation of financial instruments has been identified as a key audit matter in our audit.How the matter was addressed in our auditOur main audit procedures included (i) reviewing the accounting policy on fair value of financial instruments measurement and disclosure, as well as testing the controls over the investment cycle and related financial reporting process, including initial recognition, subsequent measurement and disclosure; (ii) sampling of the financial instruments measured at fair value with an active market to test whether the prices are appropriate and accurate; (iii) appointing our valuation specialists to assess the reasonableness of the models and parameters the Bank used to measure its fair value of financial instruments without an active market; (iv) assessing whether the fair value information is disclosed in accordance with the International Financial Reporting Standards.
3. The assessment of impairment of financial assetsPlease refer to Note 4 (12) “Impairment of assets” for related accounting policy, Note 5 (3) “The assessment of impairment of financial assets” for the uncertainty of accounting estimation and assumptions, and Note 13 “Available-for-sale financial assets, net”, Note 14 “Held to maturity financial assets, net” and Note 16 “Other financial assets, net” for the details of the assessment of impairment of financial assets.Description of key audit mattersWhen assessing whether there is any indication that financial assets other than measured at fair value through profit or loss may be impaired, the Bank relies on the management for considering all kinds of observable data to determine whether objective evidence of impairment exists on the reporting date. If there is such evidence exists, then the Bank shall calculate the amount of impairment loss by further estimating the future cash flow and effective interest rate or current market return. The decision involved the exercise of judgment and the financial assets of $1,200,968,157 thousand should be included in the scope of test of impairment as of December 31, 2016. The amount is material to the Bank. Therefore, the assessment of impairment of financial assets has been identified as a key audit matter in our audit.
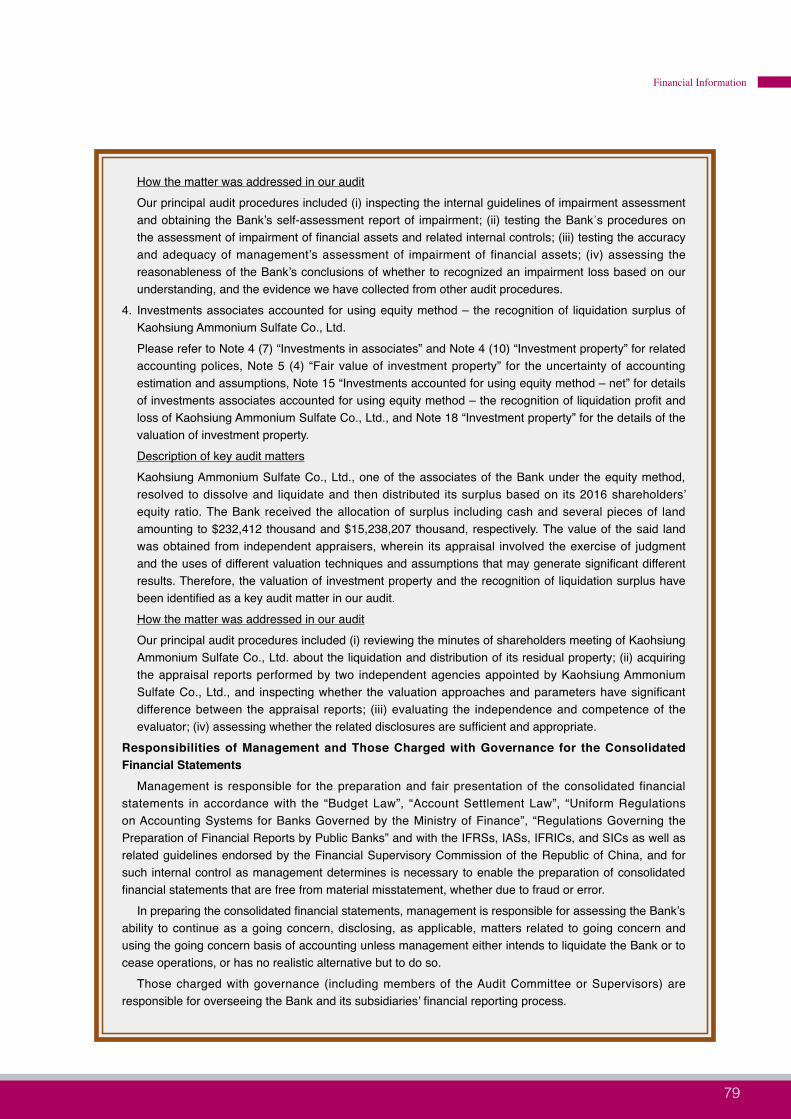
7978
Financial Information
How the matter was addressed in our auditOur principal audit procedures included (i) inspecting the internal guidelines of impairment assessment and obtaining the Bank’s self-assessment report of impairment; (ii) testing the Bank's procedures on the assessment of impairment of financial assets and related internal controls; (iii) testing the accuracy and adequacy of management’s assessment of impairment of financial assets; (iv) assessing the reasonableness of the Bank’s conclusions of whether to recognized an impairment loss based on our understanding, and the evidence we have collected from other audit procedures.
4. Investments associates accounted for using equity method – the recognition of liquidation surplus of Kaohsiung Ammonium Sulfate Co., Ltd.Please refer to Note 4 (7) “Investments in associates” and Note 4 (10) “Investment property” for related accounting polices, Note 5 (4) “Fair value of investment property” for the uncertainty of accounting estimation and assumptions, Note 15 “Investments accounted for using equity method – net” for details of investments associates accounted for using equity method – the recognition of liquidation profit and loss of Kaohsiung Ammonium Sulfate Co., Ltd., and Note 18 “Investment property” for the details of the valuation of investment property.Description of key audit mattersKaohsiung Ammonium Sulfate Co., Ltd., one of the associates of the Bank under the equity method, resolved to dissolve and liquidate and then distributed its surplus based on its 2016 shareholders’ equity ratio. The Bank received the allocation of surplus including cash and several pieces of land amounting to $232,412 thousand and $15,238,207 thousand, respectively. The value of the said land was obtained from independent appraisers, wherein its appraisal involved the exercise of judgment and the uses of different valuation techniques and assumptions that may generate significant different results. Therefore, the valuation of investment property and the recognition of liquidation surplus have been identified as a key audit matter in our audit.How the matter was addressed in our auditOur principal audit procedures included (i) reviewing the minutes of shareholders meeting of Kaohsiung Ammonium Sulfate Co., Ltd. about the liquidation and distribution of its residual property; (ii) acquiring the appraisal reports performed by two independent agencies appointed by Kaohsiung Ammonium Sulfate Co., Ltd., and inspecting whether the valuation approaches and parameters have significant difference between the appraisal reports; (iii) evaluating the independence and competence of the evaluator; (iv) assessing whether the related disclosures are sufficient and appropriate.
Responsibilities of Management and Those Charged with Governance for the Consolidated Financial Statements
Management is responsible for the preparation and fair presentation of the consolidated financial statements in accordance with the “Budget Law”, “Account Settlement Law”, “Uniform Regulations on Accounting Systems for Banks Governed by the Ministry of Finance”, “Regulations Governing the Preparation of Financial Reports by Public Banks” and with the IFRSs, IASs, IFRICs, and SICs as well as related guidelines endorsed by the Financial Supervisory Commission of the Republic of China, and for such internal control as management determines is necessary to enable the preparation of consolidated financial statements that are free from material misstatement, whether due to fraud or error.
In preparing the consolidated financial statements, management is responsible for assessing the Bank’s ability to continue as a going concern, disclosing, as applicable, matters related to going concern and using the going concern basis of accounting unless management either intends to liquidate the Bank or to cease operations, or has no realistic alternative but to do so.
Those charged with governance (including members of the Audit Committee or Supervisors) are responsible for overseeing the Bank and its subsidiaries’ financial reporting process.

2016 ANNUAL REPORT
BANK FTAIWAN
8180
Auditors’ Responsibilities for the Audit of the Consolidated Financial StatementsOur objectives are to obtain reasonable assurance about whether the consolidated financial statements
as a whole are free from material misstatement, whether due to fraud or error, and to issue an auditors’ report that includes our opinion. Reasonable assurance is a high level of assurance, but is not a guarantee that an audit conducted in accordance with the auditing standards generally accepted in the Republic of China will always detect a material misstatement when it exists. Misstatements can arise from fraud or error and are considered material if, individually or in the aggregate, they could reasonably be expected to influence the economic decisions of users taken on the basis of these consolidated financial statements.
As part of an audit in accordance with auditing standards generally accepted in the Republic of China, we exercise professional judgment and maintain professional skepticism throughout the audit. We also: 1. Identify and assess the risks of material misstatement of the consolidated financial statements, whether
due to fraud or error, design and perform audit procedures responsive to those risks, and obtain audit evidence that is sufficient and appropriate to provide a basis for our opinion. The risk of not detecting a material misstatement resulting from fraud is higher than for one resulting from error, as fraud may involve collusion, forgery, intentional omissions, misrepresentations, or the override of internal control.
2. Obtain an understanding of internal control relevant to the audit in order to design audit procedures that are appropriate in the circumstances, but not for the purpose of expressing an opinion on the effectiveness of the Bank’s internal control.
3. Evaluate the appropriateness of accounting policies used and the reasonableness of accounting estimates and related disclosures made by management.
4. Conclude on the appropriateness of management’s use of the going concern basis of accounting and, based on the audit evidence obtained, whether a material uncertainty exists related to events or conditions that may cast significant doubt on the Bank’s ability to continue as a going concern. If we conclude that a material uncertainty exists, we are required to draw attention in our auditors’ report to the related disclosures in the consolidated financial statements or, if such disclosures are inadequate, to modify our opinion. Our conclusions are based on the audit evidence obtained up to the date of our auditors’ report. However, future events or conditions may cause the Bank to cease to continue as a going concern.
5. Evaluate the overall presentation, structure and content of the consolidated financial statements, including the disclosures, and whether the consolidated financial statements represent the underlying transactions and events in a manner that achieves fair presentation.
6. Obtain sufficient and appropriate audit evidence regarding the financial information of the entities or business activities within the Bank to express an opinion on the consolidated financial statements. We are responsible for the direction, supervision and performance of the group audit. We remain solely responsible for our audit opinion.We communicate with those charged with governance regarding, among other matters, the planned
scope and timing of the audit and significant audit findings, including any significant deficiencies in internal control that we identify during our audit.

8180
Financial Information
From the matters communicated with those charged with governance, we determine those matters that were of most significance in the audit of the consolidated financial statements for the year ended December 31, 2016 and are therefore the key audit matters. We describe these matters in our auditors’ report unless law or regulation precludes public disclosure about the matter or when, in extremely rare circumstances, we determine that a matter should not be communicated in our report because the adverse consequences of doing so would reasonably be expected to outweigh the public interest benefits of such communication.
The engagement partners on the audit resulting in this independent auditor’s report are Yen-Ling Fang and Feng-Hui Lee.
KPMGTaipei, Taiwan (Republic of China)March 17, 2017
Note to ReadersThe accompanying consolidated financial statements are intended only to present the consolidated statement of financial
position, financial performance and its cash flows in accordance with the accounting principles and practices generally accepted in the Republic of China and not those of any other jurisdictions. The standards, procedures and practices to audit such consolidated financial statements are those generally accepted and applied in the Republic of China.
The auditors’ report and the accompanying consolidated financial statements are the English translation of the Chinese version prepared and used in the Republic of China. If there is any conflict between, or any difference in the interpretation of the English and Chinese language auditors’ report and consolidated financial statements, the Chinese version shall prevail.

2016 ANNUAL REPORT
BANK FTAIWAN
8382
(English Translation of Consolidated Financial Statements and Report Originally Issued in Chinese)Bank of Taiwan and subsidiaries
Consolidated Balance SheetsDecember 31, 2016 and 2015
(expressed in thousands of New Taiwan dollars)
December 31, 2016 December 31, 2015
Amount % Amount %
Assets
Cash and Cash Equivalents (note 6, 43 and 46) $ 122,398,656 3 135,422,448 3
Placement with Central Bank and Call Loans to Banks (note 7, 12, 43, 44 and 46) 687,235,976 14 585,963,772 13
Financial Assets Measured at Fair Value through Profit or Loss (note 8, 43, 44 and 46) 212,560,998 4 173,005,205 4
Hedging Derivative Financial Assets, Net (note 9, 43 and 44) 21,221 - 15,970 -
Bills and Bonds Purchased under Resell Agreements (note 10, 43 and 44) - - 50,040 -
Receivables, Net (note 11, 12, 43, 44 and 46) 63,311,112 1 72,072,783 2
Current Income Tax Assets 761,630 - 1,343,508 -
Loans and Discounts, Net (note 12, 43, 44 and 46) 2,274,236,504 48 2,386,598,795 50
Available-for-Sale Financial Assets, Net (note 13, 21, 43, 44 and 47) 1,037,841,339 22 1,053,598,710 22
Held-to-Maturity Financial Assets, Net (note 14, 43, 44 and 47) 138,812,328 3 113,786,391 2
Investments under Equity Method, Net (note 15) 35,055,524 1 35,855,822 1
Other Financial Assets, Net (note 11, 12, 16, 21, 43, and 44) 76,578,794 2 68,891,471 1
Property and Equipment, Net (note 17 and 21) 96,695,325 2 96,733,221 2
Investment Property, Net (note 18) 15,238,207 - - -
Intangible Assets, Net (note 19) 803,225 - 853,946 -
Deferred Tax Assets (note 31) 297,880 - 476,040 -
Other Assets, Net (note 20 and 46) 8,745,962 - 7,820,324 -
Total assets $ 4,770,594,681 100 4,732,488,446 100

8382
Financial Information
December 31, 2016 December 31, 2015
Amount % Amount %
Liabilities and Stockholders’ Equity
Liabilities:
Deposits of Central Bank and other banks (note 22, 43 and 46) $ 227,596,814 5 225,425,517 5
Financial Liabilities Measured at Fair Value through Profit or Loss (note 23, 43 and 46) 6,709,063 - 39,224,475 1
Hedging Derivative Financial Liabilities, Net (note 9 and 43) 144,195 - 243,967 -
Bills and Bonds Sold under Repurchase Agreements (note 10 and 43) 11,337,914 - 16,336,619 -
Payables (note 24, 43 and 46) 41,513,445 1 42,217,119 1
Current Income Tax Liabilities 654,191 - 395,504 -
Deposits and Remittances (note 25, 43 and 46) 3,873,982,764 81 3,837,520,416 81
Financial bonds payable (note 26 and 43) 24,998,082 1 24,997,826 1
Other Financial Liabilities (note 27 and 43) 748,855 - 1,785,430 -
Provision (note 28 and 29) 283,367,966 7 264,199,252 6
Deferred Tax Liabilities (note 31) 18,173,159 - 18,340,284 -
Other Liabilities (note 30 and 46) 6,924,011 - 6,954,757 -
Total liabilities 4,496,150,459 95 4,477,641,166 95
Equity attributable to shareholders of the parent:
Capital stock (note 32) 95,000,000 2 95,000,000 2
Capital surplus(note 32) 80,453,034 2 80,453,034 2
Retained earnings:(note 32)
Legal reserve 34,201,365 1 31,822,306 1
Special reserve 22,686,273 - 19,514,195 -
Unappropriated retained earnings(note 32) 18,815,254 - 7,953,744 -
75,702,892 1 59,290,245 1
Other equity 23,288,296 - 20,104,001 -
Total equity 274,444,222 5 254,847,280 5
Total liabilities and stockholders’ equity $ 4,770,594,681 100 4,732,488,446 100

2016 ANNUAL REPORT
BANK FTAIWAN
8584
(English Translation of Consolidated Financial Statements and Report Originally Issued in Chinese)BANK OF TAIWAN AND SUBSIDIARIES
Consolidated Statements of Comprehensive IncomeFor the years ended December 31, 2016 and 2015
(expressed in thousands of New Taiwan dollars, except earnings per share)2016 2015 Percentage
ChangeAmount % Amount %
Revenue and income: Interest income (note 33 and 46) $ 59,402,785 132 64,758,332 184 (8)Less: Interest expense (note 33 and 46) (33,367,303) (75) (36,352,155) (103) (8)
Net interest income (note 33) 26,035,482 57 28,406,177 81 (8)Non-interest income, NetService fees, Net (note 34 and 46) 5,629,681 13 5,459,197 16 3Gain (loss) on financial assets or liabilities measured at fair value through profit or loss (note 35 and 46) 16,322,868 37 1,494,095 4 992
Realized gain (loss) on available-for-sale financial assets (note 36 and 46) 2,131,822 5 1,496,244 4 42
Foreign exchange gain (loss)(note 37 and 46) (457,893) (1) 4,714,349 13 (110)Provision of impairment loss on assets (note 21) 27,659 - 17,323 - 60Share of profit (loss) of associates and joint ventures accounted for using equity method(note 15) 16,413,920 37 4,107,770 12 300
Premiums loss (note 38) (7,092,220) (16) (11,891,973) (34) 40Sales income (note 38) 542,536 1 499,423 1 9Subsidized income from government (note 38 and 52) 13,754,258 31 16,970,331 48 (19)Excess interest expenses (note 11 and 38) (10,777,111) (24) (11,006,752) (31) 2Provisions for policyholders’ reserve premium (note 38) (18,843,200) (42) (5,529,029) (15) (241)Excess interest expenses (note 38 and 46) 1,006,050 2 476,226 1 111
Net Revenue 44,693,852 100 35,213,381 100 27Bad debt expense and reserve for guarantees (note 12) (5,183,736) (12) (4,404,468) (13) 18
Expenses:(note 52)Employee benefits expenses (note 29 and 39) (11,961,924) (27) (11,821,279) (34) 1Depreciation and amortization expenses (note 40) (1,105,162) (2) (1,112,704) (3) (1)Other general and administrative expenses (note 41 and 46) (7,008,414) (16) (7,273,380) (21) (4)
Total Expenses (20,075,500) (45) (20,207,363) (58) (1)Operating Income, Net 19,434,616 43 10,601,550 29 83
Net income before income tax 19,434,616 43 10,601,550 29 83Income Tax Expenses (note 31) (1,785,645) (4) (1,730,852) (5) (3)Net income 17,648,971 39 8,870,698 24 99Other comprehensive income:
Components of other comprehensive income that will not be reclassified to profit or loss
Gains (losses) on remeasurements of the defined benefit plans (744,381) (2) (704,656) (2) (6)Shares of other comprehensive income of associates and joint ventures accounted for using equity method (105,554) - (122,172) - 14
Income tax related to items that will not be reclassified to profit or loss - - - - -
Total items that will not be reclassified to profitt or loss (849,935) (2) (826,828) (2) (3)Components of other comprehensive income that may be subsequently reclassified to profit or loss
Exchange difference arising on translation of foreign operation (468,214) (1) 634,243 2 (174)Unrealized gains (losses) on available-for-sale financial assets 4,003,761 9 (5,304,740) (15) 175Shares of other comprehensive income of associates and joint ventures accounted for using equity method (309,797) (1) 1,229,545 3 (125)
Income tax related to items that may be subsequently reclassified to profit or loss (note 31) (27,844) - 31,920 - (187)
Subtotal 3,197,906 7 (3,409,032) (10) 194Other comprehensive income (net amount after tax) 2,347,971 5 (4,235,860) (12) 155Total comprehensive income $ 19,996,942 44 4,634,838 12 331Basic earnings per share (In dollars) (note 42) $ 1.86 0.93

8584
Financial Information(E
nglis
h Tr
ansl
atio
n of
Con
solid
ated
Fin
anci
al S
tate
men
ts a
nd R
epor
t Orig
inal
ly Is
sued
in C
hine
se)
BAN
K O
F TA
IWAN
AN
D S
UBS
IDIA
RIE
SC
onso
lidat
ed S
tate
men
ts o
f Cha
nges
in E
quity
For t
he y
ears
end
ed D
ecem
ber 3
1, 2
016
and
2015
(exp
ress
ed in
thou
sand
s of
New
Tai
wan
dol
lars
)Eq
uity
attr
ibut
able
to s
hare
hold
ers’
of p
aren
t
Tota
lO
rdin
ary
shar
eC
apita
l su
rplu
s
Ret
aine
d ea
rnin
gsO
ther
equ
ity in
tere
st
Lega
l re
serv
eSp
ecia
l re
serv
eD
efici
t ye
t to
be
com
pens
ated
Tota
l
Exch
ange
di
ffere
nces
on
tra
nsla
tion
of fo
reig
n fin
anci
al
stat
emen
ts
Unr
ealiz
ed
gain
s (lo
sses
) on
avai
labl
e-fo
r-sal
e fin
anci
al
asse
ts
Cha
nge
in
fair
valu
e of
fina
ncia
l lia
bilit
y at
tribu
tabl
e to
cha
nge
in c
redi
t ris
k of
liab
ility
Tota
l
Bal
ance
at J
anua
ry 1
, 201
5 $9
5,00
0,00
080
,521
,742
29,5
26,9
5117
,503
,142
7,93
6,90
454
,966
,997
273,
698
23,2
16,7
8347
,305
23,5
37,7
8625
4,02
6,52
5Ap
prop
riatio
n an
d di
strib
utio
n of
re
tain
ed e
arni
ngs:
Le
gal r
eser
ve a
ppro
pria
ted
--
2,29
5,35
5-
(2,2
95,3
55)
--
--
--
Spec
ial r
eser
ve a
ppro
pria
ted
--
-2,
034,
602
(2,0
34,6
02)
--
--
--
Cas
h di
vide
nds
--
--
(3,7
45,3
75)
(3,7
45,3
75)
--
--
(3,7
45,3
75)
Rev
ersa
l of s
peci
al re
serv
e -s
ale
of la
nd-
--
(23,
549)
23,5
49-
--
--
-
Cha
nges
in e
quity
of a
ssoc
iate
s an
d jo
int v
entu
res
acco
unte
d fo
r us
ing
equi
ty m
etho
d-
(68,
708)
--
--
--
--
(68,
708)
Con
solid
ated
net
inco
me
--
--
8,87
0,69
88,
870,
698
--
--
8,87
0,69
8O
ther
com
preh
ensi
ve in
com
e (lo
ss) f
or th
e pe
riod
-
-
-
-
(8
02,0
75)
(8
02,0
75)
90
3,91
2 (
4,31
2,94
4)
(24,
753)
(3,
433,
785)
(4,
235,
860)
Tota
l com
preh
ensi
ve in
com
e
-
-
-
-
8,06
8,62
3
8,06
8,62
3
903,
912
(4,
312,
944)
(2
4,75
3) (
3,43
3,78
5)
4,63
4,83
8Ba
lanc
e at
Dec
embe
r 31,
201
595
,000
,000
80,4
53,0
3431
,822
,306
19,5
14,1
957,
953,
744
59,2
90,2
451,
177,
610
18,9
03,8
3922
,552
20,1
04,0
0125
4,84
7,28
0Ap
prop
riatio
n an
d di
strib
utio
n of
re
tain
ed e
arni
ngs:
Le
gal r
eser
ve a
ppro
pria
ted
--
2,37
9,05
9-
(2,3
79,0
59)
--
--
--
Spec
ial r
eser
ve a
ppro
pria
ted
--
-3,
172,
078
(3,1
72,0
78)
--
--
--
Cas
h di
vide
nds
--
--
(400
,000
)(4
00,0
00)
--
--
(400
,000
)C
onso
lidat
ed n
et in
com
e-
--
-17
,648
,971
17,6
48,9
71-
--
-17
,648
,971
Oth
er c
ompr
ehen
sive
inco
me
(loss
) for
the
perio
d
-
-
-
-
(836
,324
)
(836
,324
)
(690
,728
)
3,88
8,63
4
(13,
611)
3,
184,
295
2,
347,
971
Tota
l com
preh
ensi
ve in
com
e
-
-
-
-
16,8
12,6
47
16,8
12,6
47
(690
,728
)
3,88
8,63
4
(13,
611)
3,
184,
295
19,
996,
942
Bal
ance
at D
ecem
ber 3
1, 2
016
$ 95,
000,
000
80,
453,
034
34,
201,
365
22,
686,
273
18
,815
,254
75,
702,
892
48
6,88
2 2
2,79
2,47
3
8,94
1 2
3,28
8,29
6 27
4,44
4,22
2

2016 ANNUAL REPORT
BANK FTAIWAN
8786
(English Translation of Consolidated Financial Statements and Report Originally Issued in Chinese)BANK OF TAIWAN AND SUBSIDIARIESConsolidated Statements of Cash Flows
For the years ended December 31, 2016 and 2015(expressed in thousands of New Taiwan dollars)
2016 2015
Cash flows from (used in) operating activities :
Net income before income tax $ 19,434,616 10,601,550
Adjustments :
Adjustments to reconcile profit (loss)
Depreciation expense 789,460 798,365
Amortization expense 360,891 357,259
Provision for bad debt expense 5,183,736 4,404,468
Interest expense 33,367,303 36,352,155
Interest income (59,402,785) (64,758,332)
Dividend income (6,419,120) (5,776,027)
Net change in other provisions 18,843,004 5,529,413
Reversal of impairment loss on inventory (3,430) (13,942)
Share of profit of associates and joint ventures accounted for using equity method (16,413,920) (2,636,176)
Gain (loss) on disposal of property and equipment 31,493 (20,630)
Reversal of impairment loss on property and equipment (27,659) (17,323)
Others - (141)
Total adjustments to reconcile profit (loss) (23,691,027) (25,780,911)
Changes in operating assets and liabilities :
Changes in operating assets:
Decrease in placement with Central Bank and call loans to banks 50,381,710 7,416,537
(Increase) decrease in financial assets measured at fair value through profit or loss (40,268,377) 33,052,945
(Increase) decrease in hedging financial assets (5,251) 9,643
Decrease (increase) decrease in receivables 8,755,612 (9,842,022)
Decrease (increase) in loans and discounts 107,195,573 (92,743,635)
Decrease (increase) in available-for-sale financial assets 51,457,030 (244,403,945)
Increase in held-to-maturity financial assets (26,005,419) (31,831,171)
Decrease in other financial assets 2,638,627 1,777,138
Increase in other assets (771,906) (207,585)
Total changes in operating assets 153,377,599 (336,772,095)
Changes in operating liabilities:
Increase in deposits of Central Bank and other banks 2,171,297 68,436,687
Decrease in financial liabilities measured at fair value through profit or loss (32,515,412) (8,690,867)
(Decrease) increase in hedging financial liabilities (99,772) 140,943
Decrease in bills and bonds sold under repurchase agreements (4,998,705) (21,681,534)

8786
Financial Information
2016 2015
Increase in payables 759,012 20,843
Increase in deposits and remittances 36,462,348 283,438,694
Increase in employee benefit obligations 372,920 950,872
Increase in other liabilities 378,332 96,196
Total changes in operating liabilities 2,530,020 322,711,834
Total changes in operating assets and liabilities 155,907,619 (14,060,261)
Total adjustments 132,216,592 (39,841,172)
Cash inflow (outflow) generated from operations 151,651,208 (29,239,622)
Interest received 63,173,054 65,049,951
Dividends received 3,884,138 7,171,615
Interest paid (34,829,733) (35,195,338)
Income taxes paid (934,045) (1,165,672)
Net cash flows from operating activities 182,944,622 6,620,934
Cash flows from (used in) investing activities :
Proceeds from disposal of investments accounted from using equity method 187,907 -
Acquisition of property and equipment (757,290) (676,113)
Proceeds from disposal of property and equipment - 291,406
(Increase) decrease in refundable deposits (150,506) 151,920
Acquisition of intangible assets (309,966) (269,637)
Increase in other financial assets (10,325,950) (2,202,113)
Net cash flows used in investing activities (11,355,805) (2,704,537)
Cash flows from (used in) financing activities :
Decrease in guarantee deposits received (409,078) (343,662)
(Decrease) increase in other financial liabilities (1,036,575) 28,476
Cash dividends paid (400,000) (95,450)
Net cash flows used in financing activities (1,845,653) (410,636)
Effect of exchange rate changes on cash and cash equivalents (688,837) 903,912
Net increase in cash and cash equivalents 169,054,327 4,409,673
Cash and cash equivalents at beginning of period 913,173,495 908,763,822
Cash and cash equivalents at end of period $ 1,082,227,822 913,173,495
Compose of cash and cash equivalents :
Cash and cash equivalents reported in the statement of financial position $ 122,398,656 135,422,448
Due from the Central Bank and call loans to banks qualifying for cash and cash equivalents under the definition of IAS 7 318,969,155 167,350,034
Investments qualifying for cash and cash equivalents under the definition of IAS 7 640,860,011 610,401,013
Cash and cash equivalents at end of period $ 1,082,227,822 913,173,495

2016 ANNUAL REPORT
BANK FTAIWAN
8988
(English Translation of Consolidated Financial Statements and Report Originally Issued in Chinese)
BANK OF TAIWAN AND ITS SUBSIDIARY COMPANIESNotes to the Consolidated Financial Statements
December 31, 2016 and 2015(expressed in thousands of New Taiwan dollars unless otherwise stated)
(1) Organization and Business ScopeBank of Taiwan (the Bank) was incorporated on May 20, 1946 and transformed into a corporate entity since July 1,
2003, as approved by the Ministry of Finance on April 24, 2003, and became a public company from September 16, 2004.
On November 18, 2005, the House of Administration (Executive Yuan) authorized the merger of the Bank and the Central Trust of China. The merger plan was approved by the Fair Trade Commission, the Executive Yuan, and the Ministry of Finance. On December 22, 2006, the Financial Supervisory Commission, Executive Yuan, reauthorized the merger and indicated the Central Trust of China was the dissolved party and the Bank was the surviving party. The merger was accomplished on July 1, 2007.
On January 1, 2008, the Ministry of Finance organized Taiwan Financial Holding Co., Ltd. in accordance with the Act of Taiwan Financial Holding Co., Ltd., and the Bank is its subsidiary.
On January 2, 2008, the Bank decreased its capital by $8 billion and split off its part of business and assets to set up two other subsidiaries of Taiwan Financial Holding Co., Ltd. (Taiwan Financial Holdings): BankTaiwan Securities Co., Ltd. (BankTaiwan Securities) and BankTaiwan Life Insurance Co., Ltd. (BankTaiwan Life Insurance), whose capital was $3 billion and $5 billion, respectively.
The Bank is primarily involved in (a) all commercial banking operations allowed under the Banking Law; (b) foreign exchange operations allowed under the Foreign Exchange Regulation Act; (c) operations of offshore banking unit allowed under the Offshore Banking Act; (d) savings and trust operations; (e) overseas branch operations authorized by the respective foreign governments; and (f) other operations as authorized by the central competent authority in charge.
The Bank’s Trust department is engaged in the planning, management and operation of trusts under the Banking Law and Trust Law, along with the investment of overseas securities and trust funds.
In accordance to the Bank’s policy approved by the Government, the Bank’s mission’s is to perform all functions in providing stable financial environment, contribute to the economic infrastructure and develop manufacturing industries. The Bank manages public treasury and ensures the smooth settlement of national operations, which later translated into providing normal banking facilities and issuing banknotes as Central Bank of the Republic of China was later promulgated in July, 1961. The relationship between the Bank and the Central Bank remained closely attached. Among the financial institutions in Taiwan, the Bank has always maintained its importance in the financial industry.
The assets of the Bank have continuously increased through revaluations of its legal and special reserve over the period since the Government provided the capital for the establishment of the Bank. After the currency revolution in June 1949, the Government approved $5 million as the Bank’s capital in May 1950; $100 million in May 1954; $300 million in August 1963; $600 million in September 1967; $1 billion in May 1973; $2 billion in September 1977; $4 billion in September 1980; $8 billion in November 1982; $12 billion in May 1990; $16 billion in April 1992; $22 billion in December 1994; $32 billion in August 1998; $48 billion in September 2002; $53 billion in July 2007; $45 billion in January 2008; $70 billion in November 2010 and $95 billion in October 2014.
As the Bank is funded and owned by the government, the execution and compliance with government policies is of importance to the Bank. The economy of Taiwan has developed considerably from the 50s and the Bank has contributed by supporting the planning and implementation of many medium to long term infrastructure. Through the years, the Government has actively increased strategic and critical industrial development. The Bank has similarly increased its support for the fund needed for such infrastructure in compliance with the Government policy.

8988
Financial Information
The Bank has its Head Office in Taipei, and the Bank has established domestic and worldwide branch offices for expansion of various banking services. As of December 31, 2016, in addition to about thirty Departments, including the Department of Planning, Department of Corporate Finance, Department of Credit Management, Department of Loan Assets Management, Department of Wealth Management, Department of Circulation, Department of Public Treasury, Department of Risk Management, Department of Business, Department of International Banking, Department of Trusts, Department of Electronic Banking, Department of Consumer Finance, Department of Treasury, Department of Real Estate Management, Department of Procurement, Department of Domestic Operations, Department of Government Employees Insurance, Department of Precious Metals, Department of Credit Analysis, Department of General Affairs, Secretariat, Department of Human Resources, Department of Ethics, Department of Accounting, Department of Economic Research, Department of Information Management, Department of Compliance, Board Secretariat, Department of Auditing Board of Directors and etc., there were 163 domestic branches, 1 offshore banking unit, 10 overseas branches, 1 subbranch (in Shanghai Jiading), 2 representative offices (in Mumbai and Yangon) and 3 preparatory offices (in Sydney, Hanoi, and Shanghai pilot free trade zone).
The Bank invested $20 million dollars to set up a subsidiary, BankTaiwan Insurance Brokers, which was approved on January 23, 2013 and officially set up on February 6, 2013.
The parent company of the Bank is Taiwan Financial Holding Co., Ltd.
The consolidated financial statements as of December 31, 2016 include the accounts of the Bank and its
subsidiary (hereby referred as the Bank and its subsidiary).
(2) Financial statements authorization date and authorization process The consolidated financial statements were approved by the Audit Committee on March 13, 2017 and were
authorized for issue by the Board of Directors on March 17, 2017.
(3) New standards and interpretations not yet adopted
1) Impact of the International Financial Reporting Standards (“IFRSs”) endorsed by the Financial Supervisory Commission, R.O.C. (“FSC”) but not yet effect
According to Ruling No. 1050026834 issued on July 18, 2016, by the FSC, public entities are required to conform to the IFRSs which were issued by the International Accounting Standards Board (IASB) before January 1, 2016, and were endorsed by the FSC on January 1, 2017 in preparing their financial statements. The related new standards, interpretations and amendments are as follows:
New, Revised or Amended Standards and Interpretations Effective date per IASB
Amendments to IFRS 10, IFRS 12 and IAS 28 “Investment Entities: Applying the Consolidation Exception” January 1, 2016
Amendments to IFRS 11 “Accounting for Acquisitions of Interests in Joint Operations” January 1, 2016IFRS 14 “Regulatory Deferral Accounts” January 1, 2016Amendment to IAS 1 “Disclosure Initiative” January 1, 2016Amendments to IAS 16 and IAS 38 “Clarification of Acceptable Methods of Depreciation and Amortization” January 1, 2016
Amendments to IAS 16 and IAS 41 “Agriculture: Bearer Plants” January 1, 2016Amendments to IAS 19 “Defined Benefit Plans: Employee Contributions” July 1, 2014Amendment to IAS 27 “Equity Method in Separate Financial Statements” January 1, 2016Amendments to IAS 36 “Recoverable Amount Disclosures for Non Financial Assets” January 1, 2014Amendments to IAS 39 “Novation of Derivatives and Continuation of Hedge Accounting” January 1, 2014Annual improvements cycles 2010-2012 and 2011-2013 July 1, 2014Annual improvements cycle 2012-2014 January 1, 2016IFRIC 21 “Levies” January 1, 2014

2016 ANNUAL REPORT
BANK FTAIWAN
9190
Except for the amendments to IAS 36 “Recoverable Amount Disclosures for Non-Financial Assets,” the Bank and its subsidiary assessed that the adoption of the above IFRSs would not have material impact on the consolidated financial statements:
The newly amended standard stated that if the recoverable amount for which an impairment loss has been recognized as fair value, less, costs of disposal, an enterprise is required to disclose the fair value hierarchy (Level 2 or Level 3) and the key assumptions used to measure the fair value. The Bank and its subsidiary expects the amendments will result in additional disclosures of the recoverable amount for non-financial assets.
2) Newly released or amended standards and interpretations not yet endorsed by the FSC
A summary of the new standards and amendments issued by the IASB but not yet endorsed by the FSC. The FSC announced that the Bank and its subsidiary should apply IFRS 9 and IFRS 15 starting January 1, 2018. As of the date the Bank and its subsidiary’s financial statements were issued, the standards that the FSC has yet to announce the effective dates of the other IFRSs are as follows:
New, Revised or Amended Standards and Interpretations Effective date per IASB
IFRS 9 “Financial Instruments” January 1, 2018
Amendments to IFRS 10 and IAS 28 “Sale or Contribution of Assets Between an Investor and Its Associate or Joint Venture”
Effective date to be determined by IASB
IFRS 15 “Revenue from Contracts with Customers” January 1, 2018
IFRS 16 “Leases” January 1, 2019
Amendment to IFRS 2 “Clarifications of Classification and Measurement of Share based Payment Transactions” January 1, 2018
Amendment to IFRS 15 “Clarifications of IFRS 15” January 1, 2018
Amendment to IAS 7 “Disclosure Initiative” January 1, 2017
Amendment to IAS 12 “Recognition of Deferred Tax Assets for Unrealized Losses” January 1, 2017
Amendments to IFRS 4 “ Insurance Contracts”(“Applying IFRS 9 Financial Instruments with IFRS 4 Insurance Contracts”) January 1, 2018
Annual Improvements to IFRS Standards 2014-2016 Cycle:
IFRS 12 “Disclosure of Interests in Other Entities” January 1, 2017
IFRS 1 “First-time Adoption of International Financial Reporting Standards” and IAS 28 “Investments in Associates and Joint Ventures” January 1, 2018
IFRIC 22 “Foreign Currency Transactions and Advance Consideration” January 1, 2018
Amendments to IAS 40 Investment Property January 1, 2018

9190
Financial Information
Among above, the standards that may have impact on the Bank and its subsidiary are as follows:
Issuance / Release Dates Standards or Interpretations Content of amendment
November 19, 2013July 24, 2014
IFRS 9 “Financial Instruments”
The standard will replace IAS 39 “Financial Instruments: Recognition and Measurement”, and the main amendments are as follows:‧Classification and measurement: Financial assets are
measured at amortized cost, fair value through profit or loss, or fair value through other comprehensive income, based on both the entity’s business model for managing the financial assets and the financial assets’ contractual cash flow characteristics. Financial liabilities are measured at amortized cost or fair value through profit or loss. Furthermore, there is a requirement that “own credit risk” adjustments be measured at fair value through other comprehensive income.
‧Impairment: The expected credit loss model is used to evaluate impairment.
‧Hedge accounting: Hedge accounting is more closely aligned with risk management activities, and hedge effectiveness is measured based on the hedge ratio.
January 13, 2016 IFRS 16 “Leases”
The new standard of accounting for lease is amended as follows:‧For a contract that is, or contains, a lease, the lessee
shall recognize a right-of-use asset and a lease liability in the balance sheet. In the statement of profit or loss and other comprehensive income, a lessee shall present interest expense on the lease liability separately from the depreciation charge for the right-of-use asset during the lease term.
‧A lessor classifies a lease as either a finance lease or an operating lease, and therefore, the accounting remains similar to IAS 17.
The Bank and its subsidiary are currently assessing the impact on its financial position and financial performance of the adoption of the abovementioned standards or interpretations. The results thereof will be disclosed once the evaluation is completed.
(4) Significant accounting policies
1) Statement of compliance
The Bank and its subsidiary are a public company. The Bank and its subsidiary have set up its accounting policies and prepared financial statements according to the Regulations Governing the Preparation of Financial Reports by Public Banks, the International Financial Reporting Standards, the International Accounting Standards, IFRIC Interpretations, and SIC Interpretations as well as related guidelines endorsed by the Financial Supervisory Commission, ROC.
The Bank and its subsidiary are government owned enterprises, so its accounting practices mainly follow the Budget Law, Account Settlement Law and Uniform Regulations on Accounting Systems for Banks Governed by the Ministry of Finance (the MoF). The annual financial statements are examined by the Ministry of Audit (the MoA) to ensure that the Bank complies with the budget approved by the Legislative Yuan, the parliament of ROC Taiwan. The financial statements is not finalized until certified by the MoA.
The financial statements of 2015 were certified by the MoA, and the opening balances of retained earnings of 2016 are the same as those certified in the closing balances of 2015. Please see Note 51(2) for the government audit adjustments.

2016 ANNUAL REPORT
BANK FTAIWAN
9392
2) Basis of consolidation
1. Principle of preparation of the consolidated financial statements
The consolidated financial statements comprise the Bank and its subsidiary. The financial statements of its subsidiary are included in the consolidated financial statements from the date that control commences until the date that control ceases. Losses applicable to the non-controlling interests in a subsidiary are allocated to the non-controlling interests even if doing so causes the non-controlling interests to have a deficit balance.
Intra-group balances and transactions, and any unrealized income and expenses arising from intra-group transactions are eliminated in preparing the consolidated financial statements.
2. List of subsidiaries in the consolidated financial statements
Name of Investor Name of Subsidiary Principal activities
Shareholdings
NoteDecember 31, 2016
December 31, 2015
Bank of Taiwan BankTaiwan Insurance Brokers (BTIB)
Life and Property insurance broker 100.00% 100.00%
3) Basis of preparation
1. Basis of measurement
Except for the following items, the consolidated financial statements are prepared on a historical cost basis:
(a) Financial instruments measured at fair value through profit or loss (including derivative financial instruments)
(b) Available-for-Sale financial assets measured at fair value
(c) Hedging derivatives are measured at fair value
(d) The defined benefit assets are recognized as plan assets, plus unrecognized past service costs and unrecognized actuarial loss, less the unrecognized actuarial gain and the present value of the defined benefit obligation.
2. Functional and presentation currency
The functional currency of the Bank and its subsidiary entities are determined based on the primary economic environment in which the entities operats. The consolidated financial statements are presented in New Taiwan Dollars, which is the Bank’s functional currency. All financial information presented in New Taiwan Dollars has been rounded to the nearest thousand.
4) Foreign currency
1. Foreign currency transactions
Transactions in foreign currencies are translated to the respective functional currencies of the Bank and its subsidiary at the exchange rates of the dates of the transactions. Monetary assets and liabilities denominated in foreign currencies at the reporting date are retranslated to the functional currency at the exchange rate at that date. The foreign currency gain or loss on monetary items is the difference between the amortized cost in the functional currency at the beginning of the year adjusted for the effective interest and payments during the year, and the amortized cost in foreign currency translated at the exchange rate at the end of the year.

9392
Financial Information
Non-monetary assets and liabilities denominated in foreign currencies that are measured at fair value are retranslated to the functional currency at the exchange rate at the date that the fair value was determined. Non-monetary items in a foreign currency that are measured based on historical cost are translated using the exchange rate at the date of translation.
Foreign currency differences arising on retranslation are recognized in profit or loss, except for the following differences which are recognized in other comprehensive income arising on the retranslation:
(a) available-for-sale equity investment;
(b) a financial liability designated as a hedge of the net investment in a foreign operation to the extent that the hedge is effective; or
(c) qualifying cash flow hedges to the extent the hedge is effective.
2. Foreign operations
The assets and liabilities of foreign operations, including goodwill and fair value adjustments arising on acquisition, are translated to the Bank and its subsidiary’s functional currency at the exchange rates of the reporting date. The income and expenses of foreign operations, excluding foreign operations in hyperinflationary economies, are translated to the Bank and its subsidiary’s functional currency at average rate. Foreign currency differences are recognized in other comprehensive income, and presented in the foreign currency translation reserve (translation reserve) in equity.
However, if the foreign operation is a non-wholly owned subsidiary, then the relevant proportion of the translation difference is allocated to non-controlling interests. When a foreign operation is disposed of such that control, significant influence or joint control is lost, the cumulative amount in the translation reserve related to that foreign operation is reclassified to profit or loss as part of the gain or loss on disposal. When the Bank and its subsidiary dispose of any part of its interest in a subsidiary that includes a foreign operation while retaining control, the relevant proportion of the cumulative amount is reattributed to non-controlling interest. When the Bank and its subsidiary dispose of only part of investment in an associate of joint venture that includes a foreign operation while retaining significant or joint control, the relevant proportion of the cumulative amount is reclassified to profit or loss.
When the settlement of a monetary item receivable from or payable to a foreign operation is neither planed nor likely in the foreseeable future, foreign currency gains and losses arising from such items are considered to form part of a net investment in the foreign operation and are recognized in other comprehensive income, and presented in the translation reserve in equity.
5) Cash and cash equivalents
For consolidated balance sheets, Cash and cash equivalents include cash on hand, due from banks, demand deposits and highly liquid investments that are readily convertible into known amount of cash and which are subject to insignificant risk of change in value. The aforementioned time deposits which are held for short-term cash commitment rather than investment or other purposes are recognized as cash equivalents.
For consolidated statement of cash flows, cash and cash equivalents refer to cash and cash equivalents presented in consolidated statement of balance sheet, deposit in the central bank, call loans to banks, and investments of bonds and callable notes which are in accordance with the definition of cash and cash equivalents in the International Accounting Standards 7 accepted by FSC.
6) Financial instrument
The Bank and its subsidiary adopt the trade date accounting for financial assets. The financial assets and liabilities are recognized when the Bank and its subsidiary become a contracting party to the financial

2016 ANNUAL REPORT
BANK FTAIWAN
9594
instrument agreement. Financial instruments are derecognized when the rights to receive cash flows from the financial assets have expired or where the Bank and its subsidiary have transferred substantially all risks and rewards of ownership.
1. Financial asset
The Bank and its subsidiary classify financial assets into the following categories: financial assets at fair value through profit or loss, loans and receivables, available-for-sale financial assets, held-to-maturity financial assets, financial assets at cost and debt investment without active market.
(a) Financial assets at fair value through profit or loss
A financial asset is classified in this category if it is classified as held-for-trading or is designated as such on initial recognition. Financial assets are classified as held-for-trading if they are acquired principally for the purpose of selling in the short term. The Bank and its subsidiary designate financial assets, other than ones classified as held-for-trading, as at fair value through profit or loss at initial recognition under one of the following situations:
a) Designation eliminates or significantly reduces a measurement or recognition inconsistency that would otherwise arise;
b) Performance of the financial asset is evaluated on a fair value basis;
c) A hybrid instrument contains one or more embedded derivatives.
Financial assets in this category are measured at fair value at initial recognition. Attributable transaction costs are recognized in profit or loss as incurred. Financial assets at fair value through profit or loss are measured at fair value, and changes therein, which take into account any dividend and interest income, are recognized in profit or loss, and are included in statement of comprehensive income statement.
(b) Loans and receivables
Loans and receivables are financial assets with fixed or determinable payments that are not quoted in an active market. Loans and receivables comprise accounts receivable and other receivables. Such assets are recognized initially at fair value, plus, any directly attributable transaction costs. Subsequent to initial recognition, loans and receivables are measured at amortized cost using the effective interest method, less, any impairment losses other than insignificant interest on short-term receivables.
Interests are presented under interest revenue in statement of comprehensive income.
Credit maturing less than one year is called short-term loan; credit maturing more than one year but less than seven years is called medium-term loan; credit maturing more than seven years is called long-term loan. Loans with collateral, pledged assets and qualified guarantees to secure credit are secured loans. Non-performing loans refer to those loans for which interests and principal payments has been in arrears for three months or more, and those loans which the principal or interest has not yet been in arrears for more than three months, but with regards to which the creditor has sought payment from primary/subordinate debtors or has disposed of collateral. All non-performing loans shall be transferred to non-accrual loans within six months after the end of the payment period expect for the loans repaid in installments by agreements. Interest shall not be accrued to non-performing loans that are transferred to non-accrual loans account. However, loan collection shall continue as per the terms of the relevant agreement, and accrued interest shall continue to be posted to the interest column of the non-accrual loans account for each borrower, or a notation of such shall be made.
The write-off of non-performing loans and non-accrual loans shall be discussed by the related committee, reviewed by the general manager and approved by a resolution passed by the board of directors or

9594
Financial Information
the board of managing directors and the audit committee shall be notified of the write-off. The board of directors shall be notified if the write-off case is passed by the board of the managing directors. Collections after write-off shall be reversed from the allowance for bad debt.
(c) Available-for-sale financial assets
Available-for-sale financial assets are non-derivative financial assets that are designated as available-for-sale or are not classified in any of the other categories of financial assets. Available-for-sale financial assets are recognized initially at fair value, plus, any directly attributable transaction cost. Subsequent to initial recognition, they are measured at fair value, and changes therein, other than impairment losses, interest income calculated using the effective interest method, dividend income, and foreign currency differences on available-for-sale debt instruments, are recognized in other comprehensive income and presented in the fair value reserve in equity. When an investment is derecognized, the gain or loss accumulated in equity is reclassified to profit or loss, and is included in other income and statement of comprehensive income.
Dividend income is recognized in profit or loss on the date that the Bank’s right to receive payment is established, which in the case of quoted securities is normally the ex-dividend date. Such dividend income is included in statement of comprehensive income.
Interest income from investment in bond security is recognized in profit or loss, and it is included in statement of comprehensive income.
(d) Held-to-maturity financial assets
Financial assets which the Bank has the positive intent and the ability to hold debt securities to maturity, such financial assets are classified as held-to-maturity. Held-to-maturity financial assets are recognized initially at fair value, plus, any directly attributable transaction costs. Subsequent to initial recognition, held-to-maturity financial assets are measured at amortized cost using the effective interest method, less, any impairment losses.
Interest income is recognized in profit or loss, and it is included in statement of comprehensive income.
(e) Financial assets at cost
Investments in equity instruments that do not have a quoted market price in an active market and whose fair value cannot be reliably measured, and derivatives those are linked to and must be settled by delivery of such unquoted equity instruments, are measured at cost.
(f) Debts investment without active market
Debt investments without active market are the non-derivative instruments that have fixed or decidable price. Such assets are recognized initially at fair value, plus, any directly attributable transaction costs. Subsequent to initial recognition, debts investment without active market are measured at amortized cost using the effective interest method.
2. Financial liability and equity instrument
The liability and equity instrument issued by the Bank were classified as financial liability and equity based on the substance of the agreement and the definition of financial liability and equity instrument.
(a) Financial liabilities at fair value through profit or loss
This type of financial liabilities refers to the held-for-trading financial liabilities or the financial liabilities designated as fair value through profit or loss.
The held-for-trading financial liabilities are acquired or incur principally for the purpose of selling or repurchasing in a short term. Other than held-for-trading financial liabilities, those financial liabilities will

2016 ANNUAL REPORT
BANK FTAIWAN
9796
be designated upon initial recognition as at fair value through profit or loss when one of the following situations takes place:
a) Eliminate or significantly reduce the measurement or recognition inconsistency that would otherwise arise from measuring assets or liabilities or recognizing the gains and losses on them on different bases.
b) The performance of the financial liabilities is evaluated on a fair value basis.
c) Hybrid instrument contains embedded derivative.
These liabilities are recognized initially at fair value with transaction costs taken directly to income statement, and are subsequently re-measured at fair value. Gains and losses from changes in the fair value of such liabilities (including interest expenses) are reported in the account of profit or loss of financial assets and liabilities at fair value through profit or loss in the comprehensive income statement.
The amount of changes in the fair value of financial liabilities designated as at fair value through profit or loss that is attributable to changes in the credit risk of that liability shall be recognized initially in other comprehensive income, except for the recognition in profit or loss, in order to avoid accounting mismatch. Moreover, the changes in the fair value of loan commitments and financial guarantee contracts shall also be recognized in profit or loss.
The Bank issue financial guarantee contract and loan commitment and designate them as measured at fair value through profit or loss. Its profit or loss is presented in the account of profit or loss of financial assets and liabilities at fair value through profit or loss in the comprehensive income statement.
(b) Other financial liabilities
The financial liabilities not belong to the financial liabilities at fair value through profit or loss shall be measured at fair value, plus, direct attributable transaction costs upon initial recognition, and they are subsequently measured at amortized cost using effective interest method. The un-capitalized interest expenses are presented as interest expense in profit/ loss in the consolidated statement of comprehensive income.
(c) Financial guarantee contract
Financial guarantee contracts are contracts that require the issuer to make specified payments to reimburse the holder for a loss it incurs because a specified debtor fails to make payments when due, in accordance with the terms of a contract between the holder and debtor.
When the Bank issue and not designate the financial guarantee contract as measured at fair value through profit and loss, it shall be assessed at fair value, less, the directly attributable transaction costs initially. After initial recognition, an issuer of such a contract shall measure it at the higher of:
a) the amount determined in accordance with IAS 37 “Provision, Contingent Liabilities and Contingent Assets” and
b) the amount initially recognized, less, when appropriate, cumulative amortization recognized in accordance with revenue accounting policy.
3. Derivative financial instruments and hedge accounting
The Derivative financial instruments means forward swaps, FX swaps, interest rate swaps, cross currency swaps, options and other transactions related to foreign exchange, interest rate and capital market. The derivative financial instruments are initially recognized at fair value and the transaction costs are recognized through profit or loss. The sequential assessment is still assessed by fair value and the resulted gain or loss is recognized as profit or loss. However, for the derivate financial instrument designated as an effective hedging instrument, the recognition timing is decided by the nature of the hedging relationship. When the

9796
Financial Information
fair value of the derivate financial instrument is positive, it should be recorded as financial asset. When it is negative, it should be recorded as financial liability.
When the risk and characteristics of the embedded derivate are not closely related to those of the host contract and the host contract is not carried at fair value through profit or loss, the derivate is treated as a separate derivative.
The Bank document at inception the relationship between hedging instruments and hedged items, as well as its risk management objectives and strategies for undertaking various hedge transactions. The Bank and its subsidiary also document its assessments, both at hedge inception and on an ongoing basis, of whether the hedging instruments that are used in hedging transactions are highly effective in offsetting changes in fair values of hedged items.
Both of the fair value changes in hedging instruments which are designated for value hedge and in conformity with the fair value hedging definition and the fair value changes in hedged assets or liabilities with respect to the hedged risk are immediately recognized in the account related to the hedged item in the comprehensive income.
Hedge accounting must be discontinued prospectively if the Bank and its subsidiary revoke the hedge designation or if the hedge instrument expires or is sold, terminated or exercised or if the hedge no longer meets the hedge accounting criteria.
Where hedge accounting is discontinued, adjustments to the carrying amount of a hedge financial asset for which the effective interest rate is used are amortized to profit or loss. The adjustment is based on a recalculated effective interest rate at the date amortization begins.
7) Investments in associates
Associate refers to an entity in which the Bank, TFH and its subsidiary hold 20% of the voting power or less than 20% of the voting power but have significant influence. If the Bank and its subsidiary have rights on the finance and operating policy decisions but not control or joint control these decisions, it is presumed that the Bank and its subsidiary have significant influence.
The Bank and its subsidiary use equity method for investments in associates. Under the equity method, an equity investment is initially recorded at cost. In the subsequent period, the carrying amount of the investments is adjusted by the share of the profit or loss of the associate and the distributions received. Besides, the Bank and its subsidiary recognize the changes according to the holding shares.
If the Bank dispose the investment and loss significant influence, the residual investments shall be remeasured at fair value of the disposal date. The difference between the fair value of the residual investment plus the disposal price and the original carrying amount of the investment at that date is recognized in income statement. The related other comprehensive income is reclassified as profit or loss.
The associate issues additional share capital, but the Bank do not participate in the share issue on a pro-rata basis. It will lead to change in holding, but the Bank and its subsidiary still have significant influence. As a result, the Bank and its subsidiary shall adjust the APIC and investments in equity method accounts according to the changes in net assets of the associate.
Unrealized profits resulting from the transactions between the Bank and an associate are eliminated to the extent of the Bank and its subsidiary’s interest in the associate. Unrealized losses on transactions with associates are eliminated in the same way, except to the extent that the underlying asset is impaired.
When the Bank’s share of losses exceeds its interest in associates, the carrying amount of the investment, including any long-term interests that form part thereof, is reduced to zero, and the recognition of further losses is discontinued except to the extent that the Bank and its subsidiary has an obligation or has made payments on behalf of the investee.

2016 ANNUAL REPORT
BANK FTAIWAN
9998
8) Property, plant and equipment
1. Recognition and measurement
Items of property and equipment are measured at cost less accumulated depreciation and accumulated impairment losses. Cost includes expenditure that is directly attributed to the acquisition of the asset. The cost of a self-constructed asset comprises material, labor, any cost directly attributable to bringing the asset to the location and condition necessary for it to be capable of operating in the manner intended by management, the initial estimate of the costs of dismantling and removing the item and restoring the site on which it is located, and any borrowing cost that is eligible for capitalization. Cost also includes transfers from equity of any gain or loss on qualifying cash flow hedges of foreign currency purchases of property and equipment. The cost of the software is capitalized as part of the property and equipment if the purchase of the software is necessary for the property and equipment to be capable of operating.
Each part of an item of property and equipment with a cost that is significant in relation to the total cost of the item shall be depreciated separately, unless the useful life and the depreciation method of a significant part of an item of property and equipment are the same as the useful life and depreciation method of another significant part of that same item.
The gain or loss arising from the derecognition of an item of property and equipment shall be determined as the difference between the net disposal proceeds, if any, and the carrying amount of the item, and it shall be recognized as other gains and losses.
2. Reclassification to investment property
When there is a change in use, the Bank and its subsidiary treat the owner-occupied property as investment property; the property shall be reclassified to investment property at carrying amount from then on.
3. Subsequent cost
Subsequent expenditure is capitalized only when it is probable that the future economic benefits associated with the expenditure will flow to the Bank and its subsidiary. The carrying amount of those parts that are replaced is derecognized. Ongoing repairs and maintenance are expensed as incurred.
4. Depreciation
The depreciable amount of an asset is determined after deducting its residual amount, and it shall be allocated on straight-line basis over its useful life. Items of property, plant and equipment with the same useful life may be grouped in determining the depreciation charge. The remainder of the items may be depreciated separately. The depreciation charge for each period shall be recognized in profit or loss.
The depreciable amount of a leased asset is allocated to each accounting period during the period of expected use on a systematic basis consistent with the depreciation policy the lessee adopts for depreciable assets that are owned. If there is reasonably certainty that the lessee will obtain ownership by the end of the lease term, the period of expected use is the useful life of the asset; otherwise, the asset is depreciated over the shorter of the lease term and its useful life.
Land has an unlimited useful life and therefore is not depreciated.
The estimated useful lives for the current and comparative years of significant items of property, plant and equipment are as follows:

9998
Financial Information
Buildings 8 to 55 years
Machinery and equipment 2 to 20 years
Transportation equipment 2 to 15 years
Miscellaneous equipment 2 to 25 years
Leasehold improvements 5 years
9) Lease
1. Operating Lease
A lease is classified as operating lease if it retains substantially all the risks and rewards of ownership. No matter the Bank and its subsidiary are lessors or lessees, the rent is calculated over the lease term on a straight-line basis and recorded as rent revenue or rent expense respectively.
2. Financial Lease
(a) The Bank is lessors. The assets under financial lease will be recognized as lease payment receivables by the net investment value. The original cost which is cause by the operating lease agreement is included in the net lease investment. Lease investment is recognized as financial lease because of it has a steady rate of return, apportioning into each lease period.
(b) The Bank is lessees. They capitalize the lower of the fair value of the leased asset and the present value of the minimum lease payments. Lease payments made are allocated as a reduction of the obligation and interest expenses. Interest expenses are calculated by the opening balance of lease obligation using the interest rate implicit in the lease or the lessee’s incremental borrowing rate of interest and recognized in the income statement. The attained property, plant and equipment are measured at cost.
10) Investment property
Investment property is property held either to earn rental income or for capital appreciation or for both, but not for sale in the ordinary course of business, for use in the production or supply of goods or services, or for administrative purposes. Investment property is measured at cost on initial recognition and subsequently at cost less accumulated depreciation and accumulated impairment losses. Depreciation expense is calculated based on the depreciation method, useful life, and residual value which are the same as those adopted for property, plant and equipment.
Cost includes expenditure that is directly attributable to the acquisition of the investment property. The cost of self constructed investment property includes the cost of raw materials and direct labor, and any other costs directly attributable to bringing the investment property to a working condition for its intended use, as well as capitalized borrowing costs.
When the use of an investment property changes such that it is reclassified as property, plant and equipment, its book value at the date of reclassification becomes its cost for subsequent accounting.
11) Intangible assets
1. Computer Software
The Bank and its subsidiary measure the computer software at cost less accumulated amortization and accumulated loss.

2016 ANNUAL REPORT
BANK FTAIWAN
101100
2. Subsequent Expenditure
Subsequent expenditure is capitalized only when it increases the future economic benefits embodied in the specific asset to which it relates. All other expenditure, including expenditure on internally generated goodwill and brands, is recognized in profit or loss as incurred.
3. Amortization
The depreciable amount is the cost of an asset, or other amount substituted for cost, less its residual value.
Amortization is recognized in profit or loss on a straight-line basis over the estimated useful lives of intangible assets, other than goodwill and intangible assets with all indefinite useful life, from the date that they are available for use. The estimated useful lives for the current and comparative periods are as follows:
Computer software 5 years
The residual value, amortization period, and amortization method for an intangible asset with a finite useful life shall be reviewed at least annually at each fiscal year-end. Any change shall be accounted for as changes in accounting estimates.
Intangible asset is derecognized when disposed or expected that the usage or disposal will not generate economic benefit in the future. The resulted gain or loss is recognized in the income statement.
12) Impairment of Assets
1. Impairment of financial assets
The financial assets with are not measured at fair value through profit or loss shall be assessed for impairment at each reporting date. A financial asset is impaired if, and only if, there is an objective evidence of impairment as a result of one or more events that occurred after the initial recognition of the asset (a “loss event”) and that loss event (or events) has an impact on the estimated future cash flows of the financial asset that can be estimated reliably.
Objective evidence that financial assets are impaired includes default or delinquency by a debtor, restructuring of an amount due to the Bank and its subsidiary on terms that the Bank and its subsidiary would not consider otherwise, indications that a debtor or issuers will enter bankruptcy, adverse changes in the payment status of borrowers or issuers, economic conditions that correlate with defaults, or the disappearance of an active market for a security. In addition, for an investment in an equity security, a significant or prolonged decline in its fair value below its cost is accounted for as objective evidence of impairment.
Impairment losses and recoveries are recognized in profit or loss, and they are included in statement of comprehensive income.
Impairment losses recognized on an available-for-sale equity are not reversed through profit or loss. Any subsequent recovery in the fair value of an impaired available-for-sale equity security is recognized in other comprehensive income, and accumulated in other equity.
If, in a subsequent period, the fair value of an impaired available-for-sale debt security increases and the increase can be related objectively to an event occurring after the impairment loss was recognized, then the impairment loss is reversed, with the amount of the reversal recognized, in profit or loss.
If, in a subsequent period, the amount of the impairment loss of a financial asset measured at amortized cost decreases and the decrease can be related objectively to an event occurring after the impairment was recognized, the decrease in impairment loss is reversed through profit or loss to the extent that the

101100
Financial Information
carry in value of the asset does not exceed its amortized cost before impairment was recognized at the reversal date.
All individually significant receivables are assessed for specific impairment. Receivables that are not individually significant are collectively assessed for impairment by grouping together assets with similar risk characteristics. When assessing collective impairment, the Bank and its subsidiary uses historical trends of the probability of default, the timing of recoveries, and the amount of loss incurred, adjusted for management’s judgment as to whether current economic and credit conditions are such that the actual losses are likely to be greater or lesser than those suggested by historical trends.
An impairment loss in respect of a financial asset is deducted from the carrying amount, except for trade receivables, for which an impairment loss is reflected in an allowance account against the receivables. When it is determined a receivable is uncollectible, it is written off from the allowance account. Any subsequent recovery of receivable written off is recorded in the allowance account. Changes in the amount of the allowance account are recognized in profit or loss.
The Bank evaluates the categories and recognizes allowance for doubtful accounts according to the higher of the Regulations of the Procedures for Banking Institutions to Evaluate Assets and Deal with Past-Due/Non-performing Loans and the Regulation of Evaluating the Impairment Loss of Loans and Receivables.
An impairment loss in respect of a financial asset measured at amortized cost is calculated as the difference between its carrying amount and the present value of the estimated future cash flows discounted at the asset’s original effective interest rate.
An impairment loss in respect of a financial asset measured at cost is calculated as the difference between its carrying amount and the present value of the estimated future cash flows, discounted at the current market rate of return for a similar financial asset. Such impairment loss is not reversible in subsequent periods.
2. Impairment loss of non-financial assets
For non-financial assets except for the deferred tax asset and asset caused by the employee benefit, the Bank and its subsidiary shall assess at the end of each reporting date whether there is any indication that an asset may be impaired. If any such indication exists, the Bank and its subsidiary shall estimate the recoverable amount of the asset. If it is not possible to estimate the recoverable amount of the asset individually, they shall determine the recoverable amount of the cash generating unit to which the asset belongs.
The recoverable amount of an asset or a cash generating unit is the higher of its fair value less costs of disposal and its value in use. If the recoverable amount is less than its carrying amount, the carrying amount of the asset shall be reduced to its recoverable amount. That reduction is an impairment loss which shall be recognized immediately in profit or loss.
The Bank and its subsidiary assess at the end of each reporting date whether there is any indication that an impairment loss recognized in prior years for an asset other than goodwill may no longer exist or may have decreased. If any such indication exists, the entity shall estimate the recoverable amount of that asset.
An impairment loss recognized in prior periods for an asset other than goodwill shall be reverse if, and only if, there has been a change in the estimates used to determine the asset’s recoverable amount. The carrying amount of the asset shall be increased to its recoverable amount, but the increased carrying amount of an asset or an cash generating unit other than goodwill attributable to a reversal of the impairment loss shall not exceed the carrying amount that would have been determined (net of amortization or depreciation) had no impairment loss been recognized for the asset or the cash generating unit in prior years.
2016 ANNUAL REPORT
BANK FTAIWAN
103102
Notwithstanding whether indicators exist, recoverability of goodwill and intangible assets with indefinite useful lives or those not yet in use are required to be tested at least annually. Impairment loss is recognized if the recoverable amount is less than the carrying amount.
For the purpose of impairment testing, goodwill acquired in a business combination shall, from the acquisition date, be allocated to each of the acquirer’s cash generating units, or groups of cash generating units, that are expected to benefit from the synergies of the combination, irrespective of whether other assets or liabilities of the acquiree are assigned to those units or group of units.
If the carrying amount of the cash generating units exceeds the recoverable amount of the unit, the entity shall recognize the impairment loss, and the impairment loss shall be allocated to reduce the carrying amount of each asset in the unit.
Reversal of an impairment loss for goodwill is prohibited.
13) Provision
1. The Bank and its subsidiary must recognize a provision if, and only if:
(a) There is a legal or constructive present obligation as a result of a past event, and
(b) Payment is probable, and
(c) The amount can be reliably estimated.
2. The amount recognized as a provision should be the best estimate of the expenditure required to settle the present obligation at the balance sheet date .In reaching its best estimate, the Bank and its subsidiary shall take into account the risks, uncertainties that surround the underlying events and the time value of the currency.
3. The Bank and its subsidiary evaluate the provision at every end of the reporting date, and adjust the carrying amount according to the best estimation.
14) Other reserves
Provision for civil servants’, teachers’ and labor’s insurance: The Bank recognizes the surplus of the insurance as provision and withdraws when there is a deficit according to the “Civil Servant and Teacher Insurance Act” and “Guidelines for Management and Employment of Public Servants and Teachers Insurance Reserve”.
15) Revenue and expense recognition
1. Revenue is the gross inflow of economic benefits during the period arising in the course of the ordinary operating activities of an entity when those inflows result in increases in equity, other than increase relating to contributions from equity participants.
2. The amount of revenue arising on a transaction is usually determined by agreement between the entity and the buyer or user of the asset. It is measured at the fair value of the consideration received or receivable taking into account the amount of any trade discounts and volume rebates allowed by the entity. Revenue shall be recognized when all of the following criteria have been satisfied:
(a) the seller has transferred to the buyer the significant risks and rewards of ownership.
(b) it is probable that the economic benefits associated with the transaction will flow to the seller
(c) the costs incurred or to be incurred in respect of the transaction can be measured reliably,

103102
Financial Information
(d) the seller retains neither continuing managerial involvement to degree usually associated with ownership nor effective control over the goods sold, and
(e) the amount of revenue can be measured reliably.
3. Except for the financial assets and liabilities at fair value through profit and loss, the interest revenue and interest expense caused by the interest-bearing financial assets or liabilities are calculated by effective interest method. For loans and receivables, the Bank and its subsidiary shall consider the materiality principle to decide to measure the interest by agreed interest rate or effective interest rate.
4. Service fee income and expense
(a) The service fee income arising from offering loan service or other services shall be recognized in the accounting period in which the services are rendered.
(b) The service fee or expense arising from the loan service shall be amortized in the service period or taken into account for calculating the effective interest of loans and receivables in accordance with the materiality principle.
5. Dividend revenue: it shall be recognized if and only if the Bank and its subsidiary have right to receive the dividend revenue.
6. According to the “Civil Servant and Teacher Insurance Act”, if GESSI experiences a loss, the loss before May 31, 1999 would be covered by the Ministry of Finance; and the loss after that date would be covered by an adjustment of the insurance premium.
7. Revenue and expense that relate to the same transaction or other event are recognized simultaneously; this process is commonly referred to as the matching of revenue and expense.
16) Employee benefit
1. Short-term employee benefit
The payroll, annual bonus, paid annual leave, interest expense arising from preferential interest rate and non-monetary benefit are recognized in the accounting year in which the services are rendered by employees.
2. Employee benefit
(a) Employee pension:
The grant of employees’ pension compromise: a) the contributions made by the Bank at the rate from 4% to 8.5% of the employee’s monthly wage (depending on the employee’s ‘salary point’ and service period before the Labor Standards Act was applied) and the contributions made by the employee at the rate of 3% of his or her monthly wage under Article 9 and Article 8, respectively, of the aforementioned regulations. (The Bank ceased to continue the contributions mentioned above after the Labor Standards Act was applied.) The Bank also contributed 3% of the total amount of the wages as reserve. ;b) the contributions calculated based on the employee’s monthly wage and service period (after May 1, 1997) in accordance with Article 41.1 and the related regulations set forth in the Labor Standards Act. All the contributions are made to the fund managed by the Pension Supervision Committee for future payments.
(b) Labor pension:
Labor Pension is a defined contribution pension plan. The grant of labors’ pension is conducted under the Bank’s Work Rules before the Labor Standards Act was applied. Under Article 73 of the Rules,

2016 ANNUAL REPORT
BANK FTAIWAN
105104
the service period before and after May 1, 1997 is accumulated in accordance with the Rules and the Labor Standard Act, respectively. The contributions calculated at a certain rate under Labor Pension are made to a designated Labor Retirement Reserve Account for future payments. In addition, the Bank is required to allocate 6% of each employee’s monthly wages to the labor pension personal account at the Bureau of the Labor Insurance in accordance with the provisions of the Labor Pension Act effective July 1, 2005.
(c) For defined contribution plan, the employer has no further legal or constructive obligation to pay further contributions in accordance with the Labor Pension Act.
(d) For the definite benefit plan, the independent actuary uses the projected unit credit method to calculate the present value of the defined benefit obligation and the current service cost. The present value of the defined benefit obligation is the projected future cash flow discounted by the market yields at the end of the reporting period on the bonds that have maturity dates approximating the terms of the obligation and that are denominated in the same currency in which the benefits are expected to be paid. The actuarial gains and losses are recognized in the other comprehensive income when they occur.
Remeasurements of the net defined benefit liability or asset comprise: a) actuarial gains and losses; b) return on plan assets, excluding the amounts included in net interest on the net defined benefit liability (asset); and c) any changes in the effect of the asset ceiling, excluding the amounts included in net interest on the net defined benefit liability (asset). The remeasurements of the net defined benefit liability or asset are recognized in other comprehensive income and the subsequent reclassification to profit or loss is prohibited. However, the Bank and its subsidiary can , and have elected to transfer the amount (arising from remeasurement) to retained earnings. All actuarial gains and losses resulting from practical experiences and changes on actuarial assumptions are immediately recognized in other comprehensive income. Prior period servicing costs should immediately be recognized in profit or loss.
Pension cost for an interim period is calculated on a year-to-date basis by using the actuarially determined pension cost rate at the end of the prior fiscal year, adjusted for significant market fluctuations from that time and for significant curtailments, settlements, or other significant one-off events.
(e) The oversea branches of the Bank abide by the foreign government’s regulations.
3. Preferential interest deposits
(a) The Bank and its subsidiary provide their employees the preferential interest deposits, including that for current employees and retired employees. The difference between the preferential interest rate and the market rate are the employee benefit.
(b) In accordance with the Article 28 of the Regulations Governing the Preparation of Financial Reports by the Public Banks, if the preferential interest rate for retired employees exceeds the market rate, the Bank and its subsidiary shall calculate the excess interest using the actuarial method by adopting the IAS 19 when the employees retire. However the actuarial assumptions shall follow the government’s related regulations. For the preferential interest deposits paid for current employees, the Bank and its subsidiary shall calculate the interest monthly on accrual basis. The different amount of the preferential interest rate and market interest rate is recognized under the preferential interest account in the comprehensive income statement.
4. Other employee’s retirement benefits
(a) Include three Chinese festival gifts, survivors benefit, and special benefits to retired employees who were paid pension in early times.

105104
Financial Information
(b) It belongs to the definite benefit plan, and the independent actuary uses the projected unit credit method to calculate the present value of the defined benefit obligation and the current service cost. The present value of the defined benefit obligation is the projected future cash flow discounted by the market yields at the end of the reporting period on the bonds that have maturity dates approximating the terms of the obligation and that are denominated in the same currency in which the benefits are expected to be paid. The actuarial gains and losses are recognized in the other comprehensive income when they occur.
17) Income tax
Income tax expenses include both current taxes and deferred taxes. Except for expenses related to business combinations or recognized directly in equity or other comprehensive income, all current and deferred taxes shall be recognized in profit or loss.
1. Current income tax
Current taxes include tax payables and tax deduction receivables on taxable gains (losses) for the year calculated using the statutory tax rate on the reporting date or the actual legislative tax rate, as well as tax adjustments related to prior years.
2. Deferred Tax
When measuring the deferred tax asset and deferred tax liability, the Bank and its subsidiary shall use the enacted tax rate for the periods in which deferred tax asset or deferred tax liability are expected to be settled or realized. Due to the temporary difference between the carrying amount of the asset or liability in the consolidated financial report and the tax basis, the deferred income tax is recognized. The main temporary differences are resulted from the valuation of part financial instruments (including derivatives), pension and the reserves of other retirement benefits. If the temporary differences are arising from goodwill or original recognition of other assets and liabilities (excluding the merger) and the transaction does not affect the taxable income and the accounting income, it will not be recognized as deferred tax asset or deferred tax liabilities.
The deferred tax liability shall be recognized for all taxable temporary differences. But the deferred tax asset can only be recognized when there is enough taxable income for deductable temporary differences.
The temporary difference related to the investments in subsidiaries, branches and associates shall be recognized as deferred income liability. If the parent company can control the time to reverse the temporary difference and the temporary difference will probably not be reversed in the foreseeable future, the temporary difference is not recognized.
18) Earnings per share
Basic earnings per share: The earnings per share is computed by dividing the net income or loss by the weighted average number of common stocks outstanding over the reporting term.
19) Operating segments
An operating segment is a component of the Bank and its subsidiary that engages in business activities that can generate revenues and expenses (including the revenues and expenses arising from inter-company transactions). The segments’ operating results are reviewed regularly by the Bank and its subsidiary’s chief operating officer in order to decide the resource allocation and assess the segments’ performance. Each segment has separate financial information.

2016 ANNUAL REPORT
BANK FTAIWAN
107106
(5) Significant accounting judgments, estimations, assumptions, and sources of estimation uncertainty The preparation of the financial statements, in conformity with the Regulations Governing the Preparation of
Financial Reports by Public Banks and the International Financial Reporting Standards (“IFRSs”) endorsed by the Financial Supervisory Commission, R.O.C. (“FSC”), requires management to make judgments, estimates and assumptions that affect the application of the accounting policies and the reported amount of assets, liabilities, income and expenses. Actual results may differ from these estimates.
The management continued to monitor the accounting assumptions, estimates and judgments. It recognized the changes in the accounting estimates during the period and the impact of the changes in the accounting estimates in the next period.
Determination of the book value of the assets and the liabilities were influenced by the accounting estimations and judgments that have the most significant effects on the amounts recognized in the consolidated financial statements. Actual results may significantly differ from the followings due to the changes in accounting assumptions and judgments.
1) Assessments of loans impairment
The Bank and its subsidiary review loan portfolios to assess impairment periodically. In determining whether an impairment loss should be recorded in the income statement, the Bank makes judgments as to whether there is any observable data indicating a measurable decrease in the estimated future cash flows from a portfolio of loans before the decrease can be identified with an individual loan in that portfolio. This evidence may include observable data indicating that there has been an adverse change in the payment status of borrowers (e.g. payment delinquency or default), or economic conditions that correlate with defaults on assets. The management uses estimates based on historical loss experience for assets with credit risk characteristics and objective evidence of impairment similar to those in the portfolio when estimating expected future cash flows. The methodology and assumptions used for estimating both the amount and timing of future cash flows are reviewed regularly in order to decrease the difference between estimated loss and actual loss.
For the valuation of impairment loss of loans, please see Note 12.
2) The valuation of financial instruments
The fair value of non-active market or non-quoted financial instruments is determined using the valuation techniques. Such fair value is based on observable data of similar financial instruments or valuation model. If there are no observable market parameters, the fair value of financial instruments is evaluated based on appropriate assumptions. If fair value is determined using the valuation model, the model is calibrated to ensure that all output data and results reflect the actual market price. This valuation model use only observable data as much as possible. However, for credit risks, both our own and the contracting parties credit risk, the managements shall estimate their relations and variations.
For the sensitivity analysis of financial instruments, please see Note 44.
3) The assessment of impairments of financial assets
1. Available-for-sale securities
The Bank is required to assess whether there is any objective evidence of impairment. The objective evidence includes a significant or prolonged decline in its fair value, a significant financial difficulty of an issuer or debtor, default, indications that a debtor or issuer will enter bankruptcy or financial reorganization and so on.
107106
Financial Information
2. Financial assets carried at amortized cost
If any such evidence exists, the insurance subsidiary is required to determine whether an impairment loss should be recognized. The aforementioned evidence is usually as below:
(a) Significant financial difficulty of the issuer/obligor.
(b) Default or breach of contract such as a default or delinquency in interest or principal payments.
(c) Granting of a concession by the lender.
(d) Bankruptcy or financial reorganization of the borrower.
(e) Disappearance of an active market for the assets concerned.
(f) Adverse effects of changes in technological, market, economic or legal environment, in which the issuer operates.
(g) Significant or prolonged decline in the fair value of an investment in the equity instrument.
The management uses estimates based on historical loss experience for assets with credit risk characteristics and objective evidence of impairment similar to those in the portfolio when estimating expected future cash flows. The methodology and assumptions used for estimating both the amount and timing of future cash flows are reviewed regularly in order to decrease the difference between estimated loss and actual loss.
The inherent risks of the impairment evaluation for any financial assets include the following.
(a) The actual result in the market may differ from the expectation,
(b) The event and the condition may change in the future and differ from the original estimations and assumptions, or
(c) The Bank may decide to sell its related assets due to the changes in condition in the future.
4) Fair value of investment property
At the initial recognition, the fair value of investment property was calculated using valuation techniques, including comparative approach and land analysis approach. The changes in the assumptions used in these approaches may have a material impact on the fair value of investment property.
For the details of the assumptions used for the valuation of investment property, please see Note 18.
In addition to the aforementioned policies which may have a material impact on the amounts recognized by the Branch, there are other accounting policies that also involved significant judgment.
1) Income tax
The Bank and its subsidiary need to pay income tax for various countries. When estimating the globe income tax, the Bank its subsidiary relies on significant accounting estimations. Determine the final amount need to go through numerous transactions and calculations. The additional recognition of income tax liability which is related to the tax issue is based on deliberate evaluation of the affection by the issue. The difference between the amount of original estimation and the final amount will affect current income tax and deferred tax.

2016 ANNUAL REPORT
BANK FTAIWAN
109108
2) Payments to defined contribution retirement benefit plans
The present value of retirement benefit obligation is based on several actuarial assumptions (including the decisions made by Financial Supervisory Commission, R.O.C.). Any changes on these assumptions will influence the fair value of the retirement benefit obligations. One of the assumptions used to determine net pension cost (income) is the discount rate. The Bank determined the appropriate discount rate at the end of each year, and used the rate to calculate the present value of future cash flows on estimated payment of retirement benefit obligation. To determine the appropriate discount rate, the Bank should consider the followings: (1) interest rate of high quality corporate bonds or government bonds, (2) the currency used for the corporate bonds or government bonds should be inconsistent with the currency used for retirement benefit payments, (3) and the maturity period should be inconsistent with related pension liability periods.
The pension cost in the consolidated intrim financial statements is calculated and disclosed on a year-to-date base by using actuarially determined assumptions rate at the end of the prior fiscal year. The assumptions are adjusted according to market condition at the end of each fiscal year as necessary.
(6) Cash and Cash Equivalents December 31, 2016 December 31, 2015
Cash on hand $ 12,456,276 12,147,326Foreign currency on hand 11,813,908 9,387,186Notes and checks for clearing 10,860,257 5,039,875Placement with banks 87,268,215 108,848,061Total $ 122,398,656 135,422,448
December 31, 2016 December 31, 2015Cash and cash equivalents in consolidated balance sheets $ 122,398,656 135,422,448Placement with the Central Bank of R.O.C. and other banks that meet the definition of cash and cash equivalents in IAS 7 318,969,155 167,350,034
Securities purchased under agreements to resell that meet the definition of cash and cash equivalents in IAS 7
640,860,011 610,401,013
Total $ 1,082,227,822 913,173,495
(7) Placement with Central Bank and Call Loans to Banks
December 31, 2016 December 31, 2015Call loans to banks $ 220,021,403 154,125,778Less: allowance for doubtful accounts – call loans to banks 45,819 55,427Deposit reserve – account A and account B 104,699,725 85,185,155Deposit reserve – foreign – currency deposits 470,500 576,860Deposits in Central Bank – oversea branches 6,828,487 3,322,191Deposits in Central Bank 355,261,680 342,809,215Total $ 687,235,976 585,963,772
According to the Central Bank of the Republic of China Act and the Banking Act, the deposit reserves are determined monthly at prescribed rates based on the average balances of customers’ New Taiwan Dollar denominated deposits. The account B deposit reserve is subject to withdrawal restrictions, but reserve for account A and foreign currency denominated deposit may be withdrawn anytime and are non-interest earning.
Additionally, as of December 31, 2016, and 2015, 60% of the reserve deposits collected on behalf of a government institution amounting to $4,362,710 thousand and $4,728,694 thousand, respectively, were deposited in the Central Bank and their use is restricted according to the regulations.

109108
Financial Information
(8) Financial Assets Measured at Fair Value through Profit or Loss, Net
1) Financial assets measured at fair value through profit or loss were as follows:
December 31, 2016 December 31, 2015Financial assets held for trading $ 170,712,002 139,878,047Add: valuation adjustment 23,778,698 19,696,183
Subtotal 194,490,700 159,574,230Financial assets designated as fair value through profit or loss 18,004,143 13,334,634Add: valuation adjustment 66,155 96,341
Subtotal 18,070,298 13,430,975Total $ 212,560,998 173,005,205
2) For details of the valuation of financial assets measured at fair value through profit or loss, please see Note 42, “The Fair Value and Fair Value Hierarchy of Financial Instruments”.
3) Details of financial assets held for trading were as follows:
December 31, 2016 December 31, 2015Commercial papers $ 16,139,250 9,993,145Government bonds 183,242 493,311Corporate bonds - 4,244Convertible bonds - 147,549Financial bonds 283,453 9,986Foreign exchange call options 18,619 20,574Structured time deposits - 1,509,129Treasury bills 1,994,714 3,405,242Stocks and beneficates certificates 131,650,783 119,221,097Foreign government bonds 2,218,242 2,077,970Negotiable certificates of deposits 18,223,699 2,995,800Add: valuation adjustment
Non-derivative financial instruments 13,431,275 5,481,777 Foreign exchange call options (3,712) 610 Cross currency swaps 23,610 689,329 Swaps 9,636,979 13,381,103 Interest rate swaps 179,791 38,632 Forward foreign exchange 378,430 86,171 Fixed-rate commercial papers 4,488 11,338 Asset swaps 127,837 6,991 Structured time deposit - 232
Total $ 194,490,700 159,574,230
4) Details of financial assets designated as fair value through profit or loss were as follows:
December 31, 2016 December 31, 2015Foreign government bonds, corporate bonds, financial bonds and others $ 18,004,143 13,334,634
Add: valuation adjustment 66,155 96,341Total $ 18,070,298 13,430,975

2016 ANNUAL REPORT
BANK FTAIWAN
111110
5) Details of unexpired derivative financial instruments (Notional principal amount) were as follows:
December 31, 2016 December 31, 2015Foreign exchange call options $ 2,321,240 3,566,272Swaps 627,115,437 607,461,938Interest rate swaps 16,673,850 17,294,607Foreign exchange forward transactions 12,156,217 12,590,247Fixed-rate commercial paper 415,650 1,500,000Structured time deposit - 1,509,129Asset swaps 2,190,960 3,419,520Cross currency swaps 676,620 6,849,000Total $ 661,549,974 654,190,713
(9) Hedging Derivative Financial Instruments The details of hedging derivatives financial assets were as follows:
December 31, 2016 December 31, 2015Fair value hedges:
Interest rate swap $ 21,221 15,970
The details of hedging derivatives financial liabilities were as follows:
December 31, 2016 December 31, 2015Fair value hedges:
Interest rate swap $ 144,195 243,967
In order to decrease the fair value volatility caused by changes of market interest rate, the Bank uses interest rate swaps and asset swaps for some debt investments with fixed interest rate. In doing so, the risk exposure position will be calculated by floating interest rate and the interest rate risk will be hedge.
Hedged ItemHedging Investments
Designated Hedging Instruments
Fair ValueDecember 31, 2016 December 31, 2015
USD subordinated bonds interest rate swap $ - -USD financial bonds 〞 (18,069) (59,358)USD corporate debts 〞 2,098 (7,780)USD government debts 〞 (107,003) (160,859)
The net loss of hedging instruments in 2016 and 2015 amounted to $(37,095) thousand and $359,402 thousand , respectively. The net gains (losses) of hedged items embedded in hedging instrument in 2016 and 2015 amounted to $(111,645) thousand and $152,609 thousand , respectively.

111110
Financial Information
(10) Bills and Bonds Purchased / Sold under Resell (Repurchase) Agreements The details of bonds and bills purchased / sold under resell (repurchase) agreements were as follows:
December 31, 2016 December 31, 2015Bills and bonds purchased under resell agreements:
Government bonds $ - 50,040
December 31, 2016 December 31, 2015Bills and bonds sold under repurchase agreements:
Commercial papers $ 549,382 139,917Government bonds 10,319,665 16,196,702Treasury bills 468,867 -
Total $ 11,337,914 16,336,619
(11) Receivables, NetDecember 31, 2016 December 31, 2015
Notes receivable $ 2,511 2,076Accounts receivable 1,343,728 903,094Long-term receivables – payment on behalf of the government 17,054,885 21,521,114Accrued revenues 552,483 840,217Interests receivable 12,738,538 16,531,178Premiums receivable 114,028 118,228Acceptance notes receivable 2,494,641 2,095,832Non-recourse factoring 9,414,652 9,973,985Others – replenishment of national treasury 16,910,332 17,738,453Others – undelivered spot exchanges 4,813 698Other – ATM temporary receipts, payments and interbank differences 1,589,410 1,698,101
Others – FX Swaps 49,673 39,637Others 1,159,984 1,927,740
Subtotal 63,429,678 73,390,353Less: allowance for doubtful accounts 118,566 1,317,570Total $ 63,311,112 72,072,783
In accordance with Executive Yuan Tai-79-JEN-Cheng-SZU-tsu No. 14525, and regulations of Retired Civil Servants Lump-sum Retirement Payment and Old-age Benefits and Preferential Interest Deposits which excess preferential interest expenses (recognized as Excess interest expenses of Non-interest income, net) were $8,284,655 thousand and $8,245,628 thousand in 2016 and 2015, respectively, due to executing the government premium savings policy.
As of the year ended December 31, 2016 and 2015, the Bank had paid the following premium savings interest expenses on behalf of the government:
December 31, 2016 December 31, 2015
Long-term receivables $ 17,054,885 21,521,114Short-term advances (booked under other financial assets, net) 48,703,199 51,284,809Total $ 65,758,084 72,805,923

2016 ANNUAL REPORT
BANK FTAIWAN
113112
(12) Loans and Discounts, NetDecember 31, 2016 December 31, 2015
Discounts and export / import negotiations $ 3,872,121 4,562,863Overdrafts 23,276,308 31,083,412Secured overdrafts 475,381 1,310,384Short-term loans 333,038,929 393,047,077Short-term secured loans 107,308,621 106,190,288Accounts receivable financing 235,309 416,348Accounts receivable secured financing 5,201 5,733Medium-term loans 550,638,619 615,794,231Medium-term secured loans 245,968,781 257,747,275Long-term loans 176,933,311 174,758,213Long-term secured loans 860,547,639 825,160,313Non-performing loans 4,749,071 4,408,128
Subtotal 2,307,049,291 2,414,484,265Less: allowance for doubtful accounts 32,812,787 27,885,470Total $ 2,274,236,504 2,386,598,795
The movements of allowance for doubtful accounts of loans and receivables were as follows:
2016 2015Loans:
Beginning balance $ 27,885,470 26,064,270Allowance for doubtful accounts 5,166,718 4,382,804Write-off (2,634,547) (4,046,220)Recovery from written-off 2,402,036 1,427,952Effects of exchange rate changes and others (6,890) 56,664Ending balance $ 32,812,787 27,885,470
Receivables (including other financial assets and so on):Beginning balance $ 1,444,475 370,178Reversal of doubtful accounts 64,228 47,809Write-off (note) (1,185,753) (13,400)Recovery from written-off 13,543 15,295Effects of exchange rate changes and others (34,775) 1,024,593Ending balance $ 301,718 1,444,475
Total $ 33,114,505 29,329,945
Note: The bond-badced security 2007-1 No.B-1 issued by E. SUN Bank and held by the Bank amounting to $995,505 was overdue and confirmed defaulted in 2016. The write-off was approved by the board of directors of Bank of Taiwan on February 26, 2016.
Details of allowance for doubtful accounts were as follows:
December 31, 2016 December 31, 2015Call loans to banks $ 45,819 55,427Receivables 118,566 1,317,570Loans and discounts 32,812,787 27,885,470Other financial assets 137,333 71,478Total $ 33,114,505 29,329,945

113112
Financial Information
Details of bad debt expenses and reserves for guarantee liabilities were as follows:
2016 2015
Bad debts $ 5,230,946 4,430,613Reserves for guarantee liabilities (47,210) (26,145)Total $ 5,183,736 4,404,468
As of December 31, 2016 and 2015, the amounts of loans and receivables on which the interests stopped to accrue were $4,872,177 thousand and $4,456,007 thousand, respectively, which were booked under loans and discounts – non-performing loans and other financial assets-overdue receivables. As of December 31, 2016 and 2015, the non accrued interests were $337,301 thousand and $343,454 thousand, respectively.
For the date as above, the Bank did not write off any loan without legal proceedings having been initiated.
(13) Available-for-sale Financial Assets, NetDecember 31, 2016 December 31, 2015
Negotiable certificates of deposits $ 847,664,916 888,310,000Government bonds 37,693,244 35,653,007Foreign government bonds, corporate bonds, financial bonds and negotiable certificates of deposits 63,532,948 48,414,914
Financial bonds 9,227,850 514,684Corporate bonds 27,038,343 31,081,473Financial asset securitization investments 500,000 -TSEC and OTC stocks and certificates 28,923,413 30,262,708Add: Adjustment valuation 23,260,625 19,361,924Total $ 1,037,841,339 1,053,598,710
Please see Note 43, “The Fair Value and Fair Value Hierarchy of the Financial Instruments”, for valuation of available-for-sale financial assets.
(14) Held-to-maturity Financial Assets, Net December 31, 2016 December 31, 2015
Domestic:Financial bonds $ 16,579,124 14,058,173Corporate bonds 7,492,435 8,826,249Negotiable certificates of deposits 2,605,284 2,503,296Commercial papers 9,494,908 18,132,757Government bonds 67,013,737 34,369,330
103,185,488 77,889,805Foreign:
Corporate bonds and financial institution bonds 23,841,818 24,727,265Financial bonds 6,923,772 8,211,845Negotiable certificates of deposits 1,543,860 1,600,170Treasury bills 1,225,639 1,357,306Government bonds 2,091,751 -
35,626,840 35,896,586Total $ 138,812,328 113,786,391

2016 ANNUAL REPORT
BANK FTAIWAN
115114
(15) Investments Accounted for Using Equity Method – Net
AssociatesDecember 31, 2016 December 31, 2015
Amount Percentage of Ownership (%) Amount Percentage of
Ownership (%)Hua Nan Financial Holdings Co., Ltd. $ 33,751,821 21.23 32,496,294 21.23Kaohsiung Ammonium Sulfate Co., Ltd. - - 2,158,300 91.86Tang Eng Iron Works Co., Ltd. 1,284,061 21.37 1,181,719 21.37Tai Yi Real Estate Management Co., Ltd. 19,642 30.00 19,509 30.00
$ 35,055,524 35,855,822
1) The Bank and its subsidiary use equity method for investments in associates and the other comprehensive income:
2016 2015Hua Nan Financial Holdings Co., Ltd. $ (410,128) 176,637Taiwan Life Insurance Co., Ltd. - 927,861Tang Eng Iron Works Co., Ltd. (5,223) 2,875Total $ (415,351) 1,107,373
2) The Bank and its subsidiary use equity method for investments in associates, and Investment gains and losses recognized in the following table:
2016 2015Hua Nan Financial Holdings Co., Ltd. $ 2,990,692 2,989,380Taiwan Life Insurance Co., Ltd - 1,349,270Kaohsiung Ammonium Sulfate Co., Ltd. 13,312,318 (35,452)Tang Eng Iron Works Co., Ltd. 107,566 (198,839)Tai Yi Real Estate Co., Ltd. 3,344 3,411Total $ 16,413,920 4,107,770
3) Individually significant associate(s)
The Bank acquired up to 21.23% voting rights of outstanding shares of Hua Nan Financial Co., Ltd. on December 27, 2011, from which, its significant the influence has commenced. Hence, the investment has been accounted for using the equity method. Related information was as follows:
Associate(s) The relationship with the Bank
Principal operating place/registration
country
The percentage of shareholding interests and voting rights
December 31, 2016 December 31, 2015
Hua Nan Financial Holdings Co., Ltd.
Enterprises permitted to invest Financial Holding Company Act, such as banks and bill finance companies
Taiwan 21.23% 21.23%
The fair value of the equity accounting for listed companies (major associates) is as follows:
December 31, 2016 December 31, 2015Hua Nan Financial Holdings Co., Ltd. $ 36,296,532 32,074,293

115114
Financial Information
1. Summarized Financial Information
December 31, 2016 December 31, 2015Total Assets $ 2,545,941,962 2,350,288,574Total Liabilities (2,386,958,692) (2,197,219,247)Net Assets $ 158,983,270 153,069,327Attributable to the Bank $ 33,751,821 32,496,294
2016 2015Net income $ 14,086,800 14,080,661Other comprehensive income 1,931,831 831,014Total comprehensive income $ 16,018,631 14,911,675Attributable to the Bank
Investment income $ 2,990,692 2,989,380Other comprehensive income (410,128) 176,637
2. There are no significant restrictions on the ability of Hua Nan Financial Holding Co., Ltd. to transfer funds to its investors by distributing dividends, or repaying loans or advances.
3. The summarized financial information of Hua Nan Financial Holding Co., Ltd. has been adjusted to align its accounting results with those of the Bank accounted for using the equity method.
4. Hua Nan Financial Holdings Co.,Ltd.’s financial statements were audited by other auditors. The related investment gains were $2,990,692 thousand and $2,989,380 thousand in 2016 and 2015, respectively.
4) All other non-individually-significant associates
1. Summarized Financial Information – Attributable to the Bank
December 31, 2016 December 31, 2015Investment in non-individually-significant associates in aggregate $ 1,303,703 3,359,528
2016 2015Investment income $ 13,423,228 1,118,390
2. Some of the associates accounted for using the equity method were not audited by auditors. The related investment losses of such associates were $(35,452) thousand in 2015, respectively.
3. Kaohsiung Ammonium Sulfate Co., Ltd., one of the associates of the Bank under the equity method, resolved to liquidate and dissolve on January 15, 2016. The shareholders’ meetings of Kaohsiung Ammonium Sulfate Co., Ltd. held on February 4 2016 then resolved to distribute the surplus based on shareholding equity ratio. The Bank received an allocation of the surplus, including $232,412 thousand in cash and $15,238,207 thousand worth of lands (recognized as investment property) whose value was evaluated by independent appraisers. The Bank also recognized a gain amounting to $13,312,318 thousand.
4. Taiwan Life Insurance Co., Ltd. agreed to be acquired as a subsidiary of CTBC Financial Holding Co., Ltd. (’CTBC’) through swapping shares and both of these two companies have obtained approval from their boards of directors for the deal on June 29, 2015. Under the agreement, the baseline date was set on October 15, 2015, and every 1 equity share of Taiwan Life Insurance Co., Ltd. can be exchanged for 1.6129 equity shares of CTBC.

2016 ANNUAL REPORT
BANK FTAIWAN
117116
On the baseline date, the Bank held 172,012 thousand shares of Taiwan Life Insurance Co., Ltd. and could be exchanged for 277,437 thousands of CTBC. After the exchange, the shareholding of the Bank dropped to 1.54%, which makes Taiwan Life Insurance Co., Ltd. no longer an associate accounted for using the equity method of the Bank due to lack of significant influence.
5) Collateral
No investment in associates was used as collateral on December 31, 2016.
(16) Other Financial Assets, NetDecember 31, 2016 December 31, 2015
Short-term advances $ 52,253,321 54,833,878Less: allowance for doubtful accounts – short-term advances (32,088) (34,816)Debt investments without quoted price in active markets 15,732,665 5,406,715Financial assets carried at cost 8,596,825 8,596,825Less: cumulative impairment – financial assets carried at cost (15,000) (15,000)Remittances purchased 5,765 7,739Less: allowance for doubtful accounts – remittances purchased (58) (77)Overdue receivables 123,106 47,879Less: allowance for doubtful accounts – overdue receivables (105,187) (36,585)Others 19,445 84,913Total $ 76,578,794 68,891,471
1) Please see Note 43, “The Fair Value and Fair Value Hierarchy of the Financial Instruments”, for details of the valuation of hedging derivative financial assets and debt investments without quoted price in active markets for December 31, 2016, and 2015.
2) Concerning for the payment of excess preferential interest on behalf of the government, booked under “short-term advances” for December 31, 2016, and 2015, please refer to Note 11 for further information.
3) The Bank held 250 million shares of Taiwan High Speed Rail Corporation of convertible preferred stocks with the par value of $10. The Bank recognized the 2.5 billion investment as financial assets carried at cost. The investee announced to redeemed the preferred stocks at par value on July 6, 2015 and the Bank received the full payment on August 7, 2015.

117116
Financial Information
(17) Property and Equipment, NetChanges in the cost, depreciation, and impairment of the properties and equipments of the Bank and its subsidiary for the year ended 2016 and 2015 were as follows:
Land and Land improvements Buildings
Machineries and
equipments
Transport equipments
Miscellaneous equipments
Leasehold improvements
Constructions in progress and prepayments for
equipments
Total
Cost:
Balance at January 1, 2016 $ 86,292,163 14,558,694 6,475,669 1,039,062 985,219 740,760 474,409 110,565,976Additions - 14,269 389,974 28,847 28,761 12,479 282,960 757,290Disposals - (11,800) (371,920) (46,538) (35,571) (52) - (465,881)Reclassification - 43,481 22,628 35,668 990 32,789 (135,679) (123)Effect of change in exchange rates - - (927) (435) (447) (2,117) - (3,926)Balance at December 31, 2016 $ 86,292,163 14,604,644 6,515,424 1,056,604 978,952 783,859 621,690 110,853,336Balance at January 1, 2015 $ 86,467,228 14,682,751 6,487,743 1,057,539 997,682 686,282 310,926 110,690,151Additions - 7,682 298,099 38,520 29,223 36,931 265,658 676,113Disposals (175,065) (137,334) (384,948) (61,365) (42,739) - - (801,451)Reclassification - 5,595 75,491 4,799 805 15,165 (102,175) (320)Effect of change in exchange rates - - (716) (431) 248 2,382 - 1,483Balance at December 31, 2015 $ 86,292,163 14,558,694 6,475,669 1,039,062 985,219 740,760 474,409 110,565,976
Accumulated depreciation:
Balance at January 1, 2016 $ 14,423 6,463,402 4,965,817 865,746 803,713 646,058 - 13,759,159Depreciation 362 270,677 408,870 41,167 32,746 35,638 - 789,460Disposal - (11,794) (345,003) (45,102) (32,437) (52) - (434,388)Reclassification - - 98 - - (93) - 5Effect of change in exchange rates - - (396) (218) (326) (1,222) - (2,162)Balance at December 31, 2016 $ 14,785 6,722,285 5,029,386 861,593 803,696 680,329 - 14,112,074Balance at January 1, 2015 $ 14,061 6,257,656 4,909,023 884,676 808,157 616,874 - 13,490,447Depreciation 362 277,593 416,937 41,826 34,408 27,239 - 798,365Disposal - (71,847) (359,518) (60,397) (38,913) - - (530,675)Effect of change in exchange rates - - (625) (359) 61 1,945 - 1,022Balance at December 31, 2015 $ 14,423 6,463,402 4,965,817 865,746 803,713 646,058 - 13,759,159
Accumulated impairment:
Balance at January 1, 2016 $ 73,596 - - - - - - 73,596Reversal of impairment loss (27,659) - - - - - - (27,659)Balance at December 31, 2016 $ 45,937 - - - - - - 45,937Balance at January 1, 2015 90,919 - - - - - - 90,919Reversal of impairment loss (17,323) - - - - - - (17,323)Balance at December 31, 2016 $ 73,596 - - - - - - 73,596
Carrying amounts:
December 31, 2016 $ 86,231,441 7,882,359 1,486,038 195,011 175,256 103,530 621,690 96,695,325January 1, 2015 $ 86,362,248 8,425,095 1,578,720 172,863 189,525 69,408 310,926 97,108,785December 31, 2015 $ 86,204,144 8,095,292 1,509,852 173,316 181,506 94,702 474,409 96,733,221
The Bank and its subsidiary conducted revaluations of land and buildings for many times over the past years, and the latest time was in December, 2011. As of December 31, 2016, and 2015, the total revaluation increments for land were $81,739,784, both . The total revaluation increments for Buildings were $34,307, both.
As of December 31, 2016, the Bank and its subsidiary’s properties and equipments neither served as guarantees or collaterals, nor they were pledged.

2016 ANNUAL REPORT
BANK FTAIWAN
119118
(18) Investment property
1) Changes in investment property of the Bank for the year ended 2016 were as follows:
LandCost:
Balance at January 1, 2016 $ -Additions 15,238,207Balance at December 31, 2016 $ 15,238,207
Carrying amounts:December 31, 2016 $ 15,238,207
The fair value of investment properties (as measured or disclosed in the financial statements) was based on a valuation by a qualified independent appraiser who has recent valuation experience in the location and category of the investment property being valued when obtained. The inputs of levels of fair value hierarchy in determining the fair value is classified to Level 3.
As noted in Note 15, Kaohsiung Ammonium Sulfate Co., Ltd. distributed its several pieces of land to the Bank as surplus to the Bank after its dissolution and liquidation. The appraisers engaged by the bank determined to use the comparison approach and the land development analysis approach for the land in commercial-use areas by reviewing it accurately and analyzing the general factors, area factors, specific factors, market situations of real estate and its highest and best use, as well as their professional judgment. In addition, as the land reserved for roads is public service facilities and qualified to be conducted through transfer of floor area rights based on the appraisers’ survey, the market value usually ranges within 30% to 35% of the average current value of the neighboring non-public facility land announced by the government during the fiscal year. Therefore, the appraisers use 30% as one of the major assumptions for the price of land for roads. The relevant contract information and key assumptions are as follows:
Rate of return 19%Overall capitalization rate 4.31%Appraised by external independent appraiser or self-appraisal External independent appraiserAppraiser office(s) Honda Real estate appraiser firmAppraiser name(s) Hsiang-Ming NiehAppraisal date 104/12/03
Fair value by external independent appraiser(s) $16,588,863 thousand ($15,238,207 thousand recognized by the Bank according to its shareholding equity percentage)
The Bank’s plan for the development land includes determining the scope of the land to be developed, estimating the duration of development, surveying and analyzing costs, obtaining current market prices, conducting on-site surveys, and investigating and analyzing the degree of development in the local environment. There was no significant fluctuation revealed after the assessment on macroeconomic factors, i.e., market indexes, population, employment rate, market prices and rates, market equilibrium, and other relevant market factors; hence, these data were used for estimating the total selling price after development or construction, and this expected selling price was used as a basis in determining the price prior to development and construction.

119118
Financial Information
The following table shows the valuation technique used in measuring the fair value of investment property, as well as the significant unobservable inputs used.
Valuation technique Significant unobservable inputs
Inter-relationship between key unobservable inputs and fair value
measurementThe management evaluates and measures the effect of using different assumptions comparison approach or land development analysis approach. After the assessement, the Bank determines the estimation used, align with other market participants.
・The rate of return・Overall capitalization rate
The estimated fair value would increase (decrease) if:・the rate of return were lower
(higher); or・the overall capitalization rate were
lower (higher).
2) The fair value of investment property of the Bank and its subsidiary was follows:
December 31, 2016The fair value of investment property $ 16,367,959
The investment property was subsequently measured at cost, and the fair value was used as the recoverable amount for impairment testing. The fair value of investment property was evaluated by using comparison approach and land development analysis approach, and the recent market transaction prices are also taken into consideration. The valuation technique is consistent with the technique used for initial acquisition. After evaluation, the Bank did not recognized impairment loss.
3) As of December 31, 2016 the Bank did not provide any investment property as collaterals for its loans.
(19) Intangible AssetsChanges in costs, amortization, and impairment loss of the intangible assets of the Bank and its subsidiary for the year ended 2016 and 2015 were as follows:
Computer softwareCosts:
Balance at January 1, 2016 $ 2,915,290Additions 309,966Balance at December 31, 2016 $ 3,225,256Balance at January 1, 2015 $ 2,645,653Additions 269,637Balance at December 31, 2015 $ 2,915,290
Amortization:Balance at January 1, 2016 $ 2,061,344Amortization for the year 360,687Balance at December 31, 2016 $ 2,422,031Balance at January 1, 2015 $ 1,704,236Amortization for the year 357,108Balance at December 31, 2015 $ 2,061,344
Carrying amounts:December 31, 2016 $ 803,225January 1, 2015 $ 941,417December 31, 2015 $ 853,946

2016 ANNUAL REPORT
BANK FTAIWAN
121120
(20) Other AssetsDecember 31, 2016 December 31, 2015
Foreclosed collaterals and residuals taken over, net $ 1,076,959 1,076,959Advance payments 5,715,024 5,436,620Operating guarantee deposits and settlement funds 10,000 10,000Refundable deposits 453,565 303,059Temporary Payments and Suspense Accounts 326,578 247,191Inventories 1,163,603 746,112Others 233 383Total $ 8,745,962 7,820,324
1) Foreclosed collaterals and residuals taken over, net
December 31, 2016 December 31, 2015Foreclosed collaterals and residuals taken over $ 1,076,959 1,076,959
2) Advance payments
December 31, 2016 December 31, 2015Prepaid expenses $ 295,774 341,775Prepaid interests 5,434 11,871Business tax paid 170 -Business tax carry forward 699 775Other prepayments 5,412,947 5,082,199Total $ 5,715,024 5,436,620
3) Inventories
December 31, 2016 December 31, 2015Inventories $ 1,163,603 749,542Less: allowance for inventory valuation - 3,430Total $ 1,163,603 746,112
The effects on the cost of goods sold derived from the inventory write-off or reversal for the year ended 2016 and 2015 were as follows:
2016 2015Net sales gain $ 3,430 13,942

121120
Financial Information
(21) Impairment For the year ended 2016 and 2015, the movements of the accumulated impairment were as follows:
2016 2015Beginning balance $ 88,596 1,260,036Reversal of impairment losses for the current period (27,659) (17,323)Reclassification of allowance for bad debts - (1,158,875)Effect of foreign exchange rate changes - 4,758Ending balance $ 60,937 88,596
Note: It was mainly because the financial bonds and the beneficiary certificates of financial asset securitization had reached their maturity, and hence, were reclassified to accounts receivable – other receivables, as well as the accumulated impairment were all reclassified to allowance for doubtful accounts – other receivables.
Details of accumulated impairment were as follows:
December 31, 2016 December 31, 2015Other financial assets $ 15,000 15,000Property and Equipment 45,937 73,596Total $ 60,937 88,596
(22) Deposits of Central Bank and other banksDecember 31, 2016 December 31, 2015
Deposits from Central Bank $ 11,350,048 10,108,456Deposits from banks – others 49,661,259 43,422,012Postal deposits transferred 1,001,178 1,213,859Bank overdrafts 778,312 787,631Call loans from bank 164,806,017 169,893,559Total $ 227,596,814 225,425,517
(23) Financial Liabilities Measured at Fair Value through Profit or Loss
1) Details of financial liabilities measured at fair value through profit or loss were as follows:
December 31, 2016 December 31, 2015Financial liabilities held for trading $ 26,798 33,763Add: valuation adjustment 6,682,265 5,915,308
Subtotal 6,709,063 5,949,071Financial liabilities designated as fair value through profit or loss - 33,537,600Add: valuation adjustment - (262,196)
Subtotal - 33,275,404Total $ 6,709,063 39,224,475
2) For valuation of financial liabilities measured at fair value through profit or loss, please refer to Note 43 “The Fair Value and Fair Value Hierarchy of the Financial Instruments”.

2016 ANNUAL REPORT
BANK FTAIWAN
123122
3) Financial liabilities held for trading
December 31, 2016 December 31, 2015Foreign exchange options premium $ 25,709 33,763Commodities options 1,089 -Add: valuation adjustment
Foreign exchange options premium (8,409) 2,419Swaps 5,895,391 5,076,386Interest rate swaps 173,441 128,911Forward foreign exchanges 269,986 409,278Asset swaps 104,798 227,492Cross currency swaps 247,210 70,822Commodity options (152) -
Total $ 6,709,063 5,949,071
4) The details of the financial liabilities designated as fair value through profit or loss were as follows:
December 31, 2016 December 31, 2015Financial bonds $ - 33,537,600Add: valuation adjustment - (262,196)Total $ - 33,275,404
The Bank has been approved by the FSC to issue USD $1.5 billion of 2014-2 Senior Unsecured Financial Bonds, denominated in U.S. dollar, within one year starting October 23, 2014. The authorized, but not publicly offered and issued, amount of USD $0.48 billion had expired automatically on October 23, 2015.
The details of the financial bonds were as follow:
Name of bond
Conditions Bond
Beginning date Maturity date Coupon
rate Face value TypeAmount
December 31, 2016
December 31, 2015
2014-2 Senior unsecured financial bonds – A 2014/11/26 2034/11/26 0% USD $100
million
Senior unsecured financial bond
$ - 3,288,000
2014-2 Senior unsecured financial bonds – B 2014/11/26 2044/11/26 0% USD $480
million
Senior unsecured financial bond
- 15,782,400
2014-2 Senior unsecured financial bonds – C 2014/12/01 2044/12/01 0% USD $440
million
Senior unsecured financial bond
- 14,467,200
Valuation adjustment - (262,196)
$ - 33,275,404
The Bank has embedded call options to the above bonds. The call options can be exercised within 2 years after the issuing date. If the call options are not exercised prior to the bonds maturity date, the Bank will pay the principal and interests accrued in full upon maturity. The Bank exercised the call options to buy back all its financial bonds on November 28 and December 1, 2016.

123122
Financial Information
5) Unmatured derivative financial instruments (stated at notional amount)
December 31, 2016 December 31, 2015Foreign exchange options premium $ 3,163,326 3,799,753Swaps 431,236,970 461,169,732Interest rate swaps 16,436,661 9,905,676Forward foreign exchanges 15,088,510 16,559,297Asset swaps 1,288,800 32,207,933Cross currency swaps 2,609,820 1,972,800Commodity options 160,552 -Total $ 469,984,639 525,615,191
(24) PayablesDecember 31, 2016 December 31, 2015
Accounts payables $ 11,882,206 5,921,084Receipts under custody 956,166 1,201,376Accrued expenses 2,524,004 2,536,880Other tax payables 457,330 539,603Interests payables 11,447,177 12,922,565Banker’s acceptances payables 2,508,820 2,143,698Payables to representative organizations 626,716 440,521Construction payables 15,204 14,244Accounts payables – non-recourse factoring 347,180 316,680Other payables – undelivered spot exchange 535 47Other payables – collection bills 1,271,059 2,319,808Other payables – payments awaiting transfer 6,471,553 5,783,459Other payables – ATM temporary receipts, payments and inter branch differences 1,753,455 1,722,094
Other payables – foreign exchange awaiting transfer 556,826 500,296Other payables – amounts awaiting settlement 71,915 5,209,211Other payables – overdue accounts 164,970 168,143Other payables – checking accounts 122,373 122,753Other payables – collection 29,931 81,425Other payables – others 306,025 273,232Total $ 41,513,445 42,217,119

2016 ANNUAL REPORT
BANK FTAIWAN
125124
(25) Deposits and RemittancesDecember 31, 2016 December 31, 2015
Cheques deposits $ 36,130,549 32,920,985Government deposits 258,655,614 247,463,233Demand deposits 393,816,788 385,667,170Time deposits 616,587,574 661,801,152Remittances 676,407 587,182Savings account deposits:
Demand savings deposits 835,507,981 807,918,761Staff accounts 24,761,970 24,230,401Club saving deposits 918,514 1,009,183Non-drawing time savings deposits 382,729,099 346,590,130Interest withdrawal on principal deposited 860,048,514 865,905,386Preferential Interest deposits 464,149,754 463,426,833
Total $ 3,873,982,764 3,837,520,416
(26) Financial Bonds Payable
Name of bond
Condition Bond
Beginning date
Maturity date Interest rate Type
AmountDecember 31,
2016December 31,
2015
2013-1 TWD subordinated unsecured financial bonds
2013/12/2 2023/12/2
The Bank listed annual fixed deposit interest rate of time deposits plus 0.15%.
Subordinated unsecured financial bond
$ 16,000,000 16,000,000
2014-1 TWD subordinated unsecured financial bonds – A
2014/06/25 2024/06/25 TAIBOR 3M plus 0.30%
Subordinated unsecured financial bond
5,500,000 5,500,000
2014-1 TWD subordinated unsecured financial bonds – B
2014/06/27 2024/06/27 1.70%Subordinated unsecured financial bond
2,000,000 2,000,000
2014-1 TWD subordinated unsecured financial bonds – C
2014/06/27 2024/06/27Subordinated unsecured financial bond
1,500,000 1,500,000
unamortized discount amount (1,918) (2,174)
Total $ 24,998,082 24,997,826
(27) Other Financial LiabilitiesDecember 31, 2016 December 31, 2015
Appropriated loan funds $ 52,626 64,900Principal from structured products 696,229 1,720,530
$ 748,855 1,785,430

125124
Financial Information
(28) ProvisionDecember 31, 2016 December 31, 2015
Employee benefit obligations $ 17,455,332 17,082,412Guarantee reserve 1,071,798 1,119,204Reserve for government employees insurance 264,840,836 245,997,636Total $ 283,367,966 264,199,252
(29) Provisions- Employee benefits December 31, 2016 December 31, 2015
Recognized in Consolidated Balance Sheet:Defined benefit plan $ 9,472,702 9,025,034Employees preferential interest 7,982,630 8,057,378
Total $ 17,455,332 17,082,412
1) Defined contribution plans
The Bank and its subsidiary have established the defined contributions plans in accordance with the provision of the Labor Pension Act since July 1, 2005. The Bank and its subsidiary allocate 6% of each employee’s monthly wages to his or her individual account of labor pension from which he or she is entitled to claim the principal and accrued dividends in fixed installments or in lump sum in the future. The pension costs recognized under the defined contribution plans were $1,714 thousand and $1,467 thousand for the years ended December 31, 2016 and 2015, respectively.
2) Defined benefit plans
The Bank and its subsidiary have established the defined contributions plans in accordance with the provision of the Labor Standards Act, including the service periods of all the regular employees before the Labor Pension Act was adopted on July 1, 2005 and the service periods of regular employees electing to continue to apply the Labor Standards Act after July 1, 2005.
The payment of pension to an employee who is qualified for retirement is based on his or her years of service and 6-month average wages before retirement. Two bases are given for each full year of service until the service period is longer than 15 years. Those having served over 15 years are given one base for each full year of service, and the total number of bases shall be no more than 45.
The Bank and its subsidiary allocate 8% of all the qualified employees’ gross wages to the labor pension account in the name of Labor Pension Supervision Committee in the Bank’s Trust Department. The portfolio of this account is built up carefully with diversified investments and strengthened risk management and will adjust timely to stabilize income when the market changes. The portfolio is also regularly supervised and reviewed by the Ministry of Labor. Please refer to the website of the Ministry of Labor for information on the portfolio, such as fair value or percentages of assets.
The Bank and its subsidiary have established the criteria for the payment to retired employees pursuant to the interpretations made by the Executive Yuan (Tai-Ren-Jen-Cheng-Szu-Tsu No. 6378, Tai-Ren-Jen-Cheng Ji-Tsu No. 211191, Chu-Ji-Tsu No. 210226 and Chu-Ji-Tsu No. 211434), Examination Yuan (Kao-Tai-Mi-Yi No 3271 ‘Regulations for Taking Care of the Family of Deceased Civil Servant’ and Kao-Tai-Tzu-Er-Er-Tsu No.10400039491 ‘Regulations for Taking care of the Retired Civil Servant Claiming Lump-Sum Pensions before December 31, 1979’ ) and the Ministry of Finance (Tai-Tsai-Ren No. 0890850993).

2016 ANNUAL REPORT
BANK FTAIWAN
127126
Every Spring Festival, Dragon Boat Festival, and Mid-Autumn Festival, the Bank and its subsidiary are obligated to grant two thousand to each of those who are at the age of 60 or older, those who are at the age of 55 but have already served the Bank for 25 years, and those who are retired due to incapacity. In accordance with the interpretation made by Executive Yuan (Yuan-Shou-Ren-Ji-Kuei-Tsu No. 1050053161) on September 8, 2016, the regulations on the three festival employee care bonus of “The Matter of Taking Care of the Retired Civil” were revised, and therefore, the three festival employee care bonus will not be issued starting January 1, 2017.
The Bank and its subsidiary are obliged to grant $18 thousand to those who retired before December 31, 1979 and claim pensions at one time every Spring Festival, Dragon Boat Festival and Mid-Autumn Festival. The amount will be raised to $31 thousand if there are dependents.
The balances of pension account were $1,160,343 thousand and $1,161,502 thousand as of December 31, 2016 and 2015, respectively. Bank and its subsidiaries expect to contribute $786,111 thousand to the account within one year after the balance date.
Weighted average duration of the defined contribution plans were as follows:
Defined Benefit Plans 11.80 yearEmployee care bonuses during the three Chinese festivals 11.80 year
1. The reconciliation of recognized liabilities for the defined benefit obligations , present value of the defined benefit obligations, fair value of the plan assets, and the limit of assets adjustment are as follows:
December 31, 2016 December 31, 2015Present value of the defined benefit obligations $ 16,800,503 16,181,900Less: fair value of the plan assets (7,327,801) (7,156,866)
9,472,702 9,025,034Limit of assets adjustment - -Recognized liabilities for the defined benefit obligations $ 9,472,702 9,025,034
2. The movements in present value of the defined benefit obligations
2016 2015Defined benefit obligation at January 1 $ 16,181,900 15,294,824Current service costs 646,800 577,059Interest expense 306,955 330,368Remeasurements of the defined benefit plans of other Comprehensive Income
– Changes in actuarial gains and losses in financial assumptions 665,655 353,840– Experience adjustments 20,586 316,057
Past service credit (235,859) -Benefit payments (785,534) (690,248)Defined benefit obligation at December 31 $ 16,800,503 16,181,900

127126
Financial Information
3. The movements of fair value of defined benefit plan assets
2016 2015Fair value of plan assets at January 1 $ 7,156,866 6,910,165Interest revenue 138,166 149,260Remeasurements of defined benefit plans of other comprehensive income
– Return on plan assets (58,140) (34,759)Contribution made by the Bank 782,816 735,326Benefit payments (691,907) (603,126)Fair value of plan assets at December 31 $ 7,327,801 7,156,866
4. Expense recognized in profit or loss
2016 2015Current service cost $ 646,800 577,059Net interest of defined benefit obligations 168,789 181,108Past service credit (235,859) -Total $ 579,730 758,167
5. Re-measurement of net defined benefit liability (asset) recognized in other comprehensive income
The Bank and its subsidiary re-measurement of the net defined benefit liability (asset) recognized in other comprehensive income for the years ended December 31, 2016 and 2015, was as follows:
2016 2015Accumulated amount at January 1 $ (1,806,410) (1,101,754)Recognized during the period (744,381) (704,656)Accumulated amount at December 31 $ (2,550,791) (1,806,410)
6. Portfolio analysis of plan asset
2016 2015Bonds instruments $ 750,000 -Others 6,577,801 7,156,865Total $ 7,327,801 7,156,865
The overall expected rate of return on assets is based on the historical trend of returns and the estimation of return on the portfolio as a whole. The Bank also refers to the return of the funds supervised by the Labor Pension Supervision Committee and then uses judgments and estimations to determine the rate which should not be lower than the two-year time deposits rate set by the local banks.
7. Actuarial assumptions
December 31, 2016 December 31, 2015Discount rate 1.40% 1.96%Assets expected rate of return 1.40% 1.96%Future of salary increases 1.75% 2.00%
The estimated future mortality rate used in calculating of the defined benefit plan of The Bank and its subsidiary is based on the fifth round of the Taiwan Life Experience Life Table.

2016 ANNUAL REPORT
BANK FTAIWAN
129128
8. Sensitivity analysis
The followings would be the impacts on the present value of defined benefit obligations as of December 31, 2016 and 2015 if the actuarial assumptions had changed:
Impact on the defined benefit obligationIncrease 0.25% Decrease 0.25%
December 31, 2016Present value
Pension plans (changes in 0.25%) $ 16,279,269 17,275,283Three festival employee care bonus (changes in 0.25%) 8,155 8,430
December 31, 2015Present value
Pension plans (changes in 0.25%) 15,507,519 16,398,659Three festival employee care bonus (changes in 0.25%) 234,021 243,678
The aforementioned sentivitiy analysis is used to analyze what the impact could be when one variable changes while all other variables remain constant. In practice, however, this hypothesis may not exist as changes in variables could be correlative. Projected unit benefit method is also utilized in calculating the changes in present value of the defined benefit obligations when the Bank conducts the sentivitiy analysis.
Methods and variables used in preparing the sensitivity analysis are consistent with those of the previous period.
3) Employee preferential interest plan
In accordance with Tai-Cha-Ku-Tzu No.09601013320 ’ The Improvement program of Preferential Deposits of Employees of State-owned banks’, the Bank is obligated to pay preferential interests generated from a fixed amount of deposit to each retired and in-service employee.
The subsidiary, BankTaiwan Insurance Broker Co., Ltd., is also obligated to pay preferential interests generated from a fixed amount of deposit to each retired and in-service employee in accordance with Tai-Cha-Ku-Tzu No.10103675500 and the agreement between the Bank and its subsidiary.
1. The reconciliation of recognized liabilities for employee preferential interest plan, fair value of the plan, and limit of assets adjustment are as follows:
December 31, 2016 December 31, 2015Fair value of the Employees preferential interest plan $ 7,982,630 8,057,378Limit of assets adjustment - -Recognized liabilities for the defined benefit obligations $ 7,982,630 8,057,378
2. The movements of present value of employees preferential interest plan
2016 2015 Present value of employees preferential interest plan at January 1 $ 8,057,378 7,746,881Interest expense 238,186 309,875Remeasurement of net employees preferential depositBenefit payments 1,697,952 1,941,714Benefit paid by the plan (2,055,886) (1,941,092)Present value of employees preferential interest plan at December 31 $ 7,937,630 8,057,378

129128
Financial Information
3. Expense recognized in profit or loss
2016 2015Net interest of employees preferential deposit $ 283,186 309,875Prior service costs and settlement of losses 1,697,952 1,941,714Total (booked under employee benefits expense, Note 38) $ 1,981,138 2,251,589
4. Actuarial assumptions
2016 2015Discount rates of the employee preferential interest 4.00% 4.00%Return on deposit 2.00% 2.00%Pension preferential ratios deposit for withdrawal 1.00% 1.00%The probability of changes in the policy of employee preferential interest plan 50.00% 50.00%
Rate of same type deposit offered to general customers 1.165% 1.375%
5. Sensitivity analysis
The followings would be the impacts on the present value of defined benefit obligations as of December 31, 2016 and 2015 if the actuarial assumptions had changed:
Impact on the defined benefit obligationIncrease 0.25% Decrease 0.25%
December 31, 2016Present rate (Changes in 0.25%) $ 7,832,679 8,137,942December 31, 2015Present rate (Changes in 0.25%) 7,901,375 8,219,168
The aforementioned sentivitiy analysis is used to analyze what the impact could be when one variable changes, while all other variables remaind constant. In practice, however, this hypothesis may not exist as changes in variables could be correlative. Projected unit benefit method is also utilized in calculating the changes in present value of the defined benefit obligations when the Bank conducts the sentivitiy analysis.
The methods and variable used in preparing the sensitivity analysis are consistent with those of the previous period.
6. Future cash flow of Employees preferential interest plan
The Bank and its subsidiary monitor and review the contributions to employee preferential interest plan annually to ensure the ability of payments. Within one year after the financial statement date, the Bank and its subsidiary expect to contribute $1,972,476 thousand to the plan.

2016 ANNUAL REPORT
BANK FTAIWAN
131130
(30) Other LiabilitiesDecember 31, 2016 December 31, 2015
Advance collections $ 2,097,900 2,373,421Guarantee deposits received 2,866,927 3,276,005Temporary receipt and suspense accounts 686,127 32,289Other liabilities to be settled 8,239 8,239Compensation arising from land revaluation 1,264,803 1,264,803Defered revenue 15 -Total $ 6,924,011 6,954,757
(31) Income Tax Expenses
1) Income Tax expenses (benefits)
The income tax expenses for 2016 and 2015 were as follow:
2016 2015Current income tax expense $ 1,802,454 1,821,661Deferred tax expense (benefit) (16,809) (90,809)Income tax expenses $ 1,785,645 1,730,852
Income tax (expenses) benefits recognized directly in other comprehensive income for 2016 and 2015 were as follows:
2016 2015Unrealised gains (losses) on valuation of available-for-sale financial assets $ 27,844 (31,920)
The amount of expense (income) tax recognized in other comprehensive income for in 2016 and 2015 were as follows:
2016 2015Profit before tax $ 19,434,616 10,601,550Income tax using the company’s domestic tax rate $ 3,303,885 1,802,264Income tax expenses of overseas branches 789,611 636,917Net movements of deferred tax assets (16,809) (90,809)Tax-exempt effects and others (2,291,042) (617,520)Total $ 1,785,645 1,730,852
1. Unrecognized Deferred Tax Assets
Deferred tax assets have not been recognized in respect of the following items:
December 31, 2016 December 31, 2015Deductible Temporary Differences $ 4,712,918 3,644,949

131130
Financial Information
2. Recognised Deferred Tax Assets and Liabilities
Changes in the amount of deferred tax assets and liabilities for 2016 and 2015 are as follows:
Deferred Tax Assets:
Fair Value Gains Others TotalBalance at January 1, 2016 $ 377,183 98,857 476,040Recognized in profit or loss (30,618) (94,903) (125,521)Recognized in other comprehensive income (52,639) - (52,639)Balance at 2016 $ 293,926 3,954 297,880Balance at January 1, 2015 $ 262,451 99,347 361,798Recognized in profit or loss 54,572 (490) 54,082Recognized in other comprehensive income 60,160 - 60,160Balance at December 31, 2015 $ 377,183 98,857 476,040
Deferred Tax Liabilities:
Land Value Increment Tax Fair Value Gains Others Total
Balance at January 1, 2016 $ 18,106,962 138,419 94,903 18,340,284Recognized in profit or loss - (47,427) (94,903) (142,330)Recognized in other comprehensive income - (24,795) - (24,795)Balance at 2016 $ 18,106,962 66,197 - 18,173,159Balance at January 1, 2015 $ 18,143,200 110,179 95,393 18,348,772Recognized in profit or loss (36,238) - (490) (36,728)Recognized in other comprehensive income - 28,240 - 28,240Balance at December 31, 2015 $ 18,106,962 138,419 94,903 18,340,284
2) The Bank and its subsidiary’s income tax returns have been audited by the MoA up until 2015 and examined by the National Tax Administration up until 2011.
3) Information related to the unappropriated earnings and deduction tax account were summarized below:
December 31, 2016 December 31, 2015Unappropriated earnings of 1998 and after $ 18,815,254 7,953,744
December 31, 2016 December 31, 2015Balance of deductible tax account $ 910,796 690,454
After the Bank’s filing of the income tax return, the imputed tax creditable ratio for appropriating the net income for 2016 and 2015 were 8.68% and 8.86% (actual). The integrated income tax is calculated according to the Tai Cai Shui No.10204562810 (October 17, 2013).

2016 ANNUAL REPORT
BANK FTAIWAN
133132
(32) Equity
1) Capital stock
As of December 31, 2016 and 2015, the Bank’s authorized and issued shares of common stock were 9,500,000 thousand shares. The above mentioned common stock had a par value of $10.
2) Capital surplus
According to the ROC Company Act prior to the new amendment on January 4, 2012, capital surplus can only be used to increase share capital by the realized capital surplus after making good the deficit. Capital surplus cannot be used for distribution of cash dividends. According to the new amendment of the ROC Company Act, the Bank can declare dividend with capital surplus. The aforementioned realized capital surplus includes the income derived from the issuance of new shares at a premium and the income from endowments received by the Bank. The share capital capitalized in any one year may not exceed a certain percentage for the Bank’s increasing share capital under the Regulations Governing the Offering and Issuance of Securities by Securities Issuers. The Bank may only increase its capital reserve out of the share capital from cash premium on capital stock once a year. The additional capital reserve from the share capital may not be increased during the same fiscal year as the additional share capital from cash premium on capital stock.
3) Legal reserve
In accordance with the Company Act prior to the new amendment on January 4, 2012, the Bank shall set aside 30 percent of the net income after tax as legal reserve until such legal reserve amounts have reach the authorized capital. The legal reserve can only be used to make good the deficit but not use to distribute any cash dividends. According to the amendment of the ROC Company Act, the distribution of the legal reserve by issuing new shares or by cash is allowed only with the approval granted through the shareholder’s meeting when the Bank does not have any deficit, and only the portion of legal reserve which exceeds 25 percent of the paid-in capital may be distributed.
4) Other equity (net of tax)
Financial statements translation
differences of foreign operations
Unrealized gain (loss) on available-for-sale financial
assets
Effect of credit risk changes of financial liabilities
measured at fair value
Total
Balance at January 1, 2016 $ 1,177,610 18,903,839 22,552 20,104,001Exchange differences arising on translation of foreign operations (690,728) - - (690,728)
Unrealized gain (loss) on available-for-sale - 3,888,634 - 3,888,634Effect of credit risk changes in financial liabilities measured at fair value sale financial assets - - (13,611) (13,611)
Balance at December 31, 2016 $ 486,882 22,792,473 8,941 23,288,296Balance at January 1, 2015 $ 273,698 23,216,783 47,305 23,537,786Exchange differences arising on translation of foreign operations 903,912 - - 903,912
Unrealized gain (loss) on available-for-sale - (4,312,944) - (4,312,944)Effect of credit risk changes in financial liabilities measured at fair value sale financial assets - - (24,753) (24,753)
Balance at December 31, 2015 $ 1,177,610 18,903,839 22,552 20,104,001

133132
Financial Information
5) Appropriation of earnings
The articles of incorporation of the Bank and its subsidiary stipulate that net income should be distributed in the following order:
1. to settle all outstanding tax payable;
2. to offset prior years losses;
3. to appropriate 30% as legal reserve;
4. special reserve
to appropriate 20~40% as special reserve; In accordance with the Order No. 1010012865 issued by the FSC on April 6, 2012, for any unrealized revaluation gains and cumulative translation adjustments (gains) recorded in the shareholders equity which the Bank and its subsidiary elect to transfer to retained earnings by application of the exemption under IFRSs No. 1, the Bank and its subsidiary shall set aside an equal amount of special reserve. When the Bank and its subsidiary subsequently use, dispose of, or reclassify the relevant assets, it may reverse to distributable earnings a proportional amount of the special reserve originally set aside.
In accordance with the guidelines of the above Ruling, a portion of current-period earnings and undistributed prior-period earnings shall be reclassified as special earnings reserve during earnings distribution. The amount to be reclassified should be equal to the difference between the total net current- period reduction of special earnings reserve resulting from the first-time adoption of IFRSs and the carrying amount of other shareholder’s equity as stated above. Similarly, a portion of undistributed prior-period earnings shall be reclassified as special earnings reserve (which does not qualify for earnings distribution) to account for cumulative changes to other shareholder’s equity pertaining to prior due to the first-time adoption of IFRSs. Amounts of subsequent reversals pertaining to the net reduction of other shareholder’s equity shall qualify for additional distributions.
5. To appropriate dividends.
The remaining balance would be appropriated, combining accumulated retained earnings, in accordance with related laws and regulations.
According to the Banking Law, before the legal reserve balance amounts to the authorized capital, cash dividend distributions cannot exceed 15% of the authorized capital.
6. To accelerate the accumulation the Bank’s regulatory capital, TFH submitted the application (Jin-Kung -Tsai Tsu No. 10515400091 ) to the Ministry of Finance and the Executive Yuan on January 15, 2016 for the Bank not to distribute its surplus of 2015 to the Ministry of Finance. On March 31, 2016, the Ministry of Finance responded to TFH in accordance with the reply from the Executive Yuan that the surplus can be kept as retained earnings, except for the distribution of 4 hundred million of TFH’s budgeted working capital in 2016.
7. To strengthen the quality and enhance the capital adequacy ratio, during the period of the Legislative Yuan’s deliberation in the 2016 budget, the Bank submitted an application to the Executive Yuan to allow the Bank not to distribute its surplus under the premise that the government can reach the balance of fiscal revenue and expenditure. The application was approved by the Executive Yuan and the Legislative Yuan after the third reading. TFH then issued the letter, Jin-Kung-Tsai-Tsu No. 10615400021 on January 4, 2017 to instruct the Bank to proceed with its surplus distribution accordingly, wherein the distribution was authorized by its board of directors on February 24, 2017. The distribution, however, is still subject to a subsequent examination by the National Audit Office. Adjustments may be required after the examination has been conducted.
Please refer to Consolidated Statement of Change in Equity about the change of equity.

2016 ANNUAL REPORT
BANK FTAIWAN
135134
(33) Net interest income2016 2015
Interest income:Loans and discounts $ 39,433,276 43,712,134Placement with Central Bank and call loans to banks 8,020,118 9,048,237Securities investment 10,995,673 10,845,972Credit cards 29,085 30,693Bonds purchased under resell agreements 612 2,466Others 924,021 1,118,830
59,402,785 64,758,332Interest expense:
Deposits from customers 30,788,106 33,780,014Deposits of Central Banks and other banks 2,175,375 2,032,233Bonds sold under repurchased agreements 49,158 140,625Financial bonds 322,410 364,053Structured deposits 15,616 27,345Others 16,638 7,885
33,367,303 36,352,155Total $ 26,035,482 28,406,177
(34) Service fees, net2016 2015
Service fees revenue:Trust services $ 731,592 875,016Custody services 137,651 136,382Foreign exchange business 264,389 289,708Credit business 632,552 713,129Credit card services 128,635 126,942Deposit, remittance and other services 4,358,581 3,896,176
Subtotal 6,253,400 6,037,353Service fees expense:
Trust services 81,936 91,371Custody services 15,703 11,357Credit card services 115,682 102,458Deposit, remittance and other services 410,398 372,970
Subtotal 623,719 578,156Total $ 5,629,681 5,459,197

135134
Financial Information
(35) Gain (loss) on financial assets or liabilities measured at fair value through profit or loss 2016 2015
Gain on financial assets or liabilities measured at fair value through profit or loss:
Dividend income $ 3,939,458 3,871,451Net interest (loss) income (560,980) (492,351)Net gain on disposal 4,084,336 5,411,602
7,462,814 8,790,702Gain on financial assets or liabilities measured at fair value through profit or loss – evaluation:
Net (loss) gain on valuation 8,860,054 (7,296,607)Total $ 16,322,868 1,494,095
(36) Realized gain (loss) on available-for-sale financial assets2016 2015
Dividend income $ 2,198,262 1,671,718Gain on disposal 313,331 415,525
Subtotal 2,511,593 2,087,243Loss on disposal 379,771 590,999Total $ 2,131,822 1,496,244
(37) Foreign exchange gain or loss2016 2015
Foreign exchange gains $ 13,588,461 13,144,448Foreign exchange losses (14,046,354) (8,430,099)Foreign exchange gains or losses $ (457,893) 4,714,349
(38) Other non-interest income (expense)
2016 2015
Premiums income $ 22,779,133 20,918,138Sales revenue 115,695,073 126,636,755Subsidized income from government 13,754,258 16,970,331Benefits and claims (29,871,353) (32,810,111)Cost of goods sold (115,152,537) (126,137,332)Provisions for policy holders’ reserve premium (18,843,200) (5,529,029)Excess preferential interest expenses (10,777,111) (11,006,752)Others 1,006,050 476,226Total $ (21,409,687) (10,481,774)

2016 ANNUAL REPORT
BANK FTAIWAN
137136
(39) Employee benefits expenses2016 2015
Salaries $ 10,380,981 10,295,264Labor and health insurances 503,041 492,723Pensions 835,164 776,218Others 242,738 257,074Total $ 11,961,924 11,821,279
(40) Depreciation and amortization expenses 2016 2015
Depreciation expenses $ 744,271 755,445Amortization expenses 360,891 357,259Total $ 1,105,162 1,112,704
(41) Other general and administrative expenses 2016 2015
Taxes $ 3,318,279 3,634,722Rental expenses 716,926 701,298Insurance expenses 923,616 879,922Postage and phone / fax expenses 217,590 210,109Utilities 198,548 216,508Supplies expenses 162,952 168,361Repair and maintenance expenses 399,361 407,753Marketing expenses 314,029 320,267Professional service fees 370,220 362,335Cashes transferring expenses 74,806 69,573Others 312,087 302,532Total $ 7,008,414 7,273,380
(42) Earnings per ShareThe basic earnings per share of the Bank and its subsidiary was calculated as follows:
Unit: thousand dollars / thousand shares
2016 2015Before-Tax After-Tax Before-Tax After-Tax
Consolidated net income $ 19,434,616 17,648,971 10,601,550 8,870,698Weighted average outstanding shares 9,500,000 9,500,000 9,500,000 9,500,000Basic earnings per share (In dollars) $ 2.05 1.86 1.12 0.93

137136
Financial Information
(43) The Fair Value and Fair Value Hierarchy of the Financial Instruments
1) Fair value information
1. Overview
Fair value is the price that would be received to sell an asset or pay to transfer a liability in an orderly transaction between market participants at the measurement date.
Financial instruments are recognized initially at fair values. In many case, they usually refer to transaction prices. Subsequent to initial recognition, they are also measured at fair value except for those that are measured at amortized cost. The best evidence of fair value is the quoted price in an active market. If financial instruments do not have a quoted market price in an active market, the Bank uses the valuation techniques or refers to the quoted prices set by Bloomberg, Reuters or the Counterparties to determine the fair value.
2. The Three-level Definition
(a) Level 1
Inputs are quoted prices of same financial instruments in an active market. An active market indicates the market that is in conformity with all the following conditions: (i) the products in the market are identical; (ii) it is easy to find a willing party; (iii) the price information is attainable for the public. The equity investments, beneficiary certificates, certain Taiwan government bonds, and derivatives with quoted prices in an active market are classified as level 1.
(b) Level 2
Inputs are those that are observable for asset or liability, either directly (i.e. prices) or indirectly (i.e. derived from prices), other than quoted prices included within Level 1. The non-popular government bonds, corporate bonds, financial bonds, convertible bonds, most of the derivatives, and financial bonds issued by the Bank and its subsidiary are classified as level 2.
(c) Level 3
Inputs are not based on observable market data (unobservable inputs parameters), i.e., historical volatility which cannot represent an expected value of all the market participators but is used as a model for the calculation of options. Certain derivatives and equity investments without a non-active market belong to level 3.

2016 ANNUAL REPORT
BANK FTAIWAN
139138
2) Measure at fair value measurement
1. Fair value hierarchy
Financial instruments measured at fair value and investment property are measured at fair value, while assets held for sale are measured at the lower of carrying value and fair value, minus, cost of disposal. The table below analyses the financial instruments carried at fair value by their levels in the fair value hierarchy.
Financial instruments measured at fair value
December 31, 2016Total Level 1 Level 2 Level 3
Non-derivative financial instruments Assets:
Financial assets measured at fair value through profit or loss 202,194,956 147,581,135 54,613,821 -
Financial assets held for trading 184,124,658 147,581,135 36,543,523Investment in stocks 77,529,161 77,529,161 - -Investment in bonds 2,740,995 2,574,086 166,909 -Others 103,854,502 67,477,888 36,376,614 -
Financial assets designated as fair value through profit or loss 18,070,298 - 18,070,298 -
Available-for-sale financial assets 1,037,841,339 57,699,831 980,141,508Investments in stocks 51,706,108 51,706,108 - -Investment in bonds 134,829,227 5,712,226 129,117,001 -Others 851,306,004 281,497 851,024,507 -
Derivative financial instruments Assets:
Financial assets measured at fair value through profit or loss 10,366,042 - 10,366,042 -
Hedging derivatives financial assets 21,221 - 21,221 -Liabilities:
Financial liabilities measured at fair value through profit or loss 6,709,063 - 6,709,063 -
Hedging derivatives financial liabilities 144,195 - 144,195 -

139138
Financial Information
Financial instruments measured at fair value
December 31, 2015Total Level 1 Level 2 Level 3
Non-derivative financial instruments Assets:
Financial assets measured at fair value through profit or loss 157,261,096 126,808,496 30,452,600 -
Financial assets held for trading 143,830,121 126,808,496 17,021,625Investment in stocks 58,619,775 58,619,775 - -Investment in bonds 2,833,834 2,245,952 587,882 -Others 82,376,512 65,942,769 16,433,743 -
Financial assets designated as fair value through profit or loss 13,430,975 - 13,430,975 -
Available-for-sale financial assets 1,053,598,710 54,271,012 999,327,698Investments in stocks 48,312,732 48,312,732 - -Investment in bonds 114,648,153 5,307,106 109,341,047 -Others 890,637,825 651,174 889,986,651 -
LiabilitiesFinancial liabilities measured at fair value through profit or loss 33,275,404 - 33,275,404 -
Financial liabilities designated as fair value through profit or loss 33,275,404 - 33,275,404 -
Derivative financial instruments Assets:
Financial assets measured at fair value through profit or loss 15,744,109 - 15,744,109 -
Hedging financial assets 15,970 - 15,970 -Liabilities:
Financial liabilities measured at fair value through profit or loss 5,949,071 - 5,949,071 -
Hedging derivatives financial liabilities 243,967 - 243,967 -
2. Financial instruments measured at fair value
Fair value of an assets or liability is the amount at which the asset could be bought or sold in a current transaction between both willing parties who have full understanding, or transferred to an equivalent party.
Financial instruments are recognized initially at fair values. In many case, they usually refers to transaction price. Subsequent to initial recognition, they are also measured at fair value except for those that are measured at amortized cost. The best evidence of fair value is the quoted price in an active market. If a financial instrument do not have a quoted market price in an active market, the Bank uses the valuation techniques or refers to the quoted prices set by Bloomberg, Reuters or the Counterparties to determine the fair value.
The fair value of financial instruments is based on the quoted prices in an open market. These include trading prices of equity instruments listed on a major stock exchange or of the government bonds in an over the counter (“OTC”) market.
When a quoted price of a financial instrument is timely available in a stock exchange or an OTC market or from brokers, underwriter, industry associations, pricing service organizations and the authorities and the price is often used in a arm’s length transaction, the financial instrument is considered to have a quoted price in an active market. If the above criteria are not met, the market is considered inactive. In general, a large or significantly increasing bid-ask spread and very low transaction volume indicate that the market where the financial instrument is trade is not active.

2016 ANNUAL REPORT
BANK FTAIWAN
141140
Other than those traded in an active market, the fair value of all other financial instruments is determined by using a valuation model or referring to the quoted price of the counterparty. The Bank refers to the present values, the discounted cash flow or the values calculated under other valuation methods of financial instruments with similar terms and characteristics, including the one calculated by a model which uses the available market data at the financial statement day as inputs. (i.e. the applicable yield curve of bonds traded in the Taipei exchange and average prices of commercial papers quoted on Reuters)
When measuring a financial instrument which no specific techniques can be applied to but do not create challenge in valuation, such as bonds traded in an inactive market, interest rate swap, FX swaps and options, the Bank and its subsidiary adopt the valuation methods which are widely used and accepted by other market participants. The parameters used are usually the observable market data or information.
For complex financial instruments, the Bank not only refers to the valuation methods which are widely used and accepted by other banks but also develops its own valuation models to determine the fair value. These valuation models are usually applied to the valuation of derivatives, debt instruments with embedded derivatives, or securitization products. The parameters used in such models are usually not observable in a market, and therefore, the Bank has to make proper estimates based on assumptions and judgments.
3. Fair value adjustment
(a) Limitations of valuation models and uncertainty input
Outputs of valuation models are approximate values and valuation techniques may not be able to reflect critical factors of all the financial and non-financial instruments. As such, additional parameters shall be incorporated into the fair value measurement, such as modeling risk and liquidity risk, when necessary. The management of the Bank believes that the adjustments made to the fair value of financial and non-financial instruments are appropriate and necessary since they are performed in accordance with the Bank’s policies governing the fair value of valuation models and related internal controls. All the information and parameters are based on current market conditions and thoroughly reviewed by the Bank.
(b) Credit risk valuation adjustment
Credit risk valuation adjustment consists of credit valuation adjustments and debit valuation adjustments to the derivatives traded in an OTC market instead of a stock exchange market. The definitions are as follows:
a) Credit value adjustments (CVA): adjust the valuation on transactions that occurs outside the exchange market, which refers to OTC derivative contracts, to reflect the possibility of the counter parties’ delayed payment and default into fair value.
b) Debit value adjustments (DVA): adjust the valuation on transactions that occurs outside the exchange market, which refers to OTC derivative contracts, to reflect the possibility of the Company and its subsidiaries’ delayed payment and default into fair value.
The key inputs of the measurement of credit risk and the quality of the Bank’s counterparties are the probability of default (PD), loss given default (LGD) and exposure at default (EAD).
CVAs are calculated by considering the counterparty’s probability of default (PD) under the condition that the Bank is not in default, Loss given default (LGD) and Exposure at default (EAD). On the contrary, DVAs are calculated by considering the Bank’s PD under the condition that the counterparty is not in default, LGD and EAD.

141140
Financial Information
The Banks refers to the counterparty’s default rate graded by Moody’s, experiences of John Gregory (scholar), and foreign financial institutions, to determine the PD at 60%. The Bank may also use other alternative PD assumptions if data availability is limited. Moreover, the Bank also takes the credit risk valuation adjustments into consideration when calculating fair value by referring to the Mark-to-Market values of derivatives traded in the OTC markets to reflect the counterparty’s credit risk and the Bank’s creditworthiness.
4. Reconciliation for fair value measurements in Level 3 of the fair value hierarchy was as follows:
There were no financial instruments categorized in level 3 as of December 31, 2016 and 2015.
5. The process of fair value measurements in Level 3
Referring to IFRS 13, the Trading Department should inform the Risk Management Department regarding the related valuation methods before any financial instruments categorized in Level 3 are bought or sold. The valuation result of such financial instruments is quarterly reported to Asset and Liability Management Committee.
6. Fair value measurements in Level 3 – sensitivity analysis of reasonably possible alternative assumptions
The Bank considers the valuation techniques used by the Bank for fair value measurements in Level 3 reasonable. However, any changes in one or more of the paramenters or assumptions may lead to a different result.
The favorable and unfavorable effects represent the changes in fair value, and the fair value are based on a variety of unobservable inputs calculated using a valuation technique. There are no such effects as of December 31, 2016 and 2015. The analysis only reflects the effects of changes in a single input, and it does not include the inter-relationships with another input.
3) Hierarchy information of financial instruments not measured at fair value
1. Fair Value Information
In addition to the following items, the Bank’s financial instruments that are not measured at fair value include cash and cash equivalents, due from the central bank and call loans to banks, securities purchased under resell agreements, receivables, other financial assets, discounts and loans, deposit from and due to the central bank and banks, securities sold under repurchase agreements, commercial papers issued, payables, deposits, other borrowings and other financial liabilities. Since their book value is a reasonable approximation to fair value, there is no fair value disclosure.
Item Book value Fair valueDecember 31, 2016Financial Assets
Held-to-maturity financial assets 138,812,328 138,123,366Other financial assets – Debt investments without quoted price in active markets 15,732,665 15,452,600
December 31, 2015Financial Assets
Held-to-maturity financial assets 113,786,391 114,956,097Other financial assets – Debt investments without quoted price in active markets 5,406,715 5,327,273

2016 ANNUAL REPORT
BANK FTAIWAN
143142
2. Fair value hierarchy
Assets and liabilities item
December 31, 2016
Total
Quoted prices in active markets for
identical asset(Level1)
Significant other observable inputs
(Level2)
Significant observable inputs
(Level3)
Financial Assets:Held-to-maturity financial assets $ 138,123,366 58,842,117 79,281,249 -Other financial assets – Debt investments without quoted price in active markets 15,452,600 - 15,452,600 -
Assets and liabilities item
December 31, 2015
Total
Quoted prices in active markets for
identical asset(Level1)
Significant other observable inputs
(Level2)
Significant observable inputs
(Level3)
Financial Assets:Held-to-maturity financial assets $ 114,956,097 64,017,115 50,938,982 -Other financial assets – Debt investments without quoted price in active markets 5,327,273 - 5,327,273 -
The methods and assumptions to estimate the financial instruments not measured at fair value are as follows.
(a) Financial instruments that have short term to maturity or of which the agreed prices are close to carrying amounts are recognized using their carrying amounts at reporting date. These financial instruments include cash and cash equivalents, placement with Central Bank and call loans to banks, bills and bonds purchased under resell agreements, receivables, limited assets, deposits of Central Bank and other banks, loans to the Central Bank and other banks, bills and bonds sold under repurchase agreements, payables and guarantee deposits received.
(b) The discounts and loans (including non-performing loans): The Bank use the floating interest rate to be the interest rate of loans. The floating interest rate can also reflect the market interest rate. So it is reasonable to use the carrying amount and the recoverability to estimate the fair value. The mid-term and long-term loans using with fixed interest rate should use the discounted present value of expected future cash flow to estimate their fair value. However, if the loans with fixed interest rate are minor, it is reasonable to use the carrying amount and their recoverability to estimate their fair value.
(c) Held-to-maturity financial assets: The quoted price in an active market shall be used to estimate the fair value. Otherwise, the quoted price of the counterparty or the valuation methods will be used instead.
a) New Taiwan Dollar Government Bonds: The “Government Bonds Fair Value” offered by the Taipei Exchange is used to evaluate the bonds.
b) New Taiwan Dollar Corporate Bonds and Financial Bonds: The present value is decided by the present value discounted at the yield offered by the Taipei Exchange or the fair value offered by the Taipei Exchange.
(d) Deposits and Remittances: The Bank and its subsidiary consider the characteristic of bank industries to decide the fair value. The deposits with market interest rate are those almost with due within one year and their carrying amounts are reasonable basis for estimating the fair value. The long-term deposits with fixed interest rate are measured using the discounted present value of expected future cash flow. Because the term to maturity is less than three years, it is reasonable to use the carrying amount to estimate the fair value.

143142
Financial Information
(e) Financial Bonds Payable: It refers to the convertible corporate bonds and financial bonds issued by the Bank and its subsidiary. Their coupon rates are almost equal to the market interest rate, so it is reasonable to using the discounted present values of the expected future cash flow to estimate their fair values. The present values are almost equal to the carrying amounts.
(f) Other Financial Assets – Bonds Investments with Non-active Market: If there are related transactions or quoted price from market makers, the latest strike price or quoted price should be used to measure the fair value. Otherwise, use the valuation methods to estimate the discounted present value of cash flow.
(g) Other Financial Assets – Financial Assets Carried at Cost: Because there is no quoted price in the active market and the interval of estimated fair values is significant or it is not reasonable to evaluate the probability of each estimated fair value within the interval, therefore, the fair value cannot be measured reliably. Hence, the Bank and its subsidiary can not disclose the fair value.
(44) Financial Risk Management
1) Overview
The Bank’s activities has expose to various risks from financial instruments, which included credit risk, market risk, operational risk, interest rate risk, liquidity risk, national risk, legal risk and so forth. The principle of risk management is as follow:
1. Monitor the BIS Capital Adequacy Ratio in response to operation scale, credit risk, market risk, operational risk and the operating trades in the future.
2. Establish a systematic risk measure and control mechanism to measure, monitor and control every risk.
3. Manage every business risk considering the risk capacity, capital reserve, nature of debts and performance.
4. Establish a valuation method for the quality and classification of assets, control the intensity of exposure and significant exposure, check periodically and recognize allowance for loss.
5. Establish information system protection mechanism and emergency plan for bank operation, transactions, and information. Build an independent and effective risk management mechanism and strengthen the risk management of business through appropriate policies, procedures, and systems.
2) Risk management structure
The risk management structure of the Bank and its subsidiary is composed of the Board of Directors, risk management committee, risk management department and every operational unit.
1. The Board of Director is the final decision maker for risk management and is responsible for the result of risk. The Board of Director should decide the entire risk management policies in view of operational strategies and business environment to monitor the risk management mechanism which understand the risk status and maintain the appropriate Capital Adequacy Ratio in response to all risk.
2. Risk management committee under the Board of Directors is responsible for executing risk management policies and coordinating interdepartmental management of risk.
3. Risk management department is responsible to monitor, trace the execution status of risk management policies and submit reports to the board of directors or risk management committee. If a significant risk exposure is discovered, the risk management department has to make appropriate procedures and report them to the board of directors.

2016 ANNUAL REPORT
BANK FTAIWAN
145144
4. Every department should identify, evaluate, and control the risks of new products or business, set related risk management regulations as a guideline, and monitor the risk management to ensure the risk control of entire company.
5. All operational units shall comply with the regulations for risk management.
3) Credit Risk
1. Causes and definition of credit risk
Credit risk is the risk of financial loss to the Bank if a borrower, issuer or a counterparty to a financial instrument fails to meet its contractual obligations principally due to their credit deterioration or other factors (i.e. disputes between a loanee and its counterparty). Credit risk is derived both from on- and off- balance sheet items. On-balance-sheet items include loans, placement with banks, call loans to banks, acceptance bills, debt instruments, derivatives, etc. Off-balance sheet items include guarantees, acceptances, letter of credits, loan commitments, etc.
2. Identification and measurement of credit risk
To ensure the credit risk is in a tolerable range, the Bank and its subsidiary set the credit risk management policies which identified that the credit risk includes all the transactions and business related to the assets, liabilities and off-balance sheet items. Before executing present or new businesses, the Bank and its subsidiary shall identify the credit risk, understand the risk exposure through appropriate evaluation and assess the possibilities of default.
Except that the local financial supervisory institutions have their own regulations, the overseas business units of the Bank and its subsidiary shall conduct the credit ability of the loans and discounts, and recognized impairment in accordance with the “Operational Manual of Evaluating the Impairment of Loans and Receivables”. The followings are the detailed information of how major businesses of the Bank measure and manage credit risk.
(a) Credit business (including loan commitments and deposit)
a) Credit assets categories and post-loan management
The Bank has established the “Operational Manual of Evaluating the Impairment of Loans and Receivables” and classify the credit assets into five categories. Except for the normal credit assets that are classified at the first category, the other bad credit rating assets are classified as the second category- requiring attention, the third category- collectable, the forth category- hard to collect and the fifth category-impossible to collect by assessing the collaterals and overdue days. In order to reinforce the pos-loan management, the Bank and its subsidiary set the “Credit Review and Follow up Evaluations Provision”, the “Review of the Credit Conducted by Managers Provision” and “Warning Mechanism Provision” and evaluate and monitor the quality of credit assets regularly. Also, the Bank and its subsidiary keep retrial according to rating of credit cases and check significant credit case periodically to enhance the management of abnormal credit for the intention of warning and interim monitor.
b) Internal credit rating
When conducting credit review, the Bank will obtain necessary collateral to mitigate risk arising from financial loss due to the environment, economic changes, risk factors of business development strategies and policies. In order to balance the credit risk and earnings target, they strengthen the market competitiveness of products strive for customer identification and broaden the business. The following are the credit process of corporate finance and consumer finance.

145144
Financial Information
a. Corporate Finance
The Bank has established a credit policy under which each new customer is analyzed individually for creditworthiness before the interest rate is offered. The Bank's review includes external rating, when available, and in some cases, the information that is publicly available. The corporate credit rating score classify companies into two types, the large-scale enterprise and the medium-scale enterprise. Then they measure their scale, financial and business status, business management and industry characteristic. There are eight credit ratings, all in all.
b. Consumer Finance
The Bank and its subsidiary use the credit application scorecard and behavior scorecard, both of which have five grades to consider the credit risk evaluation and differential interest rate. Unsecured consumer loans are graded based on seven scoring items and classified into five ratings. The Bank and its subsidiary will reject those below the lowest scores; the others are reviewed in accordance with related provisions.
(b) Due from Banks and Call Loans to Banks
The Bank will assess the counterparty’s creditworthiness, and refer to external ratings, provided by domestic and international credit rating agencies, to set up different credit risk limits before any transactions are carried out.
(c) Investment in debt instruments and derivative
The Bank identifies and manages credit risk of debt instruments by reviewing the external ratings, bonds’ creditworthiness, and geographic region of its counterparties.
Most of the Bank’s derivative contracts with its counterparties are financial institutions with good credit ratings. For those financial institutions whose ratings are not available, the Bank reviews the transactions individually. All the counterparties, including non-financial institutions, are managed based on their lines of credit (including loans at call).
3. Management of maximum exposure to credit risk and excessive risk concentration
(a) In accordance with the Banking Law, there is a credit limitation management for the Bank and its subsidiary’s person in charge, employees, and any interested party. In respect to credit intensity, the Bank and its subsidiary provide credit and investment quota rules for the same enterprise, and industry. The Bank and its subsidiary also limit and manage the credit amount for enterprises, groups and every industry.
(b) The Bank and its subsidiary’s Treasury Department, OBU, and foreign branches provide different credit amount according to external credit evaluation and rankings when having a transaction in the currency market or capital market, foreign exchange, new financial instruments transactions and negotiable security transactions.
(c) To diversify the risk for countries, the Bank and its subsidiary allocate different credit amount according to the ranking of the countries in Euromoney to the Financing Department, OBU, and foreign branches. The covered businesses are loan assets, transaction assets, and off balance sheet positions.

2016 ANNUAL REPORT
BANK FTAIWAN
147146
4. Policies of credit risk deduction
(a) Collateral
The Bank has established policy and procedures to mitigate credit risk. Among them, one of the most common ways, is to demand for collateral. In terms of collateral management and valuation, the Bank established policies governing the scope of collateral and related procedures to secure debts. Moreover, the Bank also requires the provisions that secure debts and collateral should be contained within a credit agreement to reduce credit risk by clearly defining the amounts the Bank can cut and the grace periods the banks can offer or even requesting for a prepayment.
Non-credit businesses are not required to collect collateral, depending on the nature of the financial instruments. Only asset-backed securities and other similar financial instruments are required to pledge an asset pool of financial instruments as collateral.
Considering both credit control and business expansion, the Bank and its subsidiary shall request collaterals or guarantees to decrease the credit risk. The permitted collaterals and guarantees included mortgages on real estate or properties (i.e., land, building, machinery, car, ship, aircraft, etc.), pledges of securities or other rights (i.e., certificates of deposit; various bonds, stocks, or other securities), guarantees provided by the government agencies, banks, or credit guarantee institutions authorized by the government, and any other guarantees or collaterals approved by the Bank and its subsidiary.
(b) Master netting agreement
The Bank’s transactions are usually settled individually without bundling or netting with any other transactions. However, the Banks also enters into netting agreements or chooses to settle net and terminates the deal if the counterparty is in default.
(c) Other credits enhancement
The Bank’s credit contract contains the term that the Banks are entitled to offset the obligation by claiming the deposits of the borrower who are in default to mitigate credit risk.
5. The maximum credit exposure to the credit risk of financial assets (without considering the allowance for bad debt, collaterals and guarantees)
(a) Assets in the Financial StatementsUnit: In million of TWD
ItemDecember 31, 2016 December 31, 2015
BookValue
Maximum credit exposure (Note 1)
BookValue
Maximum credit exposure (Note 2)
Cash and cash equivalents $ 81,044 45,914 102,648 76,074Placement with Central Bank and call loans to banks 687,282 226,850 586,019 157,448
Financial assets measured at fair value through profit or loss 67,334 65,174 46,449 42,623
Available-for-sale financial assets 1,037,838 152,394 1,053,599 128,998Hedging derivatives financial assets 21 21 16 16Bonds and bills purchased under resell agreements - - 50 50
Receivables 45,795 28,044 55,952 33,159Loans and discounts 2,307,049 2,236,786 2,414,484 2,323,111Held-to-maturity financial assets 81,983 16,564 50,617 19,252Other financial assets 76,716 28,017 68,897 21,051Total $ 4,385,062 2,799,764 4,378,731 2,801,782

147146
Financial Information
Note 1: December 31, 2016
(1) The amount of non-performing loans which included the department of loan management was $4,749 million.
(2) Apart from cash, the maximum exposure to credit risk of other assets shall exclude the debts (including tax receivables, placement with Central Bank and deposits in Central Bank) from the government and the Central Bank. Explanations were as follows:
1) Cash and cash equivalents exclude cash and notes and checks for clearing ($35,130 million).
2) Placement with Central Bank and call loans to banks exclude placement with Central Bank and deposits in Central Bank ($460,432 million).
3) Financial assets measured at fair value through profit or loss exclude treasury bonds ($1,993 million) and government bonds ($167 million).
4) Available-for-sale financial assets exclude government bonds ($38,028 million) and negotiable certificate of deposits ($847,416 million).
5) Held-to-maturity financial assets exclude government bonds ($65,419 million).
6) Receivables exclude tax receivables ($696 million) and long-term receivables ($17,055 million).
7) Loans and discounts exclude loans to government ($70,263 million).
8) Other financial assets exclude short-term advances to government ($48,699 million).
(3) The book value of hedging derivatives is the principal of the hedging instruments (IRS); and the amount of greatest credit exposure is the adjusted amount of hedging derivatives at fair value.
(4) This table excludes the Department of Government Employees Insurance and the subsidiary, BankTaiwan Insurance Brokers.
Note 2: December 31, 2015
(1) The amount of non-performing loans which included the department of loan management was $4,408 million.
(2) Apart from cash, the maximum exposure to credit risk of other assets shall exclude the debts (including tax receivables, placement with Central Bank and deposits in Central Bank) from the government and the Central Bank. Explanations were as follows:
1) Cash and cash equivalents exclude cash and notes and checks for clearing ($26,574 million).
2) Placement with Central Bank and call loans to banks exclude placement with Central Bank and deposits in Central Bank ($428,571 million).
3) Financial assets measured at fair value through profit or loss exclude treasury bonds ($3,401 million) and government bonds ($425 million).
4) Available-for-sale financial assets exclude government bonds ($36,587 million) and negotiable certificate of deposits ($888,014 million).
5) Held-to-maturity financial assets exclude government bonds ($31,365 million).
6) Receivables exclude tax receivables ($1,272 million) and long-term receivables ($21,521 million).
7) Loans and discounts exclude loans to government ($91,373 million).
8) Other financial assets exclude short-term advances to government ($47,846 million).
(3) The greatest impact of the credit exposure is the fair value at the balance sheet date; the book value of hedging derivatives is the principal of the hedging instruments (IRS); and the amount of greatest credit exposure is the adjusted amount of hedging derivatives at fair value.
(4) The carrying amounts excluded the assets of the Department of Government Employees Insurance.

2016 ANNUAL REPORT
BANK FTAIWAN
149148
(b) Off-balance sheet ItemsUnit: In million of TWD
ItemDecember 31, 2016 December 31, 2015
BookValue
Maximum credit exposure (Note 1)
BookValue
Maximum credit exposure (Note 2)
Irrevocable loan commitment (with lines of credit) $ 344,599 5,797 526,250 23,950
Letter of credit receivables 28,935 26,766 30,734 28,568Deposits receivables 75,684 75,684 80,330 80,330Total $ 449,218 108,247 637,314 132,848
Note 1: December 31, 2016
(1) While measuring the maximum exposure to credit risk, the Bank and its subsidiary only consider the items that are positive at the reporting date, the off-balance commitments and guarantee contracts and exclude the position to the government.
1) Irrevocable loan commitment with credit agreement excludes $338,802 million.
2) Letter of credit receivables exclude $2,169 million.
(2) This table excludes the Department of Government Employees Insurance and the subsidiary, BankTaiwan Insurance Brokers.
Note 2: December 31, 2015
(1) While measuring the maximum exposure to credit risk, the Bank and its subsidiary only consider the items that are positive at the reporting date, the off-balance commitments and guarantee contracts and exclude the position to the government.
1) Irrevocable loan commitment with credit agreement excludes $502,300 million.
2) Letter of credit receivables exclude $2,166 million.
(2) This table excludes the Department of Government Employees Insurance and the subsidiary, BankTaiwan Insurance Brokers.
(c) The assets in the balance sheet and off-balance sheet items held as collateral, master netting arrangement and other credit enhancements related information on the financial impact the maximum amount of the violence risk in credit risk shows in the following table:
Unit: In million of TWD
December 31, 2016 Collateral General agreement of net amount settlement
Enhancement of other credits Total
In balance sheet:Receivables
Others $ 329 69 4,561 4,959Loans and discounts 1,333,311 - 972,576 2,305,887Off-balance sheetIrrevocable loan commitments 795 - 343,952 344,747Standby letters of credit 2,731 - 26,199 28,930Financial guarantees 5,354 - 70,328 75,682Total $ 1,342,520 69 1,417,616 2,760,205
December 31, 2015 Collateral General agreement of net amount settlement
Enhancement of other credits Total
In balance sheet:Receivables
Others $ 1,087 31 8,287 9,405Loans and discounts 1,311,093 - 1,102,382 2,413,475Off-balance sheetIrrevocable loan commitments 7,943 - 518,146 526,089Standby letters of credit 1,966 - 28,768 30,734Financial guarantees 6,435 - 73,895 80,330Total $ 1,328,524 31 1,731,478 3,060,033

149148
Financial Information
The Management believes that the reason why the Bank can continuously manage and minimize the exposure of credit risk to off-balance sheet items is because a stricter review process is adopted, and cases are reviewed regularly in subsequent periods.
6. Concentration of credit risk
When the transaction of financial instruments is concentrated in a single industry or region, the ability to oblige the contract would be impacted by similar factors, thereby, causing concentration of credit risk.
The credit risk of the Bank and its subsidiary is derived from credit, placement with banks, call loans to banks, security investments and so on. Disclosures of concentration of credit risk by industries, regions and collaterals were as follows:
(a) IndustryUnit: In million of TWD; %
Industry typeDecember 31, 2016 December 31, 2015
Book Value(Note 1) % Book Value
(Note 2) %
Finance and insurance $ 1,409,055 36.98% 1,371,945 35.80%Individuals 853,804 22.41% 833,697 21.76%Manufacturing 370,483 9.72% 375,421 9.80%Government Agencies 475,771 12.49% 520,066 13.57%Electricity and gas supply 130,645 3.43% 122,013 3.18%Shipping, warehousing and communications 100,166 2.63% 108,289 2.83%
Others 470,203 12.34% 500,636 13.06%Total $ 3,810,127 100.00% 3,832,067 100.00%
Note 1: December 31, 2016
(1) The carrying amounts include loans ($2,307,049 million), call loans to banks, overdraft of banks and placement with banks ($265,934 million), security investments ($1,237,144 million) and so on. Loans refer to discounts, overdrafts, government overdrafts, secured overdrafts, short-term loans, short-term secured loans, medium-term loans, medium-term secured loans, long-term loans, long-term secured loans, import bill advance and nonperforming loans ($4,749 million). Security investments include bonds and stocks. Bonds are measured at fair value. However, the bonds classified as held-to-maturity financial assets or bond investments in non-active market are carried at cost. Equity investments are measure at fair value but those classified as cost of long-term equity investments under the equity method and financial assets carried at cost are measured at cost.
(2) This table excludes the Department of Government Employees Insurance and the subsidiary, BankTaiwan Insurance Brokers.
Note 2: December 31, 2015
(1) The carrying amounts include loans ($2,414,484 million), call loans to banks, overdraft of banks and placement with banks ($230,200 million), security investments ($1,187,383 million) and so on. Loans refer to discounts, overdrafts, government overdrafts, secured overdrafts, short-term loans, short-term secured loans, medium-term loans, medium-term secured loans, long-term loans, long-term secured loans, import bill advance and nonperforming loans ($4,408 million). Security investments include bonds and stocks. Bonds are measured at fair value. However, the bonds classified as held-to-maturity financial assets or bond investments in non-active market are carried at cost. Equity investments are measure at fair value but those classified as cost of long-term equity investments under the equity method and financial assets carried at cost are measured at cost.
(2) This table excludes the Department of Government Employees Insurance and the subsidiary, BankTaiwan Insurance Brokers.

2016 ANNUAL REPORT
BANK FTAIWAN
151150
(b) RegionUnit: In million of TWD; %
Areas typeDecember 31, 2016 December 31, 2015
Book Value(Note 1) % Book Value(Note 2) %Domestic $ 3,339,650 87.65% 3,369,995 87.94%Foreign 470,477 12.35% 462,072 12.06%Total $ 3,810,127 100.00% 3,832,067 100.00%
Note 1: December 31, 2016
(1) The carrying amounts include loans ($2,307,049 million), call loans to banks, overdraft of banks and placement with banks ($265,934 million), security investments ($1,237,144 million) and so on. Loans refer to discounts, overdrafts, government overdrafts, secured overdrafts, short-term loans, short-term secured loans, medium-term loans, medium-term secured loans, long-term loans, long-term secured loans, import bill advance and nonperforming loans ($4,749 million). Security investments include bonds and stocks. Bonds are measured at fair value. However, the bonds classified as held-to-maturity financial assets or bond investments in non-active market are carried at cost. Equity investments are measure at fair value but those classified as cost of long-term equity investments under the equity method and financial assets carried at cost are measured at cost.
(2) This table excludes the Department of Government Employees Insurance and the subsidiary, BankTaiwan Insurance Brokers.
Note 2: December 31, 2015
(1) The carrying amounts include loans ($2,414,484 million), call loans to banks, overdraft of banks and placement with banks ($230,200 million), security investments ($1,187,383 million) and so on. Loans refer to discounts, overdrafts, government overdrafts, secured overdrafts, short-term loans, short-term secured loans, medium-term loans, medium-term secured loans, long-term loans, long-term secured loans, import bill advance and nonperforming loans ($4,408 million). Security investments include bonds and stocks. Bonds are measured at fair value. However, the bonds classified as held-to-maturity financial assets or bond investments in non-active market are carried at cost. Equity investments are measure at fair value but those classified as cost of long-term equity investments under the equity method and financial assets carried at cost are measured at cost.
(2) This table excludes the Department of Government Employees Insurance and the subsidiary, BankTaiwan Insurance Brokers.
(c) CollateralUnit: In million of TWD; %
Type of collateralDecember 31, 2016 December 31, 2015
Book Value(Note 1) % Book Value(Note 1) %Non-secured $ 973,737 42.21% 1,103,390 45.70%Secured 1,333,312 57.79% 1,311,094 54.30%
Guarantee 164,646 7.14% 164,626 6.82%Securities 89,334 3.87% 101,862 4.22%Real estate 1,006,275 43.62% 966,540 40.03%Chattel 72,864 3.15% 77,840 3.22%Valuables 193 0.01% 226 0.01%
Total $ 2,307,049 100.00% 2,414,484 100.00%
Note 1: The carrying amounts only contain loans which refer to discounts, overdrafts, government overdrafts, secured overdrafts, short-term loans, short-term secured loans, medium-term loans, medium-term secured loans, long-term loans, long-term secured loans, import bill advance and non-performing loans ($4,749 million at December 31, 2016; $4,408 million at December 31, 2015).
Note 2: This table excludes the Department of Government Employees Insurance and the subsidiary, BankTaiwan Insurance Brokers.

151150
Financial Information
7. The analysis of credit quality and impairment of financial instruments
The financial instruments held by the Bank, such as cash and cash equivalents, due to the Central Bank and other banks, financial assets measured at fair value through profit, bills and bonds purchased under resell agreements, guarantees deposits paid, operating guarantee deposits and settlement funds, are considered to have “very low risk” since all counterparties have good credit ratings.
(a) The credit quality of loans and receivablesUnit: In thousand of TWD
December 31, 2016Performing loans NPL but
not impair amount(B)
ImpairmentAmount(C)
Total(A)+(B)+(C)
Impairment loss(D)Net
(A)+(B)+(C)-(D)Very good Good Medium Weak Non-evaluate Subtotal(A)With
objectiveNo objective
Account receivablesCredit card
business 261,909 84,243 119,903 342,867 413 809,335 26,871 9,744 845,950 6,650 697 838,603
Others 374,308 2,647,760 1,192,862 351,260 305,845 4,872,035 220,896 5,092,931 144,688 67,677 4,880,566Loans and Discounts 175,802,682 1,243,583,117 560,255,867 164,977,714 143,647,262 2,288,266,642 18,782,651 2,307,049,293 10,325,824 22,486,963 2,274,236,506
December 31, 2015Performing loans NPL but
not impair amount(B)
ImpairmentAmount(C)
Total(A)+(B)+(C)
Impairment loss(D)Net
(A)+(B)+(C)-(D)Very good Good Medium Weak Non-evaluate Subtotal(A)With
objectiveNo objective
Account receivablesCredit card business 178,934 56,749 92,601 72,150 472,541 872,975 26,205 7,618 906,798 4,692 733 901,373
Others 783,181 5,028,261 2,289,334 690,514 578,137 9,369,427 144,835 9,514,262 89,033 93,344 9,331,885Loans and Discounts 200,281,483 1,285,867,727 585,447,137 176,583,911 147,845,769 2,396,026,027 18,458,238 2,414,484,265 9,294,867 18,590,603 2,386,598,795
(b) Credit quality analysis for either overdue nor impaired bill purchases discounts and loans by customersUnit: In thousand of TWD
December 31, 2016 Performing loansVery good Good Medium Weak Non-evaluate Total
Government agencies 70,263,218 289,673,990 - - - 359,937,208Financial, investment, andinsurance industries 16,750,000 9,413,719 31,207,584 3,230,748 746,961 61,349,012
Corporate and business 84,476,184 119,075,878 452,992,586 134,103,274 27,387,743 818,035,665Individuals - 808,288,362 7,895,469 - 29,093,548 845,277,379Others 4,313,280 17,131,168 68,160,228 27,643,692 86,419,010 203,667,378Total 175,802,682 1,243,583,117 560,255,867 164,977,714 143,647,262 2,288,266,642
December 31, 2015 Performing loansVery good Good Medium Weak Non-evaluate Total
Government agencies 91,373,411 352,188,283 - - - 443,561,694Financial, investment, andinsurance industries 17,050,000 13,330,517 33,424,359 678,637 187,194 64,670,707
Corporate and business 88,604,410 108,358,106 480,833,271 142,431,885 21,680,262 841,907,934Individuals - 788,888,251 7,010,729 - 29,599,112 825,498,092Others 3,253,662 23,102,570 64,178,778 33,473,389 96,379,201 220,387,600Total 200,281,483 1,285,867,727 585,447,137 176,583,911 147,845,769 2,396,026,027

2016 ANNUAL REPORT
BANK FTAIWAN
153152
(c) Credit quality analysis for security investments
December 31, 2016Unit: In thousand of TWD
Item
Performing loansNPL but
not impair amount(B)
Impairment Amount(C)
Total(A)+(B)+(C)
(D)
Net (A)+(B)+(C)-(D)Very good Good Medium Weak Non-evaluate Subtotal(A)
With objective evidence
Available-for-sale Financial Assets
Bond investment 83,620,167 33,740,890 14,988,676 1,413,145 770,842 134,533,720 - - 134,533,720 - 134,533,720
Stock investment 669,899 36,937,457 11,314,924 - 2,783,830 51,706,110 - 51,706,110 - 51,706,110
Others 847,417,427 1,262,204 2,642,040 - 279,840 851,601,511 - 851,601,511 - 851,601,511
Held-to-maturity Financial Assets
Bond investment 117,251,810 1,968,018 3,109,631 644,269 - 122,973,728 - 122,973,728 - 122,973,728
Others 13,325,831 - 1,868,370 940,737 - 16,134,938 - 16,134,938 - 16,134,938
Other financial assets
Stock investment - - 6,805,780 12,501 1,750,857 8,569,138 27,687 8,596,825 15,000 8,581,825
Bond investment 13,291,193 2,441,472 - - - 15,732,665 - 15,732,665 - 15,732,665
December 31, 2015Unit: In thousand of TWD
Item
Performing loansNPL but
not impair amount(B)
Impairment Amount(C)
Total(A)+(B)+(C)
(D)
Net (A)+(B)+(C)-(D)Very good Good Medium Weak Non-evaluate Subtotal(A)
With objective evidence
Available-for-sale Financial Assets
Bond investment 72,856,020 27,456,586 12,559,564 976,992 798,992 114,648,154 - - 114,648,154 - 114,648,154
Stock investment 1,207,484 34,192,868 11,215,052 - 1,697,328 48,312,732 - 48,312,732 - 48,312,732
Others 888,013,335 658,246 1,315,068 - 651,175 890,637,824 - 890,637,824 - 890,637,824
Held-to-maturity Financial Assets
Bond investment 80,297,028 3,352,805 4,625,106 927,755 - 89,202,694 - 89,202,694 - 89,202,694
Others 21,993,358 - 1,604,128 986,211 - 24,583,697 - 24,583,697 - 24,583,697
Other financial assets
Stock investment - - 6,805,780 12,501 1,750,857 8,569,138 27,687 8,596,825 15,000 8,581,825
Bond investment 3,122,135 2,284,580 - - - 5,406,715 - 5,406,715 - 5,406,715
8. Aging analysis of overdue but not impaired financial assetsUnit: In thousand of TWD
ItemDecember 31, 2016
Overdue less than 1 month Overdue 1 to 3 months TotalAccounts Receivable
– Credit Card Business $ 3,175 3,305 6,480
Unit: In thousand of TWD
ItemDecember 31, 2015
Overdue less than 1 month Overdue 1 to 3 months Total
Accounts Receivable
– Credit Card Business $ 2,715 3,065 5,780

153152
Financial Information
9. The analysis of allowance for doubtful accounts of loans and receivables
Loans
December 31, 2016
Item Total Loans Allowance for doubtful accounts
There is objective evidence of impairment on individual asset
Individual assessment of impairment 6,554,812 1,337,971
Collective assessment of impairment 12,227,839 3,392,253
There is no objective evidence of impairment on individual asset
Collective assessment of impairment 2,288,266,640 28,082,563
Subtotal 2,307,049,291 32,812,787
Receivables (including other financial assets)
December 31, 2016
Item Total Loans Allowance for doubtful accounts
There is objective evidence of impairment on individual asset
Individual assessment of impairment 26,334 8,084
Collective assessment of impairment 229,610 149,869
There is no objective evidence of impairment on individual asset
Collective assessment of impairment 335,575,225 143,765
Subtotal 335,831,169 301,718Total 33,114,505
Loans
December 31, 2015
Item Total Loans Allowance for doubtful accounts
There is objective evidence of impairment on individual asset
Individual assessment of impairment 6,702,400 1,585,017
Collective assessment of impairment 11,755,838 3,542,567
There is no objective evidence of impairment on individual asset
Collective assessment of impairment 2,396,026,027 22,757,886
Subtotal 2,414,484,265 27,885,470
Receivables (including other financial assets)
December 31, 2015
Item Total Loans Allowance for doubtful accounts
There is objective evidence of impairment on individual asset
Individual assessment of impairment 1,194,223 1,185,506
Collective assessment of impairment 160,240 84,618
There is no objective evidence of impairment on individual asset
Collective assessment of impairment 281,051,164 174,351
Subtotal 282,405,627 1,444,475Total 29,329,945

2016 ANNUAL REPORT
BANK FTAIWAN
155154
10. Disclosures required by the Regulations Governing the Preparation of Financial Reports by Public Banks
(a) Asset Quality of overdue loans and receivables
December 31, 2016
Type / ItemAmount of
overdue loans (Note 1)
Total amount of loans
Ratio (%)(Note 2)
Allowance for doubtful debt
Coverage ratio(%)(Note 3)
EnterpriseSecured 1,825,875 569,790,985 0.32% 10,715,741 586.88%Non secured 704,723 939,146,795 0.08% 12,809,461 1,817.66%
Consumer finance
House mortgage (Note 4) 1,799,702 550,621,979 0.33% 5,835,403 324.24%Cash card - - -% - -%Micro credit (Note 5) 32,367 5,135,618 0.63% 144,878 447.61%
Others(Note 6)
Secured 1,339,404 212,898,316 0.63% 2,731,454 203.93%Non secured 236,607 29,455,598 0.80% 575,850 243.38%
Total 5,938,678 2,307,049,291 0.26% 32,812,787 552.53%Overdue
receivablesAccount
receivable Ratio (%) Allowance for bad debt Cover ratio
Credit card business 4,088 847,454 0.48% 12,432 304.11%Non-recourse factoring (Note 7) - 9,359,683 -% 51,582 -%
December 31, 2015
Type / ItemAmount of
overdue loans (Note 1)
Total amount of loans
Ratio (%)(Note 2)
Allowance for doubtful debt
Coverage ratio(%)(Note 3)
EnterpriseSecured 1,706,533 575,321,952 0.30% 9,185,538 538.26%Non secured 619,452 1,065,158,902 0.06% 10,140,647 1,637.04%
Consumer
House mortgage (Note 4) 1,765,865 525,972,421 0.34% 5,529,527 313.13%Cash card - - -% - -%Micro credit (Note 5) 27,166 5,486,791 0.50% 108,010 397.59%
Others(Note 6)
Secured 1,254,761 209,799,744 0.60% 2,450,531 195.30%Non secured 229,168 32,744,455 0.70% 471,217 205.62%
Total 5,602,945 2,414,484,265 0.23% 27,885,470 497.69%Overdue
receivablesAccount
receivable Ratio (%) Allowance for doubtful debt Cover ratio
Credit card business 2,593 864,717 0.30% 11,446 441.42%Non-recourse factoring (Note 7) - 9,973,986 -% 71,485 -%
Note 1: Nonperforming loans are reported to the authorities and disclosed to the public, as required by the “Regulations Governing the Procedures for Banking Institutions to Evaluate Assets and Deal with Nonperforming/Non-accrued Loans.” Nonperforming credit card receivables are reported to the authorities and disclosed to the public, as required by the Banking Bureau’s letter dated July 6, 2005 (Ref. No. 0944000378).
Note 2:Ratio of nonperforming loans: Nonperforming loans÷Outstanding loan balance. Ratio of nonperforming credit card receivables: Nonperforming credit card receivables÷Outstanding credit card receivables balance.
Note 3: Coverage ratio of loans: Allowance for possible losses for loans÷Nonperforming loans. Coverage ratio of credit card receivables: Allowance for possible losses for credit card receivables÷Nonperforming credit card receivables.
Note 4: The mortgage loan is for house purchase or renovation and is fully secured by housing that is purchased (owned) by the borrower, the spouse or the minor children of the borrowers.
Note 5: Based on the Banking Bureau’s letter dated December 19, 2005 (Ref. No. 09440010950), small-scale credit loans are unsecured, involve small amounts, and exclude credit cards and cash cards.
Note 6: Other consumer banking loans refer to secured or unsecured loans that exclude housing mortgages, cash cards, credit cards and small- scale credit loans.
Note 7: As required by the Banking Bureau in its letter dated July 19, 2005 (Ref. No. 0945000494), non-recourse factoring are reported as nonperforming receivables within three months after the factors or insurance companies refuse to indemnify banks for any liabilities on these accounts.
Note 8: Include secured and non secured loans for government institutions.

155154
Financial Information
(b) Non-performing Loans and Overdue Receivables Exempted from ReportingUnit: In thousand of TWD
December 31, 2016 December 31, 2015
Excluded NPL Excluded overdue receivables Excluded NPL Excluded overdue
receivablesAs a result of debt consultation and loans agreement 707 - 950 -
As a result of debt solvency and restart plan 38,692 22,192 50,562 22,703
Total 39,399 22,192 51,512 22,703
(c) Concentration of Credit RiskUnit: In million of TWD; %
December 31, 2016
Rank Group Name Credit Extensions Balance % of Net Asset Value
1 A company – Transport via Railways 63,823 23.26%2 B group – Air Transport 45,963 16.75%3 C group – Manufacture of Petroleum and Coal Products 33,065 12.05%4 D group – Rolling, Extruding and Drawing of Aluminum 22,964 8.37%5 E group – Real Estate Development Activities 16,417 5.98%6 F group – Ocean Transportation 15,394 5.61%7 G group – Manufacture of Made-up Textile Articles 12,943 4.72%8 H group – Manufacture of Made-up Textile Articles 12,356 4.50%9 I group – Ocean Transportation 12,298 4.48%
10 J group – Manufacture of Liquid Crystal Panel and Components 12,079 4.40%
December 31, 2015
Rank Group Name Credit Extensions Balance % of Net Asset Value
1 A company – Transport via Railways 70,068 27.49%2 B group – Manufacture of Petroleum and Coal Products 38,541 15.12%3 C group – Air Transport 35,762 14.03%4 D group – Smelting and Refining of Iron and Steel 27,704 10.87%5 E group – Real Estate Development Activities 16,682 6.55%6 F group – Other Retail Sale in Non-specialized Stores 16,131 6.33%7 G group – Manufacture of Made-up Textile Articles 15,337 6.02%
8 H group – Manufacture of Liquid Crystal Panel and Components 14,511 5.69%
9 I group – Real Estate Activities for Sale and Rental with Own or Leased Property 12,949 5.08%
10 J group – Ocean Transportation 12,633 4.96%
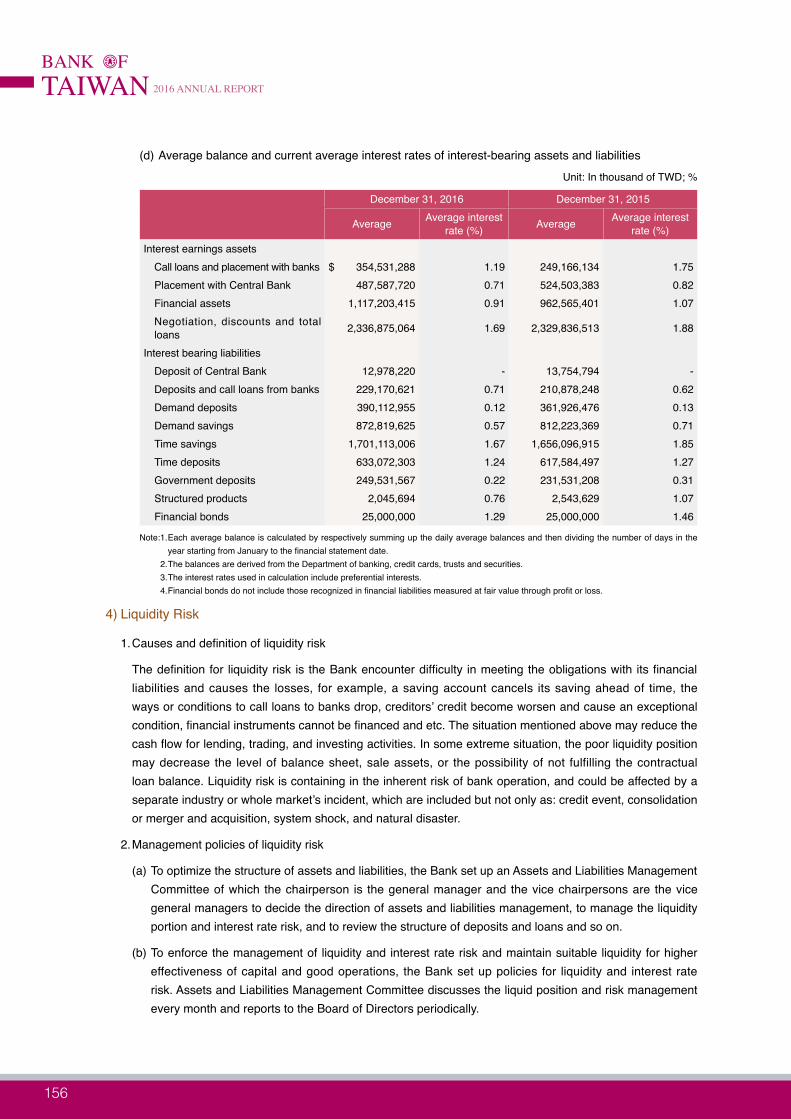
2016 ANNUAL REPORT
BANK FTAIWAN
157156
(d) Average balance and current average interest rates of interest-bearing assets and liabilitiesUnit: In thousand of TWD; %
December 31, 2016 December 31, 2015
Average Average interest rate (%) Average Average interest
rate (%)Interest earnings assets
Call loans and placement with banks $ 354,531,288 1.19 249,166,134 1.75Placement with Central Bank 487,587,720 0.71 524,503,383 0.82Financial assets 1,117,203,415 0.91 962,565,401 1.07Negotiation, discounts and total loans 2,336,875,064 1.69 2,329,836,513 1.88
Interest bearing liabilitiesDeposit of Central Bank 12,978,220 - 13,754,794 -Deposits and call loans from banks 229,170,621 0.71 210,878,248 0.62Demand deposits 390,112,955 0.12 361,926,476 0.13Demand savings 872,819,625 0.57 812,223,369 0.71Time savings 1,701,113,006 1.67 1,656,096,915 1.85Time deposits 633,072,303 1.24 617,584,497 1.27Government deposits 249,531,567 0.22 231,531,208 0.31Structured products 2,045,694 0.76 2,543,629 1.07Financial bonds 25,000,000 1.29 25,000,000 1.46
Note:1. Each average balance is calculated by respectively summing up the daily average balances and then dividing the number of days in the year starting from January to the financial statement date.
2. The balances are derived from the Department of banking, credit cards, trusts and securities.3. The interest rates used in calculation include preferential interests.4. Financial bonds do not include those recognized in financial liabilities measured at fair value through profit or loss.
4) Liquidity Risk
1. Causes and definition of liquidity risk
The definition for liquidity risk is the Bank encounter difficulty in meeting the obligations with its financial liabilities and causes the losses, for example, a saving account cancels its saving ahead of time, the ways or conditions to call loans to banks drop, creditors’ credit become worsen and cause an exceptional condition, financial instruments cannot be financed and etc. The situation mentioned above may reduce the cash flow for lending, trading, and investing activities. In some extreme situation, the poor liquidity position may decrease the level of balance sheet, sale assets, or the possibility of not fulfilling the contractual loan balance. Liquidity risk is containing in the inherent risk of bank operation, and could be affected by a separate industry or whole market’s incident, which are included but not only as: credit event, consolidation or merger and acquisition, system shock, and natural disaster.
2. Management policies of liquidity risk
(a) To optimize the structure of assets and liabilities, the Bank set up an Assets and Liabilities Management Committee of which the chairperson is the general manager and the vice chairpersons are the vice general managers to decide the direction of assets and liabilities management, to manage the liquidity portion and interest rate risk, and to review the structure of deposits and loans and so on.
(b) To enforce the management of liquidity and interest rate risk and maintain suitable liquidity for higher effectiveness of capital and good operations, the Bank set up policies for liquidity and interest rate risk. Assets and Liabilities Management Committee discusses the liquid position and risk management every month and reports to the Board of Directors periodically.
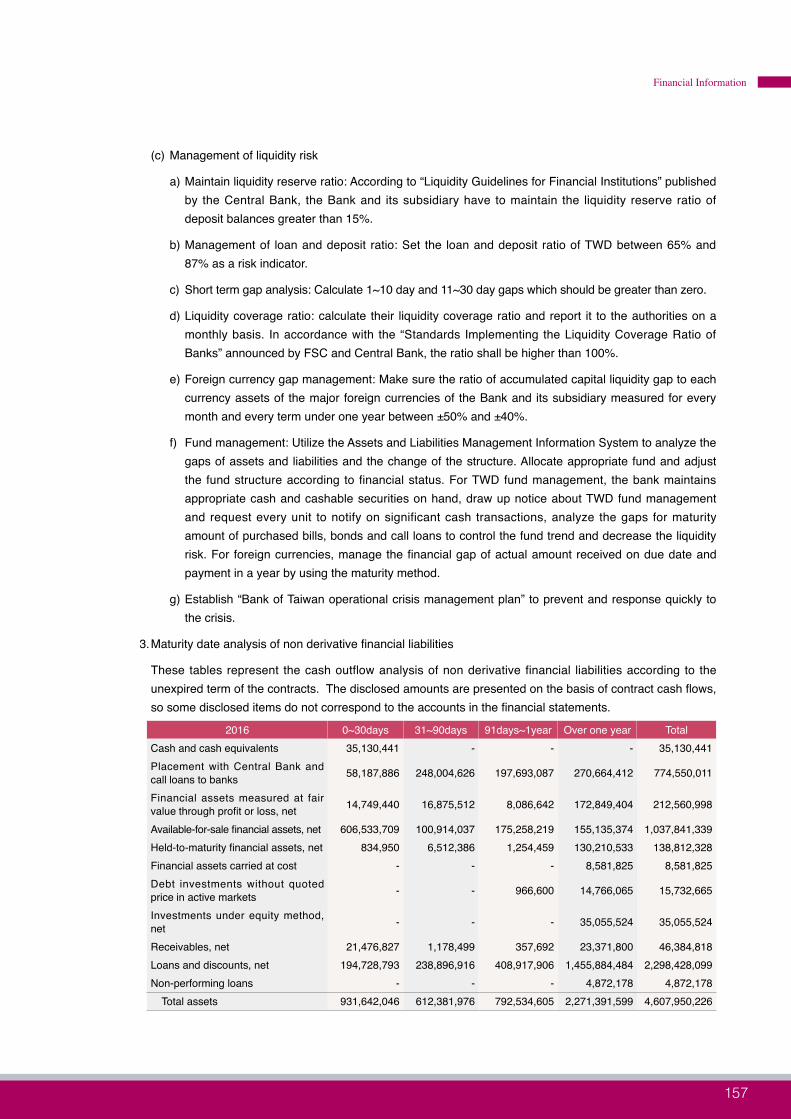
157156
Financial Information
(c) Management of liquidity risk
a) Maintain liquidity reserve ratio: According to “Liquidity Guidelines for Financial Institutions” published by the Central Bank, the Bank and its subsidiary have to maintain the liquidity reserve ratio of deposit balances greater than 15%.
b) Management of loan and deposit ratio: Set the loan and deposit ratio of TWD between 65% and 87% as a risk indicator.
c) Short term gap analysis: Calculate 1~10 day and 11~30 day gaps which should be greater than zero.
d) Liquidity coverage ratio: calculate their liquidity coverage ratio and report it to the authorities on a monthly basis. In accordance with the “Standards Implementing the Liquidity Coverage Ratio of Banks” announced by FSC and Central Bank, the ratio shall be higher than 100%.
e) Foreign currency gap management: Make sure the ratio of accumulated capital liquidity gap to each currency assets of the major foreign currencies of the Bank and its subsidiary measured for every month and every term under one year between ±50% and ±40%.
f) Fund management: Utilize the Assets and Liabilities Management Information System to analyze the gaps of assets and liabilities and the change of the structure. Allocate appropriate fund and adjust the fund structure according to financial status. For TWD fund management, the bank maintains appropriate cash and cashable securities on hand, draw up notice about TWD fund management and request every unit to notify on significant cash transactions, analyze the gaps for maturity amount of purchased bills, bonds and call loans to control the fund trend and decrease the liquidity risk. For foreign currencies, manage the financial gap of actual amount received on due date and payment in a year by using the maturity method.
g) Establish “Bank of Taiwan operational crisis management plan” to prevent and response quickly to the crisis.
3. Maturity date analysis of non derivative financial liabilities
These tables represent the cash outflow analysis of non derivative financial liabilities according to the unexpired term of the contracts. The disclosed amounts are presented on the basis of contract cash flows, so some disclosed items do not correspond to the accounts in the financial statements.
2016 0~30days 31~90days 91days~1year Over one year TotalCash and cash equivalents 35,130,441 - - - 35,130,441Placement with Central Bank and call loans to banks 58,187,886 248,004,626 197,693,087 270,664,412 774,550,011
Financial assets measured at fair value through profit or loss, net 14,749,440 16,875,512 8,086,642 172,849,404 212,560,998
Available-for-sale financial assets, net 606,533,709 100,914,037 175,258,219 155,135,374 1,037,841,339Held-to-maturity financial assets, net 834,950 6,512,386 1,254,459 130,210,533 138,812,328Financial assets carried at cost - - - 8,581,825 8,581,825Debt investments without quoted price in active markets - - 966,600 14,766,065 15,732,665
Investments under equity method, net - - - 35,055,524 35,055,524
Receivables, net 21,476,827 1,178,499 357,692 23,371,800 46,384,818Loans and discounts, net 194,728,793 238,896,916 408,917,906 1,455,884,484 2,298,428,099Non-performing loans - - - 4,872,178 4,872,178
Total assets 931,642,046 612,381,976 792,534,605 2,271,391,599 4,607,950,226

2016 ANNUAL REPORT
BANK FTAIWAN
159158
2016 0~30days 31~90days 91days~1year Over one year TotalDeposits of Central Bank and other banks 101,040,170 34,964,693 31,822,400 59,769,551 227,596,814
Payables 19,036,632 48,202 77,110 22,863,327 42,025,271Financial liabilities measured at fair value through profit or loss - - - 6,709,063 6,709,063
Bonds and bills sold under repurchase agreements 1,930,925 9,136,811 270,178 - 11,337,914
Other financial liabilities 667,849 25,003 - 56,003 748,855Deposits and remittances 323,985,682 393,903,349 143,891,262 3,012,202,471 3,873,982,764
Total liabilities 446,661,258 438,078,058 176,060,950 3,101,600,415 4,162,400,681
2015 0~30days 31~90days 91days~1year Over one year TotalCash and cash equivalents 26,574,387 - - - 26,574,387Placement with Central Bank and call loans to banks 100,381,382 245,760,589 236,305,247 112,420,041 694,867,259
Financial assets measured at fair value through profit or loss, net 13,578,657 3,879,989 5,655,286 149,891,273 173,005,205
Bonds and bills purchased under resell agreements 50,040 - - - 50,040
Available-for-sale financial assets, net 609,671,736 54,123,756 260,718,506 129,084,712 1,053,598,710Held-to-maturity financial assets, net 1,108,095 7,001,402 4,309,493 101,367,401 113,786,391Financial assets carried at cost - - - 8,581,825 8,581,825Debt investments without quoted price in active markets - - - 5,406,715 5,406,715
Investments under equity method, net - - - 35,856,579 35,856,579Receivables, net 29,664,877 989,312 1,278,057 19,924,859 51,857,105Loans and discounts, net 209,868,308 221,996,610 478,162,348 1,495,486,008 2,405,513,274Non-performing loans - - - 4,456,007 4,456,007
Total assets 990,897,482 533,751,658 986,428,937 2,062,475,420 4,573,553,497Deposits of Central Bank and other banks 113,824,750 44,216,680 37,964,942 29,419,145 225,425,517
Payables 26,757,952 63 943,623 14,927,044 42,628,682Financial liabilities measured at fair value through profit or loss 12,636 3,479 3,858 39,204,502 39,224,475
Bonds and bills sold under repurchase agreements 10,912,656 4,847,062 576,901 - 16,336,619
Other financial liabilities 1,619,185 101,345 - 64,900 1,785,430Deposits and remittances 345,202,053 420,489,720 1,211,842,618 1,859,986,025 3,837,520,416
Total liabilities 498,329,232 469,658,349 1,251,331,942 1,943,601,616 4,162,921,139

159158
Financial Information
4. Maturity analysis of derivativesUnit: In thousand of TWD
December 31, 2016
Derivative financial
instruments
1.Overdue less than 1
month
2.Overdue 1 to 3 months
3.Overdue 3 to 6 months
4.Overdue 6 months to 1 year
5.Overdue 1 to 5 years
6.Overdue more than
5 yearsTotal
Financial assets and liabilities measured at fair value through profit or loss, Derivative instruments (Foreign exchange)Foreign exchange outflow 16,007,441 15,653,076 2,552,111 728,858 427,462 - 35,368,948
Foreign exchange inflow 16,010,653 15,653,072 2,552,111 728,858 427,462 - 35,372,156
Financial assets and liabilities measured at fair value through profit or loss, Derivative instruments (Interest)Foreign exchange outflow 460,559,109 382,003,567 155,951,545 28,889,785 5,643,435 - 1,033,047,441
Foreign exchange inflow 483,945,507 398,872,859 168,338,659 39,902,553 5,575,269 - 1,096,634,847
Hedging derivative financial instruments (Interest)Foreign exchange outflow - - - - - - -
Foreign exchange inflow - 1,089 - - - - 1,089
Unit: In thousand of TWD
December 31, 2015
Derivative financial
instruments
1.Overdue less than 1
month
2.Overdue 1 to 3 months
3.Overdue 3 to 6 months
4.Overdue 6 months to
1 year
5.Overdue 1 to 5 years
6.Overdue more than 5
yearsTotal
Financial assets and liabilities measured at fair value through profit or loss, Derivative instruments (Foreign exchange)Foreign exchange outflow 12,238,343 11,849,387 4,757,998 1,453,250 451,401 - 30,750,379
Foreign exchange inflow 12,237,184 11,849,108 4,757,998 1,453,250 451,401 - 30,748,941
Financial assets and liabilities measured at fair value through profit or loss, Derivative instruments (Interest)Foreign exchange outflow 491,114,868 359,974,859 136,238,917 49,807,068 (480,455) 245,021 1,036,900,278
Foreign exchange inflow 510,220,229 373,416,695 142,768,841 76,366,129 3,496,416 - 1,106,268,310
Hedging derivative financial instruments (Interest)Foreign exchange outflow 19,700 110,463 71,241 - - - 201,404
Foreign exchange inflow 11,054 51,315 36,757 - - - 99,126

2016 ANNUAL REPORT
BANK FTAIWAN
161160
5. Maturity analysis of off-balance sheet items
If the off-balance credit items of the Bank and its subsidiary are classified as “Under One Year”, “One to Five Years” and “Above Five Years”, the maturity analysis of both off-balance items and lease agreements and capital expenditures are disclosed together.
Unit: In thousand of TWD
December 31, 2016 0-30 days 31-90 days 91-180 days 181 days-1 year Over 1 year Total
Irrevocable loan commitment - 171,086,300 91,170 168,964,907 4,311,062 344,453,439
Irrevocable credit card commitment - - - - 145,626 145,626
Unused letter of credit 6,359,406 1,708,362 4,523,176 13,396,273 2,942,243 28,929,460Guarantee receivables 53,633,221 3,422,482 5,149,124 5,598,768 7,878,560 75,682,155
Total 59,992,627 176,217,144 9,763,470 187,959,948 15,277,491 449,210,680
Unit: In thousand of TWD
December 31, 2015 0-30 days 31-90 days 91-180 days 181 days-1 year Over 1 year Total
Irrevocable loan commitment 487,650 16,628,101 1,415,396 289,399,670 218,158,086 526,088,903
Irrevocable credit card commitment - - - - 160,645 160,645
Unused letter of credit 14,265,854 1,215,206 5,617,940 6,944,844 2,689,992 30,733,836Guarantee receivables 62,026,841 2,578,657 4,640,207 1,839,581 9,244,810 80,330,096
Total 76,780,345 20,421,964 11,673,543 298,184,095 230,253,533 637,313,480
6. Maturity analysis of lease agreements and capital expenditures
The lease agreements of the Bank and its subsidiary refer to operational lease.
Maturity analysis of lease agreements and capital expenditures were as follows:
December 31, 2016 Less than 1 year 1-5 years Over 5 years TotalLease agreements
Operating lease payments (Lessee) (353,773) (731,209) - (1,084,982)Operating lease income (Lessor) 152,489 109,502 - 261,991
Total (201,284) (621,707) - (822,991)
December 31, 2015 Less than 1 year 1-5 years Over 5 years TotalLease agreements
Operating lease payments (Lessee) (378,372) (627,858) - (1,006,230)Operating lease income (Lessor) 137,953 151,245 - 289,198
Total (240,419) (476,613) - (717,032)

161160
Financial Information
7. Disclosures required by the “Regulations Governing the Preparation of Financial Reports by Public Banks”
(a) Maturity analysis of assets and liabilities (New Taiwan Dollars)
December 31, 2016Unit: In thousand of TWD
TotalAmount for each remaining period to maturity
Less than 10 days 11~30 days 31~90 days 91~180 days 181~365 days Over 1 year
Major matured capital inflow $ 4,040,338,530 311,399,548 737,168,092 652,255,605 343,306,304 442,509,506 1,553,699,475
Major matured capital outflow 4,262,128,400 155,002,003 374,300,680 596,221,167 543,802,825 916,752,263 1,676,049,462
Capital gap (221,789,870) 156,397,545 362,867,412 56,034,438 (200,496,521) (474,242,757) (122,349,987)
December 31, 2015Unit: In thousand of TWD
TotalAmount for each remaining period to maturity
Less than 10 days 11~30 days 31~90 days 91~180 days 181~365 days Over 1 year
Major matured capital inflow $ 3,984,098,202 337,915,856 652,414,855 565,558,126 361,230,114 546,056,749 1,520,922,502
Major matured capital outflow 4,251,497,044 165,729,525 347,433,709 560,235,640 500,876,175 938,030,784 1,739,191,211
Capital gap (267,398,842) 172,186,331 304,981,146 5,322,486 (139,646,061) (391,974,035) (218,268,709)
(b) Maturity analysis of assets and liabilities (United State Dollars)
December 31, 2016Unit: In thousand of USD
TotalAmount for each remaining period to maturity
Less than 30 days 31~90 days 91~180 days 181~365
days Over 1 year
Major matured capital inflow $ 41,235,359 13,366,111 10,309,276 5,360,255 2,941,194 9,258,523
Major matured capital outflow 41,235,359 16,271,096 11,089,307 4,442,059 3,338,991 6,093,906
Capital gap - (2,904,985) (780,031) 918,196 (397,797) 3,164,617
December 31, 2015Unit: In thousand of USD
TotalAmount for each remaining period to maturity
Less than 30 days 31~90 days 91~180 days 181~365
days Over 1 year
Major matured capital inflow $ 45,983,000 16,709,602 9,740,900 5,826,801 4,883,939 8,821,758
Major matured capital outflow 45,983,000 20,038,883 10,755,802 4,260,065 4,001,894 6,926,356
Capital gap - (3,329,281) (1,014,902) 1,566,736 882,045 1,895,402

2016 ANNUAL REPORT
BANK FTAIWAN
163162
5) Market risk
1. Causes and definition of market risk
Market risk means the changes in market price that lead to the fair value and future cash flow volatility risk of the held financial instruments, even if it is not included in the financial statements. The risk factors usually refer to interest rate, exchange rate, equity investment and price. When the factors change, the Bank net operating income and the value of investment portfolio will have volatility risk.
The main market risks of the Bank are interest rate risk, exchange rate risk and equity investment risk. The main position of interest rate risk includes transactions with conditions, bonds, securities investments, interest rate swaps and so on. The main position of exchange risks includes forward exchange, foreign exchange swaps, FX options and so on. The main position of equity investment risk includes stocks, funds, stock market index futures and so on.
2. Management policies of market risk
The Bank set up market risk management regulations and policies according to the risk management strategies approved by the Board of Directors, the Basel Accord and government regulations. In order to identify, assess, measure and monitor various risks of investments, they also decide the quota of investments and stop-loss point for financial instruments by types and characteristics in accordance with whole management target and offer reports to the Board of Directors, risk management committee and high-level managers.
3. Procedures of market risk management
(a) Identification
The identification procedures are as follows. First, use the business analysis or product analysis to identity the market risk factors of financial instruments. Second, measure the market risk of all financial instruments according to the risk factors changes of the important exposure. Finally, identify the market risk factors of every constitution of structured products and use the factors as the measurement basis. The above risk factors include interest rate, exchange rate and price of equity security.
(b) Measurement
The Bank’s market risk exposure can be classified into trading book and banking book. The financial instruments classified in trading book are measured at market value every day; those classified in banking book are measured at market value at least once a month. Following IFRS 13, the Bank ensures that Level-1 inputs (i.e. quoted prices in an active market, such as OTC or Bloomberg) and Level-2 inputs (those which can be directly or indirectly observed in the market) are available. When the aforementioned inputs are not available, the related instruments shall be classified to Level 3. The sources from which the Bank obtains inputs largely remain the same as prior periods and the Bank will check if a financial instrument can be reasonably measured before entering into a transaction.
(c) Monitor and Report
The Bank conduct various risks monitoring for ordinary trading activities. The monitor includes the control of market risk position and profit and loss, the control of exposure and quota of investments, the control of concentration, the sensitivity analysis and the stress testing. They report to the risk management committee or the Board of Directors to let the directors understand the market risk control status. The Bank also have communication mechanism. Each operating units put forward transaction information to management departments periodically in order to ensure accuracy and effectiveness, and communicate the events when trading amount excesses the quota, important events and abnormal conditions.

163162
Financial Information
4. Management policies of trading book risk
The trading book refers to the financial instruments held for trading or hedging. The positions held for trading mean the positions that are held to earn profit from the buy-sell spread. The positions not belonging to trading book are regarded as banking book.
(a) Policy and Procedure
The Bank formulates “Taiwan Bank Trading Book Management Provision” as important guideline for all trading units.
(b) Valuation Policy
The Bank’s market risk exposure can be classified into trading book and banking book. Following IFRS 13, the Bank ensures that Level-1 inputs (i.e. quoted prices in an active market, such as OTC or Bloomberg) and Level-2 inputs (which can be directly or indirectly observed in the market) are available. When the aforementioned inputs are not available, the related instruments shall be classified to Level 3. The sources from which the Bank obtains inputs largely remain the same as prior periods and the Bank will check if a financial instrument can be reasonably measured before entering into a transaction.
(c) Measurement Method
a) The Bank conduct stress test every quarter under unfavorable economic scenarios which are set up risk factors: equity securities, interest rate, foreign exchange and commodities, setting the scene to calculate possible impacts by inputting different on profit or loss of each risk factor.
b) Check the market price every month.
c) Prepare the risk monitor report to chief director and put it on the Bank’s website as reference.
5. Interest rate risk management for trading book
(a) Definition of interest rate risk
The interest rate risk means the changes of interest rate that lead to the fair value changes or loss. The main products include securities related to interest rate and derivatives.
(b) Procedures of interest rate risk management
The Bank and its subsidiary set quota and stop-loss points for short-term securities, bonds and derivatives related to interest rate. Each trading units measure the market price for the position of trading book every day and submit monthly reports to risk management department and quarterly reports to the risk management committee and the Board of Directors.
(c) Measurement method
The Bank and its subsidiary also use the PV01 and Duration to monitor the influence of interest risk.
6. Interest rate risk management for banking book
The main management purpose is to strengthen the interest rate risk management, increase the effectiveness of capital usage and improve the business.
(a) Strategy
The interest rate risk management increases the Bank flexibility in order to measure, manage and hedge the interest rate risk. The Bank formulate “Liquidity and Interest Rate Management Strategies” to reinforce the management and maintain proper liquidity and adjust the interest rate sensitivity gap for the steady long-term profitability and business growth.

2016 ANNUAL REPORT
BANK FTAIWAN
165164
(b) Management procedure
In order to adapt the economic financial environment changes and to fulfill the capital requirement, the Bank conduct different pricing management strategies, such as adopting variable or fixed interest rate, and use financial futures, foreign exchange swaps, interest rate swaps to manage the interest rate sensitivity gap. To adjust the interest rate sensitivity gap properly, the risk management department monitors the ratio of interest rate sensitivity assets to interest rate sensitivity liabilities, the ratio of TWD capital gap to equity and the interest rate sensitivity gap of foreign exchange, and report monthly to the risk management committee and board of directors.
(c) Measurement method
The Bank use the “Assets and Liabilities Management Information System” to identify interest rate sensitivity assets and liabilities and analyses the maturity gap and changes of maturity structure as the basis of interest rate risk management and pricing strategies. They also make proper financial transfer and adjust the capital structure to lower the liquidity risk and increase the profit.
7. Exchange rate risk management
(a) Definition of exchange rate risk
The exchange rate risk refers to the profit or loss resulted from two different currencies transferred at different times. The Bank exchange rate risk is derived from exchange, forward exchange, FX swaps, cross currency swaps, and foreign exchange options. Because the Bank squares customer’s position every day, the exchange rate does not have any significant risk.
(b) Management procedures and measurement method of exchange rate risk
To control the exchange rate risk, the Bank set different quotas and stop-loss point for employees with different levels and have annual total loss quota to control the loss in a tolerable range.
The Bank conduct stress testing. The simulated situations are ±3% changes of exchange rate for every currency. The relevant statements are disclosed at sensitivity analysis.
8. Equity security risk management
(a) Definition of equity security risk
The market risk of holding equity securities includes the respective risk arising from the market price changes of respective equity security and general market risk resulting from the whole market price changes.
(b) The intention of equity security price risk management
The intention is to avoid loss and worse financial status due to violent fluctuations of equity security price and increase the effectiveness of capital usage and improve the business.
(c) Procedure of equity security price risk management
The Bank and its subsidiary set different investment quotas by industries, enterprises and groups. They use the β value to measure the influence of systematic risk monthly and monitor the risk value of equity securities and unrealized profit/loss ratio every day. The stop-loss point mechanism is approved by the security investment committee and executed by the risk management department.

165164
Financial Information
9. Market risk valuation technique
(a) Interest rate risk sensitivity
The Bank assume that other factors did not change and the yield curve of the whole world moves upward by 100 bps at December 31, 2016 and 2015. Under this assumption, the income after tax will decrease $5,265 million and $1,253 million, respectively, and the other comprehensive income will decrease $5,665 million and $5,339 million, respectively. If the yield curve moves downward by 100 bps, the income after tax will increase $5,935 million and $1,382 million, respectively, and the other comprehensive income will increase $5,966 million and $5,588 million, respectively.
(b) Exchange rate risk sensitivity
The Bank assume that other factors did not change and the foreign currency to New Taiwan Dollars exchange rate appreciates by 3% at December 31, 2016 and 2015. Under this assumption, the income after tax will increase $2,624 million and $2,365 million, respectively, and the other comprehensive income will increase $2,440 million and $1,977 million, respectively.
If the exchange rate depreciates by 3%, the income after tax will decrease $2,624 million and $2,367 million, respectively, and the other comprehensive income will decrease $2,440 million and $1,977 million, respectively.
(c) Equity security price risk sensitivity
The Bank and its subsidiary assume that other factors did not change and the market prices of the equity securities increase by 15% at December 31, 2016 and 2015. Under this assumption, the income after tax will increase $7,648 million and $7,244 million, respectively, and the other comprehensive income will increase $7,779 million and $7,346 million, respectively.
If the market prices decrease by 15 %, the income after tax will decrease $7,648 million and $7,244 million, respectively, and the other comprehensive income will decrease $7,779 million and $7,346 million, respectively.
(d) Sensitivity analysis is as follows:Unit: In million of TWD
December 31, 2016
Main risk Range of changesAmount Influence
Equity Gain or lossInterest rate risk Interest rate curve rise 100BPS (5,665) (5,265)Interest rate risk Interest rate curve fall 100BPS 5,966 5,935Exchange rate risk Other foreign currency/ TWD rise 3% 2,440 2,624Exchange rate risk Other foreign currency/ TWD fall 3% (2,440) (2,624)Price of equity stock risk Price of equity stock rise 15% 7,779 7,648Price of equity stock risk Price of equity stock fall 15% (7,779) (7,648)
Unit: In million of TWD
December 31, 2015
Main risk Range of changesAmount Influence
Equity Gain or lossInterest rate risk Interest rate curve rise 100BPS (5,339) (1,253)Interest rate risk Interest rate curve fall 100BPS 5,588 1,382Exchange rate risk Other foreign currency/ TWD rise 3% 1,977 2,365Exchange rate risk Other foreign currency/ TWD fall 3% (1,977) (2,367)Price of equity stock risk Price of equity stock rise 15% 7,346 7,244Price of equity stock risk Price of equity stock fall 15% (7,346) (7,244)
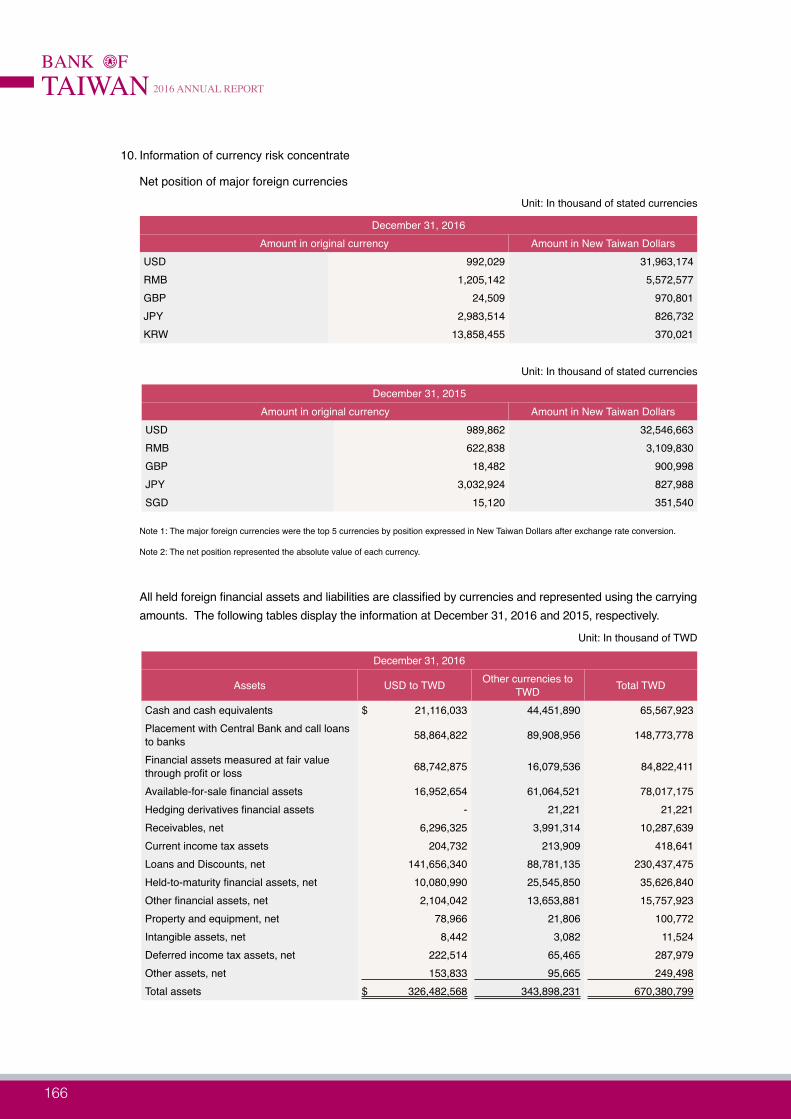
2016 ANNUAL REPORT
BANK FTAIWAN
167166
10. Information of currency risk concentrate
Net position of major foreign currenciesUnit: In thousand of stated currencies
December 31, 2016Amount in original currency Amount in New Taiwan Dollars
USD 992,029 31,963,174RMB 1,205,142 5,572,577GBP 24,509 970,801JPY 2,983,514 826,732KRW 13,858,455 370,021
Unit: In thousand of stated currencies
December 31, 2015Amount in original currency Amount in New Taiwan Dollars
USD 989,862 32,546,663RMB 622,838 3,109,830GBP 18,482 900,998JPY 3,032,924 827,988SGD 15,120 351,540
Note 1: The major foreign currencies were the top 5 currencies by position expressed in New Taiwan Dollars after exchange rate conversion.
Note 2: The net position represented the absolute value of each currency.
All held foreign financial assets and liabilities are classified by currencies and represented using the carrying amounts. The following tables display the information at December 31, 2016 and 2015, respectively.
Unit: In thousand of TWD
December 31, 2016
Assets USD to TWD Other currencies to TWD Total TWD
Cash and cash equivalents $ 21,116,033 44,451,890 65,567,923Placement with Central Bank and call loans to banks 58,864,822 89,908,956 148,773,778
Financial assets measured at fair value through profit or loss 68,742,875 16,079,536 84,822,411
Available-for-sale financial assets 16,952,654 61,064,521 78,017,175Hedging derivatives financial assets - 21,221 21,221Receivables, net 6,296,325 3,991,314 10,287,639Current income tax assets 204,732 213,909 418,641Loans and Discounts, net 141,656,340 88,781,135 230,437,475Held-to-maturity financial assets, net 10,080,990 25,545,850 35,626,840Other financial assets, net 2,104,042 13,653,881 15,757,923Property and equipment, net 78,966 21,806 100,772Intangible assets, net 8,442 3,082 11,524Deferred income tax assets, net 222,514 65,465 287,979Other assets, net 153,833 95,665 249,498Total assets $ 326,482,568 343,898,231 670,380,799
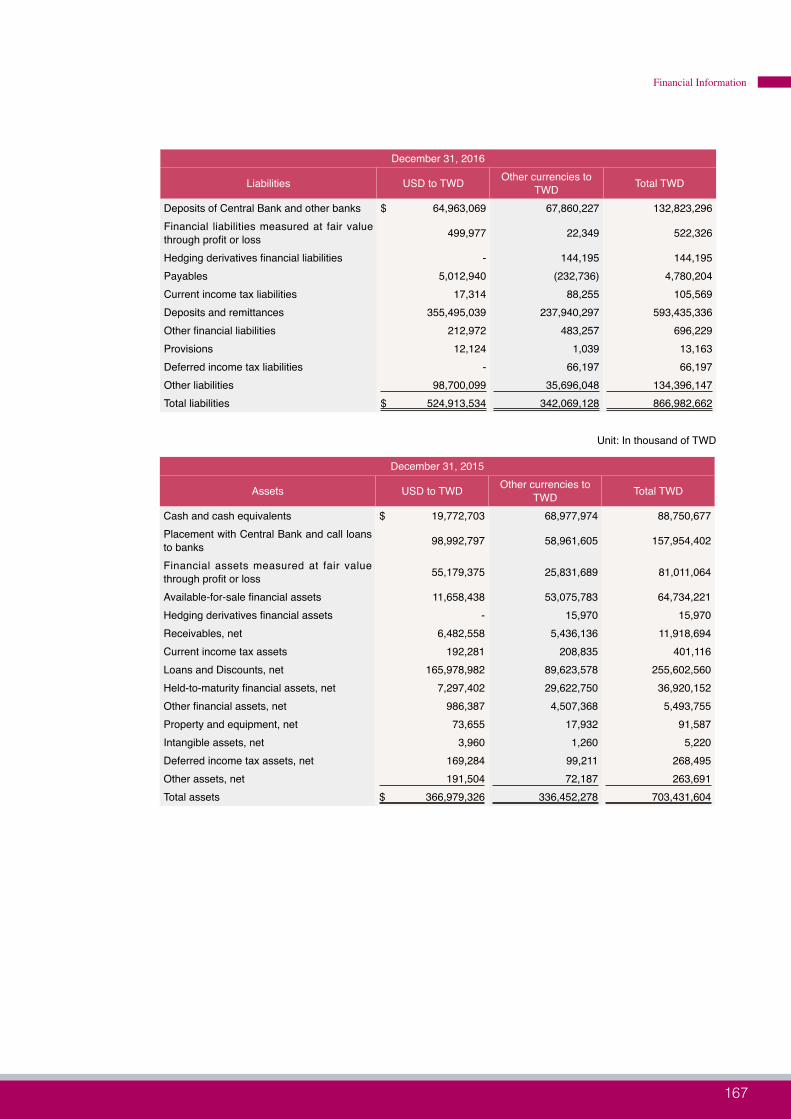
167166
Financial Information
December 31, 2016
Liabilities USD to TWD Other currencies to TWD Total TWD
Deposits of Central Bank and other banks $ 64,963,069 67,860,227 132,823,296Financial liabilities measured at fair value through profit or loss 499,977 22,349 522,326
Hedging derivatives financial liabilities - 144,195 144,195Payables 5,012,940 (232,736) 4,780,204Current income tax liabilities 17,314 88,255 105,569Deposits and remittances 355,495,039 237,940,297 593,435,336Other financial liabilities 212,972 483,257 696,229Provisions 12,124 1,039 13,163Deferred income tax liabilities - 66,197 66,197Other liabilities 98,700,099 35,696,048 134,396,147Total liabilities $ 524,913,534 342,069,128 866,982,662
Unit: In thousand of TWD
December 31, 2015
Assets USD to TWD Other currencies to TWD Total TWD
Cash and cash equivalents $ 19,772,703 68,977,974 88,750,677Placement with Central Bank and call loans to banks 98,992,797 58,961,605 157,954,402
Financial assets measured at fair value through profit or loss 55,179,375 25,831,689 81,011,064
Available-for-sale financial assets 11,658,438 53,075,783 64,734,221Hedging derivatives financial assets - 15,970 15,970Receivables, net 6,482,558 5,436,136 11,918,694Current income tax assets 192,281 208,835 401,116Loans and Discounts, net 165,978,982 89,623,578 255,602,560Held-to-maturity financial assets, net 7,297,402 29,622,750 36,920,152Other financial assets, net 986,387 4,507,368 5,493,755Property and equipment, net 73,655 17,932 91,587Intangible assets, net 3,960 1,260 5,220Deferred income tax assets, net 169,284 99,211 268,495Other assets, net 191,504 72,187 263,691Total assets $ 366,979,326 336,452,278 703,431,604

2016 ANNUAL REPORT
BANK FTAIWAN
169168
December 31, 2015
Liabilities USD to TWD Other currencies to TWD Total TWD
Deposits of Central Bank and other banks $ 43,715,878 99,097,384 142,813,262Financial liabilities measured at fair value through profit or loss 286,207 33,603,281 33,889,488
Hedging derivatives financial liabilities - 243,967 243,967Payables 5,574,702 446,041 6,020,743Current income tax liabilities 8,836 81,375 90,211Deposits and remittances 362,585,053 228,309,341 590,894,394Other financial liabilities 213,642 1,506,888 1,720,530Provisions 11,083 2,630 13,713Deferred income tax liabilities - 90,992 90,992Other liabilities 92,273,593 27,893,506 120,167,099Total liabilities $ 504,668,994 391,275,405 895,944,399
11. Disclosures required by the Regulations Governing the Preparation of Financial Reports by Public banks
(a) Interest rate sensitivity assets and liabilities analysis (New Taiwan Dollars)Unit: In thousand of TWD
December 31, 2016
Item 1~90 days 91~180 days 181 days to one year Over one year Total
Interest rate sensitive assets $ 1,778,022,449 1,290,382,982 217,875,054 354,541,173 3,640,821,658
Interest rate sensitive liabilities 365,304,321 2,745,230,523 333,722,350 133,837,865 3,578,095,059
Interest rate sensitive gap 1,412,718,128 (1,454,847,541) (115,847,296) 220,703,308 62,726,599
Net worth 273,114,708Ratio of interest rate sensitive assets to liabilities (%) 101.75Ratio of interest rate sensitive gap to net worth (%) 22.97
Unit: In thousand of TWD
December 31, 2015
Item 1~90 days 91~180 days 181 days to one year Over one year Total
Interest rate sensitive assets $ 1,629,531,364 1,472,564,685 254,393,149 252,371,479 3,608,860,677
Interest rate sensitive liabilities 344,060,000 2,737,548,699 337,299,385 121,934,922 3,540,843,006
Interest rate sensitive gap 1,285,471,364 (1,264,984,014) (82,906,236) 130,436,557 68,017,671
Net worth 252,072,974Ratio of interest rate sensitive assets to liabilities (%) 101.92Ratio of interest rate sensitive gap to net worth (%) 26.98
Note 1: The above amount included only new Taiwan dollar amounts held by the Bank, and excluded contingent assets and contingent liabilities.
Note 2: Interest rate sensitivity assets and liabilities are interest-earning assets and interesting-bearing liabilities with revenues and costs affected by interest rate changes.
Note 3: Interest rate sensitivity gap=Interest-rate-sensitivity assets – Interest-rate-sensitivity liabilities.
Note 4: Ratio of interest-rate-sensitivity assets to liabilities=Interest-rate-sensitivity assets/Interest-rate-sensitivity liabilities (in New Taiwan Dollars).

169168
Financial Information
(b) Assets and liabilities interest rate sensitivity analysis (United State Dollars)Unit: In thousand of USD
December 31, 2016
Item 1~90 days 91~180 days 181 days to one year Over one year Total
Interest rate sensitive assets $ 27,014,893 4,917,394 3,143,912 1,213,969 36,290,168
Interest rate sensitive liabilities 22,373,842 6,573,443 2,547,247 511,782 32,006,314
Interest rate sensitive gap 4,641,051 (1,656,049) 596,665 702,187 4,283,854
Net worth (42,746)Ratio of interest rate sensitive assets to liabilities (%) 113.38Ratio of interest rate sensitive gap to net worth (%) (10,021.65)
Unit: In thousand of USD
December 31, 2015
Item 1~90 days 91~180 days 181 days to one year Over one year Total
Interest rate sensitive assets $ 24,519,105 5,689,805 3,104,461 1,060,503 34,373,874
Interest rate sensitive liabilities 24,075,527 5,990,444 2,055,545 1,223,067 33,344,583
Interest rate sensitive gap 443,578 (300,639) 1,048,916 (162,564) 1,029,291
Net worth (59,738)Ratio of interest rate sensitive assets to liabilities (%) 103.09Ratio of interest rate sensitive gap to net worth (%) (1,723.01)
Note 1: The above amount included only U.S. dollar amounts held by the Bank, and excluded contingent assets and contingent liabilities.
Note 2: Interest rate sensitivity assets and liabilities are interest-earning assets and interest-bearing liabilities with revenues and costs affected by interest rate changes.
Note 3: Interest rate sensitivity gap=Interest-rate-sensitivity assets – Interest-rate-sensitivity liabilities.
Note 4: Ratio of interest-rate-sensitivity assets to liabilities = Interest-rate-sensitivity assets/Interest-rate-sensitivity liabilities (in U.S. dollars).
6) Other risks
1. Operational risk and legal risk
The Bank and its subsidiary have identified, measured and monitored operational risk and legal risk, and also disclosed qualitative and quantitative information in accordance with the “Information of the Capital Adequacy and the Risk Managements” and the FSC’s requirements.
According the “The Explanations and Formats of Calculation of Bank’s Self-Owned Capital and Risk -Weighted Assets,” operation risks is the risk of a change in value caused by the fact that actual losses, incurred for inadequate or failed internal processes, people and systems, or from external events (including legal risk), differ from the expected losses. As legal risk is part of the operational risk, where it involves legal risk to be reported together with the operation risk to the appropriate management level.

2016 ANNUAL REPORT
BANK FTAIWAN
171170
2. Compliance risks and reputation risks
The Department of Compliance has set up the “Regulations and Guidelines of Legal Compliance” which clearly states the responsibility of the competent unit (Department of Compliance), the task units (each unit of the head office, Secretary Department of the Board of directors, Department of Internal Auditing of the Board of Directors), training unit (Department of Human Resources), and the self-assessment unit (each operational unit, excluding Department of Internal Auditing Board of Directors). The Department of Compliance also holds the responsibility of planning, managing and executing the overall legal compliance of the Bank. For instance, the task unit should look into potential risks of legal compliance and obtain the opinion and approval of the department of compliance before new services and products are introduced to the market or applications are submitted to the authorities for the approval of sales.
In response to continuous changes in external regulations, the Department of Compliance prepares the “Legislation and Amendment of External Financial Regulations Checklist” to let each operation unit recheck their internal guidelines and make necessary adjustments in time. The Department of Compliance passes the information to colleagues about changes in financial regulations related to the Bank’s operations to lower the risk of legal compliance. If any operational loss events involving legal compliance occur and cause loss, they will be reported as part of operation risk to the appropriate management level.
The Bank’s “Declaration of Operation Risk Appetite” stresses that the Bank should attach importance not only to the direct financial loss cause by operational loss events, but also the indirect loss which might damage its quality of service and reputation. In view of an internal fraud that may cause enormous loss and seriously jeopardize reputation, the Bank actively establishes the enterprise culture with risk awareness. In addition to enhance its colleagues’ concept of risk (e.g. collecting and compiling the information as a report about the concept of risk), and to firmly execute internal controls, the Bank also avoids internal fraud by emphasizing the importance of compliance with regulations and laws. Any events that may damage the Bank’s reputation will be reported as part of operation risk to the appropriate management level.
In the future, the Bank shall meet the requirements proposed by the authorities. Moreover, the Bank will keep collecting domestic and international information and refer them to other banks’ practical operations to enhance the quantitative measurement and qualitative management on operation risk, legal risk, compliance risk and reputation risk.
7) Transfer of Financial Assets- Transferred financial assets that are not completely derecognized
The transferred financial assets of the Bank and its subsidiary that are not qualified for de-recognition in the daily operation are mainly debt securities under repurchase agreements. Since the right to receive cash flow is transferred and it reflects the associated liabilities to repurchase transferred financial assets at a fixed price in the future period, the Bank and its subsidiary cannot use, sell or pledge these transferred financial assets during the valid transaction period. However, since the Bank and its subsidiary still bear the interest rate risk and credit risk, their transferred financial assets are not completely derecognized. Analysis of financial assets that are not completely derecognized and the associated liabilities are as follows.

171170
Financial Information
December 31, 2016
Type of financial assets
Carrying amount of the
transferred financial assets
Carrying amount of
the Financial liability
Fair value of transferred
financial assets
Fair value of financial liabilities
Fair value net position
Financial asset measured at fair value through profit or loss
Under repurchase agreements $ 1,072,336 1,071,878 1,072,336 1,071,878 458Available for sale-financial assets
Under repurchase agreements 9,315,866 10,265,271 9,315,866 10,265,271 (949,405)
December 31, 2015
Type of financial assets
Carrying amount of the
transferred financial assets
Carrying amount of
the Financial liability
Fair value of transferred
financial assets
Fair value of financial liabilities
Fair value net position
Financial asset measured at fair value through profit or loss
Under repurchase agreements $ 282,767 299,050 282,767 299,050 (16,283)Available for sale-financial assets
Under repurchase agreements 15,130,960 16,037,569 15,130,960 16,037,569 (906,609)
8) Offsetting of financial assets and financial liabilities
Bank of Taiwan and its subsidiary hold financial instruments which meet Section 42 of the IAS 32 endorsed by FSC. Therefore, the financial instrument will be offset on the balance sheet.
Although the Bank and its subsidiary do not engage in transactions that meet the offsetting condition in IFRSs, they have signed the net settlement contracts of similar agreements with counterparties, such as global master repurchase agreement, global securities lending agreement and similar repurchase agreement or reverse-repurchase agreement. If both parties choose to net settle, the abovementioned executable net settlement contracts or similar agreements will be allowed to be settled in net amount after offsetting the financial assets and financial liabilities. Otherwise, the transaction will be settled in gross amount. However, if one party defaults, the other party could opt for net settling.
The offsetting information of financial assets and financial liabilities is shown below:
December 31, 2016Financial assets under offsetting or general agreement of net amount settlement or similar norms
Financial assets
Total recognized financial assets(a)
Total recognized financial liabilities offsetting on the balance sheet(b)
Net amount of financial assets on the balance
sheets(c)=(a)-(b)
Relevant amount not offset on the balance sheet (d)
Net amount(e)=(c)-(d)Financial
instrument (note)
Cash received as collaterals
Derivative financial assets
$ 10,320,504 - 10,320,504 1,199,479 3,441 9,117,584

2016 ANNUAL REPORT
BANK FTAIWAN
173172
December 31, 2016Financial liabilities under offsetting or general agreement of net amount settlement or similar norms
Financial liabilities
Total recognized financial liabilities(a)
Total recognized financial assets offsetting on the balance sheet(b)
Net amount of financial liabilities on the balance
sheets(c)=(a)-(b)
Relevant amount not offset on the balance sheet (d)
Net amount(e)=(c)-(d)Financial
instrument (note)
Pledged cash Collaterals
Derivative financial liabilities
$ 6,667,566 - 6,667,566 1,199,479 50,263 5,417,824
Note: Master netting arrangements and non-cash financial collaterals are included.
December 31, 2015Financial assets under offsetting or general agreement of net amount settlement or similar norms
Financial assets
Total recognized financial assets(a)
Total recognized financial liabilities offsetting on the balance sheet(b)
Net amount of financial assets on the balance
sheets(c)=(a)-(b)
Relevant amount not offset on the balance sheet (d)
Net amount(e)=(c)-(d)Financial
instrument (note)
Cash received as collaterals
Derivative financial assets
$ 14,239,009 - 14,239,009 1,907,055 294,919 12,037,035
December 31, 2015Financial liabilities under offsetting or general agreement of net amount settlement or similar norms
Financial liabilities
Total recognized financial liabilities(a)
Total recognized financial assets offsetting on the balance sheet(b)
Net amount of financial liabilities on the balance
sheets(c)=(a)-(b)
Relevant amount not offset on the balance sheet (d)
Net amount(e)=(c)-(d)Financial
instrument (note)
Pledged cash Collaterals
Derivative financial liabilities
$ 6,180,612 - 6,180,612 1,907,055 121,656 4,151,901
Note: Master netting arrangements and non-cash financial collaterals are included.
(45) Capital management
1) The Target and Procedure of capital management
The Target of capital management is to achieve the authority’s requirements for the BIS Capital Adequacy Ratio and to improve the efficiency of capital usage through capital management procedures.
The Bank consider the short-term and long-term capital demand, operating plans and the lowest requirement to the BIS ratio to draft the capital plan. The Bank conduct the stress testing, the simulation analysis periodically, consider the external conditions and other factors, such as potential risks, environment changes of the financial market and other events that will affect the risk tolerable ability to ensure the Bank can maintain sufficient capital while unfavorable events and significant changes to the market occur.
2) The definition and regulations of capital
The Competent authority of the Bank is the Financial Supervisory Commission (the FSC). The Bank and its subsidiary follow the “Regulations Governing the Capital Adequacy and Capital Category of Banks” issued by the FSC.

173172
Financial Information
The term “Ratio of Regulatory Capital to Risk-weighted Assets” shall mean Common Equity Tier 1 Ratio, Tier 1 Capital Ratio, and Total Capital Adequacy Ratio. Except computing the Bank own ratios, it also calculates the ratios using the consolidated financial information according to the IAS 27. All mentioned ratios should be in conformity with article 5 of the regulations.
3) Regulatory Capital
The term “Regulatory Capital” shall mean the net Tier 1 Capital and the net Tier 2 Capital according to the Regulations Governing the Capital Adequacy and Capital Category of Banks.”
1. The term “Net Tier 1 Capital” shall mean the aggregate amount of net Common Equity Tier 1 and net additional Tier 1 Capital.
(a) The common equity Tier 1 capital consists of the common equity that reduces intangible assets, the deferred tax assets due to losses from the previous year, the insufficiency of operation reserves and loan loss provisions, the revaluation surplus of real estate, unamortized losses on sales of non-performing loans, and the statutory adjustment items calculated in accordance with other rules for calculation methods. The common equity tier 1 capital shall mean the sum of the common stock and additional paid-in capital in excess of par-common stock, the capital collected in advance, the capital reserves, the statutory surplus reserves, the special reserves, the accumulated profit or loss, the non-controlling interests and the other items of interest.
(b) The range of additional Tier 1 capital shall mean the total amount of the following items reduces the total amount of the deductible items in accordance with the rules for calculation methods.
a. Non-cumulative perpetual preferred stock and its capital stock premium.
b. Non-cumulative perpetual subordinated debts.
c. The non-cumulative perpetual preferred stock and its capital stock premium, and the non-cumulative perpetual subordinated debts which are issued by banks’ subsidiaries, and are not directly or indirectly held by banks.
2. The range of Tier 2 capital shall mean the total amount of the following items reduces the total amount of the deductible items in accordance with the rules for calculation methods.
(a) Cumulative perpetual preferred stock and its capital stock premium.
(b) Cumulative perpetual subordinated debts.
(c) Convertible subordinated debts
(d) Long-term subordinated debts
(e) Non-perpetual preferred stock and its capital stock premium
(f) When the real estate was adopted by the International Financial Reporting Standards for the first time and used the fair value or the re-estimated value as the deemed cost. The difference in amount between the deemed cost and the book value was recognized in retained earnings, the 45% of unrealized gain on available-for-sale financial assets, as well as operational reserves and loan-loss provisions.
(g) The cumulative perpetual preferred stock and its capital stock premium, cumulative perpetual subordinated debts, convertible subordinated debts, long-term subordinated debts, and the non-perpetual preferred stock and its capital stock premiums which are issued by banks’ subsidiaries, and are not directly or indirectly held by banks.

2016 ANNUAL REPORT
BANK FTAIWAN
175174
When a bank reports its capital adequacy ratio according to the regulations, the competent authority shall examine its capital category in accordance with the provisions of these regulations on the calculation of capital adequacy ratio.
When a bank’s capital is graded as inadequate capital, significantly inadequate capital or seriously inadequate capital by the competent authority’s examination, the competent authority shall take prompt corrective actions in pursuant to Sections 1 to 3, Paragraph 1, Article 44-2 of the Act.
The government regulations are formulated in accordance with the Basel Accord. The followings are the content of the Basel Accord and the implementation of the Bank and its subsidiary.
1. The First Pillar
The first pillar contains the capital requirements for credit risks, market risks and operation risks.
(a) Credit risks refer to the default risk resulted from the counterparties. The credit risk is derived from the assets, liabilities or off-balance sheet items. There are two measurement methods, the Standardized Approach and the Internal Ratings-Based Approach (the IRB). The Bank and its subsidiary use the Standardized Approach.
(b) Market risks refer to the loss due to the changes of the market price, such as the changes of the market interest rate, the exchange rate, the stock price and the product price. There are two measurement methods, the Standardized Approach and the Internal Model Approach. The Bank and its subsidiary use the Standardized Approach.
(c) Operation risks refer that the Bank has loss caused by the internal operations, the employee’s faults, the system errors or external events. The operation risks include legal risks but exclude strategy risks and reputation risks. The measurement methods are the Basic Indicator Approach, the Standardized Approach, the Alternative Standardized Approach and the Advanced Measurement Approach. The Bank has adopted the Basic Indicator Approach since the first quarter of 2015 after obtaining the approval from the authorities.
2. The Second Pillar
The second pillar is used to ensure that each bank has sufficient internal assessment procedures and each bank can understand the capital adequacy through complete risk measurements. At the same time, it also uses proper supervisory operations to ensure the regulatory capital accord with the whole risk characteristics. The Bank and its subsidiary report the capital adequacy measurements and the risk management situations to the competent authority with related information.
3. The Third Pillar
The third pillar is related to the market discipline. It requires banks to disclose more information about the risks, the capital and the risk managements according the new Basel Accord in order to increase their information transparency. As a result, the Bank and its subsidiary have offered the “Information of the Capital Adequacy and the Risk Managements” in our website to disclose the qualitative data and the quantitative data.

175174
Financial Information
4) Capital adequacy ratio
Year Analyze Items December 31, 2016 December 31, 2015
Eligible capital
Common stock capital 196,707,640 176,651,076Other tier 1 capital - -Tier 2 capital 44,259,621 50,075,363Eligible capital 240,967,261 226,726,439
Risk assetsweightedassets
Credit riskStandardized approach 1,845,675,715 1,879,583,822Internal rating based approach - -Securitization - -
Operational risk
Basic indicator approach - -Standardized approach/Alternative standardized approach
64,622,213 56,853,725
Advance measurement approach - -
Market riskStandardized approach 90,793,588 89,149,500Internal models approach - -
Total risk weighted assets 2,001,091,516 2,025,587,047Capital adequacy ratio 12.04% 11.19%Common stock based capital ratio 9.83% 8.72%Tier 1 risk based capital ratio 9.83% 8.72%Leverage ratio 4.08% 3.64%
Note 1: The calculation of eligible capital, risk-weighted assets, and the total amount of risk exposure shall follow the Regulations Governing the Capital Adequacy and Capital Category of Banks, and Calculation of Equity Capital and Risk Assets.
Note 2: The annual report shall disclose the current and preceding period of BIS ratio. The semi-annual report (beside the current and preceding period) shall disclose the information one year before.
Note 3: The table shall disclose the calculation formula as follows:
1.Equity Capital = shareholders’ equity + other tier 1 capital + tier 2 capital
2.Risk-weighted assets = credit risk-weighted assets + (capital requirement for operational risk + capital requirement for market risk) × 12.5
3.Capital adequacy ratio = equity capital / internal models approach
4.Common stock - based capital ratio = shareholders’ equity/ total risk weighted assets
5.Tier 1 risk based capital ratio = (shareholders’ equity + Other tier 1 capital) / weighted risk
6.Leverage ratio = tier 1 capital/ total risk exposure
Note 4: The table may choose not to disclose in Q1 and Q3 financial report.
5) Stress test: In April, 2016, the Bank followed the FSC’s action plan using the data as of December 31, 2015 to perform a stress test. The scenarios set by the FSC mainly includes the macroeconomic scenarios (e.g. a decline in the economic growth rate at home and abroad, a rise of the domestic unemployment and a fall in the domestic house prices), decrease in interest rate margin between lending and borrowing, and increase in market risk. The Bank estimated the possible loss and its impact on earnings, capital adequacy ratio and leverage ratio in such scenarios to test if the bank held enough capital to withstand the impact of adverse developments. Regardless, whether be it in minor or more server scenarios, the average common equity ratio, the first class capital ratio, the capital adequacy ratio as well as the leverage ratio of the Bank all turned out to be higher than the statutory minimum requirements in 2016 (5.125%, 6.625%, 8.625% and 3%).

2016 ANNUAL REPORT
BANK FTAIWAN
177176
(46) Related-party transactions
1) Name of related party and relationship
Name RelationshipTaiwan Financial Holding Co., Ltd. Parent company of the Bank and its subsidiaryBankTaiwan Life Insurance Co., Ltd. Wholly-owned subsidiary BankTaiwan Securities Co., Ltd. Wholly-owned subsidiary Hua Nan Financial Holdings Co., Ltd. Investee company of the Bank under the equity methodTaiwan Life Insurance Co., Ltd. Investee company of the Bank under the equity methodTang Eng Iron Works Co., Ltd. Investee company of the Bank under the equity methodKaohsiung Ammonium Sulfate Co., Ltd. Investee company of the Bank under the equity methodTai Yi Real Estate Management Co., Ltd. Investee company of the Bank under the equity methodTaiwan business bank Co., Ltd. Related-PartyLand Bank of Taiwan Related-PartyThe Export-Import Bank of the Republic of China Related-Party
Others Directors, supervisors, managers and their relatives up to the second degree, affiliates and so on
2) Key Management Personnel Compensation
The related information about the salaries and bonus for the key management personnel in 2016 and 2015 were as follows:
2016 2015Short-term employee benefits $ 9,593 10,255
3) Other related-party transactions
1. Placement with banks
NameDecember 31, 2016 December 31, 2015
Amount Percentage of account balance Amount Percentage of
account balanceHua Nan Financial Holdings Co., Ltd. $ - - 5,235 -
2. Call loans to banks
December 31, 2016
Highest balance Ending balance Interest rate range (%) Interest income
Hua Nan Financial Holdings Co., Ltd. $ 49,325,120 3,060,900 0.17~3.30 51,762
December 31, 2015
Highest balance Ending balance Interest rate range (%) Interest income
Hua Nan Financial Holdings Co., Ltd. $ 23,027,270 657,600 0.03~5.00 13,246

177176
Financial Information
3. Receivables
NameDecember 31, 2016 December 31, 2015
Amount Percentage of account balance Amount Percentage of
account balanceTaiwan Financial Holding Co., Ltd. $ 2,971 - 1,989 -BankTaiwan Life Insurance Co., Ltd. 44,178 0.07 136,451 0.19BankTaiwan Securities Co., Ltd. - - 14 -Total $ 47,149 0.07 138,454 0.19
4. Other assets
NameDecember 31, 2016 December 31, 2015
Amount Percentage of account balance Amount Percentage of
account balanceBankTaiwan Life Insurance Co., Ltd. $ 5,873 0.07 6,780 0.09BankTaiwan Securities Co., Ltd. 14 - 14 -Total $ 5,887 0.07 6,794 0.09
5. Securities lending (classified as other financial assets)
NameDecember 31, 2016 December 31, 2015
Amount Percentage of account balance Amount Percentage of
account balanceBankTaiwan Securities Co., Ltd. $ - - 65,760 0.10
6. Deposits of banks
NameDecember 31, 2016 December 31, 2015
Amount Percentage of account balance Amount Percentage of
account balanceHua Nan Financial Holdings Co., Ltd. $ 209,950 0.42 5,685 0.01
7. Call loans from banks
December 31, 2016
Highest balance Ending balance Interest rate range (%) Interest expense
Hua Nan Financial Holdings Co., Ltd. $ 12,371,120 - 0.17~8.00 2,975
December 31, 2015
Highest balance Ending balance Interest rate range (%) Interest expense
Hua Nan Financial Holdings Co., Ltd. $ 17,517,100 10,743,050 0.14~9.50 24,248

2016 ANNUAL REPORT
BANK FTAIWAN
179178
8. Deposits
NameDecember 31, 2016 December 31, 2015
Amount Percentage of account balance Amount Percentage of
account balanceTaiwan Financial Holding Co., Ltd. $ 178,808 0.08 256,640 0.01BankTaiwan Life Insurance Co., Ltd. 3,848,677 1.69 3,457,654 0.09BankTaiwan Securities Co., Ltd. 322,246 0.14 730,410 0.02Hua Nan Financial Holdings Co., Ltd. 399,156 0.18 438,928 0.01Kaohsiung Ammonium Sulfate Co., Ltd. - - 735,999 0.02Tang Eng Iron Works Co., Ltd. 13,309 - 4,852 -Tai Yi Real Estate Management Co., Ltd. 605 - 10,966 -
Total $ 4,762,801 2.09 5,635,449 0.15
9. Payables
NameDecember 31, 2016 December 31, 2015
Amount Percentage of account balance Amount Percentage of
account balanceTaiwan Financial Holding Co., Ltd. $ 4 - 24 -BankTaiwan Life Insurance Co., Ltd. 155 - 177 -BankTaiwan Securities Co., Ltd. 43 - 76 -Total $ 202 - 277 -
10. Other liabilities
NameDecember 31, 2016 December 31, 2015
Amount Percentage of account balance Amount Percentage of
account balanceTaiwan Financial Holding Co., Ltd. $ 2,708 0.04 2,708 0.04BankTaiwan Securities Co., Ltd. 1,664 0.02 1,664 0.02Total $ 4,372 0.06 4,372 0.06
11. Interest income
Name2016 2015
Amount Percentage of account balance Amount Percentage of
account balanceTaiwan Financial Holding Co., Ltd. $ 143,325 0.24 130,308 0.20BankTaiwan Securities Co., Ltd. 675 - 2,965 -Total $ 144,000 0.24 133,273 0.20
12. Interest expense
Name2016 2015
Amount Percentage of account balance Amount Percentage of
account balanceTaiwan Financial Holding Co., Ltd. $ 482 - 656 -BankTaiwan Life Insurance Co., Ltd. 35,754 0.11 32,710 0.09BankTaiwan Securities Co., Ltd. 1,194 - 2,140 0.01Total $ 37,430 0.11 35,506 0.10

179178
Financial Information
13. Service fee income
Name2016 2015
Amount Percentage of account balance Amount Percentage of
account balanceBankTaiwan Life Insurance Co., Ltd. $ 1,330,860 21.28 990,340 16.40BankTaiwan Securities Co., Ltd. 1,837 0.03 2,201 0.04Total $ 1,332,697 21.31 992,541 16.44
14. Service fee expense
Name2016 2015
Amount Percentage of account balance Amount Percentage of
account balanceBankTaiwan Securities Co., Ltd. $ 15,227 2.44 8,697 1.50
15. Gain (loss) on financial assets or liabilities measured at fair value through profit or loss
Name2016 2015
Amount Percentage of account balance Amount Percentage of
account balanceBankTaiwan Life Insurance Co., Ltd. $ (199,355) 1.22 35,907 2.40BankTaiwan Securities Co., Ltd. (2,301) 0.01 (2,017) 0.13Total $ (201,656) 1.23 33,890 2.53
16. Realized loss on available-for-sale financial assets
Name2016 2015
Amount Percentage of account balance Amount Percentage of
account balanceBankTaiwan Securities Co., Ltd. $ (1,533) 0.07 (2,752) 0.18
17. Other non-interest income (expense)
Name2016 2015
Amount Percentage of account balance Amount Percentage of
account balanceTaiwan Financial Holding Co., Ltd. $ 27,072 0.13 26,675 0.30BankTaiwan Life Insurance Co., Ltd. 39,716 0.19 40,573 0.45BankTaiwan Securities Co., Ltd. 32,024 0.15 35,579 0.39Total $ 98,812 0.47 102,827 1.14
18. Other general and administrative expenses
Name2016 2015
Amount Percentage of account balance Amount Percentage of
account balanceTaiwan Financial Holding Co., Ltd. $ 781 0.01 847 0.01BankTaiwan Life Insurance Co., Ltd. 39,577 0.56 40,087 0.55BankTaiwan Securities Co., Ltd. 86 - 86 -Total $ 40,444 0.57 41,020 0.56

2016 ANNUAL REPORT
BANK FTAIWAN
181180
19. Loans
December 31, 2016
CategoryHouse holder
amount or name of related party
Highest balance
in current period
Ending balance
Status of performance
Type of collateral
Differences in transaction
terms between related and non related parties
Performing loans
Non-performing
loans
Consumer loans 32 13,922 9,153 9,153 - None None
House mortgages 110 662,165 581,249 581,249 - Land and
buildings None
Call loans to banks
Land Bank of Taiwan Co., Ltd. 8,000,000 8,000,000 8,000,000 - None None
Call loans to banks
Hua Nan Financial Holdings Co., Ltd. 30,000,000 - - - None None
Call loans to banks
Taiwan Business Bank Co., Ltd. 6,000,000 2,000,000 2,000,000 - None None
Call loans to banks
The Export-Import Bank of the Republic of China
4,000,000 2,650,000 2,650,000 - None None
Long-term secured loans
Tai Yi Real Estate Co., Ltd. 3,162 2,934 2,934 - Land and
buildings None
Short-term secured loans
Taiwan financial Holding Co., Ltd. 16,750,000 16,750,000 16,750,000 -
Government (or financial institutions) guarantee
None
Secured overdrafts loans
Tang Eng Iron Works Co., Ltd. 170,947 170,947 170,947 - Land and
factory None
Short-term secured loans
Tang Eng Iron Works Co., Ltd. 100,000 100,000 100,000 - Land and
factory None
Short-term secured loans
Tang Eng Iron Works Co., Ltd. 650,000 650,000 650,000 - Land and
factory None
Medium-term secured loans
Tang Eng Iron Works Co., Ltd. 600,000 400,000 400,000 - Land and
factory None
Medium-term secured loans
Tang Eng Iron Works Co., Ltd. 1,550,000 950,000 950,000 - Land and
factory None
Short-term secured loans
BankTaiwan Securities Co., Ltd. 500,000 - - -
Real estate and
government (or financial institutions) guarantee
None

181180
Financial Information
December 31, 2015
CategoryHouse holder
amount or name of related party
Highest balance
in current period
Ending balance
Status of performance
Type of collateral
Differences in transaction
terms between related and non related parties
Performing loans
Non-performing
loans
Consumer loans 37 16,189 9,138 9,138 - None None
House mortgages 109 655,660 548,130 548,130 - Land and
buildings None
Call loans to banks
Land Bank of Taiwan Co., Ltd. 20,000,000 - - - None None
Call loans to banks
Hua Nan Financial Holdings Co., Ltd. 10,000,000 - - - None None
Call loans to banks
The Export-Import Bank of the Republic of China
3,050,000 - - - None None
Long-term secured loans
Tai Yi Real Estate Co., Ltd. 27,362 3,162 3,162 -
Land and buildings
(commerce)None
Short-term secured loans
Taiwan financial Holding Co., Ltd. 17,050,000 17,050,000 17,050,000 -
Government (or financial institutions) guarantee
None
Secured overdrafts loans
Tang Eng Iron Works Co., Ltd. 237,807 237,807 237,807 - Land and
factory None
Short-term secured loans
Tang Eng Iron Works Co., Ltd. 100,000 100,000 100,000 - Land and
factory None
Short-term secured loans
Tang Eng Iron Works Co., Ltd. 400,000 350,000 350,000 - Land and
factory None
Short-term secured loans
Tang Eng Iron Works Co., Ltd. 151,482 110,140 110,140 - Land and
factory None
Medium-term secured loans
Tang Eng Iron Works Co., Ltd. 1,000,000 1,000,000 1,000,000 - Land and
factory None
Medium-term secured loans
Tang Eng Iron Works Co., Ltd. 800,000 600,000 600,000 - Land and
factory None
Short-term secured loans
BankTaiwan Securities Co., Ltd. 281,579 - - -
Real estate and
government (or financial institutions) guarantee
None
Note 1: The consumer loans to staff and mortgage loans to staff can be lumped together for disclosure. The disclosure of other loans is sorted by interested parties.
Note 2: Collateral is classified by real estate, short term notes, government bonds, secured or non secured bonds, TSEC and GTSM stocks, non TSEC and non GTSM stocks, and others.

2016 ANNUAL REPORT
BANK FTAIWAN
183182
20. Derivative financial instruments
December 31, 2016
Name of related party Subject Agreement
periodNotional amounts
Current valuation
adjustment
Balance sheet
Account name Amount
BankTaiwan Life Insurance Co., Ltd.
Swap agreement
2009.02.24~2017.04.19
19,411,560 216,252Valuation adjustment of financial assets measured at fair value through profit or loss-swap
216,252
December 31, 2015
Name of related party Subject Agreement
periodNotional amounts
Current valuation
adjustment
Balance sheet
Account name Amount
BankTaiwan Life Insurance Co., Ltd.
Swap agreement
2008.4.30~2016.4.26
27,812,257 366,113Valuation adjustment of financial assets measured at fair value through profit or loss-swap
366,113
21. The expenses of shared assets allocated to Taiwan Financial Holding Co., Ltd, BankTaiwan Life Insurance Co., Ltd, BankTaiwan Securities Co., Ltd, by the Bank were as follows:
Name2016 2015
Amount Percentage of account balance Amount Percentage of
account balanceTaiwan Financial Holding Co., Ltd. $ 10,822 0.05 10,424 0.12BankTaiwan Life Insurance Co., Ltd. 35,716 0.19 40,573 0.45BankTaiwan Securities Co., Ltd. 21,978 0.10 25,487 0.28Total $ 68,516 0.34 76,484 0.85
(47) Pledged assets
Pledged assets Purpose of pledge December 31, 2016
December 31, 2015
Available-for-sale financial assets –bonds
Guarantee deposit for provisional seizure against defaulted loans and others
$ 458,600 367,900
Available-for-sale financial assets – bonds
Operat ing deposit for securi t ies investment trust and consulting 150,000 150,000
Available-for-sale financial assets –bonds
Guarantee deposits for trust business compensation reserve 50,000 50,000
Held-to-maturity financial assets –government bonds
Guarantee deposits for trust business compensation reserve 400,000 400,000
Deposits in Central Bank-time deposits Payment and settlement systems of Central Bank 20,000,000 18,400,000
Available-for-sale financial assets –negotiable certificate of deposit
Payment and settlement systems of Central Bank 27,435,000 29,000,000
$ 48,493,600 48,367,900

183182
Financial Information
(48) Commitments and contingencies
1) Commitments and contingencies
December 31, 2016 December 31, 2015Consignment collection $ 52,942,935 52,812,682Contract guarantee on behalf of counter parties 1,197,372 1,379,679Traveler’s checks held on consignment 1,065,827 1,253,747Marketable securities held as custodian 1,795,341,745 1,662,667,807Letters of credit 28,935,428 30,733,836Goods held in custody 40,812,620 42,281,496Issuance of New Taiwan Dollars 1,940,153,805 1,806,647,559Trustee of behalf of Lenders 856,509,331 873,077,721Registered government bonds for sale 726,985,400 580,631,100Registered short term bills for sale 242,241,487 182,643,500Consigned sales of goods 1,753,281 2,206,661Trust liabilities 606,784,770 570,833,022Guarantees 75,683,983 80,330,097
$ 6,370,407,984 5,887,498,907
2) Balance sheet, income statement and details of assets under trust
Trust assets December 31, 2016 December 31, 2015Deposits
Deposits in the BOT $ 30,143,837 24,287,546Deposits in other banks 3,551,648 5,788,482
Short term investmentInvestment in funds 169,839,348 175,157,433Investment in bonds 239,092,992 215,848,838Common stock investment – marketable securities 49,446,789 43,093,483
ReceivablesInterest receivables 1,724,011 1,790,606Cash dividend receivables 2,813 3,366Receivables from trading securities 266,618 1,521,948Receivables from forward contracts 8,767,532 8,441,462
Prepaid expenses 823 99Real estate
Land 16,646,162 16,010,620Buildings 101,832 125,026Construction in progress 19,336,087 18,912,209
Marketable securities under custody 67,864,278 59,851,904Total of trust assets $ 606,784,770 570,833,022

2016 ANNUAL REPORT
BANK FTAIWAN
185184
Trust liabilities December 31, 2016 December 31, 2015Payables
Payables from trading securities $ 180,652 180,594Payables from forward contracts 8,604,839 8,505,100Payables from management fee 2,681 4,184Payables from supervision fee 327 324Other payables 1,327 1,151
Tax payable 392 180Securities held in custody payable 67,864,278 59,851,904Trust capital
Money trust 382,320,418 364,450,599Marketable securities trust 142,543 142,701Real estate investment trust 40,602,282 40,771,057
Other reserve and accumulated incomeAccumulated loss 72,754,445 57,815,457Foreign currency translation 7,796,843 14,643,149Deferred unrealized income 11,937,642 5,665,046
Current income 14,576,101 18,801,576Total of trust liabilities $ 606,784,770 570,833,022
Note: Including fund and bond investments of the offshore branch amounting to $318,007 and $345,045 as of December 31, 2016 and 2015, respectively.
Details of trust December 31, 2016 December 31, 2015Deposits
Deposits in the Bank $ 30,143,837 24,287,546Deposits in other banks 3,551,648 5,788,482
Short term investmentInvestment in funds 169,839,348 175,157,433Investment in bonds 239,092,992 215,848,838Common stock investment – marketable securities 49,446,789 43,093,483
Real estateLand 16,646,162 16,010,620Buildings 101,832 125,026Construction in progress 19,336,087 18,912,209
Marketable securities under custody 67,864,278 59,851,904Trust capital $ 596,022,973 559,075,541
Income statement for assets under trust 2016 2015Trust revenue
Capital interest revenue $ 10,513,381 10,325,917Cash dividend revenue 1,461,112 752,049Donation revenue 326,737 490,863Realized capital gain shares 17,819 61,186Realized capital gain fund 73,787 1,967,041Realized exchange gain – bond 774,069 1,848,237Realized foreign exchange gain - 529,644Realized gain on property exchange - 640,818Income from beneficiary certificates 3,230,082 3,309,256Total trust revenue 16,396,987 19,925,011

185184
Financial Information
Income statement for assets under trust 2016 2015Trust expense
Capital management fee 391,517 495,159Tax expense 10,883 7,094Supervisory fee 348 337Custodian fee 8,775 9,216Commission fee 9 32Donation cost 498,511 490,417Realized loss on property exchange 459,778 -Realized foreign exchange loss 337,662 -Other expense 113,403 121,180Total trust expense 1,820,886 1,123,435
Net income $ 14,576,101 18,801,576
(49) ProfitabilityUnit: %
ItemDecember 31, 2016 December 31, 2015
Before adjusting After adjusting Before adjusting After adjusting
Return on total assets (Note 6)
Before income tax 0.41 0.63 0.23 0.44After income tax 0.37 0.59 0.19 0.40
Return on net worth (Note 7)
Before income tax 7.34 10.47 4.17 7.41After income tax 6.67 9.80 3.49 6.73
Profit margin 39.49 25.19
Note 1: Return on total assets = Income before (after) income tax/Average total assets.
Note 2: Return on net worth = Income before (after) income tax/Average equity.
Note 3: Profit margin = Income after income tax/Total operating revenues.
Note 4: Income before (after) income tax is the income for the whole year of 2016 and 2015.
Note 5: The above profitability ratios are at annual rates.
Note 6: Return on total assets - after adjusting means assets excluding the short-term advances and long-term receivables resulted from government policies, and the assets of government employees insurance department; it also refers to income before (after) tax, plus, excess preferential interest expense. (If return on total assets-after adjusting at December 31, 2016 means assets excluding the assets of government employees insurance department and the income before and after tax, plus, excess preferential interest expense and interest revenue from the advance resulted from government policies, the adjusted return on total assets before (after) tax are 0.63% and 0.59%.)
Note 7: Return on net worth after adjusting means income before (after) tax, plus, excess preferential interest expense. (If the return on net worth-after adjusting at December 31, 2016 means income before (after) tax, plus, excess preferential interest expense and interest revenue from the advance resulted from government policies, the adjusted returns on net worth before and after tax are 10.73% and 10.06%.)
(50) Losses due to major disasters: None.
(51) Subsequent events: None.

2016 ANNUAL REPORT
BANK FTAIWAN
187186
(52) Other
1) The employee benefit expenses, depreciation, depletion and amortization, categorized by function, were as follows:
By functionBy nature
December 31, 2016 December 31, 2015Operating
costsOperating expenses Total Operating
costsOperating expenses Total
Employee benefits expensesSalaries 68,921 10,380,981 10,449,902 70,943 10,295,264 10,366,207Labor and health insurances 99,101 503,041 602,142 104,835 492,723 597,558
Pensions 3,315 835,164 838,479 3,465 776,218 779,683Others - 242,738 242,738 - 257,074 257,074
Depreciation expenses 45,189 744,271 789,460 42,920 755,445 798,365Amortization expenses - 360,891 360,891 - 357,259 357,259
The number of employees in 2016 and 2015 were 8,045 and 8,057, respectively.
2) Financial Statements Audited adjustment
The accounting records as at and for the year ended December 31, 2015, have been examized and certified by the MoA, and the resulting adjustments are summarized as follows:
Government audit adjustments for fiscal year ended December 31, 2015
Balance Sheet As Previously Reported December 31, 2015
Adjustments-Increase (Decrease)
As Certified by the MoA, December 31, 2015
AssetsCurrent income tax assets $ 1,343,594 (86) 1,343,508Investments accounted for using equity method, net 35,856,579 (757) 35,855,822
LiabilitiesCurrent income tax liabilities 394,875 629 395,504
Stockholders’ equityRetained earnings 59,291,717 (1,472) 59,290,245
Income statement As Previously Reported 2015
Adjustments-Increase (Decrease)
As Certified by the MoA, 2015
Share of profit of associates and joint ventures accounted for using equity method $ 4,108,527 (757) 4,107,770
Income tax expense 1,730,137 715 1,730,852Net income 8,872,170 (1,472) 8,870,698
Revised entries by the MoA in 2015 were as follows:
Item Adjustment accounts Amount adjusted by the MoA Explanation of revision by the MoA
1. Share of profit of associates and joint ventures accounted for using equity method
$ 757 Adjustment of Tai Yi Real Estate Management Co., Ltd. using equity method.
Investments accounted for using equity method, net
757
2. Income tax expense 4 Finance department recognized the tax of depostiting in other bank.
Current income tax liabilities 43. Income tax expense 711 Head office adjusted taxable income by amendment.
Current income tax liabilities 625Current income tax assets 86

187186
Financial Information
3) Supplementary information for government employees’ insurance department
1. Balance sheets
Government employees’ insurance departmentDecember 31, 2016 December 31, 2015
Cash and cash equivalents $ 41,355,259 32,774,199Financial assets measured at fair value through profit or loss 145,324,912 126,556,389Receivables, net 18,317,170 18,670,370Held-to-maturity financial assets 56,829,157 63,168,922Property and equipment, net 7,560 9,613Intangible assets, net 8,268 3,070Other assets, net 3,031,254 5,054,709Total assets $ 264,873,580 246,237,272Payables $ 32,731 239,502Provisions 264,840,836 245,997,636Other liabilities 13 134Total liabilities $ 264,873,580 246,237,272
2. Income statement
Government employees’ insurance departmentDecember 31, 2016 December 31, 2015
Net interest income $ 1,670,627 1,635,156Service fee expenses (8,666) (6,680)Gain (loss) on financial assets and liabilities at fair value through profit or loss 13,590,760 (1,857,901)
Foreign exchange gain (loss) (2,865,129) 852,232Premium income 22,779,133 20,918,139Government subsidy 13,754,258 16,970,330Insurance payments (29,871,353) (32,810,111)Recovered premium reserve - -Provision for insurance premium reserve (18,843,200) (5,529,029)Miscellaneous expense (92,807) (92,675)Miscellaneous revenue 21,015 57,432Net revenue 134,638 136,893Bad debt expenses and reserve for guarantees - (219)Employee benefits 116,983 119,336Depreciation and amortization expenses 3,881 3,633Other general and administrative expenses 13,774 14,143 134,638 136,893Net income $ - -
Note: According to Government Employees and School Staff Insurance Act, if GESSI experiences a loss, the loss before May 31, 1999, would be covered by the Ministry of Finance; and the loss after that date would be covered by an adjustment of the insurance premium.

2016 ANNUAL REPORT
BANK FTAIWAN
189188
4) The Bank has obtained approval from the FSC (Ruling No. 10400177950, issued on August 19, 2015) to engage in the business of electronic payment which started its operation in 2016. According to Article 4 of the Regulations Governing the Organization and Administration of Sinking Fund Established by Electronic Payment Institutions, the Bank shall appropriate $500 thousand to be contributed to the Sinking Fund in the first fiscal year. However, the fee in 2016, which was generated from electronic payment business, amounted only to $1 thousand, with no interest revenue and other revenue; the Bank only had to contribute the amount of $1 thousand to the Sinking Fund before the end of May 2017. It shall make up the full amount in the subsequent the years.
(53) Notes to Disclosure Items
1) Information on significant transactions:
Following the principle of financial report for public bank, the disclosure of information on significant transaction of the Bank and its Subsidiary were as follow:
1. Information regarding securities where the accumulated purchase or sale amounts for the period exceed $300 million or 10% of the Bank’s paid in capital: None.
2. Information on the acquisition of real estate for which the purchase amount exceeded $300 million or 10% of the Bank’s paid-in capital:
Name ofcompany
Name of propertyTransaction
dateTransaction
amountStatus of payment
Counter-party
Relationship with the
Company
If the counter-party is a related party, disclose the previous transfer information References for
determining price
Purpose of acquisition and current condition
OthersOwner
Relationship with the
Company
Date of transfer
Amount
The bank
Ten pieces of Lands located at No 34,35 of Xiande section and No
620-1、626、654、666、671、2763-2 of Aiqun section, Qianzhen District and No 885、932 of Beijin section, Qianjin District, Kaohsiung City, etc.
2016.04 15,238,207
Investee of distribution on surplus property
Kaohsiung Ammonium Sulfate Co., Ltd.
Related party
- - - -Referred to appraisal reports.
Real estate investment
None
3. Information on the disposal of real estate for which the sale amount exceeded $300 million or 10% of the Bank’s paid-in capital: Note.
4. Information regarding discounted processing fees on transactions with related parties for which the amount exceeded $5 million: None.
5. Information regarding receivables from related parties for which the amount exceeded $300 million or 10% of the Bank’s paid-in capital: None.
6. Information regarding selling non-performing loans:
(a) Selling non-performing loans: None.
(b) Selling non-performing loans for which the amount exceeded $1 billion: None.
7. Approved securitization instrument types and related information according to “asset backed securitization” or “mortgage backed securitization”: None.

189188
Financial Information
8. Information on significant transactions between parent and subsidiary company were as follow:
Number Name of Company Name of the counter-party
Existing relationship
with the counter-party
State of transaction
Account name Amount Terms of trading
Percentage of the total
consolidated revenues or total
assets
0 Bank of Taiwan BankTaiwan Insurance Brokers 1 Deposits 414,655
Same as regular
transaction0.01%
1 BankTaiwan Insurance Brokers Bank of Taiwan 2 Placement with banks 414,655 〃 0.01%
0 Bank of Taiwan BankTaiwan Insurance Brokers 1 Cheques deposits 50,000 〃 -%
1 BankTaiwan Insurance Brokers Bank of Taiwan 2 Placement with banks 50,000 〃 -%
0 Bank of Taiwan BankTaiwan Insurance Brokers 1 Other receivables 81,538 〃 -%
1 BankTaiwan Insurance Brokers Bank of Taiwan 2 Other payables 81,538 〃 -%
0 Bank of Taiwan BankTaiwan Insurance Brokers 1 Service fees revenue 1,835,200 〃 4.11%
1 BankTaiwan Insurance Brokers Bank of Taiwan 2 Service fees expenses 1,835,200 〃 4.11%
0 Bank of Taiwan BankTaiwan Insurance Brokers 1 Miscellaneous revenues 480 〃 -%
1 BankTaiwan Insurance Brokers Bank of Taiwan 2 Administrative expense 480 〃 -%
0 Bank of Taiwan BankTaiwan Insurance Brokers 1 Refundable deposits 769 〃 -%
1 BankTaiwan Insurance Brokers Bank of Taiwan 2 Guarantee deposits paid 769 〃 -%
0 Bank of Taiwan BankTaiwan Insurance Brokers 1 Miscellaneous revenue 12,231 〃 0.03%
1 BankTaiwan Insurance Brokers Bank of Taiwan 2 Operating expenses 12,231 〃 0.03%
0 Bank of Taiwan BankTaiwan Insurance Brokers 1 Other operating income 4,428 〃 0.01%
1 BankTaiwan Insurance Brokers Bank of Taiwan 2 Operating expenses 4,428 〃 0.01%
0 Bank of Taiwan BankTaiwan Insurance Brokers 1 Interest payables 10 〃 -%
1 BankTaiwan Insurance Brokers Bank of Taiwan 2 Interest receivables 10 〃 -%
0 Bank of Taiwan BankTaiwan Insurance Brokers 1 Interest expenses 441 〃 -%
1 BankTaiwan Insurance Brokers Bank of Taiwan 2 Interest incomes 441 〃 -%
Note 1: Number is based on the following rules:
1) The parent company is 0.
2) Subsidiaries are numbered by company from 1.
Note 2: The relation with trader is numbered as follow:
1) The parent company to its subsidiary is 1.
2) The subsidiary to its parent company is 2.
Note 3: The transactions mention above have already write-off when building the financial report.
9. Other material transaction items which were significant to people who use the information in the financial statements: None.

2016 ANNUAL REPORT
BANK FTAIWAN
191190
2) Information on investees:
The followings are the information on investees during 2016:Unit: In thousand of TWD
Name of the
investeeInvestee
LocationMajor
Operation % of sharesOriginal
investment amount
Gain(Loss)recognized
during the
period
Held by the bank and related party at year-end
NotesShares
Subtotal
Shares % of Shares
Hua Nan Financial Holdings Co., Ltd.
NO.38, Sec. 1, Chung-King South Road, Taipei, Taiwan
Financial Holding 21.23% 33,751,821 2,990,692 2,637,894 - 2,637,894 25.07%
Tang Eng Iron Works Co., Ltd.
5F., No.53, Zhonghua 4th Rd., Kaohsiung City, Taiwan
Iron Industry 21.37% 1,284,061 107,566 74,802 - 74,802 21.37%
Kaohsiung Ammonium Sulfate Co., Ltd.
No.4, Yanhai 2nd Rd., Kaohsiung City, Taiwan
Liquidation -% - 13,312,318 - - - -%
Tai Yi Real Estate Management Co., Ltd.
3F., No.56, Dunhua N. Rd.,Taipei City, Taiwan
Real Estate Service 30.00% 19,642 3,344 1,500 - 1,500 30.00%
BankTaiwan Insurance Brokers Co., Ltd.
4F, No. 49, Wu Chang St., Taipei City, Taiwan
Insurance Brokers 100.00% 441,926 307,743 2,000 - 2,000 100.00%
Note 1: The shares held or to be held by The Bank or its directors, supervisors, president, vice president and investees held by the affiliates as defined in the Company Act shall be included.
Note 2: 1) The shares to be held shall mean the shares acquired upon conversion, as hypothesized, of equity securities purchased or contracted for derivative products concluded (not yet converted to equity) in accordance with the trading terms and conditions and The Bank’s intent to link with the reinvested enterprise’s equity for the purpose of reinvestment provided in Article 74 of the Act.
2) The “equity securities” referred to in the preceding paragraph shall mean the valuable securities referred to in Paragraph 1 of Article 11 of the Securities and Exchange Law Enforcement Rules, e.g. convertible corporate bond and warrant.
3) The “derivative products” referred to in the preceding paragraph shall comply with the definition of derivative products referred to in Statement of Financial Accounting Standards No. 34, e.g. stock option.
Note 3: The table do not need to disclosure in the financial statement at first and third quarter.
Note 4: This transaction had been written off when preparation the consolidated financial statements.

191190
Financial Information
3) Information regarding investment in China:
1. Information on investees’ names, locations, etc. in China:Unit:In thousands of TWD
Investee
CompanyMain
BusinessTotal Amount of Paid-in Capital
Investment types
(Note1)
Accumulated outflow of
Investment from
Taiwan as of January 1, 2015
Investment flowsAccumulated
outflow of investment from
Taiwan as of December 31, 2015
Net income from
investee
% of shares
Equity in the
Earnings
(gains) (Note2)
Carrying value as of December 31, 2015
Accumulated
inward remittance of earnings as of December 31,
2015
Outflow Regain
Bank of Taiwan,
Shanghai Branch
Banking business
4,624,000
CNY1,000,000(3)
4,624,000
CNY1,000,000- -
4,624,000
CNY1,000,000- -% (115,550) 5,547,796 -
Bank of Taiwan,
Guangzhou Branch
Banking business
4,624,000
CNY1,000,000(3)
4,624,000
CNY1,000,000- -
4,624,000
CNY1,000,000- -% (172,966) 4,899,430 -
Bank of Taiwan Fuzhou Branch
Banking business
4,624,000
CNY1,000,000(3) -
4,624,000
CNY1,000,000-
4,624,000
CNY1,000,000- -% (179,823) 4,782,951 -
Note 1: Three types of investments:
1) Direct investment in Mainland China.
2) Investment in Mainland China through a company set up in a third region.
3) Others through overseas branches.
Note 2: Equity in the earnings for the year:
1) If a subsidiary has no income or loss during the period, the parent company should disclose all the related information.
2) A Company can recognize the investment income by obtaining the followings:
a) Financial statements audited or reviewed by an international accounting firm which has a member firm in Taiwan.
b) Financial statements audited or reviewed by the auditor of the parent company.
c) Others.
3) If the information regarding a subsidiary’s current profit and loss is not available, the parent company should disclose it.
Note 3: Numbers in this table are shown in thousands of TWD.

2016 ANNUAL REPORT
BANK FTAIWAN
193192
2. Rationed investment in China: Unit: In thousands of TWD
Current period of accumulate investment amount remitting from Taiwan
The rationed investing amount approved by Investment Commission, MOEA
The regulation announced by Investment Commission, MOEA rationed investing amount
13,872,000 13,872,000 164,666,533
4) Subsidiaries lending to other parties, guarantees and endorsements for other parties, securities held as of December 31, 2016, securities for which purchase or sale amount for the period exceed $300 million or 10% of the Bank’s paid-in capital, and trading in derivative financial instruments: None.
(54) Segment Information The Bank has five departments need to be disclosed. Each department provides different services and products, and managed separately based on their diverse techniques and marketing tactic. The higher level managements of the Bank review each department’s internal management report on quarterly basis. The information of asset and income disclose by segments follow the significant accounting policies stated above. The operation businesses of the segments which need to be disclosed were as follow:
1) Bank department: include transacting deposit, loan, and foreign exchange; dispatching, managing, performing TWD and foreign currency; investing in securities, and analyzing, managing interest for loan and deposit, and etc.
2) Government employees’ insurance department: include managing government employees’ insurance business; auditing insurance, cash settlement, and issue business; analyzing, managing, and taking statistics of government employees’ insurance business, and etc.
3) Department of Procurement: include managing government institutions, public schools, and public enterprises’ centralized purchasing business; being agency of government institutions, public schools, and public enterprises for inter-entity supply contract, and etc.
4) Department of Precious Metals: include managing gold, silver, precious metals and analyzing customs duty; gold, silver and precious metals intermediary trading, planning, marketing, training, settlement, risk management, assuring and etc.
5) BankTaiwan Insurance Broker: operation businesses include insuring personal, property insurance, related services, and the business approved by the authority which related to insurance broker.

193192
Financial Information
2016
Bank department
Department of Government Employees Insurance
Department of Procurement
Department of Precious Metals
BankTaiwan Insurance Brokers
Reconciliation and elimination Total
Interest income $ 57,731,311 1,670,627 86 761 441 (441) 59,402,785
Less: interest expense 33,367,744 - - - - (441) 33,367,303
Interest income, net 24,363,567 1,670,627 86 761 441 - 26,035,482
Non-interest income, net 28,863,755 10,716,965 254,992 34,140 505,950 (307,745) 40,068,057
Other non-interest income (9,544,661) (12,252,954) (8,440) 414,897 (1,390) (17,139) (21,409,687)
Net revenue 43,682,661 134,638 246,638 449,798 505,001 (324,884) 44,693,852
Bad debt expenses and reserve for guarantees (5,183,736) - - - - - (5,183,736)
Operating expenses (19,625,638) (134,638) (110,134) (88,026) (134,205) 17,141 (20,075,500)
Continuing operating income before income tax $ 18,873,287 - 136,504 361,772 370,796 (307,743) 19,434,616
Continuing operating income after inocme tax $ 17,070,050 - 136,504 361,772 307,744 (307,743) 17,568,327
Total assets $ 4,506,782,319 264,873,580 2,032,309 1,908,219 580,974 (5,582,720) 4,770,594,681
Total Liabilities $ 4,232,836,373 264,873,580 1,895,805 1,546,447 139,048 (5,140,794) 4,496,150,459
2015
Bank department
Department of Government Employees Insurance
Department of Procurement
Department of Precious Metals
BankTaiwan Insurance Brokers
Reconciliation and elimination Total
Interest income $ 63,122,782 1,635,156 80 314 528 (528) 64,758,332
Less: interest expense 36,352,683 - - - - (528) 36,352,155
Interest income, net 26,770,099 1,635,156 80 314 528 - 28,406,177
Non-interest income, net 17,837,311 (1,012,349) 276,462 13,777 409,074 (235,297) 17,288,978
Other non-interest income (10,356,342) (485,914) (11,805) 389,444 (692) (16,465) (10,481,774)
Net revenue 34,251,068 136,893 264,737 403,535 408,910 (251,762) 35,213,381
Bad debt expenses and reserve for guarantees (4,404,687) 219 - - - - (4,404,468)
Operating expenses (19,768,189) (137,112) (107,779) (85,330) (125,420) 16,467 (20,207,363)
Continuing operating income before income tax $ 10,078,192 - 156,958 318,205 283,490 (235,295) 10,601,550
Continuing operating income after inocme tax $ 8,395,535 - 156,958 318,205 235,295 (235,295) 8,870,698
Total assets $ 4,489,795,554 246,237,272 2,063,483 1,531,741 463,599 (7,603,203) 4,732,488,446
Total Liabilities $ 4,235,423,437 246,237,272 1,906,525 1,213,536 141,180 (7,280,784) 4,477,641,166

2016 ANNUAL REPORT
BANK FTAIWAN
195194
Ⅴ. Individual Financial Statements of Recent Years, and Independent Auditors’ Report
Independent Auditor’s Report
To the Board of Directors of Bank of Taiwan:
OpinionWe have audited the financial statements of Bank of Taiwan (“the Bank”), which comprise the balance
sheets as of December 31, 2016 and 2015, the statements of comprehensive income, changes in equity and cash flows for the years ended December 31, 2016 and 2015, and notes to the financial statements, including a summary of significant accounting policies.
In our opinion, based on our audits and the report of other auditors (please refer to Other Matter paragraph), the accompanying financial statements present fairly, in all material respects, the financial position of the Bank as of December 31, 2016 and 2015, and the results of its operations and its cash flows for the years then ended in accordance with the “Regulations Governing the Preparation of Financial Reports by Public Banks” and the “Regulations Governing the Preparation of Financial Reports by Securities Firms”.Basis for Opinion
We conducted our audit in accordance with the “Regulations Governing Auditing and Certification of Financial Statements of Financial Institutions by Certified Public Accountants” and the auditing standards generally accepted in the Republic of China. Our responsibilities under those standards are further described in the Auditors’ Responsibilities for the Audit of the Financial Statements section of our report. We are independent of Bank of Taiwan in accordance with the Certified Public Accountants Code of Professional Ethics in Republic of China (“the Code”), and we have fulfilled our other ethical responsibilities in accordance with the Code. We believe that the audit evidence we have obtained, inclusive of the report from other auditors, is sufficient and appropriate to provide a basis of our opinion. Emphasis of Matter
In accordance with the Audit Act and other governmental regulations of Taiwan, the financial statements of the Bank are required to be examined and certified by the Ministry of Audit (the “MoA”). The financial statements of the Bank as of, and for year ended 2015 were restated to reflect the adjustments made by the MoA. For further information, please see Note 52 (2).

195194
Financial Information
Other MatterAs stated in Note 15, we have not audited the financial statements of Hua Nan Financial Holdings Co.,
Ltd. and Tai Yi Real Estate Co., Ltd. The Bank recognized its investments in Hua Nan Financial Holdings Co., Ltd. and Tai Yi Real Estate Co., Ltd. under equity method amounting to $33,771,463 thousand and $32,515,803 thousand, respectively, constituting 0.71% and 0.69% of the total assets as of December 31, 2016 and 2015, respectively; and its shares of investment profits in associates accounted for using equity method amounting to $2,994,036 thousand and $2,992,791 thousand, respectively, constituting 15.46% and 28.36% of the related income before income tax for the year ended December 31, 2016 and 2015, respectively. Those financial statements were audited by other auditors, whose reports have been furnished to us, and our review, insofar as it relates to the amounts included for those companies, is based solely on the reports of the other auditors.Key Audit Matters
Key audit matters are those matters that, in our professional judgment, were of most significance in our audit of the financial statements for the year ended December 31, 2016. These matters were addressed in the context of our audit of the financial statements as a whole, and in forming our opinion thereon, and we do not provide a separate opinion on these matters.1. The assessment of loans impairment
Please refer to Note 4(12) “Impairment of assets” for related accounting policy, Note 5(1) “Assessments of loans impairment” for the uncertainty of accounting estimation and assumptions, and Note 12 “Loans and discounts, net” for the details of the assessment of loans impairment.Description of key audit mattersWhen conducting credit business, the Bank shall assess whether there is any indication that loans may be impaired because the Bank will assume credit risk if loans are not repaid. The Bank first assesses the impairment loss of loans in accordance with IAS 39, and such amount of allowance for doubtful accounts shall not be lower than the amount calculated in accordance with the “Regulations Governing the Procedures for Banking Institutions to Evaluate Assets and Deal with Non performing/Non accrual Loans”. When the Bank, individually or collectively, assesses its impairment loss of loans according to IAS 39, the uses of assumptions, such as effective interest rates, recovery rates and future cash flows, involved the exercise of judgment which usually have significant impacts on the results. In addition, the Bank recognized its loans and allowance for doubtful accounts of $2,307,049,291 thousand and $32,812,787 thousand, respectively, as of December 31, 2016. These accounts are material to the Bank. Therefore, the assessment of loans impairment has been identified as a key audit matter in our audit.How the matter was addressed in our auditOur principal audit procedures included (i) testing the internal control procedures over credit operations, and inspecting the meeting minutes of both the Board of Directors and the Assets and Liabilities Management Committee regarding credit business; (ii) executing substantive analytical procedure and analyzing the structure and movement of loans; (iii) inspecting whether the process of determining parameters were conducted in accordance with the related internal guidelines, as well as evaluating the reasonableness of adjusting the parameters; (iv) executing the retrospective testing of last year’s allowance for doubtful accounts which had already been recognized; (v) checking the accuracy of allowance for doubtful accounts calculated in accordance with the “Regulations Governing the Procedures for Banking Institutions to Evaluate Assets and Deal with Non performing/Non accrual Loans”; (vi) assessing whether the disclosures appropriately reflected the Bank’s exposure to credit risk.

2016 ANNUAL REPORT
BANK FTAIWAN
197196
2. The valuation of financial instrumentsPlease refer to Note 4 (6) “Financial instruments” for related accounting policy, Note 5 (2) “The valuation of financial instruments” for the uncertainty of accounting estimation and assumptions, and Note 43 “The fair value and fair value hierachy of the financial instruments” for details of the valuation of financial instruments.Description of key audit mattersOf the financial instruments measured at fair value through profit and loss and other comprehensive income held by the Bank, other than those that fair value can be observed in an open market, fair value of the financial instruments classified as level 2 and 3 in the fair value hierarchy shall be calculated via models. The parameters of modeling inputs often involved the exercise of judgment and the uses of different valuation techniques and assumptions that may generate significant different results. The financial assets and liabilities measured at fair value held by the Bank as of December 31, 2016 amounted to $1,449,047,752 thousand and $43,938,109 thousand, respectively. Among them, the financial assets and liabilities measure at fair value other than those classified as level 1 were $1,045,142,592 thousand and $6,853,258 thousand, respectively. The amounts are material to the Bank. Therefore, the valuation of financial instruments has been identified as a key audit matter in our audit.How the matter was addressed in our auditOur main audit procedures included (i) reviewing the accounting policy on fair value of financial instruments measurement and disclosure, as well as testing the controls over the investment cycle and related financial reporting process, including initial recognition, subsequent measurement and disclosure; (ii) sampling of the financial instruments measured at fair value with an active market to test whether the prices are appropriate and accurate; (iii) appointing our valuation specialists to assess the reasonableness of the models and parameters the Bank used to measure its fair value of financial instruments without an active market; (iv) assessing whether the fair value information is disclosed in accordance with the International Financial Reporting Standards.
3. The assessment of impairment of financial assetsPlease refer to Note 4 (12) “Impairment of assets” for related accounting policy, Note 5 (3) “The assessment of impairment of financial assets” for the uncertainty of accounting estimation and assumptions, and Note 13 “Available-for-sale financial assets, net”, Note 14 “Held-to-maturity financial assets, net” and Note 16 “Other financial assets, net” for the details of the assessment of impairment of financial assets.Description of key audit mattersWhen assessing whether there is any indication that financial assets other than measured at fair value through profit or loss may be impaired, the Bank relies on management for considering all kinds of observable data to determine whether objective evidence of impairment exists on the reporting date. If there is such evidence exists, then the Bank shall calculate the amount of impairment loss by further estimating the future cash flow and effective interest rate or current market return. The decision involved the exercise of judgment and the financial assets of $1,200,968,157 thousand should be included in the scope of test of impairment as of December 31, 2016. The amount is material to the Bank. Therefore, the assessment of impairment of financial assets has been identified as a key audit matter in our audit.

197196
Financial Information
How the matter was addressed in our auditOur principal audit procedures included (i) inspecting the internal guidelines of impairment assessment and obtaining the Bank’s self assessment report of impairment; (ii) testing the Bank’s procedures on the assessment of impairment of financial assets and related internal controls; (iii) testing the accuracy and adequacy of management’s assessment of impairment of financial assets; (iv) assessing the reasonableness of the Bank’s conclusions of whether to recognized an impairment loss based on our understanding, and the evidence we have collected from other audit procedures.
4. Investments associates accounted for using equity method – the recognition of liquidation surplus of Kaohsiung Ammonium Sulfate Co., Ltd.Please refer to Note 4 (7) “Investments in associates” and Note 4 (10) “Investment property” for related accounting polices, Note 5 (4) “Fair value of investment property” for the uncertainty of accounting estimation and assumptions, Note 15 “Investments accounted for using equity method – net” for details of investments associates accounted for using equity method – the recognition of liquidation profit and loss of Kaohsiung Ammonium Sulfate Co., Ltd., and Note 18 “Investment property” for the details of the valuation of investment property.Description of key audit mattersKaohsiung Ammonium Sulfate Co., Ltd., one of the associates of the Bank under the equity method, resolved to dissolve and liquidate and then distributed its surplus based on its 2016 shareholders’ equity ratio. The Bank received the allocation of surplus including cash and several pieces of land amounting to $232,412 thousand and $15,238,207 thousand, respectively. The value of the said land was obtained from independent appraisers, wherein its appraisal involved the exercise of judgment and the uses of different valuation techniques and assumptions that may generate significant different results. Therefore, the valuation of investment property and the recognition of liquidation surplus have been identified as a key audit matter in our audit.How the matter was addressed in our auditOur principal audit procedures included (i) reviewing the minutes of shareholders meeting of Kaohsiung Ammonium Sulfate Co., Ltd. about the liquidation and distribution of its residual property; (ii) acquiring the appraisal reports performed by two independent agencies appointed by Kaohsiung Ammonium Sulfate Co., Ltd., and inspecting whether the valuation approaches and parameters have significant difference between the appraisal reports; (iii) evaluating the independence and competence of the evaluator; (iv) assessing whether the related disclosures are sufficient and appropriate.
Responsibilities of Management and Those Charged with Governance for the Financial StatementsManagement is responsible for the preparation and fair presentation of the financial statements in
accordance with the“Budget Law”, “Account Settlement Law”, “Uniform Regulations on Accounting Systems for Banks Governed by the Ministry of Finance”, “Regulations Governing the Preparation of Financial Reports by Public Banks” and with “Regulations Governing the Preparation of Financial Reports by Securities Firms”, and for such internal control as management determines is necessary to enable the preparation of financial statements that are free from material misstatement, whether due to fraud or error.
In preparing the financial statements, management is responsible for assessing the Bank’s ability to continue as a going concern, disclosing, as applicable, matters related to going concern and using the going concern basis of accounting unless management either intends to liquidate the Bank or to cease operations, or has no realistic alternative but to do so.
Those charged with governance (including members of the Audit Committee) are responsible for overseeing the Bank’s financial reporting process.

2016 ANNUAL REPORT
BANK FTAIWAN
199198
Auditors’ Responsibilities for the Audit of the Financial StatementsOur objectives are to obtain reasonable assurance about whether the financial statements as a whole
are free from material misstatement, whether due to fraud or error, and to issue an auditors’ report that includes our opinion. Reasonable assurance is a high level of assurance, but is not a guarantee that an audit conducted in accordance with the auditing standards generally accepted in the Republic of China will always detect a material misstatement when it exists. Misstatements can arise from fraud or error and are considered material if, individually or in the aggregate, they could reasonably be expected to influence the economic decisions of users taken on the basis of these financial statements.
As part of an audit in accordance with auditing standards generally accepted in the Republic of China, we exercise professional judgment and maintain professional skepticism throughout the audit. We also: 1. Identify and assess the risks of material misstatement of the financial statements, whether due to fraud
or error, design and perform audit procedures responsive to those risks, and obtain audit evidence that is sufficient and appropriate to provide a basis for our opinion. The risk of not detecting a material misstatement resulting from fraud is higher than for one resulting from error, as fraud may involve collusion, forgery, intentional omissions, misrepresentations, or the override of internal control.
2. Obtain an understanding of internal control relevant to the audit in order to design audit procedures that are appropriate in the circumstances, but not for the purpose of expressing an opinion on the effectiveness of the Bank’s internal control.
3. Evaluate the appropriateness of accounting policies used and the reasonableness of accounting estimates and related disclosures made by management.
4. Conclude on the appropriateness of management’s use of the going concern basis of accounting and, based on the audit evidence obtained, whether a material uncertainty exists related to events or conditions that may cast significant doubt on Bank of Taiwan’s ability to continue as a going concern. If we conclude that a material uncertainty exists, we are required to draw attention in our auditors’ report to the related disclosures in the financial statements or, if such disclosures are inadequate, to modify our opinion. Our conclusions are based on the audit evidence obtained up to the date of our auditors’ report. However, future events or conditions may cause Bank of Taiwan to cease to continue as a going concern.
5. Evaluate the overall presentation, structure and content of the financial statements, including the disclosures, and whether the financial statements represent the underlying transactions and events in a manner that achieves fair presentation.
6. Obtain sufficient and appropriate audit evidence regarding the financial information of the investment in other entities accounted for using the equity method to express an opinion on this financial statements. We are responsible for the direction, supervision and performance of the audit. We remain solely responsible for our audit opinion.We communicate with those charged with governance regarding, among other matters, the planned
scope and timing of the audit and significant audit findings, including any significant deficiencies in internal control that we identify during our audit.

199198
Financial Information
From the matters communicated with those charged with governance, we determine those matters that were of most significance in the audit of the financial statements for the year ended December 31, 2016 and are therefore the key audit matters. We describe these matters in our auditors’ report unless law or regulation precludes public disclosure about the matter or when, in extremely rare circumstances, we determine that a matter should not be communicated in our report because the adverse consequences of doing so would reasonably be expected to outweigh the public interest benefits of such communication.
The engagement partners on the audit resulting in this independent auditor’s report are Yen-Ling Fang and Feng-Hui Lee.
KPMGTaipei, Taiwan (Republic of China)March 17, 2017
Note to ReadersThe accompanying financial statements are intended only to present the statement of financial position, financial
performance and its cash flows in accordance with the accounting principles and practices generally accepted in the Republic of China and not those of any other jurisdictions. The standards, procedures and practices to audit such financial statements are those generally accepted and applied in the Republic of China.
The auditors’ report and the accompanying financial statements are the English translation of the Chinese version prepared and used in the Republic of China. If there is any conflict between, or any difference in the interpretation of the English and Chinese language auditors’ report and financial statements, the Chinese version shall prevail.

2016 ANNUAL REPORT
BANK FTAIWAN
201200
(English Translation of Financial Statements and Report Originally Issued in Chinese)Bank of TaiwanBalance Sheets
December 31, 2016 and 2015(expressed in thousands of New Taiwan dollars)
December 31, 2016 December 31, 2015Amount % Amount %
Assets
Cash and Cash Equivalents $ 122,398,626 3 135,422,418 3
Placement with Central Bank and Call Loans to Banks 687,235,976 14 585,963,772 13
Financial Assets Measured at Fair Value through Profit or Loss 212,560,998 4 173,005,205 4
Hedging Derivative Financial Assets, Net 21,221 - 15,970 -
Bills and Bonds Purchased under Resell Agreements - - 50,040 -
Receivables, Net 63,288,567 1 72,046,562 2
Current Income Tax Assets 761,630 - 1,343,508 -
Loans and Discounts, Net 2,274,236,504 48 2,386,598,795 50
Available-for-Sale Financial Assets, Net 1,037,841,339 22 1,053,598,710 22
Held-to-Maturity Financial Assets, Net 138,812,328 3 113,786,391 2
Investments under Equity Method, Net 35,497,450 1 36,178,241 1
Other Financial Assets, Net 76,578,794 2 68,891,471 1
Property and Equipment, Net 96,691,099 2 96,728,064 2
Investment Property, Net 15,238,207 - - -
Intangible Assets, Net 802,989 - 853,571 -
Deferred Tax Assets 293,925 - 472,085 -
Other Assets, Net 8,742,952 - 7,817,258 -
Total assets $ 4,771,002,605 100 4,732,772,061 100

201200
Financial Information
December 31, 2016 December 31, 2015Amount % Amount %
Liabilities and Stockholders’ Equity
Liabilities:
Deposits of Central Bank and other banks $ 227,596,814 5 225,425,517 5
Financial Liabilities Measured at Fair Value through Profit or Loss 6,709,063 - 39,224,475 1
Hedging Derivative Financial Liabilities, Net 144,195 - 243,967 -
Bills and Bonds Sold under Repurchase Agreements 11,337,914 - 16,336,619 -
Payables 41,495,209 1 42,195,648 1
Current Income Tax Liabilities 615,264 - 368,527 -
Deposits and Remittances 3,874,447,418 82 3,837,851,868 81
Financial bonds payable 24,998,082 1 24,997,826 1
Other Financial Liabilities 748,855 - 1,785,430 -
Provision 283,367,966 6 264,199,252 6
Deferred Tax Liabilities 18,173,159 - 18,340,284 -
Other Liabilities 6,924,444 - 6,955,368 -
Total liabilities 4,496,558,383 95 4,477,924,781 95
Capital stock 95,000,000 2 95,000,000 2
Capital surplus 80,453,034 2 80,453,034 2
Retained earnings:
Legal reserve 34,201,365 1 31,822,306 1
Special reserve 22,686,273 - 19,514,195 -
Unappropriated retained earnings 18,815,254 - 7,953,744 -
75,702,892 1 59,290,245 1
Other equity 23,288,296 - 20,104,001 -
Total equity 274,444,222 5 254,847,280 5
Total liabilities and stockholders’ equity $ 4,771,002,605 100 4,732,772,061 100

2016 ANNUAL REPORT
BANK FTAIWAN
203202
(English Translation of Financial Statements and Report Originally Issued in Chinese)BANK OF TAIWAN
Statements of Comprehensive IncomeFor the years ended December 31, 2016 and 2015
(expressed in thousands of New Taiwan dollars, except earnings per share)2016 2015 Percentage
ChangeAmount % Amount %
Revenue and income: Interest income $ 59,402,785 132 64,758,332 185 (8)Less: Interest expense (33,367,745) (75) (36,352,682) (103) (8)
Net interest income 26,035,040 57 28,405,650 82 (8)Non-interest income, NetService fees, Net 5,123,733 12 5,050,126 14 1Gain (loss) on financial assets or liabilities measured at fair value through profit or loss 16,322,868 37 1,494,095 4 992
Realized gain (loss) on available-for-sale financial assets 2,131,822 5 1,496,244 4 42Foreign exchange gain (loss) (457,893) (1) 4,714,349 13 (110)Provision of impairment loss on assets 27,659 - 17,323 - 60Share of profit (loss) of associates and joint ventures accounted for using equity method 16,721,663 38 4,343,065 12 285
Premiums loss (7,092,220) (16) (11,891,973) (33) 40Sales income 542,536 1 499,423 1 9Subsidized income from government 13,754,258 31 16,970,331 48 (19)Excess interest expenses (10,776,632) (24) (11,006,282) (30) 2Provisions for policyholders’ reserve premium, Net (18,843,200) (42) (5,529,029) (16) (241)Other miscellaneous income, Net 1,024,100 2 492,913 1 108
Net Revenue 44,513,734 100 35,056,235 100 27Bad debt expense and reserve for guarantees (5,183,736) (12) (4,404,468) (13) 18
Expenses:Employee benefits expenses (11,918,381) (27) (11,782,328) (34) 1Depreciation and amortization expenses (1,103,835) (2) (1,111,528) (3) (1)Other general and administrative expenses (6,936,219) (16) (7,204,554) (21) (4)
Total Expenses (19,958,435) (45) (20,098,410) (58) (1)Operating Income, Net 19,371,563 43 10,553,357 29 84
Net income before income tax 19,371,563 43 10,553,357 29 84Income Tax Expenses (1,722,592) (4) (1,682,659) (5) (2)Net income 17,648,971 39 8,870,698 24 99Other comprehensive income:
Components of other comprehensive income that will not be reclassified to profit or loss
Gains (losses) on remeasurements of the defined benefit plans (744,381) (2) (704,656) (2) (6)Shares of other comprehensive income of associates and joint ventures accounted for using equity method (105,554) - (122,172) - 14
Income tax related to items that will not be reclassified to profit or loss - - - - -
Total items that will not be reclassified to profitt or loss (849,935) (2) (826,828) (2) (3)Components of other comprehensive income that may be subsequently reclassified to profit or loss
Exchange difference arising on translation of foreign operation (468,214) (1) 634,243 2 (174)Unrealized gains (losses) on available-for-sale financial assets 4,003,761 9 (5,304,740) (15) 175Shares of other comprehensive income of associates and joint ventures accounted for using equity method (309,797) (1) 1,229,545 4 (125)
Income tax related to items that may be subsequently reclassified to profit or loss (27,844) - 31,920 - (187)
Subtotal 3,197,906 7 (3,409,032) (9) 194Other comprehensive income (net amount after tax) 2,347,971 5 (4,235,860) (11) 155Total comprehensive income $ 19,996,942 44 4,634,838 13 331Basic earnings per share (In dollars) $ 1.86 0.93
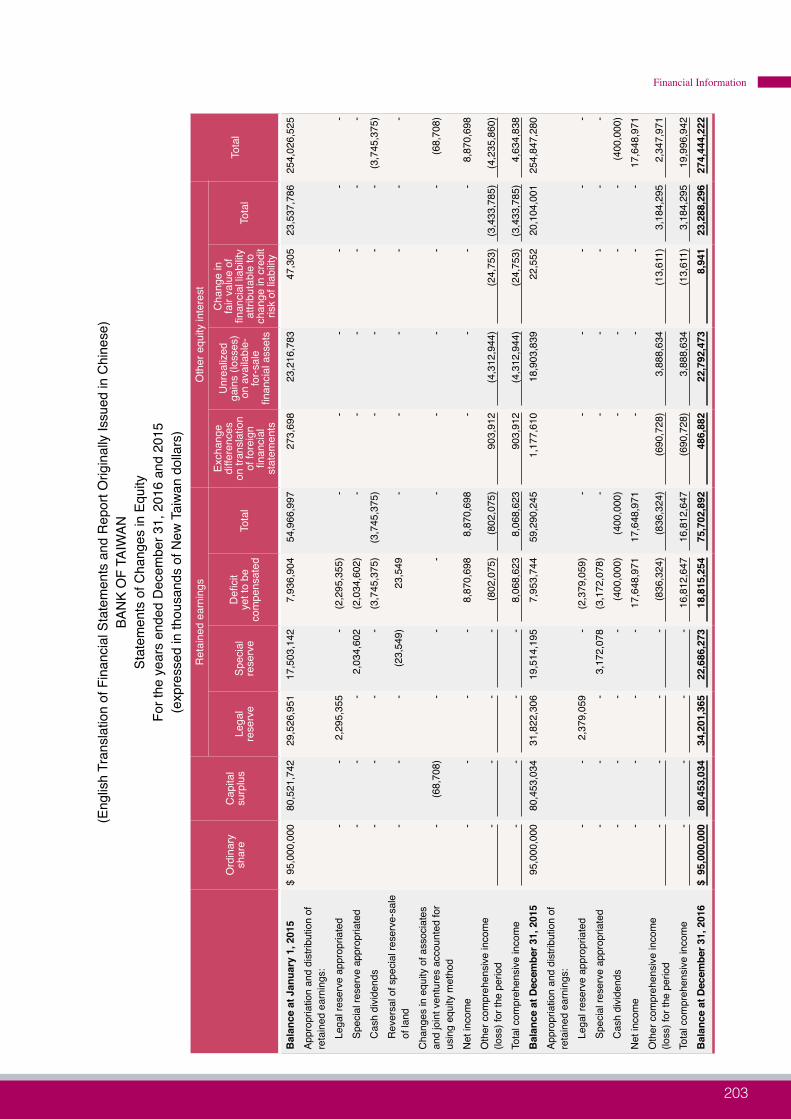
203202
Financial Information
(Eng
lish
Tran
slat
ion
of F
inan
cial
Sta
tem
ents
and
Rep
ort O
rigin
ally
Issu
ed in
Chi
nese
)BA
NK
OF
TAIW
ANSt
atem
ents
of C
hang
es in
Equ
ityFo
r the
yea
rs e
nded
Dec
embe
r 31,
201
6 an
d 20
15(e
xpre
ssed
in th
ousa
nds
of N
ew T
aiw
an d
olla
rs)
Ord
inar
y sh
are
Cap
ital
surp
lus
Ret
aine
d ea
rnin
gsO
ther
equ
ity in
tere
st
Tota
lLe
gal
rese
rve
Spec
ial
rese
rve
Defi
cit
yet t
o be
co
mpe
nsat
edTo
tal
Exch
ange
di
ffere
nces
on
tran
slat
ion
of fo
reig
n fin
anci
al
stat
emen
ts
Unr
ealiz
ed
gain
s (lo
sses
) on
ava
ilabl
e-fo
r-sal
e fin
anci
al a
sset
s
Cha
nge
in
fair
valu
e of
fin
anci
al li
abilit
y at
tribu
tabl
e to
ch
ange
in c
redi
t ris
k of
liab
ility
Tota
l
Bal
ance
at J
anua
ry 1
, 201
5 $
95,
000,
000
80,5
21,7
4229
,526
,951
17,5
03,1
427,
936,
904
54,9
66,9
9727
3,69
823
,216
,783
47,3
0523
,537
,786
254,
026,
525
Appr
opria
tion
and
dist
ribut
ion
of
reta
ined
ear
ning
s:
Lega
l res
erve
app
ropr
iate
d-
-2,
295,
355
-(2
,295
,355
)-
--
--
-Sp
ecia
l res
erve
app
ropr
iate
d-
--
2,03
4,60
2(2
,034
,602
)-
--
--
-C
ash
divi
dend
s-
--
-(3
,745
,375
)(3
,745
,375
)-
--
-(3
,745
,375
)R
ever
sal o
f spe
cial
rese
rve-
sale
of
land
--
-(2
3,54
9)23
,549
--
--
--
Cha
nges
in e
quity
of a
ssoc
iate
s an
d jo
int v
entu
res
acco
unte
d fo
r us
ing
equi
ty m
etho
d-
(68,
708)
--
--
--
--
(68,
708)
Net
inco
me
--
--
8,87
0,69
88,
870,
698
--
--
8,87
0,69
8O
ther
com
preh
ensi
ve in
com
e (lo
ss) f
or th
e pe
riod
-
-
-
-
(8
02,0
75)
(8
02,0
75)
90
3,91
2
(4,3
12,9
44)
(2
4,75
3) (
3,43
3,78
5)
(4,2
35,8
60)
Tota
l com
preh
ensi
ve in
com
e
-
-
-
-
8,06
8,62
3
8,06
8,62
3
903,
912
(4
,312
,944
)
(24,
753)
(3,
433,
785)
4,
634,
838
Bal
ance
at D
ecem
ber 3
1, 2
015
95,0
00,0
0080
,453
,034
31,8
22,3
0619
,514
,195
7,95
3,74
459
,290
,245
1,17
7,61
018
,903
,839
22,5
5220
,104
,001
254,
847,
280
Appr
opria
tion
and
dist
ribut
ion
of
reta
ined
ear
ning
s:
Lega
l res
erve
app
ropr
iate
d-
-2,
379,
059
-(2
,379
,059
)-
--
--
-Sp
ecia
l res
erve
app
ropr
iate
d-
--
3,17
2,07
8(3
,172
,078
)-
--
--
-C
ash
divi
dend
s-
--
-(4
00,0
00)
(400
,000
)-
--
-(4
00,0
00)
Net
inco
me
--
--
17,6
48,9
7117
,648
,971
--
--
17,6
48,9
71O
ther
com
preh
ensi
ve in
com
e (lo
ss) f
or th
e pe
riod
-
-
-
-
(8
36,3
24)
(8
36,3
24)
(6
90,7
28)
3,
888,
634
(1
3,61
1)
3,18
4,29
5
2,34
7,97
1
Tota
l com
preh
ensi
ve in
com
e
-
-
-
-
16,8
12,6
47
16,8
12,6
47
(690
,728
)
3,88
8,63
4
(13,
611)
3,
184,
295
19
,996
,942
Bal
ance
at D
ecem
ber 3
1, 2
016
$ 95
,000
,000
80,
453,
034
34,
201,
365
22
,686
,273
18
,815
,254
75
,702
,892
48
6,88
2
22,7
92,4
73
8,94
123
,288
,296
274,
444,
222

2016 ANNUAL REPORT
BANK FTAIWAN
205204
(English Translation of Financial Statements and Report Originally Issued in Chinese)BANK OF TAIWAN
Statements of Cash FlowsFor the years ended December 31, 2016 and 2015
(expressed in thousands of New Taiwan dollars)
2016 2015
Cash flows from (used in) operating activities :
Net income before income tax $ 19,371,563 10,553,357
Adjustments :
Adjustments to reconcile profit (loss)
Depreciation expense 788,281 797,327
Amortization expense 360,743 357,121
Provision for bad debt expense 5,183,736 4,404,468
Interest expense 33,367,745 36,352,682
Interest income (59,402,785) (64,758,332)
Dividend income (6,419,120) (5,776,027)
Net change in other provisions 18,843,004 5,529,413
Reversal of impairment loss on inventory (3,430) (13,942)
Share of profit of associates and joint ventures accounted for using equity method (16,721,663) -
Loss (gain) on disposal of property and equipment 31,493 (20,630)
Reversal of impairment loss on property and equipment (27,659) (17,323)
Others - (141)
Total adjustments to reconcile profit (loss) (23,999,655) (23,145,384)
Changes in operating assets and liabilities :
Changes in operating assets:
Decrease in placement with Central Bank and call loans to banks 50,381,710 7,416,537
(Increase) decrease in financial assets measured at fair value through profit or loss (40,268,377) 33,052,945
(Increase) decrease in hedging financial assets (5,251) 9,643
Decrease (increase) decrease in receivables 8,729,565 (9,838,875)
Decrease (increase) in loans and discounts 107,195,573 (92,743,635)
Decrease (increase) in available-for-sale financial assets 51,457,029 (247,110,404)
Increase in held-to-maturity financial assets (26,005,419) (31,831,171)
Decrease in other financial assets 2,638,627 1,777,138
Increase in other assets (774,960) (259,256)
Total changes in operating assets 153,348,497 (339,527,078)
Changes in operating liabilities:
Increase in deposits of Central Bank and other banks 2,171,297 68,436,687
Decrease in financial liabilities measured at fair value through profit or loss (32,515,412) (8,690,867)
(Decrease) increase in hedging financial liabilities (99,772) 140,943
Decrease in bills and bonds sold under repurchase agreements (4,998,705) (21,681,534)
Increase in payables 768,793 25,986

205204
Financial Information
2016 2015
Increase in deposits and remittances 36,595,550 283,502,167
Increase in employee benefit obligations 372,920 950,872
Increase in other liabilities 377,722 96,197
Total changes in operating liabilities 2,672,393 322,780,451
Total changes in operating assets and liabilities 156,020,890 (16,746,627)
Total adjustments 132,021,235 (39,892,011)
Cash inflow (outflow) generated from operations 151,392,798 (29,338,654)
Interest received 63,195,425 65,049,951
Dividends received 4,072,374 7,171,615
Interest paid (34,836,721) (35,195,868)
Income taxes paid (882,942) (1,117,346)
Net cash flows from operating activities 182,940,934 6,569,698
Cash flows from (used in) investing activities :
Proceeds from disposal of investments accounted from using equity method 187,907 -
Acquisition of property and equipment (757,041) (674,950)
Proceeds from disposal of property and equipment - 291,406
(Increase) decrease in refundable deposits (147,506) 201,920
Acquisition of intangible assets (309,959) (269,555)
Increase in other financial assets (10,325,950) (2,202,113)
Net cash flows used in investing activities (11,352,549) (2,653,292)
Cash flows from (used in) financing activities :
Decrease in guarantee deposits received (408,646) (343,671)
(Decrease) increase in other financial liabilities (1,036,575) 28,476
Cash dividends paid (400,000) (95,450)
Net cash flows used in financing activities (1,845,221) (410,645)
Effect of exchange rate changes on cash and cash equivalents (688,837) 903,912
Net increase in cash and cash equivalents 169,054,327 4,409,673
Cash and cash equivalents at beginning of period 913,173,465 908,763,792
Cash and cash equivalents at end of period $ 1,082,227,792 913,173,465
Compose of cash and cash equivalents :
Cash and cash equivalents reported in the statement of financial position $ 122,398,626 135,422,418
Due from the Central Bank and call loans to banks qualifying for cash and cash equivalents under the definition of IAS 7 318,969,155 167,350,034
Investments qualifying for cash and cash equivalents under the definition of IAS 7 640,860,011 610,401,013
Cash and cash equivalents at end of period $ 1,082,227,792 913,173,465

207206
Review of Financial Conditions, Operating Results, and Risk Management
207 Ⅰ. Analysis of Financial Status
207 Ⅱ. Financial Performance
208 Ⅲ. Analysis of Cash Flow
209 Ⅳ. Investment Policy in Last Year
210 Ⅴ. Risk Management
220 Ⅵ. Crisis Management Mechanism

207206
Review of Financial Conditions, Operating Results, and Risk Management
Review of Financial Conditions, Operating Results, and Risk Management
Ⅰ. Analysis of Financial StatusUnit: NT$1,000
YearItems Dec. 31, 2016 Dec. 31, 2015
Change
Amount %
Total Assets 4,770,594,681 4,732,488,446 38,106,235 0.81
Total Liabilities 4,496,150,459 4,477,641,166 18,509,293 0.41
Total Shareholders’ Equities 274,444,222 254,847,280 19,596,942 7.69
Note: Consolidated financial reports serve as the accounting basis.
Ⅱ. Financial PerformanceUnit: NT$1,000
YearItems 2016 2015
Change
Amount %
Net interest income 26,035,482 28,406,177 (2,370,695) (8.35)
Non-interest income (net) 18,658,370 6,807,204 11,851,166 174.10
Net revenue 44,693,852 35,213,381 9,480,471 26.92
Bad debt expense and reserve for guarantees 5,183,736 4,404,468 779,268 17.69
Operating expenses 20,075,500 20,207,363 (131,863) (0.65)
Net income before tax 19,434,616 10,601,550 8,833,066 83.32
Income tax expenses 1,785,645 1,730,852 54,793 3.17
Net income after tax 17,648,971 8,870,698 8,778,273 98.96
Note: Consolidated financial reports serve as the accounting basis.
Analysis of changes in increase/decrease ratios:1. The increase in net income before tax in 2016 compared with 2015 was due mainly to an increase in the share of income of equity-
accounted investees.2. The decrease in net interest income in 2016 compared with 2015 was due to the fact that the decrease in interest income was larger than
the decrease in interest expense.3. The increase in non-interest net income in 2016 compared with 2015 was due to the increase in the share of income of equity-accounted
investees.4. The increase in bad debt expense and reserve for guarantees in 2016 as compared with 2015 was caused mainly by an increase in
provision for bad loans.5. Income tax expenses for 2016 were higher than in 2015, mainly due to an increase in the net income before tax.

2016 ANNUAL REPORT
BANK FTAIWAN
209208
Ⅲ. Analysis of Cash Flow
1. Liquidity Analysis for the Past Year
(1) Cash Flow AnalysisUnit: NT$1,000
YearItem 2016 2015
Change
Amount %
Net cash inflow (outflow) 169,054,327 4,409,673 164,644,654 3,733.72
The main reasons for the net change were as follows:Unit: NT$1,000
Items Amount
Increase in net cash inflow from placement with Central Bank and call loans to banks 42,965,173
Decrease in net cash inflow from financial assets measured at fair value through profit or loss (73,321,322)
Decrease in net cash outflow from receivables 18,597,634
Decrease in net cash outflow from loans and discounts 199,939,208
Decrease in net cash outflow from available-for-sale financial assets 295,860,975
Decrease in net cash outflow from held-to-maturity financial assets 5,825,752
Decrease in net cash inflow from deposits of Central Bank and other banks (66,265,390)
Increase in net cash outflow from financial liabilities measured at fair value through profit or loss (23,824,545)
Decrease in net cash outflow from bills and bonds purchased under resell agreements 16,682,829
Decrease in net cash inflow from deposits and remittances (246,976,346)
Increase in net cash inflow from other operating activities 35,167,500
Increase in net cash outflow from investing activities (8,651,268)
Increase in net cash outflow from financing activities (1,435,017)
Others (1,592,749)
Total 164,644,654
Note: Consolidated financial reports serve as the accounting basis.
(2) Remedy for Estimated Shortage of Liquidity: Not applicable.

209208
Review of Financial Conditions, Operating Results, and Risk Management
2. Cash Flow Analysis for the Coming YearUnit: NT$1,000
Beginning Cash Balance
(a)
Annual Net Cash Flow from
Operating Activities(b)
Annual Net Cash Flow from Other
Activities(c)
Cash Balance (Shortage)(a)+(b)+(c)
Remedy for Estimated Cash Shortage
Investment Plan
Financial Management Plan
1,082,227,822 3,613,438 2,744,967 1,088,586,227 - -
Note: Consolidated financial reports serve as the accounting basis.
(1) Cash Flow Analysisa. Operating activities: Due primarily to a net cash inflow produced by interest income from loans.b. Investing activities: Mainly due to a net cash inflow produced by dividend income on investment
financial instruments.c. Financing activities: Primarily due to a net cash outflow produced by cash dividends paid.
(2) Remedial action to make up for cash inadequacy, and liquidity analysis: Not applicable.
Ⅳ. Investment Policy in Last YearTo assure the quality of investment and to heighten return on investment, the Bank plans for the
disposal of reinvested enterprises that are performing poorly; sends letters asking for the formulation of improvement measures to reinvested enterprises whose operations resulted in losses on a regular basis in the hope of improving their operations, upgrading their operating performance, creating profits, and protecting investment costs; participates in meetings of the boards of directors and supervisors of invested enterprises so as to remain aware of their business conditions and take necessary improvement measures in time.
When stock dividends received and gain on disposal are added, investment income as recognized under the equity method during 2016 amounted to approximately NT$19.015 billion (including BankTaiwan Insurance Brokers Co., Ltd.). The return on investment was 28.96%, reflecting a good investment performance. After factoring out the NT$13.312 billion one-time real-estate asset revaluation gain following the liquidation of Kaohsiung Ammonium Sulfate Co., Ltd., investment income came to NT$5.703 billion and the return on investment was 8.69%.
The Bank earmarked funds in its 2014 budget to invest in a wholly-owned Bank of Taiwan (China) Limited, with capitalization provisionally set at RMB 2 billion.

2016 ANNUAL REPORT
BANK FTAIWAN
211210
Ⅴ. Risk Management
1. Qualitative & Quantitative Information on Different Types of Risk(1) Credit Risk Management and Accrued Capital
A. Credit Risk Management System Year 2016
Items Contents
Credit Risk Strategies, Goals, Policies, and Procedures
1. Credit Risk Strategies, Goals, and Policies(1) In accordance with the loan, investment strategies and operating directions approved by the Board of Directors,
and in compliance with the New Basel Capital Accord and the regulatory provisions of the competent authority, the Bank readjusts its credit risk management strategies whenever necessary, and in response to changes in the macroeconomic market, loan portfolio risk, asset quality, and government policy.
(2) The Bank will establish and effectively implement a healthy credit risk management mechanism to lower credit risk, and achieve operating and management targets.
(3) When the Bank engages in business and management procedures related to credit risk, it evaluates the probability and severity of losses from the investment or loan and adopts appropriate credit risk management countermeasures in consideration of the Bank’s risk appetite and cost effectiveness. Risk management countermeasures include risk hedging, risk transfer or mitigation, risk control, and assumption of risk.
2. Credit Risk Management Procedures(1) Credit risk assessment and monitoring are carried out in accordance with the relevant regulations of the
competent authority and the BOT, and reports are submitted to the BOT’s Board of Directors and Risk Management Committee.
(2) Risk quotas and early-warning indexes are established by industry, country, conglomerate, and trading partner in order to control the concentration of risk and large exposure, and monitoring and reporting are carried out.
(3) To effectively measure the quality of loan assets, the Bank has established pre-loan investigation and screening rules and procedures. It has also strengthened post-loan management, and has adopted the following control and measurement mechanisms: a loan review and follow-up evaluation system, and loan early-warning mechanism; monitoring of asset quality; full allocation of loss provisions; and adequate capital provision.
(4) To strengthen the credit risk management capability, the Bank has established the credit risk systems with a foundation internal ratings-based approach to help the Bank identify and weigh credit risk.
Organizational Framework of Credit Risk Management
The BOT’s organizational framework of credit risk management includes the Board of Directors, Risk Management Committee, Department of Risk Management, units in charge of business, and other business units.The Board of Directors is the Bank’s supreme policymaking, management and supervision unit and has final responsibility for the Bank’s overall risk management.The Risk Management Committee is responsible for the Bank’s risk management policy, system, rules, organization, and overall risk assessment, and for supervising and examining revision affairs.
Scope and Characteristics of the Credit Risk Reporting and Measuring System
1. Credit Risk Reporting(1) Including the standard system-produced credit risk reports that are submitted to the competent authority, and
monthly credit risk monitoring reports.(2) The Bank’s Department of Risk Management produces credit risk monitoring reports and submits them to
the chief executive on a monthly basis, and also makes regular reports to the Board of Directors and Risk Management Committee. The contents of these reports include risk-control conditions such as the status of bank-wide exposure to credit risk, the status of utilization of total amounts and quota limits, analysis of the management of credit risk concentration, analysis of overseas branch (including the OBU) loan asset portfolios, and asset quality and off-book items. Dynamic monitoring of credit risk is also carried out as necessary, and if major changes are found they are reported to the chief executive in order to control credit risk effectively.
2. Credit Risk Measuring System(1) The Bank currently uses the risk standardized approach to calculate capital allocation. The Risk Management
Information System automatically produces various reports each month, including reports to the competent authority, management-related reports, and information-disclosure reports. These reports are used to compile monitoring reports for ranking executives, the Risk Management Committee, and the Board of Directors.
(2) The Bank has established the credit risk systems with a foundation internal ratings-based approach in consideration of credit characteristics, changes in the economic environment, and collateral or guarantees so as to enhance the Bank’s credit risk management capability.

211210
Review of Financial Conditions, Operating Results, and Risk Management
Items Contents
Credit Risk Hedging or Mitigation Policy, and Strategies and Procedures for Monitoring the Continuing Effectiveness of Hedging and Mitigation Instruments
1. Credit Risk Hedging and Mitigation Policy(1) The Bank has established quotas for the concentration of credit risk—by industry, conglomerate, and country,
among others.(2) The Bank has established a loan review and follow-up auditing system to strengthen post-loan management,
and continuous monitoring of the condition of borrowers. Loan review is carried out within the term of loans in accordance with the review rating, and follow-up auditing is carried out for important loan cases.
(3) The Bank operates in accordance with its loan policy and rules for the handling of collateral to seek the provision of collateral or guarantees to augment the creditworthiness of borrowers and lower credit risk.
(4) Credit risk mitigation methods (such as netting, eligible collateral, and guarantees) are included in related information systems in accordance with the rules of the New Basel Capital Accord and the competent authority in order to calculate the results of the Bank’s risk mitigation accurately.
2. Strategies and Procedures for Monitoring the Continuing Effectiveness of Hedging and Mitigation Instruments(1) The Bank monitors the status of and changes in credit risk concentration quotas, distribution of risk exposure,
asset quality, and types of collateral exposure on a scheduled basis, reviews trigger ratios and limit ratios whenever necessary, and assures the integrity and effectiveness of collateral and guarantees. Scheduled reports are submitted to the Risk Management Committee for use in compiling statements on effective strategies and procedures, and in studying countermeasures.
(2) The Bank has set up a collateral management system that can effectively handle its collateral. Analysis and policy readjustments are carried out when necessary in response to market and economic changes. In the future, a collateral reappraisal system and mechanism will be established for the accurate calculation of the results of collateral mitigation and the effective use of the early-warning system.
Method of Legal Capital Allocation
Standardized Approach
B. Exposure and Accrued Capital Following Risk Mitigation Using the Standardized Credit Risk Approach
Dec. 31, 2016
Unit: NT$1,000
Type of Exposure Exposure Following Risk Mitigation Accrued Capital
Sovereign Nations 1,694,577,194 119,616Non-Central Government Public Sector 487,823,429 15,126,838Banks (Including Multilateral Development Banks) 385,950,796 11,819,375Enterprises (Including Securities and Insurance Firms) 904,765,627 70,672,978Retail Loans 402,232,940 19,958,439Residential Real Estate 553,574,722 28,415,664Equity Investment 8,462,532 2,808,823Other Assets 146,210,622 10,267,797Total 4,583,597,862 159,189,530

2016 ANNUAL REPORT
BANK FTAIWAN
213212
(2) Securitization Risk Management System, Exposure, and Accrued CapitalA. Securitization Risk Management System
Year 2016
Items Contents
Securitization Management Strategy and Procedures
1. The BOT has not acted as the originator of securitized products, but only as investor.2. The BOT’s management strategy and procedures for investment in securitized
products are handled in accordance with the rules contained in the Bank’s “Investment Policy,” “Rules for Trading and Management of NT Dollar Funds,” and “Operating Rules for Engaging in the Offshore Banking Business.”
Securitization Management Organization and Framework
The BOT has not played the role of originator bank, and the risks potentially associated with its investment in securitized products (including credit risk, market risk, liquidity risk, interest rate risk, and operational risk) are controlled in accordance with the organizations and frameworks related to the different categories of risk as well as with the BOT’s risk management system and reporting mechanism.
Scope and Characteristics of the Securitization Risk Reporting and Measuring System
The BOT carries out prior evaluation of the risks and benefits associated with investment in securitized products in accordance with the relevant investment rules; evaluates profit and loss on a monthly basis; submits risk reports to the unit in charge, Department of Risk Management, ranking executives, and Investment Commission; and reports regularly to the Risk Management Committee and the Board of Directors.
Method of Legal Capital Allocation Standardized Approach
B. Status of SecuritizationNone
C. Securitization Risk Exposure and Accrued Capital (According to the Type of Transactions)
Dec. 31, 2016
Unit: NT$1,000
Type of Exposure
Bank Book
Asset Class
Traditional Synthetic Total
Risk ExposureAccrued Capital
(2)
Risk Exposure Accrued
Capital(4)
Risk Exposure
(5)=(1)+(3)
Accrued Capital
(6)=(2)+(4)
Accrued Capital Before SecuritizationRetention or
PurchasingThe provision of liquidity facilities
The provision of credit
enhancement
Subtotal (1)
Retention or Purchasing
(3)
Non-Originating Bank
Banking Book
CDO 497,101 0 0 497,101 21,438 0 0 497,101 21,438
Trading Book
Subtotal 497,101 0 0 497,101 21,438 0 0 497,101 21,438
Originating Bank
Banking Book
Trading Book
Subtotal
Total 497,101 0 0 497,101 21,438 0 0 497,101 21,438

213212
Review of Financial Conditions, Operating Results, and Risk Management
D. Securitized Product Information Summarization of information about investment in securitization products
Dec. 31, 2016Unit: NT$1,000
Item Account Original Cost Accumulated Value Income Accumulated Impairment Book Value
Asset-Backed Securities (ABS)
130209 Available-for-sale financial assets-
noncurrent500,000 -2,899 0 497,101
Note: This table includes beneficial interest securities or asset-backed securities held by the bank as an originator.
Summarization of the information about original cost of single transaction for investment in securitization products amounting to more than NT$300 million
Dec. 31, 2016Unit: NT$1,000
Securities Account CurrencyIssuer &
PlaceTrade Date
Maturity Date
Interest Rate
Credit Rating
RepaymentOriginal
CostAccumulated Value Income
Accumulated Impairment
Book Value
Attachment Point
Asset Pool
The Land Bank of Taiwan was appointed as trustee of the Class A senior notes of the Chailease 2016 Securitization Special Purpose Trust.
130209 Available-for-sale financial assets-noncurrent
TWD
The originator, Chailease Finance Co., transferred the property trust to the Land Bank of Taiwan, which was appointed as trustee of the trust asset account for the Chailease 2016 Securitization Special Purpose Trust.
24 Aug. 2016
24 Aug. 2021 1.9%
twAAATaiwan Ratings
Interest paid monthly; Class A notes scheduled for completion of redemption between 24 Aug. 2019 and 24 Aug. 2021.
500,000 -2,899 0 497,101 24.60%
(1) 54 finance leases, NT$384.29 million
(2) 750 installment sales, NT$ 4,091.92 million
(3) 89 conditional sales, NT$ 497.08 million
Note: This table includes both domestic and overseas securitization products.
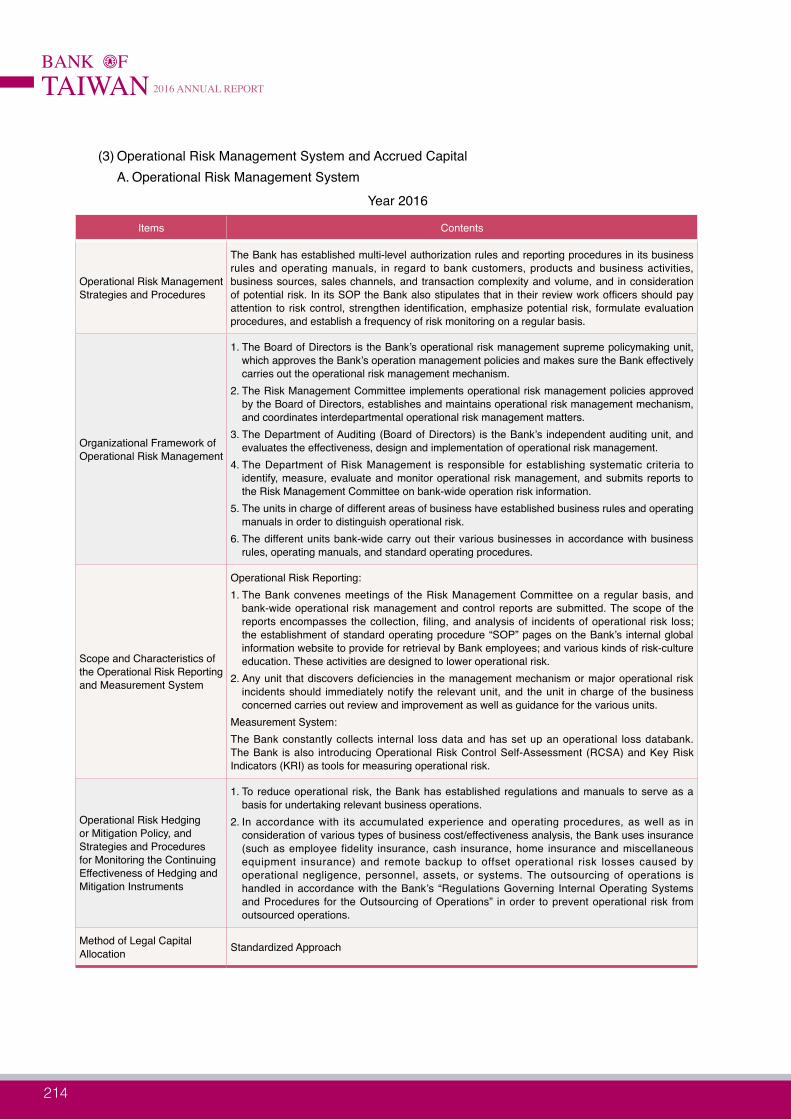
2016 ANNUAL REPORT
BANK FTAIWAN
215214
(3) Operational Risk Management System and Accrued CapitalA. Operational Risk Management System
Year 2016
Items Contents
Operational Risk Management Strategies and Procedures
The Bank has established multi-level authorization rules and reporting procedures in its business rules and operating manuals, in regard to bank customers, products and business activities, business sources, sales channels, and transaction complexity and volume, and in consideration of potential risk. In its SOP the Bank also stipulates that in their review work officers should pay attention to risk control, strengthen identification, emphasize potential risk, formulate evaluation procedures, and establish a frequency of risk monitoring on a regular basis.
Organizational Framework of Operational Risk Management
1. The Board of Directors is the Bank’s operational risk management supreme policymaking unit, which approves the Bank’s operation management policies and makes sure the Bank effectively carries out the operational risk management mechanism.
2. The Risk Management Committee implements operational risk management policies approved by the Board of Directors, establishes and maintains operational risk management mechanism, and coordinates interdepartmental operational risk management matters.
3. The Department of Auditing (Board of Directors) is the Bank’s independent auditing unit, and evaluates the effectiveness, design and implementation of operational risk management.
4. The Department of Risk Management is responsible for establishing systematic criteria to identify, measure, evaluate and monitor operational risk management, and submits reports to the Risk Management Committee on bank-wide operation risk information.
5. The units in charge of different areas of business have established business rules and operating manuals in order to distinguish operational risk.
6. The different units bank-wide carry out their various businesses in accordance with business rules, operating manuals, and standard operating procedures.
Scope and Characteristics of the Operational Risk Reporting and Measurement System
Operational Risk Reporting:1. The Bank convenes meetings of the Risk Management Committee on a regular basis, and
bank-wide operational risk management and control reports are submitted. The scope of the reports encompasses the collection, filing, and analysis of incidents of operational risk loss; the establishment of standard operating procedure “SOP” pages on the Bank’s internal global information website to provide for retrieval by Bank employees; and various kinds of risk-culture education. These activities are designed to lower operational risk.
2. Any unit that discovers deficiencies in the management mechanism or major operational risk incidents should immediately notify the relevant unit, and the unit in charge of the business concerned carries out review and improvement as well as guidance for the various units.
Measurement System:The Bank constantly collects internal loss data and has set up an operational loss databank. The Bank is also introducing Operational Risk Control Self-Assessment (RCSA) and Key Risk Indicators (KRI) as tools for measuring operational risk.
Operational Risk Hedging or Mitigation Policy, and Strategies and Procedures for Monitoring the Continuing Effectiveness of Hedging and Mitigation Instruments
1. To reduce operational risk, the Bank has established regulations and manuals to serve as a basis for undertaking relevant business operations.
2. In accordance with its accumulated experience and operating procedures, as well as in consideration of various types of business cost/effectiveness analysis, the Bank uses insurance (such as employee fidelity insurance, cash insurance, home insurance and miscellaneous equipment insurance) and remote backup to offset operational risk losses caused by operational negligence, personnel, assets, or systems. The outsourcing of operations is handled in accordance with the Bank’s “Regulations Governing Internal Operating Systems and Procedures for the Outsourcing of Operations” in order to prevent operational risk from outsourced operations.
Method of Legal Capital Allocation Standardized Approach

215214
Review of Financial Conditions, Operating Results, and Risk Management
B. Operational Risk Accrued CapitalDec. 31, 2016
Unit: NT$1,000
Year Operating Gross Profit Accrued Capital
2014 34,840,754
2015 32,041,962
2016 41,431,531
Total 108,314,247 5,169,777
(4) Market Risk Management System and Accrued CapitalA. Market Risk Management System
Year 2016
Items Contents
Market Risk Management Strategies and Procedures
In accordance with the risk management strategies and operating directions approved by the Board of Directors, and in compliance with the New Basel Capital Accord and the regulatory provisions of the competent authority, the Bank has established a market risk management system and policy. To effectively identify, assess, measure and monitor the risk associated with different investment business, the Bank sets up different investment quotas and stop-loss limits and reports are submitted to the Board of Directors, Risk Management Committee, and ranking executives.
Organizational Framework of Market Risk Management
1. The BOT’s organizational framework of risk management includes the Board of Directors, Risk Management Committee, Department of Risk Management, units in charge of business, trading units and their traders, risk control personnel, and back-office personnel.
2. The Board of Directors is the Bank’s supreme market risk management and monitoring unit, which is responsible for the risk policies and the Bank’s quota limits approval.
3. The Risk Management Committee is responsible for the Bank’s risk management policy, system, rules, organization, overall risk assessment, supervision, and examining revision affairs.
4. The Department of Risk Management is responsible for the planning and revision of risk management, handles formulation and integration of risk management regulations.
Scope and Characteristics of Market Risk Reporting and Measurement
1. The Bank’s market risk monitoring encompasses all trading units and overall and individual trading procedures for different financial products, and includes changes in position, changes in profit and loss, trading models, and trading targets, all of which should be carried out in accordance with the Bank’s quota limits, stop-loss, and over limit disposition rules, and within authorization limits.
2. The Bank’s Department of Risk Management produces market risk monitoring reports and submits them to the chief executive on a monthly basis, and also makes regular reports to the Board of Directors and Risk Management Committee. The contents of these reports include risk-control conditions such as the status of bank-wide exposure to credit risk, capital requirement, financial instruments quotas and limit exceeding, analysis of the management of risk concentration, and analysis of overseas branches (including the OBU) investment assets portfolio, among others.
3. The Bank currently uses the risk standardized approach to calculate capital allocation. The Risk Management Information System automatically produces various reports each month, including reports to the competent authority, management-related reports, and information-disclosure reports. These reports are used to compile monitoring reports for ranking executives, the Risk Management Committee, and the Board of Directors.
4. To strengthen the management of market risk, the BOT has set up a VaR system of market risk with internal model approach (IMA) that produces various kinds of risk management reports every day.

2016 ANNUAL REPORT
BANK FTAIWAN
217216
Items Contents
Market Risk Hedging or Mitigation Policy, and Strategies and Procedures for Monitoring the Continuing Effectiveness of Hedging and Mitigation Instruments
1. The BOT’s “Operating Rules for Engaging in the Offshore Banking Business” clearly specify the range of trading in the offshore banking business and establish trading limits according to the credit rating and world ranking of counterparties, issuing institutions, and guarantor institutions. The Rules also have strict specifications regarding categories of securities, with trading quotas and stop-loss limits being established for the trading book positions of different units.
2. In accordance with the “Operating Criteria for Derivatives Products, and Internal Control Operating Methods,” the Bank uses the following risk-hedging principles to trade in derivative financial products by trading units: (1) Principal and loss quotas are reviewed on a regular basis. (2) Reverse-squaring trading for derivatives positions has been provided for, and can be used for the mutual offsetting of positions, which are listed as net amounts. (3) The market risk of structured derivative financial products is calculated under the principle of decomposition. For products that do not admit of decomposition, positions should be covered in round lots, with no retained positions allowed.
Method of Legal Capital Allocation Standardized Approach
B. Market Risk Accrued CapitalDec. 31, 2016
Unit: NT$1,000
Risk Category Accrued Capital
Interest rate risk 2,087,961
Equity security risk 1,844,521
Foreign exchange risk 3,266,034
Option risk 64,971
Commodity risk 0
Total 7,263,487
(5) Liquidity RiskThe Bank uses two methods to manage liquidity risk: total amount management, and flow management. Total amount management is carried out according to the Central Bank’s “Liquidity Reserve Checking Guidelines for Financial Institutions,” and liquidity reserves are allocated in reference to fluctuations in the Bank’s flow of funds. The implementation of flow management depends on the time and place of inflow and outflow of funds and is divided into real-time management and medium and long-term management. When the flow of funds reaches a set limit, business units are required to submit a report immediately so as to maintain a grasp of the status of capital and provide for the adoption of advance countermeasures. In addition, a monthly analytic report on the Bank’s New Taiwan Dollar and Foreign Currencies funds liquidity risk and interest rate risk is compiled and submitted to the Assets and Liabilities Management Committee and to the Board of Managing Directors quarterly.

217216
Review of Financial Conditions, Operating Results, and Risk Management
A. New Taiwan Dollars-Denominated Maturity Date StructureDec. 31, 2016
Unit: NT$ 1,000
Items Total
Amounts by Time Remaining before Maturity
0-10 days 11-30 days 31-90 days 91-180 days 181 days-one year Over one year
Major inflows of matured funds 4,624,731,900 500,544,968 658,875,807 383,850,327 417,175,746 723,809,621 1,940,475,432
Major outflows of matured funds 5,973,632,808 157,760,861 172,407,186 367,557,731 521,320,427 1,098,163,276 3,656,423,327
Period gap -1,348,900,908 342,784,107 486,468,621 16,292,596 -104,144,681 -374,353,655 -1,715,947,895
B. U.S. Dollars-Denominated Maturity Date StructureDec. 31, 2016
Unit: US$ 1,000
Items Total
Amounts by Time Remaining before Maturity
0-30 days 31-90 days 91-180 days 181 days-one year Over one year
Major inflows of matured funds 41,235,359 13,366,111 10,309,276 5,360,255 2,941,194 9,258,523
Major outflows of matured funds 41,235,359 16,271,096 11,089,307 4,442,059 3,338,991 6,093,906
Period gap 0 -2,904,985 -780,031 918,196 -397,797 3,164,617
Note: This table was prepared with reference to the Assets and Liabilities Management Committee’s “Bank of Taiwan US Dollar Liquidity Risk Analysis Report.”
2. Impact of Changes in Major Domestic and Overseas Policies and Laws on the Bank’s Financial Operations, and CountermeasuresThe Bank will remain attentive to the influence of major government financial and economic policies, and will provide appropriate responses in a timely fashion so as to lower the impact on its financial operations. In addition, the BOT Department of Compliance will collect information on legal provisions related to the Bank’s businesses and forward it in a timely manner to the related business units with instructions to comply with legislative amendments and to act as quickly as possible to develop response plans or suggest revisions to the Bank’s operating rules and bylaws so as to abide by the law, ensure legal compliance, and reduce operational risk.
3. Impact of Technological and Industrial Changes on the Bank’s Financial Operations, and Countermeasures
(1) In response to Fintech development and domestic deregulation, BOT took active part in all aspects of Fintech innovation, continued promoting digitized financial services, and introduced online application processes for a wide range of services (including digital deposit accounts and cardless ATM withdrawals) in order to boost operating efficiency and improve the customer experience.A. The Bank added a push one-time password function to improve transaction security. It is used for
identity verification and transaction authentication when logging on to online banking accounts and using online/ mobile banking services for wire transfers to accounts that are not pre-registered.

2016 ANNUAL REPORT
BANK FTAIWAN
219218
B. The Bank has adopted responsive web design for conducting foreign exchange cash and traveler’s check transactions, and for checking foreign exchange rates and interest rates. The new technology provides customers a user interface that is consistent across a variety of different channels.
C. The BOT drew up plans to launch personalized online banking. The plans entail the use of responsive web technology and personalized services in combination with Big Data CRM to provide optimum web pages and take advantage of Big Data business opportunities.
D. Working together with the National Payments Net, BOT launched a “Financial Chip Card POS Device Acquirer” service to enable medical institutions, government agencies, and other such entities to accept financial chip card payments from members of the public at their service counters.
E. The Bank established a Task Force on Cloud Banking to devise integrated customer-side digital banking services. The plan is to establish an integrated online and mobile platform that will provide seamless online-to-offline (O2O) connectivity, so as to enable customers to apply online for a variety of different services.
F. The Bank established a Big Data database and a customer behavior data mining model and, relying on a CRM system database, used business intelligence analysis and other such tools to develop various lines of business.
G. The Bank launched a digital services counter for its business units, using an “e-Counter,” an “All In One” computer device, and a queuing system to incorporate transaction data into a terminal workstation, thereby effectively improving operating efficiency.
H. The Bank set up "customer greeter" robots that tap into branch bank systems to provide greeting, queuing, and simple information services.
I. Actively promoting mobile payments business, including credit card host card emulation (HCE), the QR Code-based credit card payments, and the NFC-based mobile banking cards and mobile credit cards.
(2) In response to changes in industry, and paying due attention to the needs for both lending growth and risk control, the Bank has taken the following measures:A. Control of the Bank’s exposure to any single industry
The Bank has responded to changes in industry by establishing limits on loans to different industries, and has annually adjusted limits on lending to particular industries.
B. Enhanced ability to track industrial development trendsEach month, the Bank collects information on conditions in 13 different sectors (DRAM chips; display panels; solar power; LED; desktop and notebook computers; semiconductors; data storage media; printed circuit boards; communications equipment; Apple and mobile phone supply chains; telecoms operators; the Internet of Things; cultural and creative industries), and provides the information to units throughout the bank for their reference. In addition, the Bank also provides colleagues in the company with information on production and sales in 11 different sectors (electronics and semiconductors; information; green industry; etc.), the status of individual manufacturers, future prospects, and important breaking news.

219218
Review of Financial Conditions, Operating Results, and Risk Management
C. Enhancement of credit examiner professionalismThe Bank regularly invites experts from industry, government, academia, and research institutes to attend teleconference seminars and share their insights on the latest trends in key industries. In addition, the BOT from time to time dispatches employees to take part in industrial seminars held by research institutions in order to stay abreast of the latest trends in industry.
4. Impact of Changes on the Bank’s Image, and CountermeasuresThe Bank makes efforts to expand its businesses and achieve the budget targets. In addition, the Bank treats customers with sincerity, always puts the customer’s interests first, and provides unmatched safeguards for customers’ wealth. The Bank works actively to enhance its service quality by simplifying operating procedures and participates actively in numerous public-benefit activities. This earned several awards for the Bank, including: a winner in the Reader’s Digest Trusted Brands survey in the banking category; the number one financial holding company or bank on Cheers magazine’s list of the “most admired companies in the new age;” a prize for excellence in Wealth magazine’s “Best Digital Bank” category in 2016; a “stellar enterprise” in the Corporate Social Responsibility YearBook 2016 published by Economic Daily News; Golden Quality Award and Golden Security Award by the Joint Credit Information Center; “award for best trust services” at the 8th awards for financial industry excellence of the Taiwan Academy of Banking and Finance; and “Direct Guarantee Outstanding Performance Award” and “Young Entrepreneur Assistance Award” from the Ministry of Economic Affairs.
5. Expected Benefits from, Risks Relating to and Response to Merger and Acquisition PlansNone
6. Expected Benefits from, Risks Relating to and Response to Operating Channel Expansion Plans
Since the addition of more business locations can expand the deposit, loan, remittance, and wealth management businesses while increasing stable customer sources, the Bank will make optimum use of its big customer base, encourage domestic branches to actively pass along business leads to its overseas branches, and use this to solidify relationships with OBU and DBU customers. This will enable the Bank to provide a more diversified range of services. The Bank will continuously evaluate the feasibility of setting up new business locations, in light of economic conditions and the development of commerce and industry in different areas, and will provide customers with diversified services to establish a stronger competitive niche and tap into synergies.
The BOT has adopted the “Concrete Plan of the Bank of Taiwan for Development of a Stronger Asian Presence.” This will provide a blueprint for the Bank’s efforts to expand its international business network and strengthen its presence in the markets of Asia. The Bank has established the Shanghai JiaDing Sub-Branch, Guangzhou Branch, and Yangon Representative Office in Myanmar in 2015, and Fuzhou branch also officially opened for business in 2016. The BOT is currently preparing to open a branch in Sydney, Australia. The opening of that branch will help to strengthen the Bank’s global business network and expand its overseas business operations.
The Bank has established an “Overseas Branch Preparatory Committee” to facilitate the careful planning of deployment strategy and overseas business development, including manpower training, transnational business marketing, and establishment of regulatory and information systems, and to make preparations for potential operational risk.

2016 ANNUAL REPORT
BANK FTAIWAN
221220
7. Risks Arising from the Concentration of Business, and CountermeasuresThe Bank’s main source of income is from interest income, and changes in interest rates have a relatively large influence on the Bank’s income. To reduce the risk caused by interest-rate fluctuations, the Bank will monitor changes in interest rates continuously, closely adjust the structure of its assets and liabilities, and increase the ratio of fee and commission income.
Ⅵ. Crisis Management MechanismIn regard to latent or present crisis, the Bank has adopted a series of pre-event, mid-event, and post-event countermeasures. The crisis management mechanism that has been established by the Bank includes the following:
1. A “BOT Emergency Response Manual.”
2. The “BOT Crisis Reporting Rules.”
3. A “BOT Operation Crisis Response Countermeasures.”
4. A “BOT Operations Non-Interruption Plan.”
5. A BOT Crisis Reporting System.
6. An Emergency Reporting System for headquarters and branches.Special Disclosure

221220
Special Disclosure
222 Ⅰ. Information on Affiliated Enterprises

2016 ANNUAL REPORT
BANK FTAIWAN
223222
Special Disclosure
Ⅰ. Information on Affiliated Enterprises
1. The Bank’s Subsidiaries (Dec. 31, 2016)
Bank of Taiwan
BankTaiwan Insurance Brokers Co., Ltd.
Shareholding 100%
2. Basic Data of the Bank’s Subsidiaries
Dec. 31, 2016
Unit: NT$1,000
Enterprise Name Establishment Date Address Paid-in Capital Major Operations
BankTaiwan Insurance Brokers Co., Ltd. Jan. 23, 2013 4F., No.49, Sec. 1, Wuchang St.,
Zhongzheng Dist., Taipei City 20,000Life Insurance AgencyProperty Insurance Agency
3. Information of Chairperson, Directors, Supervisors and President of the Bank’s Subsidiaries
Dec. 31, 2016
Enterprise Name Position Company Name and RepresentativeShareholding
Shares %
BankTaiwan Insurance Brokers Co., Ltd.
ChairpersonDirectorDirectorSupervisorPresident
Bank of TaiwanLegal Representative: Hsieh, Fu-DengLegal Representative: Chiang, Shih-TienLegal Representative: Kang, FanLegal Representative: Juan, Ching-HwaKang, Fan
2,000,000 100%
4. Operation Overview of the Bank’s Subsidiaries
Dec. 31, 2016
Unit: NT$1,000
Enterprise Name Capital Total Assets Total Liabilities Equity Operating
RevenueOperating
ProfitsIncome
(After Tax)EPS in NT$ (After Tax)
BankTaiwan Insurance Brokers Co., Ltd.
20,000 580,974 385,242 195,732 2,342,833 371,743 307,743 153.87

223222
Directory of Head Office and Branches
224 Ⅰ. Domestic Business Units
224 Ⅱ. Overseas Units

2016 ANNUAL REPORT
BANK FTAIWAN
PB224
Directory of Head Office and Branches Ⅰ. Domestic Business Units
Please refer to BOT website: http://www.bot.com.tw/English/BusinessUnits
Ⅱ. Overseas Units
London
Mumbai
Johannesburg
SingaporeYangon
Hong Kong Fuzhou
GuangzhouShanghai
TaiwanTokyo Los Angeles
New York
Branch Address Telephone FAX SWIFT
New York Branch 100 Wall Street, 11th Floor, New York, NY 10005 U.S.A. (1-212)968-8128 (1-212)968-8370 BKTWUS33Los Angeles Branch
601 S. Figueroa St., Suite 4525 Los Angeles, CA 90017 U.S.A. (1-213)629-6600 (1-213)629-6610 BKTWUS6L
Hong Kong Branch 23/F., Central Tower, 28 Queen’s Road Central, Central, Hong Kong 852-2521-0567 852-2869-4957 BKTWHKHH
Singapore Branch 80 Raffles Place #28-20 UOB Plaza 2Singapore 048624 65-6536-5536 65-6536-8203 BKTWSGSG
Tokyo Branch 7F, Fukoku Seimei Building, 2-2 Uchisaiwaicho 2-Chome Chiyoda-Ku, Tokyo 100-0011, Japan 813-3504-8881 813-3504-8880 BKTWJPJT
South Africa Branch
11, Cradock Ave. Rosebank 2196,Johannesburg, South Africa 27-11-880-8008 27-11-447-1868
27-11-447-1750 BKTWZAJJ
London Branch Level 5, City Tower, 40 Basinghall Street,London EC2V 5DE, UK 44-20-7382-4530 44-20-7374-8899 BKTWGB2L
Shanghai Branch 30F, No.1788, Nan-Jing West Rd., Jing-An District, Shanghai, China 86-21-3256-9900 86-21-3256-9477 BKTWCNSH
Guangzhou BranchGuangzhou International Finance Center, Unit 04-06, 24F, No 5, Zhujiang Xi Road, Zhujiang New Town, Tian He District, Guangzhou, Guangdong Province, China
86-20-8367-3000 86-20-8883-1933 BKTWCN22
Fuzhou Branch Suite 3908, 39F, Sheng Long Building, No.1, Guangming South Road, Taijiang District, Fuzhou City, Fujian Province ,China 86-591-8361-3189 86-591-2830-1020 BKTWCNBF
Shanghai JiaDing Sub-Branch
1F, No.3189, Bao’an Road, Jiading Dist.,Shanghai, China 86-21-5910-5311 86-21-5910-5312 BKTWCNSH
Mumbai Representative Office
Regus Platina, 9th Floor, Platina, C-59, G Block, Bandra-Kurla Complex, Bandra (East),Mumbai 400051, India
91-2267000907 91-2267000600 -
Yangon Representative Office
Rose Garden Offices, Unit 1 & 2, 1st Floor, No.171, Upper Pansodan Road, Mingalar Taung Nyunt Township, Yangon, The Republic of the Union of Myanmar
95-1-371992ext.2001, 2002 - -