2016 agriculture irrigation market research - bpa.gov · have any sis savings in bpa’s territory...
TRANSCRIPT

OCTOBER 2016
2016 Agriculture Irrigation Market Research


EXECUTIVE SUMMARY 2
The majority of irrigators in the Pacific Northwest changed from inefficient impact sprinklers to efficient rotating-type or wobbling-type sprinklers in a mid elevation sprinkler application (MESA) configuration on center pivots many years ago.
There are a variety of factors that irrigators consider when deciding what type of controls to install on a center pivot.
Dealers play a critical and influential role in the agricultural irrigation supply chain.
Current perceived barriers to efficient irrigation include water policies, terrain, and cost.
The most efficient irrigation system today is one that takes into account crop, soil type, and terrain.
Many experts believe that the future of irrigation will be data-driven.
1. Identify the top opportunities for improving irrigation efficiency. The primary goal of this study was for the research team to identify the top opportunities to improve irrigation energy efficiency in the Pacific Northwest.
2. Characterize the current state of the irrigation market. This study sought to identify the current irrigation technologies and practices in the Pacific Northwest, and document the market barriers to the adoption of efficient irrigation technologies and practices.
3. Review the current state of BPA’s agricultural program. This study sought to document BPA’s current agricultural program logic and desired program outcomes, and assess how the program aligns with the energy savings opportunities identified in the market research.
APPROACH
EXECUTIVE SUMMARYThis report details the research team’s findings from Bonneville Power Administration’s (BPA) agricultural irrigation market characterization study conducted from 2014 to 2016. It includes findings from the research team’s review and characterization of the agricultural market and BPA’s current agricultural program. Based on these findings, the research team identified key areas of opportunity for irrigation efficiency in the Pacific Northwest.
MARKET CHARACTERIZATION
This study sought to address the following research objectives:
The research team identified six key findings from the Pacific Northwest agricultural market:

EXECUTIVE SUMMARY 3
Current Program Initiatives:
Employment of agricultural program specialists (APSs) who conduct direct outreach to irrigators and supplement utilities’ energy efficiency staff
Informal outreach to trade allies (e.g., manufacturers, distributors, dealers) and regional organizations involved in energy and water efficiency
Providing marketing collateral and information resources to help promote irrigation efficiency, including an online tool that allows utilities to customize marketing materials
Collaboration with universities and research organizations to conduct research and demonstration projects for developing new irrigation efficiency measures like LESA and LEPA
DATA-DRIVEN IRRIGATION
The research team reviewed BPA’s current agricultural program and identified how it aligns with the Pacific Northwest irrigation market
Current Program Activity: BPA’s agriculture program saved 17.9 aMW from 2010 to 2015
Agricultural Program Specialists
Promote Efficiency
Outreach
Collaboration
17.9SIS
21%
Desired Program Outcomes:
Achieve the regional targets for energy savings within the agricultural sector.
Assist BPA’s customer utilities in helping their agricultural customers save energy and increase efficiency.
BPA’S AGRICULTURAL PROGRAM REVIEW
OR
WA
BPA’s program is maintaining the existing market efficiency. Seventy-nine percent of efficient sprinklers incented by BPA replace already efficient sprinklers in the market. Only 21% of the sprinkler measure savings are from efficient sprinklers replacing inefficient sprinklers.
Washington and Oregon achieved the most SIS savings, while Idaho did not have any SIS savings in BPA’s territory between 2010 and 2015
Of all agriculture program end-uses, irrigation accounts for the greatest amount of savings; within the irrigation end use, scientific irrigation scheduling (SIS) contributed the majority of savings on annual basis

EXECUTIVE SUMMARY 4
Based on the research team’s characterization of the market and BPA’s agriculture program, the research team identified a number of opportunities to “push” the irrigation market toward more efficient technologies and practices. This concept is in contrast to “maintaining” the market by—for example—offering to replace sprinklers in a market that has already adopted high efficiency sprinklers.
PUSH
MAINTAIN
WAYS TO INFLUENCE A MARKET
1. Focus on the Irrigation System as a Whole, Rather than Individual Components Each farm has different irrigation needs and requires different solutions to achieve the right efficiency for the farm. This requires a focus on the entire irrigation system, incorporating low-pressure sprinklers, variable frequency drives (VFDs), controls, and other efficient irrigation hardware. The research team thinks there is an opportunity to push the market by focusing on the irrigation system as a whole when considering incentive offerings.
2. Develop a Dealer and Food Processor Trade Ally Network Interviews with manufacturers, dealers, irrigation consultants, and other market actors revealed that irrigation dealers and food processors (who buy crops from irrigators) have a strong influence on irrigator efficiency within the market. The research team sees opportunities to formalize a trade ally network throughout the Northwest and use the influence of dealers and food processors to push the market toward increased efficiency.
3. Highlight Secondary Benefits within Marketing Materials Interviews with dealers and irrigation consultants suggests that marketing energy efficiency as the primary benefit to upgrading equipment is good, but adding the secondary benefits to marketing collateral may increase the chances that an irrigator will upgrade their equipment. Based on this research, highlighting secondary benefits within marketing materials could push the market to take advantage of more BPA incentive offerings. BPA does include messages about the non-energy benefits of irrigation efficiency in its marketing materials, but there may be additional opportunities to focus on secondary benefits.
4. Promote Data-Based Irrigation Practices “Farming was once intuitive. Today it is analytical and data driven.” This quote comes from the October 2015 issue of Popular Science that included an article titled “The iPhone-Driven Farm.” The article talked about one farmer who has automated his farm
with dozens of sensors and drone technology to track soil moisture, wind speed, and rainfall. He receives all this data on his iPhone. Based on this and other study research, the research team sees opportunities to push the market by promoting data-based irrigation practices; this could mean incentivizing controls and other tracking technologies, or providing education about data-based agriculture to the region.
5. Continue to Incentivize Motors, Pumps, and VFDs Dealers and irrigation consultants said that while they have observed irrigators adopting VFDs on their own without program incentives, there is still a lot of room for improvement and continued incentives from BPA would help push the market. The research team found that motors, pumps, and VFDs are popular measures that are worth promoting. Continuing to incentivize these measures could help push the market to installing more measures in some instances and maintaining the market savings in other instances.
6. Consider a LESA/LEPA Program Based on Study Results Dealers and manufacturers said that only 1%-2% of center pivot sprinkler packages sold in the Pacific Northwest are designed for low elevation spray application (LESA) or low energy precision application (LEPA), yet the Council’s Seventh Plan calculated that 15% of the region’s agricultural cumulative technically achievable savings in 2035 are available from LESA/LEPA systems. To push the market, the research team recommends that BPA review the results of the current LESA demonstration project and determine the extent to which the technology could achieve savings in BPA’s territory.
PROGRAM OPPORTUNITIES

2016 Agriculture Irrigation Market Research Report 6
Table of Contents Introduction ......................................................................................................................................................................................... 10
Background ..................................................................................................................................................................................... 10
Objectives ........................................................................................................................................................................................ 10
Organization of Report ............................................................................................................................................................... 11
Research Activities ............................................................................................................................................................................ 12
Market Characterization ................................................................................................................................................................. 15
Characterizing the Current Irrigation Market .................................................................................................................... 15
Current Market Barriers .............................................................................................................................................................. 25
The Future of the Agricultural Landscape ........................................................................................................................... 27
Agricultural Program Review ........................................................................................................................................................ 28
Program Goals ............................................................................................................................................................................... 28
Strategies, Messages, and Program Offerings .................................................................................................................. 28
Program Activity ............................................................................................................................................................................ 30
Program Opportunities ................................................................................................................................................................... 35
Delivery Mechanisms................................................................................................................................................................... 35
Technologies ................................................................................................................................................................................... 42
Other Opportunities .................................................................................................................................................................... 47
Appendices:
Appendix A: Memorandum — Staff Interview Notes (October 2014)
Appendix B: Memorandum — Market Actor Interview Notes (January 2015)
Appendix C: Memorandum — USDA Data Analysis (April 2015)
Appendix D: Memorandum — Irrigation Trade Show Findings (January 2016)
Appendix E: Memorandum — BPA and Program Staff Interview Findings (January 2016)
Appendix F: Memorandum — The BPA Agricultural Programs’ Theory, Logic, Structure, and Offerings (May 2016)
Appendix G: Memorandum — Agricultural Market Actor Interview Findings (August 2016)

2016 Agriculture Irrigation Market Research Report 7
Table of Figures Figure 1: Center Pivot Irrigation System Components ....................................................................................................... 17
Figure 2: Comparison of Variable Speed and Variable Rate Irrigation ........................................................................ 21
Figure 3: Agriculture Irrigation Supply Chain ......................................................................................................................... 24
Figure 4: Irrigation End-Use aMW Saved by Irrigation Sub-Category ......................................................................... 33
Figure 5: Ways to Influence a Market ........................................................................................................................................ 35
Figure 6: Dealer Influence on Irrigators .................................................................................................................................... 37
Table of Tables Table 1: BPA’s Irrigation-Related Measure Offerings .......................................................................................................... 29
Table 2: Agricultural Program Activity by Reported End-Use: 2010-2015 ................................................................. 31
Table 3: Irrigation End-Use Activity by Measure: 2010-2015 ........................................................................................... 32
Table 4: Annual Irrigation End-Use Savings by Sub-Category: 2010-2015 ................................................................ 32
Table 5: BPA Replacement Detail for the Multi-Trajectory Sprays and Sprinkler Replacements ...................... 34
Table 6: Trade Ally Network Engagement Levels ................................................................................................................. 40
Table 7: FRIS Data: Methods Used When Deciding When to Irrigate .......................................................................... 44

2016 Agriculture Irrigation Market Research Report 8
Acknowledgements The research team benefited greatly from the review and input provided by many people. We sincerely appreciate the time, attention, and expertise that these professionals provided in support of this report.
The team would like to acknowledge the research guidance and support from BPA’s Project Manager, Bonnie Watson.
This report benefited from the contributions of several agriculture market experts and utility program managers across the Pacific Northwest who generously offered feedback that further enhanced our understanding of BPA’s current agriculture irrigation program, current market practices, and opportunities for improvement:
Linda Bettencourt, Bonneville Power Administration
Dan Berne, Independent Consultant
Debra Bristow, Bonneville Power Administration Tom Eckman, Northwest Power and Conservation Council
Jennifer Eskil, Bonneville Power Administration Ryan Firestone, Regional Technical Forum Contract Analyst
Tom Osborn, Bonneville Power Administration Tina Jayaweera, Northwest Power and Conservation Council
Dick Stroh, Bonneville Power Administration Paul Krissel, Independent Consultant
Robert Wallace, Bonneville Power Administration Geoff Wickes, Northwest Energy Efficiency Alliance
Boyd Wilson, Bonneville Power Administration Troy Peters, Washington State University

Forward Dear Readers and Agriculture Enthusiasts,
The Bonneville Power Administration (BPA) is pleased to release this agriculture irrigation market
characterization report. The findings in this document are the result of three years of ongoing research on
the agriculture market in the Pacific Northwest.
BPA commissioned this study to understand the impact that our program is having on the agriculture
market and to identify the top opportunities to increase efficiency in the market. At BPA, we believe it is
important to hear the feedback from our customer utilities on how the program is doing, and we also
value what agriculture market actors have to say about the direction the agriculture market is heading.
Our hope is that this research will provide the region with a deeper understanding of the agriculture
market structure, market actors, technologies, and trends in the Northwest. This report affirms the aspects
of our program that are “in step” with the current market, and also provides new ideas for how BPA and
other program administrators in the Northwest can continually increase energy efficiency through new
programmatic approaches or technologies.
Moving to the future, we hope the report’s findings will inform future program strategy and illuminate
new avenues for market influence. The research team developed this document to be referenced when
BPA and other program administrators are considering program design, as well as for when program
planners are thinking about energy savings goals.
As for immediate next steps, the BPA agriculture team plans to revisit the program logic model and see
how some of these new opportunities could fit into the future of our program strategy, helping us further
achieve our desired program outcomes.
For more information about BPA’s agriculture program offerings, visit our webpage:
https://www.bpa.gov/EE/Sectors/agriculture/Pages/default.aspx
For more information about BPA’s agriculture market research, visit our research webpage:
https://www.bpa.gov/EE/Utility/research-archive/Pages/agriculture-irrigation.aspx
We hope you enjoy this report!
Sincerely,
Bonnie Watson, Jennifer Eskil,
Research Project Manager Agriculture and Industrial Sector Lead
Flux, on behalf of BPA Bonneville Power Administration
2016 Agriculture Irrigation Market Research Report 9

2016 Agriculture Irrigation Market Research Report 10
Introduction Bonneville Power Administration (BPA) contracted with Navigant Consulting, Inc. and Cadeo (the research team) to characterize the agricultural irrigation market and provide an overview of the current practices and technologies used throughout the Pacific Northwest. The research team reviewed BPA’s current agricultural irrigation program logic and desired program outcomes to see how they aligned with current practices and the use of technologies in the region. The research team then identified possible opportunities for BPA to consider to improve irrigation efficiency. This report summarizes the results of these efforts.
Background BPA began the agriculture market research by covering a broad spectrum of agricultural activity across the Pacific Northwest. The research revealed two areas of focus for possible energy savings: irrigation technologies and practices and the installation of variable frequency drives (VFDs) on pumps and motors. As such, BPA continued the agriculture market research and focused on characterizing the irrigation market in the Pacific Northwest, reviewing the current state of BPA’s irrigation program, and identifying opportunities for BPA to improve irrigation efficiency.
Objectives This study began with the following research objectives:
1. Characterize the current state of the irrigation market. This study sought to characterize theirrigation market by identifying the irrigation technologies and practices used in the PacificNorthwest as well as the market barriers to adopting efficient irrigation technologies andpractices.
2. Review BPA’s current agriculture program. This study sought to answer a number of questionsregarding BPA’s current agricultural program, including: What is BPA’s agriculture program’s logicand desired program outcomes? How does the program align with the energy savingsopportunities identified through this study? Are there opportunities to push the market towardimproved irrigation efficiencies?
3. Identify top opportunities for improving irrigation efficiency. This study sought to identifythe top opportunities to improve irrigation energy efficiency in BPA’s territory.
4. Estimate Momentum Savings.1 BPA tasked the research team with estimating and quantifyingany Momentum Savings occurring in the irrigation market as part of the effort of identifyingpotential energy savings. However, the research team concluded midway through the study thatquantifying Momentum Savings would compromise the data confidentiality of certain actors in
1 Momentum Savings are cost-effective energy savings that occur above the Northwest Power and Conservation Council’s (the Council’s) Power Plan baseline and are neither incentivized by utility programs nor included in the Northwest Energy Efficiency Alliance’s (NEEA's) net market effects. Momentum Savings have various drivers including codes and standards (beyond those already captured in the Council’s Power Plan), baseline shifts, and general market transformation effects.

2016 Agriculture Irrigation Market Research Report 11
the irrigation market. One of the major energy savings measures in the irrigation market is sprinklers, and two sprinkler manufacturers have an estimated impact on 90% of the market. Using sales data to define the market would compromise the confidentiality of these two market actors’ market shares and sales data. Therefore, BPA decided to remove the estimation of Momentum Savings from the scope of this study.
Organization of Report The research team presents the findings of the study in four report sections and several appendices:
A summary of Research Activities the team undertook to characterize the irrigation market and understand BPA’s agricultural program
The Market Characterization results and findings, including:
o Current irrigation operations and practices
o Current irrigation technologies employed throughout the region
o Possible barriers preventing the market from adopting efficient technologies or practices
Agricultural Program Review including how the current program aligns with the irrigation market
Program Opportunities to push the market toward improved efficiency
Supporting Appendices providing all interim deliverables and other supporting background documentation, including:
o Appendix A: Memorandum — Staff Interview Notes (October 2014)
o Appendix B: Memorandum — Market Actor Interview Notes (January 2015)
o Appendix C: Memorandum — USDA Data Analysis (April 2015)
o Appendix D: Memorandum — Irrigation Trade Show Findings (January 2016)
o Appendix E: Memorandum — BPA and Program Staff Interview Findings (January 2016)
o Appendix F: Memorandum — The BPA Agricultural Programs’ Theory, Logic, Structure, and Offerings (May 2016)
o Appendix G: Memorandum — Agricultural Market Actor Interview Findings (August 2016)

2016 Agriculture Irrigation Market Research Report 12
Research Activities The research team conducted a variety of activities to meet the study’s objectives of characterizing the irrigation market and understanding BPA’s agricultural program. These activities included the following:
Interviewed 24 BPA, utility, and Northwest Energy Efficiency Alliance (NEEA) staff. The research team interviewed 24 agricultural program staff at BPA, utilities, and NEEA in 2014 and 2015. These interviews included:
o Six BPA and NEEA staff in 2014. The research team conducted interviews with BPA and NEEA staff to gain insights to inform the direction of the research team’s market characterization research for BPA’s agricultural sector program. Questioning focused on current program objectives and activities, opportunities to improve existing programs, potential priority markets for future programming, and key questions and research priorities. The research team also gathered information on key market actors, utility context, and existing data sources. The research team summarized these findings in the Staff Interview Summary memo (Appendix A).
o Eight BPA staff and 10 utility staff in 2015. The research team interviewed eight BPA staff and 10 utility staff in August and September 2015, and summarized the findings in the BPA and Program Staff Interview Findings memo (Appendix E).
Interviewed 64 market actors. The research team interviewed 64 market actors from 2014 to 2016. These interviews included:
o 27 market actors in 2014. From October through December 2014, the research team interviewed 27 market actors. Six interviewees were agriculture facility service providers (i.e., providing service at agriculture facilities as opposed to focusing solely on irrigation); two interviewees were agriculture researchers with expertise in irrigation; six interviewees were irrigation-focused consultants and technical service providers; three interviewees were manufacturers of irrigation equipment; five interviewees were university-affiliated agriculture extension service experts or state agriculture office representatives; and five were other market actors (e.g., representatives of federal and state programs that fund agriculture-related efficiency improvements). Several interviewees work on a national level and specialize in the Pacific Northwest. The interviewees’ expertise spans a range of crops, and several interviewees have two decades of experience working in agriculture. The research team summarized the results in the Market Actor Interview Summary Notes memo (Appendix B).
o 11 manufacturers at the Irrigation Show. In November 2015, the research team attended the Irrigation Show in Long Beach, CA. While at the trade show the team interviewed 11 sprinkler equipment, pivot equipment, and controls manufacturers and summarized the findings in the Irrigation Trade Show Findings memo (Appendix D).
o 20 market actors in 2016. The research team interviewed eight dealers, four irrigation consultants, three pivot manufacturers, three sprinkler manufacturers, and two controls

2016 Agriculture Irrigation Market Research Report 13
manufacturers. The team summarized the findings in the Agricultural Market Actor Interview Findings memo (Appendix G).
o Six additional market actors. The research team interviewed six additional market actors: a dealer, a food processing professional, a controls manufacturer, an agriculture trade ally expert, a United States Department of Agriculture (USDA) Natural Resources Conservation Service (NRCS) technical service provider, and a precision agriculture platform developer. The team incorporated the findings into this 2016 Agriculture Irrigation Market Research Report.
Consulted with an irrigation expert at Washington State University (WSU). The research team reviewed market research findings with an expert at WSU to corroborate findings and obtain expert opinions on research questions.
Collaborated with BPA staff to develop a program logic model. In August 2015, the research team held a logic model session with BPA and documented findings in the BPA Agricultural Programs’ Theory, Logic, Structure, and Offerings memo (Appendix F). The logic model provides a visual diagram of how program activities logically lead to the achievement of program goals.
Attended the Emerging Technologies Coordinating Council (ETCC) meeting. The April 2016 ETCC meeting, titled “Making Emerging Technology Work in the Agricultural Space,” brought together customers, utilities, manufacturers, and industry experts from the rapidly changing agriculture and food processing landscape. Speakers provided insight into recent and current projects incorporating emerging technologies and assessed their demand-side management benefits. Panelists also addressed current agricultural and food processing industry trends and discussed how new technology can address evolving needs. Finally, speakers highlighted new products and technologies that have beneficial energy and water efficiency impacts for agriculture and food processing customers. The research team incorporated findings into this 2016 Agriculture Irrigation Market Research Report.
Analyzed Farm and Ranch Irrigation Survey (FRIS) data. The 2013 FRIS2 is a supplement to the 2012 Census of Agriculture provided by the USDA. Irrigators respond to the survey by providing information on water sources and amount of water used; acres irrigated by type of system, irrigation, and yield by crop; and system investments and energy costs. The survey provides comprehensive information on irrigation activities and water use across American farms, ranches, and horticultural operations. The research team analyzed this data and incorporated findings into this 2016 Agriculture Irrigation Market Research Report.
Analyzed USDA data. The research team analyzed USDA data for Idaho, Montana, Oregon, and Washington. The objective of the analysis was to summarize key trends for the Pacific Northwest region as a whole as well as within sub-regions. BPA used these findings as a first step toward identifying areas that warrant the greatest attention in their programming. The full analysis is summarized in the USDA Data Analysis memo (Appendix C). The research team incorporated findings into this 2016 Agriculture Irrigation Market Research Report.
2 United States Department of Agriculture, Farm and Ranch Irrigation Survey, 2013. For more information, see: https://www.agcensus.usda.gov/Publications/Irrigation_Survey/.

2016 Agriculture Irrigation Market Research Report 14
Analyzed BPA program data from 2010 to 2015. The research team reviewed BPA’s agriculture irrigation program incentive data from 2010 to 2015 to get an understanding of how the program currently operates. The Agricultural Program’s Theory, Logic, Structure, and Offerings memo (Appendix F) provides these results.
Compared BPA’s Implementation Manual with the Northwest Power and Conservation Council’s (the Council’s) Sixth Power Plan (Sixth Plan) with the Seventh Power Plan (Seventh Plan). The research team compared the Council’s Sixth and Seventh Plans with the incentives offered by BPA as identified in BPA’s Implementation Manual.3 The team provided this information in the BPA Agricultural Programs’ Theory, Logic, Structure, and Offerings memo (Appendix F).
3 BPA’s Implementation Manual (IM) provides the guidelines and requirements for implementing energy efficiency projects in the region. Updated annually, the IM gives customer utilities, program partners, and regional stakeholders information on how to plan and implement energy savings projects and includes approaches and options to further the regional energy efficiency partnership with BPA. More information can be found at: https://www.bpa.gov/ee/policy/imanual/pages/default.aspx.

2016 Agriculture Irrigation Market Research Report 15
Market Characterization The research team performed a number of research activities to characterize the current state of the irrigation market in the Pacific Northwest. This section describes the results of these activities.
Characterizing the Current Irrigation Market BPA is interested in finding new opportunities to save energy and improve efficiency in the agricultural irrigation market. To do this, the research team began by characterizing the market’s current practices, operations, and uses of technologies, including:
Practices for operating irrigation systems such as center pivots, wheel lines, hand lines, and drip irrigation
Current technologies such as sprinkler equipment, pumps, and controls used in the region
Possible market barriers to adopting low elevation spray application (LESA), low energy precision application (LEPA), scientific irrigation scheduling (SIS), and VFDs on pumps and motors
Irrigation Systems The research team used results from interviews with market actors and the FRIS to identify the various types of irrigation systems operating in the Pacific Northwest. The majority of these systems use pressure irrigation systems (e.g., a center pivot, wheel line, hand line) as opposed to gravity-fed systems.4 Pressure irrigation systems divert water from a river or well into a system of canals where pumps pressurize the water and distribute it to the field. The most efficient system, regardless of type, is one that takes into account crop, soil type, and terrain to use the least amount of energy while maximizing the crop yield. Therefore, much of the discussion around irrigation efficiency depends on these key factors.
Center Pivots and Linear Move Towers
The data shows center pivots and linear move towers make up the majority of irrigation systems in the Pacific Northwest.5 According to FRIS data,6 irrigators in the region irrigate 65% of pressure-irrigated acres with center pivots and linear move towers. Center pivots and linear move towers are generally more efficient than wheel lines and hand lines. However, in some instances, transitioning from a wheel line or hand line to a center pivot is not cost-effective for the irrigator. For instance, a center pivot may not be an upgrade for a farmer with a small or irregularly shaped field; in those instances, a dealer may recommend a wheel line. Most dealers and irrigation consultants indicated that they will recommend wheel lines or
4 USDA, Farm and Ranch Irrigation Survey, Table 28, “Land Irrigated in the Open by Method of Water Distribution: 2013,” 2014. 5 Data obtained from market actor interviews and corroborated by FRIS data: USDA, Farm and Ranch Irrigation Survey, Table 28, “Land Irrigated in the Open by Method of Water Distribution: 2013,” and Table 29, “Land Irrigated in the Open by Sprinkler Systems: 2013.,” 2014. 6 USDA, Farm and Ranch Irrigation Survey, Table 28, “Land Irrigated in the Open by Method of Water Distribution: 2013,” and Table 29, “Land Irrigated in the Open by Sprinkler Systems: 2013,” 2014. The research team combined the sprinkler system acres irrigated with the drip, trickle, or low-flow micro sprinkler acres irrigated for the total pressure-irrigated acres.

2016 Agriculture Irrigation Market Research Report 16
hand lines for small and irregularly shaped fields; two dealers also noted that certain crop types do not benefit from center pivots, including cattle pasture, grass, hay, and alfalfa. One of these dealers explained that alfalfa is watered at times when water is not scarce (the early spring and late fall) so efficiency is less of a concern and the benefits of a center pivot do not outweigh the costs.
Figure 1 illustrates the various components of a center pivot irrigation system. Interviews with manufacturers at the Irrigation Show and interviews with other dealers and irrigation consultants revealed that efficiency improvements to center pivot and linear move tower irrigation systems include the following:
Repairing leaky boots, sprinklers, and gaskets
Using advanced sprinkler technology such as LESA/LEPA (described the Sprinkler Equipment section below)—depending on the terrain
Ensuring the right size pump for the required system pressure
Installing a VFD—depending on the pump configuration and water delivery requirements7
Using precision irrigation controls that rely on crop and soil data
7 VFDs do not create energy savings unless the pump needs to supply a variable flow and/or pressure. The greater the variations and the longer the periods that these vary, the greater the power savings. However, if there is one pump with a well-matched motor that is supplying a single pivot then the VFD may use more energy than if it was absent.

2016 Agriculture Irrigation Market Research Report 17
Figure 1: Center Pivot Irrigation System Components
Source: Research to develop the field data collection protocol as part of the 2017 SIS Study

2016 Agriculture Irrigation Market Research Report 18
Wheel and Hand Lines
The FRIS data also shows 19% of pressure-irrigated acres use wheel or hand line irrigation systems such as side roll, wheel move, other mechanical move, or hand move systems.8 Generally, center pivots are more efficient than wheel lines and hand lines but at a greater cost. Depending on the crop type and value, the expense for upgrading away from wheel or hand lines may not be worth it to the irrigator.
Drip, Trickle, and Low-Flow Micro Sprinkler Irrigation
Drip, trickle, and low-flow micro sprinklers are low-pressure, low-volume watering systems that deliver water in a variety of methods, including dripping, spraying, and streams. Drip systems apply water to the soil or the roots (depending on the type of drip tape) instead of the air, thus reducing the water lost to evaporation. The FRIS data shows that 6% of pressure-irrigated acres in the Pacific Northwest use drip, trickle, or low-flow micro sprinkler systems.9
Irrigation Technology and Equipment on Irrigation Systems This section characterizes irrigation technologies and equipment found on irrigation systems in the market today.
Sprinkler Equipment
The research team learned that the majority of irrigators changed from inefficient impact sprinklers on center pivots to efficient rotating-type or wobbling-type sprinklers on center pivots many years ago. Currently, irrigator practice is to use low-pressure, rotating-type or wobbling-type sprinklers that hang from a drop tube on a center pivot about four to eight feet above the ground. This type of application is termed mid-elevation spray application (MESA).
Irrigation application efficiency refers to the amount of water that makes it to the soil divided by the amount of water that leaves the sprinklers.10 A lower irrigation application efficiency ratio means there is wasted water and water runoff that carries away various fertilizers and other chemicals. Replacing inefficient irrigation equipment with efficient equipment can improve irrigation application efficiency. Energy-saving measures include replacing the inefficient components (e.g., end-gun impact sprinklers) or by replacing the worn components that may leak or not be at optimum performance. Efficient sprinkler equipment can also create energy savings by applying water uniformly to the irrigated area, using less water. Uniformity is
8 USDA, Farm and Ranch Irrigation Survey, Table 28, “Land Irrigated in the Open by Method of Water Distribution: 2013,” and Table 29, “Land Irrigated in the Open by Sprinkler Systems: 2013,” 2014. The research team combined the sprinkler system acres irrigated with the drip, trickle, or low-flow micro sprinkler acres irrigated for the total pressure-irrigated acres. 9 USDA, Farm and Ranch Irrigation Survey, Table 29, “Land Irrigated in the Open by Sprinkler Systems: 2013,” and Table 28, “Land Irrigated in the Open by Method of Water Distribution: 2013,” 2014. The research team combined the sprinkler system acres irrigated with the drip, trickle, or low-flow micro sprinkler acres irrigated for the total pressure-irrigated acres. 10 Definition provided by Troy Peters, Associate Professor, Irrigated Agriculture Research and Extension Center, Washington State University.
Irrigation Application Efficiency Defined The amount of water that makes it to the soil divided by the amount of water that leaves the sprinklers.

2016 Agriculture Irrigation Market Research Report 19
important because if the irrigation system does not apply water uniformly, an irrigator must apply more water to the whole field in order to adequately irrigate an area where less water is applied.
According to dealers and the WSU consultant, efficient sprinklers and their components (nozzle and pressure regulator) typically last five to seven years depending on the irrigation water cleanliness. For example, if pumping clean water, as from a well, sprinklers can last much longer than if pumping water with sand in it.11 Specifically, the Pacific Northwest Regional Technical Forum uses a measure life of four years for a nozzle, five years for an impact sprinkler, and five years for a new sprinkler package to estimate potential savings from sprinkler replacements.12
One market actor estimated that about 66% of irrigators have a sprinkler replacement schedule that reminds them when to replace their sprinklers. The majority of sprinkler replacements (60%-75%) happen as a package—the irrigator replaces the sprinkler, nozzle, and pressure regulator at the same time.
Based on interviews at the Irrigation Show and interviews with manufacturers, dealers, and irrigation consultants, the most efficient type of sprinkler application is LESA or LEPA. This type of application puts the sprinkler lower to the ground than in a MESA application, and can reduce evaporation by nearly 7% compared to MESA.13 The research team has seen various studies that define LESA as 18 inches to 20 inches off the ground using a spray head and LEPA as 18 inches to 20 inches off the ground using a bubbler nozzle or on the ground with a drag sock. Sprinkler spacing may change along the length of the machine to meet water application and economic goals. The BPA LESA demonstration project found that 4 inch to 5 inch spacing between drop tubes improved uniformity.14
Interviews with manufacturers, dealers, and irrigation consultants identified possible areas on a center pivot where leaks occur, including boots, gaskets, and drains. However, these market actors also noted that these leaks are not that common on center pivots and, therefore, not a major cause of wasted water and energy. Most irrigators are able to fix these leaks—when they occur—on their own.
11 Irrigators can replace sprinkler components separately as they wear although dealers would rather sell the whole sprinkler. 12 The Regional Technical Forum, Agricultural: Irrigation Hardware, AgIrrigationHardware_v3_1 UES measures spreadsheet. http://rtf.nwcouncil.org/measures/measure.asp?id=84. 13 Freddie Lamm, “Concepts of In-Canopy and Near-Canopy Sprinkler Irrigation,” May 2006, http://www.researchgate.net/publication/242089279_concepts_of_in-canopy_and_near-canopy_sprinkler_irrigation. 14 Howard Neibling, Dick Stroh, Troy Peters. Presentation at the Treasure Valley Irrigation Conference. “Low Energy Sprinkler Application (LESA) Center Pivots”, December 2014. http://pnwpestalert.net/uploads/meetings/Treasure_Valley_Workshop_LESA_14.pdf.
Sprinkler Spacing Key for LESA/LEPA Usage Only about 2% of the center pivot packages sold in the Pacific Northwest include the design and spacing needed for LESA or LEPA. Well-defined sprinkler spacing is required for uniform water application and for successful LESA and LEPA systems:
Spacing that is too wide can reduce uniformity
Outlet spacing that is excessively close can have diminishing returns for the added cost of more sprinklers

2016 Agriculture Irrigation Market Research Report 20
Pumps
The amount of power required to pump water to the field depends on three factors: the volume of water pumped, the location of the water source relative to the pump (elevation and distance), and the irrigation system operating pressure. If the operating pressure of the system is not at optimum, the pump works harder than necessary. Pump tests determine pump performance and recommendations for more efficient pumping, known as pump efficiency. Pump efficiency is the water or liquid power divided by the power input at the pump shaft.15 Pumps can be most efficient when pressure of the application is optimal and is controlled by a VFD (if applicable).
Irrigators can use a VFD to better control the flow of water to two or more irrigation systems or in conjunction with a variable rate irrigation (VRI) system (discussed in the Controls section below) to focus water and fertilizer application exactly where needed. VFDs control the irrigation pump’s motor speed to deliver the right amount of energy to each system and ensure the pump functions at optimal efficiency. This saves energy by preventing over-pumping and over-pressurizing irrigation equipment. The research team heard from dealers and irrigation consultants that some VFDs are currently in use by irrigators. Dealers and irrigators did not provide their opinion on the percentage of irrigators currently using VFDs.
Controls
Controls allow irrigators to control the speed, direction, and water and fertilizer application, as well as to power the pump on or off from the pivot point, a central hub, or a mobile platform. Types of controls include the following:
Pivot on/off
Direction
Constant speed
Pump on/off
Single and/or dual end-gun
Variable speed irrigation (VSI)
Variable rate irrigation (VRI)
Auxiliary controls such as agrichemical injection pumps
Controls for a cornering pivot’s swing arm for tire direction, tire speed, and sprinkler cycling for uniform application
Various control options are available when purchasing a new pivot. Purchase decisions vary depending on the needs of the irrigator. Generally, smaller farms with one pivot may opt for controlling the pivot speed
15 This definition of pump efficiency is from James Curran, a Water Resource Consultant for Agricultural Resource Management, His presentation, “Irrigation Pump Efficiency,” is located at: http://www.farmpoint.tas.gov.au/farmpoint.nsf/downloads/3583B3EF6D09ACE8CA257686007D1663/$file/Irrigation_Pump_Efficiency_presentation.pdf.

2016 Agriculture Irrigation Market Research Report 21
and direction from the pivot point only, whereas large farms that have many pivots tens of miles from their main business location may opt for remote monitoring and control. Some pivots can be 100 miles away from the main business location; in these instances irrigators like the convenience of relying on one remote mobile application to control all of their pivots. The type of control used is less dependent on the size of the farm than on other factors. A dealer noted that key factors to decide what type of controls to use include the number of pivots and distance between each pivot (more automated controls means less driving) and the type of crop (high dollar vegetable crops may warrant advanced controls paired with aerial technology to apply the correct amount of water for the crop).
Two controls that regulate water and fertilizer application are VSI and VRI. These controls can save water and energy by enabling pivot irrigators to focus water and fertilizer application exactly where needed and to ensure crops get a more accurate application based on topography information, soil data maps, yield data, and other user-defined information. The definitions of VSI and VRI are provided below:
VSI: The pivot moves more quickly during some parts of its rotation than others, dividing the field into wedges that receive more or less water
VRI: Individual sprinklers or groups of sprinklers that pulse (turn on and off) during some parts of the pivot’s rotation, dividing the field into sub-wedges that receive more, less, or no water
Figure 2 demonstrates the difference between VSI and VRI.
Figure 2: Comparison of Variable Speed and Variable Rate Irrigation
Source: Navigant depiction of VSI and VRI irrigation technologies based on research from interviews
Dealers and pivot manufacturers indicated that most existing pivot systems are already capable of VSI with little or no additional capital investment needed. One pivot manufacturer estimated that 50% of

2016 Agriculture Irrigation Market Research Report 22
existing systems are capable of implementing VRI but only about 5%-12% of irrigators are actually taking advantage of that capability.
The Irrigation Equipment Supply Chain This section discusses the supply chain between market actors to get a sense of who impacts irrigation technology choices and who may be in a position to choose more efficient options.
The irrigation supply chain consists of four main market actors: Manufacturers, Dealers, Consultants, and Irrigators. The product flow of irrigation equipment from the manufacturer to the irrigator depends on the type of equipment. Figure 3 illustrates the supply chain for the main equipment types found in the irrigation market of the Pacific Northwest: drip equipment, irrigation controls, pumps and motors, pivot equipment, and sprinklers. Drip equipment and irrigation controls usually skip the dealers, but the majority of irrigation equipment (pumps and motors, pivot equipment, and sprinklers) are highly dependent upon these market actors. Because 84%16 of pressure-irrigated acres in the Pacific Northwest use center pivot, wheel line, and hand line systems, the research team focused the interviews on these market actors.
Manufacturers
Manufacturers in the agricultural space include companies that manufacture drip/micro sprinkler equipment, controls, pump, motors and VFDs, pivots, and sprinklers. Sprinkler equipment manufacturers sell their equipment directly to pivot manufacturers for new pivot installations and primarily sell their equipment to pivot manufacturers for existing equipment upgrades—though equipment for existing equipment upgrades can also flow through dealers. Most equipment flows from manufacturers to dealers, though controls can flow through irrigation consultants and drip/micro sprinkler equipment can move directly to the irrigators.
Dealers
Dealers play a significant role in the supply chain of pivot irrigation equipment, sprinklers, and pumps/motors. For instance, many dealers have specialized software—usually developed by the pivot or the sprinkler manufacturers—that specifies exactly how to set up the pivot system so that the rotating pivot applies water uniformly (e.g., through nozzle selection and sprinkler spacing). Since each irrigated acre is different from the next, dealers must customize these systems to the field in which they operate. To run sprinkler packages, irrigators need all of the custom specs for the pivot system (e.g., tire size, gear box ratios, pipe size, span lengths, outlet locations, overhang length, end-gun configurations) and rely heavily on dealers to set up these customized systems properly. Dealers also help irrigators repair damaged or malfunctioning pivot systems, so irrigators try to maintain good working relationships with all of their respective dealers. The research team expands on how dealers can help drive improved efficiency in the irrigation market in the Program Opportunities section below.
16 84% includes 65% center pivots and linear move tower irrigation systems and 19% side roll, wheel move, other mechanical move, or hand move systems. USDA, Farm and Ranch Irrigation Survey, Table 28, “Land Irrigated in the Open by Method of Water Distribution: 2013,” and Table 29, “Land Irrigated in the Open by Sprinkler Systems: 2013,” 2014. The research team combined the sprinkler system acres irrigated with the drip, trickle, or low-flow micro sprinkler acres irrigated for the total pressure-irrigated acres.

2016 Agriculture Irrigation Market Research Report 23
Consultants
Crop and irrigation consultants and agriculture audit firms are two key players in the agriculture irrigation supply chain. Crop and irrigation consultants provide services to irrigators including SIS, controls, and other crop guidance. Agriculture audit firms perform audits at farms and provide recommendations to the irrigator for energy efficiency and other upgrades.
Irrigators
Irrigators are the farmers that grow the crops. The irrigators are the end-users of agriculture irrigation equipment. They are the ultimate decision makers around irrigation equipment and installing efficient equipment.

2016 Agriculture Irrigation Market Research Report 24
Figure 3: Agriculture Irrigation Supply Chain
Source: Interviews with manufacturers, dealers, and irrigation consultants

2016 Agriculture Irrigation Market Research Report 25
Current Market Barriers The study found that while some irrigators are aware of efficient technologies, many irrigators may be battling competing priorities and have limited capital to invest in more efficient technologies. 17 According to interviews with dealers, energy and water costs are low compared to other farm costs, and the Pacific Northwest’s state water policies18 may prevent farmers from wanting to conserve or invest in efficiency. Interviews with BPA staff and various market actors indicated that a limited water supply is a driving factor for changing installation and equipment practices—a lack of water, or the ability to spread conserved water to additional acreage, would be a significant motivator for farmers to adopt water-efficient irrigation technologies. In this section, the research team outlines several other potential barriers to irrigators adopting LESA/LEPA, SIS, VFDs, and controls. Interviews with manufacturers, dealers, and irrigation consultants identified these potential barriers—many of which relate to the benefits of the technology not outweighing the cost of adoption.
Barriers to LESA/LEPA Few of the manufacturers, dealers, and irrigation consultants that the research team spoke with are aware of many—if any—applications of LESA/LEPA in the Pacific Northwest. Some dealers and irrigation consultants are excited about the potential of LESA/LEPA but also note the reluctance to recommending it because it is a relatively new idea in the region. Dealers and irrigation consultants noted that there is also a widespread perception that LESA/LEPA is not applicable to the Pacific Northwest terrain and crop types and, therefore, is not ready for mainstream adoption. Dealers and irrigation consultants described the following perceived market barriers:
Terrain is too variable. According to interviewed dealers and irrigation consultants, the terrain in areas of the Pacific Northwest is too hilly or variable for the technology to be effective.
Climate is not advantageous. The Pacific Northwest climate (and, therefore, soil and crop types) is thought by some to not be as well suited for this technology as—for instance—the Texas climate is, where adoption of LESA/LEPA is more common. In Texas the high temperatures (and subsequently high evaporation rates) make the technology not only more cost-effective but more necessary. Additionally, the research team learned from university experts that the water shortages in Texas also drive the adoption of LESA/LEPA practices. There are comparatively fewer water shortages in the Pacific Northwest, reducing the demand for LESA/LEPA. However, the climate in parts of the Columbia Basin is not that different from the Texas panhandle where LEPA/LESA is prevalent.
17 According to United States Department of Agriculture extension office expert, 2015 Market Actor Interview memo (Appendix B). 18 During interviews, the research team heard about a use-it-or-lose-it water rights law, but water policy was not a focus of this research study.
Dealer Interview Findings Energy and water costs are low
compared to other farm costs
Pacific Northwest’s state water policies may prevent farmers from wanting to conserve or invest in efficiency

2016 Agriculture Irrigation Market Research Report 26
Crops are at risk. Dealers and irrigation consultants cite concern from irrigators that LESA/LEPA is a risk to crops. This is based on irrigators’ perception that not enough water will be applied to the crop and that irrigators would be unable to see if sprinklers have stopped working if the sprinklers are below the canopy.
Barriers to SIS According to the preliminary findings from BPA’s 2015-2017 SIS Baseline Study, roughly 25% of fields19 in eastern Oregon and Washington use SIS.20 Market actor interviews and interviews with irrigation consultants indicate that cost is a barrier. Additionally, one dealer noted a generational divide between members of the older generation (age 50 and above) who prefer to walk the fields and check the moisture levels themselves, and the younger generation that prefers SIS and smartphone controls. He said, “I think you’ll see a mixture of the SIS going on for a few more years, or until the younger generation can outvote their dads.” One irrigation consultant noted that there may not be enough people offering the SIS service, but they did say that SIS was often successfully sold to farmers implementing LESA and LEPA because “in order to apply less water, it needs to be managed more intensely as well.”
Barriers to VFDs Dealers and irrigation consultants noted that the most significant barrier to VFDs is the high cost and long, simple payback. The simple payback period for VFDs, given the growing season (average of five months), can be more than five years. A university expert noted that the payback period is highly dependent on the variation of the flow and the length of time that the variations are present.
Barriers to VRI and VSI Controls Dealers and irrigation consultants noted that there is not a large presence of VRI and VSI technologies in the Pacific Northwest for three primary reasons:
The technology requires technology-savvy farm hands and knowledgeable agronomists. According to interviews with dealers, many irrigators lack the technical expertise required to design and program the irrigation system for VSI and VRI especially. Irrigators do not want to risk incorrectly implementing the technologies and harming the crop. Additionally, if irrigators rotate crops annually, they need to design a new program each year. Dealers and irrigation consultants suggested that there could be a lack of qualified service providers to assist irrigators with transitioning to this more data-intensive process, but that was not a widespread perception. A few dealers noted the risk of data overload, and the challenge that field hands may lack the technical expertise necessary to interpret significant amounts of data to optimize irrigation.
The technology is only cost-effective with the right terrain. Several market actors noted that the best applications for VRI or VSI are fields that have extremely variable soil types—particularly
19 The SIS Baseline Study team assumed a field to be an area of land irrigated by a system with the same shutoff point. For example, a pivot field could be shut off at the pivot point – and everything irrigated downstream of that point is the field. 20 The SIS Baseline Study included a sample of about 700 irrigated fields in the Columbia River Basin for initial recruitment into the study. The findings are based on the original field assignment—receives SIS services or does not receive SIS services—in the winter of 2015-2016. The research team is currently undergoing a review of the field assignment now that the 2016 growing season is coming to a completion so this value may be updated later in 2016.

2016 Agriculture Irrigation Market Research Report 27
those with large rocky areas that are untillable or slopes that result in runoff. In addition to water savings, farmers with those types of fields will also save money by not applying fertilizer or other chemicals to parts of the field that are not growing anything. The fact that not all fields are well suited to the technology led some dealers and irrigation consultants to identify unsuitable terrain as a barrier to the adoption of these technologies.
The payback is longer than five years. The significant cost of VRI is the primary barrier to adoption. Dealers and irrigation consultants offered estimates of the cost, which range from $25,000 to $40,000 for VRI compared to $1,500 to $3,000 for VSI. One dealer observed that farmers prefer to spend their money on tractors rather than irrigation. Similarly, due to the cost involved, some market actors noted that the investment is only worthwhile on high-value crops such as potatoes. One dealer offered a detailed case study of a situation in which widespread adoption of VRI would have significantly benefited both potato farmers, French fry food processors, and BPA.
The Future of the Agricultural Landscape The agricultural landscape is changing. Climate change—temperature increases, increasing CO2 levels, and altered patterns of precipitation—are already affecting US water resources, agriculture, land resources, and biodiversity. Meanwhile, the demand for food is growing as the world’s population increases, which the United Nations estimates will reach 11.2 billion in the year 2100.21 Farmers face challenges to increase production to meet the growing demand for food with limited land and water resources. New agriculture technologies are helping farmers to increase yield without negatively affecting the environment so that farmers can do more with less.
Lance Donny at OnFarm22 believes the industry has entered into “Agriculture 3.0.”23 His timeline puts Ag 1.0 at the start of agriculture through the 1920s when manual labor grew crops on small acres of land to sustain individual families. Ag 2.0 was from 1920 to 2010 when synthetic fertilizers supercharged production such that one acre of land could feed five people. Today, Ag 3.0 is the use of data and information systems that can increase production by 70% to 100%.
What does this mean for BPA and the future of their agricultural program offerings? To begin to answer this, the research team first reviewed BPA’s current agricultural program to understand how the program aligned with the current irrigation market. The team then identified areas of opportunity for irrigation efficiency in the BPA region.
21 United Nations, “World Population Prospects: The 2015 Revision,” 2015. https://esa.un.org/unpd/wpp/publications/files/key_findings_wpp_2015.pdf 22 OnFarm is a farm management tool that displays and analyzes data from many different sources in a single, easy-to-use application. For more information, see: http://www.onfarm.com/about-onfarm/. 23 OnPoint with Tom Ashbrook, National Public Radio (NPR) podcast. Time on recording: 13:50. http://onpoint.wbur.org/2015/08/12/farming-tech-drones-crops,

2016 Agriculture Irrigation Market Research Report 28
Agricultural Program Review The research team reviewed BPA’s current agricultural program to understand how it aligned with the current irrigation market practices identified in the Market Characterization section above. The team also looked at the top areas of opportunity for irrigation efficiency in the BPA region. This section provides an overview of BPA’s agriculture irrigation program offerings, goals, and activities. Appendix F offers further detail through the BPA Agricultural Programs’ Theory, Logic, Structure, and Offerings memo.
Program Goals The primary goal of BPA’s suite of agricultural incentives is to achieve the regional targets for energy savings within the agricultural sector. The Council’s estimate of conservation potential drives these targets.24 A secondary and closely related goal is to assist BPA’s customer utilities in helping their agricultural customers save energy and increase efficiency. The program employs multiple strategies, messages, and program offerings to engage their target audiences and meet program goals.
Strategies, Messages, and Program Offerings BPA offers rebates for energy efficient irrigation equipment and practices through its customer utilities; they encourage utilities to offer the rebates to their end-use customers by providing marketing and technical assistance. BPA offers rebates on the irrigation-related measures shown in Table 1, which utilities have the option of offering to their end-use customers. This flexibility allows utilities to participate in the agricultural program on their own terms.
24 For information on the agriculture measures contained in the Council’s Sixth and Seventh Plans, review the BPA Agricultural Programs’ Theory, Logic, Structure, and Offerings memo in Appendix F.

2016 Agriculture Irrigation Market Research Report 29
Table 1: BPA’s Irrigation-Related Measure Offerings25
Program Component Measures
Irrigation System Upgrades
Replace worn nozzle with new flow controlling type nozzle for impact sprinklers
Replace leaking impact sprinkler with rebuilt or new impact sprinkler New nozzle for impact sprinkler replacing existing worn nozzle of same
flow rate or less New nozzle for center pivot and lateral moves New rotating-type sprinklers that replace impact sprinklers Replace leaking pipe section and riser cap gaskets for wheel or hand
lines or portable main line gasket with new gasket New low-pressure regulators New rotating-type sprinklers that replace low-pressure New multiple configuration nozzles for low-pressure pivot sprinklers New multi-trajectory sprays that replace impact sprinklers New multi-trajectory sprays that replace low-pressure sprinklers Replace leaking drain gaskets with new gaskets on wheel lines, hand
lines, or pivots New hubs for wheel lines New goose-neck elbow for new drop tubes (to convert existing
sprinkler equipment mounted on top of the pivot to low-pressure sprinkler package)
New drop tube for low-pressure pivot sprinklers (minimum three feet length)
Replace leaking center pivot base boot gasket with new gasket Pipe repair of leaking hand lines, wheel lines, and portable mainline Rebuild or replace leaking or malfunctioning leveler with new or rebuilt
wheel line leveler
SIS SIS
Irrigation Pump Testing and System Analysis
Irrigation Pump Testing and System Analysis
VFDs in Agricultural Turbine Pump Applications
VFDs in Agricultural Turbine Pump Applications
Transformer De-Energization Transformer De-Energization
New Agricultural Construction/Custom Projects
New Agricultural Construction/Custom Projects
Other Agricultural Measures Other Agricultural Measures
Source: BPA 2015-2016 Implementation Manual
To assist utilities’ energy efficiency staff, BPA agricultural program specialists (APSs) are available to help with direct outreach to irrigators. The APSs offer programmatic assistance, share information about the variety of rebates available (including those from non-BPA entities), and assist irrigators in completing the rebate application paperwork. BPA engineers offer technical assistance to utilities as needed,
25 BPA 2015-2016 Implementation Manual, April 1, 2016, page 22. https://www.bpa.gov/EE/Policy/IManual/Documents/Change_Notice_Summary_15-16_Annual_Manual.pdf,

2016 Agriculture Irrigation Market Research Report 30
particularly with regard to SIS and custom projects. These strategies address the following barriers: utilities’ lack of technical resources to assist irrigators with energy efficiency projects and competing priorities for irrigators’ time, attention, and funds.
BPA also conducts outreach to trade allies (e.g., manufacturers, distributors, dealers) and regional organizations involved in energy and water efficiency.26 The APSs play a role in this outreach, which helps ensure that BPA’s programs use resources effectively and that irrigators receive information about the variety of rebates and technical resources available to help them from both BPA and non-BPA entities.
Additionally, BPA offers marketing collateral and information resources to help promote irrigation efficiency, including an online tool that allows utilities to customize marketing materials. Marketing materials include messages about both the energy and water savings and the non-energy benefits of irrigation efficiency, such as improved crop quality and reduced labor costs.27
BPA encourages utilities to promote incentives for pump tests as a means of engaging irrigators so they will consider efficiency improvements. Rebates cover half the cost of these pump tests, which can help identify performance deficiencies that hardware upgrades can resolve.
BPA collaborates with universities and research organizations such as WSU and the University of Idaho to conduct research and demonstration projects that explore the adoption of new irrigation efficiency incentive measures like LESA and LEPA. These research projects reduce the uncertainty in energy and water savings from new technologies and practices.
Program Activity The research team analyzed BPA’s agricultural program data from 2010 to 2015. Key takeaways from the program data include the following:
Of all agricultural program end-uses, irrigation accounts for the plurality of savings; within the irrigation end-use, SIS contributed the plurality of savings28
Washington and Oregon achieved the most SIS savings, while Idaho did not have any SIS savings in BPA’s territory between 2010 and 2015
Only 21% of the sprinkler measure savings are from efficient sprinklers replacing inefficient sprinklers
The research team describes the key takeaways in detail below.
Irrigation Accounts for the Plurality of Savings Table 2 shows the final end-use categories the research team used to analyze the program data as well as the associated costs and energy savings. Of the total program average megawatt (aMW) energy savings,
26 BPA and its customer utilities conduct outreach to local trade allies, but they does not have a structured communication plan or strategy for engaging them. 27 BPA includes messages about non-energy benefits of irrigation efficiency, but there may be opportunities to further focus on secondary benefits. 28 It is important to note that SIS has a one year measure life. If the analysis was on an annual basis, SIS would account for an average of 83% of the irrigation end-use savings.

2016 Agriculture Irrigation Market Research Report 31
48% are attributable to irrigation (including irrigation from SIS); thus, the research team focused the remaining data analysis on that specific end-use.
Table 2: Agricultural Program Activity by Reported End-Use: 2010-2015
Analysis End-Use Category
Total BPA Cost kWh Saved aMW
Saved $M Cost
per aMW
Percentage of Total aMW
Saved
Irrigation $13,711,913 74,677,584* 8.52* $1.61 48%
Motors/Drives $9,648,055 55,682,044 6.36 $1.52 36%
Custom $2,101,599 12,513,830 1.43 $1.47 8%
Utility Distribution System $742,764 10,162,312 1.16 $0.64 6%
Lighting $607,133 2,510,521 0.29 $2.12 2%
Refrigeration $107,393 556,765 0.06 $1.69 <1%
Process Loads $61,651 242,180 0.03 $2.23 <1%
Water Heating $1,896 27,248 0.003 $0.58 <1%
Total $26,982,404 81,694,900 17.85 $1.51 100%
Note: Table 2 does not list irrigation pump testing and system analysis because BPA does not capture energy savings from that measure.
*The totals for the five-year period include the average SIS savings over 2010-2015 because SIS has a one-year measure life. This is consistent with BPA’s reporting of SIS savings.
Source: IS2.0 2012-Feb 2016 and PTR 2010-2011 data provided by BPA, 2016
Within the irrigation end-use, the research team explored how each type of measure contributes to the savings. Table 3 summarizes all irrigation activity by measure. Over the 2010-2015 period, SIS made up 48% of the total irrigation end-use savings. However, on an annual basis, the team found that the majority (average of 83%) of irrigation end-use savings originate from SIS (see Table 4).

2016 Agriculture Irrigation Market Research Report 32
Table 3: Irrigation End-Use Activity by Measure: 2010-2015
Irrigation Sub-Category
Measure Total BPA
Cost kWh Saved aMW Saved
$M Cost per aMW
Percentage of Total aMW
Saved
SIS SIS $6,728,852 36,028,143* 4.11* $1.64 48%
Irrig
atio
n Sy
stem
Upg
rade
s
Regulator Replacement $1,782,081 11,441,089 1.31 $1.36 15%
Sprinkler Replacements $1,415,486 7,417,630 0.85 $1.67 10%
Nozzle Replacement $407,846 4,687,908 0.54 $0.76 6%
Gasket Replacement $284,216 1,733,609 0.20 $1.44 2%
Drop Tube/Hose Extension
$520,009 1,485,876 0.17 $3.07 2%
Goose Necks $223,462 1,269,224 0.14 $1.54 2%
Pipe Repair $143,819 534,568 0.06 $2.36 1%
Multi-Trajectory Sprays $42,208 326,910 0.04 $1.13 <1%
Drain Replacement $26,066 279,014 0.03 $0.82 <1%
Hub Replacement $41,448 157,496 0.02 $2.30 <1%
Leveler Rebuild $4,719 21,040 0.002 $1.96 <1%
Custom Custom $2,082,399 9,295,077 1.06 $1.96 12%
Pump Irrigation Pump Testing and System Analysis
$9,300 0%
Total $13,711,911 74,677,584 8.52 $1.61 100%
Note: Measure names correspond to BPA’s Measure List Technology/Application/Practice. *The totals for the five-year period include the average SIS savings over 2010-2015 because SIS has a one-year measure life. This is consistent with BPA’s reporting of SIS savings. Source: IS2.0 2012-Feb 2016 and PTR 2010-2011 data provided by BPA, 2016
Table 4: Annual Irrigation End-Use Savings by Sub-Category: 2010-2015
Irrigation Sub-Category
Units 2010 2011 2012 2013 2014 2015 Total
SIS aMW 3.96 5.14 3.70 4.94 1.29 5.64 4.11* kWh 34,670,728 45,021,689 32,382,084 43,317,320 11,333,423 49,443,614 36,028,143*
Irrigation System Upgrades
aMW 0.49 0.62 0.61 0.48 0.52 0.64 3.35
kWh 4,254,370 5,392,221 5,307,983 4,221,871 4,551,240 5,626,679 29,354,364
Custom aMW 0.11 0.38 0.01 0.20 0.06 0.31 1.06 kWh 934,608 3,302,712 93,950 1,775,641 498,657 2,689,508 9,295,077
Note: The years in the table are the years BPA reported the savings in the database.
*The totals for the five-year period include the average SIS savings over 2010-2015 because SIS has a one-year measure life. This is consistent with BPA’s reporting of SIS savings.
Source: IS2.0 2012-Feb 2016 and PTR 2010-2011 data provided by BPA, 2016

2016 Agriculture Irrigation Market Research Report 33
Washington and Oregon Contribute the Most SIS Savings Of the irrigation end-use measures, Washington, Oregon, and Idaho reported the largest amount of total program savings from 2010 to 2015. When assessing the different types of measures within the irrigation end-use, the team observed that most of the SIS savings come from Washington and Oregon. Idaho did not achieve any SIS savings in BPA’s territory during this time. Figure 4 depicts the aMW saved per state by irrigation sub-category.
Figure 4: Irrigation End-Use aMW Saved by Irrigation Sub-Category
Note: Other includes Montana, Utah, Wyoming, Nevada, and California, as well as areas outside BPA territory or spanning multiple states—primarily associated with cooperatives (e.g., Pacific Northwest Generating Co-op and Oregon Trail). Source: IS2.0 2012-Feb 2016 and PTR 2010-2011 data provided by BPA, 2016
Only 21% of the Sprinkler Measure Savings Are from Efficient Sprinklers Replacing Inefficient Sprinklers Sprinklers come in various shapes, sizes, and efficiencies. BPA’s current incentive structure offers replacements on sprinklers but not necessarily on sprinkler types considered inefficient. Table 5 shows the various types of sprinklers in the marketplace, as well as the energy savings generated by replacing each type. In short, 79% of sprinklers incented by BPA replace already efficient sprinkler types or are inefficient sprinklers replacing inefficient sprinklers (impact sprinklers), thus maintaining the current efficiency in the market.
‐
1
1
2
2
3
3
4
Washington Oregon Idaho Other
aMW Saved
(2010‐2015)
SIS Irrigation System Upgrades Custom

2016 Agriculture Irrigation Market Research Report 34
Table 5: BPA Replacement Detail for the Multi-Trajectory Sprays and Sprinkler Replacements
Measure
Old Techno-
logy Being
Replaced
New Replace-
ment Techno-
logy
Total BPA Cost
kWh Saved
aMW Saved
$M Cost per
aMW
Percentage of Total
aMW Saved
Efficient Sprinkler Replacing Inefficient Sprinkler
Multi-Trajectory Sprays
Low-Pressure Sprinkler
Multi-Trajectory
Sprays $12,256 102,544
0.01
$1.04 1% No
Multi-Trajectory Sprays
Impact Sprinkler
Multi-Trajectory
Sprays $29,952 224,366
0.03
$1.17 3% Yes
Sprinkler Replacements
Rebuilt or New
Impact Sprinkler
Leaking Impact
Sprinkler $191,812 1,095,842
0.13
$1.53 14% No
Sprinkler Replacements
Impact Sprinkler
Rotating-Type
Sprinkler $270,165 1,404,944
0.16
$1.68 18% Yes
Sprinkler Replacements
Low-Pressure Sprinkler
Rotating-Type
Sprinkler $953,509 4,916,844
0.56
$1.70 64% No
Total $1,457,694 7,744,540 0.89 $1.64 100%
Note: Due to rounding, Table 5 shows 22% of sprinkler replacements are efficient equipment replacing inefficient equipment. Source: IS2.0 2012-Feb 2016 and PTR 2010-2011 data provided by BPA, 2016

2016 Agriculture Irrigation Market Research Report 35
Program Opportunities Based on the research team’s market characterization and review of BPA’s agricultural program, the research team identified a number of opportunities to push the irrigation market toward more efficient technologies and practices. This concept is in contrast to maintaining the market by—for example—replacing worn, inefficient sprinklers with new, inefficient sprinklers in a market that has already adopted high efficiency sprinklers (Figure 5).
Figure 5: Ways to Influence a Market
Source: Research team depiction of the concept
The research team prioritized the opportunities based on the research finding – the research team identified the opportunities as high priority because many market actors mentioned the opportunity as being an important opportunity for the future. The research team also divided the high-priority opportunities into two categories (delivery mechanisms and technologies) and categorizing the lower-priority opportunities as other opportunities.
Delivery Mechanisms Delivery mechanisms refer to the way the program is delivered to the market rather than specific technologies that are part of the program. The following points convey opportunities for irrigation efficiency in the BPA region through the program delivery.
1. Focus on the Irrigation System as a Whole, Rather than Individual Components Each farm has different irrigation needs and requires different solutions to achieve the right efficiency. This requires a focus on the entire irrigation system, incorporating low-pressure sprinklers, VFDs, controls, and other efficient irrigation hardware. This type of focus could occur through BPA’s program as a custom incentive offering—although custom projects do not currently account for much of the program savings.29 29 The custom sub-category accounts for 39% of the 2010-2015 irrigation end-use savings. However, on an annual basis, the custom sub-category accounts for an average of 3% of the irrigation end-use savings over that same time period.

2016 Agriculture Irrigation Market Research Report 36
The research team thinks there is an opportunity to push the market by focusing on the irrigation system as a whole when considering incentive offerings. The research team suggests that BPA develop a dedicated program strategy that tracks how many irrigators are updating their entire irrigation system rather than just individual components. One way to track this is consistently requiring site information from utility customers so that it can identify how often irrigators install multiple measures on the same system.30
The following points support this conclusion:
Panelists at the ETCC Quarterly Meeting noted that looking at the system as a whole package is important for identifying efficiency in agriculture. For example, one panelist noted that for drip systems, dealers and irrigators should pay attention to drip tape type, pump, VFD, and other specifications when calculating whether it is an efficient replacement to the existing irrigation system. Another panelist noted that agricultural programs often support only portions of the irrigation system but that they really should support the system as a whole.
A quote from the Market Actor Interview Summary Notes memo (Appendix B) indicated: “A commercial energy consultant says that agriculture needs to have a different delivery model than C&I. The agriculture sector requires a holistic approach and an understanding of the unique risk and cost sensitivities facing irrigators.” Another quote from the same memo states, “According to an NRCS Technical Service Provider[…]the interviewee also notes that farms require a more holistic, ’systems thinking’ approach than does efficiency in other sectors[…] Take a step back and look at it on the systems level.”
Sprinkler manufacturers said that they recommend sprinkler replacements happen as a package (sprinkler, nozzle, pressure regulator).
2. Develop a Dealer and Food Processor Trade Ally Network Interviews with manufacturers, dealers, irrigation consultants, and other market actors revealed that irrigation dealers and food processors (those who buy crops from irrigators) have a strong influence on irrigator efficiency within the market. Discussions with BPA staff showed that BPA currently works with regional irrigation market actors, but on a more informal basis. The research team sees opportunities to formalize a trade ally network throughout the Pacific Northwest and use the influence of dealers and food processors to push the market toward
30 While the research team found that it may be possible to identify whether customers install multiple measures on the same pivot or in the same field through individual incentive offerings, BPA would need to make assumptions regarding the installation site name. Customers did not consistently record the installation site name for incentive reimbursements, so the team could not complete analysis for all data on whether irrigators updated multiple measures at the same site.
Manufacturer Interview Findings “Dealers are in a unique position to take on this effort [energy efficiency outreach] as they are regularly selling irrigation systems, controls, and hardware to irrigators.”
"It really comes down to the dealers having a good design."

2016 Agriculture Irrigation Market Research Report 37
increased efficiency. This section describes the impacts these two groups could have on the market.
Dealers
The existing agriculture supply chain in the Pacific Northwest suggests that dealers are in a unique position to spread the word about energy efficiency programs and the BPA incentives available to irrigators. Interviews with dealers, pivot manufacturers, and other market actors indicate that dealers have a strong influence on irrigators when irrigators make decisions about equipment and irrigation practices. Figure 6—which is a subset of Figure 3 from The Irrigation Equipment Supply Chain section—shows the direct connection between dealers and irrigators. The thicker arrows represent a stronger influence.
Figure 6: Dealer Influence on Irrigators
Source: Interviews with manufacturers, dealers, and irrigation consultants as part of the 2016 Agricultural Market Research Study
As discussed in The Irrigation Equipment Supply Chain section, dealers regularly design and sell irrigation systems, controls, and hardware to irrigators, and are uniquely positioned to influence the purchasing decisions of the end-use irrigators. The research team suggests that BPA utilize the existing dealer infrastructure for a trade ally program. If BPA provides training and support to dealers, dealers could promote efficient irrigation system design to irrigators.

2016 Agriculture Irrigation Market Research Report 38
Food Processors
In addition to dealers, BPA could look at opportunities to move the market to greater energy efficiency by working with the buyers of crops (i.e., food processors). According to interviews with dealers, food processors are providing detailed instructions to irrigators on how to irrigate their crops. For example, the research team learned at the ETCC Quarterly Meeting that Campbell's Soup works closely with their irrigators in California to ensure that the ideal amount of water is contained in the tomatoes they purchase from irrigators.31 Tomatoes containing the ideal amount of water is a win-win for the irrigator and for Campbell’s—the irrigator applies less water (saving water, energy, and money) and Campbell’s spends less energy removing excess water from the tomato. In addition, companies like Walmart have sustainability goals which can flow through to suppliers like Campbell’s Soup and then to the irrigators.
The team also heard from a dealer that potato food processors could encourage farmers to apply specified amounts of water to meet their standards (see “Words from a Dealer” sidebar). Anheuser Busch is also actively pursuing water conservation with their barley irrigators.
The research team’s interview with the Northwest Food Processors Association (NWFPA) indicated that food processors—including those with their own grow operations—would be very interested in partnering with BPA to support energy and water efficiency efforts. The NWFPA members have a commitment to sustainability in all parts of their businesses. The NWFPA identified several avenues of engagement BPA could take to promote efficiency offerings including, attending a NWFPA committee meeting or other regional NWFPA events, and through online webinars directly with interested members.32 Additionally, a university expert suggested that BPA could encourage food processors to develop a “water conservation” label or similar certificate to “organic” certification labels.
31 Dean Kunesh, Tom O'Donnell, Dan Sonke, “Making Emerging Technology Work in the Agricultural Space,” ETCC Quarterly Meeting, April 2016. 32 The NWFPA offered many suggestions of ways to reach their members including the following: attend a Northwest Food Processors Association energy committee or environmental committee meeting to share the program vision and sign up interested food processor representatives; present a webinar sponsored by the Northwest Food Processors Association for their members; provide information to the Northwest Food Processors Association to place on their website; present opportunities to the Northwest Food Processors Association conference and expo in January, where thousands of food processors are attendees; and attend the sustainability conference the Northwest Food Processors Association holds in the spring, usually around early April, which could also be an opportunity to discuss a trade ally network.
Words from a Dealer “Last year, we had an excessively long spell of 100 degrees every day. [Irrigators] felt they had to keep the water running and they didn’t have the monitoring to shut it off. The farms that did have VRI zones, they were able to control theirs. [The farms that didn’t have VRI] had to keep these pivots running and they were all over-irrigating. When you get water on potatoes, the cells in the potatoes gets too watery, and when they put that potato in storage, it breaks down and gets moldy, and then it deteriorates all the potatoes around it - one goes bad and the whole bag goes bad. The potato company said we got to do something about this, we can’t have this, it’s costing us too much money.”

2016 Agriculture Irrigation Market Research Report 39
Food processors could increase the value of produce if irrigators certify their irrigation practices; in return, irrigators would need to prove that they follow energy conservation practices.
Possible Levels of Trade Ally Engagement
The National Rural Electric Cooperative Association’s (NRECA) Cooperative Research Network developed a “Guide to Implementing a Trade Ally Program.” In the guide, NRECA draws on best practices from residential and commercial trade ally programs in operation around the country. The research team referenced the guide in making suggestions on how BPA could supply trade allies with important information and resources relevant to efficient agricultural irrigation opportunities across the Pacific Northwest.
Through a trade ally network, trade allies, BPA, and utilities can work cooperatively to help customers make cost-effective, energy efficient irrigation choices. There are many options to the size and amount of engagement BPA and utilities have with trade allies, ranging from ensuring that dealers and food processors are familiar with BPA’s agriculture irrigation program processes, technical specifications, and any other requirements to closely collaborating with trade allies so that they market and promote the program as a key component of their business. At a minimum it is important to set goals and develop the value proposition for the dealers and food processors. The research team outlines various levels of engagement (beyond setting goals and developing the value proposition) with trade allies in Table 6. Level 1 engagement is the minimal effort to develop a trade ally network; level 2 and 3 increase the engagement.

2016 Agriculture Irrigation Market Research Report 40
Table 6: Trade Ally Network Engagement Levels
Level 1 Level 2 Level 3
Make dealers and food processors aware of program offerings and administrative and technical program requirements33
Develop a contact list of dealers and food processors
Provide dealers and food processors with minimal marketing materials
List trade allies on BPA or utility websites using minimal documentation of meeting screening criteria
Conduct annual trainings Develop a co-branded program
with dealers and food processors34
Develop a recognition program, like Trade Ally of the Month, to recognize strong partners
Enhance documentation needs for meeting screening criteria to be listed as a program trade ally
Develop program manual with procedures and best practices
Ask that trade allies agree to market and promote the program as a key component of their business in return for financial incentives and other benefits; under this approach, trade allies will more directly represent BPA and serve as the primary marketing force for the program
Offer reimbursement for technical training and certifications
Offer sales trainings Issue an RFP for a trade ally
program Work with a data processing
and visualization company to provide value to food processors and irrigators and push energy efficiency forward
Source: Adapted from Patrick Keegan and Christine Grant, “Guide to Implementing a Trade Ally Program, Collaborative Efficiency,” March 2014.
3. Highlight Secondary Benefits within Marketing Materials Research with dealers and irrigation consultants suggests that marketing energy efficiency as the primary benefit to upgrading equipment is good, but adding the secondary benefits to marketing collateral may increase the chances that an irrigator will upgrade their equipment. The research team heard from dealers, irrigation consultants, and utility staff that there is a need for on-hand program resources such as fact sheets, case studies, and video documentaries to enhance irrigators’ understanding of efficiency benefits.
Interviews with dealers and irrigation consultants indicate that many farmers upgrade to equipment that is more efficient because it makes their lives simpler, not because their primary concern is to save energy. For instance, one interviewee noted that installing a VFD allows a farmer to manage the motor at a precise speed, to stop at a precise position, or to apply a specific amount of torque. VFDs also enable irrigators to start and control pumps remotely with ease. They gradually ramp the motor up to operating speed to lessen mechanical and electrical stress, reducing maintenance and repair costs and extending the life of the motor and the driven equipment. All these benefits mean the irrigator can worry less about fixing a pump issue and more about the crop health and yield.
33 Interviewees (BPA staff, dealers, and irrigation consultants) shared the following ideas for making dealers and food processors aware of program offerings: case studies, documentaries, forums, farm tours, dinners, and workshops. 34 Co-branding could include adding the trade ally’s logo to marketing materials and BPA and utility websites as well as inviting trade allies to speak with BPA and utilities at events, etc.
2016 Agriculture Irrigation Market Research Report 41
Another example of the importance of communicating the secondary benefits of energy efficiency upgrades relates to water use. For example, if an irrigator is located in an area where water shortage is an issue and it is a dry season, chances are the irrigator cares more about water than she does energy—the irrigator can water crops if the equipment is inefficient but cannot water crops if drought prevents water use. It is important to appeal to the irrigator’s senses in these instances. Marketing collateral could focus on how efficient technologies save water. Therefore, the irrigator can use less water and still get a productive yield.
Based on this research, highlighting secondary benefits within marketing materials could push the market to take advantage of more BPA incentive offerings. Because every farm is distinct and every irrigation system requires unique equipment to achieve the most efficiency, the BPA program could develop materials targeted specifically to small farms or specific types of crops, for example. Having targeted messaging makes irrigators less likely to say, “That program or that technology does not apply to me.”
Dealers, irrigation consultants, and utility staff also suggested that BPA hold educational events like forums, farm tours, dinners, and workshops to help educate irrigators. These interviewees believe that materials and events could close the knowledge gap between how efficient irrigation system design affects crop yield and energy and water use, and may spur earlier adoption of efficiency measures. Research findings that support this recommendation include the following:
During interviews a pivot manufacturer said the following about VRI: “The biggest key is education. Getting everyone educated to the value of doing this. And the problem is that we don’t have a lot of data on how much it’s going to improve the situation.”
Panelists at the ETCC Quarterly Meeting noted that neighbor-to-neighbor (peer-to-peer) communications are highly valued by irrigators and an effective communication channel in the agriculture sector. Panelists mentioned several times that market activity is dependent on word of mouth. The Market Actor Interviews Summary Notes memo (Appendix B) also noted the importance of peer-to-peer communications.
Interviews conducted in 2014 touched on education. Specifics are in the Market Actor Interview Summary Notes memo (Appendix B). In response, the research team stated the following:
o There is a need to train dealers and an opportunity to work with irrigation consultants
o There is a disconnect between the way a technology is designed and the way it is used in the field; partially due to communication and language barriers with irrigators
o Expanded education, outreach efforts, and demonstrations of savings potential would help close the knowledge gap and spur earlier adoption of efficiency measures
o Irrigators learn about efficiency upgrade opportunities from local soil and water conservation districts and irrigation district offices
o The team learned from the 2015 Irrigation Show that dealer and irrigator education around sprinkler spacing for LESA/LEPA is an area for improvement, and that BPA could

2016 Agriculture Irrigation Market Research Report 42
leverage education and outreach programs from other areas, like the Center Pivot Water Conservation Project35
Technologies In addition to program delivery mechanisms, BPA can consider offering incentives for specific technologies. The research team identified three technologies to consider, as described below.
1. Promote Data-Based Agriculture “Farming was once intuitive. Today it is analytical and data driven.”36 This quote comes from the October 2015 issue of Popular Science that included a series on "The Future of Food” and an article titled “The iPhone-Driven Farm.” The article talked about one farmer who has automated his farm with dozens of sensors and drone technology to track soil moisture, wind speed, and rainfall. He receives all this data on his iPhone.
Another story from National Public Radio’s (NPR’s) podcast OnPoint with Tom Ashbrook looked at the high-tech revolution that is occurring in agriculture. Lance Donny with OnFarm terms this “Agriculture 3.0” and says, “Ag 3.0 really is about information technology. How do you use data and information systems to make super or hyper efficiency decisions about the farm so we can again increase production by 70% or 100% to feed the global planet.”37
Additionally, an article from National Geographic noted that, “GPS-equipped machinery supported by computers that organize sophisticated data on plants, soil, and weather is accelerating and enhancing farmers’ on-farm knowledge.”38
Interviews with market actors including BPA staff, utility staff, dealers, controls manufacturers, and a USDA extension office representative provided similar opinions regarding decision-based agriculture. Many noted data as an area of opportunity for improving irrigation practices in the region; however, FRIS data shows that the majority of irrigators do not use data (e.g., soil moisture sensing devices, a commercial or government scheduling service, plant moisture sensing device, computer simulation model) to make decisions about when to irrigate.39 Based on this research, BPA could push the market by promoting data-based irrigation practices, which could mean incentivizing controls and other tracking technologies, or providing education about data-based agriculture to the region. The research team’s evidence supporting this opportunity is listed below:
Quotes from market actors found in the Market Actors Interview Summary Notes memo (Appendix B) state the following:
35 The Center Pivot Water Conservation Project helps center pivot irrigation operators reduce water consumption. Information can be found at: http://water.unl.edu/cropswater/pivotproject 36 Taylor Dobbs, “The iPhone-Driven Farm,” Popular Science, October 2015, Vol. 287 Issue 4, p. 38. 37 OnPoint with Tom Ashbrook, National Public Radio (NPR) podcast. Time on recording: 13:50. http://onpoint.wbur.org/2015/08/12/farming-tech-drones-crops. 38 Kelsey Nowakowski, “Precision in the Fields,” National Geographic Magazine, July 2014, Vol. 226 No. 1 39 USDA, Farm and Ranch Irrigation Survey, Table 22, “Methods Used When Deciding When to Irrigated,” 2014.

2016 Agriculture Irrigation Market Research Report 43
o “Automation and data driven management present the biggest potential for savings, according to multiple respondents.”
o “Efficiency gains are going to come from better irrigation management, not technology,” according to one agricultural extension office representative40.
o One interviewee noted that “advanced automation is currently in use in only 10% of the Columbia Basin and much less in Idaho and Montana.” This quote suggests that there is room for more advanced automation.
o According to an agriculture extension office expert, “labor costs are increasing…this will support a continued shift away from the more labor-intensive gravity irrigation systems and toward pressurized systems and greater use of automation and controls.”
Quote from a dealer: “VRI is slow to come on because of the cost, but why water a rock pile in your field if you don’t need to, so this lets you turn that head off and water elsewhere. That’s the new technology that’s coming on.”
VRI was often a topic of conversation at the Irrigation Show in November 2015. Findings from this show indicated that controls could also offer opportunities for utility load management.
The California ETCC panelists noted that they think big data with electronic tools is emerging and will be the “next thing.”
While research shows that data-based agriculture with controls can reduce over-watering and save money and energy, FRIS data shows that the majority of irrigators do not use data to make decisions about when to irrigate.41 Therefore, there is opportunity in “pushing” the market toward data-based agriculture. Table 7 represents irrigator responses about when they decide to irrigate from the FRIS.
40 These representatives are usually university affiliated. 41 USDA, Farm and Ranch Irrigation Survey, Table 22, “Methods Used When Deciding When to Irrigated,” 2014.. This data is only available by number of farms that reported—not by acres.

2016 Agriculture Irrigation Market Research Report 44
Table 7: FRIS Data: Methods Used When Deciding When to Irrigate
Method Farms Percentage of Total
Condition of crop 28,759 75%
Feel of soil 15,211 40%
Scheduled by water delivery organization (when water was delivered or available by irrigation water supplier - no choice by water user)
10,514 27%
Personal calendar schedule 9,239 24%
Soil moisture sensing device 2,735 7%
When neighbors begin to irrigate 2,073 5%
Reports on daily crop-water-evapo-transpiration (ET) 1,892 5%
Commercial or government scheduling service 1,881 5%
Plant moisture sensing device 272 1%
Computer simulation models 212 1%
Total 38,443
Note: The percentage of total does not add to 100% because respondents could choose more than one method.
Source: USDA, Farm and Ranch Irrigation Survey, Table 22, “Methods Used When Deciding When to Irrigated,” 2014
Technology has come a long way in helping irrigators irrigate their land in smarter ways. Producers can invest in soil mapping, install various types of pumping plants and flow meters, use soil sensors, put a VRI system on center pivots, and even tie some of these together through a few software applications. However, none of these tools actually talk effectively or efficiently to each other. Fortunately, there are projects and organizations dedicated to working through this problem, including the Precision Ag Irrigation Leadership (PAIL) project. The PAIL42 project is helping to pull all available information together through an integrated decision support system that makes information available in an easy-to-use format.
The research team interviewed the owner of a data processing and visualization platform that combines multiple data sets from a variety of sources (e.g., water districts, river flows, ground water, water applied, yields) to help organizations and irrigators make smart decisions. This company is currently working with Campbell’s Soup and the UC Davis Center for Energy and Water Efficiency to manage resources more intelligently, visualize data gaps, and provides irrigators with a ranking compared to similar irrigators to drive behavioral change.
To promote the use of data-based agriculture by irrigators for efficiency improvement, BPA could incentivize the types of platforms that PAIL and other companies are creating. There could also be an opportunity for BPA to create a behavior-based incentive 42 For more information, see: http://www.aggateway.org/eConnectivity/Projects/CurrentOngoing/PrecisionAgIrrigationLeadershipPAIL.aspx
Spotlight: PAIL Project The Precision Ag Irrigation Leadership (PAIL) project is working to pull all available information together through an integrated decision support system that makes information available in an easy-to-use format.
Project goal: Enable farmers to improve their profit while decreasing their use of water and energy

2016 Agriculture Irrigation Market Research Report 45
program. BPA could work with food processors (who are collecting data from farmers) to collect a standard set of data such as water applied, yield, and miles driven by on farm tractors. Food processors could provide the data to BPA to use with a data processing and visualization platform. This results of the analyzed data could be provided to food processors and irrigators to encourage behavior changes.
2. Continue to Incentivize Motors, Pumps, and VFDs Dealers and irrigation consultants said that while irrigators are adopting VFDs, there is a lot of room for improvement and continued incentives from BPA could help. The research team agrees for the following reasons: according to the research team’s analysis of the BPA agricultural program data from 2010 to 2015, 36% of program savings were from motors and drives, indicating that irrigators are utilizing this rebate offering. Additionally, interviews with dealers and irrigation consultants revealed that pumps require ongoing maintenance. This indicates a continual need for irrigators to update their pumps. Furthermore, according to FRIS data, there are 63,000 irrigation pumps in the Pacific Northwest.43 These findings indicate that a large number of pumps will need continual maintenance to sustain efficiency and confirms that irrigators are taking advantage of BPA’s incentives for motors and drives. The research team recommends that BPA continue to incentivize the measures for motors, pumps, and VFDs, as they are popular and worth promoting. Additionally, continuing to incentivize these measures could help push the market to installing more measures in some instances and maintain the market savings in other instances.
The research findings show the following:
Utilities have had inquiries from irrigators about VFDs.
A dealer noted, “A VFD and the right pump selection is going to save money, power, and time.”44
Multiple dealers noted that VFDs are high on the list of potential for energy savings. One said, "VFDs would be the number one thing."
A quote from the Market Actor Interview Summary Notes memo (Appendix B) stated, “According to multiple interviewees, there is still a need for utilities to offer pump efficiency tests.”
An irrigation consultant noted that making changes to the sprinkler system allows the irrigator to make changes to the pump also.
Quote from a market actor in 2014 states: “Irrigation measures and VFD installation are the primary areas of focus for agriculture-specific efficiency efforts in the market, and both hold significant additional potential.”
Quote from dealer interviews: “We like to install as many VFDs as we can. Business is really booming in that area.”
Quote from dealer interviews: “I like to see more money come down the pipe from BPA for their VFD replacements. That would get more people out of the woodwork to do it. Right now it’s just not cost-effective.”
43 USDA, Farm and Ranch Irrigation Survey, Table 9, “Irrigation Pumps on Farms, 2013,” 2014. 44 The university expert noted that VFDs do not always save water and power. Rather irrigators like VFDs because they make their lives simpler. They have many secondary benefits like enabling irrigators to start and control pumps remotely with ease.

2016 Agriculture Irrigation Market Research Report 46
Quote from dealer interviews: “The VFD still has a ton of applications to save energy, time, and water. It’s still cost prohibitive, for some of the guys, but once they see it, they’re sold.”
Quote from irrigation consultant interviews: “They are popular. They have been popular. There are quite a few out there, but they haven’t been widely implemented, and the main reason for that is the cost, they’re expensive. Even when we do an evaluation, the payback periods are pretty long because of 5-month irrigation season as opposed to an industrial application where they’re using it all year long.”
Quote from dealer interviews: “A lot of growers aren’t using the VFDs for irrigation.”
It is unclear from the research specifically how much support VFDs need from the program, as the research team received conflicting opinions about VFDs from BPA staff, utility staff, and market actors. BPA and utility staff said that the adoption of VFDs is occurring without incentives. However, dealers and irrigation consultants said that while irrigators are adopting VFDs, there is a lot of room for improvement and increased incentives from BPA could help.
3. Consider a LESA/LEPA Program Based on Study Results Dealers and manufacturers said that only 1%-2% of center pivot sprinkler packages sold in the Pacific Northwest are designed for LESA/LEPA,45 yet the Council’s Seventh Plan assumes 15% of the agricultural cumulative technically achievable savings in 2035 will come from LESA systems.46 Many of the market actors that the research team interviewed were excited about the potential of LESA/LEPA, though others warned about barriers to the technology’s adoption in the Pacific Northwest. The research team recommends that BPA review the results of the current LESA demonstration project47 and determine whether the technology will achieve savings in BPA’s territory to push the market. The research findings show the following:
Quote from an interview included in the Market Actor Interview Summary Notes (Appendix B): LESA/LEPA “holds great savings potential.”
The research team learned at the 2015 Irrigation Show that farmers are not adopting LESA and LEPA technology in the Pacific Northwest even though the technology has been in certain areas of the country for more than 20 years.
Quote from a dealer: “LESA – if these packages do what they claim they’ll do, then there should be some energy savings there.”
Quote from irrigation consultant: “Probably these LESA center pivot sprinkler packages…That will be a big one for water application efficiency and overall operation of the system - water and energy savings if they’re managed right. That’s the big one that will impact us here.”
45 The research team gathered this information from dealers and manufacturers. The Agricultural Market Actor Interview Findings memo (Appendix G) contains more information gleaned from interviews. 46 Northwest Power and Conservation Council, Seventh Northwest Power Plan, Ag_Master.xlsx, https://nwcouncil.app.box.com/v/7thplanconservationdatafiles/1/6722969497. 47 For more information, see: http://pnwpestalert.net/uploads/meetings/Treasure_Valley_Workshop_LESA_14.pdf

2016 Agriculture Irrigation Market Research Report 47
Reservations about LESA/LEPA included the following:
o A university expert said that LESA/LEPA is not universally applicable. In instances where irrigators experience problems with water runoff, LESA/LEPA it is not recommended until the runoff is resolved.
o One sprinkler manufacturer noted that he does not see high applicability of LESA in the Pacific Northwest due to high-value crop needs, soil type, and water availability as explained in the Barriers to LESA/LEPA section above.
o Both a sprinkler manufacturer and an irrigation consultant noted that LESA/LEPA require flat ground, and consider the Pacific Northwest to be “mostly hilly.” However, others note that the Pacific Northwest has millions of acres of land that is flat enough for LESA/LEPA.
o The university expert indicated that the applicability of LESA/LEPA depend on the soil type and slope of the land.
Other Opportunities The research team also looked at a number of lower-priority opportunities to improve the irrigation market.
Consider State Water Policies When Designing the Program The team suggests understanding state water policies and water rights, as they could heavily impact the participation in a water/energy efficiency program.
Align the Program with the USDA’s NRCS and Investor-Owned Utilities BPA customer utility staff suggested aligning the program with NRCS incentives/programs. FRIS data showed that 29% of respondents indicated receiving technical and financial assistance during the past five years for irrigation or drainage improvements from USDA programs for water conservation or environmental improvements.48 Utility staff also suggested a common incentive structure for utilities because the different incentives from each utility are confusing to dealers, irrigation consultants, and others who have a hard time remembering the incentive amounts from various entities.
Consider Hiring More APSs A BPA staff member suggested having more APSs in the field and training the APS group on efficient operations (e.g., SIS)—not just hardware.
48 USDA, Farm and Ranch Irrigation Survey, Table 24, “Technical and Financial Assistance Received During the Past Five Years for Irrigation or Drainage Improvements, 2013,” 2014.

2016 Agriculture Irrigation Market Research Report 48
Focus Specifically on Incentivizing Non-Maintenance Measures Non-maintenance measures include replacing a piece of equipment with a more efficient piece of equipment rather than replacing like-for-like equipment.
Program data showed that 79% of sprinkler-specific measure savings are for maintenance measures and that the program does incent new impact sprinklers replacing leaking impact sprinklers.
The research team suggests considering incenting only certain sprinkler technologies like the Senninger and Nelson sprinklers with dual and triple nozzle clips. These allow irrigators to apply varying amounts of water throughout the growing season. A dealer noted that the big farms saw energy savings with this approach.
Consider Incentivizing Conversion of Center Pivot to Drip Systems Conversion from center pivots to drip systems may be an area of opportunity.
Two agriculture experts at the ETCC Quarterly Meeting noted that a key agriculture emerging technology is drip system use.
A finding addressed in the Irrigation Show Findings memo was that conversion from center pivot to drip line systems could be an area of opportunity.
Quote from center pivot manufacturer: “Sometimes in California there are some places, I don’t know whether you quite get down that far, where the soils are a little tougher to irrigate with a pivot on a lot of the vegetable productions. Some of those guys have taken pivots off and went to drip.”
Consider Additional Measures and Incentive Structures A BPA staff member mentioned considering an incentive to install an hour meter on the irrigation
loads.
A utility staff member suggested including more measures and higher incentives so that farmers would not want to pass up the program. The respondent did not detail which measures and incentives.
The utilities would like to see more farm audits because there is a demand for them.
Interviews with manufacturers, dealers, and irrigation consultants also provided some suggestions on this topic:
o Buy back water and power at competitive rates in order to affect a farmer's decision to pursue the last 10% of savings potential (Ag Extension Service).
o Consider replacement and improvement of the integrity of the mainline pipes (Irrigation Consultant).
o Include conversion away from big guns (Dealer).

2016 Agriculture Irrigation Market Research Report 49
o Demand response initiatives: Incent farmers to reduce energy use during peak times (Ag Extension Service).
Consider Developing Software Tools Interviews with manufacturers, dealers, and irrigation consultants revealed that better software tools for local service providers could help quickly, accurately, and effectively estimating savings opportunities. Many different software applications were mentioned during the interviews including software to estimate water and energy savings (i.e., if you change this part of the system, the water and energy savings would be X) and software to help irrigators know how much water to apply and when to apply the water (e.g., like SIS but more automated).
Consider Indoor Agriculture as an Area of Opportunity One panelist at the ETCC Quarterly Meeting noted that indoor agriculture is a growing sector worldwide. Indoor agriculture in this opportunity includes anything not grown in the open (inside a building); thus, it is broader than just one crop type. He/she thought that indoor agriculture will probably continue to grow, but field agriculture is still important. The research team noted this because indoor agriculture could be an area of opportunity.

Memorandum — Staff Interview Summary A-1
Appendix A: Memorandum — Staff Interview Notes To: Carrie Cobb
From: Nicole Wobus, Jane Pater Salmon
Date: October 13, 2014
Subject: Agriculture Market Characterization: Staff Interview Notes
The information contained in this memo is a compilation of notes from interviews. These are not definitive statements; rather, the notes reflect what Navigant heard from respondents. It may be that the notes were only said by one person interviewed. The notes should be interpreted within the broader context of the study. This memo is a modified version of the memo submitted to BPA on October 13, 2014.
Introduction Navigant conducted interviews with staff of BPA and NEEA in an effort to gain insights to inform the direction of Navigant’s market characterization research for BPA’s agriculture sector program. Questioning focused on the following four topics:
Current program objectives and activities
Opportunities to improve existing programs
Potential priority markets for future programming
Key questions and research priorities
Navigant also gathered information on key market actors, utility context, and existing data sources. This memo provides a high level summary.
Summary SIS accounts for a large portion of agriculture program savings and if the measure were to no
longer be offered the agriculture program would have difficulty meeting its targets.
One contact indicated that program targets, handed down through the Northwest Power and Conservation Council, may overestimate the potential for hardware measures because baseline

Memorandum — Staff Interview Summary A-2
efficiency naturally improves through periodic equipment replacements that are commonplace among farmers.
SIS is well known in the Mid-Columbia area because county agriculture officers, equipment dealers, USDA and universities are all right there- in the tri-cities Washington area. The mid-Columbia region is the only area where it’s been actively marketed by BPA utilities and much potential remains. According to one respondent, significant potential exists for SIS in rural parts of Idaho, where farmers are just starting to discuss SIS. This respondent said that all potato farmers in developed regions of southern Idaho do SIS regardless of incentives. However, there are still many rural farmers in isolated valleys of Idaho and Montana where farmers are unaware of SIS, and have no access to SIS providers.
Multiple respondents favor the Ag Program Specialist (APS) outreach model the program has adopted and believe more could be done to build on the success of this model.
Four respondents indicated that trade ally networks are not well developed. Two said market activity is very ad hoc and based on existing relationships, and there’s no formal system or network.
There appears to be a limited number (8-10) irrigation companies that account for the majority of the irrigation market share in the Northwest.
BPA should explore opportunities to leverage existing relationships and networks to expand the reach of the agriculture program in a more strategic way. However, earlier efforts to leverage Resource Conservation and Development Council (RC&Ds) as a channel to build agriculture program activity failed, and any future efforts to re-establish a relationship should wait until after any new agriculture program structures are ramped up and well established.
BPA should explore opportunities to coordinate trade allies, drawing on strong example set by BPA’s work with lighting trade allies.
Trade allies get frustrated by the fact that different BPA utilities offer different incentives. This makes it challenging for trade allies to assess market opportunities and manage paperwork across clients.
Vendors can inhibit SIS usage by refusing to install energy efficiency devices out of fear it will result in under-watering and cause crop losses. Educating vendors is key, along with demonstrating benefits of SIS over time.
Low Energy Precision Application (LEPA)/Low Elevation Spray Application (LESA) hold great savings potential.
Two respondents suggested that high value crops (e.g., potatoes and sweet corn) are the most likely candidates for program participation because they’re most likely to be interested in investing in sophisticated irrigation management strategies. However, one respondent indicated that high value crops are more likely to use gravity irrigation systems to avoid the risk of under-watering.
One respondent said Idaho is seeing a big shift from potato to corn growing due to changes in Americans’ dietary preferences. A lot of dairies have moved from California to Idaho because of

Memorandum — Staff Interview Summary A-3
the strict California environmental regulations, and this increased the demand for corn feed. Corn is more water intensive than potatoes due to its longer growing season.
ID is seeing a shift towards pressure systems/center pivot because it less labor intensive than gravity systems, and due to EPA rulings about runoff. [Gravity systems over water and lead to contaminated runoff, so heavily regulated by EPA.]

Memorandum — Market Actor Interview Notes B-1
Appendix B: Memorandum — Market Actor Interview Notes To: Carrie Cobb, Bonneville Power Administration (BPA)
From: Kirsten Midura, Gabriela Gaitan, Nicole Wobus, and Jane Pater Salmon, Navigant Consulting, Inc. (Navigant)
Date: January 7, 2015
Subject: Market Actor Interview Notes
The information contained in this memo is a compilation of notes from interviews. These are not definitive statements; rather, the notes reflect what Navigant heard from respondents. It may be that the notes were only said by one person interviewed. The notes should be interpreted within the broader context of the study.
Introduction This memo provides notes summarizing preliminary findings from interviews conducted as part of a market characterization study of the agriculture sector in the Northwest. BPA can use these findings to complement those from Navigant’s analysis of the U.S. Department of Agriculture (USDA). The findings from both efforts help to inform the identification of areas that warrant further consideration for BPA’s agriculture program planning.
The document is structured as follows:
Summary
o The summary provides an overview of who was interviewed and presents five key conclusions and recommendations for BPA to consider.
Key Findings
o This section summarizes market actors’ perspectives on the utility programs available in the Northwest. It reviews the role of the programs in the market, highlighting programs cited for their success, identifies market barriers, and includes interviewees’ suggestions for programmatic changes.
Irrigation System Types in Use

Memorandum — Market Actor Interview Notes B-2
o Irrigation system type plays an important role in defining efficiency opportunities. This section summarizes the prevalence of gravity versus pressurized systems in the region as a whole, as well as in certain sub-regions. It also includes discussion of the characteristics of pressurized systems in use in the region.
SIS Activity
o This section summarizes current baseline usage, the most common users, factors affecting scientific irrigation scheduling (SIS) use, as well as remaining potential for SIS use.
Irrigation Hardware Upgrade Activity
o This section summarizes current baseline usage, as well as opportunities for additional savings.
Variable Frequency Drive Activity
o This section summarizes current baseline usage and the most common users and factors affecting variable frequency drive (VFD) use, as well as remaining potential for VFDs for irrigation pumping.
Other Energy Efficiency Measures Activity
o This section summarizes market activity in the areas of dairy improvements, pump and motor upgrades, and irrigation controls. This section is limited in this preliminary interview findings memo, as the 16 interviews summarized here focused primarily on irrigation-related efficiency activity.
Areas with Greatest Remaining Potential
o This section provides an overview of the areas of remaining opportunity for savings identified by interviewees.
Market Structure
o This section summarizes the organization of the market for irrigation efficiency measures, and for VFDs. It also summarizes existing and potential channels for delivery of energy efficiency messaging to the market.
Market Trends
o This section provides an overview of market developments highlighted by interviewees.
Summary During the months of October through December Navigant interviewed 27 market actors. An initial set of 16 primarily irrigation-focused interviews was summarized in a memo delivered on December 9, 2014. This memo provides updated notes including content from an additional 11 interviews. The more recent interviewees’ experience spans a broader scope than irrigation, including efficiency work in agriculture facilities, and market actors who run programs that fund efficiency work.

Memorandum — Market Actor Interview Notes B-3
As shown in Table B-1, six interviewees were agriculture facility service providers (i.e., providing service at agriculture facilities as opposed to focusing solely on irrigation), two interviewees were agriculture researchers with expertise in irrigation, six interviewees were irrigation focused consultants and technical service providers, three interviewees were manufacturers of irrigation equipment, five interviewees were university-affiliated agriculture extension service experts or state agriculture office representatives, and five were other market actors (e.g., representatives of federal and state programs that fund agriculture-related efficiency improvements). Several interviewees work on a national level and specialize in the Pacific Northwest. Interviewees’ expertise spans a range of crops, and several interviewees have on the order of two decades of experience working in agriculture.
Table B-1: Summary of Interviewees
Interviewee Type Count
Agriculture facility service providers 6
Agriculture researcher 2
Irrigation focused consultants and technical service providers
6
Manufacturers of irrigation equipment 3
University, agriculture extension service, and state agriculture office representatives
5
Other market actors 5
Total 27
Source: Navigant interviews, 2014
Key findings and recommendations for BPA to consider based on Navigant’s analysis of market actor interviews conducted through November 21 include the following:
1. Conclusion: Irrigation measures and VFD installation are the primary areas of focus for agriculture-specific efficiency efforts in the market, and both hold significant additional potential. Great potential for additional irrigation efficiency still exists, and significant barriers stand in the way of many farmers’ investments in efficiency. Recommendation: Continued support for SIS and other irrigation efficiency measures, as well as VFDs, appears to be warranted. This will address the apparent market need for support to expand the reach of efficient practices. The market will also likely benefit from consistency in incentives over time, as it will enable farmers to minimize the areas of risk in their long-term investment planning.
2. Conclusion: Many farmers and some dealers lack knowledge and awareness of irrigation efficiency strategies and benefits. Recommendation: Expanded education and outreach efforts would help close the knowledge gap and spur earlier adoption of efficiency measures. Specifically, it appears that BPA’s agriculture market actors would benefit from demonstrations of the savings potential from irrigation efficiency measures, and effective communication of those findings. This expanded activity could

Memorandum — Market Actor Interview Notes B-4
also include cross-marketing with other efficiency measure opportunities.
3. Conclusion: Technological advancements expand the scope of irrigation efficiency opportunities. Some advancements have made further strides than others:
o The ability to remotely monitor and control irrigation equipment operation using smart phones has achieved reasonable costs and substantial adoption.
o Variable rate irrigation (VRI) and Low Energy Precision Application (LEPA) are gaining traction but are still used by a minority of growers.
Recommendation: BPA will benefit from continuing to monitor technological advancements. This will help identify opportunities with strong potential for savings that need additional support in order to see rapid growth in adoption.
4. Conclusion: The value proposition for investment in scientific irrigation scheduling (SIS) is currently not strong enough except in the case of the highest value crops. However, significant potential for additional savings exists in lower value crops. Vineyards do not appear to warrant targeted attention from BPA; they have relatively low water requirements and tend to practice efficiency strategies already. Recommendation: BPA may consider taking action to increase incentives to use irrigation efficiency strategies among those growers that are less commonly focused on efficiency (e.g., grain and other lower value crop growers). Innovative incentive strategies, like buying back water and energy from farmers at competitive rates, may be worthy of consideration.
5. Conclusion: Water scarcity will play an increasing role in driving irrigation efficiency. Recommendation: BPA would benefit from periodically monitoring the project economics associated with irrigation efficiency measures to inform the ongoing refinement and revision of incentive amounts.
6. Lighting, HVAC and controls-related measures hold the greatest potential for savings in agriculture facilities. Pump and motor-related improvements hold significant potential for irrigation applications.
Recommendation: BPA could support market growth in efficiency with agriculture facilities by:
o Staying current on and communicating findings from ongoing industry research related to use of high efficiency lighting for agricultural applications;
o Considering adding or increasing its emphasis on controls-related measures such as fast-acting doors in cold storage facilities, and refrigeration controls.
o Working with member utilities to explore opportunities to increase uptake of HVAC-related measures in agriculture facilities.
o Continuing to support pump testing, and exploring opportunities to replace existing pumps with those that are sized properly for the application.

Memorandum — Market Actor Interview Notes B-5
Key Findings The remainder of this memo summarizes key findings from the interviews. An explanation of the content included in each section is provided in the introduction.
Utility Program Perspectives This section summarizes market actors’ perspectives on the utility programs available in the Northwest. It reviews the role of the programs in the market, highlighting programs cited for their success, identifies market barriers, and includes interviewees’ suggestions for programmatic changes.
Role of Programs in the Market
The SIS program is very important for BPA, growers, and utilities.
Hardware incentives play an important role in expediting the replacement of old, inefficient or poorly operating equipment with new, and more efficient equipment. In the absence of incentives, growers often wait until their system fails to replace equipment.
There is a perception by some that BPA’s incentive offerings and involvement in the market fluctuate.
One irrigation consultant notes that he stays current on BPA offerings because it helps him help his customers (i.e., it enables him to offer greater value to his customers).
According to one USDA-certified technical service provider, Natural Resource Conservation Service (NRCS) has historically offered the most substantial incentives, and significant benefits would come from being able to leverage both NRCS and incentives from the utilities.
An equipment manufacturer highlighted the important role of BPA in the market, noting, “BPA programs have had more impact than any single factor on bringing energy efficiency to the Northwest.” He explained that the program plays a critical role in educating farmers and demonstrating efficiency measures’ benefits. Many farmers are not likely to invest in measures on their own without incentives. However, once they see evidence of the savings, they are more willing to invest in the future with or without incentives.
Program Strengths and Model Utility Programs
Multiple interviewees cited the Energy Trust of Oregon for offering an effective agriculture program.
o According to an irrigation consultant, the Energy Trust does well at marketing and administering SIS incentives. One consultant reported farmers approaching him with an interest in SIS as a result of ETO’s outreach.
o The Energy Trust offers the same irrigation incentives as BPA given the goal of regional consistency.
o A unique feature of the Energy Trust’s programs is the organization’s emphasis on building vendor networks and stronger awareness for existing program resources.

Memorandum — Market Actor Interview Notes B-6
o One interviewee with varied experience in the market identified the Energy Trust’s custom program as more effective than Bonneville’s offerings. The interviewee prefers the Energy Trust’s policy of paying the incentive upfront.
One interviewee with extensive program experience that spans the country highlighted NYSERDA’s (New York) agriculture program as a model for success due to its ability to issue RFPs and effectively incent the activity it seeks to support.
An interviewee identified NEEA’s PAIL project as a model for bringing together key parties to leverage effective use of irrigation management software. The software monitors irrigation needs in order to facilitate more targeted, efficient irrigation practices.
One interviewee touted California for offering demand response opportunities to growers.
Market Barriers Warranting Program Attention
Many farmers and some dealers lack knowledge and awareness of irrigation efficiency strategies and benefits.
o There are limited sources of unbiased information in the market. Dealers are a source for SIS information, but the customer knows they are trying to sell something.
o One interviewee commented that BPA plays a big role in educating farmers. However, they may use SIS for a while and then abandon it.
o A lot of dealers do not have expertise in SIS and do not do a good job instructing farmers. There is so much brand loyalty that if a dealer does not know what they are doing, their customers will be unaware of efficiency opportunities.
o It is difficult to convince farmers of the benefits of efficiency improvements without them actually seeing the results themselves on their own farm or that of their peers.
The risk of under-watering is so great that some growers (e.g., some potato growers) are not willing to face the liability of potentially damaging their crop due to insufficient irrigation.
The cost of using SIS and upgrading to newer, more efficient hardware is significant. Given current incentives, the value proposition is not considered favorable enough to warrant investment in many cases. Incentives need to be high enough to make investment compelling. The fact that SIS use is low in Idaho and Montana is indicative of other forces (cost, lack of knowledge on SIS); not lack of SIS service availability.
Lenders may be a barrier. Farmers’ budgets are on the margin; an incentive of $6/acre matters to farmers operating at the margin. Lenders are looking for ways to cut growers’ expenses.
This is an indication that incentives can be the make-or-break factor that leads to use of SIS.
Lack of farmers’ time and interest are key barriers according to an agriculture extension office expert.

Memorandum — Market Actor Interview Notes B-7
Policies are a secondary barrier.
o In Idaho, due to water spreading policy there is little incentive to use efficient irrigation strategies aside from increasing yield. Rather, farmers seek to save water in one location so they can use it in another. As a result, savings are ultimately null. Conserving water for the purpose of using it in another location (i.e., through water spreading) appears to be a greater driver for efficiency than the benefit of lowering overall energy costs.
In Washington and Oregon, water spreading is prohibited and carefully monitored. As a result SIS water savings can accrue.
o In Oregon, a “use it or lose it” water rights policy (i.e., water rights are based on historic usage conditions, and continued demonstration of use over time) is a disincentive for conservation.
o There is a high volume of absentee ownership on agricultural land in the Columbia River Basin, and absentee owners are not attentive to irrigation efficiency. The absentee issue stems from the fact that the U.S. Army Corps of Engineers’ Water Development Project developed the land and, according to rules still in place, no one person can own more than 640 acres. Many odd ownership and lease arrangements have been used, resulting in significant absentee ownership.
o Farmers leasing the land from Native American tribes have limited incentive to invest in new equipment; contracts stipulate that they cannot take any equipment off the reservation when their lease ends.
Electricity and water costs are low relative to other operating expenses. This further challenges the economic merits of investing in irrigation efficiency.
Scheduling services are considered crude by some, and it is difficult to attribute savings to scheduling. Some cite low precision in the data provided to growers. Another interviewee highlighted that it is inherently difficult to pinpoint the source of savings since so many factors change in any given year (e.g., weather, crops grown)
The effects of LEDs on the growth of crops and livestock is not fully understood. Early research indicates that there are both positive and negative attributes associated with LEDs. However, until the effects are better known some greenhouse and dairy owners may limit use of LEDs.
When SIS is self-implemented (as is often the case at large farming operations), there have been many failures due to improper implementation.
One interviewee argued that utility programs lack sufficient technical rigor, and that the incentive structure of some programs (i.e., those based on installed costs rather than energy savings) distort the market.

Memorandum — Market Actor Interview Notes B-8
Interviewee Suggestions for BPA and Utility Programs
Crop-specific recommendations:
o One interviewee commented that there is a lower risk of under-irrigation with corn, alfalfa, and wheat than with other crops. Therefore, farmers will be less likely to be concerned about damaging the crop due to under-watering. These high-acreage, lower value crops offer significant potential for savings.
o Another commented that peas, wheat, and rotational crops are good candidates for SIS.
According to an agriculture extension office expert, BPA would need to use strategies like buying back water and power at competitive rates in order to affect a farmer’s decision to pursue the last 10% of savings potential available. There is a great opportunity in convincing farmers to push to save that last 10% over and above the efficiency steps they are already taking. The marginal savings for conserving the last 10% is not worth the effort for farmers, but in aggregate it would make a big difference for BPA.
o In California, Pacific Gas and Electric Company (PG&E) incentivizes farmers for reducing energy use during peak times. It is easy for growers to adjust around those peak times. The Northwest Energy Efficiency Alliance’s program showed that hardware incentives do not work as well.
If BPA makes program changes to target support for new crops, continued support for those already doing SIS is still warranted. If program incentives go away for crops already using SIS, usage will decrease. An effective goal would be to increase overall acres using SIS.
o “If you take away SIS incentives for potatoes and only give them for alfalfa, you’ll have lots of farmers stop using it on their potatoes and just switch SIS use to the alfalfa field, so then you haven’t accomplished expanding SIS, you’ve just shuffled it around.”
Program consistency is critical. BPA and the utilities need to have consistent incentives that are always there and can be factored into a farmer’s planning cycle.
One technical service provider suggests that BPA staff the program with a handful of experienced engineers fully dedicated to the program who can hand-hold projects from start to finish. He identified this as a more effective model than the current approach; trying to stimulate the market with a larger volume staff spending just a small portion of their time supporting the program.
BPA would benefit from improving and expanding upon its education and outreach efforts.
o For program outreach, irrigation consultants offer an ideal channel for information sharing, and will likely be more effective than going through manufacturers directly. The irrigation manufacturers are focused on the worldwide market.
o A lot of good research has been done, and the findings need to be better communicated.
o Non-energy benefits (e.g., increased crop yield, reduced maintenance and replacement costs) are significant for both irrigation and VFDs and are likely more compelling drivers

Memorandum — Market Actor Interview Notes B-9
than energy savings. BPA could benefit from better communicating information about non-energy benefits of agriculture efficiency measures.
o Farmers need to learn more about how efficient new irrigation equipment has become and the importance on not overwatering. Many farmers do not understand that optimal irrigation and uniform water distribution results in better quality crops and higher yields.
The message needs to be “Save energy, save water and grow better crops.”
o Consider emulating the ETO’s market efforts, which one consultant reported as effective in getting farmers to proactively seek out SIS services.
o Educating crop consultants (those who don’t focus specifically on irrigation but on the full spectrum of farm services) would help them understand what they could be offering their customers.
o There is a need to train dealers as they are not all as knowledgeable as they could be about efficiency opportunities.
o One expert noted that BPA currently attends several trade shows but would have a greater impact if their staff were present both at booths and walking around. They will reach a bigger audience that way.
One technical service provider indicated that local service providers could benefit from better software tools to quickly, accurately and effectively estimate savings opportunities.
BPA could achieve better alignment between its incentive administration cycle and the farmers’ growing season and planning cycle. One respondent commented that BPA’s calendar runs roughly November through October. As a result, BPA often pumps money into the system too late. It is hard for utilities to put together a program that works for growers due to the need to work around BPA’s schedule for reporting and issuing funding. Utilities sometimes do not receive funding until March, at which time it is too late to affect the decision to use during that growing season. Many growers develop their budgets a year ahead, and will have difficulty incorporating SIS if the opportunity does not arise until the launch of the growing season.
Ensure that the application and reporting processes remain as streamlined as possible, and look for opportunities for continued improvements in this area. One respondent reported the current processes are not too bad, but at times in the past they have been cumbersome and difficult to navigate.
Coordination between BPA and NRCS would be ideal, as interviewees noted that the incentives offered by both programs are complementary. Messaging the programs together may help enhance the impact of both organizations’ efforts.
Multiple respondents noted the importance of pilot demonstrations of savings potential. This is particularly important among growers as they tend to adopt practices they see working well for their peers. One consultant thinks BPA needs to engage in a large-scale savings demonstration effort. Demonstrating the savings potential directly to the farmers would generate interest.
Additional efficiency measures warranting attention:

Memorandum — Market Actor Interview Notes B-10
o Fast acting doors in large cold storage facilities (i.e., replacing plastic strips with solid doors that rapidly open and close using advanced controls) show great promise and growth in the Energy Trust’s program, as do refrigeration controls.
o Consider offering incentives to replace and maintain mainline pipes. BPA was involved in mortar lining and main line replacement 10-15 years ago. Now is a good time to revisit that because the pipe equipment is once again aging. However, those improvements would be costly and will deplete budgets quickly.
o According to multiple interviewees, there is still a need for utilities to offer pump efficiency tests.
Demand response initiatives (e.g., buying out growers for their energy during peak times) may drive irrigation efficiency advancements. This strategy has been used successfully by PG&E in California.
Two interviewees noted benefits of limiting the number of years a grower can obtain SIS incentives to three years. This provides growers with time to gain experience with SIS while encouraging them to become more self-sufficient and to take steps to facilitate permanent adoption of the measure. The Energy Trust maintains a three year limit on SIS incentives.
The dairy industry’s commitment to reduce greenhouse gas emissions by 25% by 2020 may warrant some targeted attention for dairy facilities.
According to an NRCS Technical Service Provider (TSP), the agriculture sector lags the broader commercial and industrial sector in its identification of and preparedness to address efficiency opportunities. The interviewee also notes that farms require a more holistic, “systems thinking” approach than does efficiency in other sectors. The interviewee stated,
o “Farms need to be treated as a production facility. Only offering a one-for-one replacement limits what growers/producers can do. [Programs] need to be sure to include options for new expansion/growth, and focus on the ability to increase production. Production is king, and energy use is fairly far down the list of [cost/priorities] for growers. Take a step back and look at it on the systems level.”
Irrigation System Types in Use Irrigation system type plays an important role in defining efficiency opportunities. This section summarizes the prevalence of gravity versus pressurized systems, in the region as a whole, as well as in certain subregions. It also includes discussion of the characteristics of pressurized systems in use in the region.
Gravity vs. Pressurized
Pressurized irrigation systems are the norm in most parts of the Northwest among farms operated as businesses. Most interviewees estimated that pressurized systems account for 90 to 99% of irrigated acreage in the Northwest.

Memorandum — Market Actor Interview Notes B-11
o One irrigation researcher noted, “Everyone who can afford a sprinkler has one. That is the direction this is going.” This reflects a significant and gradual shift since 1995 (about 2% per year) when the majority of irrigation was gravity.
o A manufacturer explained, “Among those farming for a living, from which 80-90% of our food comes from, all are pressurized.”
o Potato growers need to have a pressurized system in order to secure a sales contract.
Growers typically only switch from one system type to another when land ownership changes hands, or when an incentive is available (e.g., from NRCS).
Farmers are moving away from gravity systems because:
o Pressurized systems are more efficient.
o Crop quality and yield improves with pressurized irrigation due to improved uniformity of water distribution.
o The labor involved in maintaining gravity irrigation systems is high.
o Gravity has a big problem with runoff and chemicals.
o In most fields that have been recently developed, the water source is subsurface rather than a lake or other surface source. When you are already paying to pump from deep wells, it is going to be already pressurized, so it makes sense to put it into a pressurized sprinkler system.
Gravity systems are most common in:
o Idaho
A university extension office rep explained that in southern Idaho, gravity systems account for 15-20% of irrigated acres, and pressured system about 80-90%. In western Idaho, gravity systems account for about 30% of irrigated acres.
A research agronomist commented that Idaho used to be 100% gravity irrigation and that it has gradually transitioned to pressurized. Now only approximately 10% of Idaho’s irrigated acres are gravity, and that number will continue to shrink. In niche areas, such as Treasure Valley, gravity still accounts for about 40-50% of irrigated acres.
o On the east side of the Cascades, according to a state agriculture department representative.
o On Native American reservations, according to a university representative. Misalignment of incentives (i.e., farmers lease land from Native Americans and cannot retrieve equipment placed on land) limit the farmer’s benefits from investing in an advanced system.
o “Older” acreage. Land suitable for flood irrigation would have been developed long ago.

Memorandum — Market Actor Interview Notes B-12
o On hobby farms. For farms in the 10- to 20-acre range that are not sustaining a livelihood, it is too expensive to justify conversion to a pressurized system.
Characteristics of Pressurized Systems Used
Gradations of efficiency in available equipment/system design:
o According to an agriculture extension office expert, drip systems and micro-sprinklers have the highest efficiency, and pivots are a close second. Hand and wheel are the least efficient.
o Multiple interviewees noted that some pivot system designs are much better than others in terms of efficiency (e.g., in how they address issues of potential wind to avoid losing 20% of water from wind-driven mist). In some cases, a pivot system’s sprinkler heads can be spaced too far apart, resulting in poor uniformity of water distribution.
o For the actual equipment itself, there are only marginal differences across products.
Orchards or vineyards will put in a permanent stationary system: “solid set” or drip. Row crops typically use pivot, but could temporarily use a drip system at times, for onion or melon.
o Drip systems are only used for specialty crops: onions (to keep from getting water on foliage), orchards, grapes, and permanent crops.
o Drip systems only account to one-half to 1% of irrigated acres in the Northwest.
Linear systems are only chosen in case of flat ground that is rectangular or square. If the boundaries of a field are non-uniform or curvy, you will see pivots.
People move from hand lines to pivot because center pivots are simpler and easier to operate, and they get more out of their limited water rights as a result of improved efficiency.
o According to a research agronomist, “The direction of everything has been pivot. There have been a lot of hand lines taken out and pivots put in.”
Some pivot designs are better than others.
o Specifically, some designs are better suited to windy areas, which can be a significant issue in some areas (e.g., Tri-cities and Hermiston). In windy areas, you can lose 20% of your water due to mist from some nozzles. It is important to get nozzles appropriate to wind conditions at the site.
Pivot systems usually last around 20 years, but farmers often hope to get around 30 years out of a system. The pipeline can also last up to 30 years.
Some growers will space out their sprinklers on a pivot farther than they should (in order to use fewer sprinklers to cut costs)
o An ”inexpensive package” is one that has too few sprinkler heads. This reduces the uniformity of the irrigation and reduces the efficiency of the system.

Memorandum — Market Actor Interview Notes B-13
SIS Activity This section summarizes current baseline usage and the most common users and factors affecting SIS use, as well as remaining potential for SIS use.
Current Baseline Usage of SIS
Baseline usage estimates fall in the 5 to 20% range for the region as a whole.
According to an agriculture extension office representative, only approximately 12% of the farms are using a meaningful SIS services.
An irrigation consultant estimates SIS usage at approximately 10% of irrigated acres, even in the Columbia River Basin.
According to one expert, among potato growers, greater than 50% of irrigated acres use SIS. Among less valuable crops, SIS use is closer to 20%.
According to a sprinkler manufacturer, only 1-2% of growers are using SIS on their own. All the rest need help. Farmers need significant hand-holding to pursue an investment in SIS.
Most Common Users and Factors Affecting Use of SIS
More valuable crops (e.g., potatoes, carrots, onions, orchards, vineyards, and beets) are the most common users of SIS. These crops carry high penalties for overwatering, as it results in reduced yield and crop quality.
As noted, potato farmers have done the best so far; small grains and alfalfa are seeing an increase in usage. Onions will not use SIS because the approach involves using neutron probes, which are useless for the shallow root zone of onions.
According to one expert, SIS use is high among orchards and vineyards.
There is no correlation between size of operation and SIS use, according to two irrigation consultants. Many big farmers who have the money are already utilizing SIS and sophisticated moisture monitoring to calibrate irrigation. However, many smaller farmers are using it as well.
Very large growers manage their SIS in-house rather than contract out. However, there have been many failed efforts because it is outside their scope of knowledge.
Crop value and farmer population are correlated with the level of SIS usage in a particular state.
Level of education affects SIS use.
Remaining Potential for SIS Use
According to an irrigation consultant, SIS use is still in its infancy, even among sophisticated farmers. While a lot of farmers have used some SIS, still only a small percentage of total irrigated acres currently use SIS.

Memorandum — Market Actor Interview Notes B-14
o Potato farmers are among the growers who make the best use of technology and data for managing their growing, but a large remaining market opportunity exists, even among potato growers.
Moisture monitoring anywhere in the basin or areas with automated systems is said to have a big potential.
Farmers often do not pay attention to the irrigation of lower value crops. Farmers tend to overwater them so there is a significant potential for savings.
o One irrigation consultant noted that they can bring SIS to most growers for under $10/acre, which is even affordable for land used for grazing cattle.
According to a sprinkler manufacturer, historical pastures (small grains and hay) present a strong opportunity for the program to have an impact. Multiple interviewees noted that incentives would help improve the economic favorability of using SIS on a broader range of crop types.
Farmers in less concentrated areas may lack knowledge and access to SIS services. Potential exists at farms that are located outside of the more concentrated areas of farming activity. One consultant noted that he tends to focus work on concentrated areas of farming to minimize travel costs.
According to an irrigation consultant, potential exists among small farmers if greater incentives were available. For small producers, the $5-10 thousand dollar investment would mean pulling that money from some other part of the business. So even though it is a relatively small investment, they don't prioritize it over other potential uses of their funds.
Idaho is the hardest place to stimulate interest in SIS. The greatest interest in SIS has been observed in Oregon’s fruit industry, and second, Washington’s fruit market. Past efforts to recruit farmers for SIS use in Idaho have failed.
There is potential to leverage and highlight the reduced runoff/nitrate issues associated with SIS use. Two interviewees referenced U.S. Environmental Protection Agency-funded pollution prevention research in the early–mid- 2000s that highlighted SIS as a potential strategy for mitigating nitrate issues.
Potential for SIS use in Lincoln County is great. It is a well-irrigated area that is very costly ($200-$300/acre) to irrigate, making the potential for savings very attractive to growers.
According to an irrigation consultant, significant potential for SIS use exists in Yakima. Water is plentiful and cheap, so water savings is not the motivation. Rather, fruit quality and yield attract growers to SIS.
Willamette Valley holds potential because there is so much irrigation occurring there, and a lot of it is wheel line, an outdated technology. However, water costs are relatively low there.
o Orchards and vineyards have a large presence in the Willamette Valley. Orchards are moving to drop systems, but are nearly all converted.

Memorandum — Market Actor Interview Notes B-15
o Vineyards may not offer much savings potential as they do not use as much water as many other crop types.
Klamath Basin and Jefferson County are a little further ahead of the Willamette Valley, but not as advanced as Umatilla.
Farmers may need additional assistance when switching to new crops; what they know about their current SIS system may not transfer to new conditions.
Irrigation Hardware Upgrade Activity This section summarizes current baseline usage, as well as opportunities for additional savings.
Current Baseline Usage of Efficient Hardware
According to one interviewee, about 40% of farmers’ sprinkler packages are up to date with the latest, most efficient equipment. Another estimated that one-quarter of farmers are using up-to- date sprinkler equipment.
Even the worst sprinkler packages available today are approximately 85% efficient. Therefore, just replacing sprinkler equipment will make a system more efficient (the extent of improvement depending on the level of efficiency of the equipment being replaced).
Hardware upgrades occurring through BPA programs are mostly for center pivot applications and some for high-pressure wheel lines.
Opportunities for Additional Savings from Hardware Improvements
According to several interviewees, growers often wait too long to replace equipment and are surprised to learn of the significant potential savings associated with the relatively low-cost replacement of sprinkler equipment.
o Too many wait until something fails to make a replacement. According to an agriculture engineer, many growers’ mentality is, “If there’s water coming out, the system must be working fine.”
o Potato farmers are more proactive than others about replacing equipment.
Replacement timeframes:
o Growers may work on sprinkler parts and regulators every five to seven years.
o Some growers will push the use of their drip irrigation system for longer than they should due to the expense of replacement. Therefore, equipment remains in use when it is not operating at optimal efficiency.
o According to a few interviews, growers typically replace their sprinkler package once every ten years. Sprinkler package replacement cycles can range from seven to fifteen years. Lots of farmers lack a maintenance program and will just wait until they need to replace the entire system. Utility program participants are more knowledgeable about the benefits of sprinkler system replacement and will replace equipment every six years.

Memorandum — Market Actor Interview Notes B-16
o One interviewee notes that lower value crops may wait longer to replace parts than higher value crops.
o Center pivot equipment lasts 20 to 30 years.
o Pumps undergo continuous maintenance and get replaced every four or five years.
o According to a sprinkler manufacturer, the cash value of crops correlates with how long growers will wait to replace equipment, as the decision is driven by return on investment. In Washington and Oregon, when growers see a 3% drop in pressure or flow they’ll replace their equipment. In Idaho, growers wait until the observed fluctuation is 6% (in western Idaho) or 9% (in eastern Idaho).
o The equipment’s estimated life of 10,000 hours equates to about five years in the lower Columbia Basin. The climate is relatively hot and arid with a long growing season. The 10,000 hours lifetime rating equates to about ten years for areas like Spokane and Odessa.
o Equipment will last longer in areas where water is less corrosive.
A low-tech opportunity is to focus on right-sizing pump/pipe size combinations. In the past, farmers would want to shrink the size of their pipe and use a bigger pump to force it through to save money. Now many growers have discovered energy savings results from using a bigger pipe and smaller pump.
Newer sprinkler systems are designed to run at lower pressures, so these systems are not compatible with some of the older pivot equipment. Older machines did not have as many outlets on the stand. As a result, upgrading to more efficient sprinkler equipment could require some growers to replace their entire pivot system.
There is a threshold level below which a decrease in pressure becomes counterproductive. A decrease below common/historic higher pressures will increase yield up to a point, but going for the lowest pressure is not always best. In discussions of irrigation efficiency there is too much emphasis on pressure and not enough on maintaining uniformity. Energy is only one factor to consider; you cannot be so aggressive with efficiency that you compromise crop yield.
Conversion away from "big end guns" holds significant potential.
Variable Frequency Drive Activity This section summarizes current baseline usage and the most common users and factors affecting VFD use, as well as remaining potential for VFDs for irrigation pumping.
Current Baseline Usage of VFDs
Use of VFDs in deep well areas is picking up, and is currently at about 20% of its potential.
Use of VFDs in agriculture is already fairly significant. An agriculture extension office contact estimates that about one-third to one-half of farmers are using VFDs. In contrast, a pivot manufacturer estimates that only 5 to 10% of the potential VFD market has been tapped. A

Memorandum — Market Actor Interview Notes B-17
sprinkler manufacturer and a technical service provider estimate that 15–20% of VFD potential savings is tapped.
Most Common Users, and Factors Affecting Use of VFDs
VFDs are best used in areas with deep well turbines. According to an irrigation consultant, the Columbia Basin is not an ideal area for VFD use because it relies on surface water sources (as opposed to deep well) and centrifugal pumps do not benefit much from use of VFDs. Another interviewee noted that opportunities exist to use VFDs in broader applications than are common today.
Remaining Potential for VFD Use
Growers are tuned into the importance of electricity savings and are often surprised when they find out how much savings a VFD provide.
Multiple experts spoke about the remaining untapped potential of using VFDs, specifically in deep well areas with turbine pumps.
As noted previously, farmers typically oversize turbine well pumps because they do not want to replace the pumps if the water table drops. Given these circumstances, VFDs have a significant opportunity on well pumps.
One interviewee noted that VFDs are typically only used on turbine pumps (not centrifugal), but that VFDs hold significant potential for use on centrifugal pumps. The interviewee anticipates much broader use of VFDs on pumps would occur in the agriculture sector if programs supported installation of VFDs on centrifugal pumps.
Other Energy Efficiency Measures Activity This section summarizes market activity in the areas of dairy improvements, pump and motor upgrades, and irrigation controls. This section is limited in this preliminary interview findings memo, as the 16 interviews summarized here focused primarily on irrigation-related efficiency activity.
Energy Efficiency Activity at Dairies
According to an agriculture engineer, nearly every dairy already uses a flat-plate cooler. A heat exchanger pre-cools the milk using well water. The preheated well water is then used for wash down.
Navigant heard varying perspectives on the potential for savings in the dairy sector.
o According to two interviewees, not much energy efficiency activity is underway in the dairy sector. One attributed this to energy’s relatively small impact relative to other costs facing dairies.
o In contrast, according to two other interviewees, dairies have the greatest opportunity for energy efficiency within agriculture facilities because of their cooling loads and refrigeration needs.

Memorandum — Market Actor Interview Notes B-18
o Two interviewees estimated that only about 10% of energy saving potential has been tapped at dairy facilities in the Northwest.
o Energy saving measure opportunities at dairies include lighting, flat plate coolers, heat recovery systems, improvements in refrigeration controls, and heat pump water heaters. Additional savings potential is available in ventilation fans. VFDs on vacuum pumps remains an opportunity as well, despite significant existing market penetration for this measure.
Pump Testing, and Pump and Motor Upgrades
Pumps have to be maintained constantly. Growers pull them out every four to five years to work on them.
According to a manufacturer of sprinkler equipment, some growers wait too long to replace or maintain their pumps. They will complain about "dirty power,” (i.e., fluctuations in reliability), when in reality they are overloading their motors so badly that the pump shuts down.
According to multiple interviewees, pumps (well pumps and turbines in particular) hold great potential for savings, and continuation of pump testing incentives is warranted.
Energy Efficiency Activity at Greenhouses
The marijuana industry drives significant growth in the construction of greenhouses. Gas savings are considered the dominant savings opportunity at greenhouses according to one interviewee. However, significant potential exists for lighting savings as well. Many growers rely on underground knowledge for identifying the best lighting to enhance plant growth. Limited research exists which focuses on identifying which high efficiency lighting solutions are best suited to enhancing plant growth.
Additional Efficiency Measure Activity at Ag Facilities
As noted previously, measures recently identified as holding significant potential based on the Energy Trust of Oregon’s experience include fast acting doors and refrigeration controls. VFDs on ventilation fans continue to demonstrate significant potential.
HVAC measures have seen limited uptake up to this point. One interviewee estimated penetration rates of 20% for refrigeration measures at dairies, 10% for ventilation measures in agriculture facilities in general, and 5% for HVAC measures in agriculture facilities in general.
Several interviewees identified lighting upgrades as a common focus of current upgrade activity, and also one that holds significant potential across most agriculture facilities. One interviewee noted the importance of using proper lighting at dairy facilities due to effect of light on a cow’s milk production.

Memorandum — Market Actor Interview Notes B-19
Other Irrigation Strategies
Variable Rate Irrigation (VRI)
o VRI uses software to enable a center pivot system to vary the rate of water delivery based on the needs of a specific location.
o Experts commented that they are seeing growth in use of this approach at more sophisticated farms.
o One expert described the two different types of VRI systems available; one is too expensive and complicated to set up and maintain. A farmer can change the speed up to 300 times as it goes around the field and calculate when it hits good/poor soil.
o It is useful for limiting water use on areas with uneven terrain. Some ground is not farmable but is being irrigated (due to equipment configuration); VRI could add more precision to where irrigation is applied, which would result in savings.
Low Energy Precision Application (LEPA)
o LEPA involves precise, low pressure application of water at a height that’s closer to the ground than traditional equipment. This reduces the loss of water to wind drift and evaporation.
o LEPA provides an opportunity to improve efficiency if field conditions are appropriate. Current use is limited, though it is expanding quickly, thanks in large part to benefits of peer demonstration.
o One researcher based in Idaho commented that demand for LEPA is minimal in the area.
Other Irrigation Controls
o More remote control over irrigation equipment is in use because costs are coming down.
Areas with Greatest Remaining Potential This section provides an overview of the areas of remaining opportunity for savings identified by interviewees.
Irrigation accounts for the greatest amount of electricity use among the agriculture sector. Therefore, irrigation warrants continued attention as a source of energy savings. On interviewee referenced a NEEA study that found that 85% of electricity use in the agriculture sector in BPA’s territory is for pumping water, 10% is for dairies, and 5% is for food storage facilities [Navigant was unable to confirm the source of this information.]
Automation and data driven irrigation management present the biggest potential for savings, according to multiple respondents. Better measurement and record keeping, and access to engineering and sophisticated irrigation planning, will help enable farmers to tap the potential that exists in automation and management.

Memorandum — Market Actor Interview Notes B-20
o According to two interviewees, cell phone automation packages are becoming more common, particular at larger farms. One interviewee noted that they come standard with several new pivot systems.
o “The big opportunities for reducing energy use are not in hardware, they’re in management, and getting growers to understand the benefits of [decreasing the amount of water they apply].”
o “The big opportunity is just having the systems off.”
o One interviewee noted that advanced automation is currently in use in only 10% of the Basin and much less in Idaho and Montana.
As noted previously, great potential exists for improved precision in the application of water through use of VRI and LEPA.
o VRI is currently only used by about 5% of growers according to one irrigation consultant and an agriculture engineer
o LEPA has potential for use in about one-third of center pivot applications. In order for it to work, a field needs to be flat, and soil must have good water uptake. The technology is applicable for 1.5 to 2 million acres. So far it has been adopted by less than 1% of the applicable area. According to an agriculture extension office expert, potential for LEPA is greatest among alfalfa/wheat (rotation), corn, small grains, and perhaps beets and potatoes. There are pockets of Washington that can benefit from LEPA, according to an irrigation consultant.
According to multiple interviewees, a big opportunity remains for efficiency gains with the pastures growing small grains and hay, those for which growers might not be able to make an SIS investment case in the absence of incentives
Replacement and improvement of the integrity of mainline pipes offers significant potential for savings according to one respondent. BPA was involved in mortar lining and main line replacement 10-15 years ago. Now is a good time to revisit that because the pipe equipment is once again aging.
Savings potential also exists in irrigation system optimization (e.g., making sure sprinklers are spaced properly).
Look for potential energy savings in storage facilities, according to an agriculture extension office expert.
Many growers who installed pumps in the ‘50s and ‘60s will need to replace them soon, which presents a good opportunity to introduce more efficient pump equipment.
Centrifugal motors are numerous and inefficient. Converting to more efficient motor configurations presents a significant opportunity for savings.

Memorandum — Market Actor Interview Notes B-21
A trend to decrease the amount of tillage is underway. This primarily is a diesel saving measure (less operation of tractors), but also affects and pesticide application needs and irrigation in ways that save electricity.
Market Structure
Organization of Market and Relationships Between Companies
Irrigation
For some parts of the pivot system, multiple pivot manufacturers use components made by the same factory, but each stamps it with their own brand.
In Oregon, sometimes only engineers can do irrigation work (not general consultants). In Washington, not as much activity happens outside of the irrigation industry.
It is common for a grower to stay affiliated with a particular brand for a long time because the dealer they bought their system from will have the replacement equipment they need.
In the center pivot industry, manufacturers distribute products through a network of brand-dedicated dealers.
o Pivot dealers/distributors are affiliated with a specific brand for sales, but will service all brands.
o In contrast, in the orchard/tree vine market, manufacturers are more directly involved with sales to growers. This is due to the need for specialization in the design, and unique hydraulic consideration for orchards.
Generally, there is no market for energy efficiency-specific consultants as growers have not historically prioritized investments in energy efficiency.
Growers of high-value crops will invest in irrigation consultants because they have more to lose.
o Seventy percent of growers use “irrigation consultants” in some way. Those who do not use consultants are mostly alfalfa or grain growers.
Distributors/dealers provide irrigation system design. NRCS also provides this as a free courtesy to those who want to do something more efficient.
Irrigation consultants play a larger role in the market now than in the past, according to both consultants and academics interviewed. Water scarcity is a key driver for the increased demand for irrigation consultants.
o According to one interviewee, irrigation companies now serve broader geographic areas than they did previously. It’s not clear whether this might be due to an increase in the demand for the services of experienced practitioners.

Memorandum — Market Actor Interview Notes B-22
VFDs
For VFDs, manufacturers sell to regional electrical and pump distributors. Some sell both wholesale and retail and some just sell wholesale. Those that specialize in selling a lot of big ticket items will focus on the wholesale market. This distributors selling smaller ticket items tend to offer retail sales in addition to wholesale.
Pump and well service providers install VFDs, but they're not pitching rebates. They are just paid to do design because their credentials are needed.
Pivot dealers will sell a range of brands of VFDs. This is in contrast to the single-brand relationship dealers have with a pivot manufacturer.
According to one technical service provider, the marketplace lacks a strong network of service providers with the technical capabilities to support ongoing use and maintenance of VFDs. The interviewee noted that some pivot dealers are more qualified than others to support and service this technology.
Market Structure for Other Efficiency Measures
Many general engineering firms that conduct work in the industrial sector serve the agriculture sector as well, though they are not “ag focused.”
A key source of information about companies that conduct audits for the USDA’s Natural Resource Conservation Service program is that program’s listing of certified Technical Service Providers (TSPs).
In some cases TSPs hold the proper qualifications to implement measure opportunities identified through the energy audits they complete. More often, the farmer would use standard contractors with which they have existing relationships to implement the opportunities identified in the audit, or the TSP would serve as a general contractor to bring in the appropriate tradespeople to complete the work.
Channels for Delivery of EE Message to End Users
Years ago every state had an extension department and an "irrigation extension specialist (IES).” Idaho is the only state that still has that position intact. That specialist would disseminate information to counties and counties would get the information out to growers. That communication channel (unbiased sharing of information) has broken down with the elimination of the IES role. NRCS offices have taken over that role, by default.
Most growers currently learn about efficiency upgrade opportunities from their local soil and water conservation district and irrigation district offices.
Some interviewees report that growers typically identify their own opportunities for energy savings. Others say dealers are the most common source for identifying energy-saving opportunities.

Memorandum — Market Actor Interview Notes B-23
According to an irrigation consultant, BPA should work with irrigation consultants and dealers for program outreach as opposed to going to the manufacturers directly. The irrigation manufacturers are focused on the worldwide market.
When there are innovations in irrigation automation or scheduling, dealers will approach the growers about it directly.
The most common/effective information-sharing channels are agriculture publications, university agriculture extension offices, dealers, and trade shows.
o The Farm Journal is one agriculture-focused publications mentioned.
Each type of grower belongs to its own type of trade association. Numerous specialized trade associations exist. Farmers often choose their affiliations with trade association(s) based on their predecessors’ or peers’ experiences.
o Trade associations mentioned include: The Farm Bureau, American Society of Agronomy, ASABE (American Society of Agricultural and Biological Engineers), Corn Growers’ Association, United Soybean Board, Hay Growers Association, Oregon/Washington Potato Growers Association, Vegetable Growers Association,
Pivot dealers have their own “pivot schools” where they teach 50-60 growers in several towns what to do with new technologies.
Long-term relationships are critical.
o Neighbor-to-neighbor (peer to peer) communications are highly valued effective communication channels in the agriculture sector.
o Growers will often go back to the service providers with which they have existing relationships, conducting projects as capital becomes available. Therefore, firms holding existing relationships with growers are strong candidates for targeting program messaging.
A commercial energy consultant says that agriculture needs to have a different delivery model than C&I. The agriculture sector requires a holistic approach and an understanding of the unique risk and cost sensitivities facing growers.
Market Trends This section provides an overview of market developments highlighted by interviewees. It first summarizes key market trends in the area of technology advancements, automation, and irrigation controls. The section also summarizes changes in crops, and other market trends.
Technology Advancements, Automation, and Irrigation Controls
Web-based software that allows for remote monitoring of irrigation. This presents an enormous improvement in energy efficiency because it allows farmers to shut down the system instantly if, for example, there is a problem or if it is raining. It allows farmers to manage 25 pivots in 30 minutes, instead of one person taking all day to manage the equipment.

Memorandum — Market Actor Interview Notes B-24
o According to a pivot manufacturer, about 40–80% of farmers are using this type of advanced technology now, resulting in major gains in energy efficiency. It also enables farmers to participate as demand response assets; when the utility calls an event, the farmer can respond via phone-controlled applications and shut down their pivots.
o Satellite technology is being used to upload data from the fields.
o A transition to a younger generation of more tech-savvy farmers positions the agriculture sector to embrace new technologies that are coming online.
According to an agriculture extension office expert, labor costs are increasing due in part to a shortage in labor supply. This will support a continued shift away from the more labor-intensive gravity irrigation systems and toward pressurized systems and greater use of automation and controls.
Two interviewees highlighted drones as a game changer. There is significant interest in this concept for use in managing irrigation systems, particularly among sugar beet growers, according to an agriculture engineer. There are currently Federal Aviation Administration (FAA) restrictions on business use, but private individuals can use them right now. Through drone flyovers a farmer can look at plant stress and irrigation system operation, providing much more valuable information than moisture probes. They can also use drones to inform more selective distribution of pesticides. Limitations on drone use include prices, reliability, and FAA restrictions.
Agriculture is not growing (as a market). However, the sector is seeing increased yield as the result of new technologies.
Crop Changes
The Rogue Valley/Bear Creek Valley (N-S from Medford) are experiencing significant crop changeover. The region is switching from fruit to more vegetable production. Pear production is especially volatile.
Growth of the dairy industry, particularly in southern Idaho, has significantly affected the amount of corn grown according to an agriculture engineer. If the soil is well drained, corn does not care how much water or nitrogen you add, so there is no decrease in quality to function as a disincentive for overwatering (as there is with beets and potatoes). National Agricultural Statistics Service’s (NASS) Farm and Ranch Irrigation Survey (FRIS) data indicates that for every three cows, two new acres of corn are planted.
An ag extension office expert reports that an increase in the number of wine grapes is driving down water use, as grapes use half as much water as hay, and grape growers have more efficient irrigation practices than most other growers.
Other Market Trends
Efficiency gains are going to come from better irrigation management, not technology, according to one agriculture extension office representative.

Memorandum — Market Actor Interview Notes B-25
The competition for water is accelerating, according to several interviewees. Farmers need to find the sweet spot where they can cut excess irrigation without hurting yield. That will be the rule of the day in the next 10-15 years. Water use will need to be much more efficient in the future. The marginal benefit in the last 10% of efficiency is very low, and that is where the program opportunity exists.
Farmers are conserving water but are trying to grow more acres with it; energy is being saved but water is being re-spread, which eliminates any net savings.
Water will continue to get more expensive in Idaho, which will drive continued conversion from gravity to pressure (especially pivot). This pace of the transition will increase during the next five to ten years. In addition to shifting from gravity to pressurized, there will be a conversion from "big impact" to pivot systems.
Minimizing labor costs is of critical importance for growers, as is reliability.
Electricity and water costs are increasing in response to population growth, according to multiple interviewees. As water and energy become more expensive it will be easier to sell farmers on SIS as the economics will improve. Farms are getting bigger and more efficient in general, according to a research agronomist.

Memorandum — USDA Data Analysis C-1
Appendix C: Memorandum — USDA Data Analysis To: Carrie Cobb, Bonneville Power Administration (BPA)
From: Nicole Wobus, Molly Podolefsky, Kirsten Midura, Daniel Layton, Gabriela Gaitan, and Jane Pater Salmon, Navigant Consulting, Inc.
Date: April 10, 2015
Subject: Analysis of United States Department of Agriculture (USDA) data to inform BPA agricultural program market characterization
This memo presents findings resulting from Navigant’s analysis of USDA data for the states of Idaho, Montana, Oregon, and Washington. The objective of the analysis was to summarize key trends for the Northwest region as a whole as well as within sub-regions. BPA can use these findings as a first step toward identifying areas that warrant the greatest attention in their programming.
The memo is organized as follows:
Section I provides a high-level summary of findings.
Section II provides an overview of the data sources and methods used for the analysis.
Section III includes discussion of findings for each of the following key areas of focus for the analysis:
o Crops
o Dairy
o Beef
o Greenhouses
Section IV summarizes conclusions from Navigant’s analysis.
Appendices A and B includes detailed maps of two areas that BPA may consider in its program planning: the Columbia River Basin and northwestern Montana.

Memorandum — USDA Data Analysis C-2
Summary The project team mined data from two USDA datasets: the agricultural census, and the Farm and Ranch Information Survey (FRIS), to highlight key program opportunities and trends in the agricultural sector within BPA’s service territory.1 Working with the available data, along with a subset of findings from market actor interviews, Navigant’s analysis illuminates the location of agricultural activity within BPA’s territory. BPA can build on these findings by conducting additional research to better understand areas of interest.
The project team assembled content from a variety of USDA data sources to present as complete a picture as possible of the USDA data available to guide agriculture program decision making. These sources are briefly noted here, and described in greater detail in Section II.2
USDA Census provides certain types of agricultural data by state and county. These data include irrigated crop acreage and head of cattle by location.
USDA FRIS provides state-level data on the number of irrigated vs. non-irrigated acres for a select set of crops and national level data on the number of pressure irrigated vs. gravity irrigated acres.
USDA CropScape maps provide a high degree of geographic resolution for crop location. They only show total crop acreage, providing no indication of irrigation practices.
Both the census and FRIS data sets are collected every five years. Navigant reviewed agricultural census data from 2012 and FRIS data from 2008 and 2013.
The USDA data do not include county level or more granular data on irrigation practices; thus, these data do not allow for an analysis of irrigation practices for a specific crop within a particular area of BPA territory. This limits the ability to draw conclusions about the relevance of the crop acreage as it relates to irrigation efficiency savings potential.
Navigant’s data analysis resulted in the key findings summarized here.
Key Findings: Crops Trends in BPA’s territory are similar to those in the entire Northwest. This suggests that
BPA’s service territory covers many of the areas in which the Northwest’s agricultural activities take place. The exception is in Idaho, where much of the agricultural activity falls outside of BPA’s service territory. Consequently, changes in Idaho’s agricultural market are less relevant to BPA’s agricultural program planning efforts.
The most robust agricultural region within BPA territory is Washington’s Columbia River Basin. The region holds the most distinct cluster of high-value crops (e.g., potatoes, apples,
1 Sources: United States Department of Agriculture (USDA) 2012 Census of Agriculture. United States Department of Agriculture (USDA) 2013 Farm and Ranch Information Survey (FRIS). The Census and the FRIS are conducted by NASS (National Agricultural Statistics Service), a division within USDA. 2 In addition to these USDA sources, Navigant analyzed the 2011 Washington Vineyard Acreage Report. This report served as the source for vineyard and grape analysis because the Agricultural Census lacks detailed data on vineyards.

Memorandum — USDA Data Analysis C-3
cherries, and alfalfa), as well as the greatest amount of irrigated acreage within BPA territory.3 Utilities located in this area are also the most active participants in BPA’s agricultural program.
Northwestern Montana’s BPA territory includes a high volume of alfalfa production, along with a noteworthy concentration of wheat and barley production. Within BPA, Montana is second only to Washington in alfalfa production, with over 136,000 irrigated acres of alfalfa. However, only one of Bonneville’s Montana customers has been notably active in BPA’s Scientific Irrigation System (SIS) program. Therefore, Montana presents a potential area of focus for future targeted program activity.
Alfalfa and wheat are the dominant crops in BPA’s territory. Seed and grain crops dominate the Northwest agricultural market both in terms of irrigated acreage and crop value. In terms of irrigated acreage, alfalfa and wheat are the leading crops, with roughly 500,000 acres and 200,000 acres, respectively. Despite the relatively low cash value of these crops, their potential impact on energy savings may be sizeable given their large acreage within BPA and across the Northwest.
Washington’s vineyards are a growing component of BPA’s agricultural landscape. BPA vineyard acreage in Washington has more than quadrupled over the past two decades to over 40,000 acres. Additionally, Washington has over 17,000 acres of juice grapes in production.
Key Findings: Dairy Much of the Northwest’s dairy activity occurs outside of BPA territory. Most of the
Northwest’s dairy cattle are located in parts of Idaho that lie outside of BPA’s service territory.
The dairy market within BPA territory is growing more rapidly than that of the Northwest as a whole. The majority of BPA’s dairy market is contained in Washington and Oregon. The number of dairy cattle in these two states grew rapidly between 2002 and 2012.
Dairy farms in BPA territory and the Northwest as a whole are increasing in size. The number of dairy farms declined between 2002 and 2012 across the Northwest and in BPA’s territory, though the number of dairy cattle raised at those farms increased during that period.
Dairy farms are relatively energy intensive.4 They may warrant additional attention from BPA despite the fact that a large majority of the region’s dairy industry resides outside of Bonneville’s territory.
3 The “high value crops” referred to throughout this study are a collection of crops identified by in-depth interviews with industry, academic and governmental agency experts on agriculture in the Northwest. 4 Studies conducted in Wisconsin found that dairy farms use as much as 1,736 kWh/cow-year. For context, in 2012, the average annual electricity consumption for a U.S. residential customer was 10,387 kWh (EIA), so about 10 cows on a dairy farm equals one US residential customer. Sources: 1) Wisconsin Energy Efficiency and Renewable Energy Resource, http://www.uwex.edu/energy/dairy.html (accessed January 21, 2015). 2) U.S. Energy Information Administration. “Frequently Asked Questions: How much electricity does an American home use?” http://www.eia.gov/tools/faqs/faq.cfm?id=97&t=3 (accessed January 21, 2015). Relevance of both the dairy and beef findings depend to some extent on whether food processing facilities fall within the scope of the industrial program or the agriculture program.

Memorandum — USDA Data Analysis C-4
Key Findings: Beef The majority of beef cattle in BPA are located in Oregon and Montana. Within BPA, Oregon is
home to 280,000 head of beef cattle, followed by Montana’s 173,000. Together these states are home to nearly three-quarters of BPA’s beef cattle market. Across the Northwest as a whole, Montana leads in beef cattle production, holding as many beef cattle as Oregon, Washington and Idaho combined, but the majority of these cattle lie outside BPA territory. An assessment of the energy intensity of the beef industry was outside the scope of this analysis.
The beef market appears to be declining moderately in the Northwest, both within and outside of BPA territory. The number of beef cattle declined between 2002 and 2012. No distinct trend was identified in number of beef farms during that time.
Key Findings: Greenhouses5 Most of the greenhouses in BPA’s territory are located in Washington and Oregon. Of the
341 greenhouses in BPA’s territory, nearly 80 percent are in Washington and Oregon.
Greenhouses have trended towards smaller operations. The overall number of greenhouses in the Northwest, including within BPA territory, has increased rapidly, particularly between 2007 and 2012. The total square footage declined, however, between 2002 and 2012.
Implications for BPA’s Agricultural Program The crops covering the greatest amount of irrigated acres in BPA’s territory are not commonly
associated with SIS use, and may represent a large potential for energy savings. Market actor interviews indicate that SIS use is most common among potato farms and other high-value crops, and such growers have taken advantage of BPA’s SIS incentives in the Columbia Basin. However, other irrigated crops could still benefit from SIS. Based on interview findings, increased adoption of SIS may occur in response to additional education and a more compelling package of incentives.6
The Columbia River Basin area has participated actively in BPA’s program already, but may hold a great deal of additional potential for program savings. This region is home to a substantial amount of agricultural activity, both in terms of irrigated acres and crop value, and opportunities likely exist to increase use of SIS and other efficiency measures. For example, existing SIS users may expand use to a greater number of fields within their operations, and they may represent ideal candidates for completing a range of additional agricultural efficiency measures incented by BPA (i.e., potential exists to “upsell” existing, engaged participants to complete additional agricultural measures).
Northwestern Montana may warrant closer examination as a potential area of focus for future program activity. Concentrated areas of northwestern Montana grow alfalfa and wheat, yet most of BPA’s utility customers in the state have relatively low prior program participation rates, and have no history of SIS participation. For irrigated crops, volume of acreage is directly related to
5 Data on the products grown in greenhouses in BPA territory was not reviewed as part of this analysis. 6 This theme will be addressed in greater detail in market actor interview notes.

Memorandum — USDA Data Analysis C-5
greater energy use.7 Thus, even though the dollar value of crops in Montana may be low relative to other crops, the potential energy savings could be substantial. The volume of beef farming in Montana’s BPA territory may also support an increased focus on activity in the state.
Valuable potential for savings may exist within the dairy and greenhouse sectors, both of which have experienced growth within BPA territory. Dairy and greenhouse activity are concentrated in Washington and Oregon. Much of the potential savings in the dairy sector likely exists in the form of irrigation efficiency in the fields upon which dairy cattle graze. Dairy processing facilities represent another area of opportunity, though efficiency improvements at those facilities may fall within the scope of BPA’s industrial program. Greenhouses present a number of efficiency opportunities as well.
Methodology This summary of Navigant’s methodology starts with a review of the data sources included in the analysis. A discussion of the data limitations and steps taken to address those limitations follows. Finally, this section presents a summary of the process Navigant used to estimate the volume of irrigated acreage from the USDA Census that falls within BPA territory.
Summary of Data Sources Navigant analyzed USDA data as well as other key data sources deemed necessary to provide context. Data used for this analysis include the following sources:8
2012 USDA Census of Agriculture.9 The census served as the source for all data on quantities of irrigated crop acreage cited in this memo, with the exception of vineyards.
2008 and 2013 USDA FRIS.10 FRIS data was of limited use for this analysis due to the granularity of data, as noted in Section 1 and described below. The memo does include references to select FRIS data for context on the potential irrigation characteristics of various crops identified (through analysis of census data) as has having a notable presence in BPA’s territory.
2012 USDA CropScape Map Files.11 Navigant used the files to create maps and perform Geographic Information System (GIS) analysis. The maps provide detailed information about the location of crops, but they lack data on irrigation practices. Therefore, all maps included in this memo show total acreage, but do not specify which acres may be irrigated and what type of irrigation system might be in use.
7 National level data indicate that wheat and alfalfa tend to be pressure irrigated when they are irrigated at all. However, the maps used to identify acreage of these crops within BPA’s territory in Montana do not distinguish between irrigated vs. non-irrigated acreage. 8 The analysis presented in this memo is primarily based on USDA data. Navigant also conducted market actor interviews during late 2014 which provide helpful context. There are instances in this memo in which Navigant includes references to the interviews. The full findings from the interviews will be published separately. 9 United States Department of Agriculture (USDA) Census of Agriculture, 2012, published by the USDA. 10 At the time of Navigant’s original analysis (memo submitted in late November, 2014) 2008 FRIS data was the most current available. 2013 FRIS data was released on November 13, 2014 and was reviewed in preparation for submitting the revised memo. The same data granularity limitations exist with the 2013 data as with the 2008 data. 11 CropScape—Cropland Data Layer, United States Department of Agriculture (USDA), National Agricultural Statistics Service (NASS), 2013. http://nassgeodata.gmu.edu/CropScape/.

Memorandum — USDA Data Analysis C-6
2011 Washington Vineyard Acreage Report.12 This report served as the source for vineyard and grape analysis because the census lacks detailed data on vineyards.
BPA agricultural program tracking data. These data included program activity occurring from 2010 through 2014.13 A detailed summary of program activity was outside the scope of the USDA data analysis task. However, the team believed that a brief reference to the location of utilities that have been active in BPA’s agricultural offerings to date (with an emphasis on SIS) would make the mapping analysis more meaningful.
Navigant’s analysis of the USDA data focused on the following crops: alfalfa, wheat, barley, potatoes, corn, sweet corn, apples, sugar beets, berries, pears, and cherries. Navigant selected these crops for the following reasons:
They comprise sizeable irrigated acreage in the Northwest and in BPA territory (e.g., alfalfa, wheat, barley, potatoes, and corn)
They are high-value crops used as indicator crops (e.g., sweet corn, apples, sugar beets, berries, pears, and cherries)
Strategies to Address Data Limitations Navigant completed the most comprehensive analysis possible working with resources available during the timeline of this study. A key limitation of the USDA data is the lack of information necessary to understand the irrigation characteristics of crops within BPA territory, as discussed in the Summary section.
The census provides data on irrigated acreage by crop but does not distinguish between types of irrigation (e.g., pressurized vs. non-pressurized). The FRIS reports data on irrigation status (i.e., irrigated vs. non-irrigated acreage) at the state level for a select set of crops, and type of irrigation system (i.e., pressurized vs. non-pressurized) at the national level. However, this provides insufficient information upon which to base conclusions about the irrigation efficiency potential of various crops present within BPA’s territory.
This memo includes references to state and national level data on irrigation practices from the most recent FRIS data (2013). These references provide an indication of the irrigation practices that may characterize the crop acreage present in BPA’s territory. Additional research would be needed in order to accurately characterize the savings potential associated with the agricultural activity highlighted in this memo.
USDA census data are available at the county level for acreage of irrigated crops by type. However, many gaps exist in the county-level data available to the public, and the data are not of sufficient quality to use for the purpose of characterizing BPA’s agricultural market. Furthermore, BPA’s territory does not align with county boundaries. Roughly one-third of the counties in Oregon, Washington, Idaho, and Montana are split between BPA and non-BPA utilities; agricultural activity tends to be highly concentrated within
12Washington Vineyard Acreage Report, 2011, published by the USDA and the National Agricultural Statistics Service (NASS). 13 Data for 2014 only reflects program records available to BPA staff through October 2014.

Memorandum — USDA Data Analysis C-7
specific regions of counties, which means that within split counties, agriculture may be predominantly concentrated inside or outside of BPA regions.
Table C-2: Role of Data Used in Analysis
Data Source Data Used for Analysis Role of Data in Analysis
USDA Census State level irrigated acreage for
all key crops except vineyards14 Used as the basis for summarizing total irrigated
acreage by crop within BPA territory and by state15
FRIS
State level irrigated, non-irrigated acreage for select set of crops
National pressurized / non-pressurized acreage for select set of crops
Used relative values to provide context for understanding the significance of acreage shown in mapping (e.g., irrigated / non-irrigated acres by state, national pressurized / non-pressurized acres by crop)
USDA CropScape Maps Location-specific data for total
crop acreage; irrigation practices not specified
Used as the basis for Navigant map development and for visual inspection of crops falling within BPA territory
Washington Vineyard Acreage Report
Washington-specific acreage by grape type
Used for assessing growth in vineyard sector
Source: Navigant
Process for Estimating Irrigated Acreage in BPA Territory In order to present a summary of irrigated acres by crop that is relevant to BPA, the Navigant team developed and applied a weighting scheme to counties that included portions inside and outside of BPA.16 The weighting scheme accounted for land area in BPA as well as the percentage of agriculture in BPA by county. The process included the following steps:
1. Navigant used GIS mapping analysis to calculate the percentage of land area in BPA for every split county.
2. The team used visual inspection to estimate the percentage of each county’s agriculture falling within BPA boundaries. For this exercise, Navigant combined USDA CropScape maps with BPA territory and county maps to show the location of all farming activities by county in relation to BPA territory. Two independent observers visually inspected these maps by county to estimate the percent of each county’s agricultural activity located in BPA. Observers binned the percentage of agriculture in BPA by county according to the following percentage bins: 0, 5, 10, 25, 50, 75, 90, 95, and 100.17
14 Available at county level, but significant data gaps exist. 15 As described in greater detail later in the methodology section, Navigant used GIS maps of DTE territory to identify BPA land area by county. Navigant then estimated irrigated crop acreage that falls within BPA territory using visual inspection of USDA CropScape maps. 16 As noted previously, the census provides data for the irrigated acreage of crops by state and county. However, data gaps and a lack of granularity prevented Navigant from being able to readily identify the acreage of irrigated crops that fall within BPA territory. 17 Navigant selected these bins because it was easiest to visually distinguish among them, and they were the most reliable bins available to use as the basis for assigning areas as falling within or outside BPA territory.

Memorandum — USDA Data Analysis C-8
3. The Navigant team averaged two independent sets of visual inspection results to create the final visual inspection weight.
4. For each county, Navigant averaged the percentage of land in BPA and the percentage of agriculture in BPA. The resulting value was applied in the weighting scheme Navigant used to filter data according to its relevance to BPA, described in the following step.
5. The team then applied weights to every county-level Agricultural Census statistic before aggregating these statistics to the BPA level. Counties completely in BPA were assigned a weight of 1, counties completely outside were assigned a weight of 0, and split counties were assigned the weight described above. This weighting process allowed the Navigant team to report statistics and draw conclusions specific to BPA as opposed to the region as a whole.
Navigant took the following steps to identify “BPA territory” for the purposes of the geographic analysis:
1. Referenced a Ventyx map layer (vintage early 2014) that included GIS details for all utilities in the U.S., and sorted for those listing BPA as their control/planning area.
2. Reviewed BPA agriculture program tracking data and flagged utilities that had participated in BPA’s program but did not list BPA as their control/planning area in the Ventyx data.
3. Sought clarification from BPA staff on the status of utilities whose BPA affiliations were unclear (e.g., utilities with service area overlapping that of an IOU, such as Avista).
4. Adjusted the utilities marked as falling within “BPA territory” based on outcomes from BPA staff communications.
Discussion of Findings This section includes discussion of key findings, first addressing crops in great detail, followed by discussion of the dairy, beef, and greenhouse sectors. The discussion of crops is most extensive due to its close relationship with irrigation efficiency opportunities, the measure category that has been the primary focus of BPA agriculture program activities to date.
Crop Findings This section presents findings related to the location and size, both in terms of acreage and dollar value, of key crop markets present within BPA’s service territory. First, the geographic summary highlights “hot-spot” areas that may warrant attention from BPA’s agricultural program planners. A discussion of the market size of key crops follows, first in terms of volume of production (i.e., either land area or other volumetric indicators, as appropriate), then in terms of dollar value.
Geographic Summary
Washington and Oregon’s Columbia River Basin is by far the most agriculturally active area within BPA territory, both in terms of the concentration of high-value crops (e.g., cherries, apples, berries, potatoes, and wine grapes), and BPA program participation (see Figure C-2). This region also grows a large acreage of lower value, high-volume grain crops such as wheat and alfalfa. A great deal of potential for savings

Memorandum — USDA Data Analysis C-9
still likely exists. For example, according to market actor interviews many farmers currently only use SIS on a portion of their fields due to cost, and expanded use could produce additional savings.18
As shown in Figure C-1, northwestern Montana has the second greatest concentration of agricultural activity in BPA territory. The standout crop in that area is alfalfa; BPA’s Montana territory is second only to its Oregon territory in terms of irrigated acreage of alfalfa. Northwestern Montana also produces notable volumes of wheat and barley, though the area is not a leader within BPA’s territory for either of those two crops. Montana utilities are active in BPA incentive programs, though sprinklers and VFDs make up the majority of measures for those utilities; they have not participated in SIS.
The crops with significant acreage in Montana are lower value and thus might not have the same market drivers for efficiency improvements as other crops. However, national-level data on the irrigation practices used for irrigated acreage of these crops indicate that they may hold irrigation efficiency potential.19 Given the concentration of agricultural activity in northwestern Montana, even modest efficiency improvements on those fields may amount to meaningful savings in aggregate. Crops that are less common users of SIS may stand to benefit the most from BPA’s programs (i.e., the crops for which a combination of BPA and other incentives may tip the scales in favor of using more efficient irrigation practices and equipment).
Figure C-1 also shows that additional areas of southeastern Washington, northeastern Oregon, and parts of both northwestern and southeastern Idaho may warrant closer attention from BPA. These areas contain smaller yet highly concentrated areas of agricultural activity within BPA territory, which could generate valuable savings through future participation in BPA programs. Figure C-1 provides a region-level perspective of the geographic areas of opportunity. More detailed maps of the Columbia River Basin area and Montana are included in Appendices C1 and C2.
18 Interviews with SIS providers suggest that farmers will often only use SIS on a portion of their farm. They usually use SIS on higher value crops or crops more sensitive to water application. 19 As detailed in previously, national level data indicate that all three crops, when irrigated, tend to be pressure irrigated. However, the maps used to identify acreage of these crops within BPA’s territory in Montana do not distinguish between irrigated vs. non-irrigated acreage.

Memorandum — USDA Data Analysis C-10
Figure C-1: Agricultural Activity in the Northwest and BPA Territories
Sources: United States Department of Agriculture (USDA), Census of Agriculture, 2012; USDA CropScape maps, 2013; Bonneville Power Administration (BPA) agriculture energy efficiency program participation data (2010-2011); Ventyx Geographic Information System (GIS) utility boundary data

Memorandum — USDA Data Analysis C-11
Summary of Market Size, Volume of Production
According to USDA data, seed and grain crops dominated the Northwest’s irrigated crop acreage from 2002 to 2012. In terms of total irrigated acreage, alfalfa is the dominant grain crop in BPA territory. Figure C-2 shows that in 2012, farmers in BPA’s service territory grew 498,000 irrigated acres of alfalfa, which is equal to the acreage of the next three most land-intensive irrigated crops combined – wheat (230,000 irrigated acres), potatoes (141,000 irrigated acres), and corn (127,000 irrigated acres).
The energy implications of alfalfa, wheat, and other dominant grain crops could be substantial even though the dollar value of these high-acreage crops may be low relative to other crops. Field crops require more irrigated land than permanent crops such as apples and cherries, and greater irrigated acreage is directly related to greater energy use. Data for type of irrigation used by various crops is only available at the national level. Those data show that irrigated acreage of alfalfa, wheat and barley tend to use pressure irrigation as opposed to gravity irrigation.20 This indicates that these crops may hold irrigation efficiency potential within BPA’s territory.
The amount of irrigated acreage for a crop is only one indicator of a crop’s importance. Fruit and vegetable crops such as sweet corn, cherries, and pears comprise far less acreage than field crops, but their high value in terms of dollars per acre makes them key indicator crops for BPA as well. Growers of high-value crops are more likely to have the financial resources to invest in irrigation improvements. Furthermore, crop quality is critical for high-value crops, and, according to market actor interviews, irrigation efficiency improvements are associated with improved crop quality.
20 According to 2013 FRIS data, alfalfa, wheat and barley acreage that is irrigated is more likely to be pressure irrigated than gravity irrigated. National level counts of acreage for pressure vs. gravity systems for each crop type are as follows: Alfalfa: 3,545,400 acres pressure systems vs. 1,967,471 gravity systems; Wheat: 2,654,442 acres pressure systems vs. 543,059 gravity systems; Barley: 887,964 acres pressure systems vs. 321,563 gravity systems (FRIS Table 38). However, findings related to the prominence of a particular crop within a particular state in BPA’s territory are based in part on CropScape maps which do not indicate whether crop acreage is irrigated.

Memorandum — USDA Data Analysis C-12
Figure C-2: 2012 Total Irrigated Acreage of Key Crops, BPA Territory
Source: Navigant analysis of USDA 2012 Census of Agriculture data
It appears that the majority of key crops in BPA territory have remained relatively stable in terms of acreage over the past decade, with the exception of alfalfa. Alfalfa production decreased in acreage between 2002 and 2012. Figure C-3 illustrates trends in crop acreage for all key crops from 2002 to 2012. Figure C-4 shows the same trends excluding high-acreage grain crops in order to more clearly illustrate changes in lower acreage crops.
Potatoes and corn have experienced significant increases in the number of farms. While the acreage of corn increased with the increase in number of farms, the acreage of potatoes decreased or stayed constant despite the growing number of farms.
Figure C-3: BPA Trends in Key Irrigated Crop Acreage
Source: Navigant analysis of USDA 2012 Census of Agriculture data
498
230
141 127101
78 6813 13 12 1
0
100
200
300
400
500
600Ir
riga
ted
Acr
es, 1
,000
'salfalfa hay
wheat
potatoes
corn
barley
apples
sweet corn
pears
sugarbeets
berries
cherries
0
100
200
300
400
500
600
700
800
900
2002 2007 2012
Irri
gate
d A
cres
, 1,0
00
alfalfa
apples
cherries
pears
barley
corn
sugarbeets
wheat
berries
potatoes
sweet corn

Memorandum — USDA Data Analysis C-13
Figure C-4: BPA Trends in Low-Acreage Key Irrigated Crops
Source: Navigant analysis of USDA 2012 Census of Agriculture data
The following discussion highlights those key crops that have experienced noteworthy changes from 2002 to 2012 in any of the following: acreage, number of farms or size of operations. The crops include:
Alfalfa
Potatoes
Corn
Vineyards and grapes
Alfalfa and Other Leading Seed and Grain Crops
Alfalfa remains by far the largest crop in terms of irrigated acreage in BPA territory, and seed and grain crops lead in irrigated crop acreage throughout BPA. As shown in Figure C-5, Oregon and Montana are BPA’s two largest producers of alfalfa, with over 300,000 irrigated acres, combined.
Despite declines in BPA and across the Northwest, alfalfa remains the prominent crop. Total irrigated acres of alfalfa declined both in BPA’s territory and across the entire Northwest between 2002 and 2012, and by nearly 200,000 acres (28 percent) in BPA territory. During the same time period, the number of BPA alfalfa farms declined by over 1,000 (18 percent). In BPA territory, Washington saw the greatest decline in alfalfa acreage, losing 42 percent between 2002 and 2012, followed by Oregon, which lost 27 percent of its acreage during this period. Montana’s alfalfa production within BPA territory has remained more stable than it has in other states; alfalfa production in Montana’s BPA territory decreasing by only 17 percent from 2002-2012.
0
10
20
30
40
50
60
70
2002 2007 2012
Irri
gate
d A
cres
, 1,0
00's
apples
cherries
pears
sugarbeets
berries
sweet corn

Memorandum — USDA Data Analysis C-14
Figure C-5: Alfalfa and Dominant Grain and Seed Crops by State, BPA Territory
Source: Navigant analysis of USDA 2012 Census of Agriculture data
Potatoes
Potatoes demonstrated a trend toward less acreage and more farms during the period from 2002 to 2012. This indicates a move toward smaller potato farms. Trends in potato farming are particularly important due to their association with SIS use. According to interviews conducted by Navigant, potatoes’ high value has made this market among the most common for use of SIS in the region to date.21 Figure C-6 shows trends in both total acreage and number of farms for potatoes in BPA territory by state. As shown, potatoes decreased in acreage by 9 percent in BPA territory and by 16 percent across the Northwest during this period. Interestingly, the number of potato farms increased by 152 percent in BPA and 70 percent in the Northwest overall during this period. The largest increase in potato farms occurred in Washington’s BPA territory.
21 Navigant conducted market actor interviews as part of another component of our work for BPA’s agriculture program. Comprehensive findings from those interviews will be presented in a separate document. However, the dominance of SIS use in potato farming is noted here due to its key significance.
72
136
180
110
52
28
59
90
70
24
4 30
20
40
60
80
100
120
140
160
180
200
Idaho Montana Oregon Washington
Irri
gate
d A
cres
, 1,0
00's
Alfalfa
Wheat
Barley

Memorandum — USDA Data Analysis C-15
Figure C-6: BPA Trends in Potato Acreage and Number of Farms, 2002-2012
Source: Navigant analysis of USDA 2012 Census of Agriculture data
Corn
Corn production within BPA demonstrated considerable growth between 2002 and 2012, which may position this crop as a key target area for BPA’s future program. Growth in the corn market occurred both in terms of acreage and number of farms. This was true in BPA’s territory and across the Northwest. From 2002 to 2012, irrigated acres of corn grew by 70 percent in BPA’s territory and by 73 percent across the entire Northwest. The number of corn farms also increased, by 55 percent in BPA’s territory, and by 32 percent in the Northwest overall. Corn market growth, both irrigated acreage and number of farms, occurred in Washington and Oregon. In contrast, Montana and Idaho saw slight declines in acreage and number of farms. Growth in BPA’s irrigated corn acres reached as high as 70 percent in Washington during this period (see Figure C-7).
Figure C-7: BPA Trends in Corn Acreage and Number of Farms, 2002-2012
Source: Navigant analysis of USDA 2012 Census of Agriculture data
0
20
40
60
80
100
0
200
400
600
800
2002 2007 2012 Irri
gate
d A
cres
, 1.0
00’s
Num
ber
of F
arm
s
ID # Farms MT # Farms OR # Farms WA # Farms
ID Acres MT Acres OR Acres WA Acres
0
20
40
60
80
100
0
100
200
300
400
500
2002 2007 2012
Irri
gage
d A
cres
, 1,0
00's
Num
ber
of F
arm
s
ID # Farms MT # Farms OR # Farms WA # Farms
ID Acres MT Acres OR Acres WA Acres

Memorandum — USDA Data Analysis C-16
Vineyards and Juice Grapes
Washington’s vineyards and juice grapes are important to BPA in that they represent a growing market for a high-value crop and may present a favorable opportunity for investment in efficiency. Vineyards (farms growing grapes exclusively for use in producing wine) and juice grape farms are growing within BPA, with activity concentrated in Washington. Vineyard data are not included in the USDA’s Agricultural Census data, only grape production as a whole (not differentiating among table grapes, and those used for wine and juice production). USDA and NASS have collected data specific to vineyards and other grape crops in Washington in order to provide more detail on the grape market in that state.22 Navigant drew on the most recent vineyard-focused report to inform the analysis discussed in this section, and these findings pertain only to Washington.
As of 2013, grapes were among the top ten crops in Washington by acreage,23 representing over 24 main wine varieties in addition to two types of juice grapes. Washington vineyard acreage has expanded rapidly, nearly quadrupling between 1993 and 2011 from 11,000 acres to over 40,000 acres.
All varieties of wine grapes in Washington have shown substantial increases in acreage during the past two decades. The largest growth periods occurred in the mid-1990s and late 2000s, as shown in Figure C-8. The greatest increase in production has occurred in Cabernet Sauvignon and Merlot varieties; they have increased in acreage over the last 20 years by over 600% and 300%, respectively.
22 Washington Vineyard Acreage Report, 2011, published by the USDA and NASS. 23 USDA CropScape maps, 2013, available at: http://nassgeodata.gmu.edu/CropScape/.

Memorandum — USDA Data Analysis C-17
Figure C-8: Washington Vineyard Trends by Wine Grape Variety
Source: Washington Vineyard Acreage Report, USDA/NASS 2011
BPA’s vineyard production is heavily concentrated in Washington’s Columbia River Basin. The greatest acreage is located in Benton County, followed by Klickitat, Yakima, Franklin and Walla Walla Counties. Benton County contains over 18,000 acres of vineyards, which accounts for nearly 60 percent of all vineyard production in BPA territory within Washington (see Figure C-9). As shown in Figure C-10, white wine grape production is heavily centered in the Yakima Valley, parts of Columbia Valley, and Horse Heaven Hills. While Horse Heaven Hills is the largest producer of red wine grapes, the Columbia Valley, Wahluke Slope, and Yakima Valley are also notable regions of production.
0
2,000
4,000
6,000
8,000
10,000
12,000
1993 1999 2002 2006 2011
Acr
es
Chardonnay Pinot Gris White Riesling
Cabernet Sauvignon Merlot Syrah

Memorandum — USDA Data Analysis C-18
Figure C-9: BPA Vineyard Acreage by Washington Counties, 2011
Source: Washington Vineyard Acreage Report, USDA/NASS 2011
Figure C-10: Vineyard Acreage by Washington Regions, 2011
Source: Washington Vineyard Acreage Report, USDA/NASS 2011
In addition to wine grapes, BPA territory in Washington is also a key producer of grapes for juice, particularly Niagara and Concord grapes. In total, Washington has over 17,000 acres of juice grapes planted, centered in the Columbia River Basin area. Juice grape acreage expansion in the region peaked between 2001 and 2005, and has since leveled off, showing little recent expansion. By contrast, rapid and steady expansion of wine grape acreage suggests that wine grapes will continue to be a key crop for BPA in Washington in the years to come.
0%
10%
20%
30%
40%
50%
60%
70%
Benton Klickitat Yakima Franklin Walla Walla Skamania
% o
f Was
hing
ton
BPA
V
iney
ard
Acr
eage
01,0002,0003,0004,0005,0006,0007,0008,0009,000
Acr
es
White Wine Grapes Red Wine Grapes

Memorandum — USDA Data Analysis C-19
Cash Value by Crop Summary
A review of crop value data reveals that the crops described in interviews as having the highest value and being the most common users of SIS do not hold the highest total value across BPA’s territory. Crop-specific and BPA-specific analysis is not possible for the cash value of crops due to data limitations;24 cash value data is only publicly available at the level of commodity group by state. However, the state level commodity group comparisons provide valuable insight into the importance of different crop groups by state. USDA dollar value data is organized into four commodity groups, listed here in order of the total cash value they represent in the Pacific Northwest (see Figure C-11).
Commodity group 1: Grains, oil seeds, dry beans, and dry peas
Commodity group 2: Fruits, tree nuts, and berries
Commodity group 3: Vegetables, melons, potatoes, and sweet potatoes
Commodity group 4: Nursery, greenhouse, floriculture, and sod
It is not surprising that commodity group 1 holds the top value because grains cover such a large area of BPA territory. This reflects the large concentrations of wheat, alfalfa, and barley acreage in Montana and the Columbia River Basin.
Commodity group 1, which includes grains, dominates in Montana. Commodity groups 1 and 3 (which includes potatoes) both hold relatively high value in Idaho. Commodity group 2 (which includes fruits) dominates in Washington. By contrast, Oregon displays more even distribution in terms of each commodity group’s contribution to the total cash value of sales.
24 Total cash value of production is only available through the USDA Agriculture Census for commodity groups at the state level. Because our BPA-specific analysis is based on weighting county observations for BPA and then aggregating to the state level, we cannot apply this method to the cash value data. Moreover, cash value data is not available for individual crops, but rather for crop commodity groups.

Memorandum — USDA Data Analysis C-20
Figure C-11: 2012 Cash Value of Commodity Groups by State25
Source: Navigant analysis of USDA 2012 Census of Agriculture data
Dairy Findings Most of the dairy cattle in the Northwest were situated outside of BPA’s service territory in 2012. Within BPA territory the majority of dairy cattle were located in Washington and Oregon in 2012. This differs from the Northwest overall, in which Idaho claimed the greatest number of dairy cattle (Figure C-12).
25 Cash value of total sales is only available at the commodity group level by state, not at the level of individual crops or by county. As a result, BPA-specific data cannot be represented.
0
500
1,000
1,500
2,000
2,500
3,000
3,500
Idaho Montana Oregon Washington
Tota
l Ann
ual $
Sal
es, 1
,000
’s
Fruits, tree nuts, and berries
Grains,oilseeds, dry beans, and dry peas
Nursery, greenhouse, floriculture, and sod
Vegetables, melons, potatoes, and sweet potatoes

Memorandum — USDA Data Analysis C-21
Figure C-12: 2012 Head of Dairy Cattle in BPA and Northwest
Source: Navigant analysis of USDA 2012 Census of Agriculture data
BPA’s dairy industry appears to be growing at a rate faster than the Northwest as a whole. As shown in Table C-3, from 2002 to 2012, the number of dairy cattle increased in all states except Montana. In those states seeing growth, the increase was more pronounced within BPA territory than for the region as a whole. In Montana the number of dairy cattle decreased by 25 percent in BPA’s territory and by 35 percent for the region as a whole between 2002 and 2012.
Table C-3: Percent Increase in Head of Dairy Cattle, 2002-2012
Territory Idaho Montana Oregon Washington
BPA 80% -25% 68% 23%
Entire Northwest
48% -35% 34% 5%
Source: Navigant analysis of USDA 2012 Census of Agriculture data
Evidence points to consolidation in the dairy industry both within BPA and the Northwest. Although the number of dairy cattle increased from 2002 to 2012, the total number of farms with milk cattle declined during this time period by an average rate of 24 percent in BPA’s territory and 29 percent in the Northwest overall. This indicates that while the dairy market was growing, it became concentrated into fewer farms. Figure C-13 highlights the trend in number of dairy cattle in BPA’s territory and the Northwest, while Figure C-14 illustrates trends in the number of dairy farms in BPA and the Northwest as a whole.
0
100
200
300
400
500
600
700
Idaho Montana Oregon Washington
Hea
ds o
f Milk
Cow
s, 1
000'
s
BPA Territory All Territories

Memorandum — USDA Data Analysis C-22
Figure C-13: Three-Year Trend in Head of Dairy Cattle by State
Source: Navigant analysis of USDA 2012 Census of Agriculture data
Figure C-14: Three-Year Trend in Dairy Farms by State
Source: Navigant analysis of USDA 2012 Census of Agriculture data
Beef Findings Beef farms both in BPA and the Northwest as a whole trended towards smaller farms with fewer cattle between 2002 and 2012. During this period the numbers of cattle farms in BPA and the Northwest were stable, declining only slightly by 3 and 5 percent, respectively (see Figure C-16). However, the total
0
100
200
300
400
500
600
700
2002 2007 2012
Hea
ds o
f Dai
ry C
attl
e, 1
,000
's
Idaho - BPA Montana - BPA Oregon - BPA Washington - BPA
Idaho - NW Montana - NW Oregon - NW Washington- NW
0
200
400
600
800
1,000
1,200
1,400
2002 2007 2012
Num
ber
of F
arm
s
Idaho - BPA Montana - BPA Oregon - BPA Washington - BPA
Idaho - NW Montana - NW Oregon - NW Washington - NW

Memorandum — USDA Data Analysis C-23
number of cattle declined more significantly; BPA saw a 10 percent decline while the Northwest as a whole saw a 14 percent decline.
Montana represents the greatest difference between the beef market in BPA territory and that of the region as a whole, as shown in Figure C-15. While Montana comprises 50 percent of the Northwest’s beef market as a whole, the share of Montana beef production within BPA territory accounts for only 28 percent of the BPA market.
Oregon held BPA’s highest concentration of beef cattle in 2012, with Montana a close second. Beef production remains stable in Oregon. However, the beef market in Montana appears to be in moderate decline, based on a downward trend seen in the number of beef cattle in this state, both within BPA territory and for the state as a whole (see Figure C-15).
One market actor identified beef farms as a potential market for SIS. This individual indicated that it is becoming more common for beef farmers to irrigate grazing pastureland and that, in fact some beef farms use SIS.26 Other energy end uses at beef farms include feedlot lighting, ventilation, exhaust and circulation systems for beef production during periods when the cattle are in confined spaces.27 An assessment of the energy intensity of the beef industry was outside the scope of this analysis; BPA may consider this as an area for additional study.
Each beef farm in Montana may represent a more substantial energy savings opportunity, on average, than beef farms in the other states, because more animals reside on Montana’s beef farms than in other states. BPA’s Montana beef farms house an average of 84 animals per farm, compared with 18 per farm in Washington’s BPA territory. This means that outreach to beef farmers may be best targeted to beef farmers in Montana.
26 A recent trade publication published an article supporting this claim. In the article, interviewed beef ranchers suggested that irrigating their beef grazing pastures with center pivot systems lengthened the grazing season, increasing beef yield and profitability, while requiring fewer acres. Source: Sorenson, Loretta “Cattle Graze under Center Pivots: Cattle grazing pasture irrigated with center pivots lets this Nebraska rancher grow more beef.” Beef. July, 2011. 27 An academic paper suggests that while most energy consumption in beef production comes from feed and feed transport, 11% comes from “direct” sources such as ventilation and circulation systems and lighting. Source: Veermae, J. et al., 2012, “Energy Consumption in Animal Production,” Estonian University of Life Sciences,

Memorandum — USDA Data Analysis C-24
Figure C-15: Head of Beef Cattle in BPA and Northwest
Source: Navigant analysis of USDA 2012 Census of Agriculture data
Figure C-16: Number of Beef Farms in BPA and Northwest
Source: Navigant analysis of USDA 2012 Census of Agriculture data
0
200
400
600
800
1,000
1,200
1,400
2002 2007 2012
Hea
ds o
f Dai
rly
Catt
le, 1
000'
s
Idaho - BPA Montana - BPA Oregon - BPA Washington - BPA
Idaho - NW Montana - NW Oregon - NW Washington - NW
0
2,000
4,000
6,000
8,000
10,000
12,000
14,000
2002 2007 2012
Num
ber
of F
arm
s
Idaho - BPA Montana - BPA Oregon - BPA Washington - BPA
Idaho - NW Montana NW Oregon - NW Washington - NW

Memorandum — USDA Data Analysis C-25
Greenhouse Findings As shown in Figure C-17 and Figure C-18, greenhouse activity is greatest in Oregon and Washington, both in terms of square footage and number of greenhouses. This holds true for BPA territory and for the Northwest as a whole. In 2012, Washington represented the largest greenhouse market in the Northwest, with 50 percent of the greenhouses in BPA’s service territory and 44 percent of the greenhouses in the Northwest overall.
The number of greenhouses has steadily increased in the Northwest, despite an overall decrease in square footage. This points to a trend toward less concentration of the greenhouse market, with smaller greenhouse operations increasing in number. As shown in Figure C-17, the number of greenhouses has grown rapidly in all four states during the last decade, particularly between 2007 and 2012. Overall, the number of greenhouses across the Northwest increased by 73 percent between 2002 and 2012. Growth in the number of greenhouses was slightly more modest within BPA territory. Montana has seen the greatest amount of growth within BPA territory, with a 190 percent growth rate over this same period (see Figure C-18). In terms of greenhouse square footage, BPA territory saw an 11 percent decline between 2002 and 2012, but this was entirely due to Oregon. The total square footage of Oregon greenhouses in BPA decreased by 60 percent from 2002 to 2007, followed by a modest rebound from 2007 to 2012 (Figure C-18).
Figure C-17: Number of Greenhouses in BPA and Northwest
Source: Navigant analysis of USDA 2012 Census of Agriculture data
0
50
100
150
200
250
300
350
400
2002 2007 2012
Num
ber
of G
reen
hous
es
Idaho - BPA Montana - BPA Oregon - BPA Washington - BPA
Idaho - NW Montana - NW Oregon - NW Washington - NW

Memorandum — USDA Data Analysis C-26
Figure C-18: Greenhouse Square Footage in BPA
Source: Navigant analysis of USDA 2012 Census of Agriculture data
Conclusions A great deal of untapped potential for energy savings from irrigation-related efficiency measures may remain in BPA territory. The crops covering the greatest amount of irrigated acreage in BPA’s territory (i.e., alfalfa and wheat) are not the crops most commonly associated with SIS use.28 These crops may benefit from SIS and other irrigation efficiency measures. However, interview findings indicate that these crops do not currently receive a great deal of attention when it comes to investments in irrigation efficiency.
The Columbia River Basin region may still hold great potential for program savings based on its large volume and high value of agricultural activity. This is true despite the fact that market actor interviews suggest that SIS usage is already relatively high among certain crops grown within the Columbia River Basin (e.g., potatoes and specialty crops).
Navigant’s analysis also shows that northwestern Montana may hold potential for future energy savings due to the volume of grain crops produced in that area. To date, this area has been active in BPA’s agricultural programs in general, but has not participated in BPA’s SIS programs. BPA may benefit from investigating the baseline practices in the region and whether the length of the growing season will impact the cost-effectiveness of irrigation efficiency measures.
Potential for BPA program savings may exist in the dairy and greenhouse sectors, both of which are either steady or growing within BPA territory. The majority of BPA’s dairy market activity occurs in Washington and Oregon. Much of the potential savings in the dairy sector likely exists in the form of irrigation efficiency in the fields upon which dairy cattle graze. Dairy processing facilities represent another area of opportunity (e.g., refrigeration, pumps, motors, and lighting), though efficiency improvements at those
28 As detailed previously, national level data indicate that all three crops, when irrigated, tend to be pressure irrigated. However, the maps used to identify acreage of these crops within BPA’s territory in Montana do not distinguish between irrigated vs. non-irrigated acreage. Also, Navigant does not have information upon which to base an assessment of which crops are most closely associated with hardware-related irrigation efficiency activity (i.e., that which extends beyond SIS). However, SIS may serve as an indicator of familiarity with technology-based irrigation practices and may also be associated with other types of irrigation efficiency measures.
0
100
200
300
400
500
600
700
800
2002 2007 2012
Squa
re F
eet,
1,00
0's
Idaho Montana Oregon Washington

Memorandum — USDA Data Analysis C-27
facilities may fall within the scope of BPA’s industrial program. Greenhouses in BPA territory are most numerous in Washington and Oregon, and a number of efficiency opportunities exist at these facilities (e.g., improvements in irrigation, air handling, temperature, and humidity controls).

Memorandum — USDA Data Analysis C-28
Appendix C1 Figure C-19 provides a detailed view and information on agriculture in the Columbia River Basin.
Figure C-19: Agricultural Activity in the Columbia River Basin and BPA
Sources: United States Department of Agriculture (USDA), Census of Agriculture, 2012; USDA CropScape maps, 2013; Bonneville Power Administration (BPA) agriculture energy efficiency program participation data (2010-2011); Ventyx Geographic Information System (GIS) utility boundary data

Memorandum — USDA Data Analysis C-29
Appendix C2 Figure C-20 provides a detailed view and information on agriculture in northwestern Montana.
Figure C-20: Agricultural Activity in Northwestern Montana and BPA
Sources: United States Department of Agriculture (USDA), Census of Agriculture, 2012; USDA CropScape maps, 2013; Bonneville Power Administration (BPA) agriculture energy efficiency program participation data (2010-2011); Ventyx Geographic Information System (GIS) utility boundary data

Memorandum — USDA Data Analysis C-30
Appendix C3 Table C-4 provides a high level summary of key findings.
Table C-4: Summary of Data Analysis Key Findings
Primary Activity in NW
Split between BPA and non-
BPA Outside BPA Inside BPA Outside BPA
Primary Activity in BPA
Washington and Montana
Oregon and Washington
Montana Oregon and Washington
Market Size Not
Generalizable Expanding Declining Uncertain
Size of Operations Not
Generalizable Growing Stable Decreasing
Source: Navigant analysis of USDA 2012 Census of Agriculture data

Memorandum — USDA Data Analysis C-31
Appendix C4 Figure C-21 to Figure C-24 depicting irrigated acreage by state for BPA territory.
Figure C-21: Idaho: Total Irrigated Acres by Crop, BPA Territory
Source: Navigant analysis of USDA 2012 Census of Agriculture data
Figure C-22: Montana: Total Irrigated Acres by Crop, BPA Territory
Source: Navigant analysis of USDA 2012 Census of Agriculture data
72
52
70
32
8
0 0
11
0 0 00
10
20
30
40
50
60
70
80
Irri
gate
d A
cres
, 1,0
00's
alfalfa hay
wheat
barley
potatoes
corn
sweet corn
apples
sugarbeets
pears
berries
cherries
136
28 24
2 1 0 0 0 0 0 00
20
40
60
80
100
120
140
160
Irri
gate
d A
cres
, 1,0
00's
alfalfa hay
wheat
barley
potatoes
corn
sweet corn
apples
sugarbeets
pears
berries
cherries

Memorandum — USDA Data Analysis C-32
Figure C-23: Oregon: Total Irrigated Acres by Crop, BPA Territory
Source: Navigant analysis of USDA 2012 Census of Agriculture data
Figure C-24: Washington: Total Irrigated Acres by Crop, BPA Territory
Source: Navigant analysis of USDA 2012 Census of Agriculture data
180
59
422
31
112 2 4 5 0
0
20
40
60
80
100
120
140
160
180
200
Irri
gate
d A
cres
, 1,0
00's
alfalfa hay
wheat
barley
potatoes
corn
sweet corn
apples
sugarbeets
pears
berries
cherries
110
90
3
84 86
57
75
09 6
10
20
40
60
80
100
120
Irri
gate
d A
cres
, 1,0
00's
alfalfa hay
wheat
barley
potatoes
corn
sweet corn
apples
sugarbeets
pears
berries
cherries

Memorandum — Irrigation Trade Show Findings D-1
Appendix D: Memorandum — Irrigation Trade Show Findings To: Bonnie Watson, BPA
From: Nicole DelSasso, Beth Davis, Navigant Consulting, Inc.
Date: September 8, 2016
Subject: Irrigation Trade Show Findings Memo
The Bonneville Power Administration (BPA) tasked the Navigant team (the research team) with characterizing the irrigation market in coordination with the Agricultural Market Study (Task Order 19). This is the second phase of BPA’s agricultural research work, of which occurred in Task Order 7.
As part of this effort, members of the research team attended the 2015 Irrigation Show to speak with irrigation equipment manufacturers and learn about new technologies that may provide future program opportunities. The research team collaborated with BPA staff to complete 11 in-person interviews with sprinkler equipment, pivot equipment, and agricultural controls manufacturers in the region. The research team plans to conduct additional telephone interviews with a wider range of market actors to get a more complete picture of the irrigation market. This memo discusses the findings from the 11 manufacturing interviews as well as how these findings will aid the research team in conducting 20 additional market actor interviews.
Goals of Attending the Irrigation Show The research team attended the 2015 Irrigation Show with specific goals in mind. These included the following:
Understanding the irrigation supply chain in the Pacific Northwest—including key market actors and the product flow of irrigation equipment in the region
Identifying new technologies and trends impacting the irrigation market
Distinguishing between manufacturer market niches to enable effective comparison of data points for the Chain Logic Method for calculating Momentum Savings
Gaining information that will provide for more sensible and meaningful market actor interviews, including:

Memorandum — Irrigation Trade Show Findings D-2
o Networking to gain candidates for the 20 additional market actor interviews including four sales data contributors
o Ensuring the sample frame for the additional market actor interviews fully represents the Northwest agricultural market
In-Person Interviews The research team and BPA staff conducted 11 interviews with regional manufacturers (sprinklers, pivots, and controls) at the 2015 Irrigation Show to gain insight into the irrigation market. Each interview lasted 15 to 45 minutes and covered topics such as market share, market trends, and specifics on the irrigation equipment supply chain.
Market Findings This section describes the market findings gathered from the 11 interviews at the 2015 Irrigation Show. Findings include the key market actors in the agricultural supply chain and the market share held by each one.
Key Market Actors in the Supply Chain The research team used the supply chain diagram developed as part of the TO7 Agricultural Market Study (Figure D-25) to facilitate conversations about the flow of products from manufacturers to irrigators. The research team showed the supply chain diagram to each interviewee and, using a whiteboard, asked the interviewee whether the diagram was an accurate representation of the market. The research team also asked manufacturers the following:
What percentage of your products do you sell in the Pacific Northwest?
What fraction of your products move through each of the sales channels depicted on the diagram?
Do you ever sell directly to irrigators?
o How often?
Do you sell sprinkler hardware and the irrigation system together as a package?
o How often?
Who is installing the equipment?
What is your role in the sales process of equipment to irrigators?
o Do irrigators hire your services independently, or do dealers include your services in their sale to the irrigator?
What is your bestselling product?

Memorandum — Irrigation Trade Show Findings D-3
Figure D-25: Initial Irrigation Efficiency Supply Chain
Source: BPA Agriculture Market Study Phase 1 conducted by Navigant Consulting, Inc.

Memorandum — Irrigation Trade Show Findings D-4
Conversations with manufacturers provided the research team with increased knowledge of center pivot irrigation systems, sprinkler hardware, and irrigation system controls. Three main findings emerged from these discussions:
All products flow to irrigators through pivot and sprinkler dealers.
New Pivot Systems:
o Sell. Pivot dealers take custom orders from irrigators for new pivots.
o Order. Dealers then request custom orders from pivot manufacturers. Custom orders may be for the pivot only, or they can also include sprinklers and controls for the pivot.
o Build. Pivot manufacturers build the pivot in-house; they use sprinklers from the sprinkler manufacturers if dealers have ordered a complete system package.
o Deliver. Pivot manufacturers ship all system components (including controls) to the dealer or irrigator.
Existing Pivot Systems:
o Sell. Sprinkler dealers take custom orders from irrigators for existing pivots.
o Order. Dealers request sprinklers from the sprinkler manufacturers.
o Deliver. Sprinkler equipment for existing center pivots and lateral move systems flow from the manufacturer to the sprinkler dealer.

Memorandum — Irrigation Trade Show Findings D-5
Themes in the Irrigation Market The research team identified a number of major themes regarding the current state of the irrigation market in the Northwest. This section describes each theme and its impact on this study.
LEPA and LESA Have Been Around for More than 20 Years, but Not Widely Applied LEPA and LESA are two types of sprinkler applications that are more prevalent in the United States than BPA originally thought. These systems can reduce wind drift and evaporation losses by nearly 15%29 and may offer even greater energy and water savings in desert and windy climates. LEPA and LESA definitions were inconsistent among respondents at the Irrigation Show, but the research team has seen various studies that define LESA as 18” to 20” off the ground using a spray head and LEPA as 18” to 20” off the ground using a bubbler nozzle or on the ground with a drag sock.
One presentation at the Irrigation Show indicated that LESA and LEPA have been around for more than 20 years. However, one pivot manufacturer indicated that only about 2% of their center pivot packages include the design and spacing needed for LESA or LEPA. Another pivot manufacturer indicated that they build LEPA and LESA spacing on the pivots they manufacture, but the drop tube spacing is custom and makes up only about 1% to 2% of sales. 30 A third pivot manufacturer noted that education around sprinkler spacing for LESA and LEPA is an area for improvement.
LESA and LEPA have the potential to save energy and water. There is a strong incentive for adopting LEPA/LESA in Idaho because of a recent surface water court case in the Snake River plain that requires surface water irrigators to reduce water use by roughly 10%. This technology is a simple way to meet the policy reduction without affecting irrigators’ crop production. LEPA/LESA also helps reduce energy use when it is most necessary, during the hot summer months of July and August when irrigation water demands are the greatest and electricity demands for air conditioning are at their peak. LEPA/LESA reduces water and power use during these high use periods, while other methods that can save significant water, primarily save water in the spring and the fall when there are few water or power shortages.
For this reason, the research team is interested in learning about the impact that dealers have on purchasing decisions, and whether LESA and LEPA are part of dealer marketing strategies to irrigators. Additional research in this area will shed light on whether dealers need more education on the energy benefits of LESA and LEPA and whether BPA should explore a future program opportunity for LESA and LEPA.31
29 Freddie Lamm, “Concepts of In-Canopy and Near-Canopy Sprinkler Irrigation,” May 2006, http://www.researchgate.net/publication/242089279_concepts_of_in-canopy_and_near-canopy_sprinkler_irrigation. 30 Pivots made with shorter drop-tube spacing is not necessary to implement LEPA/LESA. Pivots can be retrofitted using a double gooseneck and truss rod hose clamps. This configuration has benefits for increased infiltration. 31 BPA, in conjunction with Washington State University (WSU) and University of Idaho (UI), is conducting a demonstration pilot that will assess the viability and suitability of LEPA/LESA irrigation technology for broader deployment in the Northwest.

Memorandum — Irrigation Trade Show Findings D-6
Nobody Is Talking About Wheel and Hand Lines Manufacturers mentioned experiencing a low volume of sales for wheel and hand lines over the past few years. This information is helpful to keep in mind when thinking about the existing market for wheel and hand lines and the conversion from these systems to pivots or other irrigation systems.
Many companies manufacture brass impact sprinklers typically used in wheel and hand line applications outside the United States to save on manufacturing costs. Farmers generally like to purchase products made in America, so brass sprinkler sales have decreased over the years. Additionally, thieves often steal brass sprinklers, so although farmers still like brass compared to plastic, many farmers have switched to plastic impact sprinklers for their wheel and hand line systems.
Variable Rate Irrigation Is a High Focus Manufacturers spoke about variable rate irrigation (VRI) as a precision irrigation practice trend. VRI technology works by applying water at a variable rate along the center pivot rather than one uniform rate along the entire length of the system. VRI uses global positioning system (GPS) and geographic information system (GIS) technology to prescribe a specific amount of water to certain areas of the field. VRI can apply little to no water to certain nozzles and as much as 200% of the normal application rate to other nozzles by opening and closing individual nozzles.
There is excitement around VRI, but it is likely due to its ability to increase crop yield rather than its energy savings potential. In fact, VRI might not actually save energy if the irrigator was using less water before switching to VRI technology. Manufacturers are particularly interested in the technology’s ability to increase crop yield. Energy and water savings from the use of VRI are highly dependent upon the amount of water used before transitioning to VRI. Irrigators who were under-watering before transitioning to VRI could actually increase their water use after transitioning. VRI enables irrigators to focus water application exactly where it is needed and ensure crops get a more accurate watering based on topography information, soil data maps, yield data, and other user-defined information. This practice has the potential to reduce wasted water, but the industry needs further studies completed before making any such claims.32
The research team also heard mixed use of the terms VRI and variable speed irrigation (VSI). Note that VSI is also a type of precision irrigation, though it is used to change the pivot speed and the rate that water is applied from each sprinkler does not change. This misuse of terminology may mean that there is opportunity for education around VRI and VSI technologies. The research team will explore this opportunity in more depth during the hour-long interviews with dealers.
32 Simulation studies have demonstrated water savings, primarily in humid climates and using irrigation management strategies that leave space in the field to take advantage of more frequent and significant rainfall events. These studies show savings when VRI limits irrigation to areas of the field that contain crops. These savings are directly proportional to the percentage of land that is not irrigated. Simulation studies in dry climates have not shown much water savings due to soil variability.

Memorandum — Irrigation Trade Show Findings D-7
Controls Are Installed on Most New Pivots, but the Level of Control Varies Various control options are available when purchasing a new pivot. These controls vary depending on the needs of the irrigator and the control and pivot manufacturer. Some options include the following:
Controlling the center pivot speed and direction from the pivot point or end tower
Controlling pivot start/stop, direction, application rate and speed, and water pump control
Networking all pivots from a central hub
Managing pivots remotely
Employing mobile platforms for smart phone controls
The hour-long interviews with dealers will explore whether dealers are actively influencing the adoption of controls by irrigators. The interviews will also explore what type of controls are already in use by irrigators versus the new control technologies that irrigators have not yet adopted.
Preliminary Ideas for Program Opportunities The research team identified a number of program opportunities to investigate further. These remain preliminary findings until the study is complete. The research team will present a final list of program opportunities in the final report. This section describes preliminary ideas for program opportunities.
Irrigation System Controls Could Offer an Opportunity for Utility Load Management Sioux Valley Energy in South Dakota operates a load management/demand response program for irrigators. During times of peak electric usage, the load management program helps shift the load peak to times when irrigators are not using as much electricity. By managing these loads, Sioux Valley Energy is potentially able to reduce the costs of wholesale power purchases, which saves money and resources. A load management or demand response program could offer an opportunity to meet the goals outlined in the Northwest Power and Conservation Council’s Seventh Power Plan.
The Sioux Valley Energy program determines when to control and turn off the irrigation system. The systems remain off with no cycling until the peak usage period has passed. Out of the demand response programs at Sioux Valley Energy, irrigation systems are the last type of load to be controlled and the first type of load restored during a control period. A no-cost notification via phone, text, or email is available to any irrigators that want to be notified of an irrigation control event. Irrigation systems may be started automatically after a control event through the load control system.
System Design Could Be the Most Efficient Program Opportunity Just changing sprinklers on an irrigation system may not save energy. Water and energy saving opportunities must take into consideration crop type, soil type, pump, controls, sprinklers, and the irrigation system. Using the same system on different soil may, for instance, increase energy and water use. Similarly, using the same sprinklers on a pivot versus a wheel line will have different effects on water and energy use. There may be an opportunity to incentivize compliance to an efficient system through a

Memorandum — Irrigation Trade Show Findings D-8
recognition and certification program similar to the Leadership in Energy and Environmental Design (LEED) program.
There is also an opportunity to educate irrigators on the benefits of whole system design and how the design affects crop yield and energy and water use. During the hour-long interviews, the research team will further explore whether dealers already are speaking to irrigators about the benefits. Dealers are in a unique position to take on this effort as they are regularly selling irrigation systems, controls, and hardware to irrigators (According to the research teams preliminary findings, irrigators typically replace sprinkler packages every five years). Thus, there is an ongoing opportunity for education and system efficiency upgrades.
BPA Could Leverage Education and Outreach Programs from Other Areas
The Center Pivot Water Conservation Project is a three-year educational project conducted in Nebraska with special emphasis on the Republican River Basin and Platte River Basin upstream of Kearney, Nebraska. The goal of the project is to maximize the benefit of a constrained water supply and to help center pivot irrigators apply water more efficiently. The project is a partnership between the University of Nebraska—Lincoln Extension (UNL), Valmont Irrigation of Valley, Reinke Manufacturing Co. of Deshler, T-L Irrigation Co. of Hastings, Lindsay Corp. of Lindsay, the Nebraska Department of Natural Resources, and the Nebraska Environmental Trust.
This project teaches irrigators to be more efficient in how they use rain and stored soil moisture. Irrigators learn to use pivots to supplement rainwater efficiently. They also learn to properly manage and maintain pivot systems. UNL Extension specialists and educators teach the information, and BPA could benefit from utilizing their existing resources—e.g., their educational materials. Their materials and lesson plans could provide a starting point for irrigator education in the Pacific Northwest. In addition, there may be an opportunity to replicate this project’s partnerships with universities in the Pacific Northwest or by modeling the project’s work with dealers. The research team will look into this as a possible program opportunity.
Conversions from Center Pivots to Drip Lines Could Be an Opportunity Primary reasons to change from center pivots to drip irrigation are yield and quality. For example, a storage onion, or onion that has been bred to keep long after the growing season, does better with water only on the soil and no water applied on the plant. Drip lines, rather than a pivot, would better serve an onion grower. One manufacturer of drip lines is devoting resources to determine how to make drip irrigation more economical for other crops, such as potatoes.33 According to the manufacturer, drip irrigation is currently costly because irrigators reinstall it every year. The company is working to design a drip tube that can last multiple seasons. Although the company’s market share in the Pacific Northwest is currently small, the company is looking to expand. The research team has yet to determine the efficiency benefits of drip over pivot irrigation. However, researchers learned at the Irrigation Show that California
33 The primary limitation to using drip to irrigate potatoes is that irrigators rely on pivots to apply agricultural chemicals that control outbreaks of diseases such as late blight (caused the Irish potato famine). Drip irrigation methods would require irrigators to fly and drop chemicals from the air, or apply them with a ground sprayer. Drip works better from crops like onions. Applying water to onion leaves exacerbates certain pest problems such as thrips.

Memorandum — Irrigation Trade Show Findings D-9
has installed 2.5 of the 3.5 million acres of drip irrigation currently installed in the United States. When considering opportunities with drip irrigation, the research team will look to California for guidance.
The Amount of Irrigation Data Is Growing—what Is Done with It Matters Irrigation controls, weather data applications, and soil moisture monitors offer irrigators an opportunity to irrigate with precision. However, not all irrigators know how to use the data they have on hand. Irrigation consultants are helping farmers understand and use their data to effectively manage their usage and enhance crop yield. There is a lot of data out there now, but it is not centrally managed nor made publicly available. There could be opportunities to capture and utilize the data for efficiency gain.
New Technologies One of the goals of attending the Irrigation Show was to identify new technologies that may have an impact on energy efficiency.
Table D-5 identifies the new technologies the research team identified when walking the trade show floor. Note that the main goal of these technologies is not to save water and energy but to increase crop yield and water application in difficult-to-reach areas. The research team did not identify new technologies specifically used to save water and energy.

Memorandum — Irrigation Trade Show Findings D-10
Table D-5: New Irrigation Technologies
What is the new
technology or equipment
sold?
Who is the manufacturer/ dealer?
How does the equipment get to the farmer/ grower/ irrigator?
Who is the intended
customer? What technology will
it replace?
When did or will it hit the
market?
Does this technology save energy or water?
Irrigate-IQ Precision Irrigation Solution
Trimble Valley dealer
network
Center pivot irrigators; this technology is
new.
2015
The Irrigate-IQ precision irrigation solution enables irrigators to apply the right
amount of water, fertigation, chemigation, or
effluent in precisely the right place while
minimizing nutrient and chemical runoff. Water
savings depend on water application prior to
installing this system.
Pivoting Lateral
Reinke Reinke dealer
network
Irrigators with rectangular fields; these
types of fields are mostly in Europe; this technology replaces center
pivots and is intended to more efficiently irrigate
corners.
Winter 2015/2016
It might, but that is not the intention. Reinke intends
for this technology to more effectively irrigate corners
and increase yield.
Nelson 3030 Series with 3NV nozzle (Note: This technology
won the new product
contest for agriculture at the Irrigation
Show.)
Nelson Nelson dealer
network
Center pivot irrigators; the
hardware fits all existing sprinkler types and turns a
nozzle into a more efficient
one.
June 2015 It might in some cases, but that is not the full intention.
Source: Navigant Consulting, Inc. compilation of 2015 Irrigation Show findings

Memorandum — BPA and Program Staff Interview Findings E-1
Appendix E: Memorandum — BPA and Program Staff Interview Findings To: Bonnie Watson, BPA
From: Jane Hummer, Nicole DelSasso, Kristin Landry, Lorraine Renta, Beth Davis, Navigant
Date: January 12, 2016
Subject: BPA and Program Staff Interview Findings
This memo summarizes the findings of 18 interviews conducted with Bonneville Power Administration (BPA) and utility staff regarding BPA’s agricultural efficiency programs. The Navigant team’s (the research team’s) interview objectives include the following:
Document the program’s current state34
Identify successes in current program design
Explore utility satisfaction with program and current measure offerings
Identify areas of opportunity for the program
The three programs included within the scope of this research project are Irrigation System Upgrades, Scientific Irrigation Scheduling (SIS), and Irrigation Pump Testing and System Analysis.
The research team organized the remainder of this memo as follows:
Methods
Discussion of Findings by Research Topic
o Barriers and Customer Engagement
o Program Design
o Measure Offerings
Conclusions and Next Steps
34 Note that the research team provided a separate memo summarizing findings related to this research objective, entitled The BPA Agricultural Programs’ Theory and Logic.

Memorandum — BPA and Program Staff Interview Findings E-2
Methods The research team conducted interviews with eight BPA staff and 10 utility staff in August and September 2015. BPA provided recommendations on which staff to interview based on utility participation in the agricultural programs.
Three members of the research team conducted the interviews and used NVivo qualitative research software to store, code, and analyze the interview notes.
To provide context for the interviews, the research team also conducted secondary research to inform this effort. The secondary research focused on program documentation, including the program implementation manual, the Northwest Power and Conservation Council’s (the Council’s) Six and Seventh Power Plans, and utility program websites. The research team also conducted a detailed review of the Phase 1 research previously conducted by Navigant (Task Order 7).
Discussion of Findings by Research Topic This section discusses the research findings organized around three main research topics: barriers and customer engagement, program design, and market trends and opportunities.
Barriers and Customer Engagement This section discusses the market barriers that the agricultural programs seek to address and provides insights into the types of customers the program has and has not been successful in engaging to date.
Market Barriers
The agricultural programs need to exist because of a variety of market barriers that prevent irrigators from implementing all possible cost-effective energy efficiency measures on their own.
Several barriers relate to resource availability. Irrigators have limited capital available to spend on new energy-efficient equipment, and they have competing demands on their time, attention, and funds. Similarly, utility program staff have competing demands on their time as most are responsible for energy efficiency programs in all sectors—not solely the agricultural sector. Some utility program staff have additional responsibilities beyond energy efficiency as well.
Other barriers relate to a lack of knowledge and information. Some irrigators lack knowledge of new irrigation technologies and practices, and they may not have good information on their current equipment’s performance. The variety of entities offering incentives and assistance with energy and water efficiency can confuse irrigators. Utilities often lack the technical resources to help irrigators with irrigation efficiency projects.
Lastly, some barriers relate to behavior. Some irrigators, particularly those with more experience, may be reluctant to change equipment or practices that have worked well for them in the past.
BPA’s programs address all of these barriers to varying degrees.

Memorandum — BPA and Program Staff Interview Findings E-3
Customer Engagement
Many interviewees expressed the views that certain program incentives are more applicable to some crop types than others and that decision-making criteria varied significantly across irrigators. Several utilities noted that they were unable to detect any patterns in which irrigators were more or less likely to participate in the programs.
Overall, the programs have more success engaging larger irrigators, particularly potato farmers, because potatoes are a high-value crop and thus irrigators pay careful attention to their equipment. Newer farmers take a more technologically driven approach to irrigation and tend to have more interest in technologies and practices such as SIS. Interviewees noted several crops as more sensitive to irrigation discrepancies; therefore, irrigators of these crops—cherry, carrot seed, and mint—are more willing to engage with the programs. Cherry farmers in particular have shown significant interest in SIS.
The programs have had less success engaging smaller irrigators; irrigators who are leasing their land from other farmers; wheat, alfalfa, and hay farmers; and more experienced farmers who have faith in their own ability to figure out when to irrigate and how much. One interviewee noted that tree fruit farmers were harder to engage but speculated that it may be because they are typically smaller acreage farms that may not be receiving the same amount of attention from the program as larger farms. The programs have also sometimes struggled to engage irrigators in more remote locations where it is harder to provide in-person outreach and technical support.
Program Design This section presents findings relevant to the current program design, including utility satisfaction with the program, what is working well with the program, and some areas for improvement.
Utility Satisfaction
Most utility interviewees expressed a high level of satisfaction with the BPA program offerings. When asked to rate their satisfaction on a scale of 0-10, four interviewees rated it as an 8 and one rated it as a 9. Just four utilities rated their satisfaction as a 4, 5, or 6, and no utilities rated their satisfaction under 4 (Figure E-26).

Memorandum — BPA and Program Staff Interview Findings E-4
Figure E-26: Utility Satisfaction with Current Programs
Note: One interviewee was unable to provide a rating. Source: Navigant analysis
The interviewees with lower satisfaction were careful to note that their rating had nothing to do with BPA staff and the efforts that they make. Their lower satisfaction was due to a sense that the irrigators do not find BPA’s measure opportunities enticing enough for their programs to be well subscribed. One interviewee said:
“Well, in terms of…how hard [BPA staff] try to get new stuff out there, I would rate it 10. But in terms of how effective it is, as far as having something available, you know, more like a four or five, but that has to do with the acceptance of stuff…”
Utility interviewees who rated their satisfaction with the program more highly also shared the concern that the measures were not appealing enough to irrigators, or that BPA’s messages were not convincing irrigators of the measures’ value.
What Is Working Well in Program Design
Most utilities had many positive things to say about the current program design and the measures offered. The deemed measures, particularly for sprinkler hardware, were described as easy to work with and turnkey from the perspective of the irrigators. Most utilities had generally positive reviews of the Implementation Manual as a resource for running their programs.
Utility interviewees had glowingly positive views of their relationships with BPA staff, including technical, outreach, and contracting staff. Nearly all interviewees (at both BPA and the utilities) emphasized the importance of the agricultural program specialists (APSs) in the programs’ successes. Utility interviewees credited the APSs with relieving some of the time pressure they are under, supplementing their technical knowledge, and helping them “speak the language” of the irrigators. The utilities also relied heavily on the technical support provided by BPA’s engineering staff.
Some utilities expressed appreciation that the programs improve utility relationships with agricultural customers by offering a means for them to engage with and serve this important part of their communities. They especially appreciate BPA’s willingness to pursue emerging technologies in this sector because it helps them look good to their agricultural customers and have something new and valuable to offer them.
0
1
2
3
4
5
0 1 2 3 4 5 6 7 8 9 10
Num
ber o
f Int
ervi
ewee
s
Satisfaction (0-10 Rating)

Memorandum — BPA and Program Staff Interview Findings E-5
Several utilities praised the current design of the SIS program, particularly the SIS reporting:
“The reporting is good if not outstanding, and the irrigators that use it like it.”
Opportunities for Improvement in Program Design
Several utilities expressed a desire to see improved consistency in measure eligibility and incentive calculation processes from year to year and across the different entities that offer incentives (both BPA and non-BPA programs). On a similar note, some utilities would like to see certain measures move from custom to prescriptive status (e.g., variable frequency drives (VFDs) for centrifugal pumps).
Both BPA and utility interviewees are eager to see more clarity on SIS and Low Elevation Spray Application (LESA) savings estimates, cost-effectiveness, and the future of these measures. Several utilities expressed the opinion that it is important for BPA to achieve more market penetration of SIS. One utility interviewee felt strongly that BPA should have more faith in its own studies and put less emphasis on what the Regional Technical Forum (RTF) has to say about SIS’s savings:
“SIS is an example where the RTF was not satisfied with the studies that were done, so they just cut the energy savings in half until they have more confidence in the sampling data. Well, BPA accepted that. They are not required to accept RTF decisions or the analysis that they conduct… I'd change the way BPA makes those decisions and make it less based on what the RTF designates and more based on the results BPA sees from the projects that they do in the program.”
Several BPA and utility interviewees indicated a need for increased engagement with vendors, although there are conflicting opinions on what type of engagement. Some BPA staff expressed interest in testing out a midstream approach in which the vendors or other market actors would play an active role in the program and receive an incentive for their participation, but one utility voiced a strong distaste for that approach because they would lose that program touchpoint with their agricultural customers. Another utility interviewee believes that irrigation vendors are perhaps the best way to engage agricultural customers in the program and wonders how much (if any) education vendors are receiving on the program opportunities.
Another area for improvement is better alignment of BPA’s reporting schedule and the growing season. Utilities have to report savings to BPA before the end of the growing season, meaning they either have to submit incomplete data (resulting in a lower incentive than the irrigator expects) or they have to ask the irrigator to wait a full year to receive their full incentive and potentially incur additional costs. One utility interviewee expressed frustration with this misalignment:
“Irrigation season normally runs mostly through September/first two weeks of October. Those farmers have probes in the ground. We are required to submit everything at rate period end – Sep. 30. So we’re not accurately gathering all of the information and savings and the benefit of the entire season for a farmer. We’re cutting a month off because we have to report to BPA – it would be a benefit if we could collect data until Sep. 30th and report to BPA by October 15th. Our farmers go “Wait, I’m paying for this service, and the minute the contractor comes out, he pulls his stuff, unless I’m willing to pay for him to come back again.” It’s frustrating that BPA puts that deadline on us.”

Memorandum — BPA and Program Staff Interview Findings E-6
Measure Offerings This section presents some changes that BPA and utility program staff interviewees thought BPA may want to consider regarding current measures as well as new measures that BPA could add to the programs. Note that the findings presented in this section represent the views of the interviewees only and do not reflect any conclusions drawn by the research team. The research team will consider these findings in context with other research and future interviewees with manufacturers, dealers, and consultants before making any possible recommendations on changes to BPA measure offerings.
Interviewees’ Views on Current Measure Offerings
The interviewees answered questions about measures currently included in programs that they thought need more program support and measures agricultural customers are likely to adopt without additional program support (Figure E-27). In some cases, a measure appeared on some interviewees’ lists of “needs more program support” and on others’ lists of “needs less program support,” indicating mixed opinions on the necessity to continue program support. Most commonly, interviewees feel that SIS and LESA need continued program support; several interviewees expressed concern that SIS incentives would go away.
Figure E-27: Measures that Need More or Less Program Support
Note: Red text indicates a measure that some interviewees thought required additional program support and others thought that irrigators would continue to adopt without the program. The number in parentheses indicates the number of interviewees who mentioned the measure. Source: Navigant analysis
Other Measures Discussed by Interviewees
When asked if there are gaps in BPA’s offerings, most interviewees could not think of measures they would like to offer that are not currently included in the programs. Some utility interviewees noted that they count on BPA to identify these opportunities for them and to educate them on new technologies. Note, however, that several interviewees talked about LESA throughout the interviews as if they expect it to be incented in the future, indicating that they do view the current lack of incentives for LESA as a gap that should be filled.
Several interviewees noted that there are gaps in the incentives for irrigation controls, which they noted may represent a substantial program opportunity that would be appealing to irrigators. Although related to the SIS measure, the programs have not kept pace with the recent, rapid development of smartphone controls, sensors, and other smart technologies. Several interviewees noted that the labor savings might
Current Measures that Could Benefit from More Program Support
•SIS (4)•LESA (3)•Controls•Custom projects•Pump tests•VFDs•All measures
Current Measures that May Not Require Additional Support
•VFDs (2)•Drip irrigation•LESA•Sprinklers•"Most measures"

Memorandum — BPA and Program Staff Interview Findings E-7
be more compelling than the energy/water savings resulting from these measures. One utility interviewee described the opportunity as follows:
“There’s a lot of wireless control systems that have come into place. [A manufacturer]… builds a wireless control system that allows you to control irrigation zones and not have to build the hardwired infrastructure… It makes it so much more affordable and so much more likely that someone would try this and I can see that in the really heavily irrigated areas that do not use mechanized irrigation like solid soils or orchard operation, the vineyard operation, the ability to do this, and the savings comes back from irrigation zone management. And being able to do this more automated and even basically from your computer like in your office. And this technology is available now, it's mainstreamed, it's not test.”
One interviewee specifically wanted VFDs for centrifugal pumps to become a prescriptive measure rather than a custom measure. This interviewee noted that BPA cites lack of data as the reason why the measure has not been added to the implementation manual, but the lack of data may be due to the relatively few custom projects that are completed.
One interviewee identified canal water pump stations as an additional measure opportunity:
“We have some deep well irrigators who may have the opportunity to get the Columbia River water and they can take off their deep wells and have canal water pump stations instead of bringing water up 1,000 ft. with an 800hp pump. They would put the pump station to pump it out of a pond and only need 125hp pump – huge savings. It’s going to be interesting to see how they adapt to that and if by doing that they can diversify or lease to potato farmers. The one problem you have with the deep wells is that some of these wells are drying up, so now they’re not getting as many gallons per minute as they had before. With a canal, you can pump it for far less and you can have all the water you need. That might help them diversify more with the crop rotations and may allow them to lease their ground and help their bottom line. That project is going to dictate what their needs are going to be.”
Some BPA staff mentioned the possibility of doing a demonstration of variable rate irrigation or precision irrigation. The utility interviewees did not discuss this opportunity, but as mentioned above, many felt that their technical understanding of the irrigation market was lacking and they count on BPA to make them aware of these types of opportunities.
One of the BPA interviewees expressed a desire to have the APSs more involved in the emerging technology side of the program, since the APSs have on-the-ground exposure to the irrigators’ needs as well as experiences with different types of technology.
Conclusions and Next Steps The BPA and utility program staff interviews provided insights into the programs’ design and market opportunities as documented in this memo. Next, the research team will be interviewing irrigation manufacturers, dealers, and consultants (collectively referred to as market actors). These market actor interviews will provide even deeper insights into market opportunities for irrigation efficiency, improve BPA’s understanding of current market practices, and support the analysis of Momentum Savings from center pivot irrigation hardware. The research team will revisit the results of the program staff interviews

Memorandum — BPA and Program Staff Interview Findings E-8
when analyzing the results of the market actor interviews to provide a more detailed and integrated summary of market opportunities in the market actor interview findings memo.

Memorandum – The BPA Agricultural Programs’ Theory, Logic, Structure, and Offerings F-1
Appendix F: Memorandum – The BPA Agricultural Programs’ Theory, Logic, Structure, and Offerings To: Bonnie Watson, BPA
From: Jane Hummer, Nicole DelSasso, Beth Davis, Navigant Consulting, Inc.; Ben Barrington, Elizabeth Daykin, Cadeo Group
Date: May, 2016
Subject: Agricultural Program’s Theory, Logic, Structure, and Offerings
Introduction This memo documents the current program theory and logic of the Bonneville Power Administration’s (BPA’s) agricultural programs as they relate to irrigation efficiency. Program theory is a narrative description of a program’s design, while a program logic model is a visual diagram of how program activities logically lead to the achievement of program goals.
This program theory and logic model document covers three BPA programs related to irrigation efficiency:
Irrigation system upgrades
Scientific irrigation scheduling (SIS)
Irrigation pump testing and system analysis
These three programs, from the perspective of end-use customers, operate essentially as a single program with multiple types of rebates available. Thus, this document presents a unified program theory and logic for the overall agricultural irrigation programmatic approach rather than for three separate programs. Some program activities and outcomes, however, are specific to one or two programs rather than all three; this report identifies those nuances within the narrative discussion.

Memorandum – The BPA Agricultural Programs’ Theory, Logic, Structure, and Offerings F-2
Acknowledgements The research team benefited greatly from the review and input provided by many people. We sincerely appreciate the time, attention, and expertise that these professionals provided in support of this report.
The team would like to thank all of the BPA staff participants in the logic model working session held in Walla Walla: Jennifer Eskil, Tom Osborn, Robert Wallace, Boyd Wilson, Linda Bettencourt, Debra Bristow, Ethan Manthey, Bonnie Watson, and Carrie Cobb. That lively discussion provided rich source material for this program theory and logic document, and it would not have been possible without the effort put forth by the participants and our facilitator, Paul Krissel.
Additionally, many of the working session participants as well as other BPA and utility program staff generously offered feedback on the logic model and/or participated in our in-depth interview process, which further enhanced our understanding of the agricultural programs’ current design and opportunities for improvement.
That said, any errors or omissions are the responsibility of the research team.
A Primer on Program Theory and Logic Thorough documentation of a program’s theory and logic has multiple benefits, including the following:
1. It serves as a valuable tool for communication and consensus building by ensuring that evaluators, program staff, program designers, and other stakeholders all share a common understanding of the program’s intent and implementation.
2. It facilitates program improvement by identifying aspects of the program logic that may inhibit the program’s success.
3. It enables effective evaluation planning by creating a framework through which evaluators can systematically identify research questions, metrics, and performance indicators to track over time.
A program theory typically documents the following elements of a program’s design in a narrative form:
Program goals/desired results: The long-term, overarching goals of the program.
Motivating conditions/barriers: The conditions and barriers that currently exist in opposition to the desired results of the program—the reason that the need for the program exists.
Target audience: The people who the program will attempt to reach and convince to take action to help reach the program’s goals—those most capable of contributing to the program’s goals.
Desired actions/behaviors: The actions the program intends the target audience to take to help achieve the program’s goals.
Strategies: The program’s general action plan for reaching the target audience and motivating the target audience to adopt the desired behaviors.
Messages: What the program tells the target audience to convince them that it is worth their while to adopt the desired behaviors.

Memorandum – The BPA Agricultural Programs’ Theory, Logic, Structure, and Offerings F-3
Communication vehicles: The channels through which the messages reach the target audience.
A program logic model presents the intended logic of how program activities lead to the achievement of program goals in a visual diagram. The BPA agricultural programs’ logic model includes the following elements:
Activities: Actions taken by BPA staff or contractors working directly on behalf of BPA to implement agricultural programs.
Results: Direct outputs of the activities within control of BPA (does not require utilities, trade allies, irrigators, or other market actors to take any action to achieve).
Immediate outcomes: Outcomes that should occur if the programs’ activities have their intended effect on the market.
Intermediate outcomes: Outcomes that flow logically from the immediate outcomes; intermediate outcomes typically cannot occur without the immediate outcomes first occurring.
Ultimate outcomes: The overarching goals of the programs—the reason that the programs exist—which should materialize if the programs achieve their intermediate outcomes.
The remainder of the document is organized around the two preceding sets of bullets.
BPA Agricultural Programs’ Theory and Logic This section begins with the methodology and then provides an in-depth discussion of the agricultural programs’ theory and logic.
Methodology The Navigant team (the research team) developed this program theory and logic model document based on the findings from several primary and secondary data collection efforts. In August 2015, the research team held a facilitated working session with BPA staff to identify and articulate the elements of the program logic. The research team then conducted in-depth interviews with 18 BPA and utility program staff and designed a draft program logic model based on the working session and interview findings. Key BPA staff provided feedback on the draft logic model, which informed the research team’s thinking for this document.
Program Theory This section presents the key components of the program theory: program goals, motivating conditions/barriers, target audience and desired actions, and strategies, messages, and communication vehicles.
Program Goals
The primary goal of BPA’s suite of agricultural programs is to achieve the regional targets for energy savings within the agricultural sector. The Northwest Power and Conservation Council’s (the Council’s)

Memorandum – The BPA Agricultural Programs’ Theory, Logic, Structure, and Offerings F-4
estimate of conservation potential drives these targets. A secondary and closely related goal is to assist BPA utilities in helping their agricultural customers save energy.
Motivating Conditions/Barriers
The agricultural programs need to exist because of a variety of market barriers that prevent irrigators from implementing all possible cost-effective energy efficiency measures on their own. According to BPA and utility program staff interviewees, the most significant barriers facing the irrigation efficiency market include the following:
Barriers related to resource availability
o Limited capital available for irrigators to purchase new energy-efficient equipment or implement new practices
o Competing priorities for irrigators’ time, attention, and funds
Barriers related to knowledge and information
o Irrigators’ lack of knowledge of new irrigation technologies and practices
o Irrigators’ lack of knowledge of their irrigation systems’ health and performance
o Confusion in the marketplace with multiple entities offering rebates and assistance
o Utilities’ lack of technical resources to assist irrigators with energy efficiency projects
Barriers related to behavior
o Irrigators’ reluctance to change equipment or practices that have worked for them in the past
BPA’s programs address all of these barriers to varying degrees.
Target Audience and Desired Actions
The primary target audience, from the BPA perspective, is BPA’s utilities with significant agricultural customer bases. Without the utilities’ active participation in the programs, BPA cannot achieve the regional energy savings targets. A secondary, though essential, target audience is the utilities’ end-use customers—i.e., the irrigators themselves.
The desired actions for utilities are to offer and promote BPA’s irrigation efficiency rebates to their customers and to assist their customers in successfully completing efficiency projects. The desired actions for irrigators are to install rebated energy efficiency measures and to implement energy-efficient irrigation practices.
Strategies, Messages, and Communication Vehicles
The programs employ multiple strategies, messages, and communication vehicles to engage their target audiences and address the barriers mentioned above.

Memorandum – The BPA Agricultural Programs’ Theory, Logic, Structure, and Offerings F-5
BPA offers rebates for energy-efficient irrigation equipment and practices through its utilities as a primary strategy to address the barrier of limited capital; they encourage utilities to offer the rebates to their customers by providing marketing and technical assistance. BPA offers rebates on the following irrigation equipment and practices:35
Scientific irrigation scheduling (SIS) Irrigation pump testing and system analysis New flow-controlling type nozzle for impact
sprinklers New rotating-type sprinkler (replacing
impact sprinklers) New gasket for wheel lines or hand lines New low-pressure regulators with pivot
sprinklers New multiple configuration nozzles for low-
pressure pivot sprinklers
New gooseneck elbow for new drop tubes New drop tube for low-pressure pivot New center pivot base boot gasket New multi-trajectory sprays that replace
impact sprinklers New drains for wheel lines, hand lines, or
pivots New hubs for wheel lines Cut and pipe press repair of leaking hand
lines, wheel lines, and portable mainlines Other equipment as part of custom projects
Many of the other strategies BPA employs are designed to encourage the utilities to participate, as the utilities may offer all, some, or none of the agricultural rebates to their customers at their own discretion.
To supplement utilities’ energy efficiency staff, BPA agricultural program specialists (APSs) are available to conduct direct outreach to irrigators at the request of the utilities. The APSs offer technical assistance, share information about the variety of rebates available (including from non-BPA entities), and assist irrigators in completing the rebate application paperwork. Other BPA technical staff also offer technical assistance to utilities as needed, particularly with regard to SIS and custom projects. These strategies address the following barriers: utilities’ lack of technical resources to assist irrigators with energy efficiency projects; competing priorities for irrigators’ time, attention, and funds; and confusion in the marketplace with multiple entities offering rebates and assistance.
BPA also conducts significant outreach to trade allies (e.g., manufacturers, distributors, dealers, etc.) and regional organizations involved in energy and water efficiency. The APSs play a role in this outreach, which helps ensure that BPA’s programs use resources effectively and that irrigators receive information about the variety of rebates and technical resources available to help them (from both BPA and non-BPA entities). This strategy helps to address the barrier of confusion in the marketplace with multiple entities offering rebates.
Additionally, BPA offers marketing collateral and information resources to help promote irrigation efficiency, including an online tool that allows utilities to customize marketing materials. Marketing materials include messages about both the energy/water savings and the non-energy benefits of irrigation efficiency, such as improved crop quality and reduced labor costs. These marketing and outreach efforts address the barriers related to irrigators’ lack of knowledge of irrigation efficiency technologies and utilities’ lack of technical resources.
35 Note that the research team limited this list of measures to the three BPA programs included within the scope of this analysis: irrigation hardware rebates, SIS, and irrigation pump testing and system analysis. BPA also offers agricultural rebates for measures such as variable frequency drives through other programs.

Memorandum – The BPA Agricultural Programs’ Theory, Logic, Structure, and Offerings F-6
BPA encourages utilities to promote and conduct pump tests as a means of engaging irrigators so that they will consider efficiency improvements. Rebates cover half the cost of these pump tests, which can help identify performance deficiencies that hardware upgrades can resolve. This strategy addresses the barrier of irrigators’ lack of knowledge of their irrigation systems’ health and performance.
BPA collaborates with universities and research organizations such as Washington State University to conduct research and demonstration projects to develop new irrigation efficiency measures like SIS and low energy precision application (LEPA) and to inform the program staff’s understanding of market trends. These research projects reduce the uncertainty in energy and water savings from new technologies and practices, which helps to address the barrier of irrigators’ reluctance to change equipment or practices that have worked for them in the past. BPA’s focus on emerging technologies and market research also helps to ensure that the programs remain relevant to the current market and that the program spends its resources where they can have the most benefit.
Program Logic This section discusses the elements of the program logic and presents the visual logic model.
Program Activities and Results
The program activities and their results fit within six main categories, each with a unique logical flow for contributing to meeting the programs’ goals. Program activities and results include only those program components over which BPA program staff are directly in control. If something requires a utility, trade ally, or irrigator to take action, it is an outcome, not an activity. The next section presents program outcomes.
The program activity categories include the following:
1. Marketing support for utilities and trade allies. This category includes the development of marketing collateral, product sheets, mailers, and the online, customizable marketing collateral tool. The tangible results of these activities are the collateral and tools themselves.
2. Outreach and collaboration. This category includes all of the networking, outreach, and collaboration activities that BPA uses to engage utilities, trade allies, and irrigators. One of the major activities within this category is the direct outreach to irrigators that APSs conduct on behalf of utilities. The tangible results of these activities consist of contacts made, outreach events attended, marketing collateral distributed, etc.
3. Technical support for utilities. This category includes BPA’s technical assistance provided to the utilities as well as the assistance provided directly to the irrigators at the request of the utilities. The tangible results of these activities are the technical tools and information made available to the utilities and irrigators to help them pursue efficiency projects. This category of activities is distinct from the outreach activities because it is in response to specific project needs requested from utilities and irrigators, whereas the APS outreach is primarily meant to engage irrigators and proactively identify new project opportunities.
4. Technology pipeline. This category includes all activities relevant to developing and approving new measures for inclusion in BPA’s programs. The tangible results of these activities include the completion of research and demonstration projects.

Memorandum – The BPA Agricultural Programs’ Theory, Logic, Structure, and Offerings F-7
5. Market research and evaluation. This category includes market research and program evaluation activities that contribute to improving BPA’s understanding of the market and its assessment of program effectiveness. The tangible results include research and evaluation reports.
6. Program operations. This final category includes all of the operational activities that keep the agricultural programs functioning, such as planning and budgeting, updating the implementation manual, reviewing project compliance, and processing invoices. The tangible results of these activities consist of annual updates to the implementation manual and the approval and payment of invoices.
Immediate, Intermediate, and Ultimate Outcomes
The following includes the expected immediate outcomes resulting from the programs’ activities:
Utilities proactively market the rebates for irrigation measures and pump tests. BPA encourages the utilities to play an active role in promoting the rebates to their agricultural customers by making it easy for them with marketing and technical assistance.
Utilities conduct pump tests for irrigators; irrigators better understand their systems’ health. Pump tests offer irrigators insight into their systems’ performance, which can aid the programs in persuading the irrigators to adopt efficiency improvements.
Utilities, irrigators, and trade allies increase their awareness of energy savings opportunities, non-energy benefits, and rebate programs (including BPA’s and others). Irrigators are more likely to adopt new efficiency measures after receiving program messaging. Program messaging aims to help irrigators understand the benefits of the available efficiency measures and make them aware of the financial assistance available to help them affordably implement the measures.
BPA provides administrative guidance, technical support, and tools to utilities to enable deemed measures and custom projects to receive incentives. Some BPA utilities—particularly the smaller ones—have limited staff time and expertise to assist their customers with energy efficiency projects. Many times the person responsible for agricultural energy efficiency is also responsible for energy efficiency in all the other sectors and may have responsibilities in other utility departments as well. BPA’s assistance enables these smaller utilities to participate in the rebate programs.
BPA, the Regional Technical Forum (RTF), and irrigators have increased confidence in energy savings estimates from existing and new technologies (e.g., SIS, LESA/LEPA). BPA wants to focus its financial resources on the measures that will achieve cost-effective energy savings, and irrigators want to invest in equipment that will save them money. All parties benefit from additional data to support savings claims.
BPA adapts and improves its programs in response to changing market conditions and research findings. The agricultural market varies from year to year due to crop demand, weather patterns, changing technologies, and many other factors. BPA’s research and evaluation efforts provide information that empowers the programs to remain nimble and responsive to changing market conditions.

Memorandum – The BPA Agricultural Programs’ Theory, Logic, Structure, and Offerings F-8
Utilities continue to offer agricultural rebate programs to their customers. BPA relies on the utilities and their direct connection with agricultural customers to achieve their energy savings targets. Therefore, it is crucial that BPA does what it can to facilitate and encourage utilities’ continued participation in the programs.
The expected intermediate outcomes resulting from the immediate outcomes include the following:
Irrigators receive rebates for implementing irrigation hardware, energy-efficient irrigation practices, and custom projects. This outcome constitutes irrigators’ direct program participation.
Irrigators are more willing to try new energy-saving irrigation practices and measures. Marketing, outreach, and the data that results from research projects all increase irrigators’ willingness to try new efficiency measures.
New measures receive RTF and BPA approval to be included in programs. New measures help BPA programs remain relevant in a changing market and help ensure that BPA can achieve its energy savings targets.
Utilities with an agricultural base view BPA as a partner in energy efficiency. BPA offers financial, technical, marketing, and administrative resources to small, rural utilities to help them better serve their agricultural customers.
Irrigators’ satisfaction with utilities increases; utilities’ satisfaction with BPA increases. BPA and utilities mutually benefit from positive program relationships. When irrigators receive assistance that helps them save energy, water, money, and time, their satisfaction with their utilities increase. This, in turn, increases utilities’ satisfaction with BPA.
One can expect that the sum total of the immediate and intermediate outcomes will lead to the achievement of BPA’s two ultimate goals:
BPA achieves regional energy savings targets.
BPA supports utilities in enabling their agricultural customers to save energy.
The logic model (Figure F-28 on the following page) visually demonstrates how the program activities logically lead to the achievement of the immediate, intermediate, and ultimate outcomes.
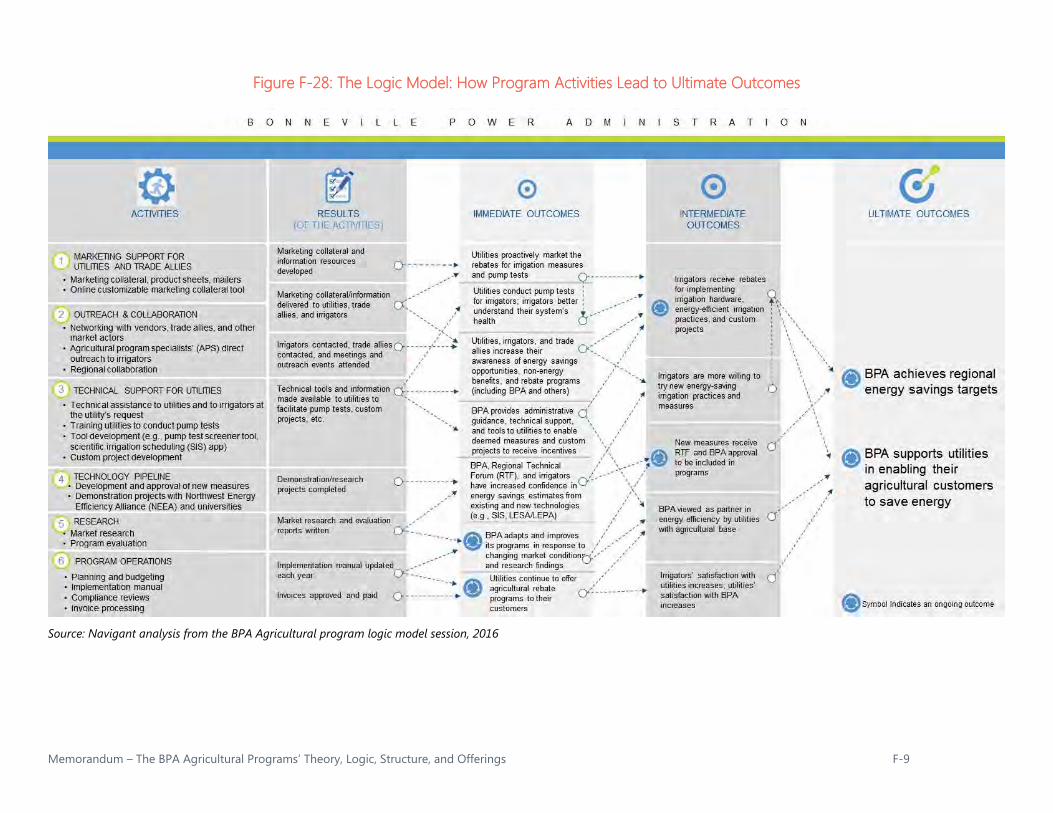
Memorandum – The BPA Agricultural Programs’ Theory, Logic, Structure, and Offerings F-9
Figure F-28: The Logic Model: How Program Activities Lead to Ultimate Outcomes
Source: Navigant analysis from the BPA Agricultural program logic model session, 2016

Memorandum – The BPA Agricultural Programs’ Theory, Logic, Structure, and Offerings F-10
Program Current State This section discusses the current state of the BPA agricultural program. It first explains the differences between the BPA program measure offerings and the agriculture measures in the Council’s Sixth and Seventh Power Plans (Sixth and Seventh Plans). The section then explores utility irrigation measure uptake.
Current Program Measure Offerings and Comparison to the Sixth and Seventh Plans The earlier Strategies, Messages, and Communication Vehicles section lists measures for which BPA provides incentives. BPA’s implementation manual (IM), edited October 2015, includes these measures as well as guidelines and requirements for implementing the energy efficiency projects. The Sixth and Seventh Plans determine energy savings differently than the measures in the IM. Table F-6 maps BPA’s measure offerings to those outlined in the Sixth and Seventh Plans, highlighting where they overlap and where there are gaps. The full measure lists are available in the Appendix.
Table F-6: Current BPA Measure Offerings Compared to the Sixth and Seventh Plans
Group BPA Measures Sixth Plan Measures Seventh Plan Measures
SIS SIS SIS SIS
Irrigation Hardware
Goosenecks New gooseneck elbows
Drop tube/hose extension New drop tubes
Regulator replacement
Sprinkler replacements (rotating type sprinkler or impact sprinkler)
Install new sprinkler package on an existing system; rebuild or replace leaking impact sprinkler
Multi-trajectory sprays
Nozzle replacement Nozzle and gasket replacement
Replace worn nozzle
Gasket replacement Replace leaking pivot boot or tower gasket
Drain replacement Replace leaking drain
Hub replacement Replace leaking hub
Pipe repair Cut and pipe press repair of leaking hand lines, wheel lines, and portable main lines
Leveler rebuild Rebuild or replace leaking or malfunctioning leveler
Pump Irrigation pump testing and system analysis
Pump, nozzle, and gasket replacement
Motors and Drives
Motors/drives control improvements (variable
Motor rewind, install variable speed drive (VSD) on

Memorandum – The BPA Agricultural Programs’ Theory, Logic, Structure, and Offerings F-11
Group BPA Measures Sixth Plan Measures Seventh Plan Measures
frequency drive on irrigation turbine pump)
irrigation pump, VSD – vacuum pump
Pressure Reduction
Convert high and medium pressure center pivots to low pressure systems
Convert high and medium pressure center pivots to low pressure systems
Convert wheel and hand lines to low pressure systems
Convert wheel and hand lines to low pressure systems on alfalfa acreage
Other
Freeze-resistant stock water tanks/fountains
Dairy measures LESA
Transformer de-energization Refrigeration and lighting measures
Custom and multi-sector (e.g., lighting, Green Motor Rewind Initiative)
Source: Navigant, BPA Agricultural Irrigation Program Data Analysis, 2016
The Seventh Plan closely matches the measures included in BPA’s program offerings, whereas the Sixth Plan comparison presents a greater difference. While many of the measures included in BPA’s program offerings (e.g., goosenecks, drop tubes, pressure regulators, and non-impact sprinklers and nozzles) are necessary components of a system-wide pressure reduction—as defined in the Sixth Plan measures—they are not sufficient in and of themselves. An overall system pressure reduction also requires modification of the pump or drive motor. This may include implementing a variable frequency drive, trimming the pump impeller, or dropping a bowl in a submerged turbine pump.
Measure Uptake The research team analyzed BPA’s agricultural program data from 2010 to 2015. Key takeaways from the program data include the following:
The irrigation end-use contributed to 48% of the agriculture program’s average megawatt (aMW) savings from 2010 to 2015. Within the irrigation end-use, SIS accounts for 48% of aMW savings.
No SIS savings came from Idaho between 2010 and 2015.
Of the sprinkler specific measures (multi-trajectory sprays and sprinkler replacements), 65% of savings are from new sprinklers replacing low-pressure sprinklers and 14% of savings are from new impact sprinklers replacing old impact sprinklers. Thus, 21% of the sprinkler measure savings are sprays and rotating type sprinklers replacing impact sprinklers.
There are some differences in end-use categories in the raw data provided by BPA from fiscal year (FY) 2010 to FY2011 as compared with FY2012 to FY2015.36 These differences required the research team to
36 The research team attributes the differences in end-use categories to the change in reporting systems from the Planning, Tracking, and Reporting (PTR) system to the IS2.0 database, the latter of which reflects the BPA measure list and taxonomy.

Memorandum – The BPA Agricultural Programs’ Theory, Logic, Structure, and Offerings F-12
map end-use categories for consistent analysis and reporting. Table F-7 depicts the mapping of end-use categories.
Table F-7: End-Use Categories by Reporting Mechanism
Reported End-Use Categories Analysis End-Use Categories
Energy Efficiency Admin/Performance Funding (Pre 2012)
Multiple Measures Custom
Other Agricultural Measures Custom
HVAC Custom
Irrigation Hardware Irrigation
SIS Projects Irrigation
Lighting Lighting
Green Motor Rewind Initiative Motors/Drives
Motors Motors/Drives
Stock Watering Process Loads
Dairy Equipment and Systems Assigned on a project-by-project basis to either Custom or Motors/Drives end-uses
Transformer De-energization Utility Distribution System
NEMA premium motors under the Irrigation end-use
Motors/Drives
No end-use specified Custom
Source: Navigant, BPA Agricultural Irrigation Program Data Analysis, 2016
Agriculture Program Activity
Table F-8 shows the final end-use categories the research team used to analyze the program data and their associated costs and energy savings. The plurality of savings are attributable to irrigation, so the research team focused the remaining data analysis on that specific end-use.
Table F-8: Agriculture Program Activity by Reported End-Use (2010–2015)
Analysis End-Use Category Total BPA Cost kWh Saved aMW Saved $M Cost per aMW
Irrigation $13,711,913 74,677,584* 8.52* $1.61
Motors/Drives $9,648,055 55,682,044 6.36 $1.52
Custom $2,101,599 12,513,830 1.43 $1.47
Utility Distribution System $742,764 10,162,312 1.16 $0.64
Lighting $607,133 2,510,521 0.29 $2.12
Refrigeration $107,393 556,765 0.06 $1.69
Process Loads $61,651 242,180 0.03 $2.23
Water Heating $1,896 27,248 0.003 $0.58
* The totals for the five year period include the average SIS savings over 2010 -2015 because SIS has a one year measure life. This is consistent with BPA’s reporting of SIS savings.

Memorandum – The BPA Agricultural Programs’ Theory, Logic, Structure, and Offerings F-13
Source: Navigant, BPA Agricultural Irrigation Program Data Analysis, 2016
Irrigation End-Use Activity
The irrigation end-use consists of SIS, irrigation system upgrades, custom, and irrigation pump testing and system analysis. Table F-9 depicts the aMW saved from each sub-category from 2010 to 2015. The table does not list irrigation pump testing and system analysis because BPA does not capture energy savings from pump testing.
Table F-9: Irrigation End-Use Savings by Sub-Category (2010–2015)
Irrigation Sub-Category
Units 2010 2011 2012 2013 2014 2015 Total
SIS aMW 3.96 5.14 3.70 4.94 1.29 5.64 4.11* kWh 34,670,728 45,021,689 32,382,084 43,317,320 11,333,423 49,443,614 36,028,143*
Irrigation System Upgrades
aMW 0.49 0.62 0.61 0.48 0.52 0.64 3.35
kWh 4,254,370 5,392,221 5,307,983 4,221,871 4,551,240 5,626,679 29,354,364
Custom aMW 0.11 0.38 0.01 0.20 0.06 0.31 1.06 kWh 934,608 3,302,712 93,950 1,775,641 498,657 2,689,508 9,295,077
Note: The years in the table are the years the savings were reported in the database.
*The totals for the five year period include the average SIS savings over 2010 -2015 because SIS has a one year measure life. This is consistent with BPA’s reporting of SIS savings
Source: Navigant, BPA Agricultural Irrigation Program Data Analysis, 2016
Table F-10 summarizes all irrigation activity by measure. The research team organized the table by the aMW saved by measure from largest to smallest. Notice that regulator replacements achieved the highest energy savings within irrigation system upgrades, with sprinkler and nozzle replacements following second and third, respectively. Additional measure detail is available in the Appendix.

Memorandum – The BPA Agricultural Programs’ Theory, Logic, Structure, and Offerings F-14
Table F-10: Irrigation End-Use Activity by Measure (2010–2015)
Irrigation Sub-Category
Measure Total BPA Cost kWh Saved aMW Saved $M Cost per
aMW
SIS SIS $6,728,852 36,028,143* 4.11* $1.64
Irrig
atio
n Sy
stem
Upg
rade
s
Regulator Replacement $1,782,081 11,441,089 1.31 $1.36
Sprinkler Replacements $1,415,486 7,417,630 0.85 $1.67
Nozzle Replacement $407,846 4,687,908 0.54 $0.76
Gasket Replacement $284,216 1,733,609 0.20 $1.44
Drop Tube/Hose Extension $520,009 1,485,876 0.17 $3.07
Goose Necks $223,462 1,269,224 0.14 $1.54
Pipe Repair $143,819 534,568 0.06 $2.36
Multi-Trajectory Sprays $42,208 326,910 0.04 $1.13
Drain Replacement $26,066 279,014 0.03 $0.82
Hub Replacement $41,448 157,496 0.02 $2.30
Leveler Rebuild $4,719 21,040 0.002 $1.96
Custom Custom $2,082,399 9,295,077 1.06 $1.96
Pump Irrigation Pump Testing and System Analysis
$9,300
Note: Measure names correspond to BPA’s Measure List Technology/Application/Practice
*The totals for the five year period include the average SIS savings over 2010 -2015 because SIS has a one year measure life. This is consistent with BPA’s reporting of SIS savings.
Source: Navigant, BPA Agricultural Irrigation Program Data Analysis, 2016
Figure F-29 shows that Washington, Oregon, and Idaho reported the largest amount of total program savings from 2010 to 2015. All other states were categorized as “Other,” with overall savings less than an aMW. The other states include Montana, Utah, Wyoming, Nevada, California, and states outside the BPA territory or spanning multiple states primarily associated with cooperatives (e.g., Pacific Northwest Generating Co-op and Oregon Trail).

Memorandum – The BPA Agricultural Programs’ Theory, Logic, Structure, and Offerings F-15
Figure F-29: Irrigation End-Use aMW Saved by Irrigation Sub-Category
Note: Other includes Montana, Utah, Wyoming, Nevada, and California, as well as areas outside BPA territory or spanning multiple states—primarily associated with cooperatives (e.g., Pacific Northwest Generating Co-op and Oregon Trail). Source: Navigant, BPA Agricultural Irrigation Program Data Analysis, 2016
Preliminary Conclusions The working session participants identified a number of program connections throughout the daylong logic model session. These potential program connections are outlined below in bold. In addition, the team has included program connections from the program data analysis. The research team will review the identified connections along with the findings from other data collection tasks, synthesize all the findings and make more complete recommendations in this study’s final report.
Small farmers may not be taking advantage of program incentives. Is increasing their participation a program opportunity?
Pump test are very valuable, but utilities do not incentivize many of them. How valuable are pump tests? Could trade allies help with marketing the value?
BPA does not offer drip irrigation incentives because the savings is tough to determine. Will drip irrigation incentives affect BPA savings goals?
BPA does not offer irrigation control incentives. What are the efficiency benefits to irrigation controls? Could incentivizing controls affect BPA savings goals?
Farmers need irrigation pump tests and system health assessments. What are the benefits to irrigation pump tests and system heath assessments?
Farmers need education. How much do farmers already know? What should they know about efficiency? Who can help educate them?
‐
1
1
2
2
3
3
4
Washington Oregon Idaho Other
aMW Saved
(2010‐2015)
SIS Irrigation System Upgrades Custom

Memorandum – The BPA Agricultural Programs’ Theory, Logic, Structure, and Offerings F-16
There are untapped partnership opportunities. Is there opportunity in coordinating with the water utilities or water conservationists like the Department of Fish and Wildlife or Bonneville environmental foundation?
Demand Response could help utilities with load management and energy savings. What utilities have demand response programs for irrigation? How do they work? Are they successful?
Three utilities have been involved in a majority of the savings. Are there opportunities for other utilities to become involved in the program?
The majority of sprinkler measure participation has been for maintenance of sprinklers. Should the focus be on replacing “inefficient” sprinkler technology with more “efficient” sprinkler technology?
Next Steps The research team is in the midst of an ongoing research project to identify new areas of opportunity for BPA’s agricultural programs. This document may serve as a useful tool for BPA to communicate intended changes to the program design that may result from this study.

Memorandum – The BPA Agricultural Programs’ Theory, Logic, Structure, and Offerings F-17
Appendix F1
BPA Measure Detail for the Irrigation End Use
Table F-11: BPA Measure Detail for the Irrigation End Use
Measure Measure Details Total BPA
Cost kWh Saved
aMW Saved
$M Cost per aMW
Drain Replacement
Replace Leaking Drain Gaskets With New Gaskets on Wheel-lines, Hand-lines, Center Pivot Systems or Lateral Moves
$26,066 279,014 0.03 $0.82
Drop Tube/Hose Extension
New Drop Tube for Low Pressure Center Pivot or Lateral Move Sprinklers (minimum three feet length)
$520,009 1,485,876 0.17 $3.07
Gasket Replacement Replace Leaking Center Pivot Base Boot Gasket with New Gasket
$121,415 721,163 0.08 $1.47
Gasket Replacement
Replace Leaking Pipe Section and Riser Cap Gaskets for Wheel-lines, Hand-lines, or Portable Mainline with New Gasket
$162,801 1,012,446 0.12 $1.41
Goose Necks
New Goose Neck Elbow for New Drop Tubes (to convert existing sprinkler equipment mounted on top of pivot or lateral move to low pressure sprinkler package)
$223,462 1,269,224 0.14 $1.54
Hub Replacement New Hubs for Wheel Lines $41,448 157,496 0.02 $2.30
Leveler Rebuild Rebuild or Replace Leaking or Malfunctioning Leveler with new or Rebuilt Wheel Line Leveler
$4,719 21,040 0.002 $1.96
Multi-Trajectory Sprays
New Multi-Trajectory Sprays Replace Low Pressure Sprinkler
$12,256 102,544 0.01 $1.04
Multi-Trajectory Sprays
New Multi-Trajectory Sprays That Replace Impact Sprinkler
$29,952 224,366 0.03 $1.17
Nozzle Replacement New Multiple Configuration Nozzle for Low Pressure Pivot or Lateral Move Sprinklers
$181,161 2,048,796 0.23 $0.77
Nozzle Replacement New Nozzle for Center Pivot or Lateral Move System
$84,890 1,150,374 0.13 $0.65

Memorandum – The BPA Agricultural Programs’ Theory, Logic, Structure, and Offerings F-18
Measure Measure Details Total BPA
Cost kWh Saved
aMW Saved
$M Cost per aMW
Nozzle Replacement New Nozzle for Impact Sprinkler Replacing Existing Worn Nozzle of Same Flow Rate or Less
$115,844 1,359,165 0.16 $0.75
Nozzle Replacement Replace Worn Nozzle With New Flow Controlling Type Nozzle for Impact Sprinkler
$25,952 129,573 0.01 $1.75
Pipe Repair Pipe Repair of Leaking Hand-Lines, Wheel-lines, or Portable Mainline
$143,819 534,568 0.06 $2.36
Irrigation Pump Testing and System Analysis
Pump Testing Service Booster Pump Complex System Over 400 acres BPA Qualified
$100
Irrigation Pump Testing and System Analysis
Pump Testing Service Irrigation Pump Test Complex System Over 400 acres BPA Qualified
$2,600
Irrigation Pump Testing and System Analysis
Pump Testing Service Irrigation Pump Test Simple System or Open Discharge BPA Qualified
$800
Irrigation Pump Testing and System Analysis
Pump Testing Service Irrigation Pump Test System Analysis 400 acres or less BPA Qualified
$4,600
Irrigation Pump Testing and System Analysis
Pump Testing Service Irrigation Pump Test System Analysis Over 400 acres BPA Qualified
$900
Irrigation Pump Testing and System Analysis
Pump Testing Service Simple System Evaluation BPA Qualified
$300
Regulator Replacement
New Low Pressure Regulator $1,782,081 11,441,089 1.31 $1.36
Scientific Irrigation Scheduling
Scientific Irrigation Scheduling $6,728,852 216,168,858 24.68 $0.27
Sprinkler Replacements
New Rotating Type Sprinkler Replace Low Pressure Sprinkler
$953,509 4,916,844 0.56 $1.70
Sprinkler Replacements
New Rotating Type Sprinkler That Replace Impact Sprinkler.
$270,165 1,404,944 0.16 $1.68
Sprinkler Replacements
Replace Leaking Impact Sprinkler with Rebuilt or new Impact Sprinkler
$191,812 1,095,842 0.13 $1.53
Source: Navigant, BPA Irrigation Agricultural Program Data Analysis, 2016

Memorandum – The BPA Agricultural Programs’ Theory, Logic, Structure, and Offerings F-19
BPA Implementation Manual Agricultural Sector Measure List
Figure F-30: BPA Implementation Manual Agricultural Sector Measure List
Source: BPA Implementation Manual, October 2015
Sixth Plan Agriculture Measures
Figure F-31: SIS Measures
Source: Northwest Power and Conservation Council Sixth Power Plan Supply Curve: IrrgAgHardwareSupplyCurve_6thPlanv1.xls (2009)

Memorandum – The BPA Agricultural Programs’ Theory, Logic, Structure, and Offerings F-20
Figure F-32: Irrigation Hardware Measures
Source: Northwest Power and Conservation Council Sixth Power Plan Supply Curve: IrrgAgHardwareSupplyCurve_6thPlanv1.xls (2009)
Measure Measure Type Category Climate ZoneBuilding Type Vintage
Lost-Opporunity
Total Technically Available Units (Acres)
Maximum Technically Applicable Market Penetration
Current Market Saturation
Remaining Technical Potential (Fraction of Units)
Remaining Technical Potential (Units)
Convert hand line systems to low pressure systems on alfalfa acreage - Idaho Convert hand line to low pressure Irrigation Hardw are Idaho NA Existing No 23,463 85% 0% 85% 19,944 Convert hand line systems to low pressure systems on alfalfa acreage - Montana Convert hand line to low pressure Irrigation Hardw are Montana NA Existing No 9,041 85% 0% 85% 7,685 Convert hand line systems to low pressure systems on alfalfa acreage - Oregon Convert hand line to low pressure Irrigation Hardw are Oregon NA Existing No 11,475 85% 0% 85% 9,754 Convert hand line systems to low pressure systems on alfalfa acreage - PNW Convert hand line to low pressure Irrigation Hardw are PNW NA Existing No 0 85% 0% 85% - Convert hand line systems to low pressure systems on alfalfa acreage - Washington Convert hand line to low pressure Irrigation Hardw are Washington NA Existing No 13,893 85% 0% 85% 11,809 Convert High Pressure Center Pivot to Low pressure system - Idaho Convert from High to Low Pressure Irrigation Hardw are Idaho NA Existing No 43,300 85% 0% 85% 36,805 Convert High Pressure Center Pivot to Low pressure system - Montana Convert from High to Low Pressure Irrigation Hardw are Montana NA Existing No 4,039 85% 0% 85% 3,433 Convert High Pressure Center Pivot to Low pressure system - Oregon Convert from High to Low Pressure Irrigation Hardw are Oregon NA Existing No 10,049 85% 0% 85% 8,542 Convert High Pressure Center Pivot to Low pressure system - PNW Convert from High to Low Pressure Irrigation Hardw are PNW NA Existing No 0 85% 0% 85% - Convert High Pressure Center Pivot to Low pressure system - Washington Convert from High to Low Pressure Irrigation Hardw are Washington NA Existing No 28,186 85% 0% 85% 23,958 Convert Medium Pressure Center Pivot to Low pressure system - Idaho Convert from Medium to Low Pressure Irrigation Hardw are Idaho NA Existing No 144,317 85% 0% 85% 122,670 Convert Medium Pressure Center Pivot to Low pressure system - Montana Convert from Medium to Low Pressure Irrigation Hardw are Montana NA Existing No 39,758 85% 0% 85% 33,794 Convert Medium Pressure Center Pivot to Low pressure system - Oregon Convert from Medium to Low Pressure Irrigation Hardw are Oregon NA Existing No 31,680 85% 0% 85% 26,928 Convert Medium Pressure Center Pivot to Low pressure system - PNW Convert from Medium to Low Pressure Irrigation Hardw are PNW NA Existing No 0 85% 0% 85% - Convert Medium Pressure Center Pivot to Low pressure system - Washington Convert from Medium to Low Pressure Irrigation Hardw are Washington NA Existing No 96,883 85% 0% 85% 82,351 Convert w heel line systems to low pressure systems on alfalfa acreage - Idaho Convert w heel line to low pressure Irrigation Hardw are Idaho NA Existing No 35,685 85% 0% 85% 30,333 Convert w heel line systems to low pressure systems on alfalfa acreage - Montana Convert w heel line to low pressure Irrigation Hardw are Montana NA Existing No 31,926 85% 0% 85% 27,137 Convert w heel line systems to low pressure systems on alfalfa acreage - Oregon Convert w heel line to low pressure Irrigation Hardw are Oregon NA Existing No 19,586 85% 0% 85% 16,648 Convert w heel line systems to low pressure systems on alfalfa acreage - PNW Convert w heel line to low pressure Irrigation Hardw are PNW NA Existing No 0 85% 0% 85% - Convert w heel line systems to low pressure systems on alfalfa acreage - Washington Convert w heel line to low pressure Irrigation Hardw are Washington NA Existing No 20,936 85% 0% 85% 17,795 Nozzle & Gasket Replacement - Idaho Nozzle & Gasket Replacement Irrigation Hardw are Idaho NA Existing No 598,181 85% 0% 85% 508,454 Nozzle & Gasket Replacement - Montana Nozzle & Gasket Replacement Irrigation Hardw are Montana NA Existing No 106,094 85% 0% 85% 90,180 Nozzle & Gasket Replacement - Oregon Nozzle & Gasket Replacement Irrigation Hardw are Oregon NA Existing No 178,910 85% 0% 85% 152,074 Nozzle & Gasket Replacement - PNW Nozzle & Gasket Replacement Irrigation Hardw are PNW NA Existing No 0 85% 0% 85% - Nozzle & Gasket Replacement - Washington Nozzle & Gasket Replacement Irrigation Hardw are Washington NA Existing No 342,622 85% 0% 85% 291,229 Pump, Nozzle & Gasket Replacement Average Well - Idaho Pump, Nozzle & Gasket Replacement Irrigation Hardw are Idaho NA Existing No 119,292 85% 0% 85% 101,398 Pump, Nozzle & Gasket Replacement Average Well - Montana Pump, Nozzle & Gasket Replacement Irrigation Hardw are Montana NA Existing No 7,102 85% 0% 85% 6,037 Pump, Nozzle & Gasket Replacement Average Well - Oregon Pump, Nozzle & Gasket Replacement Irrigation Hardw are Oregon NA Existing No 33,946 85% 0% 85% 28,854 Pump, Nozzle & Gasket Replacement Average Well - PNW Pump, Nozzle & Gasket Replacement Irrigation Hardw are PNW NA Existing No 0 85% 0% 85% - Pump, Nozzle & Gasket Replacement Average Well - Washington Pump, Nozzle & Gasket Replacement Irrigation Hardw are Washington NA Existing No 67,529 85% 0% 85% 57,400 Pump, Nozzle & Gasket Replacement Deep Well - Idaho Pump, Nozzle & Gasket Replacement Irrigation Hardw are Idaho NA Existing No 119,292 85% 0% 85% 101,398 Pump, Nozzle & Gasket Replacement Deep Well - Montana Pump, Nozzle & Gasket Replacement Irrigation Hardw are Montana NA Existing No 7,102 85% 0% 85% 6,037 Pump, Nozzle & Gasket Replacement Deep Well - Oregon Pump, Nozzle & Gasket Replacement Irrigation Hardw are Oregon NA Existing No 33,946 85% 0% 85% 28,854 Pump, Nozzle & Gasket Replacement Deep Well - PNW Pump, Nozzle & Gasket Replacement Irrigation Hardw are PNW NA Existing No 0 85% 0% 85% - Pump, Nozzle & Gasket Replacement Deep Well - Washington Pump, Nozzle & Gasket Replacement Irrigation Hardw are Washington NA Existing No 67,529 85% 0% 85% 57,400

Memorandum – The BPA Agricultural Programs’ Theory, Logic, Structure, and Offerings F-21
Figure F-33: Dairy Measures
Source: Northwest Power and Conservation Council Sixth Power Plan Supply Curve: IrrgAgHardwareSupplyCurve_6thPlanv1.xls (2009)
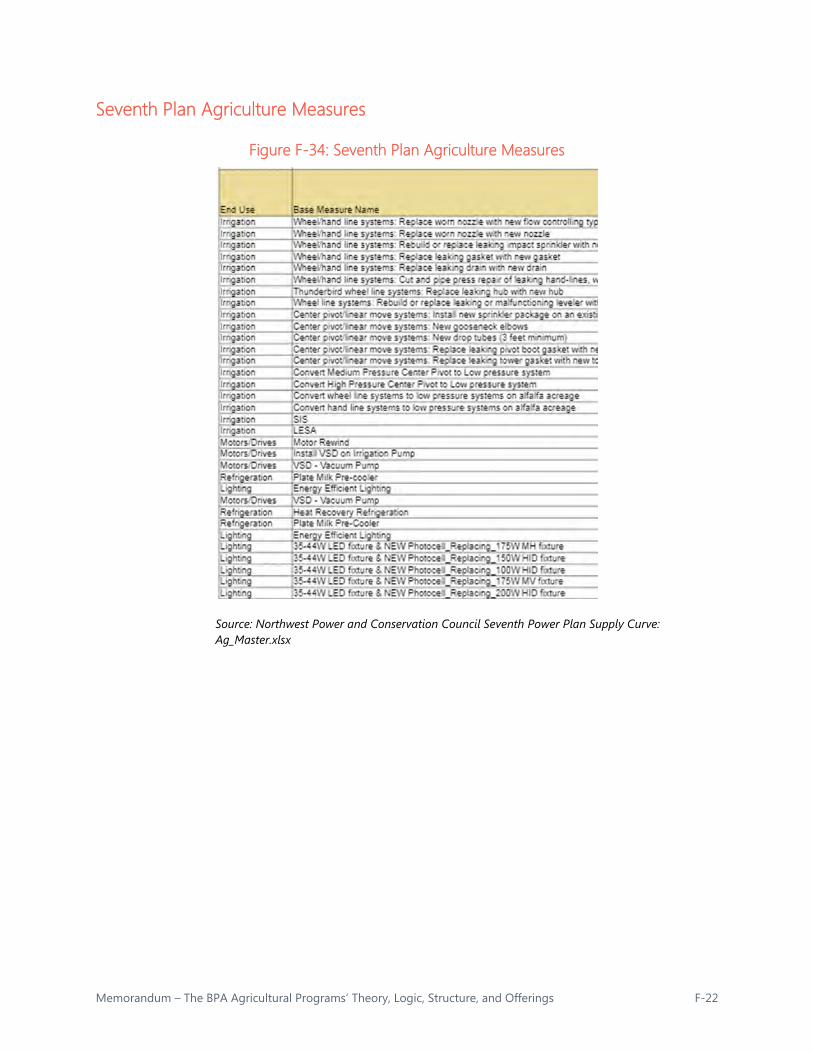
Memorandum – The BPA Agricultural Programs’ Theory, Logic, Structure, and Offerings F-22
Seventh Plan Agriculture Measures
Figure F-34: Seventh Plan Agriculture Measures
Source: Northwest Power and Conservation Council Seventh Power Plan Supply Curve: Ag_Master.xlsx

Memorandum — Agricultural Market Actor Interview Findings G-1
Appendix G: Memorandum — Agricultural Market Actor Interview Findings To: Bonnie Watson, Bonneville Power Administration (BPA)
From: Jane Hummer, Nicole DelSasso, Beth Davis, Kristin Landry, Lorraine Renta, Navigant Consulting, Inc.
Date: August 17, 2016
Subject: Agricultural Market Actor Interview Findings
This memo documents the key findings from the market actor interviews conducted as part of the agricultural market study. The Navigant team (the research team) conducted 20 phone interviews with a variety of market actors, including the following:
Eight dealers Four irrigation consultants Three pivot manufacturers Three sprinkler manufacturers Two controls manufacturers
These interviews focused on identifying and exploring opportunities within the agricultural irrigation market—characterizing the current state of the market as well as market trends—and gathering input on the market actors’ program experiences.
Opportunities This section discusses the market actors’ insights into specific irrigation efficiency opportunities.
Controls, Variable Speed Irrigation, Variable Rate Irrigation, and Big Data
Definition of Terms
Most market actors are familiar with the basic concepts of variable speed irrigation (VSI) or variable rate irrigation (VRI). However, some market actors view the two phrases as interchangeable terms for the same concept, while others combine VSI with variable frequency drives on pumps. Overall, market actors tend to use these definitions:

Memorandum — Agricultural Market Actor Interview Findings G-2
VSI: The pivot moves more quickly during some parts of its rotation than others, dividing the field into wedges that receive more or less water.
VRI: Individual sprinklers or groups of sprinklers that pulse (turn on and off) during some parts of the pivot’s rotation, dividing the field into sub-wedges that receive more, less, or no water.
Some market actors refer to VSI as speed control or sector control and VRI as zone control or nozzle banking. Similarly, some draw a line of distinction between zone control (groups of sprinklers) and individual sprinkler control.
Figure G-35 demonstrates the difference between VSI and VRI as described by interviewees.
Figure G-35: Comparison of Variable Speed and Variable Rate Irrigation
Source: Navigant depiction of VSI and VRI technologies based on interview research, 2016
Market Actor Insights on Opportunity
The interviewed market actors most commonly described this set of opportunities (which could be described as data-driven controls) as “the next big thing” in irrigation efficiency, with seven interviewees identifying it as the top opportunity. Most dealers noted that they are regularly talking to their customers about VRI and VSI. However, there was some nuance in describing who would really be interested in and benefit from the technologies involved.
Many market actors indicated that most existing pivot systems are already capable of VSI, with little or no additional capital investment needed. One pivot manufacturer estimated that 50% of existing systems are capable of implementing VSI, but only about 5% to 12% of irrigators are actually taking advantage of that capability.

Memorandum — Agricultural Market Actor Interview Findings G-3
The significant cost of VRI is the primary barrier to adoption. Several market actors offered estimates of the cost, ranging from $25,000 to $40,000 for VRI compared to $1,500 to $3,000 for VSI. One dealer observed that farmers prefer to spend their money on tractors rather than irrigation. One dealer described the challenge as follows:
“So it’s pretty cool tech, it’s expensive. Bang for the buck, a VFD is going to get you better…If they can get the price down on this other stuff [VRI], where the guys can justify it and use it, it’s cool – soil probes underground. The problem is it’s so expensive, it’s in the field where the tractors are and everything else is. Who’s going to insure their $2,000 soil probe? And they want two in every field – that’s really not justifiable.”
Another barrier noted by the interviewed market actors is the lack of technical expertise to design the program for VSI and especially VRI, and the risk that not implementing the technology correctly will actually leave them worse off than before. One irrigation consultant described this as the primary barrier to adoption, as opposed to cost: “’How do I know how to vary the speed? …It’s not the cost of the hardware. It’s something we’re doing one by one, but they are reluctant to start.” If farmers rotate crops annually, they would need to design a new program each year. A few market actors suggested there could be a lack of qualified service providers to assist farmers with transitioning to this more data-intensive process, but that was not a widespread perception. A few dealers noted the risk of data overload and the challenge that field hands may lack the technical expertise necessary to interpret significant amounts of data to optimize irrigation.
Several market actors noted that the best applications for VRI or VSI are fields that have extremely variable soil types, particularly those with large rocky areas that are untillable or slopes that result in runoff. In addition to water savings, farmers with those types of fields will also save money by not applying fertilizer or other chemicals to parts of the field that are not growing anything. The fact that not all fields are well-suited to the technology led a few market actors to identify unsuitable terrain as a barrier to the adoption of these technologies.
Similarly, due to the cost involved, some market actors noted that the investment is only worthwhile on high-value crops such as potatoes. One dealer offered a detailed case study of a situation in which widespread adoption of VRI would have significantly benefitted both potato farmers and BPA:
“Last year, we had an excessively long spell of 100 degrees every day weather. In the potato fields, they felt they had to keep the water running and they didn’t have the monitoring to shut it off. The farms that did have VRI zones, they were able to controls theirs, and they didn’t have the spots where water runs off and ran down into the low spots. Soil is like a sponge, you can’t force water through it once it’s full, it just runs off… They had to keep these pivots running and they were all over-irrigating… Well, what happens when you get water on potatoes, the cells in the potatoes gets too watery, and when they put that potato in storage, it breaks down and gets moldy, and then it deteriorates all the potatoes around it…one goes bad and the whole bag goes bad. So we had all these cellars with millions and millions of dollars of potatoes and they’re going bad because when they put them into the cellar they looked fine… Bonneville would have saved money, it’s during the heat and everyone’s running their air conditioners too. The potato company said we got to do something about this, we can’t have this, it’s costing us too much money.”

Memorandum — Agricultural Market Actor Interview Findings G-4
Another barrier—mentioned in regards to several measures including VRI and VSI—is the historic abundance of water in the Northwest and the lack of a water shortage crisis, which would be a significant motivator for farmers to adopt water-efficient irrigation technologies.
One dealer expressed surprise that VRI has not been adopted much to date but believes that rapid adoption is forthcoming:
“Variable rate irrigation has been available for the last eight or nine years. And it has not taken off like I thought it would, but I know once it begins to go, it’ll be like a snowball. More people will start doing it. It’ll become a huge impact on water usage and fertilizer leaching.”
Many market actors mentioned that telemetry and smartphone controls are appealing to farmers, particularly those with large, remotely located fields—for instance, in Montana or central Washington. One pivot manufacturer notes that while we typically “think about energy for irrigation being the energy it takes to pump the water and move the pivot, another huge energy requirement is driving somebody out to the field.” The ability to control the pivot and remotely monitor soil moisture saves on labor costs as well as gas and vehicle wear and tear. Features of smartphone controls may include the following:
Simple on/off remote control of the pivot Information on the pivot’s current location within the field Alerts on system malfunctions Alerts on weather conditions Remote reading of soil moisture sensors Access to historical data on irrigation, weather conditions Automated control based on all of the above
One controls manufacturer described the growing demand for smartphone controls:
“[Automated telemetry] is a smaller, but much faster growing portion of sales. First quarter of last year, that quote level is seven times year-over-year. People just want data delivered to their smartphone. Access to historical data is a big part of the smartphone/software.”
Some market actors drew a connection between the big data/smartphone controls and scientific irrigation scheduling (SIS). One dealer noted a generational divide between members of the older generation (age 50 and above) who prefer to “walk the fields” and check the moisture levels themselves, and the younger generation that prefers SIS and smartphone controls. He noted, “I think you’ll see a mixture of the SIS going on for a few more years, or until the younger generation can outvote their dads.” One irrigation consultant noted that there may not be enough people offering the SIS service, but noted that SIS was often successfully sold to farmers implementing LESA and LEPA (discussed below) because “in order to apply less water, it needs to be managed more intensely as well.”
LESA and LEPA
Definition of Terms
Market actors had varying understandings of the acronyms LESA and LEPA, though all recognized that the “L” stands for low—low pressure, low elevation, and/or low energy use.

Memorandum — Agricultural Market Actor Interview Findings G-5
Market actors defined LESA as “low elevation spray application,” “low energy spray application,” or “low energy sprinkler.” Most market actors attempted to define it based on the height of the sprinkler from the ground, although those definitions varied in number and specificity. One person said “one foot from the ground”; one said “1.5 feet”; one said “three to six feet”; two said “right above the canopy”; and three simply said “very close to the ground” or “the closer to the ground, the better.”
Market actors defined LEPA as “low energy pressure application” or “low energy precision application,” and was frequently described as “dragging” a nozzle, “sock,” or “bubbler” on the ground. One sprinkler manufacturer described it as, “a bubbler which just dribbles the water on the ground, doesn’t try to spread it out.”
The definitions used by BPA are low elevation spray application (LESA) and low elevation precision agriculture (LEPA).37
Market Actor Insights on Opportunity
Though most market actors are able to define LESA or LEPA or at least demonstrate a basic understanding of the concept, few are aware of many—if any—applications of the technology in the Northwest. One dealer bluntly stated, “We don’t use LEPA around here. That’s in Texas.” Three market actors (two dealers and an irrigation consultant) identified LESA as the “next big thing” for irrigation efficiency, although several noted that it is not a new technology—just one that has not seen widespread adoption in the Northwest. However, there is a widespread perception that LESA/LEPA are not applicable to the Northwest or that the technology is not yet ready for mainstream adoption in the Northwest. Few interviewees have recommended—much less implemented—LESA or LEPA yet.
The main benefit of LESA and LEPA recognized by market actors is reducing water loss due to evaporation and wind.
The barriers to LESA and LEPA include a perception that the technology is not cost-effective in the Northwest because water is “too available” and electricity is “too cheap” or “too available” relative to states such as California and Texas where adoption has been more widespread. (Note: These are barriers to all irrigation efficiency measures, not just this one.) One dealer noted that it was more common in places that rely on diesel generators rather than electricity for irrigation.
Another barrier cited frequently is the Northwest terrain, which market actors described as too hilly or variable for the technology to be effective. One irrigation consultant stated the barrier as such: “In our area, I don’t foresee that those systems are ever going to be used here on any kind of scale, because they require virtually flat fields.” Similarly, the Northwest climate is not as well suited for this technology as the Texas climate, where adoption of LEPA is more common—the high temperatures (and subsequently high evaporation rates) in Texas make the technology not only more cost-effective but more necessary.
The third barrier to LESA and LEPA as mentioned by interviewees is the risk to crops (cited by two dealers) based on concerns that not enough water will be put down and the fear that farmers would be unable to see if sprinklers have stopped working if the sprinklers are below the canopy. One dealer indicated an unwillingness to market the technology due to uncertainty in how it will perform, saying:
37 https://www.bpa.gov/EE/Sectors/agriculture/Pages/LEPA%20and%20LESA.aspx

Memorandum — Agricultural Market Actor Interview Findings G-6
“I try to push what I’m familiar with and what I’ve seen work. There’s nothing worse than saying hey, there’s this great technology, and then he has all the issues you were trying to avoid…if he has a system that works, and you try to improve it, you don’t take wild chances.”
Variable Frequency Drives and Motor Pumps Several market actors emphasized that variable frequency drives (VFDs) and motor pumps are one of the most significant opportunities for energy savings in the agricultural sector.
The most significant barrier to VFDs and motor pumps are the high cost and long payback. One irrigation consultant noted that the payback for VFDs and motors is much longer in the agricultural sector than in industrial applications because the growing season is only five months long; the consultant stated: “I talk to a lot of people who are really interested until they see what the cost savings are in comparison to the cost of the VFD, and then they change their mind.” In light of this, several market actors expressed a desire to see BPA offer higher incentives for VFDs to increase uptake.
Current Market Practices This section focuses on insights into current market practices regarding product flow, installation practices, and market trends that may affect the viability of the opportunities described in the previous section.
Product Flow Dealers and irrigation consultants had mixed experiences regarding whether they approach customers to purchase new sprinklers, systems, or controls, or whether customers approach them first. Three dealers and an irrigation consultant described a sales process in which customers mainly approach them rather than vice versa, with several dealers noting that this process is possible because their customers are “loyal” and they have “good rapport” with them. Another three dealers said there was a mix between their staff selling directly to customers and customers approaching them first. One of those dealers noted a generational difference: older salespeople with established customer relationships focus their limited outreach on promoting new technologies to existing customers, whereas newer salespeople engage in more prolific customer outreach in a process called “prospecting.” Finally, two irrigation consultants and a dealer indicated that they mainly go to their customers and not vice versa; one dealer said he makes 40-50 calls to customers per day.
The interviewed market actors almost universally emphasized the importance of designing projects to meet a farmer’s unique needs, not designing a project around program requirements/offerings. Dealers are generally educated on energy efficiency, but the most efficient option is not always appropriate for a given farmer in the context of their system, soil, terrain, crop type, labor availability, and overall business plan. For instance, a center pivot may not be an upgrade for a farmer with a small or irregularly shaped field; in those instances, a dealer may be better off recommending a wheel line. Most dealers and irrigation consultants indicated that they will recommend wheel lines or hand lines for small and irregularly shaped fields; two dealers also noted that certain crop types do not require center pivots, including cattle pasture, grass, hay, and alfalfa. One of these dealers explained that alfalfa is watered at
Memorandum — Agricultural Market Actor Interview Findings G-7
times when water is not scarce (the early spring and late fall) so efficiency is less of a concern and the benefits of a center pivot do not outweigh the costs.
Two pivot manufacturers noted that the vast majority of their pivot systems are sold in combination with a sprinkler package. One said, “We have people who would work with the dealer to design and select what they want, and they are packed and shipped as a complete system.”
The majority of manufacturers indicated that the late winter and early spring are their busiest sales periods; several indicated that they also see a bump in sales in the fall right after the harvest period. One sprinkler manufacturer described the sales cycle as follows:
“Dealers are designing fields or projects in the fall and winter that will be put in the field in early spring…our busiest time is in the winter when projects are being priced out to growers…so November to March are our busiest as a manufacturer. From a dealer standpoint, March and April are their busiest because that stuff is going into the field.”
Installation Practices Most dealers indicated that they install as much of their products as they can, with several noting that they have electricians and/or plumbers on staff. One dealer noted that they only work with outside contractors on deep wells or large motors. Only one dealer said they do not install any of their equipment, working exclusively with outside contractors.
Two major sprinkler manufacturers emphasized that they currently sell few high-pressure, impact sprinklers, and that the market has moved toward low-pressure rotators, spinners, and sprays such as the i-Wob sold by Senninger. These two sprinkler manufacturers indicated that many of these sprinklers operate between 10 psi and 20 psi.
Several market actors indicated that farmers tend to replace their sprinklers, nozzles, and pressure regulators too infrequently, with the exception of potato farmers who typically replace their equipment before each new potato crop. Several irrigation consultants noted that farmers replace nozzles more frequently because it is less expensive than replacing the whole package. One irrigation consultant noted that the appropriate replacement timing varies based on the quality of the water; farmers receiving water with a lot of sediment need to replace the equipment more frequently. One sprinkler manufacturer indicated that about two-thirds of farmers have an adequate replacement schedule, but the length of the cycle varies, ranging from four to seven years. An irrigation consultant noted that a lot of hay and grain farmers will replace even less frequently, perhaps every 10 years on average.
Market actors have varying perceptions of what percentage of the Northwest’s irrigated land is irrigated with center pivots versus wheel lines versus hand lines. Most say that center pivots account for 60% to 80% of the market, and wheel lines and hand lines account for 10% to 20%—the majority of those being wheel lines, not hand lines.
Several market actors noted that leaks are far more common on wheel and hand lines than on pivots. One dealer said that leaks tend to start developing within four to five years on wheel and hand lines, though an irrigation consultant noted that those leaks tend to get fixed promptly because farmers are handling the equipment on a regular basis. One irrigation consultant noted a difference between big corporate

Memorandum — Agricultural Market Actor Interview Findings G-8
farms (where hired hands are doing the onsite work) and smaller farms where the owner is present; he said that with the corporate farms, “I’ll report leaks and come back a month later and the leak is still there.”
Controls manufacturers and dealers note that wheel and hand lines are very rarely installed with any type of controls or monitoring equipment; however, drip and micro sprinkler irrigation systems are regularly sold with controls.
Market Trends One dealer observed that pivot technology has increased in reliability so significantly that overwatering is an unintended consequence:
“The machines have gotten better and better, and it used to be that we just tried to keep them running, and so you didn’t worry about management. Now they are working so good, they tend to let them run too long and it’s using up power and resources that they don’t need to use.”
Several market actors cautioned that the market has increased in efficiency so much already that future efficiency gains will be incremental. One irrigation consultant noted that the biggest efficiency gain is in converting from flood irrigation to pressure irrigation, and many farmers (particularly in Washington) have already made that transition. Dealers and irrigation consultants alike confirm that pressure irrigation offer significantly more efficiency and better uniformity than flood irrigation. Similarly, a different irrigation consultant noted that most farmers in Oregon and Washington have already converted from wheel and hand lines to center pivots, when applicable. No interviewed market actors had observed fields with center pivots being converted back to wheel or hand lines; once a farmer converts to center pivots, they generally stay with the center pivot.
Many dealers and irrigation consultants described their most frequent recommendations as non-hardware upgrades, i.e., improved maintenance and more frequent replacement of sprinklers and nozzles (mentioned by three dealers) and improved water management practices (mentioned by two irrigation consultants). Evaluation of the pump system (with possible upgrades or addition of a VFD) is also a frequent recommendation, mentioned by three dealers and an irrigation consultant. Irrigation consultants in particular noted that they frequently conduct research (e.g., water monitoring, soil mapping, aerial imagery, a pump test, etc.) before making recommendations on hardware recommendations.
Dealers and irrigation consultants indicated that drought conditions and water shortages drive a lot of interest in improved water management practices, especially soil moisture monitoring. Some dealers and irrigation consultants also indicated that there are some farmers who prefer to change their crop rotations (i.e., switching to crops which require less water) to adapt. A few interviewees noted that farmers are adopting drip tape (sometimes in concert with center pivots) in response to drought conditions. However, many of the interviewees noted that their regions had rarely experienced drought conditions in recent years.
Two market actors noted that there is a trend toward smaller diameter pivots with smaller pipes. One dealer attributed this to larger fields already having center pivots, so new pivots are mostly going into smaller fields. A pivot manufacturer noted that the cost of the larger pivot systems was also driving people to purchase smaller pivots.

Memorandum — Agricultural Market Actor Interview Findings G-9
Program Insights The majority of interviewed market actors were aware of BPA and utility programs, most commonly the rebates for sprinkler packages and VFDs. Several of the interviewees used the term “cost-share” rather than “rebate” or “incentive”; this language may resonate more with farmers. Opinions of the BPA programs varied, with some expressing appreciation of the support and some expressing frustration at program processes and limitations.
Market actors varied significantly in their opinions on what measures BPA should incent through its programs. Two interviewees stated that BPA should continue with their current incentives, with one saying “I think what they’re doing is great. I just don’t think we’ve made ourselves aware of everything available there.” Another two interviewees said that BPA should increase incentives on VFDs. Individual interviewees suggested the following measures for BPA incentives:
Conversion from regular pump starter to VFD with centrifugal motor.
Rebuilding pump station motors: “A lot of guys will take advantage of rebuilding and other guys will just run them until they die. You know the ones that are running until they died probably are not the most efficient.”
VRI.
Infrared imagery: “On a weekly basis, it gives the farmer a check on ‘do they have problems with their system, are they overwatering, are they underwatering?’ It would be a management tool.”
Soil moisture sensors: “The cost of some of these technologies is outpacing what the utilities are offering.”
Irrigation demand response: “The peak times are when irrigation systems are very inefficient anyways. If growers had information available…If there was an incentive, they might get interested.”
As discussed earlier, many dealers and irrigation consultants emphasized that they design the project around the farmers’ needs first, then seek incentives if available, rather than designing projects around incentive availability.
Beyond measures to incent, market actors offered some advice to BPA to improve their programs further. The following list summarizes the suggestions; the numbers in parentheses indicate how many market actors gave the suggestion if more than one.
Higher incentives (3): “Simplify the paperwork or increase the dollars.”
Less paperwork (2): “When it was ‘bring in your old gaskets and nozzles, and we’ll give you a new one’ it worked really well because they didn’t have to fill anything out, pay for them, wait to be reimbursed.”
More promotion of the program (2): “Maybe on the utility district level, they need to promote them more aggressively.”
Consistency in rebate levels across utility territories: “It’s not fair for a farmer to get a whole lot less rebate than his neighbor.”

Memorandum — Agricultural Market Actor Interview Findings G-10
Consistency in program offerings over time: “Stick with one so people get used to how it works.”
More education of farmers: “They have to realize these sprinklers don’t last forever, the life expectancy is probably 4-6 years.”
Reduce steps necessary to participate: “Now, you get an audit, they tell you what you’re [eligible for], then you buy the sprinkler package, then you get another audit, and if the sprinkler’s done what it’s supposed to be doing, then they’ll pay on it. Growers aren’t doing that at all—they just quit buying them because of that.”
Most of the dealers and irrigation consultants were aware of USDA/NRCS programs when prompted, although several noted complaints such as a lot of bureaucratic red tape and challenges in working with the NRCS programs due to their broader focus (beyond just irrigation).
Next Steps The research team will incorporate the findings from the market actor interviews into the final Agriculture Market Study Report, along with the findings from the logic model and program current state research, BPA staff interviews, utility staff interviews, and the Irrigation Show.

Contributors in This Report:Developed by Nicole DelSasso, Beth Davis, Dave Bluestein, Jane Hummer, Kristin Landry, Lorraine Renta, Emily Merchant, Navigant Consulting, Inc.; Rob Carmichael, Ben Barrington, and Elizabeth Daykin, Cadeo; Andriy Nemchenko, Artisan
Developed for the Bonneville Power Administration Please refer questions to: Bonnie Watson, [email protected], 503.230.3693