2015/16 australian salary outlook - michael page€¦ · · 2015-07-272015/16 australian sales...
TRANSCRIPT

1 2015/16 AUSTRALIA SALARY & EMPLOYMENT OUTLOOK
OUTLOOKS A L A R Y & E M P L O Y M E N T
2015/16 AUSTRALIAN
SALES
Sales

Hiring activity for sales in Australia has shown moderate levels of improvement, with the exception of Victoria which has seen a significant uplift over the past 12 months. The focus for most businesses has been to hire strong business development managers to drive business and expansion, whereas in previous years the focus has been on account managers to manage relationships and retain business. Areas in which we have seen the strongest recruitment levels are healthcare, pharmaceutical, IT and industrial service providers. Consumer goods at the mid-year point were just starting to show positive growth.
Job types in highest demand are:
• Business development managers – to drive new business opportunities
• Category managers – this job type is candidate short due to the niche skill set
• GP reps/HSRs – strong need for medical sales specialists
In Western Australia, the top skill sets in demand are those that can outperform the market and sell in a contested environment, such as strong influencing and communication skills. Similar to Victoria and New South Wales, employers want candidates who can expand into new revenue streams.
The executive job market has remained constant for most states. The exception is Queensland, where it has become weaker due to a drop off in sales roles in the mining, oil and gas industries. In Western Australia there is a higher focus on meaningful roles where an executive level candidate can add value, rather than a focus on salary.
We expect to see further investment in growing headcount over the next 12 months and the demand for account managers to increase again once companies have won business from their front line sales teams. An emerging trend, which can have a negative impact, is to offer a sales role with remuneration and benefits but no commission. Companies believe they can get increased levels of sales with higher customer confidence and trust. It can mean, however, that talented sales people will look to companies who do offer commission for higher overall remuneration and this can be seen as a counter-productive idea.
“ COMPANIES BELIEVE THEY CAN GET INCREASED LEVELS OF SALES WITH HIGHER CUSTOMER CONFIDENCE AND TRUST. “
2 2015/16 AUSTRALIA SALARY & EMPLOYMENT OUTLOOK
SALES OVERVIEW

KEY INSIGHTS
“ Permanent recruitment has increased in Western Australia, with the exception of the mining sector where it has decreased. We have seen a decrease in New South Wales and Queensland but consistency in Victoria. Confidence levels vary by industry but will pick up as the economy improves. Levels of experience in demand vary by state; Queensland and Victoria are mainly focusing on mid-level and management roles, whereas New South Wales and Western Australia have a higher focus on specialists. ”
YES
45%
UNSURE
10%
NO
45%
Do survey respondents expect to grow their teams
this year?Current national economy rating
Poor
Fair
Very goodGood Very poor5%17% 1% 20%
58%
Very poorGood3%
Very good14%23%
Fair40%
Overall confidence in sales
Poor20%
Mid level
Senior Management
5%
57%
Specialists18%
Entry level8%
Management12%
Levels of experience in highest demand
SALES
3 2015/16 AUSTRALIA SALARY & EMPLOYMENT OUTLOOK

KEY INSIGHTS
“ Strong business development professionals may be able to command an above average salary increase, as well as IT sales professionals where there is a skills shortage. Financial rewards are always expected in sales roles – but we have seen a big increase compared with last year in the trend for career progression opportunities as an attraction and retention method. ”
YES
84%
NO
16%
Do survey respondents expect their direct
employees to receive a bonus?
Financial incentives
Strong company culture
Recognition and rewards
Training and mentoring partnerships
Work/life balance initiatives
27%
72%
46%
23%
42%
Global career opportunities
Other
21%
7%
Broaden experience / opportunity to learn
Top talent attraction methods used *
* Respondents could select more than one answer.
Top talent retention methods used *
* Respondents could select more than one answer.
Financial incentives
Strong company culture
Recognition and rewards
Training and mentoring partnerships
Work/life balance initiatives
40%
62%
57%
42%
43%
Global career opportunities
Other
19%
7%
YES
73%
NO
27%
Do survey respondents expect their direct
employees to receive a salary increase?
SALES
4 2015/16 AUSTRALIA SALARY & EMPLOYMENT OUTLOOK
SALES
SALARY TABLES
Please note:
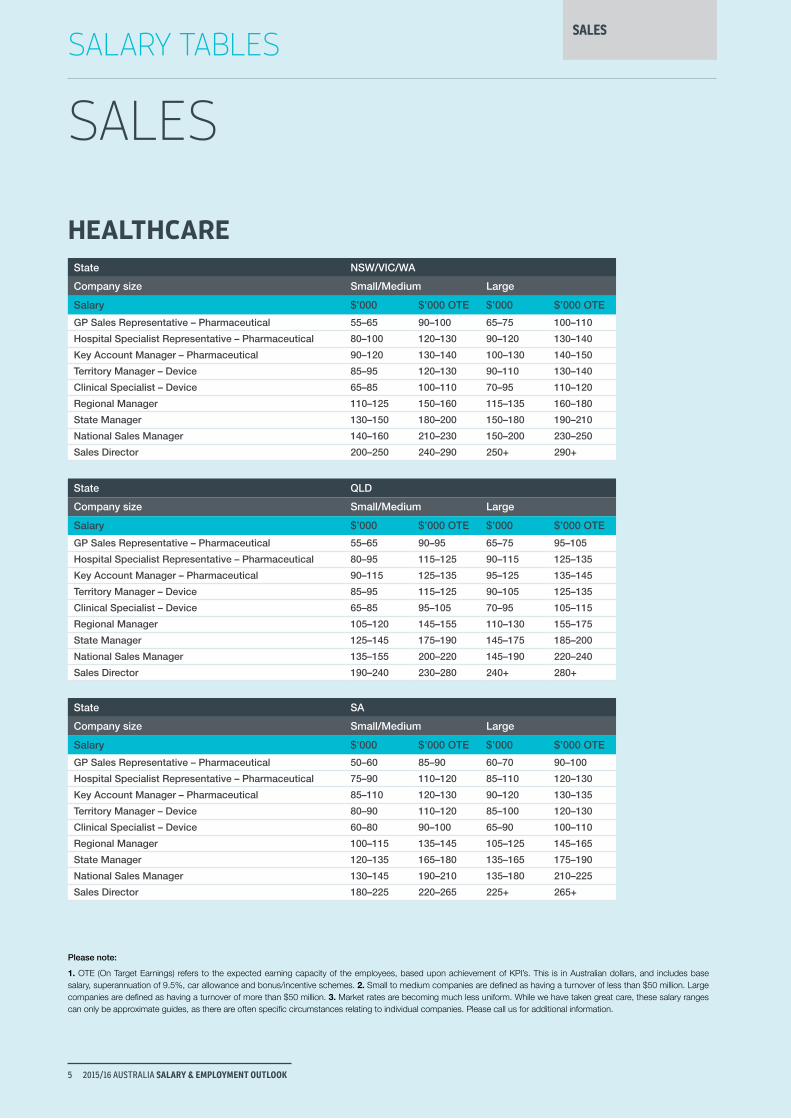
1. OTE (On Target Earnings) refers to the expected earning capacity of the employees, based upon achievement of KPI’s. This is in Australian dollars, and includes base salary, superannuation of 9.5%, car allowance and bonus/incentive schemes. 2. Small to medium companies are defined as having a turnover of less than $50 million. Large companies are defined as having a turnover of more than $50 million. 3. Market rates are becoming much less uniform. While we have taken great care, these salary ranges can only be approximate guides, as there are often specific circumstances relating to individual companies. Please call us for additional information.
HEALTHCAREState NSW/VIC/WA
Company size Small/Medium Large
Salary $’000 $’000 OTE $’000 $’000 OTE
GP Sales Representative – Pharmaceutical 55–65 90–100 65–75 100–110
Hospital Specialist Representative – Pharmaceutical 80–100 120–130 90–120 130–140
Key Account Manager – Pharmaceutical 90–120 130–140 100–130 140–150
Territory Manager – Device 85–95 120–130 90–110 130–140
Clinical Specialist – Device 65–85 100–110 70–95 110–120
Regional Manager 110–125 150–160 115–135 160–180
State Manager 130–150 180–200 150–180 190–210
National Sales Manager 140–160 210–230 150–200 230–250
Sales Director 200–250 240–290 250+ 290+
State QLD
Company size Small/Medium Large
Salary $’000 $’000 OTE $’000 $’000 OTE
GP Sales Representative – Pharmaceutical 55–65 90–95 65–75 95–105
Hospital Specialist Representative – Pharmaceutical 80–95 115–125 90–115 125–135
Key Account Manager – Pharmaceutical 90–115 125–135 95–125 135–145
Territory Manager – Device 85–95 115–125 90–105 125–135
Clinical Specialist – Device 65–85 95–105 70–95 105–115
Regional Manager 105–120 145–155 110–130 155–175
State Manager 125–145 175–190 145–175 185–200
National Sales Manager 135–155 200–220 145–190 220–240
Sales Director 190–240 230–280 240+ 280+
State SA
Company size Small/Medium Large
Salary $’000 $’000 OTE $’000 $’000 OTE
GP Sales Representative – Pharmaceutical 50–60 85–90 60–70 90–100
Hospital Specialist Representative – Pharmaceutical 75–90 110–120 85–110 120–130
Key Account Manager – Pharmaceutical 85–110 120–130 90–120 130–135
Territory Manager – Device 80–90 110–120 85–100 120–130
Clinical Specialist – Device 60–80 90–100 65–90 100–110
Regional Manager 100–115 135–145 105–125 145–165
State Manager 120–135 165–180 135–165 175–190
National Sales Manager 130–145 190–210 135–180 210–225
Sales Director 180–225 220–265 225+ 265+
SALES
5 2015/16 AUSTRALIA SALARY & EMPLOYMENT OUTLOOK

SALES
SALARY TABLES
Please note:
1. OTE (On Target Earnings) refers to the expected earning capacity of the employees, based upon achievement of KPI’s. This is in Australian dollars, and includes base salary, superannuation of 9.5%, car allowance and bonus/incentive schemes. 2. Small to medium companies are defined as having a turnover of less than $50 million. Large companies are defined as having a turnover of more than $50 million. 3. Market rates are becoming much less uniform. While we have taken great care, these salary ranges can only be approximate guides, as there are often specific circumstances relating to individual companies. Please call us for additional information.
CONSUMER GOODSState NSW/VIC/WA
Company size Small/Medium Large
Salary $’000 $’000 OTE $’000 $’000 OTE
Category Executive/Analyst 50–65 60–75 60–75 75–90
Category Manager 80–110 100–120 100–140 110–140
Territory Manager/Sales Representative 55–70 85–95 55–80 85–100
National Account Executive 70–85 100–110 80–100 110–120
Key Account Manager 70–85 100–110 80–110 110–130
National Account Manager – 4 years 110–130 130–150 120–160 160–180
State Manager – 7 years 130–160 160–190 150–180 180–210
National Business Manager 150–180 180–210 170–200 200–240
National Sales Manager 170–200 200–240 190–220 230–270
Head of Category 170–200 200–240 190–220 230–270
Sales Director 200–250 240–300 250+ 300+
State QLD
Company size Small/Medium Large
Salary $’000 $’000 OTE $’000 $’000 OTE
Category Executive/Analyst 50–65 60–75 60–75 75–90
Category Manager 80–105 95–115 95–135 105–135
Territory Manager/Sales Representative 55–70 85–95 55–80 85–95
National Account Executive 70–85 95–105 80–95 105–115
Key Account Manager 70–85 95–105 80–105 105–125
National Account Manager – 4 years 105–125 125–145 115–155 155–175
State Manager – 7 years 125–155 155–185 145–175 175–200
National Business Manager 145–175 175–200 165–190 190–230
National Sales Manager 165–190 190–230 185–210 220–260
Head of Category 165–190 190–230 185–210 220–260
Sales Director 190–240 230–285 240+ 285+
SALES
6 2015/16 AUSTRALIA SALARY & EMPLOYMENT OUTLOOK

SALES
SALARY TABLES
Please note:
1. OTE (On Target Earnings) refers to the expected earning capacity of the employees, based upon achievement of KPI’s. This is in Australian dollars, and includes base salary, superannuation of 9.5%, car allowance and bonus/incentive schemes. 2. Small to medium companies are defined as having a turnover of less than $50 million. Large companies are defined as having a turnover of more than $50 million. 3. Market rates are becoming much less uniform. While we have taken great care, these salary ranges can only be approximate guides, as there are often specific circumstances relating to individual companies. Please call us for additional information.
CONSUMER GOODSState SA
Company size Small/Medium Large
Salary $’000 $’000 OTE $’000 $’000 OTE
Category Executive/Analyst 45–60 55–70 55–70 70–85
Category Manager 75–100 90–110 90–130 100–130
Territory Manager/Sales Representative 50–65 80–90 50–75 80–90
National Account Executive 65–80 90–100 75–90 100–110
Key Account Manager 65–80 90–100 75–100 100–120
National Account Manager – 4 years 100–120 120–135 110–145 145–165
State Manager – 7 years 120–145 145–175 135–165 165–190
National Business Manager 135–165 165–190 155–180 180–220
National Sales Manager 155–180 180–220 175–200 210–245
Head of Category 155–180 180–220 175–200 210–245
Sales Director 180–225 220–270 225+ 270+
SALES
7 2015/16 AUSTRALIA SALARY & EMPLOYMENT OUTLOOK

SALES
SALARY TABLES
Please note:
1. OTE (On Target Earnings) refers to the expected earning capacity of the employees, based upon achievement of KPI’s. This is in Australian dollars, and includes base salary, superannuation of 9.5%, car allowance and bonus/incentive schemes. 2. Small to medium companies are defined as having a turnover of less than $50 million. Large companies are defined as having a turnover of more than $50 million. 3. Market rates are becoming much less uniform. While we have taken great care, these salary ranges can only be approximate guides, as there are often specific circumstances relating to individual companies. Please call us for additional information.
IT&TState NSW/VIC/WA
Company size Small/Medium Large
Salary $’000 $’000 OTE $’000 $’000 OTE
Sales Executive 55–75 100–120 65–85 110–130
Account Manager 60–80 100–120 65–90 110–130
Senior Account Manager – 5 years 90–120 120–140 100–140 130–150
Channel Manager 120–140 150–180 130–150 160–190
Technical Sales Manager 100–130 150–180 110–150 160–190
Business Development Manager 110–130 150–180 120–160 160–190
National Sales Manager 150–180 190–220 180–200 220–250
Sales Director 180–240 230–310 240+ 310+
State QLD
Company size Small/Medium Large
Salary $’000 $’000 OTE $’000 $’000 OTE
Sales Executive 55–75 95–115 65–85 105–125
Account Manager 60–80 95–115 65–90 105–125
Senior Account Manager – 5 years 90–115 115–135 95–135 125–145
Channel Manager 115–135 145–175 125–145 155–185
Technical Sales Manager 95–125 145–175 105–145 155–185
Business Development Manager 105–125 145–175 115–155 155–185
National Sales Manager 145–175 185–210 175–190 210–240
Sales Director 175–230 220–295 230+ 295+
State SA
Company size Small/Medium Large
Salary $’000 $’000 OTE $’000 $’000 OTE
Sales Executive 50–70 90–110 60–80 100–120
Account Manager 55–75 90–110 60–85 100–120
Senior Account Manager – 5 years 85–110 110–130 90–130 120–135
Channel Manager 110–130 135–165 120–135 145–175
Technical Sales Manager 90–120 135–165 100–135 145–175
Business Development Manager 100–120 135–165 110–145 145–175
National Sales Manager 135–165 175–200 165–180 200–225
Sales Director 165–220 210–280 220+ 280+
SALES
8 2015/16 AUSTRALIA SALARY & EMPLOYMENT OUTLOOK
SALES
SALARY TABLES
Please note:
1. OTE (On Target Earnings) refers to the expected earning capacity of the employees, based upon achievement of KPI’s. This is in Australian dollars, and includes base salary, superannuation of 9.5%, car allowance and bonus/incentive schemes. 2. Small to medium companies are defined as having a turnover of less than $50 million. Large companies are defined as having a turnover of more than $50 million. 3. Market rates are becoming much less uniform. While we have taken great care, these salary ranges can only be approximate guides, as there are often specific circumstances relating to individual companies. Please call us for additional information.
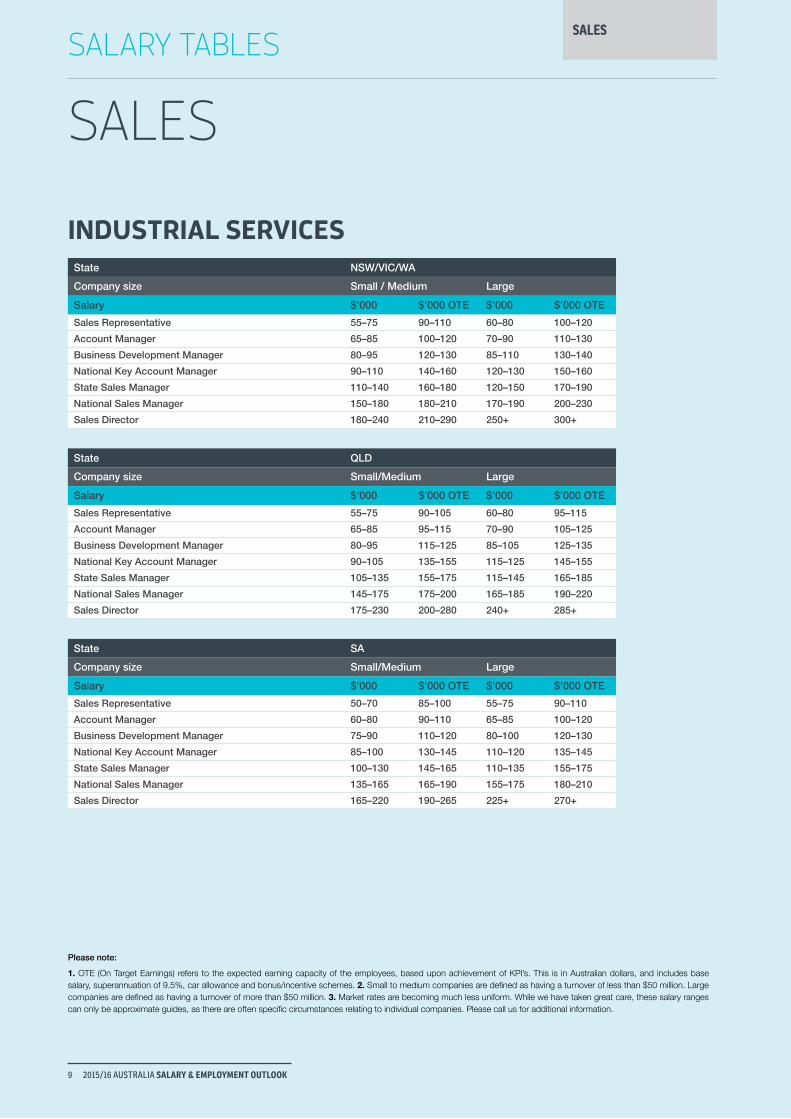
INDUSTRIAL SERVICESState NSW/VIC/WA
Company size Small / Medium Large
Salary $’000 $’000 OTE $’000 $’000 OTE
Sales Representative 55–75 90–110 60–80 100–120
Account Manager 65–85 100–120 70–90 110–130
Business Development Manager 80–95 120–130 85–110 130–140
National Key Account Manager 90–110 140–160 120–130 150–160
State Sales Manager 110–140 160–180 120–150 170–190
National Sales Manager 150–180 180–210 170–190 200–230
Sales Director 180–240 210–290 250+ 300+
State QLD
Company size Small/Medium Large
Salary $’000 $’000 OTE $’000 $’000 OTE
Sales Representative 55–75 90–105 60–80 95–115
Account Manager 65–85 95–115 70–90 105–125
Business Development Manager 80–95 115–125 85–105 125–135
National Key Account Manager 90–105 135–155 115–125 145–155
State Sales Manager 105–135 155–175 115–145 165–185
National Sales Manager 145–175 175–200 165–185 190–220
Sales Director 175–230 200–280 240+ 285+
State SA
Company size Small/Medium Large
Salary $’000 $’000 OTE $’000 $’000 OTE
Sales Representative 50–70 85–100 55–75 90–110
Account Manager 60–80 90–110 65–85 100–120
Business Development Manager 75–90 110–120 80–100 120–130
National Key Account Manager 85–100 130–145 110–120 135–145
State Sales Manager 100–130 145–165 110–135 155–175
National Sales Manager 135–165 165–190 155–175 180–210
Sales Director 165–220 190–265 225+ 270+
SALES
9 2015/16 AUSTRALIA SALARY & EMPLOYMENT OUTLOOK

SALES
SALARY TABLES
Please note:
1. OTE (On Target Earnings) refers to the expected earning capacity of the employees, based upon achievement of KPI’s. This is in Australian dollars, and includes base salary, superannuation of 9.5%, car allowance and bonus/incentive schemes. 2. Small to medium companies are defined as having a turnover of less than $50 million. Large companies are defined as having a turnover of more than $50 million. 3. Market rates are becoming much less uniform. While we have taken great care, these salary ranges can only be approximate guides, as there are often specific circumstances relating to individual companies. Please call us for additional information.
MEDIA & ENTERTAINMENTState NSW/VIC/WA
Company size Small/Medium Large
Salary $’000 $’000 OTE $’000 $’000 OTE
Account Manager – Agency 60–80 85–95 85–95 110–120
Account Manager – Direct 70–80 90–120 70–80 110–130
Business Development Manager 75–95 120–130 80–100 120–140
Group Sales Manager 100–110 130–140 110–130 150–170
National Sales Manager 110–130 130–150 130–160 150–170
Sales Director 140–160 150–180 180–220 200+
State QLD
Company size Small/Medium Large
Salary $’000 $’000 OTE $’000 $’000 OTE
Account Manager – Agency 60–80 85–95 85–95 105–115
Account Manager – Direct 70–80 90–115 70–80 105–125
Business Development Manager 75–95 115–125 80–95 115–135
Group Sales Manager 95–105 125–135 105–125 145–165
National Sales Manager 105–125 125–145 125–155 145–165
Sales Director 135–155 145–175 175–210 190+
State SA
Company size Small/Medium Large
Salary $’000 $’000 OTE $’000 $’000 OTE
Account Manager – Agency 55–75 80–90 80–90 100–110
Account Manager – Direct 65–75 85–110 65–75 100–120
Business Development Manager 70–90 110–120 75–90 110–130
Group Sales Manager 90–100 120–130 100–120 135–155
National Sales Manager 100–120 120–135 120–145 135–155
Sales Director 130–145 135–165 165–200 180+
SALES
10 2015/16 AUSTRALIA SALARY & EMPLOYMENT OUTLOOK
SALES
SALARY TABLES
Please note:
1. OTE (On Target Earnings) refers to the expected earning capacity of the employees, based upon achievement of KPI’s. This is in Australian dollars, and includes base salary, superannuation of 9.5%, car allowance and bonus/incentive schemes. 2. Small to medium companies are defined as having a turnover of less than $50 million. Large companies are defined as having a turnover of more than $50 million. 3. Market rates are becoming much less uniform. While we have taken great care, these salary ranges can only be approximate guides, as there are often specific circumstances relating to individual companies. Please call us for additional information.
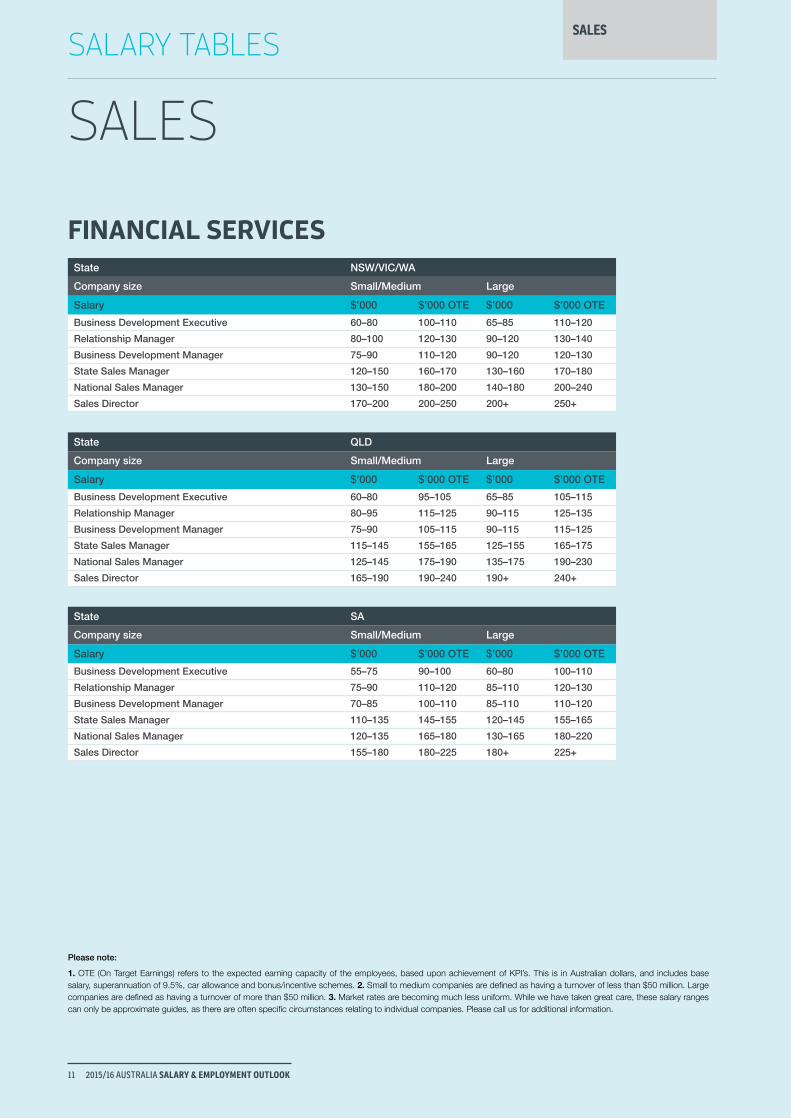
FINANCIAL SERVICESState NSW/VIC/WA
Company size Small/Medium Large
Salary $’000 $’000 OTE $’000 $’000 OTE
Business Development Executive 60–80 100–110 65–85 110–120
Relationship Manager 80–100 120–130 90–120 130–140
Business Development Manager 75–90 110–120 90–120 120–130
State Sales Manager 120–150 160–170 130–160 170–180
National Sales Manager 130–150 180–200 140–180 200–240
Sales Director 170–200 200–250 200+ 250+
State QLD
Company size Small/Medium Large
Salary $’000 $’000 OTE $’000 $’000 OTE
Business Development Executive 60–80 95–105 65–85 105–115
Relationship Manager 80–95 115–125 90–115 125–135
Business Development Manager 75–90 105–115 90–115 115–125
State Sales Manager 115–145 155–165 125–155 165–175
National Sales Manager 125–145 175–190 135–175 190–230
Sales Director 165–190 190–240 190+ 240+
State SA
Company size Small/Medium Large
Salary $’000 $’000 OTE $’000 $’000 OTE
Business Development Executive 55–75 90–100 60–80 100–110
Relationship Manager 75–90 110–120 85–110 120–130
Business Development Manager 70–85 100–110 85–110 110–120
State Sales Manager 110–135 145–155 120–145 155–165
National Sales Manager 120–135 165–180 130–165 180–220
Sales Director 155–180 180–225 180+ 225+
SALES
11 2015/16 AUSTRALIA SALARY & EMPLOYMENT OUTLOOK
SALES
SALARY TABLES
Please note:
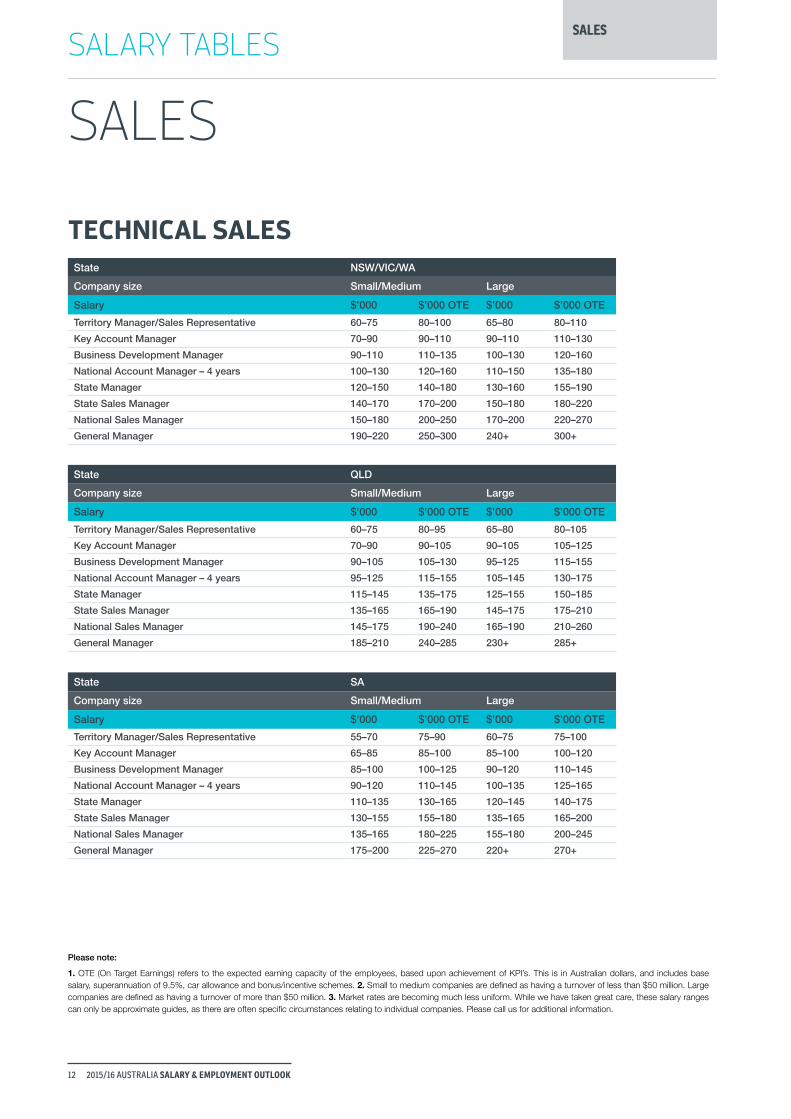
1. OTE (On Target Earnings) refers to the expected earning capacity of the employees, based upon achievement of KPI’s. This is in Australian dollars, and includes base salary, superannuation of 9.5%, car allowance and bonus/incentive schemes. 2. Small to medium companies are defined as having a turnover of less than $50 million. Large companies are defined as having a turnover of more than $50 million. 3. Market rates are becoming much less uniform. While we have taken great care, these salary ranges can only be approximate guides, as there are often specific circumstances relating to individual companies. Please call us for additional information.
TECHNICAL SALESState NSW/VIC/WA
Company size Small/Medium Large
Salary $’000 $’000 OTE $’000 $’000 OTE
Territory Manager/Sales Representative 60–75 80–100 65–80 80–110
Key Account Manager 70–90 90–110 90–110 110–130
Business Development Manager 90–110 110–135 100–130 120–160
National Account Manager – 4 years 100–130 120–160 110–150 135–180
State Manager 120–150 140–180 130–160 155–190
State Sales Manager 140–170 170–200 150–180 180–220
National Sales Manager 150–180 200–250 170–200 220–270
General Manager 190–220 250–300 240+ 300+
State QLD
Company size Small/Medium Large
Salary $’000 $’000 OTE $’000 $’000 OTE
Territory Manager/Sales Representative 60–75 80–95 65–80 80–105
Key Account Manager 70–90 90–105 90–105 105–125
Business Development Manager 90–105 105–130 95–125 115–155
National Account Manager – 4 years 95–125 115–155 105–145 130–175
State Manager 115–145 135–175 125–155 150–185
State Sales Manager 135–165 165–190 145–175 175–210
National Sales Manager 145–175 190–240 165–190 210–260
General Manager 185–210 240–285 230+ 285+
State SA
Company size Small/Medium Large
Salary $’000 $’000 OTE $’000 $’000 OTE
Territory Manager/Sales Representative 55–70 75–90 60–75 75–100
Key Account Manager 65–85 85–100 85–100 100–120
Business Development Manager 85–100 100–125 90–120 110–145
National Account Manager – 4 years 90–120 110–145 100–135 125–165
State Manager 110–135 130–165 120–145 140–175
State Sales Manager 130–155 155–180 135–165 165–200
National Sales Manager 135–165 180–225 155–180 200–245
General Manager 175–200 225–270 220+ 270+
SALES
12 2015/16 AUSTRALIA SALARY & EMPLOYMENT OUTLOOK