2015 u.k. consumer mobile payment study - tsys
TRANSCRIPT

2015 U.K. Consumer Mobile Payment Study
www.tsys.com
“Do you think someday we can open a bank account or ask for a loan without physically having to come to the bank?” — Bill Gates
TSYS® is excited to publish its first research report exploring mobile payments (m-payments)
in the U.K. The report includes information regarding U.K. consumer payment preferences and
other insights. The aim of this report is to provide valuable information to help our clients and
other stakeholders in navigating the current market trends for m-payments and related topics
like mobile banking, communication and retailer apps.
In line with our belief in keeping payments people-centred, this primary research is based on the end-user of the technologies explored. The goal of this research is two-fold:
1) to investigate consumers’ current behaviour; and 2) to understand how their attitudes and concerns could help predict future behaviour.
With the increase of choices among consumers, mobile payments is approaching a critical mass, if not maturity. In 2013, worldwide mobile payments reached $154 billion, and it has been predicted that this figure will reach $721 billion by 20171. In the U.K., mobile payments are expected to reach £53.6 billion in the next ten years, and 75 percent of the U.K. population is expected to have a smartphone by 20192.
According to The Financial Times3, U.K. consumers are increasingly using mobile phones and tablets to make purchases — with mobile spending reaching £9.7 billion last year. Moreover, the July 2015 launch of Apple pay in the U.K. will drive even more adoption of m-payments in the near future. These are positive indicators — but the market is still nascent.
1 Gartner, Inc., (2013). Gartner Says Worldwide Mobile Payment Transaction Value to Surpass $235 Billion in 2013. [Online]. 4 June 2013. Available at: http://www.gartner.com/newsroom/id/2504915 [Accessed on 14 July 2015]
2 Pymnts.com (2015). Twenty Need-To-Know Stats About U.K. Mobile Shopping. [Online]. 16 April 2015. Available at: http://www.pymnts.com/in-depth/2015/how-uk-consumers-use-mobile-to-shop/ [Accessed 14 July 2015]
3 Dunkley, E. (2015). Digital payments on the up but cash is still king. [Online]. Financial Times. 13 April 2015. Available at: http://www.ft.com/cms/s/0/938fc0e6-e1db-11e4-bb7f-00144feab7de.html#axzz3fsGiysOT [Accessed 14 July 2015]

2015 U.K. Consumer Mobile Payment Study
www.tsys.com2
About the Study
Our research is based on an online survey of 525 U.K. residents. The respondents covered diverse socio-demographics, including gender, age, income, occupational status and level of education. We required that the respondents possess a smartphone. We also required that the respondents be at least 18 years old, reside in the U.K. and own at least one credit card and one debit card. When reviewing the report, it is important to keep in mind that about 35 million U.K. residents who are more than 18 years old4 have a smartphone.
We asked payment-specific questions to comprehend consumers’ attitudes, preferences and perceptions regarding specific digital and mobile payment topics.
The report provides several insights from our primary research, and is organised as follows:
TABLE OF CONTENTS
I. SUMMARY OF STUDY’S KEY FINDINGS .....................................................................................................3
II. DETAILED FINDINGS
A. Communication apps penetration ......................................................................................................................5
B. Interaction with mobile banking app ..................................................................................................................8
C. Mobile payments .................................................................................................................................................8
i. General m-payments ......................................................................................................................................10
ii. Online m-payments ........................................................................................................................................10
iii. In-store m-payments ......................................................................................................................................10
III. ABOUT THE ONLINE SURVEY RESPONDENTS ........................................................................... 15
4 Deloitte Report (2014). Mobile consumers 2014. The UK cut revolution and evolution. [Online] Available at: http://www.deloitte.co.uk/mobileuk/assets/pdf/Deloitte_Mobile_Consumer_2014.pdf [Accessed 18 August 2015]

2015 U.K. Consumer Mobile Payment Study
www.tsys.com3
I. SUMMARY OF STUDY’S KEY FINDINGS
Key fact: 73 percent of the respondents are likely to use m-payments for in-store purchases in the next two years.
First Surprise: The rate of retailer app (e.g., Amazon, eBay, Tesco) ownership — 71 percent — is higher than that of communication apps such as WhatsApp, Skype and Viber. Among U.K. consumers, this indicates a positive preference toward m-payments, given the functionality of retailer apps in facilitating the m-payment process.
Second Surprise: Banking self-service processes are preferred by U.K. consumers in comparison to front- or back-office services such as branch and telephone banking. Significant attention should be paid to the growing trend of the m-banking app, which has obtained a high level of preference among U.K. consumers. What used to be the exclusive domain of the digital native is now adopted by all ages.
Third Surprise: 54 percent of respondents do not think that security is a benefit of m-payments in-store. More than 87 percent of respondents expressed interest in using m-payments technology if security and fraud protection were guaranteed.
The adoption of mobile banking apps is no longer the exclusive domain of “digital natives” (those born into the digital age).
a. d.
b. e.
c.
A third of respondents made an m-payment in the last three months. Further, those respondents who did so were highly satisfied with the experience.
Consumers expect m-payments to be an integral part of their shopping in just two years.
Consumers trust financial institutions more than any other type of organisation to safeguard their personal financial information.
Security is the overwhelming concern expressed by the majority of respondents.
1
2
3

2015 U.K. Consumer Mobile Payment Study
www.tsys.com4
II. DETAILED FINDINGS
A. Communication appsThis section details the usage level of specific texting and video call apps such as WhatsApp, Skype, Fring and Facetime in comparison to retailers, digital wallet and banking apps. The outcome was surprising, as we expected that the penetration of communication apps would have outpaced mobile banking apps — which in turn would have higher usage rates than retailer apps. The opposite is the case.
Question: Please select the option that best describes your usage of each of the following Mobile Apps for your smartphone or tablet listed below.*
* Respondents reporting having used particular app in the past six months
Observation: As shown in the graph, retailer apps surprisingly have the highest usage level (nearly 72 percent) among our respondents. This is followed by mobile banking and communication, at 59 and 58 percent respectively. The high penetration level in retailer apps among U.K. consumers likely reflects the user-friendliness of such apps.
B. Mobile Banking Apps and The Marmite EffectMobile banking apps refer to systems that allow customers of a financial institution to conduct a number of financial transactions (e.g., viewing account balances and transactions, moving money between accounts, making payments to new and existing payees and choosing how to receive account statements) through a mobile device such as a mobile phone or tablet. We investigated how often U.K. consumers digitally interact with a mobile banking app relative to other principal channels.
Graph 1
Retailer App (e.g. Amazon, eBay, Argos, Tesco)
Mobile Banking App
Communications App(e.g. Skype, WhatsApp, Fring)
Digital Wallet App(e.g. Starbucks)
72%
59%
58%
37%
Question: How often do you use each of the following methods to access your banking services?
* To help analyse the results, we grouped the answers in three ranges: “Never” — those who do not use a specific banking service”; “Occasionally” — those who use the banking service once a month or less; “Often” — those who use the channel more than once a month.
Observation: Traditional channels such as telephone and physical branch services have the lowest frequency of usage, confirming a popular belief in their diminishing roles in customer engagement. The data also provides insight into the importance of the self-service process. “Online banking,” “ATM” and “mobile banking apps” ranked in a very high position in terms of usage level. Furthermore, mobile banking app usage has obtained a “Marmite effect” of sorts: with two extremes — high usage and no usage at all. This suggests a lack of benefit-awareness among consumers not using the app. The implication for issuers with more robust m-banking apps is that they should educate cardholders about the benefits of those apps.
Online Banking
ATM
Mobile Banking App
Bank Branch
Telephone Banking
80% 14% 7%
74% 23% 3%
44% 14% 42%
29% 63% 8%
12% 42% 46%
Often Occasionally Never
Graph 2

2015 U.K. Consumer Mobile Payment Study
www.tsys.com5
Observation: There is a significant level of association between a bank’s size and its cardholders’ propensity to use mobile banking apps. As shown, customers of large-tier banks (Barclays, Lloyds, HSBC, RBS, etc.) are more likely to use mobile banking apps. This might reflect the comparatively hefty budgets larger banks enjoy for digital channel development. The takeaway here for larger banks is that, despite local and regional banks’ reputation for stronger customer relationships, larger banks can differentiate themselves in the digital era.
A similar analysis of age groups underscores the popular belief that younger cardholders are more likely to use mobile banking apps. However, we did not find statistical
differences in age groups under 45; the significant drop in usage levels is only in respondents 45 and older. What used to be exclusively the domain of the digital native is now leveraged by a wider age group. “Digital immigrants,” people that were not born in the digital era, use m-banking apps at a significant rate.
Rounding out the socio-demographics analysis, there is a significant level of association between gender, income level and m-banking usage level, meaning that males are more likely to use an m-banking app and that with the increase of income level there is an increase in the m-banking usage level. There is no association with the educational level of potential users.
M-banking App Usage By Bank Size
M-banking App Usage By Income Level M-banking App Usage By Age Group
M-banking App Usage By Gender
Large Banks Male
Less than £20,000 18 – 24
Medium Banks
Small Banks
64%
56%
46%
Female
67%
50%
£20,000 to £30,000
£30,000 to £50,000
£50,000 to £75,000
£125,000 or more
£75,000 to £125,000
46%
57%
64%
69%
62%
75%
25 – 34
35 – 44
45 – 54
65 and older
55 – 64
69%
66%
61%
44%
30%
35%
Bank size determined by number of debit and credit cards issued
Graph 3
Graph 5
Graph 6Graph 4

2015 U.K. Consumer Mobile Payment Study
www.tsys.com6
Our conclusion is that large banks should continue to exploit this digital superiority, especially amongst users between the age of 18 and 44. Moreover, all tiers of banks need to build stronger strategies to drive further digital engagement for those cardholders who have not adopted the digital channel as fully (age groups older than 45).
Among the respondents that downloaded the mobile banking app, we identified the most popular actions undertaken in the last six months.
Question: Using your mobile phone and banking app, which actions have you taken in the past six months? Please select all that apply.
Observation: We anticipated the high popularity of more passive actions such as “checked account balance” and “checked recent transaction,” at 80 and 75 percent respectively. Interestingly, more active events like “transferred money between bank accounts” and “made a bill payment” ranked highly too. More than 60 percent of respondents have used their mobile banking app for those purposes. It can be inferred that a high level of our respondents have confidence in conducting financial transactions via a mobile device. There is a corresponding
opportunity to proactively engage cardholders with alerts, especially considering the popularity of activities such as “checked an account balance” and “checked a recent transaction.” Cardholders seem to see value in self-determining when and how they receive alerts (e.g., when the balance is below a predetermined threshold or after each transaction). For further evidence, see Graph 7.
We also analysed the potential reasons that might lead to a respondent not using a mobile banking app.
Question: There could be many reasons you might choose not to use a mobile banking app. Please indicate your agreement or disagreement with the following statements.
Observation: The top reason given for not using m-banking apps is “My banking needs are being met without mobile banking.” This is consistent with responses regarding the usage level of specific banking services as per Graph 2. In effect, ATM and online banking have a higher usage level than that of mobile banking apps. However, it is evident that security is one of the most significant factors that can lead consumers to avoid using mobile banking apps — whereas the dimension of the screen has the lowest impact. In sum, banks should ensure a secure experience and educate customers regarding that security.
Checked an account balance
Checked recent transactions
Transferred money between bank accounts
Made a bill payment
Received an alert from your bank (e.g., a text message or email)
Located the closest in-network ATM or bank branch
Deposited a cheque to your account electronically using your mobile phone camera
Other (e.g., changed address)
84%
69%
64%
63%
46%
32%
14%
1%
Graph 7
Age
Gender
Income Level
35
Male
£35,000
Profile of typical U.K. user of m-banking app
My banking needs are being met without mobile banking
I am concerned about the security of mobile banking apps
The mobile phone screen is too small
58% 20% 22%
53% 21% 26%
40% 24% 37%
Agree Neutral Disagree
Graph 8

2015 U.K. Consumer Mobile Payment Study
www.tsys.com7
C. Mobile payments In this section, we explore the behaviour and attitudes of U.K. consumers in the area of m-payments. There are several payment methods that individuals can use in different locations and circumstances. We define m-payments as payments that can be made directly from mobile devices. In order to assure that respondents would understand our interpretation of m-payments, we provided the aforementioned definition and also showed an explanatory video clip regarding the process of m-payments in-store.
This section explores:i. General m-paymentsii. M-payments on-lineiii. M-payments in-store
i. General m-payments Globally, m-payments have grown dramatically with a compound annual growth rate (CAGR) of 58.5 percent in transactions from 2010 to 20145. The respondents corroborate such positive indicators.
Rogers Diffusion of Innovation: Adopter Categories
Innovators Early Adopters Early Majority
Critical Mass
Laggards
Time
Late Majority
2.5% 13.5% 34.0% 34.0% 16.0%
Please select the option that best describes your usage of M-Banking Apps
Use it daily Use it a few times a week
Use it a few times a month
Hyper Accomplished Emerging
Digital Capability
Use it once a month Use it less than monthly Do not use
41.5% 41.9%16.6%
6.7% 7.2% 41.9%9.9%17.7%16.6%
Segmenting the Respondents by Digital Capability
As demographics are no longer sufficient to differentiate in an era where all have equal access to digital tools, we segmented our respondents in three categories based on their level of digital capabilities.
According to Rogers’ theory of the diffusion of innovation6, there are five different types of technology adopters linked to a specific innovation: Innovators, Early Adopters, Early Majority and Late Majority and Laggards. For this study, we grouped the five Rogers categories into three groups in
order to simplify the analysis. We also used the ownership of an m-banking app as a proxy to segment our sample:
• Hyper Digitals represent the “Innovators” and “Early Adopters” categories. In our context, they are the respondents that use daily the app.
• Accomplished Digitals represent the “Early Majority” and “Late Majority” categories. In other words, they are the respondents that use the app from less than monthly to a few times a week.
• Emerging Digitals represent the “Laggards” category of the Rogers theory. These respondents simply do not have m-banking apps yet.
5 Capgemini (2013). Word-payment report. [Online]. Available at https://www.capgemini.com/resource-file-access/resource/pdf/wpr_2013.pdf [Accessed 25 July 2015]
6 Rogers, E.M. (2003). Diffusion of innovations (5th ed.). New York: Free Press.

2015 U.K. Consumer Mobile Payment Study
www.tsys.com8
Question: Have you made mobile payments using your smartphone in the last six months?
Observation: A third of respondents have made an m-payment in the last six months. As anticipated, the Hyper Digitals have the highest percentage of usage (56 percent), followed by the Accomplished and Emerging categories with 46 and 8 percent respectively.
While not everyone has used m-payments, those who do are very satisfied. Eighty one percent of respondents who made an m-payment reported a good to excellent level of satisfaction — and only 2 percent reported a “poor” experience.
Yes33%No
67%
Level of Satisfaction Among 33% Who Report Having Used M-Payments
Yes33%No
67%
Good
Excellent
Average
Poor
26%
17%
2%
Level of Satisfaction Among 33% Who Report Having Used M-Payments
Graph 9
55%26%
17%
2%
GoodExcellentAveragePoor
Usage of m-payments across digital categories
Hyper
Accomplished
Emerging
Overall
56%
46%
8%
33%
Graph 10
Adop
tion
Rat
e %
Time
Hyper
Accomplished
Emerging
>>
SatisfactoryExperienceSatisfactoryExperience
Word of MouthWord of MouthTrialTrial
Established User / Increase AdoptionEstablished User / Increase Adoption
SatisfactoryExperienceSatisfactoryExperience
Word of MouthWord of MouthTrialTrial
Established User / Increase AdoptionEstablished User / Increase Adoption
SatisfactoryExperienceSatisfactoryExperience
Word of MouthWord of MouthTrialTrial
Established User / Increase AdoptionEstablished User / Increase Adoption
Customer Satisfaction Drives Adoption
There is also a recognised link between customer satisfaction and retention and word-of-mouth advocacy. Given this connection and the strong satisfaction level of those who used m-payments, we expect the cycle of trial, adoption and user-base growth to reach critical mass in the near term.
2015 U.K. Consumer Mobile Payment Study
www.tsys.com9
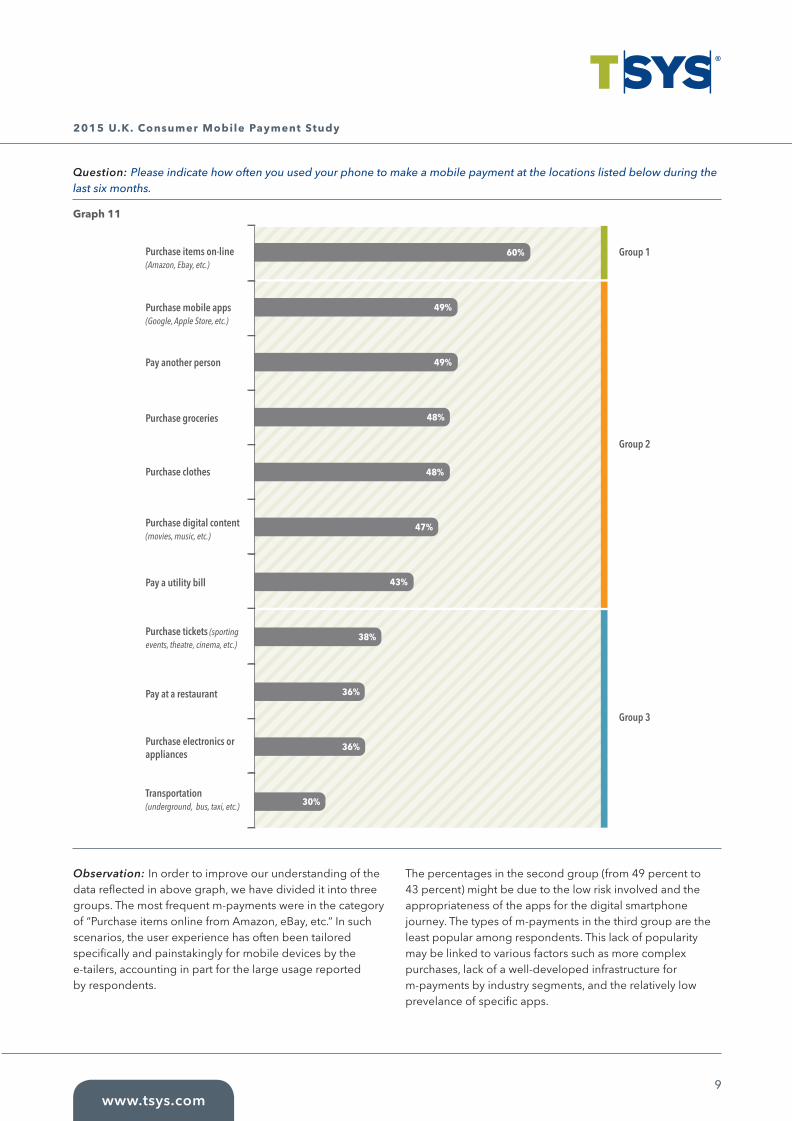
Question: Please indicate how often you used your phone to make a mobile payment at the locations listed below during the last six months.
Observation: In order to improve our understanding of the data reflected in above graph, we have divided it into three groups. The most frequent m-payments were in the category of “Purchase items online from Amazon, eBay, etc.” In such scenarios, the user experience has often been tailored specifically and painstakingly for mobile devices by the e-tailers, accounting in part for the large usage reported by respondents.
The percentages in the second group (from 49 percent to 43 percent) might be due to the low risk involved and the appropriateness of the apps for the digital smartphone journey. The types of m-payments in the third group are the least popular among respondents. This lack of popularity may be linked to various factors such as more complex purchases, lack of a well-developed infrastructure for m-payments by industry segments, and the relatively low prevelance of specific apps.
Purchase items on-line (Amazon, Ebay, etc.)
Purchase mobile apps (Google, Apple Store, etc.)
Pay another person
Group 1
Group 2
Group 3
Purchase groceries
Purchase clothes
Purchase digital content (movies, music, etc.)
Pay a utility bill
Purchase tickets (sporting events, theatre, cinema, etc.)
Pay at a restaurant
Purchase electronics or appliances
Transportation (underground, bus, taxi, etc.)
60%
49%
49%
48%
48%
47%
43%
38%
36%
30%
36%
Graph 11

2015 U.K. Consumer Mobile Payment Study
www.tsys.com10
Question: How likely would you be to use your smartphone to make a mobile payment in the following scenarios?
* Percentage of respondents selecting “likely” and ”very likely”.
Observation: Having examined actual consumer behaviour, we then analysed their potential behaviour, investigating their propensity to make m-payments in specific circumstances. “Supermarkets,” “coffee shops” and “department stores” ranked highest for potential use of m-payments. These areas seem to hold the most short-term promise for m-payments, but the overall data also indicates long-term attractiveness in the entire m-payments space.
Supermarket
Coffee shop
Department store
Payment to individuals (friends, family, handy man, etc.)
Restaurant
Car parking
Paying bills (utility, phone, cable, etc.)
Holiday travel
DIY
43%
59%
41%
62%
39%
56%
39%
64%
38%
52%
36%
54%
35%
63%
28%
44%
27%
40%
Overall Hyper
Graph 12
Question: There are a number of sources from which you can get an app for your smartphone to facilitate making a mobile payment. Whose mobile payment app would you most trust to safeguard your personal and financial information?
Observation: When it comes to using mobile apps for payments, respondents trust their primary financial institutions to safeguard their personal financial information much more than any other type of company. This is consistent with market data from other international markets, particularly the U.S. Indeed a 2014 PwC report7 showed a similar attitude among U.S. consumers regarding their financial information. While many mobile device manufacturers and operating systems are launching new apps promising users a secure and easy mobile payment experience, banks should act now to leverage this position of trust.
My primary financial institution / bank
Payment card scheme (Visa, Mastercard, American Express, etc.)
Mobile device manufacturer (Apple, Nokia, Blackberry, etc.)
Online retailer (Amazon, Ebay, Argos, etc.)
High street retailer (Currys, M&S, Boots, etc.)
Mobile network operator (Vodafone, EE, O2, etc.)
Mobile device operating system provider (Android, Microsoft, etc.)
62%
2%
2%
2%
3%
11%
18%
Graph 13
7 PwC report (2014). Consumer Intelligence Series: Opening the Mobile Wallet. [Online]. Available at : http://www.pwc.de/de_DE/de/technologie-medien-und-telekommunikation/assets/pwc-consumer-intelligence-series-mobile-wallet.pdf [accessed 25 July 2015]

2015 U.K. Consumer Mobile Payment Study
www.tsys.com11
Question: How influential would the following features be in attracting you to use mobile payments on your smartphone? On a scale of one (1) [not influential] to five (5) [very influential]
* Percentage of respondents selecting “somewhat influential,” “influential,” “very influential”
Observation: Loyalty incentives rank highly, with 68 percent for the “ability to install all my loyalty cards in the phone,” 67 percent for “special offers or discounts provided at the time of the purchase,” and 65 percent for “reward program associated with a specific mobile app.” These incentives are only surpassed by security and self-direction, which rank at 87 percent and 77 percent respectively. The lowest influencers were the possibility to leave the physical wallet at home and the opportunity to instantly apply and obtain approval for a new credit or debit card account directly from the smartphone.
ii. M-payment onlineFor this section, we define online m-payments as those payments made with a mobile device using an Internet connection via a Web browser or an app. Our aim was to determine those devices consumers prefer to use in shopping online.
Question: When shopping online (check out and pay) how often do you use different devices?
* Percentage of respondents who report having used selected devices
Observation: The device used most often is the PC/laptop, immediately followed by the smartphone. This result is consistent with the popular belief that consumers feel more secure when they shop online via a computer, especially for expensive purchases. However, it is important to note the contrast with the Hyper Digitals, who are likely to use a smartphone more than any other device for shopping online. As Rogers’ diffusion of innovation theory suggests, we expect an increase in smartphone adoption for shopping online in the near future — increasing overall m-payment transactions as well.
Security and fraud protection
Ability to instantly check my balance
Ability to install all my loyalty cards in the phone
Special offers or discounts provided at the time of purchase
Not having to enter my PIN in the presence of clerks
Reward program associated with the specific mobile app
Ability to scan items in the store and check out on my smartphone
Ability to leave my physical wallet at home
Instant application and approval of a new credit card account directly from your phone
87%
49%
54%
65%
65%
66%
67%
68%
77%
Graph 14
PC or laptop
Smartphone
Tablet
73%
82%
62%
91%
60%
74%
Overall Hyper
Graph 15

Question: Based on the video showing everyday usage of a mobile wallet, how would you rate the following statements?
* Percentage of respondents selecting “agree” and
“strongly agree”
Observation: Seventy five percent of respondents recognise the self-direction capabilities of “checking the current balance immediately” as clear benefits of m-payments in-store. Not having to enter their PIN in the presence of others (71 percent) and not showing personal identification documents (70 percent) were next in the most prominently recognised benefits. From these responses overall, we can infer that the common perception is that m-payments are easy, fast and convenient — but not secure.
www.tsys.com12
2015 U.K. Consumer Mobile Payment Study
iii. M-payment in storeWe define m-payments in store as payments made between a mobile device and point of sale (POS) whereby the payment transaction is transferred to a sales terminal via Wifi, NFC or Bluetooth. For a consistent understanding among respondents, we showed a video example of how in-store m-payments work.
We then analysed the perception and attitudes of U.K. consumers.
Question: Over the next two years, what percentage of your in-store purchases made with your phone (as described in the video) will replace your use of physical, plastic credit and debit cards?
Observation: Although the current usage level of m-payments is 33 percent of the respondents (as shown in Graph 9), the potential is promising. Seventy three percent of respondents report being likely to use in-store payments in the next two years, and 42 percent said they would use m-payments in-store for at least 50 percent of their purchases.
We also inquired about the perceived benefits of and concerns with using m-payments in-store.
I can see my current balance immediately
I do not have to enter my PIN in the presence of clerks
I do not have to show my personal documents
It is easy to use
It is a faster way to pay
I can leave my wallet at home
It is secure
74%
46%
53%
67%
69%
70%
71%
Graph 17
3%27% 31% 25% 14%
100% of purchases
75% of purchases50% of purchases
25% of purchases0% of purchases
Graph 16

2015 U.K. Consumer Mobile Payment Study
www.tsys.com13
Question: Please share your degree of concern based on the following statements.
* Percentage of respondents selecting “somewhat concerned”, “moderately concerned” and “extremely concerned”
Observation: The most common concerns related to fraud and information security, which is consistent with responses depicted in Graph 17. Other leading concerns are linked to the inability to make purchases due to phone loss or a dead battery.
Privacy was also an issue, with almost half of the respondents expressing concern that their shopping history and habits might be tracked. At the other end of the scale, respondents’ technical ability was not a concern for the vast majority.
Responses to the previous two questions illustrate a popular belief in inherent security issues with m-payments. As such, there is a great opportunity to dispel such preconceptions through marketing campaigns highlighting how m-payments enjoy the same fraud protection as physical card-based transactions. Specifically, promotional tactics explaining the benefits of tokenisation may prompt consumers to adopt m-payments that employ this security feature.
The risk of losing my phone and my information being stolen
The risk that someone could steal my information when it is sent wirelessly
Limited battery life could prevent my making a purchase
Not being able to pay for a purchase if my phone is lost or stolen
The possibility that all my shopping experience is tracked
It can be used only in a specific situation
My lack of technical knowledge
58%
21%
26%
45%
47%
48%
49%
Graph 18
Question: What purchase amount limit would be most appealing to you when using your smartphone to make a mobile payment for in-store purchases?
Observation: We investigated the most appealing purchase limit for m-payments in-store. While analysing this section, it is important to keep in mind that the current contactless card payment limit imposed by the U.K. network was increased from £20 to £30 as of 1 September, meaning transactions under £30 no longer require a PIN. In other countries like the U.S., higher-value contactless transactions are allowed provided that a PIN is entered or certain biometric identification processes are used.
It is interesting to note that 47 percent of respondents would spend more than the erstwhile limit — when it was £20 — and only 22 percent would consider spending less than the actual limit at the time of the survey. This is something that the industry at large should consider in the near future, especially if the aim is to help m-payment growth. Further, with the advent of biometrics, such transactions should be much more secure, obviating the need for any purchase amount limits.
24% 31%
22%
7%
16%
Less than £10 Less than £20
Less than £100Less than £50I would not want a limit
Graph 19

www.tsys.com14
2015 U.K. Consumer Mobile Payment Study
III. ABOUT THE ONLINE SURVEY RESPONDENTS
We can say with 95-percent confidence that our survey sample represents the approximately 30 million of U.K. population that meet the following criteria:
• Holds a debit card • Holds a credit card• Has a smartphone• Is at least 18 years old
Further information on respondents as follows (graph not to scale):
UK population64.1 million
Credit card cardholders31.3 million
Debit card cardholders48.5 million
Smartphone owners over 18 years old
35 million
Gender
Male 49%Female 51%

2015 U.K. Consumer Mobile Payment Study
www.tsys.com15
18-24 25-3445-54
35-4465 or older55-64
Age
24%
25%
5%
13%12%
21%
Education
8%
28%
27%
18%
7%
1%
11%
Incomplete secondary education (Below GCSE/O-level)Secondary education completed (A-level or equivalent)Some vocational or technical qualificationsVocational or technical qualifications completed (E.g. HND, NVQ)
Prefer not to answer
University education completed (e.g. BA, BSc) Postgraduate degree or equivalent
< £20,000 £20,000 — £30,000
£50,000 — £75,000£30,000 — £50,000
> £125,000£75,000 — £125,000Prefer not to answer
Income
26% 23%
1%
7%
4%
25%
14%
Type of owned smartphone
54%
33%
9%
2%
2%
An Apple iPhoneAn Android-based smartphoneA Blackberry smartphoneA Microsoft-based smartphoneOther type of smartphone

2015 U.K. Consumer Mobile Payment Study
© 2015 Total System Services, Inc.®. All rights reserved worldwide. Total System Services, Inc., and TSYS® are federally registered service marks of Total System Services, Inc., in the United States. Total System Services, Inc., and its affiliates own a number of service marks that are registered in the United States and in other countries. All other products and company names are trademarks of their respective companies. (10/2015)
to learn more
contact +44 (0) 1904 56200 or email [email protected].
twitter.com/tsys_tss
facebook.com/tsys1
linkedin.com/company/tsys
About TSYSAt TSYS® (NYSE: TSS), we believe payments should revolve around people, not the other way aroundSM.We call this belief “People-Centered Payments®.” By putting people at the center of every decisionwe make, TSYS supports financial institutions, businesses and governments in more than 80 countries.
TSYS’ headquarters are located in Columbus, Ga., U.S.A., with local offices spread across the Americas,EMEA and Asia-Pacific. TSYS is a member of The Civic 50 and was named one of the 2015 World’sMost Ethical Companies by Ethisphere magazine. TSYS routinely posts all important information onits website. For more, please visit us at www.tsys.com.