2015 state teacher policy yearbook · 2015 state teacher policy yearbook . ... improvement plan....
TRANSCRIPT
47
Educational Personnel: Demographics, Salaries, Professional Development, and
Performance Evaluations
2015 STATE TEACHER POLICY YEARBOOK
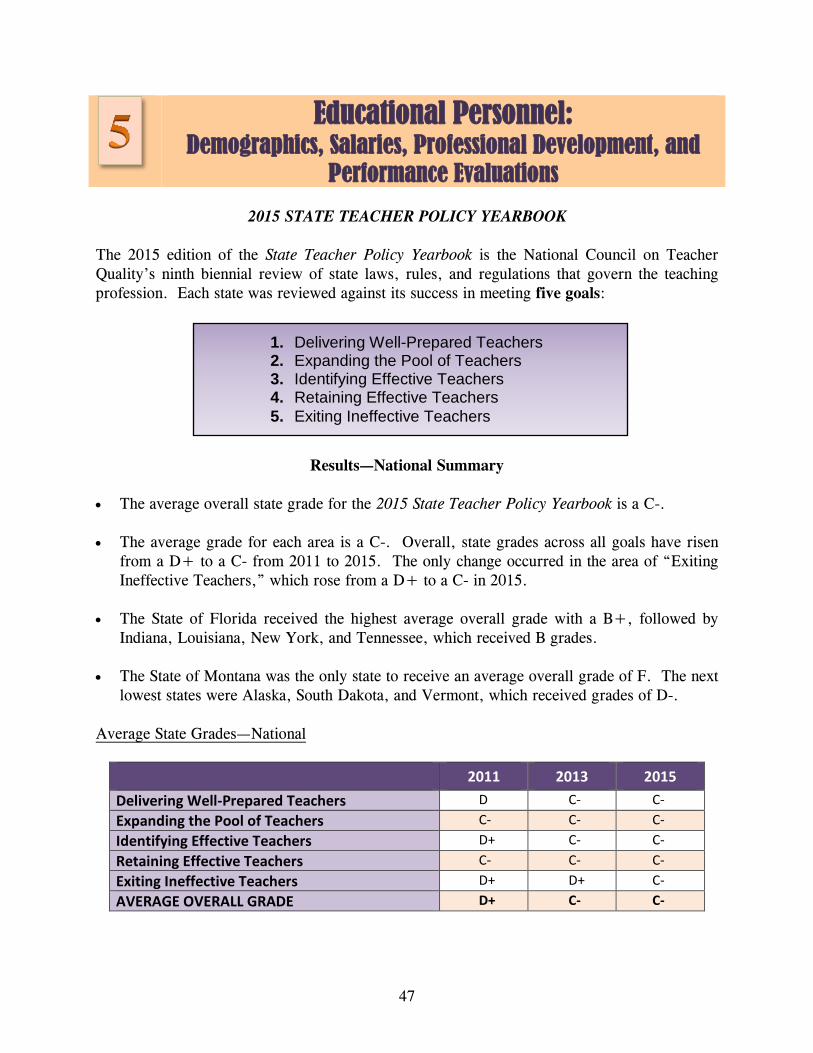
The 2015 edition of the State Teacher Policy Yearbook is the National Council on Teacher Quality’s ninth biennial review of state laws, rules, and regulations that govern the teaching profession. Each state was reviewed against its success in meeting five goals:
Results—National Summary • The average overall state grade for the 2015 State Teacher Policy Yearbook is a C-. • The average grade for each area is a C-. Overall, state grades across all goals have risen
from a D+ to a C- from 2011 to 2015. The only change occurred in the area of “Exiting Ineffective Teachers,” which rose from a D+ to a C- in 2015.
• The State of Florida received the highest average overall grade with a B+, followed by
Indiana, Louisiana, New York, and Tennessee, which received B grades. • The State of Montana was the only state to receive an average overall grade of F. The next
lowest states were Alaska, South Dakota, and Vermont, which received grades of D-. Average State Grades—National
2011 2013 2015
Delivering Well-Prepared Teachers D C- C- Expanding the Pool of Teachers C- C- C- Identifying Effective Teachers D+ C- C- Retaining Effective Teachers C- C- C- Exiting Ineffective Teachers D+ D+ C- AVERAGE OVERALL GRADE D+ C- C-
1. Delivering Well-Prepared Teachers 2. Expanding the Pool of Teachers 3. Identifying Effective Teachers 4. Retaining Effective Teachers 5. Exiting Ineffective Teachers
Chapter 5
48
Results—State of Nevada
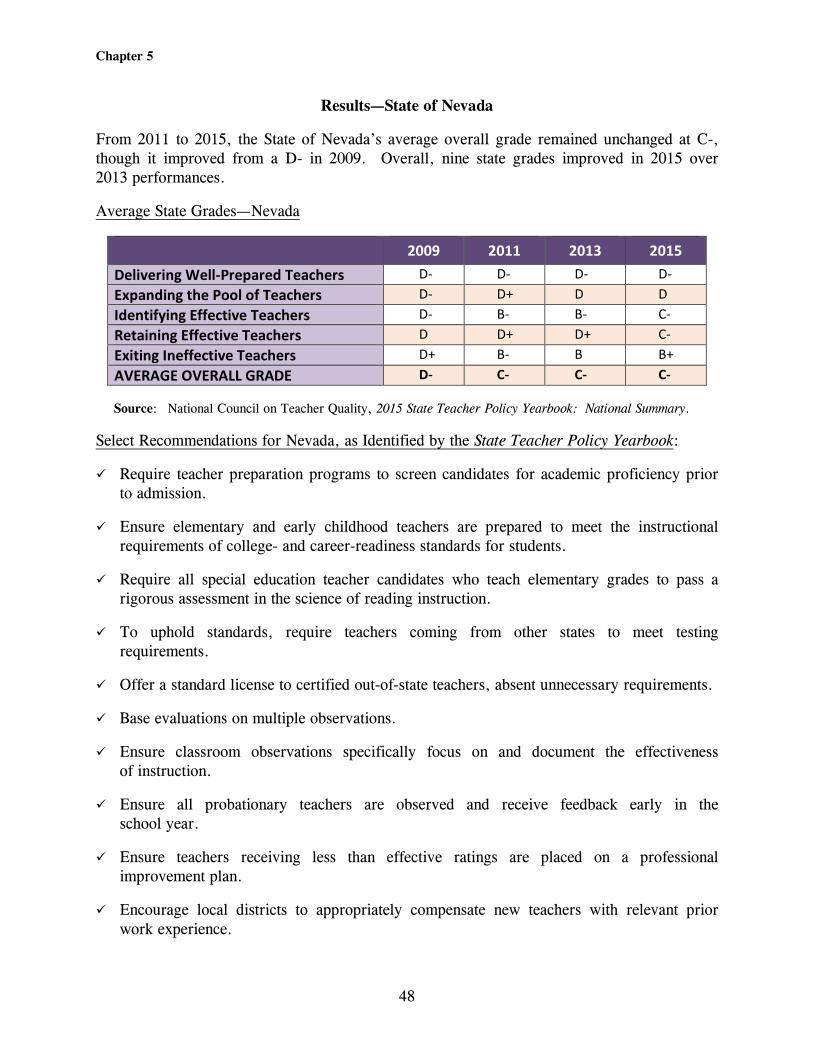
From 2011 to 2015, the State of Nevada’s average overall grade remained unchanged at C-, though it improved from a D- in 2009. Overall, nine state grades improved in 2015 over 2013 performances.
Average State Grades—Nevada
2009 2011 2013 2015 Delivering Well-Prepared Teachers D- D- D- D- Expanding the Pool of Teachers D- D+ D D Identifying Effective Teachers D- B- B- C- Retaining Effective Teachers D D+ D+ C- Exiting Ineffective Teachers D+ B- B B+ AVERAGE OVERALL GRADE D- C- C- C-
Source: National Council on Teacher Quality, 2015 State Teacher Policy Yearbook: National Summary.
Select Recommendations for Nevada, as Identified by the State Teacher Policy Yearbook:
Require teacher preparation programs to screen candidates for academic proficiency prior to admission.
Ensure elementary and early childhood teachers are prepared to meet the instructional requirements of college- and career-readiness standards for students.
Require all special education teacher candidates who teach elementary grades to pass a rigorous assessment in the science of reading instruction.
To uphold standards, require teachers coming from other states to meet testing requirements.
Offer a standard license to certified out-of-state teachers, absent unnecessary requirements.
Base evaluations on multiple observations.
Ensure classroom observations specifically focus on and document the effectiveness of instruction.
Ensure all probationary teachers are observed and receive feedback early in the school year.
Ensure teachers receiving less than effective ratings are placed on a professional improvement plan.
Encourage local districts to appropriately compensate new teachers with relevant prior work experience.

Chapter 5
49
Grades—Western States
State
GOAL
Delivering Well-
Prepared Teachers
Expanding the Pool
of Teachers
Identifying Effective Teachers
Retaining Effective Teachers
Exiting Ineffective Teachers
Average Overall Grade
Arizona D+ D+ C C- D+ C-
California D+ D+ F C+ F D
Colorado D D+ B C C+ C
Idaho D+ D C+ D- C C-
Montana F F F D- F- F
Nevada D- D C- C- B+ C-
New Mexico D+ D C C+ C C
Oregon D+ F D- C F D
Utah C D+ D+ B B- C+
Washington D C+ C- C- C- C-
Wyoming D- F D+ D D+ D
National C- C- C- C- D+ C-
Source: National Council on Teacher Quality, 2015 State Teacher Policy Yearbook: National Summary.
Nevada’s 2016 Michael Landsberry Teacher of the Year was John Tierney of Adobe Middle School in the Elko County School District.

Chapter 5
50
FULL-TIME EQUIVALENTS (FTEs)
Nevada Teaching Personnel and Student Enrollment SY 2005–2006 Through SY 2013–2014
2005–2006
2006–2007
2007–2008
2008–2009
2009–2010
2010–2011
2011–2012
2012–2013
2013–2014
Total Teaching Personnel (FTE)* 21,744 22,908 23,423 21,993 22,104 21,839 21,132 20,695 21,921
Total Teaching Personnel: Percent
Change From Previous Year
3.8% 5.4% 2.2% -6.1% 0.5% -1.2% -3.2% -2.1% 5.9%
Total Public Student Enrollment 412,395 424,766 429,362 433,371 428,947 437,149 439,634 445,707 451,831
Total Public Student Enrollment: Percent
Change From Previous Year
3.1% 3.0% 1.1% 0.9% -1.0% 1.9% 0.6% 1.4% 1.4%
*Teaching Personnel includes: elementary school teachers; middle school teachers; secondary school teachers; special education teachers; and occupational teachers. Source: U.S. Department of Education, National Center for Education Statistics, Common Core of Data, State
Nonfiscal Public Elementary/Secondary Education Survey, 2013–14 v.1a.
-7%-6%-5%-4%-3%-2%-1%0%1%2%3%4%5%6%7%
2005-2006 2006-2007 2007-2008 2008-2009 2009-2010 2010-2011 2011-2012 2012-2013 2013-2014
Percentage Change in Teaching Personnel and Student Enrollment in Nevada
Total Teaching Personnel: Percent Change from Previous Year
Total Student Enrollment: Percent Change from Previous Year
Chapter 5
51
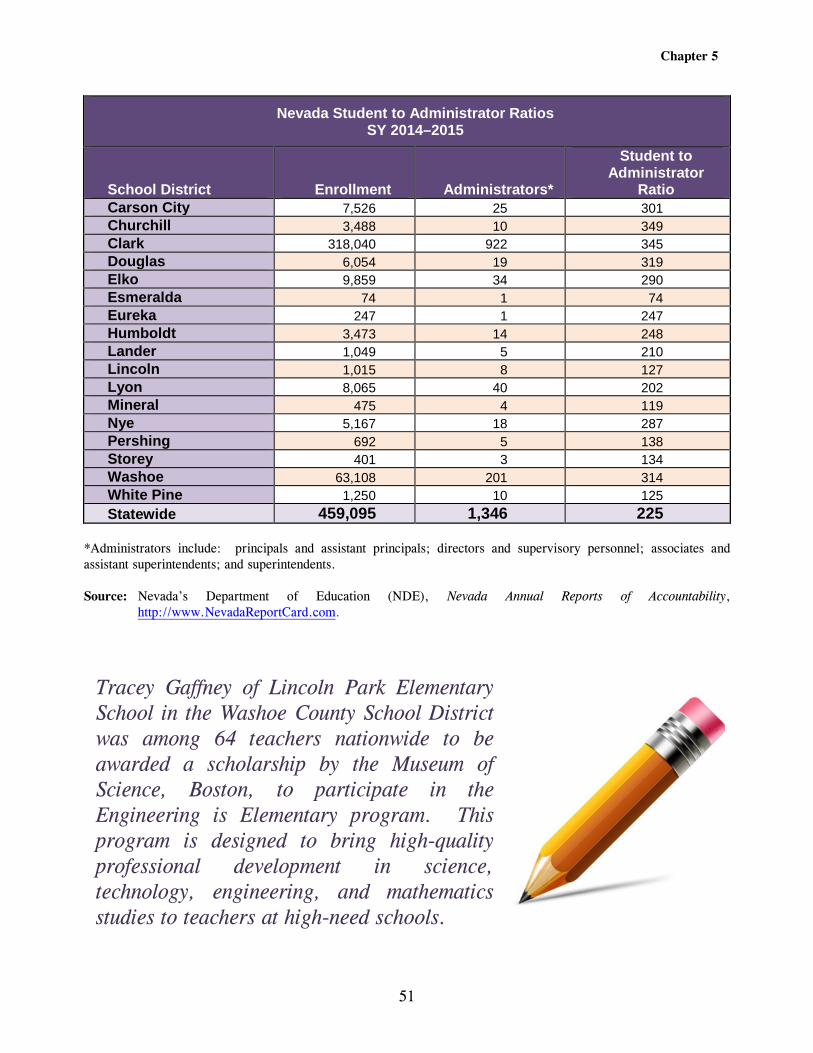
Nevada Student to Administrator Ratios SY 2014–2015
School District Enrollment Administrators*
Student to Administrator
Ratio Carson City 7,526 25 301 Churchill 3,488 10 349 Clark 318,040 922 345 Douglas 6,054 19 319 Elko 9,859 34 290 Esmeralda 74 1 74 Eureka 247 1 247 Humboldt 3,473 14 248 Lander 1,049 5 210 Lincoln 1,015 8 127 Lyon 8,065 40 202 Mineral 475 4 119 Nye 5,167 18 287 Pershing 692 5 138 Storey 401 3 134 Washoe 63,108 201 314 White Pine 1,250 10 125 Statewide 459,095 1,346 225
*Administrators include: principals and assistant principals; directors and supervisory personnel; associates and assistant superintendents; and superintendents.
Source: Nevada’s Department of Education (NDE), Nevada Annual Reports of Accountability,
http://www.NevadaReportCard.com.
Tracey Gaffney of Lincoln Park Elementary School in the Washoe County School District was among 64 teachers nationwide to be awarded a scholarship by the Museum of Science, Boston, to participate in the Engineering is Elementary program. This program is designed to bring high-quality professional development in science, technology, engineering, and mathematics studies to teachers at high-need schools.

Chapter 5
52
SUBSTITUTE TEACHERS—LONG-TERM
Note: Long-term substitute teachers are those teaching 20 consecutive days or more in the same classroom
or assignment. Source: NDE, Nevada Annual Reports of Accountability, http://www.NevadaReportCard.com.
64%
36%
Percentage of Long-Term Substitute Teachers by School Level
SY 2014–2015
Elementary Secondary
27%
10%
30%
33%
Percentage of Secondary Long-Term Substitute Teachers by Subject
SY 2014–2015
Mathematics Science Social Studies English

Chapter 5
53
SUBSTITUTE TEACHERS—SHORT-TERM
Note: Short-term substitute teachers are those employed for fewer than 20 consecutive days in the same classroom or assignment.
Source: NDE, Nevada Annual Reports of Accountability, http://www.NevadaReportCard.com.
68%
32%
Percentage of Short-Term Substitute Teachers by School Level
SY 2014–2015
Elementary Secondary
24%
25% 18%
33%
Percentage of Secondary Short-Term Substitute Teachers by Subject
SY 2014–2015
Mathematics Science Social Studies English

Chapter 5
54
SUBSTITUTE TEACHERS—LONG-TERM OVER TIME
Long Term Substitute Teachers, Statewide, Clark County, and Washoe County SY 2007–2008 Through SY 2014–2015*
2007–2008 2008–2009 2009–2010 2010–2011 2011–2012 2012–2013 2013–2014
Statewide 2,025 2,074 1,625 2,157 2,368 2,840 2,388
Clark County 1,611 1,164 1,169 1,097 1,331 1,205 1,089
Washoe County 148 135 125 156 128 102 88
*Reported for previous school year. Source: NDE, Nevada Annual Reports of Accountability, http://www.NevadaReportCard.com.
TEACHERS—NATIONAL BOARD CERTIFICATION
National Board Certified Teachers: Nevada and Western States
States 2007–2008 2014–2015 Increase 2008 to 2015
Arizona 683 1,196 75% California 4,561 6,345 39% Colorado 485 898 85% Idaho 360 382 6% Montana 87 139 60% Nevada 443 633 43% New Mexico 490 1,030 110% Oregon 244 309 27% Utah 184 242 32% Washington 3,953 8,461 114% Wyoming 255 628 146%
Source: National Board for Professional Teaching Standards, http://www.nbpts.org.

Chapter 5
55
TEACHER COMPENSATION
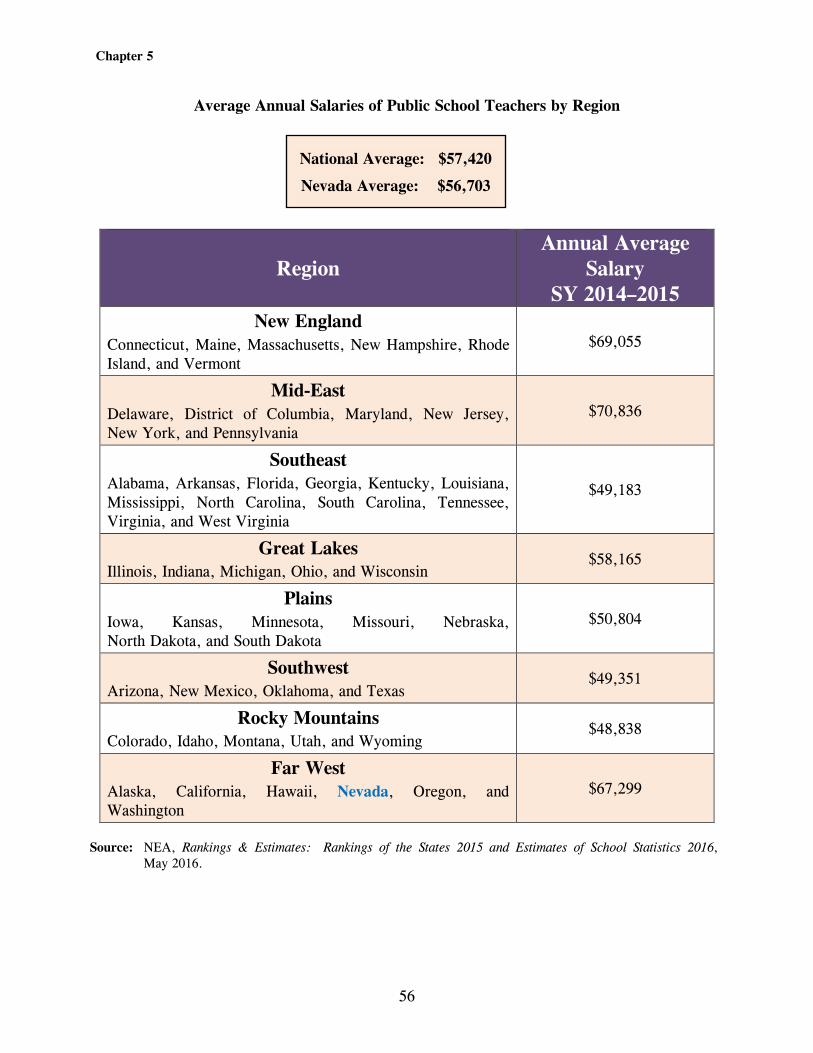
Average Teacher Salaries Teacher pay is often viewed as a major factor in attracting qualified people to the profession. According to the National Education Association’s (NEA’s) May 2016 Rankings of the States and Estimates of School Statistics 2016, the average salary for a public school teacher in Nevada was $56,703 in SY 2014–2015, compared to the national average of $57,420. State average public school teacher salaries ranged from highs in New York ($77,628), the District of Columbia ($75,490), and Massachusetts ($75,398) to lows in Idaho ($45,218), Mississippi ($42,564), and South Dakota ($40,934). These estimates do not include compensation packages that contain the employee portion of retirement contributions, which local school districts often pay for employees.
Collective Bargaining The Nevada State budget often includes funding for education personnel pay raises. Salary increases used by the Legislature to construct the budget, however, are not necessarily passed on to school district employees. Rather, salaries for teachers are set at the school district level, using the collective bargaining process outlined in Chapter 288 (“Relations Between Governments and Public Employees”) of Nevada Revised Statutes (NRS). Following the lead of other states, the Nevada Legislature adopted the Local Government Employee-Management Relations Act in 1969 to regulate collective bargaining between local units of government and their employees, including school districts and teachers. The requirements for recognition of an employee organization and definitions of bargaining units are set forth in Chapter 288 of NRS. There is only one recognized employee organization for each bargaining unit; there are 17 organizations representing teachers, 1 in each school district.
Budget Update—Teacher and State Employee Salaries The 2015 Legislature increased funding for teacher salaries by 1 percent in Fiscal Year (FY) 2016 and 2 percent in FY 2017; this is the same amount that was added to the salaries of State employees. In addition to the salary increases, the Legislature eliminated six furlough days per year for State employees. Merit pay increases were restored for both years of the 2015–2017 Biennium. Teacher salaries continue to be subject to local collective bargaining agreements.
Chapter 5
56
Average Annual Salaries of Public School Teachers by Region
Region
Annual Average Salary
SY 2014–2015 New England
Connecticut, Maine, Massachusetts, New Hampshire, Rhode Island, and Vermont
$69,055
Mid-East Delaware, District of Columbia, Maryland, New Jersey, New York, and Pennsylvania
$70,836
Southeast Alabama, Arkansas, Florida, Georgia, Kentucky, Louisiana, Mississippi, North Carolina, South Carolina, Tennessee, Virginia, and West Virginia
$49,183
Great Lakes Illinois, Indiana, Michigan, Ohio, and Wisconsin
$58,165
Plains Iowa, Kansas, Minnesota, Missouri, Nebraska, North Dakota, and South Dakota
$50,804
Southwest Arizona, New Mexico, Oklahoma, and Texas
$49,351
Rocky Mountains Colorado, Idaho, Montana, Utah, and Wyoming
$48,838
Far West Alaska, California, Hawaii, Nevada, Oregon, and Washington
$67,299
Source: NEA, Rankings & Estimates: Rankings of the States 2015 and Estimates of School Statistics 2016,
May 2016.
National Average: $57,420
Nevada Average: $56,703
Chapter 5
57
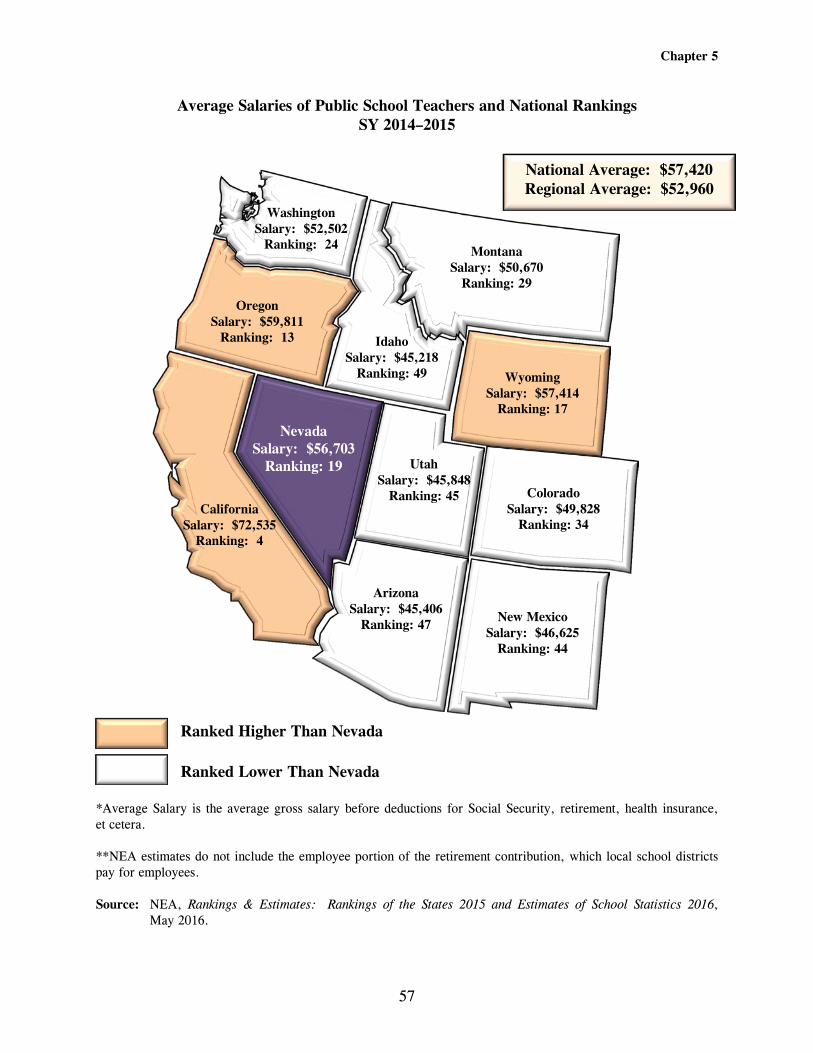
Average Salaries of Public School Teachers and National Rankings SY 2014–2015
Ranked Higher Than Nevada Ranked Lower Than Nevada *Average Salary is the average gross salary before deductions for Social Security, retirement, health insurance, et cetera. **NEA estimates do not include the employee portion of the retirement contribution, which local school districts pay for employees. Source: NEA, Rankings & Estimates: Rankings of the States 2015 and Estimates of School Statistics 2016,
May 2016.
Washington Salary: $52,502
Ranking: 24
Oregon Salary: $59,811
Ranking: 13
Montana Salary: $50,670
Ranking: 29
Wyoming Salary: $57,414
Ranking: 17
Colorado Salary: $49,828
Ranking: 34
New Mexico Salary: $46,625
Ranking: 44
Arizona Salary: $45,406
Ranking: 47
Idaho Salary: $45,218
Ranking: 49
Nevada Salary: $56,703
Ranking: 19 Utah Salary: $45,848
Ranking: 45 California
Salary: $72,535 Ranking: 4
National Average: $57,420 Regional Average: $52,960
Chapter 5
58
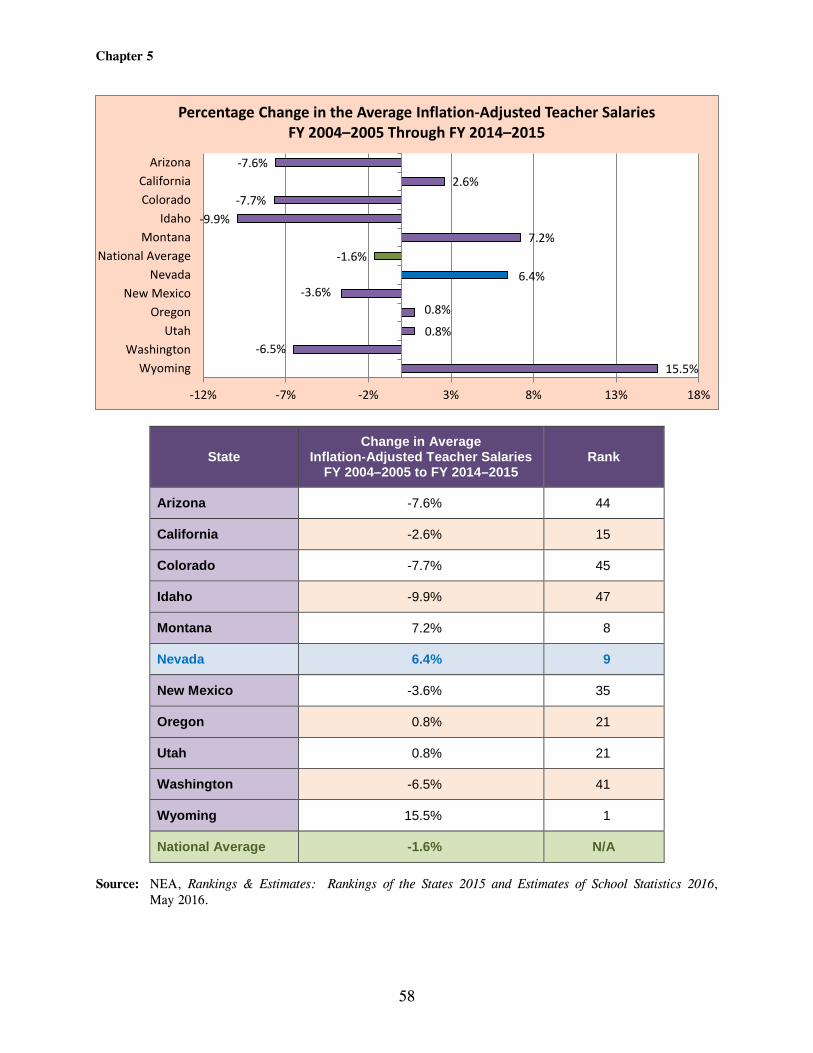
State Change in Average
Inflation-Adjusted Teacher Salaries FY 2004–2005 to FY 2014–2015
Rank
Arizona -7.6% 44
California -2.6% 15
Colorado -7.7% 45
Idaho -9.9% 47
Montana 7.2% 8
Nevada 6.4% 9
New Mexico -3.6% 35
Oregon 0.8% 21
Utah 0.8% 21
Washington -6.5% 41
Wyoming 15.5% 1
National Average -1.6% N/A Source: NEA, Rankings & Estimates: Rankings of the States 2015 and Estimates of School Statistics 2016,
May 2016.
15.5% -6.5%
0.8%
0.8% -3.6%
6.4% -1.6%
7.2% -9.9%
-7.7% 2.6%
-7.6%
-12% -7% -2% 3% 8% 13% 18%
WyomingWashington
UtahOregon
New MexicoNevada
National AverageMontana
IdahoColoradoCalifornia
Arizona
Percentage Change in the Average Inflation-Adjusted Teacher Salaries FY 2004–2005 Through FY 2014–2015

Chapter 5
59
Current Per-Pupil Spending on Instruction—Salaries
(Excluding Benefits) and National Rankings SY 2013–2014
Ranked Higher Than Nevada Ranked Lower Than Nevada Source: United States Census Bureau, Public Education Finances 2014, May 2016.
Washington Per Pupil: $3,958
Ranking: 26
Oregon Per Pupil: $3,242
Ranking: 45
Montana Per Pupil: $4,243
Ranking: 24
Wyoming Per Pupil: $6,094
Ranking: 7
Colorado Per Pupil: $3,620
Ranking: 37
New Mexico Per Pupil: $3,595
Ranking: 39
National Average: $4,378 Regional Average: $3,624
Arizona Per Pupil: $2,855
Ranking: 49
Idaho Per Pupil: $2,741
Ranking: 50
Nevada Per Pupil: $3,180
Ranking: 46 Utah
Per Pupil: $2,562 Ranking: 51
California Per Pupil: $3,779
Ranking: 33

Chapter 5
60
Current Per-Pupil Spending on Instruction
Benefits Only (No Base Salary) and National Rankings SY 2013–2014
Ranked Higher Than Nevada Ranked Lower Than Nevada Source: United States Census Bureau, Public Education Finances 2014, May 2016.
Washington Per Pupil: $1,386
Ranking: 30 Montana Per Pupil: $1,321
Ranking: 32
Idaho Per Pupil: $957
Ranking: 48
Wyoming Per Pupil: $2,495
Ranking: 12
CO: Per Pupil: $872
Ranking: 48
Utah Per Pupil: $1,193
Ranking: 41
Arizona Per Pupil: $889
Ranking: 50 New Mexico
Per Pupil: $1,249 Ranking: 36
National Average: $1,691 Regional Average: $1,359
California Per Pupil: $1,288
Ranking: 33
Nevada Per Pupil: $1,272
Ranking: 35
Oregon Per Pupil: $1,912
Ranking: 17
Colorado Per Pupil: $983
Ranking: 46

Chapter 5
61
PROFESSIONAL DEVELOPMENT
Regional Professional Development Programs (RPDPs) In response to a series of regional workshops conducted by the Legislature during the 1997–1998 Interim, teachers, administrators, and others proposed a regional professional development model to help educators teach the new State academic standards. The 1999 Legislature appropriated $3.5 million in each year of the biennium to establish and operate four regional training programs (later consolidated into the three regions shown in the map below) to prepare teachers to teach the new, more rigorous academic standards and to evaluate the effectiveness of these programs. Since then, the State has continued its support
through State General Fund appropriations every biennium. Most recently, the Legislature approved Senate Bill 515 (Chapter 537, Statutes of Nevada 2015), appropriating $15.12 million over the biennium ($7.46 million in FY 2015–2016 and $7.46 million in FY 2016–2017) for RPDPs to train teachers and administrators, and biennial funding of $200,000 for additional statewide administrator training provided at the direction of the Statewide Council for the Coordination of the Regional Training Programs.
Northwestern = Carson City and Churchill, Douglas, Lyon, Storey, and Washoe Counties.
Northeastern = Elko, Eureka, Humboldt, Lander, Pershing, and White Pine Counties.
Southern = Clark, Esmeralda, Lincoln, Mineral, and Nye Counties.
Northwestern
Northeastern
Southern Northwestern
Northeastern
Southern

Chapter 5
62
Each RPDP is overseen by a governing body composed of superintendents of schools, representatives of the Nevada System of Higher Education, teachers, and employees of the Department of Education. The governing body is responsible for assessing the training needs of teachers in the region and adopting training priorities accordingly.
In addition to the governing bodies of the RPDPs, the 2001 Legislature created the Statewide Council for the Coordination of the Regional Training Programs. The Council consists of the RPDP coordinator and one member of the governing board from each of the three regions. The Council is responsible for adopting statewide standards for professional development; disseminating information to school districts, administrators, and teachers concerning training, programs, and services provided by the RPDP; and conducting long-range planning concerning the professional development needs of teachers and administrators employed in Nevada.
Nevada Early Literacy Intervention Program The RPDPs also are responsible for assisting the State in reaching the goal of all pupils reading at grade level by the end of third grade through the Nevada Early Literacy Intervention Program. This program is designed to provide training for teachers who teach kindergarten and grades 1, 2, and 3, on methods to teach fundamental reading skills, including: • Phonemic awareness;
• Phonics;
• Vocabulary;
• Fluency;
• Comprehension; and
• Motivation.
Education Week, a national newspaper covering education, chose D’Lisa Crain, Family-School Partnerships Administrator of the Washoe County School District, as 1 of 13 “Leaders to Learn From” in 2016. Ms. Crain was chosen from among 700 nominees submitted by readers, education writers, school administrator groups, and education experts.

Chapter 5
63
Great Teaching and Leading Fund Grants
With the passage of Senate Bill 474 (Chapter 535, Statutes of Nevada 2015), the Legislature expanded the professional development options for educational personnel in Nevada. Under a revised approach, entitled the Great Teaching and Leading Fund (GTLF), the Superintendent of Public Instruction must annually prescribe program priorities for which grants may be awarded from the Fund. The pool of eligible training grant applicants was expanded to include: (1) the governing body of a regional training program for the professional development of teachers and administrators; (2) the board of trustees of a school district; (3) the governing body of a charter school; (4) the State Public Charter School Authority; (5) a university, state college, or community college within the Nevada System of Higher Education; (6) employee associations representing licensed educational personnel; and (7) nonprofit educational organizations. Program priorities for SY 2015–2016 include: • Professional development for teachers to provide instruction in the standards of content and
performance for science (Nevada has adopted the Next Generation Science Standards);
• Implementation of the statewide Nevada Educator Performance Framework;
• Recruitment, selection, and retention of effective teachers and principals; and
• Leadership training and development. Applications submitted by an entity must address how funding will be used in accordance with those priorities. An entity receiving a grant from the GTLF is required to use the money in accordance with the priorities to provide: (1) professional development for teachers, administrators, and other licensed educational personnel; (2) programs of preparation for teachers, administrators, and other licensed educational personnel; (3) programs of peer assistance and review for teachers, administrators, and other licensed educational personnel; (4) programs for leadership training and development; and (5) programs to recruit, select, and retain effective teachers and principals. Entities awarded GTLF grants must provide a report to the Superintendent within 120 days after the conclusion of the grant (for entities receiving funding for one year or less) or annually (for entities receiving funding for more than one year). Reports must include a description of programs for which the grant was used, as well as measures of effectiveness of the grant in: • Improving the achievement of pupils;
• Assisting teachers, administrators, and other licensed educational personnel to improve the effectiveness of their professional practice; and
• Improving the recruitment, selection, and retention of effective teachers and principals.

Chapter 5
64
To the extent money is available from legislative appropriations or otherwise, the Superintendent will contract for an independent evaluation of the effectiveness of the grants, including a review and analysis of data relating to: • Changes in instructional or administrative practices;
• Student achievement; and
• Recruitment, selection, and retention of effective teachers and administrators.
Source: Fiscal Analysis Division, Legislative Counsel Bureau.
$0
$5,000,000
$10,000,000
$15,000,000
$20,000,000
$25,000,000
$30,000,000
2003-2005 2005-2007 2007-2009 2009-2011 2011-2013 2013-2015 2015-2017
State Funding of Professional Development Programs For Teachers and Administrators
2003–2005 Through 2015–2017 Biennia
Chapter 5
65
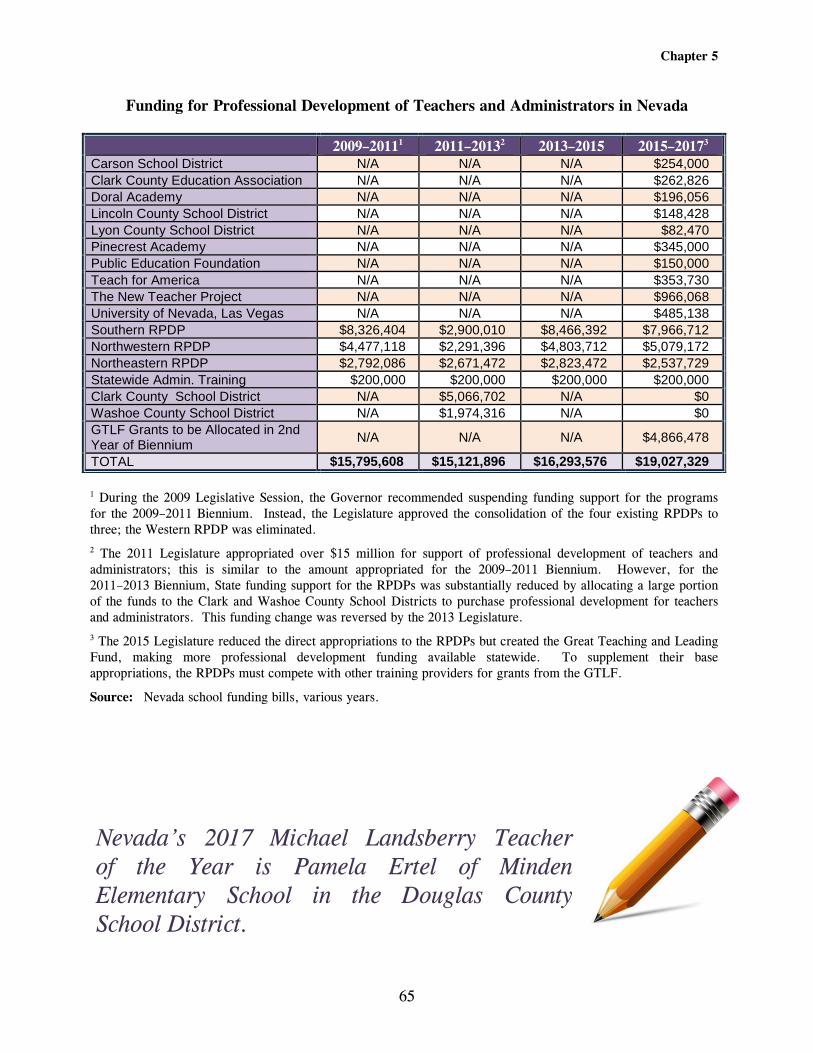
Funding for Professional Development of Teachers and Administrators in Nevada
2009–20111 2011–20132 2013–2015 2015–20173 Carson School District N/A N/A N/A $254,000 Clark County Education Association N/A N/A N/A $262,826 Doral Academy N/A N/A N/A $196,056 Lincoln County School District N/A N/A N/A $148,428 Lyon County School District N/A N/A N/A $82,470 Pinecrest Academy N/A N/A N/A $345,000 Public Education Foundation N/A N/A N/A $150,000 Teach for America N/A N/A N/A $353,730 The New Teacher Project N/A N/A N/A $966,068 University of Nevada, Las Vegas N/A N/A N/A $485,138 Southern RPDP $8,326,404 $2,900,010 $8,466,392 $7,966,712 Northwestern RPDP $4,477,118 $2,291,396 $4,803,712 $5,079,172 Northeastern RPDP $2,792,086 $2,671,472 $2,823,472 $2,537,729 Statewide Admin. Training $200,000 $200,000 $200,000 $200,000 Clark County School District N/A $5,066,702 N/A $0 Washoe County School District N/A $1,974,316 N/A $0 GTLF Grants to be Allocated in 2nd Year of Biennium N/A N/A N/A $4,866,478
TOTAL $15,795,608 $15,121,896 $16,293,576 $19,027,329 1 During the 2009 Legislative Session, the Governor recommended suspending funding support for the programs for the 2009–2011 Biennium. Instead, the Legislature approved the consolidation of the four existing RPDPs to three; the Western RPDP was eliminated. 2 The 2011 Legislature appropriated over $15 million for support of professional development of teachers and administrators; this is similar to the amount appropriated for the 2009–2011 Biennium. However, for the 2011–2013 Biennium, State funding support for the RPDPs was substantially reduced by allocating a large portion of the funds to the Clark and Washoe County School Districts to purchase professional development for teachers and administrators. This funding change was reversed by the 2013 Legislature. 3 The 2015 Legislature reduced the direct appropriations to the RPDPs but created the Great Teaching and Leading Fund, making more professional development funding available statewide. To supplement their base appropriations, the RPDPs must compete with other training providers for grants from the GTLF.
Source: Nevada school funding bills, various years.
Nevada’s 2017 Michael Landsberry Teacher of the Year is Pamela Ertel of Minden Elementary School in the Douglas County School District.

Chapter 5
66
NEVADA EDUCATOR PERFORMANCE FRAMEWORK
Background
Assembly Bill 222 (Chapter 487, Statutes of Nevada 2011) created the Teachers and Leaders Council of Nevada to establish a statewide performance evaluation system for teachers and site-based administrators. The measure requires evaluations to be based upon student achievement data and provides that teachers and administrators be evaluated using a four-category system: (1) “highly effective”; (2) “effective”; (3) “minimally effective”; or (4) “ineffective.” In 2015, Assembly Bill 447 (Chapter 415, Statutes of Nevada) made several changes to the Statewide Performance Evaluation System, most notably the inclusion of district-level supervisors and other licensed personnel in the evaluation process. The measure also reduced from 50 percent to 20 percent the weighting of student achievement data within the System for SY 2016–2017 and evenly divided the weighting among statewide and local examinations, as designated by the State Board of Education. In SY 2017–2018, the weighting of student achievement data will increase from 20 percent to 40 percent. In SY 2015–2016, student achievement data was excluded from the evaluation system due to the statewide transition to Smarter Balanced student assessments.
Nevada Educator Performance Framework SY 2016–2017
Source: NDE.

Chapter 5
67
Nevada Administrator Performance Framework SY 2016–2017
Source: NDE.
Nationwide, only 108 teachers each year receive the Presidential Award for Excellence in Mathematics and Science Teaching. Nevada’s 2016 awardees were Arvella Jergesen of Fernley Intermediate School in the Lyon County School District and Kathleen Schaeffer of Bob Miller Middle School in the Clark County School District.