2015 shareholding review report to...
TRANSCRIPT
DEVELOPMENT COMMITTEE
(Joint Ministerial Committee of the
Boards of Governors of the Bank and the Fund on the
Transfer of Real Resources to Developing Countries)
DC2015-0007 September 28, 2015
2015 SHAREHOLDING REVIEW
REPORT TO GOVERNORS
Attached is a document entitled “2015 Shareholding Review: Report to Governors” prepared by the World Bank Group for the October 10, 2015 Development Committee meeting.
.
* * *


2015 Shareholding Review
Report to Governors September 2015
Abbreviations
AIIB Asian Infrastructure Investment Bank MER Market Exchange Rates BRICS Brazil, Russian Federation, India,
China, and South Africa MIGA Multilateral Investment Guarantee
Agency CDI Council on Diversity and Inclusion NOFs Nationalities of Focus CODE Committee on Development
Effectiveness ODA Official Development Assistance
COGAM Committee on Governance and Administrative Matters
OP Operational Policy
CY Calendar year OPCS Operations Policy and Country Services
D&I Diversity and Inclusion PFM Prospective Founding Members DC Development Committee PforR Program-for-Results DSC Deployable Strategic Capital PPP Purchasing Power Parity DTC Developing and Transition Countries RAP Results and Performance E/L Equity-to-Loans and Long-Term
Investment Assets SBO Strategic Business Outlook
ED Executive Director SC Steering Committee EDGE Economic Dividends for Gender
Equality SCI Selective Capital Increase
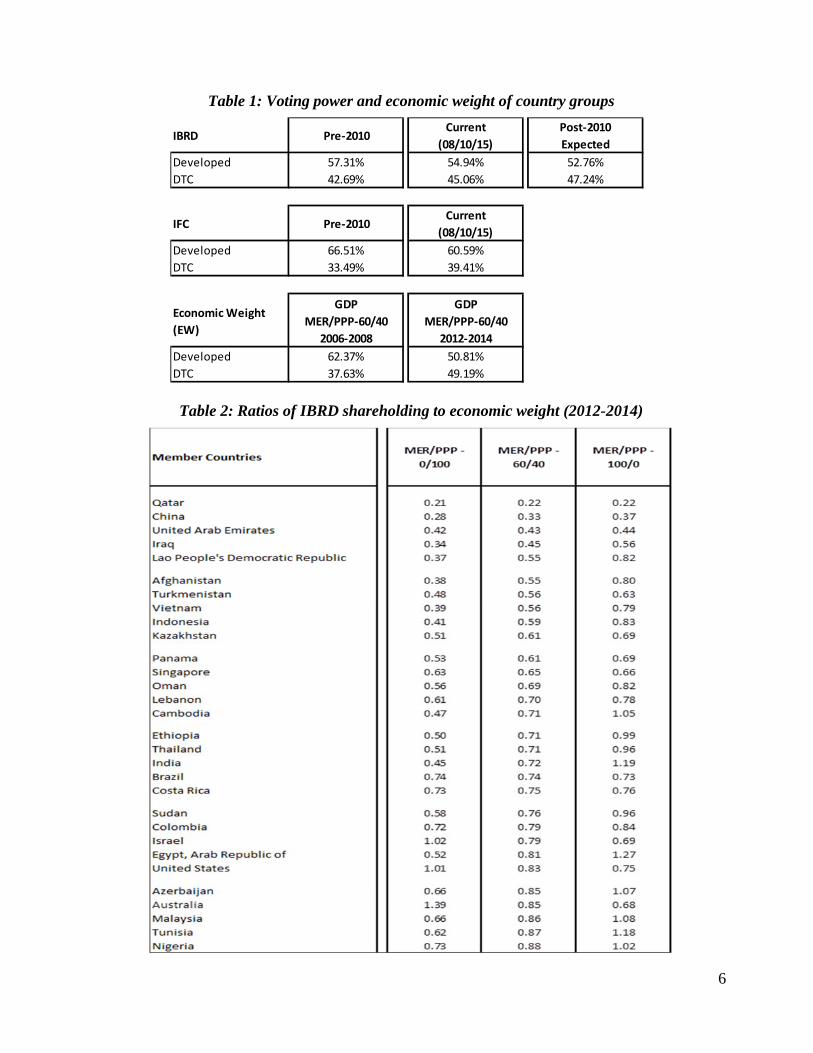
EW Economic Weight SDG Sustainable Development Goals FCS Fragile and Conflict-Affected States SDR Special Drawing Rights FfD Financing for Development SMT Senior Management Team FY Fiscal Year SSA Sub-Saharan Africa GCI General Capital Increase SSA/CR Sub-Saharan African and Caribbean GDP Gross Domestic Product TOR Terms of Reference GNI Gross National Income TRA Total Resources Available HR Human Resources TRR Total Resources Required HRVP Human Resources Vice Presidential
Unit UNGA United Nations General Assembly
IBRD International Bank for Reconstruction and Development
VP Vice President
IDA International Development Association
VPU Vice Presidential Unit
IEG Independent Evaluation Group VSP Voice Secondment Program IFC International Finance Corporation WBG World Bank Group IMF International Monetary Fund WDI World Development Indicators MDB Multilateral Development Bank WEO World Economic Outlook MDG Millennium Development Goals

Contents I. Introduction, Background and Scope ........................................................................................ 1 II. The Role of the World Bank Group .......................................................................................... 2 III. Capital Adequacy of WBG Institutions ..................................................................................... 3 IV. Voting Rights and Realignment ................................................................................................ 4 (a) Economic weight........................................................................................................................ 4 (b) Progress towards equitable voting power ................................................................................. 5 (c) Contributions to the WBG development mission ....................................................................... 7 (d) Next steps ................................................................................................................................... 9 V. A Dynamic Formula .................................................................................................................. 9 VI. Approach to Shareholding Reviews ......................................................................................... 10 VII. Representation ......................................................................................................................... 11 VIII. Responsiveness ................................................................................................................. 12 (a) Client engagement ................................................................................................................... 12 (b) Accountability to Shareholders ................................................................................................ 13 (c) Diversity and Inclusion ............................................................................................................ 14 IX. Conclusions ............................................................................................................................. 15 X. Roadmap .................................................................................................................................. 16 Annex 1. MIGA Shareholding .................................................................................................... 17 Annex 2. IFC’s Capital Adequacy .............................................................................................. 19 Annex 3. Milestones and Expected Actions on the IBRD and IFC Capital Increases ............... 20 Annex 4. Governors' Voting Requirements ................................................................................ 22 Annex 5. Global Development Landscape: Post 2015, Climate, New Institutions ..................... 23 Annex 6a. Ratio of IBRD to GDP Blend Shares - Three-Year Average (2012-014)………..... 32 Annex 6b. Ratio of IBRD to GDP Blend Shares - Five-Year Average (2010-2015)…………... 37 Annex 7a. Comparison of GDP Blend Shares - By Alpha……………………………………... 42 Annex 7b. Comparison of GDP Blend Shares - By Change in Share………………………….. 46 Annex 7c. Comparison of GDP Blend Shares - By Classification……………………………... 50 Annex 8. Historical Partner Grant Contributions to IDA (in USD millions)…………………. 54 Annex 9a. Member Shareholding and Voting Power – By Country - IBRD ................................ 55 Annex 9b. Member Shareholding and Voting Power – By Constituency - IBRD ........................ 58 Annex 9c. Member Shareholding and Voting Power – By Country - IFC ................................... 59 Annex 9d. Member Shareholding and Voting Power – By Constituency - IFC ........................... 62 Annex 9e. Member Shareholding and Voting Power – By Country - IDA ................................... 63 Annex 9f. Member Shareholding and Voting Power – By Constituency - IDA ........................... 66

Annex 9g. Member Shareholding and Voting Power – By Country - MIGA ............................... 67 Annex 9h. Member Shareholding and Voting Power – By Constituency - MIGA ........................ 70 Annex 10. Phases 1 and 2 of Voice Reform and the 2010 Approach to Realignment .................. 71 Annex 11. Representation ............................................................................................................. 75 Annex 12. Diversity and Inclusion……………………………………………………………..…79
1
2015 Shareholding Review Report to Governors
I. Introduction, Background and Scope 1. In 2008, World Bank Group (WBG) Shareholders agreed to undertake a two-phase package of reforms (“The Voice Reform”) with three pillars: (1) voice as shareholding; (2) voice as responsiveness; and (3) voice as effective representation at the Board. 2. Phase 1 Voice Reform was approved by the Governors in 2009 and led to an increase in developing countries’ shares in IBRD to 44.06 percent (and beyond that in IDA) achieved through an increase in basic votes. On Representation, there was agreement to create a new chair for Sub Saharan Africa. On Responsiveness, there was a commitment to strengthen Board effectiveness, to deepen responsiveness to developing county views on development by expanding field presence and decentralization of Bank staff and increasing access to information of Bank operations to shareholders, and to establish a merit-based and transparent selection of the Bank’s President. 3. Phase 2 Voice Reform was approved by Governors in 2010 and increased the voting power of developing countries in IBRD by 3.13 percentage points, to 47.19 percent,1 bringing the total shift to Developing and Transition Countries (DTCs) in both Phases to 4.59 percentage points once the current SCI is fully subscribed. At IFC, there was a $200 million capital increase, which was open for subscription with preference given to DTC members whose voting power would increase from 33.41% to 39.48%.2 On Representation, in line with Phase 1 agreement, a third chair for Sub-Saharan Africa was elected during Regular Election of Executive Directors at the 2010 Annual Meetings. On Responsiveness, institutional reforms included strengthening diversity in management and staff, accelerating decentralization of operations and field presence as well as internal governance reforms. 4. In 2010, following Phase 2 Voice Reform, Governors agreed to conduct periodic IBRD and IFC Shareholding Reviews, every five years, beginning in 2015.3 Periodic Shareholding Reviews were seen as a way to maintain legitimacy and dynamism and to reflect global economic changes in IBRD and IFC shareholding. Governors’ guidance on shareholding reviews included three issues to be addressed and distinguished review from a shareholding realignment:
“In each review, the Board of Governors would review the weight of all members in the world economy; review contributions to the WBG development mission; and assess progress towards equitable voting power between developed and developing members. While reviews would take place regularly, shareholding realignment would not necessarily be required with each review, but only when shareholders, through the Board of Governors, decided that the results warranted adjustment.” (DC2010-0006/1, April 25 2010).
5. During the 2015 review, we have, following this guidance, reviewed the weight of members in the world economy, their contributions to the WBG development mission, and progress towards equitable voting power. We have also reviewed the distribution of shares and voting power; the capital subscription processes; and the methodology that underpinned the 2010 SCI in IBRD. With
1 With the membership of Tuvalu and South Sudan, the voting power of DTCs is expected to increase to 47.24%. 2 With the membership of Suriname and South Sudan, the voting power of DTCs is expected to increase to 39.54%. 3 The World Bank Governors’ Resolution No. 612, March 16, 2011; DC2010-0006/1.

2
Governors’ guidance at the Spring Meetings this year on the importance of agreed principles, we have reviewed again the principles that guide shareholding reviews. We have discussed the need for a dynamic formula to serve as the basis for shareholding reviews and the desirable characteristics and main elements of such a formula.
6. On the responsiveness pillar of Voice, we have considered the WBG strategy, the new Country Engagement Model, Program-for-Results, Diversity and Inclusion, Procurement Reforms, Hubs, and the Post 2015 Development Agenda. On the Representation pillar of Voice, we have considered Board Effectiveness, strategic focus, capacity, and Board Representation. Annexes to this report summarize the data and other information reviewed. 7. The context for this review – both external and internal - is complex. 2015 is a significant year for development, with important discussions of development aspirations and objectives, the conclusion of work on the Post 2015 Development agenda and discussions on Financing for Development focused on the July conference in Addis Ababa, the UNGA on the post-2015 agenda in September, and the discussions of climate finance at the Paris Conference on Climate Change in November. The institutional landscape is evolving with the emergence of new development institutions. Meanwhile, the IMF quota reform process, which includes a review of the quota formula and was scheduled to be completed in advance of this shareholding review, has stalled.
8. Internally, the WBG has an agreed strategy and goals, to end extreme poverty and to promote shared prosperity in a sustainable way. It has completed a far reaching reorganization that will strengthen its delivery to clients alongside a set of financial measures that support increased lending. The capital subscriptions process needed to deliver the 2010 SCI and GCI for IBRD is underway and needs more time and the deadlines have been extended as provided for in the resolutions. It is expected to be completed within the extended deadlines. Looking ahead, the next IDA replenishment will be negotiated in 2016 and options for IDA reform are under consideration by the Board. 9. Each of these factors has a direct or indirect implication for a shareholding review, and taken together they add to its complexity. II. The Role of the World Bank Group 10. An underlying theme has been the need to root our discussions of shareholding structure and voting power, along with the conceptually separate but linked issue of the size of its capital base, in a clear shared vision of the role of the World Bank Group, in the context of the complex and evolving development landscape already described. 11. The World Bank Group is absolutely critical to development. Among the WBG’s unique strengths in this regard is its ability to provide the full menu of services and support—from appropriately customized global knowledge, analytics and technical assistance, to financing and implementation support, to convening of partnerships, and crowding in contributions from diverse partners from the public and private sectors. It already has the benefit of clear goals and an agreed strategy for achieving them, endorsed by Governors at the 2013 Spring Meetings, and well aligned with the new SDGs. This strategy has guided comprehensive internal reforms that will position the WBG to meet its goals. In the implementation of this strategy, the WBG will play a crucial role in Financing for Development including through helping countries build the capacity to generate, attract and manage much larger flows through improving the enabling environment and leveraging the private sector. It is also serving as an effective platform for action on global issues, such as health, climate change and illicit finance, using its convening power and global reach. In addition, it

3
benefits from strong client and shareholder support as well as rising client demand for its services. 12. From this very positive perspective, but also taking account of the complex and evolving development landscape, shareholders have a collective interest in looking ahead over the medium to long term and discussing a shared view of the future of this successful global co-operative, and its instruments for achieving it. The internal reforms of the WBG are largely complete, with ongoing actions to enhance the flow of knowledge, the creation of ongoing financial space and the management of talent. This is therefore a good time to take stock of the role of the strengthened WBG in the context of the new development landscape and to see if any adjustment is needed to ensure that it has the right tools and instruments to achieve its goals, deal with the challenges clients face, and so maximize its impact. Such work would also provide important context for discussion of the resources needed.
13. We propose that this work could be completed by the Annual Meetings 2016 with an interim report to Governors at the Spring Meetings of that year. III. Capital Adequacy of WBG Institutions 14. The 2010 agreement increased IBRD capital by $86.2 billion, with $5.1 billion paid-in, with $58.4 billion through a General Capital Increase ($3.5 billion paid-in) and $27.8 billion through a Selective Capital Increase ($1.6 billion paid-in). IFC’s capital was increased by $200 million through a Selective Capital Increase, fully paid-in.4 15. For IBRD, the package of revenue and capacity measures agreed by the Board in 2014 have achieved the objective of improving IBRD’s medium-term outlook and strengthened its financial sustainability, helping to unlock a significantly stronger lending program. For instance, lending projections in the reference case have increased from an average of around $21 billion p.a. in the Strategy and Business Outlook paper of March 2015 to the latest projected average of about $25 billion p.a. This in turn has implications for IBRD’s capital outlook. Looking beyond the current work program, the issues related to post-2015 financing needs, including FfD and climate finance, developments in the global economy, and shareholders’ view of the future role of the Bank including within the overall development finance architecture, should all feed into an assessment of capital needs. 16. In the course of our review, a broad range of views on the need for additional capital in IBRD and IFC have been expressed. Some chairs believe the case is already clear and would prefer to move ahead quickly. Most chairs, while remaining open to discussing the issue, believe that other issues or processes need to be addressed or completed first. For example, some feel that IBRD’s 2010 GCI should be completed first (see Annex 3), and others want to consider options to do more with existing capital, mindful of options for IDA reform. 17. A capital increase requires broad support from shareholders (see Annex 4). We will continue to review the financial position, including the implications of strengthened client demand and other factors relevant to capital adequacy, through regular engagements between Management and the Board. 18. In IFC, economic capital is the foundation of financial risk management and is the best way to measure IFC’s capital adequacy. From a micro level, it is used to calculate the amount of capital IFC needs to hold against its assets in order to maintain a AAA rating. The Economic Capital (Total Resources Required-TRR) to support the AAA rating are compared with IFC’s Total Resources Available (TRA), which consist of IFC’s capital, including retained earnings net of designations plus
4 For MIGA shareholding review and voting power see Annex 1.
4
loan loss reserves. The TRA, less the TRR and a buffer needed for additional protection during times of stress, represent the amount of capital available for new investments. This is known as IFC’s deployable strategic capital (DSC) and is the key measure of capital adequacy used at IFC. (Annex 2 provides more detail on IFC’s economic capital framework).
19. IFC’s DSC ratio has been declining, from a peak of 32 percent in fiscal year FY07 to 5 percent as of June, 2015. Although this lower ratio means IFC is using more of its capital to achieve its developmental mission, it also means that IFC has to carefully manage capital usage in order to allocate capital to achieve the greatest impact, while also ensuring IFC’s own financial sustainability. Factors affecting the decline in DSC include the pace of portfolio growth, IDA designations, changes in product composition of the portfolio, realized income and the increasing share of IDA and FCS investments, which have a higher capital requirement above a certain threshold. 20. The financing needs of the post-2015 agenda call for a strong contribution from the private sector. IFC is uniquely positioned to play a leadership role as the largest development finance institution focused solely on the private sector. It has been very successful in leveraging its own developmental contributions in several important ways: leveraging its balance sheet through borrowing, mobilizing outside investors directly, and catalyzing significant additional funding through its presence in projects. In order to play a significant role in the challenging post-2015 environment, IFC would require faster growth with more capital and other resources devoted to riskier markets and products and, based on current projections, a significant strengthening of its capital position.
21. We propose that Governors agree to review the capital positions of IBRD and IFC and consider the need to increase capital through a GCI during 2017, aiming to reach a decision by the Annual Meetings of 2017. IV. Voting Rights and Realignment
(a) Economic weight
22. As part of the review we have considered the medium to long term trends in the evolution of global economic weight (see Annex 5). Rapid growth in per capita incomes in developing countries starting in the second half of the twentieth century has dramatically changed the global economic landscape. Combined with faster population growth, it has resulted in a much larger share of the developing world in the world economy: the GNI share has increased from about 14 percent in the early 1990s to nearly 32 percent in 2013, at market exchange rates, and has reached 58 percent in PPP terms.5 23. These trends are likely to continue. It is expected that growth in the developing world will remain above the growth in the high-income countries – at least in aggregate, and probably in per capita terms as well. This would lead to a continued increasing share of the developing countries in the global economy – even if at a slower pace than was experienced during the extraordinary economic convergence period of recent decades. 24. Accompanying the growing share is a changed ranking of the largest economies in the world. China already has moved up the rankings to occupy second place, in both PPP and market exchange rates. In PPP terms, it probably already surpassed the United States at some point last year. Using market exchange rates, if China grows at roughly twice the growth rate of the United States, its
5 Data from WDI, using the World Bank analytic classification of low and middle income countries.

5
economy’s size would likely surpass the United States in the next 15 to 20 years (depending upon changes in market exchange rates), although it has lower GDP per capita and continues to face development challenges. China is not alone in moving up the rankings. In 2014, using market exchange rates, 4 of the 10 largest economies in the world were members of the DTC group. Using PPP exchange rates, half of the top ten were DTCs.
(b) Progress towards equitable voting power
25. We have reviewed the relationship between shareholding and economic weight, using ratios of shareholding to GDP measured by different blends of PPP and Market Exchange Rates (see Annexes 6a-b). There are different views on the merits of using PPP, with some favoring a higher proportion of PPP in the blend and others a lower proportion. The only blend so far used in a shareholding realignment is a 60/40 blend of market exchange rates and PPP, averaged over 3 years, as used in 2010, and could be taken as a starting point. (see Annexes 7a-c). 26. In terms of country groups, Developed Countries accounted for 50.81 percent of the global economy measured by the blend GDP variable over 2012-2014, and Developing and Transition Countries 49.19 percent. When the 2010 capital subscriptions are complete, the voting power of Developed Countries in IBRD will be 52.76 percent and of DTC 47.24 percent. On the basis of capital so far subscribed at July 16 2015, DTC voting power is 45.06 percent. Completing the IBRD SCI subscription process is important to deliver the move towards equitable shareholding agreed in 2010, and more remains to be done. It is worth noting that the membership of the country groups used in 2008 and 2010 would change if they were updated using current economic classifications, and further changes in countries’ status is likely in a dynamic global economy. In IFC, the SCI subscription period ended on 27 June 2015 and increased the DTC share of voting power by 5.92 percentage points with a total DTC voting power of 39.41 percent (see Table 1). 27. In terms of individual countries, the same comparison of IBRD shareholding to economic weight shows that some countries are under-weight on that measure, a few by significant amounts, and some others over-weight. Table 2 shows the most under-weight relative to blend GDP, with ratios of shareholding to both PPP and MER exchange rates shown for comparison. Of the under-weight, examples from among the larger member countries include China (at 33 percent of economic weight; Indonesia (59 percent); India (72 percent); Brazil (74 percent), United States (83 percent), and Australia (85 percent).
6
Table 1: Voting power and economic weight of country groups
Table 2: Ratios of IBRD shareholding to economic weight (2012-2014)
IBRD Pre‐2010Current
(08/10/15)
Post‐2010
Expected
Developed 57.31% 54.94% 52.76%
DTC 42.69% 45.06% 47.24%
IFC Pre‐2010Current
(08/10/15)
Developed 66.51% 60.59%
DTC 33.49% 39.41%
Economic Weight
(EW)
GDP
MER/PPP‐60/40
2006‐2008
GDP
MER/PPP‐60/40
2012‐2014
Developed 62.37% 50.81%
DTC 37.63% 49.19%

7
(c) Contributions to the WBG development mission 28. To reflect the development mandate, we have also reviewed IDA contributions (Annex 8). IDA is the World Bank’s main instrument for achieving the goals of ending extreme poverty and boosting shared prosperity in the world’s poorest countries, and contributing partner grant contributions are IDA’s main funding source. Partner contributions to the 17th IDA Replenishment were a total of SDR17.3 billion (equivalent to US$26.1 billion). Partner contributions to the past five Replenishments, IDA13 to IDA17, including the MDRI, were equivalent to US$141.6 billion. 29. IDA’s global coalition of contributing partners has been expanding. During IDA’s initial replenishment, 22 partner countries contributed to IDA. This number grew steadily with each IDA replenishment. In IDA16, this number has increased to 51 partner countries, and decreases slightly to 50 partners in IDA17, with growing engagement from middle income countries, including IDA graduates such as China, Egypt, India, Indonesia, the Philippines, and Thailand. Overall grant contributions of emerging and middle income partners, those that joined IDA since IDA13, increased from US$19 million in IDA13 (0.2 percent of the total) to US$652 million in IDA17 (2.5 percent of the total).6 30. IDA continues to rely heavily on the contribution of traditional partners. For example, the largest contributing partners to IDA13 - IDA17 were the G7 countries plus Spain, Sweden, the Netherlands, and Switzerland. These development partners contributed 86 percent of the total partner pledges in IDA13 and 80 percent in IDA17. The share of the other high- and middle income traditional IDA partners grew from about 14 percent in IDA13 to about 18 percent in IDA17.
Graph 1: Largest contributing partners to IDA13-IDA17 (US$ million)
Note. Switzerland and Spain participated in IDA13-IDA 17. They were amongst the largest contributing partners in some of the replenishments as shown in Graph 1.
6 New partners that joined IDA since IDA13 are: Argentina, the Bahamas, Barbados, Chile, China, Cyprus, Egypt, Estonia, India, Indonesia, Iran, Kazakhstan, Latvia, Lithuania, Malaysia, Peru, the Philippines, Singapore, Slovenia, and Thailand.
0 2000 4000 6000 8000 10000 12000 14000 16000 18000 20000
United States
United Kingdom
Japan
Germany
France
Canada
Sweden
Italy
Netherlands
Spain
Switzerland
IDA13 IDA14 IDA15 IDA16 IDA17

8
Table 3. Average IDA16 -IDA17 actual burdenshare as a percentage of notional burdenshare
1/ Table reflects a partner's total contribution as a percentage of all partners total contributions divided by its notional burdenshare for each replenishment; the ratio for each replenishment is averaged across the two replenishments. The IDA17 notional burdenshare was calculated using the 2013 GNI data (60% Atlas and 40% PPP) and the IDA16 notional burdenshare was calculated using the 2010 GNI data.
Adjusted GNI notional burdenshares are used to evaluate the economic capacity of a country to contribute to IDA and to measure the relative generosity when compared to the actual burdenshares.

9
31. In addition, it should be noted that “borrower contribution to financial sustainability and development” consistent with current IBRD loan pricing is estimated to be 7 basis points7 and that Trust Funds constitute around one third of the Bank’s Administrative Budget.
(d) Next steps 32. The distribution of shareholding is important for the legitimacy of the institution. Our review of the economic weight and shareholding shows that there are countries that are underweight relative to the GDP blend, and others that are overweight. On its own, this does not necessarily trigger a full realignment of shareholding. However, some of the differences between weight and shareholding at country level are significant and, to the extent that they have been driven by continuing economic trends, will become larger over time. At the same time, it is understood that shareholding is not based solely on GDP but should also take account of other factors including contributions to the development mission and the need to protect the shareholding of the smallest poor members. A realignment should be based on an agreed dynamic formula with appropriate variables and weights, bearing in mind Governors’ guidance not to reapply the 2010 approach.8 An additional factor to consider for the timing of a realignment that the 2010 SCI has yet to run its course. In light of all these issues, there is a range of views on the best timing of the next SCI and realignment of shareholding, with some preferring to move much more quickly than others. There is support for considering an SCI and a GCI together. 33. Balancing these perspectives, and with a spirit of compromise, we propose that Governors commit to consider an SCI for IBRD and IFC during 2017 once the current IBRD SCI and the work on a dynamic formula are complete, aiming to reach a decision by the Annual Meetings of 2017. This timetable is aligned with the proposed work on assessing the capital needs of IBRD and IFC. V. A Dynamic Formula 34. For much of its history, IBRD shareholding has been based on IMF quota shares, but a clear break was made in 2010 to better reflect the distinct mandate of the WBG (see Annexes 9a-h) reflect the status of shareholding in the WBG). At the same time, Governors called for the development of a benchmark for a dynamic formula.
35. We have discussed the issues around developing a dynamic formula as part of the 2015 shareholding review, and reviewed the experience in the IMF with the quota formula. There is agreement around some general features of the formula, including desirable features of the data and that it will be based primarily on economic weight and the WBG’s development mission, including measures of GDP and IDA contributions. 36. However, turning this benchmark into an agreed formula, with specific variable definitions and weights, will require further work as there are many options to assess for each variable and reaching agreement will require compromise and a careful balance of different interests. Our discussions have shown there are differences of substance on a number of issues, including the measurement of both economic weight and development contributions, how to reflect and incentivize IDA contributions, as well as on other potential candidates for inclusion in the formula. For example, some support including Trust Fund contributions in the formula and some support including interest payments by borrowers that contribute to IBRD capital, although neither is agreed. 7 Allocation of FY15 Net Income and Waivers of Loan Charges for FY16 (R2015-0111). 8 See para.37

10
37. The 2010 approach to realignment was not a formula-based approach (see Annex 10) but rather a ‘building block’ approach that distributed shares based on certain thresholds and ratios. Governors said clearly in 2010 this was a one-off approach “for the current selective capital increase only”.9 The outcome was to allocate 75 percent of shares according to economic weight, 20 percent according to IDA recognition, and 5 percent to smallest poor protection. Weights derived from this distribution could be considered in the upcoming work on the formula. The weights for the prospective formula should be considered and agreed by the Board as part of this work.
38. We propose setting in hand this detailed work to develop an agreed dynamic formula immediately after the Annual Meetings in Lima, reporting on progress to the 2016 Spring Meetings, with the aim to make a final recommendation to Governors at the 2016 Annual Meetings.
39. Based on our discussions so far, we recommend the following guidance on a formula to shape this future work:
(a) The formula should reflect and be consistent with the roles and responsibilities of shareholders in the WBG.10 (b) The formula should be simple and transparent, producing results that can be readily understood and that are broadly acceptable to the membership. (c) It should be based on readily available, timely and high quality data, and should capture broad economic trends avoiding excessive volatility. (d) It will be based primarily on economic weight and the WBG’s development mission, including measures of GDP and IDA contributions. Other variables that are consistent with this guidance may be considered. (e) Shareholding Reviews will base their work on the output of the formula which will give clear guidance for adjustments in shareholding.
VI. Approach to Shareholding Reviews 40. We have also reviewed the principles that underpin shareholding, notably the Istanbul principles which “stressed the importance of moving towards equitable voting power” while saying that “it will be important to protect the voting power of the smallest poor countries” (DC Communique 5 October 2009). These principles command broad support among shareholders, although there are different interpretations of equitable voting power, in particular whether to give priority to a fair balance of voting power country by country or between groups of countries, and of the appropriate balance of shareholder rights and responsibilities, including the burdenshare of financial contributions to the WBG. Some Executive Directors support defining the countries whose voting power would be protected in terms of poverty as well as size. 41. The different views on what constitutes equitable shareholding have not been resolved. However, provided the economic trends identified in this review persist and developing 9 Development Committee Communique, April 25 2010. 10 The term “roles” refers to the different parts shareholders play in the WBG, for example as providers of capital, as clients for its services and as participants in its governance. The term “responsibilities” refers to what is expected of shareholders in their roles, for example their support for its mission, their participation in its decision making, their financial contributions to its capital and to its work in the poorest countries through IDA.

11
countries continue to increase their contributions to the WBG’s development mission, there need not be a contradiction between equitable shareholding assessed country by country and equitable shareholding for country groups. 42. We have considered an updated set of agreed principles – based on existing commitments by Governors and notably the principles of Istanbul - to underpin and set direction for shareholding reviews. They reaffirm commitments on the timing of formula-based reviews, the aim of equitable voting power, and protection of the smallest and poorest members. Such agreed principles will support and guide our work as we prepare for the next realignment of shareholding based on shared principles.
43. We recommend endorsement of the following shareholding review principles: (a) Regular shareholding reviews will take place every 5 years based on agreed principles
and a dynamic formula. (b) The guiding principle for shareholding realignments is to achieve an equitable balance
of voting power. This can be assessed by looking at the balance of voting power between country groups and/or under-representation country by country.
(c) As a global cooperative, all voices are important. Where possible decision making is by consensus. All members have basic votes, protected in the constituent documents of the respective WBG entities.
(d) The smallest poor member countries shall be protected from dilution of their voting power.
(e) Shareholding brings both rights and responsibilities, and all shareholders have an interest in the long term financial sustainability of the WBG, including IBRD and IFC’s AAA credit rating, contributing in line with their capacity to do so.
VII. Representation 44. The size of the Boards of the WBG institutions, currently 25 Executive Directors, and their constituency structure, seeks to balance representation and efficiency in decision making. Under IBRD’s Articles, the 5 largest Members each appoint an Executive Director and may not form constituencies with other Members.11 The remaining chairs are elected. An increase in the number of elected Executive Directors, from 19 to 20, in order to add a third Director for Sub- Saharan Africa was approved by the Board of Governors in January 2009. Executive Directors of the Bank serve ex-officio as Executive Directors of IFC and IDA, as long as the country that appoints them, or any one of the countries that have elected them, is a member of IFC and IDA. All members of the MIGA Board of Directors are elected. 45. Constituency formation is subject to limits on the minimum and maximum percentage of eligible votes that an elected Executive Director casts, with the limits forming part of the election rules approved by Governors. In 2014, the limits were set at a minimum of 2% and a maximum of 10% of eligible votes. Provided they respect these limits on voting power,
11 With the 2010 voice reforms, China became the third largest shareholder and the United Kingdom and France the joint fifth largest shareholders. The Executive Directors opted to resolve “solely as a temporary measure” that France and the United Kingdom could each appoint an Executive Director “until the first Board election of Executive Directors after 2015.” An extension of this resolution was submitted to the Board of Executive Directors for approval on August 2015.

12
countries are free to form a constituency with other member countries. 46. Constituencies are typically governed by internal agreements voluntarily entered into by their members. Such agreements can set out the agreement on rotation of available positions within the Executive Director’s office. Changes in the agreed rotation of the Executive Directors and Alternate Executive Director positions in particular have the potential to affect the composition of the Board. For example, the recently agreed constituency agreement in the constituency led by Belgium provides for a rotation of the Executive Director position which enables the participation of both developed and developing countries in the Board. 47. A move to an all-elected Board for IBRD, with no appointed Executive Directors, could open scope for more multi-country constituencies to form and so open up the potential for further rotation among Executive Directors. This would require an IBRD Articles amendment (see Annex 4) and the advantages and disadvantages require careful consideration. It could be considered as part of the next realignment of shareholding. 48. The WBG Boards have consistently sought to enhance its effectiveness, including through increasing strategic focus. The Board Effectiveness agenda has been discussed regularly at COGAM, informed by Board Self-Assessment exercises, and rules and procedures have been reviewed and updated to improve the work of the Board. For example, more effective linkages are being made between the Standing Board Committees consultations and Board deliberations. Modifications to IFC Streamlined procedures have been implemented. Steering Committee (SC) meetings are now held bi-monthly. Annex 11 reports on this continuing agenda. VIII. Responsiveness 49. The WBG has undergone an extensive program of modernization over several years to streamline procedures without compromising quality and to improve its effectiveness. The 2015 Shareholding Review has taken stock of some key measures to enhance the responsiveness pillar of Voice since 2010. These include strategic and policy reforms that affect how the WBG engages with clients; corporate governance reforms to strengthen WBG accountability to shareholders; and, the important initiatives on Diversity and Inclusion.
(a) Client engagement
50. The World Bank Group’s Strategy and the goals endorsed by Governors at the 2013 Spring Meetings, together with recent policy reforms, are strengthening responsiveness to clients. Focusing on the poverty and prosperity goals requires the World Bank Group to exercise greater selectivity in choosing its engagements. Country programs are better-focused, and the World Bank Group is deepening its engagement with global issues affecting progress toward the two goals. Working as One World Bank Group and using its strengths as a global organization, the WBG is supporting clients in delivering effective development solutions to meet the goals. 51. The new country engagement model, based on evidence and analysis, enables the WBG to help country clients focus on the toughest challenges in meeting the two goals in a sustainable manner, in the context of each country’s national priorities and in coordination with other country-level development partners. Additionally, IFC is focusing on delivering integrated solutions to clients that draw on a full range of investment and advisory services and expertise.

13
52. Program-for-Results (PforR) Financing was introduced in 2012 as a third core instrument for the World Bank and its use is now expanding. It complements Development Policy Finance and Investment Project Finance by supporting a government program of expenditures, building institutional capacity, and tying financing to achievement of results. It responds to client countries’ requests for financing and expertise to improve their own development programs’ effectiveness. The new framework for procurement in Investment Project Finance aims to ensure that procurement in Bank operations supports clients to achieve value for money with integrity in delivering sustainable development. The main innovations proposed include a focus on value for money decision-making as a precept of modern procurement, increased support to borrower capacity building and institutional strengthening, and the ability to use alternative procurement arrangements where appropriate 53. The World Bank is revising its environmental and social safeguard policies to strengthen its standards to ensure the delivery of an environmental and social framework that is more efficient and comprehensive. The aim is to strengthen the Bank’s approach to managed environmental and social risks to better support sustainable development.
54. The World Bank’s responsiveness to client views on development has been supported by expanding field presence and decentralization of its staff in low-income and fragile-states. Regional Hubs, such as the Global Center on Conflict, Security and Development in Nairobi and the Infrastructure Finance Center of Excellence in Singapore, help the Bank to be closer to clients, potentially enhancing responsiveness. Hubs collect sector-specific knowledge in centralized locations to facilitate more enhanced knowledge exchange with and responsiveness to client concerns and needs. 55. Within client countries, stakeholders have enhanced access to information about Bank operations under the Access to Information policy agreed in 2010. This year, the extension of the Voice Secondment Program (VSP), newly transferred to the Corporate Secretariat, for another 5 years provides a comprehensive and successful capacity-enhancement program for client counterparts. A new governance structure for the VSP has been introduced, that better links with the WBG structure and seeks to maximize the impact of the program.
(b) Accountability to Shareholders
56. In response to the DC Communiqués calling for “open, merit-based and transparent selection of the World Bank President,” the Executive Directors in 2011 approved a process for selecting the World Bank President as an important part of the governance and accountability reforms. 57. In 2011, the Board agreed on a framework for a Dual Performance Feedback process to establish a constructive mechanism for exchanging views between the Board and the President in regard to oversight, strategic directions, and management of the WBG which is unprecedented among development institutions. As part of the Dual Performance Feedback process, each year, the Board conducts a Board Self-Assessment exercise with an objective to highlight areas of strategic importance or improvement that could be used to guide future discussions on Board Effectiveness.
58. The Corporate Scorecard is designed to facilitate the strategic dialogue between the Board and Management on overall corporate performance, progress, issues, and direction. The Scorecard serves as one of the tools for strategic engagement with the Board on the overall performance of the WBG in the context of results. The Corporate Scorecard is an important tool to assess the institution’s performance and results as well as a platform for exchanging feedback between the Board and the President on the effectiveness of the governance structures of the Institution. The Scorecard it is an integral part of the institutional reporting to shareholders.

14
(c) Diversity and Inclusion
59. Diversity and Inclusion (D&I: see Annex 12) is a critical component of Responsiveness. WBG D&I efforts are based on three pillars: Advocacy, Accountability and Inclusion. 60. In terms of advocacy, the first WBG statement of commitment to D&I has been issued by the President and SMT and published internally and externally. The first top-level D&I Compact has been developed and signed by the SMT. D&I Advocates have been selected for each Bank Group VPU and with their assistance D&I Compacts have been developed and signed by all VPUs. The IFC has also concluded a D&I Compact signed by all VPs and that cascades down to IFC Directors. An external Advisory Panel has been established, with well-known and experienced D&I champions as its members, to guide and advise the WBG. An internal WBG Council on Diversity and Inclusion being formed, including representation from the IFC Diversity and Inclusion Council. The D&I Office will now report both to the HRVP and to the Office of the President.
61. To strengthen accountability: D&I Compacts will be monitored by SMT on a quarterly basis. Updates will be posted, and progress tied to performance evaluations. Improved diversity indicators, based on staff self-identifying by nationality at birth, multiple nationalities, race and sexual orientation/gender identity will enable the WBG to better define its true diversity (beyond the current passport held by staff) and track any trends. 62. On inclusion, the WBG is embarking on EDGE Certification for gender parity. Training has been rolled out on “Unconscious Bias” and “Managing Challenges of Multicultural Complexities” as part of an expanded D&I learning curriculum. The WBG will also strengthen and leverage the Employee Resource Groups to improve inclusion for diverse staff, provide guidance and mentoring and help improve retention. 63. Over the past five years, the WBG has continued to make incremental progress against the institutional diversity targets. At the WBG level, women managers have increased from 34% of managers in 2011 to 36% in 2015, against a target of 50%. Women at Grades GF+ in technical, non-managerial roles have increased from 41% to 44%, against a target of 50%. The progress on the nationality and race indicators has been mixed, with Part II managers increasing from 40% to 41%, against a target 50%, and SSA/CR staff at Grades GF+ decreasing from 11.4% to 11.1%, against a target of 12.5%.
64. The Nationalities of Focus (NOFs) have been part of the WBG’s efforts to “recruit on as wide a geographic basis as possible,” as required in the Articles of Agreement. While the WBG has intentionally shied away from a quota system, the concept of NOFs was developed to address divergent shareholder concerns, with progress measured in the aggregate. A comparison of the growth rate of GF+ staff from NOFs (including current and former) to those from non- NOFs and the WBG as a whole shows that the approach has been successful. 65. While gender, nationality, and race are the official targets by which the WBG measures its diversity, they do not provide a sense of the WBG’s true diversity. In FY15, the WBG introduced four new, voluntary diversity indicators for staff to update within their HR profile: nationality at birth; multiple nationalities; race/ethnicity; sexual orientation/gender identity. The information is completely confidential and will only be used in the aggregate to identify trends in talent management processes. 66. We attach great importance to the D&I agenda and welcome the enhanced initiatives developed by WBG Management. We note the development of D&I Compacts, with targets, and will closely follow the success of these initiatives and monitor progress towards agreed targets.
15
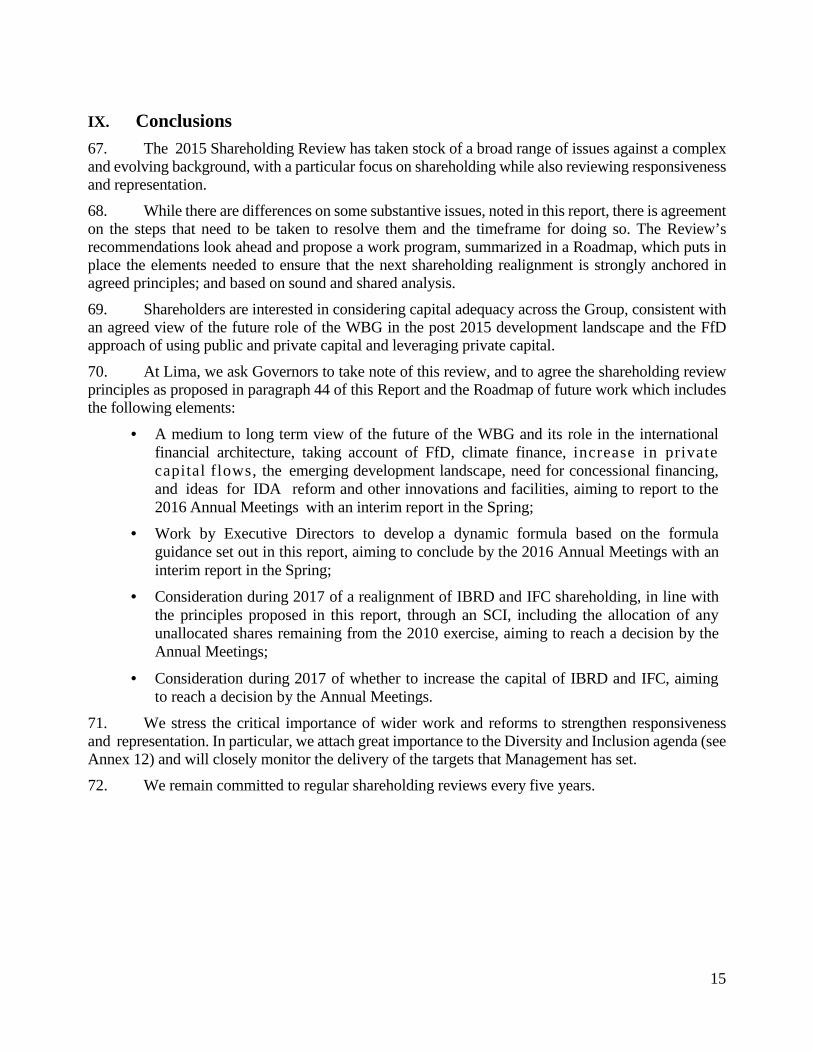
IX. Conclusions 67. The 2015 Shareholding Review has taken stock of a broad range of issues against a complex and evolving background, with a particular focus on shareholding while also reviewing responsiveness and representation. 68. While there are differences on some substantive issues, noted in this report, there is agreement on the steps that need to be taken to resolve them and the timeframe for doing so. The Review’s recommendations look ahead and propose a work program, summarized in a Roadmap, which puts in place the elements needed to ensure that the next shareholding realignment is strongly anchored in agreed principles; and based on sound and shared analysis.
69. Shareholders are interested in considering capital adequacy across the Group, consistent with an agreed view of the future role of the WBG in the post 2015 development landscape and the FfD approach of using public and private capital and leveraging private capital.
70. At Lima, we ask Governors to take note of this review, and to agree the shareholding review principles as proposed in paragraph 44 of this Report and the Roadmap of future work which includes the following elements:
• A medium to long term view of the future of the WBG and its role in the international financial architecture, taking account of FfD, climate finance, increase in private capital flows, the emerging development landscape, need for concessional financing, and ideas for IDA reform and other innovations and facilities, aiming to report to the 2016 Annual Meetings with an interim report in the Spring;
• Work by Executive Directors to develop a dynamic formula based on the formula guidance set out in this report, aiming to conclude by the 2016 Annual Meetings with an interim report in the Spring;
• Consideration during 2017 of a realignment of IBRD and IFC shareholding, in line with the principles proposed in this report, through an SCI, including the allocation of any unallocated shares remaining from the 2010 exercise, aiming to reach a decision by the Annual Meetings;
• Consideration during 2017 of whether to increase the capital of IBRD and IFC, aiming to reach a decision by the Annual Meetings.
71. We stress the critical importance of wider work and reforms to strengthen responsiveness and representation. In particular, we attach great importance to the Diversity and Inclusion agenda (see Annex 12) and will closely monitor the delivery of the targets that Management has set. 72. We remain committed to regular shareholding reviews every five years.

16
X. Roadmap Roadmap to implementation of the 2015 review
IDA Track
2015 AMs •2015 Review Completed •Governors endorse roadmap to implementation of 2015 review •Launch Work on Dynamic Formula •WBG Forward Look exercise launch
Spring 2016 •Dynamic formula interim report
•WBG Forward Look interim report
2016 AMs • Dynamic Formula complete
•WBG Forward Look report
Fall 2017 •IBRD SCI/GCI •IFC SCI/GCI
2018 AMs •Review of Representation & Responsiveness
November 2015
IDA Mid‐Term Review
December 2016
IDA18 Replenishment Negotiations end
November 2018
IDA18 Mid‐ Term Review
December 2019
IDA19 Replenishment
Negotiations end

Annex | 1
17
Annex 1. MIGA Shareholding I. Shareholding and Voting Power
1. MIGA’s voting structure consists of three types of votes – subscription votes (i.e., one subscription vote for each share of stock held by a member), membership votes (i.e., 177 membership votes at MIGA’s inception) and parity votes that result from the application of the Parity Factor. Therefore, shareholding alone is not determinative of the voting power in MIGA. Subscription votes, membership votes and parity votes (which are allocated so as to achieve parity) should be taken into account. II. MIGA Has Parity of Voting Power a. MIGA Convention Requirement
2. Article 39(a) of the MIGA Convention requires that MIGA establish “voting arrangements that reflect the equal interest in the Agency of the two Categories of States listed in Schedule A” of the Convention.1 Paragraph 63 of the Commentary on the MIGA Convention further explains that the “voting structure of the Agency reflects the view that Category One and Category Two countries have an equal stake in foreign investment, that cooperation between them is essential, and that both groups of countries should, when all eligible countries become members, have equal voting power (50/50)”. b. Implementation
3. In the years following MIGA’s inception, the Council of Governors sought the right time for achieving voting parity, and for various reasons postponed its implementation on several occasions.2
Finally, pursuant to Resolution No. 64, adopted on March 17, 2003, the Council of Governors mandated that Management present to the MIGA Board of Directors by 2004 “a proposal to achieve parity of voting power”. In accordance with Resolution 64, in 2004 Management submitted a detailed proposal to the MIGA Board of Directors3 for achieving voting parity. The Board approved the proposal and recommended it to the Council of Governors. On the basis of this recommendation, on October 3, 2004 the Council of Governors adopted Resolution No. 70 “Parity of Voting Power in MIGA”. It mandated that parity of voting power be achieved immediately through a Parity Factor calculated by using a formula that results in assigning an additional number of votes, called parity votes, to every member so that the aggregate number of votes of Category One members would be the same as the aggregate number of votes of Category Two members.
1 According to Article 39(a), each member shall have 177 membership votes, in addition to one subscription vote for each share of stock held by such member. The calculation of 177 membership votes resulted from the requirement for parity. In other words, the number of membership votes that each country would receive upon becoming a member of MIGA (177) was calculated in such a way that, when all members of the IBRD at the date of the Convention (October 11, 1985) plus Switzerland were to join MIGA and subscribe to their allocated shares, the aggregate voting power of Category One countries would be the same as that of Category Two countries. 2 In anticipation of additional countries joining MIGA over the years following its inception, the Council of Governors postponed the review and reallocation of shares for the purpose of achieving parity (Resolution No. 20 (1991) and Resolution No. 43 (1993)). Resolution No. 55 (1998) further postponed the decision on parity until the end of the subscription period for the 1998 General Capital Increase (described below). 3 President’s Report dated April 14, 2004 (MIGA/R2004-0021).

Annex | 1
18
4. Pursuant to Resolution No. 70, the Parity Factor, being a simple mathematical formula, is automatically adjusted at any time when (i) a new member country joins MIGA, (ii) a member country is moved from one category to the other, and (iii) a capital increase is undertaken, ensuring that the allocation of any available subscription shares and the application of the Parity Factor result in parity of voting power. III. General Capital Increase in MIGA
5. In MIGA’s history thus far there has been only one general capital increase and no special capital increases. The general capital increase, which is described below, occurred before the achievement of voting parity. 6. In 1999, MIGA’s capital was increased through a “funding package” comprising an IBRD grant of US$150 million and a general capital increase from members of US$850 million, of which US$150 million would be paid- in capital and US$700 million would be callable capital. On March 29, 1999, the Council of Governors adopted Resolution No. 57 entitled “1998 General Capital Increase” (1998 GCI) that increased the authorized capital of MIGA by SDR 785,590,000, divided into 78,559 shares each having a par value of SDR 10,000 (equivalent to US$850 million at the fixed rate of SDR 1.00 = US$1.082). These 78,559 shares were allocated to the one hundred and sixty-one countries that were signatories to the Convention at the time. The subscription period for these GCI shares was set at three years from the date Resolution No. 57 was adopted.
7. By Resolution No. 61 of 2002, the Council of Governors extended the subscription period for the 1998 GCI to March 28, 2003. Subsequently, Resolution No. 64, adopted on March 17, 2003 by the Council of Governors, allowed eligible countries to subscribe to the shares allotted to them under the 1998 GCI by depositing an Instrument of Contribution in a prescribed form. 8. Resolution 64 further provided that:
Countries that deposit an Instrument of Contribution are requested to pay for their GCI shares as soon as possible.
Voting power corresponding to GCI shares shall accrue when payment for such shares is made.
At appropriate intervals, the Board of Directors shall review the status of subscriptions and payments keeping in mind the objective of parity and may, at any time, recommend that the Council of Governors set a deadline for the payment of subscriptions.4
4 To date, no such deadline has been set. MIGA is participating in the ongoing WBG shareholding review.

Annex | 2
19
Annex 2. IFC’s Capital Adequacy 1. Economic capital is used to gauge the relative riskiness of different products and markets, to estimate their contribution to the overall risk of the portfolio, and to measure the total amount of capital that IFC needs to hold in order to operate. This overall measure, known as the Total Resources Required (TRR), is IFC’s best estimate of the capital needed to maintain the highest level of credit rating; it is the sum of the economic capital needed for all of the Corporation’s activities. 2. In line with industry best practices and with the international regulatory framework (the "Basel Accord"), IFC measures TRR by projecting a distribution of potential losses, based on a granular bottom‐up simulation of the entire investment and Treasury portfolios, calibrated to a triple-A standard. 3. The calculation of TRR reflects the size and composition of IFC’s portfolio, as well as the different risks faced by the Corporation. Consistent with industry and regulatory practice, IFC calculates economic capital for the following risk types:
Credit risk: the potential loss due to a client’s default or downgrade Market risk: the potential loss due to changes in market variables (e.g. interest
rates, currency, equity, or commodity prices) Operational risk: the potential loss resulting from inadequate or failed internal
processes, people, and systems or from external events; operational risk attends all IFC activities, including Advisory Services and the Asset Management Company.
4. As expected, given the nature of IFC’s business, the main contributor to the Corporation’s TRR is risk in the investment portfolio in particular Loan and Equity products, which account for 81 percent of the Corporation’s TRR.

Annex | 3
20
Annex 3. Milestones and Expected Actions on the IBRD and IFC Capital Increases
Bank SCI - Resolution 596
Part of phase one of the voice reform that aimed at enhancing voice and participation of DTCs by increasing basic votes.
Governors allocated 7,117 shares to 16 DTCs whose voting power would be diluted by the increase in basic votes.
The Resolution provided for a six-month extension. At the end of the subscription period, 15 members had subscribed 95.2% of the total shares
allocated. The remaining unsubscribed shares (339) were released and became part of the Bank's
authorized and unallocated capital stock. Key dates: 1- Adoption date: January 30, 2009 2- Original deadline: December 27, 2012 3- Extension deadline: June 27, 2013 4- Subscription ended on June 27, 2013 Bank SCI - Resolution 612
Part of the voice realignment exercise to achieve an increase of 3.13% in DTCs voting power.
Governors authorized an increase in the capital stock of an additional 230,374 shares ($27.8 billion, with a paid in of $1.6 billion).
These shares were allocated to 139 member countries. Resolution provides for a one-year or two-year extension, to be approved by the President
or the Board of Executive Directors, respectively. 88 members requested extension of deadline. As of August 10, 2015, 61 members had subscribed 80% of the total SCI shares allocated.
Key dates:
1- Adoption date: March 16, 2011 2- Original deadline: March 16, 2015 3- Extension deadline 1: March 16, 2016 for 42 members 4- Extension deadline 2: March 16, 2017 for 46 members Bank GCI - Resolution 613
The purpose of the increase is to enhance IBRD's financial capacity. Governors authorized an increase in the capital stock of an additional 484,102 shares ($58.4
billion, with a paid in of $3.5 billion).

Annex | 3
21
These shares were allocated to 186 member countries (prior to the membership of South Sudan). An additional 384 shares were allocated to South Sudan when they became a member.
The Resolution provides for a one-year or two-year extension, to be approved by the President or the Board of Executive Directors, respectively.
As of August 10, 2015, 60 members had subscribed 68% of the total GCI shares allocated.
Key dates: 1- Adoption date: March 16, 2011 2- Original deadline: March 16, 2016 Bank Additional Increase - Resolution 614
Governors authorized a special increase of 11,400 shares of the capital stock. Shares are not allocated. They are available for prospective new members. Adoption date: March 16, 2011.
IFC SCI - Resolution No. 256
The increase was part of the voice reform exercise to realign with IBRD. Governors authorized an increase in the capital stock of an additional 130,000 shares ($130
million). 200,000 shares (130,000 authorized + 70,000 already authorized) were allocated to 40
member countries. 4 countries renounced their shares, which were reallocated to other members. Resolution does not provide for any extension after the payment deadline. As of June 27, 2015, 35 members had subscribed 97.2% of the total SCI shares allocated. A total of 5,339 shares were released and became part of IFC's authorized and unallocated
capital stock.
Key dates: 1- Adoption date: March 9, 2012 2- Deadline for subscription: June 27, 2014 3- Reallocation of renounced shares: July 10, 2014 4- Deadline for subscription to reallocated shares: December 27, 2014 5- Payment deadline: June 27, 2015 6- Subscription ended on June 27, 2015

Annex | 4
22
Annex 4. Governors' Voting Requirements
Increase of Capital Stock (increase in authorized capital stock) IBRD Article II, Section 2(b) Three-fourths majority of the total voting power IFC Article II, Section 2(c)(ii) Four-fifths majority of the total voting power IDA Article III, Section 1(d) Two-thirds majority of the total voting power MIGA Chapter II, Article 5(c) and
Chapter I Article 3(d) Not less than two-thirds of the total voting power representing not less than 55 percent of the subscribed shares of the capital stock
Increase in the number of Executive Directors
IBRD Article V, Section 4(b) Four-fifths majority of the total voting power MIGA Chapter V, Article 32(b)
and Chapter VI Article 40(a)
The number of Directors may be adjusted by a majority of the votes of the Governors
Amendment of Articles of Agreement (IBRD-IFC-IDA) / Convention(MIGA)
IBRD Article VIII Three-fifths of the members, having eighty-five
percent of the total voting power IFC Article VII(a) Three-fifths of the Governors, exercising eighty-five
percent of the total voting power IDA Article IX(a) Three-fifths of the members, having four-fifths of
the total voting power MIGA Chapter X, Art. 59(a)(i) and
(ii) Three-fifths of the Governors, exercising four-fifths of the total voting power, except for any amendment modifying the following provisions which would require an affirmative vote of all Governors: (i) the right to withdraw from the Agency provided in Article 51 or the limitation on liability provided in Section (d) of Article 8; and (ii) the loss sharing arrangement provided in Articles 1 and 3 of Annex I of the Convention which result in an increase in any member's liability thereunder.
Issuance of Shares of Capital Stock (allocation of authorized shares)
IBRD Article V, Section 3(b) Majority of the votes cast in a voting that meets the
quorum requirement IFC Article II, Section 2(e) Three-fourths majority of the total voting power IDA N/A Not applicable MIGA N/A Not applicable

Annex | 5
23
Annex 5. Global Development Landscape: Post 2015, Climate, New Institutions
A. Changing global development landscape: the historical context
1. In the pre-industrial revolution period, economic weight in the global economy was broadly proportional to population.1 In other words, income per capita did not vary substantially across countries. From the start of the industrial revolution to the late 20th century, there was a great divergence in incomes per capita. The leaders, and subsequent early followers of the industrial revolution, experienced economic growth that far surpassed other economies. As a result, countries like the United States and many western European countries developed economies that comprised a far greater share of the global economy than their share of the world population. In 1990, for example, the United States’ share of world GNI was about 28 percent at market exchange rates (21 percent in PPP-adjusted terms), while its share of world population was just under 5 percent. China and India’s combined share of world GNI was 3.2 (7.5 percent in PPP-adjusted terms), while their share of the world’s population was 38 percent. The vast underlying differences in income per capita across countries continues to be, by far, the largest determinant of inequality across people in the world.2 2. Per capita incomes began growing much faster in developing countries than in the high income countries in the second half of the 20th century. Starting with (then developing) Japan in the Post-World War II period, and the “East Asian Miracle” economies in the 1960s and 1970s, new high-income economies became established. Later, the convergence forces expanded, starting with China in the 1980s, India in the 1990s and spreading to many developing countries and most developing regions in the early 2000s. This has dramatically changed the global economic landscape. The faster per capita growth combined with faster population growth has resulted in a much larger share of the developing world in the world economy: the GNI share has increased from about 14 percent in the early 1990s to nearly 32 percent in 2013, at market exchange rates, and has reached 48 percent in PPP terms.3 3. Moving forward, these trends are likely to continue.4 Forecasts for a long time horizon are subject to extremely large margins of error; however, it is expected that growth in the developing world will remain above the growth in the high-income countries – at least in aggregate, and probably in per capita terms as well. This would lead to a continued increasing share of the developing countries in the global economy – even if at a slower pace than was experienced during the extraordinary economic convergence period of recent decades. 4. Accompanying the growing share is a changed ranking of the largest economies in the world. China already has moved up the rankings to occupy second place, in both PPP and market exchange rates. In PPP terms, it probably already surpassed the United States at some point last year. Using market exchange rates, if China grows at roughly twice the growth rate of the United States, its economy’s size would likely surpass the United States in the next 15 to 20 years (depending upon changes in market exchange rates). It should be noted, however, that China 1 From the Maddison database. http://www.ggdc.net/maddison/maddison-project/home.htm 2 See Lakner, C. and B. Milanovic, 2013, “Global Income Distribution: From the Fall of the Berlin Wall to the Great Depression,” World Bank Policy Research Working Paper 6719, page 28. 3 Data from WDI, using the World Bank analytic classification of low and middle income countries. 4 Section D presents the World Bank’s forecasts over the near term (3 years).

Annex | 5
24
remains a middle-income country and faces many development challenges. B. From the MDGs to the SDGs post-20155
5. The 2015 shareholding review comes at an inflection point for both the setting of global development goals and the underlying economic and social trends crucial for meeting these goals. This year marks the end of the 15-year window for achieving the Millennium Development Goals (MDGs). Many of the global development benchmarks included in the MDGs will be extended through the launching of the Sustainable Development Goals (SDGs) this September and, on a parallel course, are reflected in the World Bank Group’s Twin Goals. The 2015 Global Monitoring Report will present the final MDG report card, pointing out that substantial progress has been made in some areas but that a large unfinished agenda remains. According to the new (still preliminary) poverty estimates based on 2011 purchasing power parity prices and a revised poverty line of $1.90 a day, 954 million people lived in extreme poverty in 2011. Extreme poverty continued its decades-long descent in 2012 and was brought down to about 907 million people, or 12.9 percent of the global population, in that year. Yet, according to this latest information, about 1 billion people remain extremely poor, mostly in Sub-Saharan Africa and South Asia, and pockets of very deep and concentrated poverty continue to exist in other regions. Comparatively less progress has been made on the MDGs that capture the non-income indicators of deprivation and which favor the intergenerational transmission of poverty, such as scant access to education, health care and social status. The expanded SDG agenda represents an effort to better capture the multi-dimensionality of development as well as to frame development goals that are universal in their applicability to both developing and developed countries. 6. There are a number of contextual factors that are likely to complicate the achievement of the development goals. First, extreme poverty has become increasingly concentrated in low-income countries characterized by high fertility, conflict and fragility, and/or dependence on natural resources. For example, in the Democratic Republic of Congo—a conflict state—88 percent of the population was living in extreme poverty in 2011, while in Zambia—a natural resource-based economy with low agricultural productivity—poverty levels were as high as 74 percent in 2010. In many countries, poverty reduction may be further challenged by the fact that the remaining poor belong to particularly disadvantaged groups or reside in remote areas. Second, while many countries have registered fast growth in the bottom 40 percent of their income distributions, the pursuit of shared prosperity is made difficult by persistent inequality in non-income socioeconomic indicators. This includes both access and quality concerns for basic services, human development programs and infrastructure. Third, many high-income countries are rebuilding fiscal space under high indebtedness, limiting the scope for direct interventions aimed at achieving development objectives at home and limiting the availability of official development assistance for international initiatives. 7. Scenarios have been constructed for the recent Global Economic Prospects, as well as last year’s Policy Research Report (A Measured Approach to Ending Poverty and Boosting Shared Prosperity). The scenarios reveal that historical growth rates with no change in inequality would be insufficient for reaching the 3 percent goal by 2030. In other words, to achieve the goal either growth would have to be substantially faster or growth would have to be shared more equitably, or some combination of these factors. Economic growth needs to be supplemented with other types of policy interventions if the WBG’s extreme poverty goal is to be reached.
5 Draws on material from the Concept Note for the 2015 Global Monitoring Report.

Annex | 5
25
C. Development Needs and the Emergence of New Development Finance Institutions
8. With a billion people living on less than $1.25 a day, and billions more living well below rich country poverty lines, the development needs are enormous. Developing countries seek knowledge, ideas, data and finance for both their public and private sectors, and the WBG remains an important source of solutions for all of these needs. That said, the WBG’s lending flows are a small fraction of the financing needs. Developing economies produce an annual GDP/GNI on the order of $24 trillion, and Gross Fixed Capital Formation on the order of $7 to 8 trillion in recent years.6 Much of the latter investment is financed from domestic resources. Bilateral development assistance and multilateral flows finance only a small share of the investment needs of the developing countries. Financing flows achieve a broader impact when they are accompanied by knowledge and lessons from experience, either embedded in “project supervision” or conducted in stand-alone advisory and analytic services. 9. IBRD gross disbursements have been on the order of $15 billion, and IDA (gross) disbursements have been the order of $7 billion to $9 billion (nearly 10 in CY13 was an exception) in recent years. This compares to net ODA of about $135 billion. Given the vast financing needs discussed above, the emergence of new multilateral and bilateral institutions is welcome. An important consideration for existing and emerging institutions is to assure the effectiveness of their work in order to leverage a major impact from the small share of development needs that are being financed.
10. In going from “billions to trillions,” there is the need to strengthen domestic resource mobilization and public expenditures, as well as enhanced efforts at engaging and incentivizing private finance.7 There is also clear scope for innovation at existing development finance institutions to support countries in these areas, as well as space for new institutions to provide finance and leverage global knowledge. 11. Two new development finance institutions that are in the advanced stage of their establishment are the New Development Bank – supported by the “BRICS” countries (Brazil, Russian Federation, India, China, and South Africa)—and the Asian Infrastructure Investment Bank (AIIB), currently supported by 57 Prospective Founding Members (PFM).8 The New Development Bank already has established Articles of Agreement. Article 7 establishes the terms of the initial capital base – with authorized capital of $100 billion, half of which will be subscribed capital. Of the $50 billion initially subscribed, $10 billion is "paid-in" capital, while the remaining $40 billion is “callable” capital.9 The AIIB continues to progress in the establishment of the new bank. Fifty countries signed the Articles of Agreement in Beijing, on June 29, 2015 and the plan is for the bank to be operational by the end of 2015. 6 Data from WDI in current dollars. 7 See the paper “From Billions to Trillions: Transforming Development Finance Post-2015 Financing for Development: Multilateral Development Finance” prepared jointly by the African Development Bank, the Asian Development Bank, the European Bank for Reconstruction and Development, the European Investment Bank, the Inter-American Development Bank, the International Monetary Fund, and the World Bank Group for the April 18, 2015 Development Committee meeting. 8 See www.aiibank.org. 9 The Articles of Agreement were agreed to at the Sixth BRICS Summit in Fortaleza Brazil, July 14-16, 2014. For more information, see: http://brics6.itamaraty.gov.br/media2/press-releases/219-agreement-on-the-new-development-bank-fortaleza-july-15.

Annex | 5
26
D. Medium-Term Economic Prospects
12. With a deceleration in activity underway in a number of large economies, the global economy is expected to expand by 2.8 percent this year, lower than anticipated in January. In 2016–17, global growth is projected to pick up to an average of 3.2 percent and developing-country growth to 5.3 percent, supported by continued low commodity prices and generally still-benign financing conditions (Figure 1). 13. Important shifts in global growth patterns are emerging. In high-income countries, the recovery is gathering momentum and will be characterized over the medium term by a narrowing gap between the growth rate of the United States and that of the Euro Area and Japan. The strengthening of activity in high-income countries means that these countries will to contribute an increasing share of global growth (Figure 2). Among developing countries, a broad-based slowdown continues in 2015 (Table 1) that affects the majority of developing countries. 14. Growth in Brazil, held back by weak confidence and higher inflation, is expected to contract by 1.3 percent in 2015, while Russia’s economy, hit by oil price declines and sanctions, is forecast to contract by 2.7 percent. In China, a carefully managed slowdown continues. Growth in Mexico is projected to be considerably more moderate than expected at the beginning of the year, with growth weighed down by low oil prices and a soft patch in activity in the United States. Growth in low-income countries will remain more buoyant, however, bolstered by public and foreign investment and remittances. 15. Developing countries are facing two major transitions: to an era of low commodity prices and the prospect of rising borrowing cost. 16. The adjustment to an era of low-commodity prices is becoming increasingly pronounced. Despite finding some support in the first quarter of 2015, oil prices remain low, and other commodity prices have been soft as well. As a result, in commodity-exporting developing countries, especially those with limited reserve and fiscal buffers, activity has slowed more than anticipated, currencies have weakened, and domestic and external vulnerabilities have grown. Deteriorating prospects in these countries have eroded their resilience to future shocks. Although oil-importing countries have benefited from improving current account and fiscal balances and falling inflation as oil prices have declined, country-specific headwinds have thus far prevented low oil prices from being fully reflected in stronger GDP growth. 17. In a second transition, the prospects of tightening U.S. monetary policy, alongside continued expansionary monetary policy by other major central banks, has already contributed to broad-based depreciation of developing-country currencies against the U.S. dollar, raising concerns about U.S. dollar- denominated exposures in sovereign and corporate balance sheets in some countries. The first U.S. interest rate increase since the crisis and the subsequent tightening cycle should proceed smoothly and result in a modest tightening of global financial conditions. However, the taper tantrum of 2013 is a reminder that there remain important risks that these rate increases will be associated with financial market volatility and slowing capital inflows to developing countries. The June 2015 edition of the World Bank’s Global Economic Prospects estimates that capital flows to developing countries could fall by about one-third. While, on average, this is manageable, it could affect some countries disproportionately. In countries with weak growth prospects, elevated vulnerabilities, and policy uncertainty, financial market volatility could be associated with significant stress in financial markets.
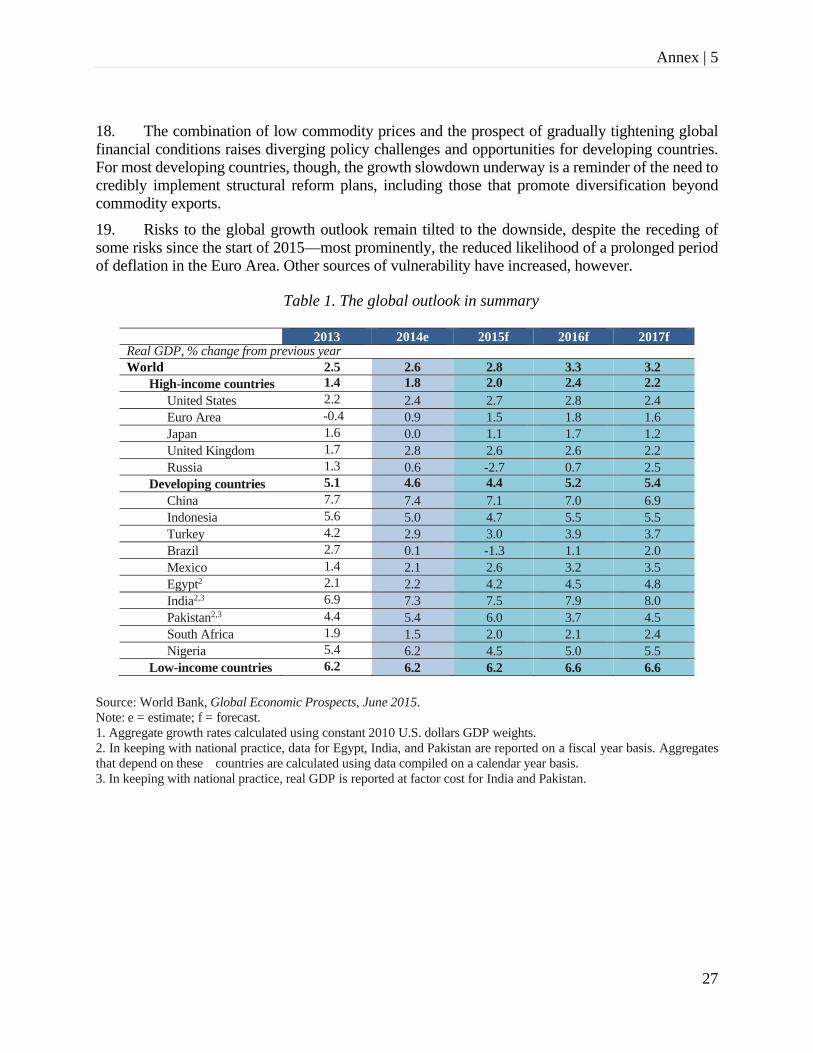
Annex | 5
27
18. The combination of low commodity prices and the prospect of gradually tightening global financial conditions raises diverging policy challenges and opportunities for developing countries. For most developing countries, though, the growth slowdown underway is a reminder of the need to credibly implement structural reform plans, including those that promote diversification beyond commodity exports. 19. Risks to the global growth outlook remain tilted to the downside, despite the receding of some risks since the start of 2015—most prominently, the reduced likelihood of a prolonged period of deflation in the Euro Area. Other sources of vulnerability have increased, however.
Table 1. The global outlook in summary
2013 2014e 2015f 2016f 2017f Real GDP, % change from previous year World 2.5 2.6 2.8 3.3 3.2
High-income countries 1.4 1.8 2.0 2.4 2.2United States 2.2 2.4 2.7 2.8 2.4 Euro Area -0.4 0.9 1.5 1.8 1.6 Japan 1.6 0.0 1.1 1.7 1.2 United Kingdom 1.7 2.8 2.6 2.6 2.2 Russia 1.3 0.6 -2.7 0.7 2.5
Developing countries 5.1 4.6 4.4 5.2 5.4China 7.7 7.4 7.1 7.0 6.9 Indonesia 5.6 5.0 4.7 5.5 5.5 Turkey 4.2 2.9 3.0 3.9 3.7 Brazil 2.7 0.1 -1.3 1.1 2.0 Mexico 1.4 2.1 2.6 3.2 3.5 Egypt2 2.1 2.2 4.2 4.5 4.8 India2,3 6.9 7.3 7.5 7.9 8.0 Pakistan2,3 4.4 5.4 6.0 3.7 4.5 South Africa 1.9 1.5 2.0 2.1 2.4 Nigeria 5.4 6.2 4.5 5.0 5.5
Low-income countries 6.2 6.2 6.2 6.6 6.6
Source: World Bank, Global Economic Prospects, June 2015. Note: e = estimate; f = forecast. 1. Aggregate growth rates calculated using constant 2010 U.S. dollars GDP weights. 2. In keeping with national practice, data for Egypt, India, and Pakistan are reported on a fiscal year basis. Aggregates that depend on these countries are calculated using data compiled on a calendar year basis. 3. In keeping with national practice, real GDP is reported at factor cost for India and Pakistan.
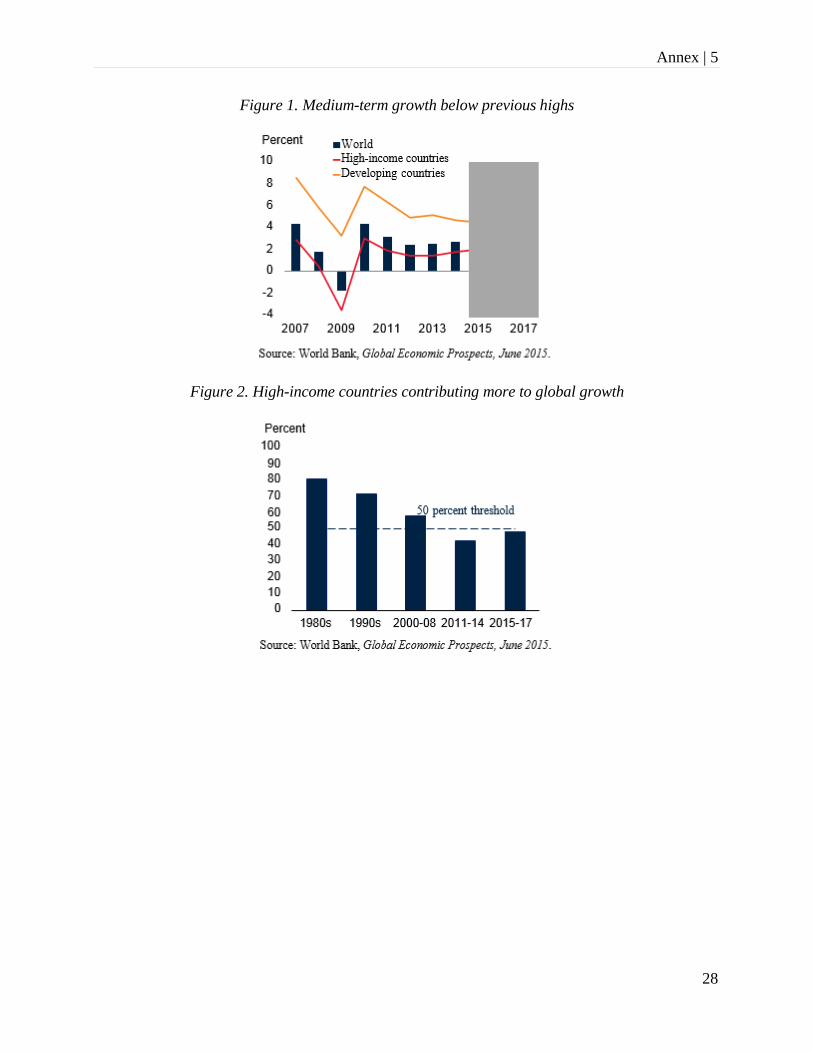
Annex | 5
28
Figure 1. Medium-term growth below previous highs
Figure 2. High-income countries contributing more to global growth

Ratio of IBRD to GDP Blend Shares – Three-Year Average (2012-2014) Annex | 6a
29
Member CountriesMER/PPP ‐
0/100
MER/PPP ‐
10/90
MER/PPP ‐
20/80
MER/PPP ‐
30/70
MER/PPP ‐
40/60
MER/PPP ‐
50/50
MER/PPP ‐
60/40
MER/PPP ‐
70/30
MER/PPP ‐
80/20
MER/PPP ‐
90/10
MER/PPP ‐
100/0Classification
3/
Afghanistan 0.38 0.40 0.42 0.45 0.48 0.51 0.55 0.60 0.65 0.72 0.80 DTC
Albania 1.81 1.89 1.97 2.06 2.15 2.26 2.38 2.51 2.65 2.82 3.00 DTC
Algeria 0.99 1.04 1.09 1.15 1.21 1.28 1.36 1.45 1.56 1.68 1.82 DTC
Angola 1.00 0.99 0.99 0.99 0.99 0.99 0.98 0.98 0.98 0.98 0.98 DTC
Antigua and Barbuda 15.24 15.45 15.65 15.87 16.08 16.31 16.54 16.78 17.02 17.27 17.53 DTC
Argentina 1.27 1.28 1.30 1.32 1.34 1.35 1.37 1.39 1.41 1.44 1.46 DTC
Armenia 3.15 3.27 3.41 3.56 3.73 3.90 4.10 4.32 4.57 4.84 5.15 DTC
Australia 1.39 1.26 1.15 1.06 0.98 0.91 0.85 0.80 0.76 0.72 0.68 Developed
Austria 1.68 1.60 1.53 1.46 1.40 1.35 1.29 1.25 1.20 1.16 1.12 Developed
Azerbaijan 0.66 0.68 0.71 0.74 0.78 0.81 0.85 0.90 0.95 1.00 1.07 DTC
Bahamas, The 6.82 6.62 6.44 6.27 6.10 5.94 5.80 5.65 5.52 5.39 5.27 DTC
Bahrain 1.06 1.09 1.11 1.14 1.17 1.21 1.24 1.28 1.32 1.36 1.40 DTC
Bangladesh 0.62 0.65 0.70 0.74 0.79 0.86 0.93 1.01 1.11 1.23 1.38 DTC
Barbados 13.25 12.67 12.14 11.64 11.19 10.77 10.38 10.02 9.68 9.37 9.07 DTC
Belarus 1.11 1.16 1.22 1.28 1.34 1.41 1.49 1.58 1.69 1.80 1.93 DTC
Belgium 3.53 3.36 3.21 3.07 2.94 2.82 2.71 2.61 2.52 2.43 2.35 Developed
Belize 13.27 13.57 13.88 14.20 14.54 14.90 15.27 15.66 16.07 16.51 16.97 DTC
Benin 3.01 3.14 3.28 3.42 3.59 3.76 3.96 4.18 4.42 4.70 5.01 DTC
Bhutan 5.31 5.63 5.99 6.40 6.87 7.41 8.05 8.80 9.71 10.84 12.25 DTC
Bolivia 1.74 1.81 1.88 1.95 2.04 2.13 2.22 2.33 2.45 2.58 2.73 DTC
Bosnia and Herzegovina 1.00 1.03 1.07 1.11 1.16 1.20 1.26 1.31 1.38 1.45 1.52 DTC
Botswana 1.04 1.08 1.12 1.17 1.22 1.28 1.34 1.41 1.49 1.57 1.67 DTC
Brazil 0.74 0.74 0.74 0.74 0.74 0.74 0.74 0.74 0.74 0.73 0.73 DTC
Brunei Darussalam 4.33 4.45 4.57 4.70 4.83 4.98 5.13 5.29 5.46 5.65 5.84 DTC
Bulgaria 2.53 2.63 2.73 2.84 2.96 3.09 3.23 3.39 3.56 3.75 3.97 DTC
Burkina Faso 2.02 2.11 2.20 2.31 2.42 2.55 2.68 2.84 3.01 3.21 3.44 DTC
Burundi 5.88 6.20 6.56 6.97 7.43 7.96 8.56 9.27 10.10 11.10 12.31 DTC
Cabo Verde 9.98 10.22 10.48 10.74 11.02 11.31 11.62 11.95 12.30 12.66 13.05 DTC
Cambodia 0.47 0.50 0.53 0.57 0.61 0.65 0.71 0.77 0.84 0.93 1.05 DTC
Cameroon 1.54 1.60 1.66 1.73 1.81 1.89 1.98 2.07 2.18 2.30 2.43 DTC
Canada 1.70 1.60 1.51 1.43 1.36 1.30 1.24 1.18 1.13 1.09 1.05 Developed
Central African Republic 16.52 16.94 17.39 17.85 18.35 18.87 19.42 20.00 20.62 21.28 21.98 DTC
Chad 1.99 2.07 2.15 2.23 2.32 2.42 2.53 2.65 2.78 2.92 3.08 DTC
Chile 1.15 1.16 1.17 1.17 1.18 1.19 1.20 1.20 1.21 1.22 1.22 DTC
China 0.28 0.29 0.30 0.31 0.31 0.32 0.33 0.34 0.35 0.36 0.37 DTC
Colombia 0.72 0.73 0.74 0.75 0.76 0.77 0.79 0.80 0.81 0.83 0.84 DTC
Comoros 16.66 17.08 17.51 17.97 18.46 18.97 19.51 20.09 20.70 21.34 22.03 DTC
Congo, Democratic Republic of 3.20 3.26 3.33 3.40 3.47 3.54 3.62 3.70 3.78 3.87 3.96 DTC
Congo, Republic of 2.23 2.30 2.37 2.44 2.52 2.60 2.69 2.78 2.88 2.99 3.11 DTC
Costa Rica 0.73 0.74 0.74 0.74 0.75 0.75 0.75 0.75 0.76 0.76 0.76 DTC
RATIO OF IBRD TO GDP BLEND SHARES (2012‐2014)1/ 2/

Ratio of IBRD to GDP Blend Shares – Three-Year Average (2012-2014) Annex | 6a
30
Member CountriesMER/PPP ‐
0/100
MER/PPP ‐
10/90
MER/PPP ‐
20/80
MER/PPP ‐
30/70
MER/PPP ‐
40/60
MER/PPP ‐
50/50
MER/PPP ‐
60/40
MER/PPP ‐
70/30
MER/PPP ‐
80/20
MER/PPP ‐
90/10
MER/PPP ‐
100/0Classification
3/
Cote d'Ivoire 2.36 2.45 2.54 2.65 2.76 2.88 3.02 3.16 3.32 3.50 3.70 DTC
Croatia 1.42 1.44 1.46 1.49 1.51 1.53 1.55 1.58 1.60 1.63 1.66 DTC
Cyprus 3.02 2.96 2.90 2.84 2.79 2.74 2.69 2.64 2.59 2.55 2.51 Developed
Czech Republic 1.15 1.16 1.17 1.18 1.19 1.20 1.21 1.22 1.23 1.25 1.26 DTC
Denmark 3.18 2.94 2.73 2.55 2.39 2.25 2.13 2.01 1.91 1.82 1.74 Developed
Djibouti 13.50 13.84 14.19 14.56 14.95 15.37 15.80 16.27 16.76 17.28 17.83 DTC
Dominica 37.55 37.76 37.98 38.20 38.42 38.65 38.87 39.10 39.34 39.57 39.81 DTC
Dominican Republic 0.92 0.95 0.98 1.02 1.06 1.11 1.15 1.21 1.26 1.33 1.40 DTC
Ecuador 0.99 1.02 1.04 1.07 1.10 1.13 1.17 1.20 1.24 1.28 1.32 DTC
Egypt, Arab Republic of 0.52 0.55 0.59 0.63 0.68 0.74 0.81 0.89 0.99 1.11 1.27 DTC
El Salvador 0.81 0.83 0.86 0.89 0.93 0.96 1.00 1.05 1.09 1.14 1.20 DTC
Equatorial Guinea 1.56 1.59 1.62 1.65 1.68 1.72 1.75 1.79 1.83 1.87 1.91 DTC
Eritrea 4.95 5.15 5.36 5.59 5.84 6.12 6.42 6.75 7.12 7.53 7.99 DTC
Estonia 1.53 1.53 1.54 1.54 1.54 1.54 1.55 1.55 1.55 1.55 1.56 DTC
Ethiopia 0.50 0.53 0.55 0.59 0.62 0.66 0.71 0.76 0.83 0.90 0.99 DTC
Fiji 8.09 8.28 8.47 8.67 8.89 9.11 9.35 9.59 9.86 10.13 10.42 DTC
Finland 2.33 2.19 2.06 1.95 1.84 1.75 1.67 1.60 1.53 1.46 1.41 Developed
France 1.60 1.52 1.45 1.39 1.33 1.28 1.23 1.18 1.14 1.10 1.06 Developed
Gabon 1.82 1.86 1.91 1.95 2.00 2.05 2.10 2.16 2.22 2.28 2.35 DTC
Gambia, The 11.37 12.11 12.95 13.91 15.03 16.35 17.92 19.83 22.18 25.17 29.10 DTC
Georgia 3.12 3.22 3.33 3.45 3.57 3.71 3.86 4.02 4.19 4.38 4.58 DTC
Germany 1.19 1.15 1.11 1.06 1.03 0.99 0.96 0.93 0.90 0.87 0.85 Developed
Ghana 0.95 0.99 1.04 1.09 1.15 1.21 1.28 1.36 1.45 1.55 1.67 DTC
Greece 1.15 1.13 1.11 1.10 1.08 1.06 1.05 1.03 1.02 1.00 0.99 Developed
Grenada 24.22 24.39 24.58 24.76 24.95 25.14 25.33 25.53 25.73 25.93 26.13 DTC
Guatemala 1.12 1.16 1.20 1.25 1.30 1.35 1.41 1.47 1.55 1.62 1.71 DTC
Guinea 5.65 5.90 6.18 6.48 6.81 7.18 7.59 8.05 8.57 9.16 9.84 DTC
Guinea‐Bissau 14.23 14.91 15.65 16.46 17.37 18.38 19.52 20.81 22.28 23.97 25.95 DTC
Guyana 12.95 13.23 13.52 13.83 14.15 14.49 14.84 15.21 15.61 16.02 16.45 DTC
Haiti 3.92 4.06 4.22 4.38 4.56 4.76 4.97 5.20 5.46 5.74 6.05 DTC
Honduras 1.17 1.20 1.23 1.27 1.31 1.35 1.39 1.44 1.49 1.54 1.60 DTC
Hungary 2.06 2.11 2.16 2.21 2.26 2.32 2.38 2.44 2.51 2.58 2.66 DTC
Iceland 5.66 5.37 5.10 4.86 4.64 4.44 4.25 4.08 3.93 3.78 3.65 Developed
India 0.45 0.48 0.52 0.56 0.60 0.66 0.72 0.80 0.90 1.02 1.19 DTC
Indonesia 0.41 0.43 0.45 0.48 0.51 0.54 0.59 0.63 0.69 0.75 0.83 DTC
Iran, Islamic Republic of 1.23 1.29 1.36 1.43 1.52 1.61 1.72 1.84 1.98 2.14 2.33 DTC
Iraq 0.34 0.35 0.37 0.39 0.40 0.42 0.45 0.47 0.50 0.53 0.56 DTC
Ireland 1.62 1.54 1.48 1.41 1.35 1.30 1.25 1.21 1.16 1.12 1.09 Developed
Israel 1.02 0.97 0.93 0.89 0.86 0.82 0.79 0.76 0.74 0.71 0.69 Developed
Italy 1.32 1.28 1.23 1.19 1.16 1.12 1.09 1.06 1.03 1.00 0.97 Developed
RATIO OF IBRD TO GDP BLEND SHARES (2012‐2014)1/ 2/

Ratio of IBRD to GDP Blend Shares – Three-Year Average (2012-2014) Annex | 6a
31
Member CountriesMER/PPP ‐
0/100
MER/PPP ‐
10/90
MER/PPP ‐
20/80
MER/PPP ‐
30/70
MER/PPP ‐
40/60
MER/PPP ‐
50/50
MER/PPP ‐
60/40
MER/PPP ‐
70/30
MER/PPP ‐
80/20
MER/PPP ‐
90/10
MER/PPP ‐
100/0Classification
3/
Jamaica 6.05 6.16 6.28 6.41 6.54 6.67 6.81 6.96 7.11 7.27 7.44 DTC
Japan 1.59 1.51 1.44 1.38 1.32 1.26 1.21 1.17 1.12 1.08 1.05 Developed
Jordan 1.17 1.22 1.27 1.33 1.39 1.46 1.54 1.63 1.72 1.83 1.96 DTC
Kazakhstan 0.51 0.53 0.54 0.56 0.57 0.59 0.61 0.63 0.65 0.67 0.69 DTC
Kenya 1.23 1.28 1.33 1.39 1.45 1.53 1.60 1.69 1.79 1.90 2.02 DTC
Kiribati 158.31 154.96 151.75 148.67 145.72 142.87 140.14 137.51 134.98 132.54 130.18 DTC
Korea, Republic of 1.00 0.99 0.98 0.98 0.97 0.96 0.96 0.95 0.94 0.94 0.93 DTC
Kosovo 3.85 4.02 4.20 4.40 4.62 4.86 5.13 5.43 5.77 6.15 6.59 DTC
Kuwait 3.11 3.16 3.21 3.25 3.30 3.36 3.41 3.46 3.52 3.58 3.64 DTC
Kyrgyz Republic 3.91 4.11 4.32 4.55 4.81 5.10 5.43 5.80 6.23 6.73 7.32 DTC
Lao People's Democratic Republic 0.37 0.39 0.41 0.44 0.47 0.51 0.55 0.60 0.66 0.73 0.82 DTC
Latvia 1.73 1.74 1.75 1.77 1.78 1.80 1.81 1.83 1.84 1.86 1.88 DTC
Lebanon 0.61 0.62 0.64 0.65 0.67 0.68 0.70 0.72 0.74 0.76 0.78 DTC
Lesotho 7.95 8.31 8.70 9.13 9.61 10.13 10.72 11.38 12.13 12.98 13.96 DTC
Liberia 7.83 8.10 8.38 8.69 9.01 9.37 9.75 10.16 10.62 11.11 11.65 DTC
Libya 3.58 3.69 3.81 3.94 4.08 4.22 4.38 4.55 4.74 4.94 5.15 DTC
Lithuania 1.12 1.14 1.16 1.18 1.21 1.23 1.25 1.28 1.30 1.33 1.36 DTC
Luxembourg 2.03 1.91 1.81 1.71 1.63 1.55 1.48 1.41 1.36 1.30 1.25 Developed
Macedonia, former Yugoslav Republic of 0.92 0.97 1.01 1.07 1.12 1.19 1.26 1.34 1.43 1.54 1.66 DTC
Madagascar 2.80 2.97 3.16 3.38 3.62 3.91 4.24 4.64 5.12 5.71 6.46 DTC
Malawi 5.43 5.75 6.12 6.53 7.01 7.56 8.20 8.96 9.88 11.01 12.43 DTC
Malaysia 0.66 0.69 0.72 0.75 0.78 0.82 0.86 0.91 0.96 1.02 1.08 DTC
Maldives 6.31 6.45 6.59 6.74 6.90 7.07 7.24 7.43 7.62 7.82 8.04 DTC
Mali 2.89 3.01 3.15 3.29 3.45 3.63 3.82 4.04 4.28 4.56 4.87 DTC
Malta 4.72 4.70 4.69 4.67 4.66 4.64 4.63 4.61 4.60 4.59 4.57 DTC
Marshall Islands 154.91 150.05 145.48 141.18 137.13 133.31 129.69 126.26 123.01 119.92 116.99 DTC
Mauritania 4.01 4.23 4.48 4.77 5.09 5.46 5.88 6.38 6.97 7.68 8.55 DTC
Mauritius 3.12 3.20 3.30 3.39 3.50 3.61 3.72 3.85 3.98 4.12 4.28 DTC
Mexico 0.87 0.89 0.90 0.92 0.94 0.95 0.97 0.99 1.01 1.03 1.05 DTC
Micronesia, Federated States of 88.14 85.83 83.63 81.55 79.57 77.68 75.88 74.16 72.52 70.94 69.44 DTC
Moldova 5.33 5.53 5.74 5.98 6.23 6.51 6.81 7.14 7.50 7.91 8.36 DTC
Mongolia 0.95 1.00 1.05 1.11 1.18 1.25 1.33 1.42 1.53 1.66 1.80 DTC
Montenegro 4.43 4.58 4.74 4.91 5.09 5.28 5.49 5.72 5.97 6.24 6.53 DTC
Morocco 1.22 1.27 1.33 1.40 1.47 1.54 1.63 1.73 1.84 1.97 2.11 DTC
Mozambique 2.07 2.12 2.18 2.24 2.31 2.37 2.45 2.52 2.60 2.69 2.78 DTC
Myanmar 0.69 0.74 0.79 0.86 0.93 1.02 1.13 1.26 1.42 1.64 1.93 DTC
Namibia 3.87 3.95 4.03 4.11 4.19 4.28 4.38 4.47 4.57 4.68 4.79 DTC
Nepal 0.99 1.05 1.12 1.20 1.29 1.40 1.52 1.67 1.86 2.09 2.38 DTC
Netherlands 2.60 2.48 2.37 2.27 2.18 2.10 2.02 1.95 1.88 1.82 1.76 Developed
New Zealand 2.81 2.64 2.49 2.35 2.23 2.12 2.02 1.93 1.85 1.77 1.70 Developed
RATIO OF IBRD TO GDP BLEND SHARES (2012‐2014)1/ 2/

Ratio of IBRD to GDP Blend Shares – Three-Year Average (2012-2014) Annex | 6a
32
Member CountriesMER/PPP ‐
0/100
MER/PPP ‐
10/90
MER/PPP ‐
20/80
MER/PPP ‐
30/70
MER/PPP ‐
40/60
MER/PPP ‐
50/50
MER/PPP ‐
60/40
MER/PPP ‐
70/30
MER/PPP ‐
80/20
MER/PPP ‐
90/10
MER/PPP ‐
100/0Classification
3/
Nicaragua 1.39 1.45 1.53 1.61 1.70 1.80 1.92 2.05 2.20 2.37 2.58 DTC
Niger 3.28 3.41 3.55 3.70 3.87 4.05 4.25 4.47 4.72 4.99 5.30 DTC
Nigeria 0.73 0.75 0.78 0.80 0.83 0.85 0.88 0.92 0.95 0.99 1.02 DTC
Norway 1.78 1.61 1.47 1.35 1.24 1.16 1.08 1.01 0.96 0.90 0.86 Developed
Oman 0.56 0.58 0.60 0.62 0.64 0.67 0.69 0.72 0.75 0.78 0.82 DTC
Pakistan 0.62 0.66 0.71 0.76 0.83 0.90 0.99 1.10 1.24 1.41 1.64 DTC
Palau 3.01 2.99 2.97 2.95 2.93 2.91 2.89 2.87 2.85 2.83 2.81 DTC
Panama 0.53 0.54 0.55 0.57 0.58 0.60 0.61 0.63 0.65 0.67 0.69 DTC
Papua New Guinea 4.46 4.40 4.33 4.27 4.21 4.15 4.10 4.04 3.99 3.94 3.89 DTC
Paraguay 1.46 1.50 1.55 1.60 1.65 1.70 1.76 1.82 1.89 1.96 2.04 DTC
Peru 0.96 0.98 1.01 1.03 1.06 1.09 1.12 1.15 1.18 1.22 1.26 DTC
Philippines 0.68 0.71 0.75 0.78 0.82 0.87 0.92 0.98 1.04 1.12 1.20 DTC
Poland 0.83 0.85 0.87 0.89 0.91 0.93 0.96 0.98 1.01 1.04 1.07 DTC
Portugal 1.15 1.15 1.14 1.13 1.13 1.12 1.12 1.11 1.11 1.10 1.09 Developed
Qatar 0.21 0.21 0.21 0.21 0.21 0.22 0.22 0.22 0.22 0.22 0.22 DTC
Romania 0.81 0.83 0.86 0.90 0.93 0.97 1.01 1.05 1.10 1.15 1.20 DTC
Russian Federation 0.82 0.84 0.86 0.89 0.91 0.94 0.96 0.99 1.02 1.06 1.09 DTC
Rwanda 3.80 3.96 4.14 4.34 4.55 4.79 5.05 5.35 5.68 6.06 6.49 DTC
Samoa 31.45 31.47 31.49 31.51 31.53 31.54 31.56 31.58 31.60 31.62 31.64 DTC
San Marino 17.37 16.91 16.48 16.07 15.68 15.30 14.95 14.61 14.28 13.97 13.68 Developed
Sao Tome and Principe 54.32 55.91 57.59 59.38 61.28 63.30 65.46 67.78 70.27 72.94 75.83 DTC
Saudi Arabia 1.92 1.99 2.06 2.14 2.23 2.32 2.42 2.53 2.65 2.78 2.92 DTC
Senegal 4.07 4.23 4.40 4.58 4.78 5.00 5.24 5.50 5.79 6.11 6.48 DTC
Serbia 1.74 1.80 1.87 1.95 2.03 2.12 2.21 2.32 2.44 2.57 2.71 DTC
Seychelles 6.47 6.61 6.76 6.91 7.08 7.25 7.43 7.61 7.81 8.02 8.24 DTC
Sierra Leone 4.06 4.25 4.47 4.71 4.97 5.27 5.60 5.98 6.41 6.91 7.49 DTC
Singapore 0.63 0.63 0.63 0.64 0.64 0.64 0.65 0.65 0.66 0.66 0.66 DTC
Slovak Republic 1.25 1.26 1.27 1.29 1.30 1.31 1.32 1.33 1.35 1.36 1.37 DTC
Slovenia 1.26 1.25 1.24 1.23 1.22 1.21 1.20 1.19 1.18 1.17 1.16 DTC
Solomon Islands 27.38 26.72 26.10 25.50 24.93 24.38 23.86 23.36 22.88 22.42 21.98 DTC
Somalia 4/ 4/ 4/ 4/ 4/ 4/ 4/ 4/ 4/ 4/ 4/ DTC
South Africa 1.16 1.19 1.22 1.25 1.29 1.33 1.37 1.42 1.46 1.51 1.57 DTC
South Sudan 3.24 3.36 3.49 3.63 3.78 3.95 4.13 4.33 4.54 4.78 5.05 DTC
Spain 1.26 1.24 1.21 1.19 1.16 1.14 1.12 1.10 1.08 1.06 1.04 Developed
Sri Lanka 1.14 1.21 1.28 1.36 1.46 1.57 1.69 1.84 2.02 2.23 2.50 DTC
St. Kitts and Nevis 13.21 13.34 13.46 13.59 13.72 13.85 13.98 14.12 14.26 14.40 14.54 DTC
St. Lucia 16.25 16.33 16.40 16.48 16.57 16.65 16.73 16.81 16.90 16.98 17.07 DTC
St. Vincent and the Grenadines 13.65 13.86 14.07 14.29 14.52 14.76 15.00 15.25 15.52 15.79 16.07 DTC
Sudan 0.58 0.60 0.62 0.65 0.68 0.72 0.76 0.80 0.85 0.90 0.96 DTC
Suriname 2.65 2.70 2.76 2.82 2.88 2.94 3.00 3.07 3.15 3.22 3.30 DTC
RATIO OF IBRD TO GDP BLEND SHARES (2012‐2014)1/ 2/

Ratio of IBRD to GDP Blend Shares – Three-Year Average (2012-2014) Annex | 6a
33
Member CountriesMER/PPP ‐
0/100
MER/PPP ‐
10/90
MER/PPP ‐
20/80
MER/PPP ‐
30/70
MER/PPP ‐
40/60
MER/PPP ‐
50/50
MER/PPP ‐
60/40
MER/PPP ‐
70/30
MER/PPP ‐
80/20
MER/PPP ‐
90/10
MER/PPP ‐
100/0Classification
3/
Swaziland 3.62 3.76 3.91 4.07 4.25 4.45 4.66 4.90 5.16 5.45 5.78 DTC
Sweden 2.05 1.90 1.77 1.66 1.56 1.47 1.39 1.32 1.26 1.20 1.14 Developed
Switzerland 3.33 3.02 2.76 2.55 2.36 2.20 2.06 1.94 1.83 1.73 1.64 Developed
Syrian Arab Republic 4/ 4/ 4/ 4/ 4/ 4/ 4/ 4/ 4/ 4/ 4/ DTC
Tajikistan 3.28 3.43 3.59 3.78 3.98 4.21 4.46 4.75 5.07 5.45 5.88 DTC
Tanzania 0.70 0.74 0.78 0.82 0.87 0.93 0.99 1.07 1.15 1.26 1.38 DTC
Thailand 0.51 0.54 0.57 0.60 0.63 0.67 0.71 0.76 0.82 0.89 0.96 DTC
Timor‐Leste 12.99 13.31 13.65 14.01 14.39 14.78 15.21 15.65 16.12 16.63 17.16 DTC
Togo 7.44 7.74 8.07 8.43 8.82 9.25 9.72 10.25 10.83 11.49 12.23 DTC
Tonga 57.82 57.19 56.57 55.96 55.36 54.78 54.21 53.65 53.10 52.56 52.04 DTC
Trinidad and Tobago 3.62 3.68 3.74 3.80 3.87 3.94 4.01 4.08 4.16 4.24 4.32 DTC
Tunisia 0.62 0.65 0.69 0.72 0.77 0.81 0.87 0.93 1.00 1.08 1.18 DTC
Turkey 0.81 0.83 0.84 0.87 0.89 0.91 0.93 0.96 0.98 1.01 1.04 DTC
Turkmenistan 0.48 0.49 0.50 0.51 0.53 0.54 0.56 0.57 0.59 0.61 0.63 DTC
Tuvalu 577.30 550.42 525.93 503.53 482.96 464.00 446.48 430.23 415.12 401.04 387.88 DTC
Uganda 0.65 0.68 0.72 0.75 0.80 0.85 0.90 0.96 1.03 1.12 1.21 DTC
Ukraine 1.61 1.68 1.76 1.84 1.93 2.03 2.15 2.28 2.42 2.58 2.77 DTC
United Arab Emirates 0.42 0.42 0.42 0.42 0.43 0.43 0.43 0.44 0.44 0.44 0.44 DTC
United Kingdom 1.63 1.55 1.48 1.41 1.35 1.29 1.24 1.20 1.15 1.11 1.07 Developed
United States 1.01 0.98 0.95 0.92 0.89 0.86 0.83 0.81 0.79 0.77 0.75 Developed
Uruguay 2.33 2.30 2.28 2.25 2.23 2.20 2.18 2.16 2.14 2.11 2.09 DTC
Uzbekistan 0.98 1.03 1.09 1.16 1.23 1.31 1.41 1.52 1.65 1.81 1.99 DTC
Vanuatu 51.91 49.44 47.20 45.16 43.28 41.56 39.96 38.49 37.12 35.84 34.65 DTC
Venezuela, Republica Bolivariana de 2.11 2.10 2.09 2.08 2.07 2.06 2.05 2.03 2.02 2.01 2.00 DTC
Vietnam 0.39 0.41 0.43 0.46 0.49 0.52 0.56 0.60 0.66 0.72 0.79 DTC
Yemen, Republic of 1.42 1.49 1.57 1.66 1.76 1.87 2.00 2.14 2.31 2.51 2.74 DTC
Zambia 3.01 3.13 3.25 3.39 3.54 3.70 3.88 4.08 4.30 4.54 4.81 DTC
Zimbabwe 7.76 8.00 8.27 8.54 8.84 9.16 9.50 9.87 10.27 10.71 11.18 DTC
1/ Expected IBRD shareholding after completion of Phase 2 Voice Reforms.
2/ GDP blend using market exchange rates and PPP exchange rates (2011 ICP) using data from WDI as of July 1, 2015 and WEO as of April 2015 where WDI data was not available.
3/ Classification as applied in IBRD Phase 1 and Phase 2 Voice Reforms.
4/ Data not available.
Note: Figures in red indicate members with ratios below 1.0 which are considered under‐represented in IBRD relatively to their reference weight in the world's economy.
RATIO OF IBRD TO GDP BLEND SHARES (2012‐2014)1/ 2/

Ratio of IBRD to GDP Blend Shares – Five-Year Average (2010-2014) Annex | 6b
34
Member CountriesMER/PPP ‐
0/100
MER/PPP ‐
10/90
MER/PPP ‐
20/80
MER/PPP ‐
30/70
MER/PPP ‐
40/60
MER/PPP ‐
50/50
MER/PPP ‐
60/40
MER/PPP ‐
70/30
MER/PPP ‐
80/20
MER/PPP ‐
90/10
MER/PPP ‐
100/0Classification
3/
Afghanistan 0.39 0.41 0.44 0.46 0.50 0.53 0.57 0.62 0.68 0.75 0.83 DTC
Albania 1.76 1.83 1.91 2.00 2.10 2.20 2.32 2.45 2.59 2.75 2.94 DTC
Algeria 0.99 1.03 1.09 1.15 1.21 1.29 1.37 1.47 1.58 1.71 1.86 DTC
Angola 1.01 1.01 1.02 1.02 1.02 1.03 1.03 1.03 1.04 1.04 1.04 DTC
Antigua and Barbuda 14.99 15.21 15.42 15.65 15.88 16.11 16.36 16.61 16.87 17.14 17.41 DTC
Argentina 1.26 1.28 1.30 1.32 1.34 1.36 1.38 1.41 1.43 1.46 1.48 DTC
Armenia 3.19 3.32 3.45 3.60 3.76 3.93 4.12 4.33 4.56 4.81 5.10 DTC
Australia 1.39 1.26 1.16 1.07 1.00 0.93 0.87 0.82 0.78 0.74 0.70 Developed
Austria 1.64 1.56 1.49 1.43 1.37 1.32 1.26 1.22 1.17 1.13 1.10 Developed
Azerbaijan 0.65 0.68 0.71 0.74 0.78 0.82 0.87 0.92 0.97 1.03 1.11 DTC
Bahamas, The 6.67 6.49 6.32 6.15 5.99 5.84 5.70 5.57 5.44 5.32 5.20 DTC
Bahrain 1.06 1.09 1.12 1.16 1.19 1.22 1.26 1.30 1.35 1.39 1.44 DTC
Bangladesh 0.63 0.67 0.71 0.76 0.82 0.88 0.96 1.05 1.15 1.28 1.45 DTC
Barbados 12.31 11.81 11.36 10.93 10.54 10.17 9.83 9.51 9.21 8.93 8.67 DTC
Belarus 1.10 1.15 1.21 1.27 1.35 1.42 1.51 1.61 1.73 1.86 2.02 DTC
Belgium 3.45 3.28 3.13 2.99 2.87 2.75 2.64 2.54 2.45 2.37 2.29 Developed
Belize 13.19 13.50 13.83 14.17 14.53 14.91 15.31 15.73 16.17 16.64 17.14 DTC
Benin 3.06 3.19 3.33 3.48 3.65 3.84 4.04 4.27 4.53 4.82 5.14 DTC
Bhutan 5.38 5.70 6.06 6.46 6.92 7.45 8.07 8.80 9.68 10.75 12.09 DTC
Bolivia 1.77 1.85 1.93 2.02 2.11 2.22 2.34 2.47 2.62 2.78 2.97 DTC
Bosnia and Herzegovina 0.97 1.01 1.04 1.08 1.12 1.17 1.22 1.27 1.33 1.40 1.47 DTC
Botswana 1.06 1.10 1.14 1.19 1.24 1.29 1.35 1.41 1.49 1.56 1.65 DTC
Brazil 0.74 0.73 0.73 0.73 0.72 0.72 0.72 0.71 0.71 0.71 0.70 DTC
Brunei Darussalam 4.25 4.37 4.51 4.65 4.80 4.96 5.13 5.31 5.51 5.72 5.95 DTC
Bulgaria 2.45 2.55 2.65 2.76 2.88 3.01 3.15 3.30 3.48 3.67 3.88 DTC
Burkina Faso 2.07 2.16 2.26 2.37 2.49 2.62 2.76 2.93 3.11 3.32 3.56 DTC
Burundi 5.92 6.26 6.64 7.07 7.56 8.12 8.78 9.54 10.46 11.56 12.93 DTC
Cabo Verde 9.84 10.07 10.31 10.56 10.82 11.10 11.39 11.70 12.02 12.37 12.73 DTC
Cambodia 0.49 0.52 0.55 0.59 0.63 0.68 0.74 0.80 0.88 0.98 1.10 DTC
Cameroon 1.56 1.62 1.69 1.76 1.84 1.92 2.01 2.11 2.23 2.35 2.49 DTC
Canada 1.68 1.58 1.49 1.41 1.34 1.28 1.22 1.17 1.12 1.07 1.03 Developed
Central African Republic 14.61 15.02 15.45 15.90 16.39 16.90 17.45 18.03 18.66 19.33 20.04 DTC
Chad 2.04 2.11 2.19 2.28 2.37 2.47 2.58 2.70 2.83 2.97 3.13 DTC
Chile 1.17 1.17 1.18 1.19 1.19 1.20 1.21 1.22 1.22 1.23 1.24 DTC
China 0.30 0.30 0.31 0.32 0.33 0.34 0.35 0.36 0.37 0.39 0.40 DTC
Colombia 0.72 0.74 0.75 0.76 0.78 0.79 0.81 0.82 0.84 0.86 0.87 DTC
Comoros 16.60 17.02 17.46 17.92 18.41 18.92 19.47 20.04 20.66 21.31 22.00 DTC
Congo, Democratic Republic of 3.32 3.39 3.47 3.56 3.64 3.73 3.83 3.93 4.04 4.15 4.27 DTC
Congo, Republic of 2.24 2.31 2.37 2.44 2.51 2.59 2.67 2.76 2.85 2.95 3.06 DTC
Costa Rica 0.74 0.75 0.75 0.76 0.76 0.77 0.77 0.78 0.78 0.79 0.80 DTC
RATIO OF IBRD TO GDP BLEND SHARES (2010‐2014)1/ 2/

Ratio of IBRD to GDP Blend Shares – Five-Year Average (2010-2014) Annex | 6b
35
Member CountriesMER/PPP ‐
0/100
MER/PPP ‐
10/90
MER/PPP ‐
20/80
MER/PPP ‐
30/70
MER/PPP ‐
40/60
MER/PPP ‐
50/50
MER/PPP ‐
60/40
MER/PPP ‐
70/30
MER/PPP ‐
80/20
MER/PPP ‐
90/10
MER/PPP ‐
100/0Classification
3/
Cote d'Ivoire 2.43 2.53 2.63 2.74 2.85 2.98 3.12 3.28 3.45 3.64 3.85 DTC
Croatia 1.38 1.40 1.41 1.43 1.45 1.46 1.48 1.50 1.52 1.54 1.55 DTC
Cyprus 2.83 2.77 2.72 2.66 2.61 2.56 2.51 2.46 2.42 2.37 2.33 Developed
Czech Republic 1.12 1.12 1.13 1.14 1.14 1.15 1.16 1.17 1.17 1.18 1.19 DTC
Denmark 3.08 2.85 2.64 2.47 2.31 2.18 2.06 1.95 1.85 1.76 1.68 Developed
Djibouti 13.61 13.99 14.38 14.80 15.25 15.72 16.22 16.76 17.33 17.94 18.60 DTC
Dominica 36.18 36.45 36.72 36.99 37.27 37.55 37.83 38.12 38.41 38.71 39.02 DTC
Dominican Republic 0.92 0.95 0.99 1.03 1.07 1.11 1.16 1.21 1.27 1.33 1.40 DTC
Ecuador 1.01 1.04 1.07 1.10 1.13 1.17 1.21 1.25 1.29 1.34 1.39 DTC
Egypt, Arab Republic of 0.51 0.55 0.58 0.63 0.68 0.74 0.81 0.89 1.00 1.14 1.31 DTC
El Salvador 0.79 0.82 0.85 0.88 0.92 0.96 1.00 1.04 1.09 1.14 1.20 DTC
Equatorial Guinea 1.52 1.55 1.59 1.62 1.66 1.70 1.74 1.79 1.83 1.88 1.93 DTC
Eritrea 5.02 5.25 5.50 5.77 6.07 6.40 6.77 7.19 7.66 8.20 8.81 DTC
Estonia 1.53 1.54 1.54 1.55 1.55 1.56 1.57 1.57 1.58 1.58 1.59 DTC
Ethiopia 0.53 0.56 0.59 0.63 0.67 0.72 0.77 0.83 0.91 1.00 1.11 DTC
Fiji 8.04 8.24 8.45 8.67 8.90 9.14 9.40 9.68 9.97 10.27 10.60 DTC
Finland 2.24 2.11 1.99 1.88 1.78 1.70 1.62 1.55 1.48 1.42 1.36 Developed
France 1.55 1.48 1.41 1.35 1.29 1.24 1.19 1.14 1.10 1.06 1.03 Developed
Gabon 1.86 1.89 1.93 1.98 2.02 2.06 2.11 2.16 2.21 2.27 2.33 DTC
Gambia, The 11.29 11.99 12.79 13.70 14.75 15.98 17.42 19.15 21.27 23.91 27.30 DTC
Georgia 3.17 3.28 3.40 3.53 3.67 3.81 3.98 4.15 4.34 4.56 4.79 DTC
Germany 1.17 1.12 1.08 1.04 1.00 0.97 0.94 0.91 0.88 0.85 0.83 Developed
Ghana 0.99 1.04 1.08 1.14 1.19 1.26 1.33 1.41 1.50 1.60 1.72 DTC
Greece 1.06 1.04 1.02 1.00 0.98 0.96 0.94 0.93 0.91 0.89 0.88 Developed
Grenada 23.57 23.79 24.02 24.24 24.48 24.71 24.96 25.20 25.45 25.71 25.97 DTC
Guatemala 1.12 1.16 1.21 1.26 1.31 1.37 1.44 1.51 1.59 1.68 1.78 DTC
Guinea 5.63 5.89 6.19 6.52 6.88 7.28 7.74 8.26 8.85 9.53 10.33 DTC
Guinea‐Bissau 13.94 14.59 15.30 16.08 16.94 17.90 18.98 20.19 21.58 23.16 25.00 DTC
Guyana 13.12 13.44 13.77 14.13 14.50 14.89 15.31 15.75 16.21 16.70 17.23 DTC
Haiti 3.93 4.08 4.24 4.42 4.61 4.81 5.04 5.29 5.56 5.87 6.21 DTC
Honduras 1.14 1.17 1.21 1.25 1.29 1.33 1.38 1.43 1.49 1.54 1.61 DTC
Hungary 2.00 2.05 2.09 2.14 2.19 2.24 2.30 2.35 2.41 2.48 2.54 DTC
Iceland 5.58 5.30 5.05 4.82 4.61 4.42 4.25 4.08 3.93 3.79 3.66 Developed
India 0.47 0.50 0.53 0.57 0.61 0.67 0.73 0.81 0.90 1.02 1.18 DTC
Indonesia 0.41 0.44 0.46 0.49 0.52 0.55 0.59 0.64 0.69 0.75 0.83 DTC
Iran, Islamic Republic of 1.16 1.22 1.29 1.36 1.44 1.53 1.63 1.75 1.88 2.04 2.23 DTC
Iraq 0.35 0.37 0.39 0.40 0.42 0.45 0.47 0.50 0.53 0.57 0.61 DTC
Ireland 1.58 1.50 1.44 1.38 1.32 1.27 1.22 1.17 1.13 1.09 1.06 Developed
Israel 1.02 0.98 0.94 0.90 0.87 0.83 0.80 0.78 0.75 0.73 0.70 Developed
Italy 1.27 1.22 1.18 1.14 1.10 1.07 1.04 1.01 0.98 0.95 0.92 Developed
RATIO OF IBRD TO GDP BLEND SHARES (2010‐2014)1/ 2/

Ratio of IBRD to GDP Blend Shares – Five-Year Average (2010-2014) Annex | 6b
36
Member CountriesMER/PPP ‐
0/100
MER/PPP ‐
10/90
MER/PPP ‐
20/80
MER/PPP ‐
30/70
MER/PPP ‐
40/60
MER/PPP ‐
50/50
MER/PPP ‐
60/40
MER/PPP ‐
70/30
MER/PPP ‐
80/20
MER/PPP ‐
90/10
MER/PPP ‐
100/0Classification
3/
Jamaica 5.90 6.01 6.13 6.25 6.38 6.51 6.65 6.79 6.94 7.10 7.26 DTC
Japan 1.55 1.46 1.38 1.31 1.25 1.19 1.14 1.09 1.04 1.00 0.97 Developed
Jordan 1.16 1.21 1.27 1.33 1.40 1.47 1.56 1.65 1.76 1.89 2.03 DTC
Kazakhstan 0.52 0.54 0.56 0.57 0.59 0.61 0.63 0.65 0.68 0.70 0.73 DTC
Kenya 1.25 1.30 1.36 1.43 1.50 1.58 1.67 1.78 1.89 2.02 2.17 DTC
Kiribati 157.51 153.97 150.58 147.35 144.25 141.27 138.42 135.68 133.05 130.51 128.07 DTC
Korea, Republic of 0.98 0.98 0.97 0.97 0.97 0.96 0.96 0.96 0.95 0.95 0.94 DTC
Kosovo 3.85 4.01 4.20 4.40 4.62 4.86 5.13 5.44 5.78 6.17 6.61 DTC
Kuwait 3.16 3.22 3.28 3.34 3.40 3.47 3.54 3.61 3.69 3.77 3.85 DTC
Kyrgyz Republic 3.95 4.16 4.38 4.63 4.92 5.24 5.60 6.02 6.50 7.08 7.76 DTC
Lao People's Democratic Republic 0.38 0.41 0.43 0.46 0.50 0.54 0.58 0.64 0.71 0.79 0.89 DTC
Latvia 1.75 1.76 1.78 1.79 1.81 1.83 1.85 1.86 1.88 1.90 1.92 DTC
Lebanon 0.60 0.62 0.63 0.65 0.66 0.68 0.70 0.72 0.74 0.76 0.79 DTC
Lesotho 8.01 8.34 8.69 9.07 9.49 9.94 10.44 11.00 11.62 12.31 13.09 DTC
Liberia 8.34 8.63 8.94 9.27 9.62 10.01 10.42 10.88 11.37 11.91 12.50 DTC
Libya 3.39 3.52 3.65 3.79 3.95 4.12 4.30 4.50 4.72 4.96 5.23 DTC
Lithuania 1.13 1.15 1.17 1.19 1.22 1.24 1.26 1.29 1.32 1.35 1.38 DTC
Luxembourg 2.01 1.89 1.79 1.69 1.61 1.53 1.46 1.40 1.34 1.29 1.24 Developed
Macedonia, former Yugoslav Republic of 0.91 0.95 1.00 1.05 1.10 1.17 1.24 1.32 1.41 1.52 1.64 DTC
Madagascar 2.78 2.95 3.14 3.35 3.60 3.89 4.23 4.63 5.12 5.73 6.49 DTC
Malawi 5.45 5.72 6.03 6.37 6.75 7.19 7.68 8.24 8.89 9.65 10.55 DTC
Malaysia 0.67 0.70 0.73 0.76 0.80 0.84 0.88 0.93 0.98 1.04 1.11 DTC
Maldives 6.44 6.58 6.72 6.88 7.04 7.20 7.38 7.56 7.75 7.96 8.17 DTC
Mali 2.85 2.98 3.11 3.26 3.42 3.60 3.80 4.03 4.28 4.56 4.89 DTC
Malta 4.69 4.68 4.67 4.66 4.65 4.64 4.63 4.62 4.61 4.60 4.59 DTC
Marshall Islands 151.19 147.04 143.11 139.39 135.86 132.50 129.30 126.26 123.35 120.57 117.92 DTC
Mauritania 4.09 4.31 4.56 4.83 5.14 5.50 5.91 6.38 6.94 7.60 8.41 DTC
Mauritius 3.12 3.21 3.30 3.40 3.51 3.63 3.75 3.88 4.02 4.17 4.34 DTC
Mexico 0.87 0.88 0.90 0.92 0.94 0.95 0.97 0.99 1.01 1.04 1.06 DTC
Micronesia, Federated States of 83.48 81.67 79.94 78.28 76.69 75.16 73.69 72.27 70.91 69.60 68.34 DTC
Moldova 5.36 5.57 5.80 6.05 6.32 6.61 6.94 7.30 7.70 8.14 8.64 DTC
Mongolia 1.03 1.08 1.13 1.20 1.27 1.35 1.44 1.54 1.66 1.80 1.96 DTC
Montenegro 4.26 4.40 4.56 4.72 4.90 5.09 5.30 5.52 5.76 6.03 6.32 DTC
Morocco 1.22 1.27 1.33 1.39 1.46 1.54 1.63 1.72 1.83 1.95 2.09 DTC
Mozambique 2.14 2.20 2.27 2.34 2.41 2.49 2.58 2.67 2.76 2.87 2.98 DTC
Myanmar 0.72 0.76 0.82 0.88 0.96 1.04 1.15 1.28 1.44 1.65 1.93 DTC
Namibia 3.93 4.00 4.08 4.16 4.24 4.32 4.41 4.50 4.60 4.70 4.80 DTC
Nepal 1.00 1.06 1.13 1.21 1.30 1.41 1.53 1.68 1.86 2.09 2.38 DTC
Netherlands 2.50 2.39 2.28 2.18 2.09 2.01 1.94 1.87 1.80 1.74 1.68 Developed
New Zealand 2.79 2.63 2.50 2.37 2.26 2.16 2.06 1.98 1.90 1.82 1.76 Developed
RATIO OF IBRD TO GDP BLEND SHARES (2010‐2014)1/ 2/

Ratio of IBRD to GDP Blend Shares – Five-Year Average (2010-2014) Annex | 6b
37
Member CountriesMER/PPP ‐
0/100
MER/PPP ‐
10/90
MER/PPP ‐
20/80
MER/PPP ‐
30/70
MER/PPP ‐
40/60
MER/PPP ‐
50/50
MER/PPP ‐
60/40
MER/PPP ‐
70/30
MER/PPP ‐
80/20
MER/PPP ‐
90/10
MER/PPP ‐
100/0Classification
3/
Nicaragua 1.41 1.48 1.55 1.64 1.73 1.84 1.96 2.10 2.25 2.44 2.65 DTC
Niger 3.39 3.53 3.68 3.84 4.02 4.21 4.43 4.66 4.93 5.22 5.56 DTC
Nigeria 0.74 0.77 0.79 0.82 0.85 0.88 0.92 0.96 1.00 1.04 1.09 DTC
Norway 1.77 1.60 1.46 1.34 1.24 1.15 1.08 1.01 0.96 0.90 0.86 Developed
Oman 0.56 0.58 0.61 0.63 0.65 0.68 0.71 0.74 0.78 0.81 0.86 DTC
Pakistan 0.62 0.67 0.71 0.77 0.84 0.91 1.01 1.12 1.26 1.45 1.70 DTC
Palau 3.02 3.01 3.00 2.99 2.98 2.96 2.95 2.94 2.93 2.92 2.91 DTC
Panama 0.55 0.57 0.58 0.60 0.62 0.63 0.65 0.67 0.69 0.72 0.74 DTC
Papua New Guinea 4.54 4.51 4.47 4.44 4.40 4.37 4.34 4.31 4.27 4.24 4.21 DTC
Paraguay 1.47 1.52 1.57 1.63 1.68 1.75 1.81 1.88 1.96 2.05 2.14 DTC
Peru 0.98 1.00 1.03 1.06 1.09 1.12 1.16 1.19 1.23 1.27 1.32 DTC
Philippines 0.70 0.73 0.77 0.81 0.85 0.90 0.95 1.02 1.09 1.17 1.26 DTC
Poland 0.82 0.84 0.86 0.88 0.90 0.92 0.94 0.97 0.99 1.02 1.05 DTC
Portugal 1.10 1.09 1.09 1.08 1.07 1.06 1.05 1.04 1.04 1.03 1.02 Developed
Qatar 0.22 0.22 0.22 0.22 0.23 0.23 0.23 0.23 0.24 0.24 0.24 DTC
Romania 0.80 0.83 0.86 0.89 0.92 0.96 1.00 1.04 1.08 1.13 1.19 DTC
Russian Federation 0.83 0.85 0.87 0.90 0.92 0.95 0.98 1.01 1.04 1.08 1.11 DTC
Rwanda 3.92 4.10 4.28 4.49 4.72 4.97 5.25 5.57 5.92 6.33 6.79 DTC
Samoa 30.72 30.83 30.95 31.07 31.19 31.31 31.43 31.56 31.68 31.80 31.93 DTC
San Marino 15.74 15.32 14.92 14.54 14.18 13.83 13.51 13.20 12.90 12.61 12.34 Developed
Sao Tome and Principe 54.70 56.56 58.55 60.68 62.98 65.46 68.13 71.04 74.21 77.67 81.47 DTC
Saudi Arabia 1.95 2.02 2.10 2.19 2.28 2.38 2.49 2.61 2.74 2.89 3.05 DTC
Senegal 4.07 4.22 4.39 4.57 4.77 4.98 5.22 5.48 5.76 6.08 6.43 DTC
Serbia 1.68 1.74 1.81 1.88 1.96 2.05 2.14 2.24 2.36 2.48 2.62 DTC
Seychelles 6.62 6.78 6.96 7.14 7.33 7.53 7.74 7.97 8.21 8.46 8.73 DTC
Sierra Leone 4.40 4.63 4.88 5.15 5.46 5.81 6.21 6.67 7.20 7.82 8.56 DTC
Singapore 0.63 0.63 0.64 0.64 0.65 0.65 0.66 0.66 0.67 0.67 0.68 DTC
Slovak Republic 1.23 1.24 1.25 1.26 1.27 1.28 1.29 1.31 1.32 1.33 1.34 DTC
Slovenia 1.22 1.21 1.20 1.18 1.17 1.16 1.15 1.14 1.13 1.12 1.10 DTC
Solomon Islands 27.83 27.37 26.92 26.49 26.08 25.68 25.28 24.91 24.54 24.18 23.83 DTC
Somalia 4/ 4/ 4/ 4/ 4/ 4/ 4/ 4/ 4/ 4/ 4/ DTC
South Africa 1.14 1.17 1.20 1.23 1.26 1.29 1.32 1.35 1.39 1.43 1.47 DTC
South Sudan 4/ 4/ 4/ 4/ 4/ 4/ 4/ 4/ 4/ 4/ 4/ DTC
Spain 1.21 1.18 1.16 1.13 1.11 1.08 1.06 1.04 1.02 1.00 0.98 Developed
Sri Lanka 1.18 1.25 1.32 1.41 1.51 1.62 1.75 1.91 2.10 2.32 2.61 DTC
St. Kitts and Nevis 13.01 13.14 13.28 13.43 13.57 13.72 13.88 14.04 14.20 14.36 14.53 DTC
St. Lucia 15.62 15.73 15.84 15.95 16.06 16.18 16.30 16.42 16.54 16.66 16.78 DTC
St. Vincent and the Grenadines 13.32 13.53 13.75 13.97 14.20 14.44 14.69 14.95 15.22 15.50 15.78 DTC
Sudan 0.56 0.58 0.61 0.63 0.66 0.70 0.73 0.77 0.82 0.87 0.93 DTC
Suriname 2.65 2.72 2.78 2.85 2.92 2.99 3.07 3.15 3.24 3.33 3.43 DTC
RATIO OF IBRD TO GDP BLEND SHARES (2010‐2014)1/ 2/

Ratio of IBRD to GDP Blend Shares – Five-Year Average (2010-2014) Annex | 6b
38
Member CountriesMER/PPP ‐
0/100
MER/PPP ‐
10/90
MER/PPP ‐
20/80
MER/PPP ‐
30/70
MER/PPP ‐
40/60
MER/PPP ‐
50/50
MER/PPP ‐
60/40
MER/PPP ‐
70/30
MER/PPP ‐
80/20
MER/PPP ‐
90/10
MER/PPP ‐
100/0Classification
3/
Swaziland 3.59 3.71 3.85 4.00 4.17 4.34 4.53 4.74 4.97 5.22 5.50 DTC
Sweden 2.00 1.86 1.74 1.63 1.53 1.45 1.37 1.30 1.24 1.19 1.13 Developed
Switzerland 3.30 2.99 2.74 2.52 2.34 2.18 2.04 1.92 1.81 1.72 1.63 Developed
Syrian Arab Republic 4/ 4/ 4/ 4/ 4/ 4/ 4/ 4/ 4/ 4/ 4/ DTC
Tajikistan 3.39 3.55 3.74 3.94 4.17 4.42 4.71 5.04 5.42 5.86 6.38 DTC
Tanzania 0.72 0.76 0.80 0.85 0.91 0.97 1.04 1.13 1.22 1.34 1.49 DTC
Thailand 0.51 0.54 0.57 0.60 0.63 0.67 0.72 0.77 0.83 0.89 0.97 DTC
Timor‐Leste 13.53 13.91 14.31 14.74 15.19 15.67 16.18 16.73 17.32 17.95 18.62 DTC
Togo 7.57 7.89 8.24 8.62 9.04 9.49 10.00 10.57 11.20 11.92 12.73 DTC
Tonga 56.08 55.63 55.18 54.73 54.30 53.87 53.44 53.03 52.62 52.21 51.82 DTC
Trinidad and Tobago 3.55 3.62 3.69 3.77 3.85 3.93 4.01 4.10 4.20 4.29 4.40 DTC
Tunisia 0.62 0.65 0.68 0.72 0.76 0.80 0.85 0.91 0.98 1.06 1.15 DTC
Turkey 0.81 0.82 0.84 0.86 0.88 0.90 0.93 0.95 0.97 1.00 1.03 DTC
Turkmenistan 0.51 0.52 0.54 0.56 0.57 0.59 0.61 0.64 0.66 0.68 0.71 DTC
Tuvalu 566.70 541.41 518.28 497.05 477.48 459.40 442.64 427.05 412.53 398.96 386.26 DTC
Uganda 0.66 0.69 0.73 0.77 0.82 0.87 0.94 1.01 1.09 1.18 1.30 DTC
Ukraine 1.56 1.63 1.71 1.79 1.89 1.99 2.11 2.24 2.39 2.56 2.76 DTC
United Arab Emirates 0.42 0.42 0.43 0.43 0.44 0.44 0.45 0.45 0.45 0.46 0.46 DTC
United Kingdom 1.60 1.52 1.45 1.39 1.34 1.28 1.23 1.19 1.15 1.11 1.07 Developed
United States 1.00 0.97 0.94 0.91 0.88 0.86 0.83 0.81 0.79 0.77 0.75 Developed
Uruguay 2.34 2.33 2.31 2.30 2.28 2.27 2.25 2.24 2.22 2.21 2.20 DTC
Uzbekistan 1.02 1.08 1.14 1.21 1.29 1.38 1.49 1.61 1.75 1.93 2.14 DTC
Vanuatu 50.25 48.01 45.97 44.09 42.35 40.75 39.27 37.89 36.60 35.40 34.27 DTC
Venezuela, Republica Bolivariana de 2.10 2.09 2.09 2.09 2.08 2.08 2.07 2.07 2.07 2.06 2.06 DTC
Vietnam 0.39 0.42 0.44 0.47 0.50 0.54 0.58 0.63 0.69 0.77 0.86 DTC
Yemen, Republic of 1.37 1.44 1.53 1.62 1.72 1.84 1.98 2.14 2.33 2.55 2.83 DTC
Zambia 3.09 3.21 3.34 3.48 3.64 3.81 3.99 4.20 4.42 4.67 4.96 DTC
Zimbabwe 8.07 8.34 8.62 8.92 9.25 9.60 9.98 10.39 10.83 11.31 11.84 DTC
1/ Expected IBRD shareholding after completion of Phase 2 Voice Reforms.
2/ GDP blend using market exchange rates and PPP exchange rates (2011 ICP) using data from WDI as of July 1, 2015 and WEO as of April 2015 where WDI data was not available.
3/ Classification as applied in IBRD Phase 1 and Phase 2 Voice Reforms.
4/ Data not available.
Note: Figures in red indicate members with ratios below 1.0 which are considered under‐represented in IBRD relatively to their reference weight in the world's economy.
RATIO OF IBRD TO GDP BLEND SHARES (2010‐2014)1/ 2/

Comparison of GDP Blend Shares–By Alpha Annex | 7a
39
Member Countries
GDP MER/PPP 60/40
Blend
(2012‐2014) 1/
GDP MER/PPP 60/40
Blend
(2006‐2008) 1/ 2/
Change in share Classification 3/
Afghanistan 0.0399 0.0257 0.0142 DTC
Albania 0.0217 0.0260 ‐0.0043 DTC
Algeria 0.3743 0.3214 0.0529 DTC
Angola 0.1639 0.1261 0.0378 DTC
Antigua and Barbuda 0.0017 0.0023 ‐0.0006 DTC
Argentina 0.8356 0.6243 0.2113 DTC
Armenia 0.0175 0.0207 ‐0.0033 DTC
Australia 1.6092 1.4075 0.2017 Developed
Austria 0.4912 0.6062 ‐0.1150 Developed
Azerbaijan 0.1209 0.0780 0.0429 DTC
Bahamas, The 0.0102 0.0103 ‐0.0002 DTC
Bahrain 0.0490 0.0229 0.0261 DTC
Bangladesh 0.3041 0.2004 0.1036 DTC
Barbados 0.0050 0.0043 0.0007 DTC
Belarus 0.1227 0.1193 0.0034 DTC
Belgium 0.6001 0.7291 ‐0.1290 Developed
Belize 0.0024 0.0027 ‐0.0003 DTC
Benin 0.0138 0.0136 0.0002 DTC
Bhutan 0.0037 0.0030 0.0007 DTC
Bolivia 0.0502 0.0396 0.0106 DTC
Bosnia and Herzegovina 0.0286 0.0352 ‐0.0065 DTC
Botswana 0.0253 0.0289 ‐0.0037 DTC
Brazil 3.1631 2.6480 0.5151 DTC
Brunei Darussalam 0.0255 0.0224 0.0031 DTC
Bulgaria 0.0889 0.0991 ‐0.0102 DTC
Burkina Faso 0.0204 0.0180 0.0025 DTC
Burundi 0.0053 0.0029 0.0024 DTC
Cabo Verde 0.0027 0.0026 0.0001 DTC
Cambodia 0.0304 0.0254 0.0050 DTC
Cameroon 0.0485 0.0477 0.0008 DTC
Canada 2.0543 2.2388 ‐0.1845 Developed
Central African Republic 0.0028 0.0038 ‐0.0011 DTC
Chad 0.0213 0.0179 0.0034 DTC
Chile 0.3646 0.3213 0.0433 DTC
China 14.0826 7.9853 6.0973 DTC
Colombia 0.5378 0.4596 0.0782 DTC
Comoros 0.0009 0.0010 ‐0.0001 DTC
Congo, Democratic Republic of 0.0441 0.0231 0.0210 DTC
Congo, Republic of 0.0216 0.0181 0.0034 DTC
Costa Rica 0.0651 0.0590 0.0061 DTC
Cote d'Ivoire 0.0506 0.0429 0.0077 DTC
Croatia 0.0814 0.1156 ‐0.0342 DTC
Cyprus 0.0300 0.0334 ‐0.0035 Developed
Czech Republic 0.2874 0.3503 ‐0.0629 DTC
Denmark 0.3644 0.4692 ‐0.1047 Developed
Djibouti 0.0022 0.0020 0.0002 DTC
Dominica 0.0007 0.0008 0.0000 DTC
Dominican Republic 0.0999 0.0922 0.0077 DTC
Ecuador 0.1428 0.1147 0.0280 DTC
Egypt, Arab Republic of 0.5774 0.4008 0.1766 DTC
El Salvador 0.0390 0.0474 ‐0.0084 DTC
Equatorial Guinea 0.0225 0.0271 ‐0.0047 DTC
Eritrea 0.0058 0.0035 0.0023 DTC
Estonia 0.0329 0.0391 ‐0.0062 DTC
Ethiopia 0.0901 0.0613 0.0288 DTC
COMPARISON OF GDP BLEND SHARES ‐ sorted by alphabetical order
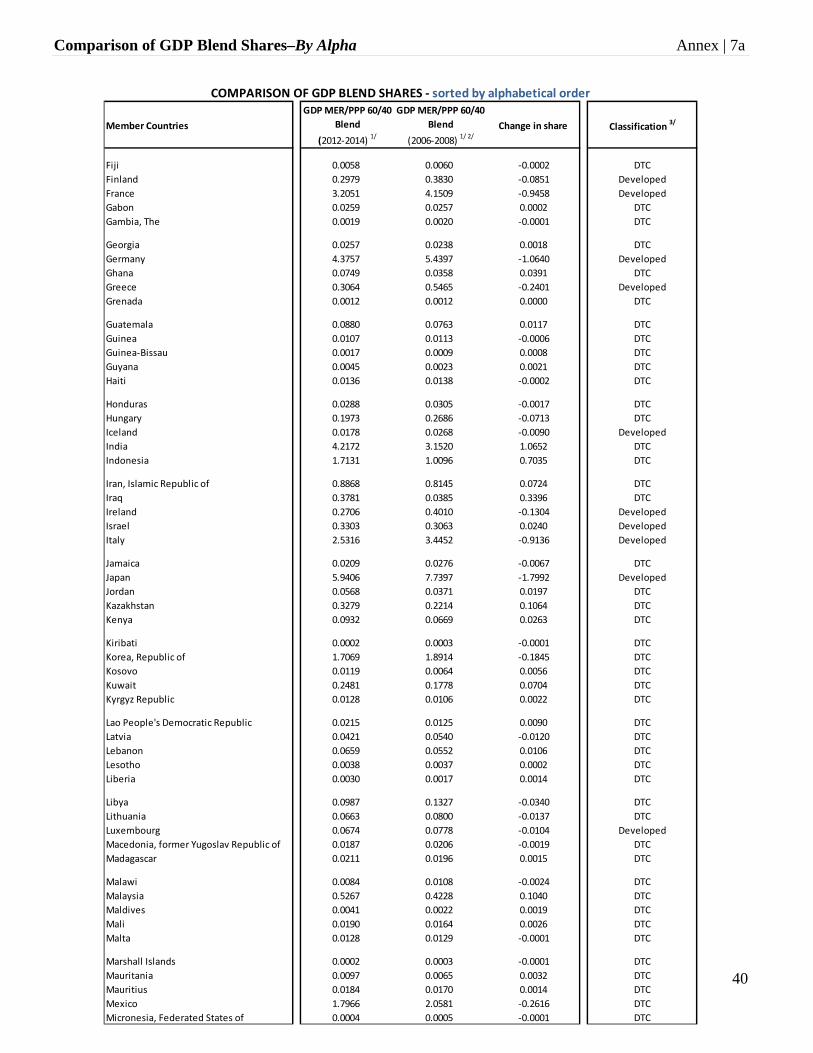
Comparison of GDP Blend Shares–By Alpha Annex | 7a
40
Member Countries
GDP MER/PPP 60/40
Blend
(2012‐2014) 1/
GDP MER/PPP 60/40
Blend
(2006‐2008) 1/ 2/
Change in share Classification 3/
Fiji 0.0058 0.0060 ‐0.0002 DTC
Finland 0.2979 0.3830 ‐0.0851 Developed
France 3.2051 4.1509 ‐0.9458 Developed
Gabon 0.0259 0.0257 0.0002 DTC
Gambia, The 0.0019 0.0020 ‐0.0001 DTC
Georgia 0.0257 0.0238 0.0018 DTC
Germany 4.3757 5.4397 ‐1.0640 Developed
Ghana 0.0749 0.0358 0.0391 DTC
Greece 0.3064 0.5465 ‐0.2401 Developed
Grenada 0.0012 0.0012 0.0000 DTC
Guatemala 0.0880 0.0763 0.0117 DTC
Guinea 0.0107 0.0113 ‐0.0006 DTC
Guinea‐Bissau 0.0017 0.0009 0.0008 DTC
Guyana 0.0045 0.0023 0.0021 DTC
Haiti 0.0136 0.0138 ‐0.0002 DTC
Honduras 0.0288 0.0305 ‐0.0017 DTC
Hungary 0.1973 0.2686 ‐0.0713 DTC
Iceland 0.0178 0.0268 ‐0.0090 Developed
India 4.2172 3.1520 1.0652 DTC
Indonesia 1.7131 1.0096 0.7035 DTC
Iran, Islamic Republic of 0.8868 0.8145 0.0724 DTC
Iraq 0.3781 0.0385 0.3396 DTC
Ireland 0.2706 0.4010 ‐0.1304 Developed
Israel 0.3303 0.3063 0.0240 Developed
Italy 2.5316 3.4452 ‐0.9136 Developed
Jamaica 0.0209 0.0276 ‐0.0067 DTC
Japan 5.9406 7.7397 ‐1.7992 Developed
Jordan 0.0568 0.0371 0.0197 DTC
Kazakhstan 0.3279 0.2214 0.1064 DTC
Kenya 0.0932 0.0669 0.0263 DTC
Kiribati 0.0002 0.0003 ‐0.0001 DTC
Korea, Republic of 1.7069 1.8914 ‐0.1845 DTC
Kosovo 0.0119 0.0064 0.0056 DTC
Kuwait 0.2481 0.1778 0.0704 DTC
Kyrgyz Republic 0.0128 0.0106 0.0022 DTC
Lao People's Democratic Republic 0.0215 0.0125 0.0090 DTC
Latvia 0.0421 0.0540 ‐0.0120 DTC
Lebanon 0.0659 0.0552 0.0106 DTC
Lesotho 0.0038 0.0037 0.0002 DTC
Liberia 0.0030 0.0017 0.0014 DTC
Libya 0.0987 0.1327 ‐0.0340 DTC
Lithuania 0.0663 0.0800 ‐0.0137 DTC
Luxembourg 0.0674 0.0778 ‐0.0104 Developed
Macedonia, former Yugoslav Republic of 0.0187 0.0206 ‐0.0019 DTC
Madagascar 0.0211 0.0196 0.0015 DTC
Malawi 0.0084 0.0108 ‐0.0024 DTC
Malaysia 0.5267 0.4228 0.1040 DTC
Maldives 0.0041 0.0022 0.0019 DTC
Mali 0.0190 0.0164 0.0026 DTC
Malta 0.0128 0.0129 ‐0.0001 DTC
Marshall Islands 0.0002 0.0003 ‐0.0001 DTC
Mauritania 0.0097 0.0065 0.0032 DTC
Mauritius 0.0184 0.0170 0.0014 DTC
Mexico 1.7966 2.0581 ‐0.2616 DTC
Micronesia, Federated States of 0.0004 0.0005 ‐0.0001 DTC
COMPARISON OF GDP BLEND SHARES ‐ sorted by alphabetical order
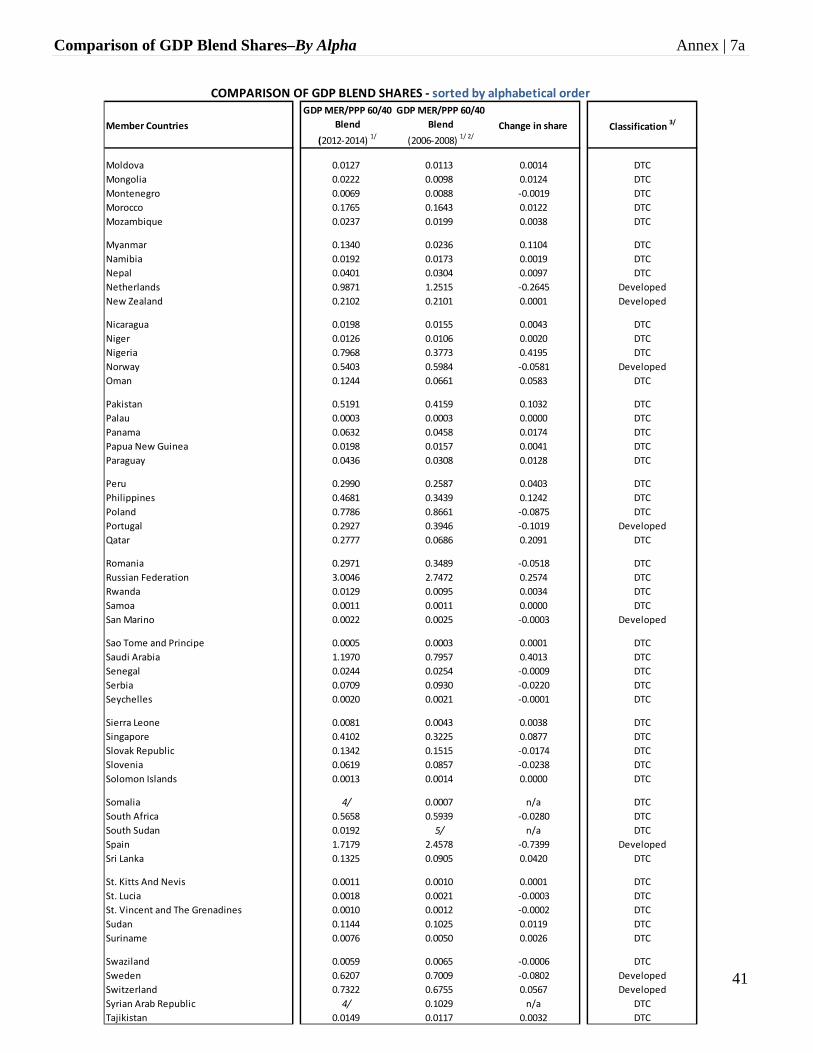
Comparison of GDP Blend Shares–By Alpha Annex | 7a
41
Member Countries
GDP MER/PPP 60/40
Blend
(2012‐2014) 1/
GDP MER/PPP 60/40
Blend
(2006‐2008) 1/ 2/
Change in share Classification 3/
Moldova 0.0127 0.0113 0.0014 DTC
Mongolia 0.0222 0.0098 0.0124 DTC
Montenegro 0.0069 0.0088 ‐0.0019 DTC
Morocco 0.1765 0.1643 0.0122 DTC
Mozambique 0.0237 0.0199 0.0038 DTC
Myanmar 0.1340 0.0236 0.1104 DTC
Namibia 0.0192 0.0173 0.0019 DTC
Nepal 0.0401 0.0304 0.0097 DTC
Netherlands 0.9871 1.2515 ‐0.2645 Developed
New Zealand 0.2102 0.2101 0.0001 Developed
Nicaragua 0.0198 0.0155 0.0043 DTC
Niger 0.0126 0.0106 0.0020 DTC
Nigeria 0.7968 0.3773 0.4195 DTC
Norway 0.5403 0.5984 ‐0.0581 Developed
Oman 0.1244 0.0661 0.0583 DTC
Pakistan 0.5191 0.4159 0.1032 DTC
Palau 0.0003 0.0003 0.0000 DTC
Panama 0.0632 0.0458 0.0174 DTC
Papua New Guinea 0.0198 0.0157 0.0041 DTC
Paraguay 0.0436 0.0308 0.0128 DTC
Peru 0.2990 0.2587 0.0403 DTC
Philippines 0.4681 0.3439 0.1242 DTC
Poland 0.7786 0.8661 ‐0.0875 DTC
Portugal 0.2927 0.3946 ‐0.1019 Developed
Qatar 0.2777 0.0686 0.2091 DTC
Romania 0.2971 0.3489 ‐0.0518 DTC
Russian Federation 3.0046 2.7472 0.2574 DTC
Rwanda 0.0129 0.0095 0.0034 DTC
Samoa 0.0011 0.0011 0.0000 DTC
San Marino 0.0022 0.0025 ‐0.0003 Developed
Sao Tome and Principe 0.0005 0.0003 0.0001 DTC
Saudi Arabia 1.1970 0.7957 0.4013 DTC
Senegal 0.0244 0.0254 ‐0.0009 DTC
Serbia 0.0709 0.0930 ‐0.0220 DTC
Seychelles 0.0020 0.0021 ‐0.0001 DTC
Sierra Leone 0.0081 0.0043 0.0038 DTC
Singapore 0.4102 0.3225 0.0877 DTC
Slovak Republic 0.1342 0.1515 ‐0.0174 DTC
Slovenia 0.0619 0.0857 ‐0.0238 DTC
Solomon Islands 0.0013 0.0014 0.0000 DTC
Somalia 4/ 0.0007 n/a DTC
South Africa 0.5658 0.5939 ‐0.0280 DTC
South Sudan 0.0192 5/ n/a DTC
Spain 1.7179 2.4578 ‐0.7399 Developed
Sri Lanka 0.1325 0.0905 0.0420 DTC
St. Kitts And Nevis 0.0011 0.0010 0.0001 DTC
St. Lucia 0.0018 0.0021 ‐0.0003 DTC
St. Vincent and The Grenadines 0.0010 0.0012 ‐0.0002 DTC
Sudan 0.1144 0.1025 0.0119 DTC
Suriname 0.0076 0.0050 0.0026 DTC
Swaziland 0.0059 0.0065 ‐0.0006 DTC
Sweden 0.6207 0.7009 ‐0.0802 Developed
Switzerland 0.7322 0.6755 0.0567 Developed
Syrian Arab Republic 4/ 0.1029 n/a DTC
Tajikistan 0.0149 0.0117 0.0032 DTC
COMPARISON OF GDP BLEND SHARES ‐ sorted by alphabetical order

Comparison of GDP Blend Shares–By Alpha Annex | 7a
42
Member Countries
GDP MER/PPP 60/40
Blend
(2012‐2014) 1/
GDP MER/PPP 60/40
Blend
(2006‐2008) 1/ 2/
Change in share Classification 3/
Tanzania 0.0817 0.0497 0.0320 DTC
Thailand 0.6778 0.5651 0.1127 DTC
Timor‐Leste 0.0022 0.0009 0.0012 DTC
Togo 0.0072 0.0060 0.0011 DTC
Tonga 0.0006 0.0005 0.0000 DTC
Trinidad and Tobago 0.0367 0.0432 ‐0.0065 DTC
Tunisia 0.0850 0.0873 ‐0.0022 DTC
Turkey 1.1971 1.3328 ‐0.1357 DTC
Turkmenistan 0.0621 0.0339 0.0282 DTC
Tuvalu 0.0000 5/ n/a DTC
Uganda 0.0448 0.0342 0.0107 DTC
Ukraine 0.2817 0.3576 ‐0.0759 DTC
United Arab Emirates 0.5377 0.2748 0.2629 DTC
United Kingdom 3.1642 4.2347 ‐1.0704 Developed
United States 20.0493 23.8407 ‐3.7913 Developed
Uruguay 0.0711 0.0524 0.0187 DTC
Uzbekistan 0.1072 0.0656 0.0416 DTC
Vanuatu 0.0009 0.0011 ‐0.0002 DTC
Venezuela, Republica Bolivariana de 0.5510 0.4766 0.0744 DTC
Vietnam 0.3245 0.2186 0.1059 DTC
Yemen, Republic of 0.0680 0.0576 0.0104 DTC
Zambia 0.0435 0.0234 0.0201 DTC
Zimbabwe 0.0207 0.0061 0.0146 DTC
Source: WDI as of July 1, 2015 and WEO as of April 2015 where WDI data was not available.
WDI data can be found at http://data.worldbank.org/data‐catalog/GDP‐PPP‐based‐table
WEO data can be found at http://www.imf.org/external/pubs/ft/weo/2015/01/weodata/download.aspx
1/ GDP blend using 60% market exchange rates and 40% PPP exchange rates (2011 ICP for 2012‐2014 and 2005 ICP for 2006‐2008).
2/ Reference data used for the Phase 2 Voice Reforms.
3/ Classification as applied in IBRD Phase 1 and Phase 2 Voice Reforms.
4/ Data not available.
5/ South Sudan and Tuvalu became members of IBRD on April 18, 2012 and June 24, 2010, respectively.
COMPARISON OF GDP BLEND SHARES ‐ sorted by alphabetical order
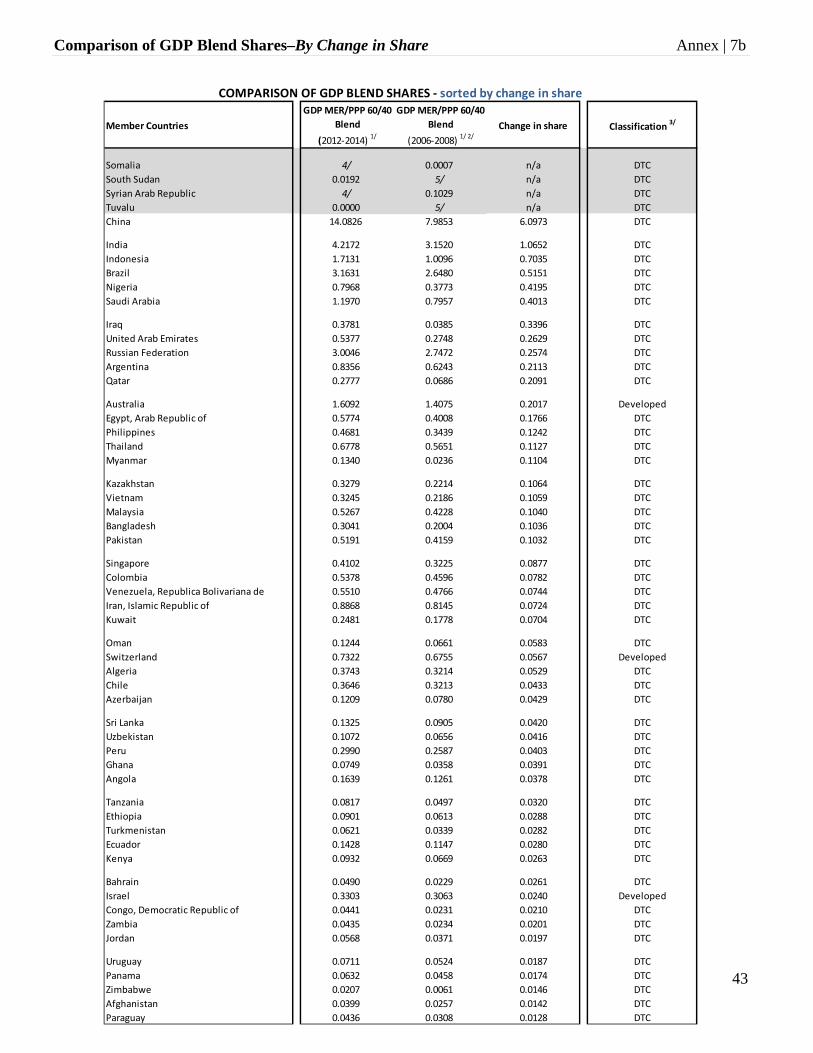
Comparison of GDP Blend Shares–By Change in Share Annex | 7b
43
Member Countries
GDP MER/PPP 60/40
Blend
(2012‐2014) 1/
GDP MER/PPP 60/40
Blend
(2006‐2008) 1/ 2/
Change in share Classification 3/
Somalia 4/ 0.0007 n/a DTC
South Sudan 0.0192 5/ n/a DTC
Syrian Arab Republic 4/ 0.1029 n/a DTC
Tuvalu 0.0000 5/ n/a DTC
China 14.0826 7.9853 6.0973 DTC
India 4.2172 3.1520 1.0652 DTC
Indonesia 1.7131 1.0096 0.7035 DTC
Brazil 3.1631 2.6480 0.5151 DTC
Nigeria 0.7968 0.3773 0.4195 DTC
Saudi Arabia 1.1970 0.7957 0.4013 DTC
Iraq 0.3781 0.0385 0.3396 DTC
United Arab Emirates 0.5377 0.2748 0.2629 DTC
Russian Federation 3.0046 2.7472 0.2574 DTC
Argentina 0.8356 0.6243 0.2113 DTC
Qatar 0.2777 0.0686 0.2091 DTC
Australia 1.6092 1.4075 0.2017 Developed
Egypt, Arab Republic of 0.5774 0.4008 0.1766 DTC
Philippines 0.4681 0.3439 0.1242 DTC
Thailand 0.6778 0.5651 0.1127 DTC
Myanmar 0.1340 0.0236 0.1104 DTC
Kazakhstan 0.3279 0.2214 0.1064 DTC
Vietnam 0.3245 0.2186 0.1059 DTC
Malaysia 0.5267 0.4228 0.1040 DTC
Bangladesh 0.3041 0.2004 0.1036 DTC
Pakistan 0.5191 0.4159 0.1032 DTC
Singapore 0.4102 0.3225 0.0877 DTC
Colombia 0.5378 0.4596 0.0782 DTC
Venezuela, Republica Bolivariana de 0.5510 0.4766 0.0744 DTC
Iran, Islamic Republic of 0.8868 0.8145 0.0724 DTC
Kuwait 0.2481 0.1778 0.0704 DTC
Oman 0.1244 0.0661 0.0583 DTC
Switzerland 0.7322 0.6755 0.0567 Developed
Algeria 0.3743 0.3214 0.0529 DTC
Chile 0.3646 0.3213 0.0433 DTC
Azerbaijan 0.1209 0.0780 0.0429 DTC
Sri Lanka 0.1325 0.0905 0.0420 DTC
Uzbekistan 0.1072 0.0656 0.0416 DTC
Peru 0.2990 0.2587 0.0403 DTC
Ghana 0.0749 0.0358 0.0391 DTC
Angola 0.1639 0.1261 0.0378 DTC
Tanzania 0.0817 0.0497 0.0320 DTC
Ethiopia 0.0901 0.0613 0.0288 DTC
Turkmenistan 0.0621 0.0339 0.0282 DTC
Ecuador 0.1428 0.1147 0.0280 DTC
Kenya 0.0932 0.0669 0.0263 DTC
Bahrain 0.0490 0.0229 0.0261 DTC
Israel 0.3303 0.3063 0.0240 Developed
Congo, Democratic Republic of 0.0441 0.0231 0.0210 DTC
Zambia 0.0435 0.0234 0.0201 DTC
Jordan 0.0568 0.0371 0.0197 DTC
Uruguay 0.0711 0.0524 0.0187 DTC
Panama 0.0632 0.0458 0.0174 DTC
Zimbabwe 0.0207 0.0061 0.0146 DTC
Afghanistan 0.0399 0.0257 0.0142 DTC
Paraguay 0.0436 0.0308 0.0128 DTC
COMPARISON OF GDP BLEND SHARES ‐ sorted by change in share
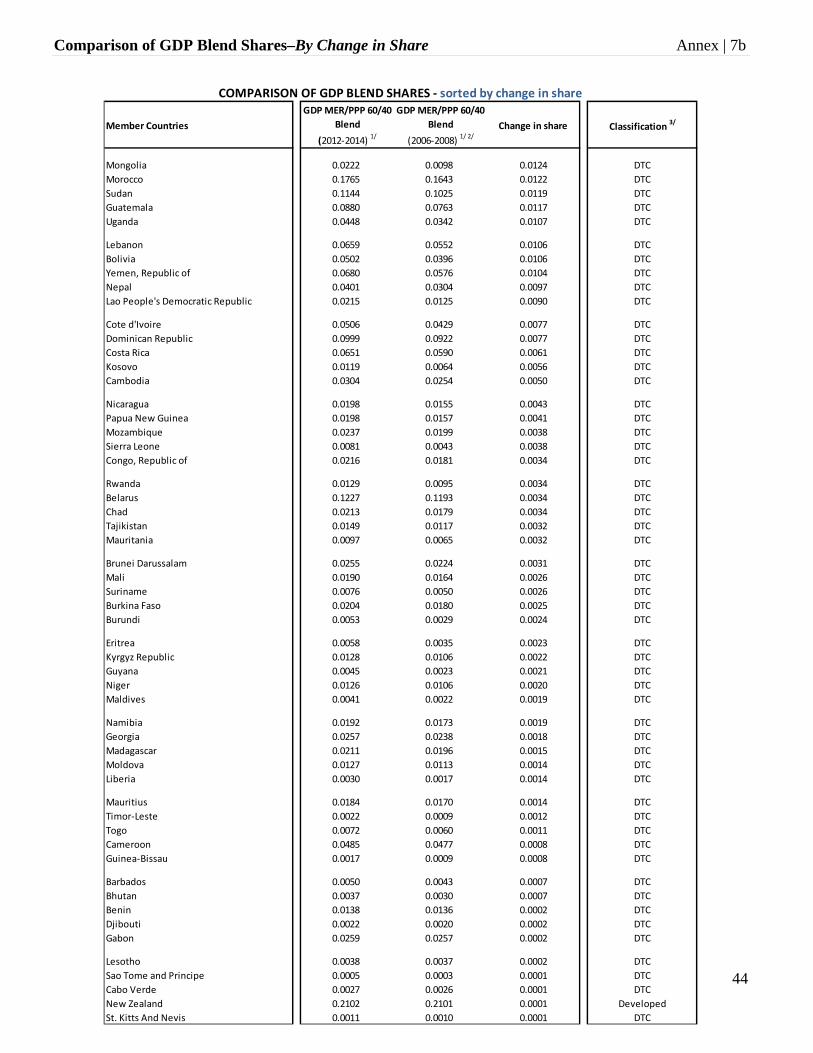
Comparison of GDP Blend Shares–By Change in Share Annex | 7b
44
Member Countries
GDP MER/PPP 60/40
Blend
(2012‐2014) 1/
GDP MER/PPP 60/40
Blend
(2006‐2008) 1/ 2/
Change in share Classification 3/
Mongolia 0.0222 0.0098 0.0124 DTC
Morocco 0.1765 0.1643 0.0122 DTC
Sudan 0.1144 0.1025 0.0119 DTC
Guatemala 0.0880 0.0763 0.0117 DTC
Uganda 0.0448 0.0342 0.0107 DTC
Lebanon 0.0659 0.0552 0.0106 DTC
Bolivia 0.0502 0.0396 0.0106 DTC
Yemen, Republic of 0.0680 0.0576 0.0104 DTC
Nepal 0.0401 0.0304 0.0097 DTC
Lao People's Democratic Republic 0.0215 0.0125 0.0090 DTC
Cote d'Ivoire 0.0506 0.0429 0.0077 DTC
Dominican Republic 0.0999 0.0922 0.0077 DTC
Costa Rica 0.0651 0.0590 0.0061 DTC
Kosovo 0.0119 0.0064 0.0056 DTC
Cambodia 0.0304 0.0254 0.0050 DTC
Nicaragua 0.0198 0.0155 0.0043 DTC
Papua New Guinea 0.0198 0.0157 0.0041 DTC
Mozambique 0.0237 0.0199 0.0038 DTC
Sierra Leone 0.0081 0.0043 0.0038 DTC
Congo, Republic of 0.0216 0.0181 0.0034 DTC
Rwanda 0.0129 0.0095 0.0034 DTC
Belarus 0.1227 0.1193 0.0034 DTC
Chad 0.0213 0.0179 0.0034 DTC
Tajikistan 0.0149 0.0117 0.0032 DTC
Mauritania 0.0097 0.0065 0.0032 DTC
Brunei Darussalam 0.0255 0.0224 0.0031 DTC
Mali 0.0190 0.0164 0.0026 DTC
Suriname 0.0076 0.0050 0.0026 DTC
Burkina Faso 0.0204 0.0180 0.0025 DTC
Burundi 0.0053 0.0029 0.0024 DTC
Eritrea 0.0058 0.0035 0.0023 DTC
Kyrgyz Republic 0.0128 0.0106 0.0022 DTC
Guyana 0.0045 0.0023 0.0021 DTC
Niger 0.0126 0.0106 0.0020 DTC
Maldives 0.0041 0.0022 0.0019 DTC
Namibia 0.0192 0.0173 0.0019 DTC
Georgia 0.0257 0.0238 0.0018 DTC
Madagascar 0.0211 0.0196 0.0015 DTC
Moldova 0.0127 0.0113 0.0014 DTC
Liberia 0.0030 0.0017 0.0014 DTC
Mauritius 0.0184 0.0170 0.0014 DTC
Timor‐Leste 0.0022 0.0009 0.0012 DTC
Togo 0.0072 0.0060 0.0011 DTC
Cameroon 0.0485 0.0477 0.0008 DTC
Guinea‐Bissau 0.0017 0.0009 0.0008 DTC
Barbados 0.0050 0.0043 0.0007 DTC
Bhutan 0.0037 0.0030 0.0007 DTC
Benin 0.0138 0.0136 0.0002 DTC
Djibouti 0.0022 0.0020 0.0002 DTC
Gabon 0.0259 0.0257 0.0002 DTC
Lesotho 0.0038 0.0037 0.0002 DTC
Sao Tome and Principe 0.0005 0.0003 0.0001 DTC
Cabo Verde 0.0027 0.0026 0.0001 DTC
New Zealand 0.2102 0.2101 0.0001 Developed
St. Kitts And Nevis 0.0011 0.0010 0.0001 DTC
COMPARISON OF GDP BLEND SHARES ‐ sorted by change in share

Comparison of GDP Blend Shares–By Change in Share Annex | 7b
45
Member Countries
GDP MER/PPP 60/40
Blend
(2012‐2014) 1/
GDP MER/PPP 60/40
Blend
(2006‐2008) 1/ 2/
Change in share Classification 3/
Tonga 0.0006 0.0005 0.0000 DTC
Palau 0.0003 0.0003 0.0000 DTC
Samoa 0.0011 0.0011 0.0000 DTC
Grenada 0.0012 0.0012 0.0000 DTC
Solomon Islands 0.0013 0.0014 0.0000 DTC
Dominica 0.0007 0.0008 0.0000 DTC
Comoros 0.0009 0.0010 ‐0.0001 DTC
Kiribati 0.0002 0.0003 ‐0.0001 DTC
Micronesia, Federated States of 0.0004 0.0005 ‐0.0001 DTC
Malta 0.0128 0.0129 ‐0.0001 DTC
Marshall Islands 0.0002 0.0003 ‐0.0001 DTC
Gambia, The 0.0019 0.0020 ‐0.0001 DTC
Seychelles 0.0020 0.0021 ‐0.0001 DTC
Bahamas, The 0.0102 0.0103 ‐0.0002 DTC
Vanuatu 0.0009 0.0011 ‐0.0002 DTC
St. Vincent and The Grenadines 0.0010 0.0012 ‐0.0002 DTC
Fiji 0.0058 0.0060 ‐0.0002 DTC
Haiti 0.0136 0.0138 ‐0.0002 DTC
St. Lucia 0.0018 0.0021 ‐0.0003 DTC
San Marino 0.0022 0.0025 ‐0.0003 Developed
Belize 0.0024 0.0027 ‐0.0003 DTC
Swaziland 0.0059 0.0065 ‐0.0006 DTC
Antigua and Barbuda 0.0017 0.0023 ‐0.0006 DTC
Guinea 0.0107 0.0113 ‐0.0006 DTC
Senegal 0.0244 0.0254 ‐0.0009 DTC
Central African Republic 0.0028 0.0038 ‐0.0011 DTC
Honduras 0.0288 0.0305 ‐0.0017 DTC
Montenegro 0.0069 0.0088 ‐0.0019 DTC
Macedonia, former Yugoslav Republic of 0.0187 0.0206 ‐0.0019 DTC
Tunisia 0.0850 0.0873 ‐0.0022 DTC
Malawi 0.0084 0.0108 ‐0.0024 DTC
Armenia 0.0175 0.0207 ‐0.0033 DTC
Cyprus 0.0300 0.0334 ‐0.0035 Developed
Botswana 0.0253 0.0289 ‐0.0037 DTC
Albania 0.0217 0.0260 ‐0.0043 DTC
Equatorial Guinea 0.0225 0.0271 ‐0.0047 DTC
Estonia 0.0329 0.0391 ‐0.0062 DTC
Bosnia and Herzegovina 0.0286 0.0352 ‐0.0065 DTC
Trinidad and Tobago 0.0367 0.0432 ‐0.0065 DTC
Jamaica 0.0209 0.0276 ‐0.0067 DTC
El Salvador 0.0390 0.0474 ‐0.0084 DTC
Iceland 0.0178 0.0268 ‐0.0090 Developed
Bulgaria 0.0889 0.0991 ‐0.0102 DTC
Luxembourg 0.0674 0.0778 ‐0.0104 Developed
Latvia 0.0421 0.0540 ‐0.0120 DTC
Lithuania 0.0663 0.0800 ‐0.0137 DTC
Slovak Republic 0.1342 0.1515 ‐0.0174 DTC
Serbia 0.0709 0.0930 ‐0.0220 DTC
Slovenia 0.0619 0.0857 ‐0.0238 DTC
South Africa 0.5658 0.5939 ‐0.0280 DTC
Libya 0.0987 0.1327 ‐0.0340 DTC
Croatia 0.0814 0.1156 ‐0.0342 DTC
Romania 0.2971 0.3489 ‐0.0518 DTC
Norway 0.5403 0.5984 ‐0.0581 Developed
Czech Republic 0.2874 0.3503 ‐0.0629 DTC
COMPARISON OF GDP BLEND SHARES ‐ sorted by change in share

Comparison of GDP Blend Shares–By Change in Share Annex | 7b
46
Member Countries
GDP MER/PPP 60/40
Blend
(2012‐2014) 1/
GDP MER/PPP 60/40
Blend
(2006‐2008) 1/ 2/
Change in share Classification 3/
Hungary 0.1973 0.2686 ‐0.0713 DTC
Ukraine 0.2817 0.3576 ‐0.0759 DTC
Sweden 0.6207 0.7009 ‐0.0802 Developed
Finland 0.2979 0.3830 ‐0.0851 Developed
Poland 0.7786 0.8661 ‐0.0875 DTC
Portugal 0.2927 0.3946 ‐0.1019 Developed
Denmark 0.3644 0.4692 ‐0.1047 Developed
Austria 0.4912 0.6062 ‐0.1150 Developed
Belgium 0.6001 0.7291 ‐0.1290 Developed
Ireland 0.2706 0.4010 ‐0.1304 Developed
Turkey 1.1971 1.3328 ‐0.1357 DTC
Korea, Republic of 1.7069 1.8914 ‐0.1845 DTC
Canada 2.0543 2.2388 ‐0.1845 Developed
Greece 0.3064 0.5465 ‐0.2401 Developed
Mexico 1.7966 2.0581 ‐0.2616 DTC
Netherlands 0.9871 1.2515 ‐0.2645 Developed
Spain 1.7179 2.4578 ‐0.7399 Developed
Italy 2.5316 3.4452 ‐0.9136 Developed
France 3.2051 4.1509 ‐0.9458 Developed
Germany 4.3757 5.4397 ‐1.0640 Developed
United Kingdom 3.1642 4.2347 ‐1.0704 Developed
Japan 5.9406 7.7397 ‐1.7992 Developed
United States 20.0493 23.8407 ‐3.7913 Developed
Source: WDI as of July 1, 2015 and WEO as of April 2015 where WDI data was not available.
WDI data can be found at http://data.worldbank.org/data‐catalog/GDP‐PPP‐based‐table
WEO data can be found at http://www.imf.org/external/pubs/ft/weo/2015/01/weodata/download.aspx
1/ GDP blend using 60% market exchange rates and 40% PPP exchange rates (2011 ICP for 2012‐2014 and 2005 ICP for 2006‐2008).
2/ Reference data used for the Phase 2 Voice Reforms.
3/ Classification as applied in IBRD Phase 1 and Phase 2 Voice Reforms.
4/ Data not available.
5/ South Sudan and Tuvalu became members of IBRD on April 18, 2012 and June 24, 2010, respectively.
COMPARISON OF GDP BLEND SHARES ‐ sorted by change in share

Comparison of GDP Blend Shares–By Classification Annex | 7c
47
Member Countries
GDP MER/PPP 60/40
Blend
(2012‐2014) 1/
GDP MER/PPP 60/40
Blend
(2006‐2008) 1/ 2/
Change in share Classification 3/
Australia 1.6092 1.4075 0.2017 Developed
Switzerland 0.7322 0.6755 0.0567 Developed
Israel 0.3303 0.3063 0.0240 Developed
New Zealand 0.2102 0.2101 0.0001 Developed
San Marino 0.0022 0.0025 ‐0.0003 Developed
Cyprus 0.0300 0.0334 ‐0.0035 Developed
Iceland 0.0178 0.0268 ‐0.0090 Developed
Luxembourg 0.0674 0.0778 ‐0.0104 Developed
Norway 0.5403 0.5984 ‐0.0581 Developed
Sweden 0.6207 0.7009 ‐0.0802 Developed
Finland 0.2979 0.3830 ‐0.0851 Developed
Portugal 0.2927 0.3946 ‐0.1019 Developed
Denmark 0.3644 0.4692 ‐0.1047 Developed
Austria 0.4912 0.6062 ‐0.1150 Developed
Belgium 0.6001 0.7291 ‐0.1290 Developed
Ireland 0.2706 0.4010 ‐0.1304 Developed
Canada 2.0543 2.2388 ‐0.1845 Developed
Greece 0.3064 0.5465 ‐0.2401 Developed
Netherlands 0.9871 1.2515 ‐0.2645 Developed
Spain 1.7179 2.4578 ‐0.7399 Developed
Italy 2.5316 3.4452 ‐0.9136 Developed
France 3.2051 4.1509 ‐0.9458 Developed
Germany 4.3757 5.4397 ‐1.0640 Developed
United Kingdom 3.1642 4.2347 ‐1.0704 Developed
Japan 5.9406 7.7397 ‐1.7992 Developed
United States 20.0493 23.8407 ‐3.7913 Developed
50.8096 62.3678 ‐11.5582 Developed Total
Somalia 4/ 0.0007 n.a. DTC
South Sudan 0.0192 5/ n.a. DTC
Syrian Arab Republic 4/ 0.1029 n.a. DTC
Tuvalu 0.0000 5/ n.a. DTC
China 14.0826 7.9853 6.0973 DTC
India 4.2172 3.1520 1.0652 DTC
Indonesia 1.7131 1.0096 0.7035 DTC
Brazil 3.1631 2.6480 0.5151 DTC
Nigeria 0.7968 0.3773 0.4195 DTC
Saudi Arabia 1.1970 0.7957 0.4013 DTC
Iraq 0.3781 0.0385 0.3396 DTC
United Arab Emirates 0.5377 0.2748 0.2629 DTC
Russian Federation 3.0046 2.7472 0.2574 DTC
Argentina 0.8356 0.6243 0.2113 DTC
Qatar 0.2777 0.0686 0.2091 DTC
Egypt, Arab Republic of 0.5774 0.4008 0.1766 DTC
Philippines 0.4681 0.3439 0.1242 DTC
Thailand 0.6778 0.5651 0.1127 DTC
Myanmar 0.1340 0.0236 0.1104 DTC
Kazakhstan 0.3279 0.2214 0.1064 DTC
Vietnam 0.3245 0.2186 0.1059 DTC
Malaysia 0.5267 0.4228 0.1040 DTC
Bangladesh 0.3041 0.2004 0.1036 DTC
Pakistan 0.5191 0.4159 0.1032 DTC
COMPARISON OF GDP BLEND SHARES ‐ sorted by classification and change in share

Comparison of GDP Blend Shares–By Classification Annex | 7c
48
Member Countries
GDP MER/PPP 60/40
Blend
(2012‐2014) 1/
GDP MER/PPP 60/40
Blend
(2006‐2008) 1/ 2/
Change in share Classification 3/
Singapore 0.4102 0.3225 0.0877 DTC
Colombia 0.5378 0.4596 0.0782 DTC
Venezuela, Republica Bolivariana de 0.5510 0.4766 0.0744 DTC
Iran, Islamic Republic of 0.8868 0.8145 0.0724 DTC
Kuwait 0.2481 0.1778 0.0704 DTC
Oman 0.1244 0.0661 0.0583 DTC
Algeria 0.3743 0.3214 0.0529 DTC
Chile 0.3646 0.3213 0.0433 DTC
Azerbaijan 0.1209 0.0780 0.0429 DTC
Sri Lanka 0.1325 0.0905 0.0420 DTC
Uzbekistan 0.1072 0.0656 0.0416 DTC
Peru 0.2990 0.2587 0.0403 DTC
Ghana 0.0749 0.0358 0.0391 DTC
Angola 0.1639 0.1261 0.0378 DTC
Tanzania 0.0817 0.0497 0.0320 DTC
Ethiopia 0.0901 0.0613 0.0288 DTC
Turkmenistan 0.0621 0.0339 0.0282 DTC
Ecuador 0.1428 0.1147 0.0280 DTC
Kenya 0.0932 0.0669 0.0263 DTC
Bahrain 0.0490 0.0229 0.0261 DTC
Congo, Democratic Republic of 0.0441 0.0231 0.0210 DTC
Zambia 0.0435 0.0234 0.0201 DTC
Jordan 0.0568 0.0371 0.0197 DTC
Uruguay 0.0711 0.0524 0.0187 DTC
Panama 0.0632 0.0458 0.0174 DTC
Zimbabwe 0.0207 0.0061 0.0146 DTC
Afghanistan 0.0399 0.0257 0.0142 DTC
Paraguay 0.0436 0.0308 0.0128 DTC
Mongolia 0.0222 0.0098 0.0124 DTC
Morocco 0.1765 0.1643 0.0122 DTC
Sudan 0.1144 0.1025 0.0119 DTC
Guatemala 0.0880 0.0763 0.0117 DTC
Uganda 0.0448 0.0342 0.0107 DTC
Lebanon 0.0659 0.0552 0.0106 DTC
Bolivia 0.0502 0.0396 0.0106 DTC
Yemen, Republic of 0.0680 0.0576 0.0104 DTC
Nepal 0.0401 0.0304 0.0097 DTC
Lao People's Democratic Republic 0.0215 0.0125 0.0090 DTC
Cote d'Ivoire 0.0506 0.0429 0.0077 DTC
Dominican Republic 0.0999 0.0922 0.0077 DTC
Costa Rica 0.0651 0.0590 0.0061 DTC
Kosovo 0.0119 0.0064 0.0056 DTC
Cambodia 0.0304 0.0254 0.0050 DTC
Nicaragua 0.0198 0.0155 0.0043 DTC
Papua New Guinea 0.0198 0.0157 0.0041 DTC
Mozambique 0.0237 0.0199 0.0038 DTC
Sierra Leone 0.0081 0.0043 0.0038 DTC
Congo, Republic of 0.0216 0.0181 0.0034 DTC
Rwanda 0.0129 0.0095 0.0034 DTC
Belarus 0.1227 0.1193 0.0034 DTC
COMPARISON OF GDP BLEND SHARES ‐ sorted by classification and change in share

Comparison of GDP Blend Shares–By Classification Annex | 7c
49
Member Countries
GDP MER/PPP 60/40
Blend
(2012‐2014) 1/
GDP MER/PPP 60/40
Blend
(2006‐2008) 1/ 2/
Change in share Classification 3/
Chad 0.0213 0.0179 0.0034 DTC
Tajikistan 0.0149 0.0117 0.0032 DTC
Mauritania 0.0097 0.0065 0.0032 DTC
Brunei Darussalam 0.0255 0.0224 0.0031 DTC
Mali 0.0190 0.0164 0.0026 DTC
Suriname 0.0076 0.0050 0.0026 DTC
Burkina Faso 0.0204 0.0180 0.0025 DTC
Burundi 0.0053 0.0029 0.0024 DTC
Eritrea 0.0058 0.0035 0.0023 DTC
Kyrgyz Republic 0.0128 0.0106 0.0022 DTC
Guyana 0.0045 0.0023 0.0021 DTC
Niger 0.0126 0.0106 0.0020 DTC
Maldives 0.0041 0.0022 0.0019 DTC
Namibia 0.0192 0.0173 0.0019 DTC
Georgia 0.0257 0.0238 0.0018 DTC
Madagascar 0.0211 0.0196 0.0015 DTC
Moldova 0.0127 0.0113 0.0014 DTC
Liberia 0.0030 0.0017 0.0014 DTC
Mauritius 0.0184 0.0170 0.0014 DTC
Timor‐Leste 0.0022 0.0009 0.0012 DTC
Togo 0.0072 0.0060 0.0011 DTC
Cameroon 0.0485 0.0477 0.0008 DTC
Guinea‐Bissau 0.0017 0.0009 0.0008 DTC
Barbados 0.0050 0.0043 0.0007 DTC
Bhutan 0.0037 0.0030 0.0007 DTC
Benin 0.0138 0.0136 0.0002 DTC
Djibouti 0.0022 0.0020 0.0002 DTC
Gabon 0.0259 0.0257 0.0002 DTC
Lesotho 0.0038 0.0037 0.0002 DTC
Sao Tome and Principe 0.0005 0.0003 0.0001 DTC
Cabo Verde 0.0027 0.0026 0.0001 DTC
St. Kitts And Nevis 0.0011 0.0010 0.0001 DTC
Tonga 0.0006 0.0005 0.0000 DTC
Palau 0.0003 0.0003 0.0000 DTC
Samoa 0.0011 0.0011 0.0000 DTC
Grenada 0.0012 0.0012 0.0000 DTC
Solomon Islands 0.0013 0.0014 0.0000 DTC
Dominica 0.0007 0.0008 0.0000 DTC
Comoros 0.0009 0.0010 ‐0.0001 DTC
Kiribati 0.0002 0.0003 ‐0.0001 DTC
Micronesia, Federated States of 0.0004 0.0005 ‐0.0001 DTC
Malta 0.0128 0.0129 ‐0.0001 DTC
Marshall Islands 0.0002 0.0003 ‐0.0001 DTC
Gambia, The 0.0019 0.0020 ‐0.0001 DTC
Seychelles 0.0020 0.0021 ‐0.0001 DTC
Bahamas, The 0.0102 0.0103 ‐0.0002 DTC
Vanuatu 0.0009 0.0011 ‐0.0002 DTC
St. Vincent and The Grenadines 0.0010 0.0012 ‐0.0002 DTC
Fiji 0.0058 0.0060 ‐0.0002 DTC
Haiti 0.0136 0.0138 ‐0.0002 DTC
COMPARISON OF GDP BLEND SHARES ‐ sorted by classification and change in share

Comparison of GDP Blend Shares–By Classification Annex | 7c
50
Member Countries
GDP MER/PPP 60/40
Blend
(2012‐2014) 1/
GDP MER/PPP 60/40
Blend
(2006‐2008) 1/ 2/
Change in share Classification 3/
St. Lucia 0.0018 0.0021 ‐0.0003 DTC
Belize 0.0024 0.0027 ‐0.0003 DTC
Swaziland 0.0059 0.0065 ‐0.0006 DTC
Antigua and Barbuda 0.0017 0.0023 ‐0.0006 DTC
Guinea 0.0107 0.0113 ‐0.0006 DTC
Senegal 0.0244 0.0254 ‐0.0009 DTC
Central African Republic 0.0028 0.0038 ‐0.0011 DTC
Honduras 0.0288 0.0305 ‐0.0017 DTC
Montenegro 0.0069 0.0088 ‐0.0019 DTC
Macedonia, former Yugoslav Republic of 0.0187 0.0206 ‐0.0019 DTC
Tunisia 0.0850 0.0873 ‐0.0022 DTC
Malawi 0.0084 0.0108 ‐0.0024 DTC
Armenia 0.0175 0.0207 ‐0.0033 DTC
Botswana 0.0253 0.0289 ‐0.0037 DTC
Albania 0.0217 0.0260 ‐0.0043 DTC
Equatorial Guinea 0.0225 0.0271 ‐0.0047 DTC
Estonia 0.0329 0.0391 ‐0.0062 DTC
Bosnia and Herzegovina 0.0286 0.0352 ‐0.0065 DTC
Trinidad and Tobago 0.0367 0.0432 ‐0.0065 DTC
Jamaica 0.0209 0.0276 ‐0.0067 DTC
El Salvador 0.0390 0.0474 ‐0.0084 DTC
Bulgaria 0.0889 0.0991 ‐0.0102 DTC
Latvia 0.0421 0.0540 ‐0.0120 DTC
Lithuania 0.0663 0.0800 ‐0.0137 DTC
Slovak Republic 0.1342 0.1515 ‐0.0174 DTC
Serbia 0.0709 0.0930 ‐0.0220 DTC
Slovenia 0.0619 0.0857 ‐0.0238 DTC
South Africa 0.5658 0.5939 ‐0.0280 DTC
Libya 0.0987 0.1327 ‐0.0340 DTC
Croatia 0.0814 0.1156 ‐0.0342 DTC
Romania 0.2971 0.3489 ‐0.0518 DTC
Czech Republic 0.2874 0.3503 ‐0.0629 DTC
Hungary 0.1973 0.2686 ‐0.0713 DTC
Ukraine 0.2817 0.3576 ‐0.0759 DTC
Poland 0.7786 0.8661 ‐0.0875 DTC
Turkey 1.1971 1.3328 ‐0.1357 DTC
Korea, Republic of 1.7069 1.8914 ‐0.1845 DTC
Mexico 1.7966 2.0581 ‐0.2616 DTC
49.1904 37.6322 11.6425 DTC Total
100.0000 100.0000 0.0843 Grand Total
Source: WDI as of July 1, 2015 and WEO as of April 2015 where WDI data was not available.
WDI data can be found at http://data.worldbank.org/data‐catalog/GDP‐PPP‐based‐table
WEO data can be found at http://www.imf.org/external/pubs/ft/weo/2015/01/weodata/download.aspx
1/ GDP blend using 60% market exchange rates and 40% PPP exchange rates (2011 ICP for 2012‐2014 and 2005 ICP for 2006‐2008).
2/ Reference data used for the Phase 2 Voice Reforms.
3/ Classification as applied in IBRD Phase 1 and Phase 2 Voice Reforms.
4/ Data not available.
5/ South Sudan and Tuvalu became members of IBRD on April 18, 2012 and June 24, 2010, respectively.
COMPARISON OF GDP BLEND SHARES ‐ sorted by classification and change in share
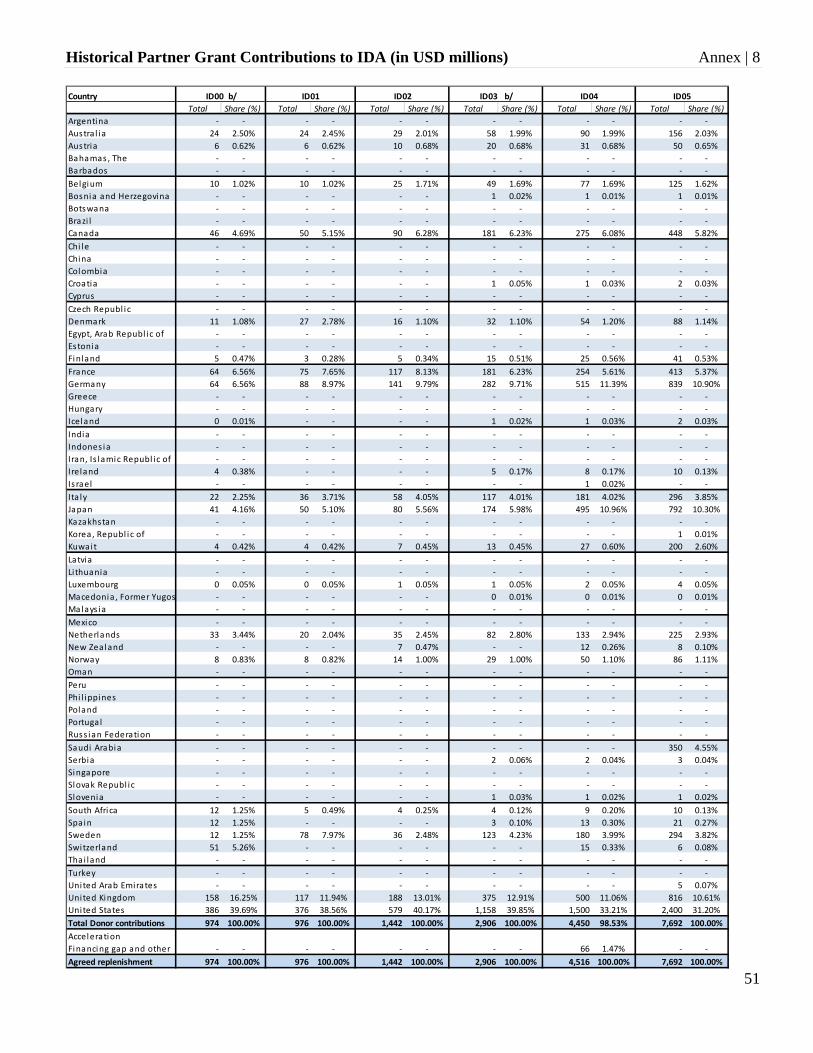
Historical Partner Grant Contributions to IDA (in USD millions) Annex | 8
51
Country
Total Share (%) Total Share (%) Total Share (%) Total Share (%) Total Share (%) Total Share (%)
Argentina ‐ ‐ ‐ ‐ ‐ ‐ ‐ ‐ ‐ ‐ ‐ ‐
Austral ia 24 2.50% 24 2.45% 29 2.01% 58 1.99% 90 1.99% 156 2.03%
Austria 6 0.62% 6 0.62% 10 0.68% 20 0.68% 31 0.68% 50 0.65%
Bahamas , The ‐ ‐ ‐ ‐ ‐ ‐ ‐ ‐ ‐ ‐ ‐ ‐
Barbados ‐ ‐ ‐ ‐ ‐ ‐ ‐ ‐ ‐ ‐ ‐ ‐
Belgium 10 1.02% 10 1.02% 25 1.71% 49 1.69% 77 1.69% 125 1.62%
Bosnia and Herzegovina ‐ ‐ ‐ ‐ ‐ ‐ 1 0.02% 1 0.01% 1 0.01%
Botswana ‐ ‐ ‐ ‐ ‐ ‐ ‐ ‐ ‐ ‐ ‐ ‐
Brazi l ‐ ‐ ‐ ‐ ‐ ‐ ‐ ‐ ‐ ‐ ‐ ‐
Canada 46 4.69% 50 5.15% 90 6.28% 181 6.23% 275 6.08% 448 5.82%
Chi le ‐ ‐ ‐ ‐ ‐ ‐ ‐ ‐ ‐ ‐ ‐ ‐
China ‐ ‐ ‐ ‐ ‐ ‐ ‐ ‐ ‐ ‐ ‐ ‐
Colombia ‐ ‐ ‐ ‐ ‐ ‐ ‐ ‐ ‐ ‐ ‐ ‐
Croatia ‐ ‐ ‐ ‐ ‐ ‐ 1 0.05% 1 0.03% 2 0.03%
Cyprus ‐ ‐ ‐ ‐ ‐ ‐ ‐ ‐ ‐ ‐ ‐ ‐
Czech Republ ic ‐ ‐ ‐ ‐ ‐ ‐ ‐ ‐ ‐ ‐ ‐ ‐
Denmark 11 1.08% 27 2.78% 16 1.10% 32 1.10% 54 1.20% 88 1.14%
Egypt, Arab Republ ic of ‐ ‐ ‐ ‐ ‐ ‐ ‐ ‐ ‐ ‐ ‐ ‐
Estonia ‐ ‐ ‐ ‐ ‐ ‐ ‐ ‐ ‐ ‐ ‐ ‐
Finland 5 0.47% 3 0.28% 5 0.34% 15 0.51% 25 0.56% 41 0.53%
France 64 6.56% 75 7.65% 117 8.13% 181 6.23% 254 5.61% 413 5.37%
Germany 64 6.56% 88 8.97% 141 9.79% 282 9.71% 515 11.39% 839 10.90%
Greece ‐ ‐ ‐ ‐ ‐ ‐ ‐ ‐ ‐ ‐ ‐ ‐
Hungary ‐ ‐ ‐ ‐ ‐ ‐ ‐ ‐ ‐ ‐ ‐ ‐
Iceland 0 0.01% ‐ ‐ ‐ ‐ 1 0.02% 1 0.03% 2 0.03%
India ‐ ‐ ‐ ‐ ‐ ‐ ‐ ‐ ‐ ‐ ‐ ‐
Indones ia ‐ ‐ ‐ ‐ ‐ ‐ ‐ ‐ ‐ ‐ ‐ ‐
Iran, Is lamic Republ ic of ‐ ‐ ‐ ‐ ‐ ‐ ‐ ‐ ‐ ‐ ‐ ‐
Ireland 4 0.38% ‐ ‐ ‐ ‐ 5 0.17% 8 0.17% 10 0.13%
Israel ‐ ‐ ‐ ‐ ‐ ‐ ‐ ‐ 1 0.02% ‐ ‐
Ita ly 22 2.25% 36 3.71% 58 4.05% 117 4.01% 181 4.02% 296 3.85%
Japan 41 4.16% 50 5.10% 80 5.56% 174 5.98% 495 10.96% 792 10.30%
Kazakhstan ‐ ‐ ‐ ‐ ‐ ‐ ‐ ‐ ‐ ‐ ‐ ‐
Korea, Republ ic of ‐ ‐ ‐ ‐ ‐ ‐ ‐ ‐ ‐ ‐ 1 0.01%
Kuwait 4 0.42% 4 0.42% 7 0.45% 13 0.45% 27 0.60% 200 2.60%
Latvia ‐ ‐ ‐ ‐ ‐ ‐ ‐ ‐ ‐ ‐ ‐ ‐
Lithuania ‐ ‐ ‐ ‐ ‐ ‐ ‐ ‐ ‐ ‐ ‐ ‐
Luxembourg 0 0.05% 0 0.05% 1 0.05% 1 0.05% 2 0.05% 4 0.05%
Macedonia , Former Yugos ‐ ‐ ‐ ‐ ‐ ‐ 0 0.01% 0 0.01% 0 0.01%
Malays ia ‐ ‐ ‐ ‐ ‐ ‐ ‐ ‐ ‐ ‐ ‐ ‐
Mexico ‐ ‐ ‐ ‐ ‐ ‐ ‐ ‐ ‐ ‐ ‐ ‐
Netherlands 33 3.44% 20 2.04% 35 2.45% 82 2.80% 133 2.94% 225 2.93%
New Zealand ‐ ‐ ‐ ‐ 7 0.47% ‐ ‐ 12 0.26% 8 0.10%
Norway 8 0.83% 8 0.82% 14 1.00% 29 1.00% 50 1.10% 86 1.11%
Oman ‐ ‐ ‐ ‐ ‐ ‐ ‐ ‐ ‐ ‐ ‐ ‐
Peru ‐ ‐ ‐ ‐ ‐ ‐ ‐ ‐ ‐ ‐ ‐ ‐
Phi l ippines ‐ ‐ ‐ ‐ ‐ ‐ ‐ ‐ ‐ ‐ ‐ ‐
Poland ‐ ‐ ‐ ‐ ‐ ‐ ‐ ‐ ‐ ‐ ‐ ‐
Portuga l ‐ ‐ ‐ ‐ ‐ ‐ ‐ ‐ ‐ ‐ ‐ ‐
Russ ian Federation ‐ ‐ ‐ ‐ ‐ ‐ ‐ ‐ ‐ ‐ ‐ ‐
Saudi Arabia ‐ ‐ ‐ ‐ ‐ ‐ ‐ ‐ ‐ ‐ 350 4.55%
Serbia ‐ ‐ ‐ ‐ ‐ ‐ 2 0.06% 2 0.04% 3 0.04%
Singapore ‐ ‐ ‐ ‐ ‐ ‐ ‐ ‐ ‐ ‐ ‐ ‐
Slovak Republ ic ‐ ‐ ‐ ‐ ‐ ‐ ‐ ‐ ‐ ‐ ‐ ‐
Slovenia ‐ ‐ ‐ ‐ ‐ ‐ 1 0.03% 1 0.02% 1 0.02%
South Africa 12 1.25% 5 0.49% 4 0.25% 4 0.12% 9 0.20% 10 0.13%
Spain 12 1.25% ‐ ‐ ‐ ‐ 3 0.10% 13 0.30% 21 0.27%
Sweden 12 1.25% 78 7.97% 36 2.48% 123 4.23% 180 3.99% 294 3.82%
Switzerland 51 5.26% ‐ ‐ ‐ ‐ ‐ ‐ 15 0.33% 6 0.08%
Thai land ‐ ‐ ‐ ‐ ‐ ‐ ‐ ‐ ‐ ‐ ‐ ‐
Turkey ‐ ‐ ‐ ‐ ‐ ‐ ‐ ‐ ‐ ‐ ‐ ‐
United Arab Emirates ‐ ‐ ‐ ‐ ‐ ‐ ‐ ‐ ‐ ‐ 5 0.07%
United Kingdom 158 16.25% 117 11.94% 188 13.01% 375 12.91% 500 11.06% 816 10.61%
United States 386 39.69% 376 38.56% 579 40.17% 1,158 39.85% 1,500 33.21% 2,400 31.20%
Total Donor contributions 974 100.00% 976 100.00% 1,442 100.00% 2,906 100.00% 4,450 98.53% 7,692 100.00%
Acceleration
Financing gap and other ‐ ‐ ‐ ‐ ‐ ‐ ‐ ‐ 66 1.47% ‐ ‐
Agreed replenishment 974 100.00% 976 100.00% 1,442 100.00% 2,906 100.00% 4,516 100.00% 7,692 100.00%
ID05ID00 b/ ID01 ID02 ID03 b/ ID04

Historical Partner Grant Contributions to IDA (in USD millions) Annex | 8
52
Country
Total Share (%) Total Share (%) Total Share (%) Total Share (%) Total Share (%)
Argentina 25 0.21% 8 0.42% ‐ ‐ ‐ ‐ ‐ ‐
Austra l ia 229 1.91% 65 3.29% 179 1.98% ‐ ‐ 229 1.86%
Austria 82 0.68% 20 0.99% 61 0.68% 17 1.65% 81 0.65%
Bahamas , The ‐ ‐ ‐ ‐ ‐ ‐ ‐ ‐ ‐ ‐
Barbados ‐ ‐ ‐ ‐ ‐ ‐ ‐ ‐ ‐ ‐
Belgium 202 1.68% 40 2.01% 151 1.68% 16 1.49% 193 1.57%
Bosnia and Herzegovina 3 0.02% 0 0.02% 2 0.02% ‐ ‐ ‐ ‐
Botswana ‐ ‐ ‐ ‐ ‐ ‐ ‐ ‐ ‐ ‐
Brazi l 50 0.42% 10 0.50% 22 0.25% ‐ ‐ 29 0.23%
Canada 516 4.30% 162 8.13% 405 4.50% 82 7.78% 575 4.68%
Chi le ‐ ‐ ‐ ‐ ‐ ‐ ‐ ‐ ‐ ‐
China ‐ ‐ ‐ ‐ ‐ ‐ ‐ ‐ ‐ ‐
Colombia 10 0.08% ‐ ‐ 8 0.08% ‐ ‐ 9 0.07%
Croatia 6 0.05% 1 0.04% 4 0.05% ‐ ‐ ‐ ‐
Cyprus ‐ ‐ ‐ ‐ ‐ ‐ ‐ ‐ ‐ ‐
Czech Republ ic ‐ ‐ ‐ ‐ ‐ ‐ ‐ ‐ ‐ ‐
Denmark 144 1.20% 28 1.43% 108 1.20% 25 2.33% 150 1.22%
Egypt, Arab Republ ic of ‐ ‐ ‐ ‐ ‐ ‐ ‐ ‐ ‐ ‐
Estonia ‐ ‐ ‐ ‐ ‐ ‐ ‐ ‐ ‐ ‐
Finland 72 0.60% 19 0.94% 63 0.70% 18 1.70% 92 0.75%
France 646 5.38% 127 6.38% 594 6.60% 244 23.10% 840 6.83%
Germany 1,500 12.50% 264 13.29% 1,035 11.50% ‐ ‐ 1,373 11.16%
Greece 6 0.05% 1 0.05% 5 0.05% ‐ ‐ 6 0.05%
Hungary ‐ ‐ ‐ ‐ 10 0.11% ‐ ‐ 13 0.10%
Iceland 4 0.03% 0 0.02% 3 0.03% ‐ ‐ 3 0.03%
India ‐ ‐ ‐ ‐ ‐ ‐ ‐ ‐ ‐ ‐
Indones ia ‐ ‐ ‐ ‐ ‐ ‐ ‐ ‐ ‐ ‐
Iran, Is lamic Republ ic of ‐ ‐ ‐ ‐ ‐ ‐ ‐ ‐ ‐ ‐
Ireland 13 0.11% 3 0.14% 10 0.11% 2 0.21% 13 0.11%
Israel ‐ ‐ ‐ ‐ ‐ ‐ ‐ ‐ ‐ ‐
Ita ly 462 3.85% 89 4.49% 387 4.30% 222 20.97% 700 5.69%
Japan 1,758 14.65% 502 25.24% 1,683 18.70% ‐ ‐ 2,601 21.15%
Kazakhstan ‐ ‐ ‐ ‐ ‐ ‐ ‐ ‐ ‐ ‐
Korea , Republ ic of 3 0.03% 1 0.03% 9 0.10% ‐ ‐ 17 0.14%
Kuwait 200 1.67% 63 3.17% 63 0.70% ‐ ‐ 25 0.20%
Latvia ‐ ‐ ‐ ‐ ‐ ‐ ‐ ‐ ‐ ‐
Li thuania ‐ ‐ ‐ ‐ ‐ ‐ ‐ ‐ ‐ ‐
Luxembourg 7 0.05% 1 0.06% 5 0.05% ‐ ‐ 6 0.05%
Macedonia , Former Yugos 1 0.01% 0 0.01% 1 0.01% ‐ ‐ ‐ ‐
Malays ia ‐ ‐ ‐ ‐ ‐ ‐ ‐ ‐ ‐ ‐
Mexico 20 0.17% 1 0.07% 15 0.17% ‐ ‐ 20 0.16%
Netherlands 360 3.00% 86 4.31% 270 3.00% 170 16.11% 505 4.11%
New Zealand 10 0.08% 2 0.12% 10 0.11% ‐ ‐ 17 0.14%
Norway 144 1.20% 45 2.25% 114 1.27% 40 3.78% 163 1.33%
Oman ‐ ‐ ‐ ‐ ‐ ‐ ‐ ‐ ‐ ‐
Peru ‐ ‐ ‐ ‐ ‐ ‐ ‐ ‐ ‐ ‐
Phi l ippines ‐ ‐ ‐ ‐ ‐ ‐ ‐ ‐ ‐ ‐
Poland ‐ ‐ ‐ ‐ ‐ ‐ ‐ ‐ 15 0.12%
Portugal ‐ ‐ ‐ ‐ ‐ ‐ ‐ ‐ ‐ ‐
Russ ian Federation ‐ ‐ ‐ ‐ ‐ ‐ ‐ ‐ ‐ ‐
Saudi Arabia 420 3.50% 130 6.53% 315 3.50% ‐ ‐ 374 3.04%
Serbia 7 0.06% 1 0.05% 5 0.06% ‐ ‐ ‐ ‐
Singapore ‐ ‐ ‐ ‐ ‐ ‐ ‐ ‐ ‐ ‐
Slovak Republ ic ‐ ‐ ‐ ‐ ‐ ‐ ‐ ‐ ‐ ‐
Slovenia 3 0.03% 0 0.02% 2 0.03% ‐ ‐ ‐ ‐
South Africa 10 0.08% 2 0.12% 11 0.12% ‐ ‐ 9 0.07%
Spain 50 0.42% 10 0.49% 41 0.46% 14 1.30% 62 0.51%
Sweden 360 3.00% 81 4.07% 225 2.50% 70 6.66% 301 2.45%
Switzerland 36 0.30% ‐ ‐ 91 1.01% ‐ ‐ 205 1.67%
Thai land ‐ ‐ ‐ ‐ ‐ ‐ ‐ ‐ ‐ ‐
Turkey ‐ ‐ ‐ ‐ ‐ ‐ ‐ ‐ 11 0.09%
United Arab Emirates ‐ ‐ ‐ ‐ ‐ ‐ ‐ ‐ ‐ ‐
United Kingdom 1,212 10.10% 181 9.08% 603 6.70% ‐ ‐ 786 6.39%
United States 3,240 27.00% ‐ ‐ 2,250 25.00% 137 12.92% 2,875 23.38%
Total Donor contributions 11,809 98.41% 1,945 97.76% 8,760 97.33% 1,057 100.00% 12,295 100.00%
Acceleration
Financing gap and other 191 1.59% 45 2.24% 240 2.67% ‐ ‐ ‐ ‐
Agreed replenishment 12,000 100.00% 1,989 100.00% 9,000 100.00% 1,057 100.00% 12,295 100.00%
ID06 FY84 ID07 AFFA ID08

Historical Partner Grant Contributions to IDA (in USD millions) Annex | 8
53
Country
Total Share (%) Total Share (%) Total Share (%) Total Share (%) Total Share (%) Total Share (%)
Argentina ‐ ‐ ‐ ‐ 8 0.10% 5 0.10% ‐ ‐ ‐ ‐
Austra l ia 293 1.99% 266 1.48% 121 1.58% 82 1.80% 183 1.50% 185 1.46%
Austria 118 0.80% 168 0.90% 69 0.90% 46 1.00% 97 0.78% 102 0.78%
Bahamas , The ‐ ‐ ‐ ‐ ‐ ‐ ‐ ‐ ‐ ‐ ‐ ‐
Barbados ‐ ‐ ‐ ‐ ‐ ‐ ‐ ‐ 0 0.00% ‐ ‐
Belgium 240 1.63% 290 1.55% 119 1.55% 71 1.55% 192 1.55% 207 1.55%
Bosnia and Herzegovina ‐ ‐ ‐ ‐ ‐ ‐ ‐ ‐ ‐ ‐ ‐ ‐
Botswana ‐ ‐ ‐ ‐ 1 0.01% 1 0.01% ‐ ‐ ‐ ‐
Brazi l 13 0.09% 14 0.08% 102 1.33% 7 0.16% 117 0.95% 81 0.61%
Canada 699 4.75% 719 4.00% 288 3.75% 159 3.50% 463 3.75% 510 4.02%
Chi le ‐ ‐ ‐ ‐ ‐ ‐ ‐ ‐ ‐ ‐ ‐ ‐
China ‐ ‐ ‐ ‐ ‐ ‐ ‐ ‐ ‐ ‐ ‐ ‐
Colombia ‐ ‐ ‐ ‐ ‐ ‐ ‐ ‐ ‐ ‐ ‐ ‐
Croatia ‐ ‐ ‐ ‐ ‐ ‐ ‐ ‐ ‐ ‐ ‐ ‐
Cyprus ‐ ‐ ‐ ‐ ‐ ‐ ‐ ‐ ‐ ‐ ‐ ‐
Czech Republ i c 8 0.06% 10 0.05% 4 0.05% 2 0.05% 7 0.05% 7 0.05%
Denmark 191 1.30% 259 1.39% 136 1.78% 59 1.30% 195 1.58% 200 1.58%
Egypt, Arab Republ ic of ‐ ‐ ‐ ‐ ‐ ‐ ‐ ‐ ‐ ‐ ‐ ‐
Estonia ‐ ‐ ‐ ‐ ‐ ‐ ‐ ‐ ‐ ‐ ‐ ‐
Finland 177 1.20% 93 0.50% 38 0.50% 23 0.50% 74 0.60% 80 0.60%
France 1,118 7.60% 1,364 7.30% 560 7.30% 333 7.30% 902 7.29% 800 6.00%
Germany 1,691 11.49% 2,056 11.00% 844 11.00% 501 11.00% 1,360 10.99% 1,306 10.30%
Greece 8 0.05% 10 0.05% 4 0.05% 2 0.05% 14 0.12% 15 0.12%
Hungary 14 0.09% 14 0.08% 5 0.06% 3 0.07% 7 0.06% 8 0.06%
Iceland 5 0.03% 6 0.03% 2 0.03% 1 0.03% 5 0.04% 5 0.04%
India ‐ ‐ ‐ ‐ ‐ ‐ ‐ ‐ ‐ ‐ ‐ ‐
Indones ia ‐ ‐ ‐ ‐ ‐ ‐ ‐ ‐ ‐ ‐ ‐ ‐
Iran, Is lamic Republ ic of ‐ ‐ ‐ ‐ ‐ ‐ ‐ ‐ ‐ ‐ ‐ ‐
Ireland 18 0.12% 22 0.12% 14 0.19% 7 0.15% 30 0.24% 46 0.35%
Israel ‐ ‐ ‐ ‐ 1 0.01% ‐ ‐ 13 0.11% 13 0.10%
Ita ly 809 5.50% 953 5.30% 334 4.35% 183 4.02% 470 3.80% 482 3.80%
Japan 3,054 20.75% 3,738 20.00% 1,534 20.00% 911 20.00% 2,311 18.68% 2,134 16.00%
Kazakhstan ‐ ‐ ‐ ‐ ‐ ‐ ‐ ‐ ‐ ‐ ‐ ‐
Korea, Republ ic of 37 0.25% 53 0.28% 93 1.21% 14 0.30% 112 0.91% 121 0.91%
Kuwait 50 0.34% 26 0.14% 17 0.22% ‐ ‐ 17 0.14% 19 0.14%
Latvia ‐ ‐ ‐ ‐ ‐ ‐ ‐ ‐ ‐ ‐ ‐ ‐
Li thuania ‐ ‐ ‐ ‐ ‐ ‐ ‐ ‐ ‐ ‐ ‐ ‐
Luxembourg 7 0.05% 10 0.05% 9 0.12% 5 0.10% 12 0.10% 13 0.10%
Macedonia , Former Yugos ‐ ‐ ‐ ‐ ‐ ‐ ‐ ‐ ‐ ‐ ‐ ‐
Malays ia ‐ ‐ ‐ ‐ ‐ ‐ ‐ ‐ ‐ ‐ ‐ ‐
Mexico 25 0.17% 50 0.27% 8 0.10% 5 0.10% 6 0.05% 5 0.04%
Netherlands 486 3.30% 655 3.51% 253 3.30% 241 5.30% 321 2.60% 347 2.60%
New Zealand 21 0.15% 22 0.12% 14 0.18% 7 0.15% 18 0.15% 16 0.12%
Norway 209 1.42% 265 1.42% 111 1.45% 80 1.75% 176 1.42% 193 1.52%
Oman ‐ ‐ ‐ ‐ 1 0.01% ‐ ‐ ‐ ‐ ‐ ‐
Peru ‐ ‐ ‐ ‐ ‐ ‐ ‐ ‐ ‐ ‐ ‐ ‐
Phi l ippines ‐ ‐ ‐ ‐ ‐ ‐ ‐ ‐ ‐ ‐ ‐ ‐
Poland 5 0.03% 6 0.03% 2 0.03% 1 0.03% 4 0.03% 4 0.03%
Portugal 4 0.03% 22 0.12% 15 0.20% 9 0.20% 25 0.20% 27 0.20%
Russ ian Federation 126 0.86% 0 0.00% 26 0.34% 12 0.27% 4 0.03% 27 0.20%
Saudi Arabia 290 1.97% 156 0.83% 50 0.65% 25 0.55% 53 0.43% 53 0.39%
Serbia ‐ ‐ ‐ ‐ ‐ ‐ ‐ ‐ ‐ ‐ ‐ ‐
Singapore ‐ ‐ ‐ ‐ ‐ ‐ ‐ ‐ ‐ ‐ 19 0.14%
Slovak Republ i c 4 0.03% 0 0.00% 3 0.04% 2 0.03% 2 0.01% 2 0.01%
Slovenia ‐ ‐ ‐ ‐ ‐ ‐ ‐ ‐ ‐ ‐ ‐ ‐
South Afri ca 11 0.08% 14 0.08% 6 0.08% 4 0.08% 10 0.08% 11 0.08%
Spain 107 0.73% 150 0.80% 77 1.00% 46 1.00% 218 1.79% 250 1.80%
Sweden 423 2.87% 500 2.68% 201 2.62% 119 2.62% 324 2.62% 332 2.62%
Switzerland 227 1.54% 331 1.77% 186 2.43% 79 1.74% 299 2.43% 308 2.43%
Thai land ‐ ‐ ‐ ‐ ‐ ‐ ‐ ‐ ‐ ‐ ‐ ‐
Turkey 19 0.13% 36 0.19% 8 0.10% 3 0.07% 32 0.27% 11 0.09%
United Arab Emirates ‐ ‐ ‐ ‐ ‐ ‐ ‐ ‐ ‐ ‐ ‐ ‐
United Kingdom 986 6.70% 1,105 6.15% 472 6.15% 280 6.15% 902 7.29% 1,445 10.87%
United States 3,180 21.61% 3,898 20.86% 1,600 20.86% ‐ ‐ 2,578 20.84% 2,999 22.48%
Total Donor contributions 14,673 99.71% 17,283 93.12% 7,337 95.65% 3,328 73.04% 11,556 93.45% 12,383 94.20%
Acceleration 3.01% 6.45% 3.49%
Financing gap and other 43 0.29% 695 3.87% 334 4.35% 1,228 26.96% 12 0.10% 293 2.31%
Agreed replenishment 14,716 100.00% 17,978 100.00% 7,670 100.00% 4,556 100.00% 11,568 100.00% 12,676 100.00%
ID09 ID10 a/ ID11 ITF ID12 a/ ID13 a/

Historical Partner Grant Contributions to IDA (in USD millions) Annex | 8
54
Notes: SDR amounts are converted to USD based on the reference exchange rate of each replenishment. Total contributions include basic and supplemental contributions, contributions to debt relief and grant financing, grant element of concessional partner loans (if any), and credit accelerations (if any). The agreed replenishment is the total replenishment size as reported in Table 1 of each replenishment resolution, except where actual contributions exceeded the resolution total in which case the latter is used. Donors who joined a replenishment by filling the gap are shown in that replenishment with the cumulative contribution through that replenishment. Special contributions are recorded in the replenishment where they were committed. a/ Total burdenshare excludes acceleration b/ Contribution valued at 1960 USD 1 to USD 1.20635.
Country
Total Share (%) Total Share (%) Total Share (%) Total Share (%) Total Share (%) Total Share ( %)
Argentina ‐ ‐ ‐ ‐ 69 0.20% 7 0.02% ‐ ‐ 121 0.04%
Austra l ia 302 1.46% 556 1.79% 700 2.05% 625 1.78% 572 1.61% 4,969 1.78%
Austria 307 1.47% 472 1.52% 519 1.52% 528 1.49% 277 0.78% 3,084 1.10%
Bahamas, The ‐ ‐ ‐ ‐ 4 0.01% 4 0.01% ‐ ‐ 8 0.00%
Barbados 0 0.00% 1 0.00% 1 0.00% ‐ ‐ ‐ ‐ 2 0.00%
Belgium 321 1.55% 486 1.57% 534 1.56% 550 1.57% 551 1.55% 4,456 1.60%
Bosnia and Herzegovina ‐ ‐ ‐ ‐ ‐ ‐ ‐ ‐ ‐ ‐ 7 0.00%
Botswana ‐ ‐ ‐ ‐ ‐ ‐ ‐ ‐ ‐ ‐ 2 0.00%
Brazi l 126 0.61% 191 0.62% 101 0.30% 101 0.29% ‐ ‐ 966 0.35%
Canada 782 3.78% 1,240 4.00% 1,383 4.05% 1,375 3.92% 1,388 3.90% 11,836 4.24%
Chi le ‐ ‐ ‐ ‐ 35 0.10% ‐ ‐ ‐ ‐ 35 0.01%
China ‐ ‐ 31 0.10% 163 0.48% 301 0.86% ‐ ‐ 495 0.18%
Colombia ‐ ‐ ‐ ‐ ‐ ‐ ‐ ‐ ‐ ‐ 27 0.01%
Croatia ‐ ‐ ‐ ‐ ‐ ‐ ‐ ‐ ‐ ‐ 16 0.01%
Cyprus ‐ ‐ 6 0.02% 7 0.02% 7 0.02% 7 0.02% 27 0.01%
Czech Republ ic 10 0.05% 17 0.06% 19 0.05% 19 0.05% 18 0.05% 121 0.04%
Denmark 260 1.26% 339 1.09% 373 1.09% 384 1.09% 619 1.74% 3,697 1.32%
Egypt, Arab Republ i c of ‐ ‐ 2 0.01% 2 0.01% 2 0.01% ‐ ‐ 7 0.00%
Estonia ‐ ‐ 3 0.01% 4 0.01% 5 0.01% ‐ ‐ 13 0.00%
Finland 124 0.60% 281 0.91% 333 0.97% 346 0.99% 217 0.61% 2,144 0.77%
France 1,471 7.11% 2,012 6.50% 1,717 5.02% 1,724 4.91% 2,190 6.16% 17,745 6.36%
Germany 1,703 8.23% 2,213 7.14% 2,205 6.45% 2,125 6.05% 3,509 9.87% 25,612 9.17%
Greece 25 0.12% 71 0.23% ‐ ‐ ‐ ‐ 46 0.13% 212 0.08%
Hungary 13 0.06% 19 0.06% 21 0.06% 21 0.06% 21 0.06% 168 0.06%
Iceland 9 0.05% 12 0.04% 10 0.03% 11 0.03% 14 0.04% 95 0.03%
India ‐ ‐ ‐ ‐ ‐ ‐ 202 0.57% ‐ ‐ 202 0.07%
Indones ia ‐ ‐ ‐ ‐ ‐ ‐ 18 0.05% ‐ ‐ 18 0.01%
Iran, Is lamic Republ ic of ‐ ‐ ‐ ‐ 19 0.05% ‐ ‐ ‐ ‐ 19 0.01%
Ireland 85 0.41% 137 0.44% 117 0.34% 119 0.34% 71 0.20% 733 0.26%
Israel 15 0.07% 23 0.07% 25 0.07% ‐ ‐ ‐ ‐ 92 0.03%
Ita ly 786 3.80% 1,179 3.80% 806 2.36% 753 2.14% 1,405 3.95% 10,729 3.84%
Japan 2,721 12.24% 3,101 10.00% 3,719 10.87% 3,511 10.01% 4,681 13.17% 39,590 14.18%
Kazakhstan ‐ ‐ ‐ ‐ 3 0.01% 3 0.01% ‐ ‐ 7 0.00%
Korea, Republ i c of 193 0.91% 285 0.92% 342 1.00% 386 1.10% 324 0.91% 1,992 0.71%
Kuwait 29 0.14% 53 0.17% 79 0.23% 62 0.18% 53 0.15% 1,012 0.36%
Latvia ‐ ‐ 3 0.01% 3 0.01% 4 0.01% 4 0.01% 14 0.00%
Li thuania ‐ ‐ 3 0.01% 3 0.01% 3 0.01% ‐ ‐ 10 0.00%
Luxembourg 35 0.17% 57 0.18% 64 0.19% 67 0.19% 39 0.11% 345 0.12%
Macedonia, Former Yugos ‐ ‐ ‐ ‐ ‐ ‐ ‐ ‐ ‐ ‐ 3 0.00%
Malays ia ‐ ‐ ‐ ‐ ‐ ‐ 27 0.08% ‐ ‐ 27 0.01%
Mexico 10 0.05% 16 0.05% 101 0.29% 102 0.29% ‐ ‐ 384 0.14%
Netherlands 574 2.78% 926 2.99% 1,023 2.99% 988 2.81% 1,020 2.87% 8,754 3.14%
New Zealand 26 0.12% 38 0.12% 41 0.12% 43 0.12% 46 0.13% 358 0.13%
Norway 459 2.22% 460 1.48% 457 1.34% 532 1.51% 597 1.68% 4,240 1.52%
Oman ‐ ‐ ‐ ‐ ‐ ‐ ‐ ‐ ‐ ‐ 1 0.00%
Peru ‐ ‐ ‐ ‐ 16 0.05% ‐ ‐ ‐ ‐ 16 0.01%
Phi l ippines ‐ ‐ ‐ ‐ 11 0.03% 5 0.01% ‐ ‐ 17 0.01%
Poland 6 0.03% 9 0.03% 10 0.03% 11 0.03% 11 0.03% 85 0.03%
Portugal 42 0.20% 63 0.20% 30 0.09% 13 0.04% 78 0.22% 328 0.12%
Russ ian Federation 59 0.28% 109 0.35% 176 0.51% 193 0.55% 32 0.09% 764 0.27%
Saudi Arabia 50 0.24% 75 0.24% 112 0.33% 118 0.34% 139 0.39% 2,709 0.97%
Serbia ‐ ‐ ‐ ‐ ‐ ‐ ‐ ‐ 20 0.01%
Singapore 18 0.09% 25 0.08% 50 0.15% 53 0.15% 50 0.14% 214 0.08%
Slovak Republ ic 3 0.01% 3 0.01% 3 0.01% 4 0.01% 4 0.01% 29 0.01%
Slovenia 6 0.03% 9 0.03% 9 0.03% 5 0.01% 11 0.03% 48 0.02%
South Africa 17 0.08% 32 0.10% 35 0.10% 30 0.09% 32 0.09% 278 0.10%
Spain 474 2.17% 972 3.14% 1,036 3.03% 386 1.10% 707 1.99% 4,648 1.66%
Sweden 867 4.10% 1,021 3.29% 1,011 2.95% 1,214 3.46% 1,027 2.89% 8,801 3.15%
Switzerland 472 2.28% 651 2.10% 718 2.10% 808 2.30% 866 2.44% 5,350 1.92%
Thai land ‐ ‐ ‐ ‐ ‐ ‐ 5 0.01% ‐ ‐ 5 0.00%
Turkey 13 0.06% 16 0.05% 20 0.06% 41 0.12% ‐ ‐ 210 0.08%
United Arab Emirates ‐ ‐ ‐ ‐ ‐ ‐ ‐ ‐ 5 0.00%
United Kingdom 2,726 13.18% 4,681 15.07% 4,106 12.00% 4,565 13.00% 4,915 13.83% 31,117 11.15%
United States 2,850 13.78% 3,779 12.19% 4,131 12.08% 3,909.68 11.13% 7,217 20.31% 51,045 18.28%
Total Donor contributions 17,989 85.81% 25,679 82.80% 26,475 77.41% 26,314 74.93% 32,759 92.16% 250,081 89.58%
Acceleration 1.17% 1.62% 1.05% 0.71% ‐
Financing gap and other 2,692 13.02% 4,724 15.58% 7,269 21.54% 8,475 24.36% 2,790 7.84% 29,096 10.42%
Agreed replenishment 20,681 100.00% 30,403 100.00% 33,744 100.00% 34,789 100.00% 35,549 100.00% 279,176 100.00%
ID14 a/ ID15 a/ ID16 a/ ID17 a/ MDRI Total resources
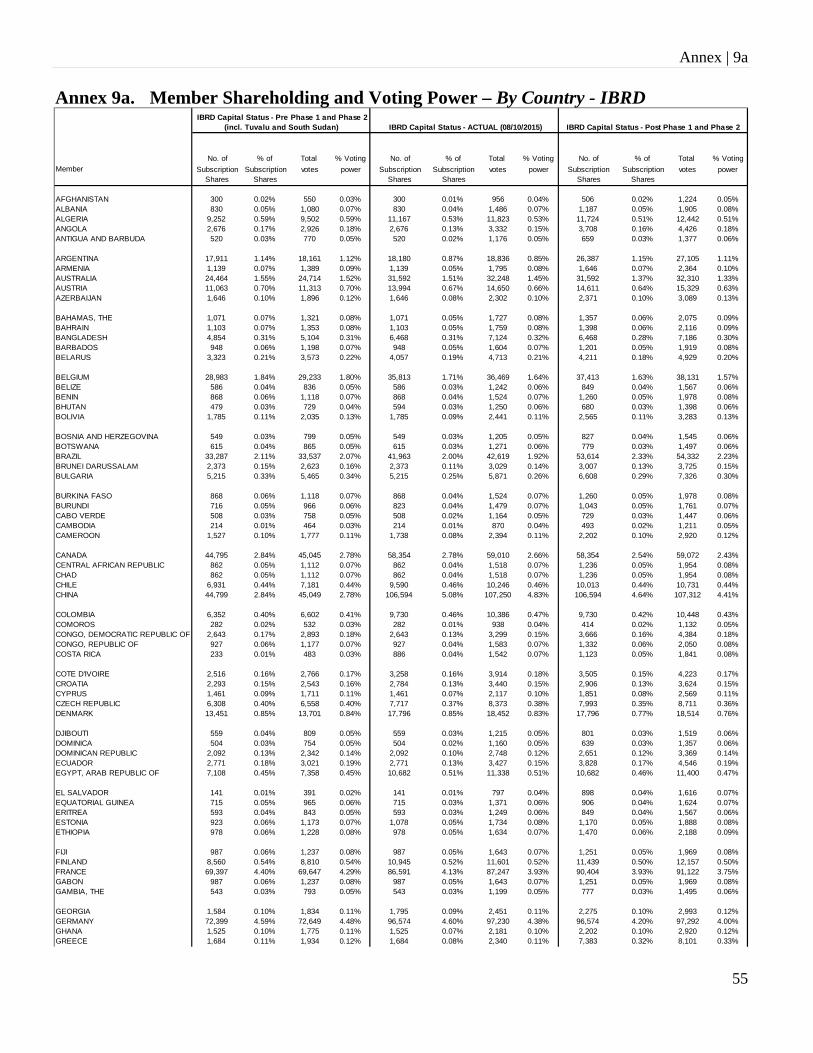
Annex | 9a
55
Annex 9a. Member Shareholding and Voting Power – By Country - IBRD
No. of % of Total % Voting No. of % of Total % Voting No. of % of Total % VotingMember Subscription Subscription votes power Subscription Subscription votes power Subscription Subscription votes power
Shares Shares Shares Shares Shares Shares
AFGHANISTAN 300 0.02% 550 0.03% 300 0.01% 956 0.04% 506 0.02% 1,224 0.05%ALBANIA 830 0.05% 1,080 0.07% 830 0.04% 1,486 0.07% 1,187 0.05% 1,905 0.08%ALGERIA 9,252 0.59% 9,502 0.59% 11,167 0.53% 11,823 0.53% 11,724 0.51% 12,442 0.51%ANGOLA 2,676 0.17% 2,926 0.18% 2,676 0.13% 3,332 0.15% 3,708 0.16% 4,426 0.18%ANTIGUA AND BARBUDA 520 0.03% 770 0.05% 520 0.02% 1,176 0.05% 659 0.03% 1,377 0.06%
ARGENTINA 17,911 1.14% 18,161 1.12% 18,180 0.87% 18,836 0.85% 26,387 1.15% 27,105 1.11%ARMENIA 1,139 0.07% 1,389 0.09% 1,139 0.05% 1,795 0.08% 1,646 0.07% 2,364 0.10%AUSTRALIA 24,464 1.55% 24,714 1.52% 31,592 1.51% 32,248 1.45% 31,592 1.37% 32,310 1.33%AUSTRIA 11,063 0.70% 11,313 0.70% 13,994 0.67% 14,650 0.66% 14,611 0.64% 15,329 0.63%AZERBAIJAN 1,646 0.10% 1,896 0.12% 1,646 0.08% 2,302 0.10% 2,371 0.10% 3,089 0.13%
BAHAMAS, THE 1,071 0.07% 1,321 0.08% 1,071 0.05% 1,727 0.08% 1,357 0.06% 2,075 0.09%BAHRAIN 1,103 0.07% 1,353 0.08% 1,103 0.05% 1,759 0.08% 1,398 0.06% 2,116 0.09%BANGLADESH 4,854 0.31% 5,104 0.31% 6,468 0.31% 7,124 0.32% 6,468 0.28% 7,186 0.30%BARBADOS 948 0.06% 1,198 0.07% 948 0.05% 1,604 0.07% 1,201 0.05% 1,919 0.08%BELARUS 3,323 0.21% 3,573 0.22% 4,057 0.19% 4,713 0.21% 4,211 0.18% 4,929 0.20%
BELGIUM 28,983 1.84% 29,233 1.80% 35,813 1.71% 36,469 1.64% 37,413 1.63% 38,131 1.57%BELIZE 586 0.04% 836 0.05% 586 0.03% 1,242 0.06% 849 0.04% 1,567 0.06%BENIN 868 0.06% 1,118 0.07% 868 0.04% 1,524 0.07% 1,260 0.05% 1,978 0.08%BHUTAN 479 0.03% 729 0.04% 594 0.03% 1,250 0.06% 680 0.03% 1,398 0.06%BOLIVIA 1,785 0.11% 2,035 0.13% 1,785 0.09% 2,441 0.11% 2,565 0.11% 3,283 0.13%
BOSNIA AND HERZEGOVINA 549 0.03% 799 0.05% 549 0.03% 1,205 0.05% 827 0.04% 1,545 0.06%BOTSWANA 615 0.04% 865 0.05% 615 0.03% 1,271 0.06% 779 0.03% 1,497 0.06%BRAZIL 33,287 2.11% 33,537 2.07% 41,963 2.00% 42,619 1.92% 53,614 2.33% 54,332 2.23%BRUNEI DARUSSALAM 2,373 0.15% 2,623 0.16% 2,373 0.11% 3,029 0.14% 3,007 0.13% 3,725 0.15%BULGARIA 5,215 0.33% 5,465 0.34% 5,215 0.25% 5,871 0.26% 6,608 0.29% 7,326 0.30%
BURKINA FASO 868 0.06% 1,118 0.07% 868 0.04% 1,524 0.07% 1,260 0.05% 1,978 0.08%BURUNDI 716 0.05% 966 0.06% 823 0.04% 1,479 0.07% 1,043 0.05% 1,761 0.07%CABO VERDE 508 0.03% 758 0.05% 508 0.02% 1,164 0.05% 729 0.03% 1,447 0.06%CAMBODIA 214 0.01% 464 0.03% 214 0.01% 870 0.04% 493 0.02% 1,211 0.05%CAMEROON 1,527 0.10% 1,777 0.11% 1,738 0.08% 2,394 0.11% 2,202 0.10% 2,920 0.12%
CANADA 44,795 2.84% 45,045 2.78% 58,354 2.78% 59,010 2.66% 58,354 2.54% 59,072 2.43%CENTRAL AFRICAN REPUBLIC 862 0.05% 1,112 0.07% 862 0.04% 1,518 0.07% 1,236 0.05% 1,954 0.08%CHAD 862 0.05% 1,112 0.07% 862 0.04% 1,518 0.07% 1,236 0.05% 1,954 0.08%CHILE 6,931 0.44% 7,181 0.44% 9,590 0.46% 10,246 0.46% 10,013 0.44% 10,731 0.44%CHINA 44,799 2.84% 45,049 2.78% 106,594 5.08% 107,250 4.83% 106,594 4.64% 107,312 4.41%
COLOMBIA 6,352 0.40% 6,602 0.41% 9,730 0.46% 10,386 0.47% 9,730 0.42% 10,448 0.43%COMOROS 282 0.02% 532 0.03% 282 0.01% 938 0.04% 414 0.02% 1,132 0.05%CONGO, DEMOCRATIC REPUBLIC OF 2,643 0.17% 2,893 0.18% 2,643 0.13% 3,299 0.15% 3,666 0.16% 4,384 0.18%CONGO, REPUBLIC OF 927 0.06% 1,177 0.07% 927 0.04% 1,583 0.07% 1,332 0.06% 2,050 0.08%COSTA RICA 233 0.01% 483 0.03% 886 0.04% 1,542 0.07% 1,123 0.05% 1,841 0.08%
COTE D'IVOIRE 2,516 0.16% 2,766 0.17% 3,258 0.16% 3,914 0.18% 3,505 0.15% 4,223 0.17%CROATIA 2,293 0.15% 2,543 0.16% 2,784 0.13% 3,440 0.15% 2,906 0.13% 3,624 0.15%CYPRUS 1,461 0.09% 1,711 0.11% 1,461 0.07% 2,117 0.10% 1,851 0.08% 2,569 0.11%CZECH REPUBLIC 6,308 0.40% 6,558 0.40% 7,717 0.37% 8,373 0.38% 7,993 0.35% 8,711 0.36%DENMARK 13,451 0.85% 13,701 0.84% 17,796 0.85% 18,452 0.83% 17,796 0.77% 18,514 0.76%
DJIBOUTI 559 0.04% 809 0.05% 559 0.03% 1,215 0.05% 801 0.03% 1,519 0.06%DOMINICA 504 0.03% 754 0.05% 504 0.02% 1,160 0.05% 639 0.03% 1,357 0.06%DOMINICAN REPUBLIC 2,092 0.13% 2,342 0.14% 2,092 0.10% 2,748 0.12% 2,651 0.12% 3,369 0.14%ECUADOR 2,771 0.18% 3,021 0.19% 2,771 0.13% 3,427 0.15% 3,828 0.17% 4,546 0.19%EGYPT, ARAB REPUBLIC OF 7,108 0.45% 7,358 0.45% 10,682 0.51% 11,338 0.51% 10,682 0.46% 11,400 0.47%
EL SALVADOR 141 0.01% 391 0.02% 141 0.01% 797 0.04% 898 0.04% 1,616 0.07%EQUATORIAL GUINEA 715 0.05% 965 0.06% 715 0.03% 1,371 0.06% 906 0.04% 1,624 0.07%ERITREA 593 0.04% 843 0.05% 593 0.03% 1,249 0.06% 849 0.04% 1,567 0.06%ESTONIA 923 0.06% 1,173 0.07% 1,078 0.05% 1,734 0.08% 1,170 0.05% 1,888 0.08%ETHIOPIA 978 0.06% 1,228 0.08% 978 0.05% 1,634 0.07% 1,470 0.06% 2,188 0.09%
FIJI 987 0.06% 1,237 0.08% 987 0.05% 1,643 0.07% 1,251 0.05% 1,969 0.08%FINLAND 8,560 0.54% 8,810 0.54% 10,945 0.52% 11,601 0.52% 11,439 0.50% 12,157 0.50%FRANCE 69,397 4.40% 69,647 4.29% 86,591 4.13% 87,247 3.93% 90,404 3.93% 91,122 3.75%GABON 987 0.06% 1,237 0.08% 987 0.05% 1,643 0.07% 1,251 0.05% 1,969 0.08%GAMBIA, THE 543 0.03% 793 0.05% 543 0.03% 1,199 0.05% 777 0.03% 1,495 0.06%
GEORGIA 1,584 0.10% 1,834 0.11% 1,795 0.09% 2,451 0.11% 2,275 0.10% 2,993 0.12%GERMANY 72,399 4.59% 72,649 4.48% 96,574 4.60% 97,230 4.38% 96,574 4.20% 97,292 4.00%GHANA 1,525 0.10% 1,775 0.11% 1,525 0.07% 2,181 0.10% 2,202 0.10% 2,920 0.12%GREECE 1,684 0.11% 1,934 0.12% 1,684 0.08% 2,340 0.11% 7,383 0.32% 8,101 0.33%
IBRD Capital Status - Pre Phase 1 and Phase 2(incl. Tuvalu and South Sudan) IBRD Capital Status - Post Phase 1 and Phase 2 IBRD Capital Status - ACTUAL (08/10/2015)

Annex | 9a
56
No. of % of Total % Voting No. of % of Total % Voting No. of % of Total % VotingMember Subscription Subscription votes power Subscription Subscription votes power Subscription Subscription votes power
Shares Shares Shares Shares Shares Shares
GUATEMALA 2,001 0.13% 2,251 0.14% 2,001 0.10% 2,657 0.12% 2,852 0.12% 3,570 0.15%GUINEA 1,292 0.08% 1,542 0.09% 1,292 0.06% 1,948 0.09% 1,864 0.08% 2,582 0.11%GUINEA-BISSAU 540 0.03% 790 0.05% 540 0.03% 1,196 0.05% 777 0.03% 1,495 0.06%GUYANA 1,058 0.07% 1,308 0.08% 1,456 0.07% 2,112 0.10% 1,526 0.07% 2,244 0.09%HAITI 1,067 0.07% 1,317 0.08% 1,067 0.05% 1,723 0.08% 1,550 0.07% 2,268 0.09%
HONDURAS 641 0.04% 891 0.05% 641 0.03% 1,297 0.06% 921 0.04% 1,639 0.07%HUNGARY 8,050 0.51% 8,300 0.51% 10,337 0.49% 10,993 0.49% 10,793 0.47% 11,511 0.47%ICELAND 1,258 0.08% 1,508 0.09% 1,500 0.07% 2,156 0.10% 1,742 0.08% 2,460 0.10%INDIA 44,795 2.84% 45,045 2.78% 67,040 3.19% 67,696 3.05% 69,923 3.04% 70,641 2.90%INDONESIA 14,981 0.95% 15,231 0.94% 21,064 1.00% 21,720 0.98% 23,031 1.00% 23,749 0.98%
IRAN, ISLAMIC REPUBLIC OF 23,686 1.50% 23,936 1.47% 34,943 1.66% 35,599 1.60% 34,967 1.52% 35,685 1.47%IRAQ 2,808 0.18% 3,058 0.19% 2,808 0.13% 3,464 0.16% 3,875 0.17% 4,593 0.19%IRELAND 5,271 0.33% 5,521 0.34% 6,970 0.33% 7,626 0.34% 7,787 0.34% 8,505 0.35%ISRAEL 4,750 0.30% 5,000 0.31% 6,019 0.29% 6,675 0.30% 6,019 0.26% 6,737 0.28%ITALY 44,795 2.84% 45,045 2.78% 54,227 2.58% 54,883 2.47% 63,372 2.76% 64,090 2.63%
JAMAICA 2,578 0.16% 2,828 0.17% 2,715 0.13% 3,371 0.15% 3,267 0.14% 3,985 0.16%JAPAN 127,000 8.06% 127,250 7.84% 165,444 7.88% 166,100 7.47% 165,444 7.20% 166,162 6.83%JORDAN 1,388 0.09% 1,638 0.10% 2,009 0.10% 2,665 0.12% 2,009 0.09% 2,727 0.11%KAZAKHSTAN 2,985 0.19% 3,235 0.20% 2,985 0.14% 3,641 0.16% 4,573 0.20% 5,291 0.22%KENYA 2,461 0.16% 2,711 0.17% 2,711 0.13% 3,367 0.15% 3,435 0.15% 4,153 0.17%
KIRIBATI 465 0.03% 715 0.04% 465 0.02% 1,121 0.05% 680 0.03% 1,398 0.06%KOREA, REPUBLIC OF 15,817 1.00% 16,067 0.99% 35,941 1.71% 36,597 1.65% 37,524 1.63% 38,242 1.57%KOSOVO 966 0.06% 1,216 0.07% 966 0.05% 1,622 0.07% 1,405 0.06% 2,123 0.09%KUWAIT 13,280 0.84% 13,530 0.83% 15,335 0.73% 15,991 0.72% 19,432 0.85% 20,150 0.83%KYRGYZ REPUBLIC 1,107 0.07% 1,357 0.08% 1,107 0.05% 1,763 0.08% 1,598 0.07% 2,316 0.10%
LAO PEOPLE'S DEMOCRATIC REPUBL 178 0.01% 428 0.03% 272 0.01% 928 0.04% 272 0.01% 990 0.04%LATVIA 1,384 0.09% 1,634 0.10% 1,661 0.08% 2,317 0.10% 1,754 0.08% 2,472 0.10%LEBANON 340 0.02% 590 0.04% 340 0.02% 996 0.04% 1,062 0.05% 1,780 0.07%LESOTHO 663 0.04% 913 0.06% 663 0.03% 1,319 0.06% 945 0.04% 1,663 0.07%LIBERIA 463 0.03% 713 0.04% 463 0.02% 1,119 0.05% 680 0.03% 1,398 0.06%
LIBYA 7,840 0.50% 8,090 0.50% 7,840 0.37% 8,496 0.38% 9,935 0.43% 10,653 0.44%LITHUANIA 1,507 0.10% 1,757 0.11% 1,507 0.07% 2,163 0.10% 1,910 0.08% 2,628 0.11%LUXEMBOURG 1,652 0.10% 1,902 0.12% 1,652 0.08% 2,308 0.10% 2,289 0.10% 3,007 0.12%MACEDONIA, FORMER YUGOSLAV RE 427 0.03% 677 0.04% 427 0.02% 1,083 0.05% 541 0.02% 1,259 0.05%MADAGASCAR 1,422 0.09% 1,672 0.10% 1,422 0.07% 2,078 0.09% 2,057 0.09% 2,775 0.11%
MALAWI 1,094 0.07% 1,344 0.08% 1,094 0.05% 1,750 0.08% 1,574 0.07% 2,292 0.09%MALAYSIA 8,244 0.52% 8,494 0.52% 9,786 0.47% 10,442 0.47% 10,447 0.45% 11,165 0.46%MALDIVES 469 0.03% 719 0.04% 469 0.02% 1,125 0.05% 680 0.03% 1,398 0.06%MALI 1,162 0.07% 1,412 0.09% 1,162 0.06% 1,818 0.08% 1,670 0.07% 2,388 0.10%MALTA 1,074 0.07% 1,324 0.08% 1,074 0.05% 1,730 0.08% 1,361 0.06% 2,079 0.09%
MARSHALL ISLANDS 469 0.03% 719 0.04% 469 0.02% 1,125 0.05% 680 0.03% 1,398 0.06%MAURITANIA 900 0.06% 1,150 0.07% 900 0.04% 1,556 0.07% 1,308 0.06% 2,026 0.08%MAURITIUS 1,242 0.08% 1,492 0.09% 1,242 0.06% 1,898 0.09% 1,574 0.07% 2,292 0.09%MEXICO 18,804 1.19% 19,054 1.17% 19,098 0.91% 19,754 0.89% 40,119 1.75% 40,837 1.68%MICRONESIA, FEDERATED STATES O 479 0.03% 729 0.04% 479 0.02% 1,135 0.05% 680 0.03% 1,398 0.06%
MOLDOVA 1,368 0.09% 1,618 0.10% 1,368 0.07% 2,024 0.09% 1,984 0.09% 2,702 0.11%MONGOLIA 466 0.03% 716 0.04% 466 0.02% 1,122 0.05% 680 0.03% 1,398 0.06%MONTENEGRO 688 0.04% 938 0.06% 688 0.03% 1,344 0.06% 872 0.04% 1,590 0.07%MOROCCO 4,973 0.32% 5,223 0.32% 6,619 0.32% 7,275 0.33% 6,619 0.29% 7,337 0.30%MOZAMBIQUE 930 0.06% 1,180 0.07% 1,051 0.05% 1,707 0.08% 1,332 0.06% 2,050 0.08%
MYANMAR 2,484 0.16% 2,734 0.17% 2,734 0.13% 3,390 0.15% 3,465 0.15% 4,183 0.17%NAMIBIA 1,523 0.10% 1,773 0.11% 1,523 0.07% 2,179 0.10% 1,930 0.08% 2,648 0.11%NEPAL 968 0.06% 1,218 0.08% 968 0.05% 1,624 0.07% 1,405 0.06% 2,123 0.09%NETHERLANDS 35,503 2.25% 35,753 2.20% 41,698 1.99% 42,354 1.91% 45,829 1.99% 46,547 1.91%NEW ZEALAND 7,236 0.46% 7,486 0.46% 9,761 0.47% 10,417 0.47% 9,761 0.42% 10,479 0.43%
NICARAGUA 608 0.04% 858 0.05% 827 0.04% 1,483 0.07% 873 0.04% 1,591 0.07%NIGER 852 0.05% 1,102 0.07% 852 0.04% 1,508 0.07% 1,236 0.05% 1,954 0.08%NIGERIA 12,655 0.80% 12,905 0.80% 12,774 0.61% 13,430 0.60% 16,187 0.70% 16,905 0.69%NORWAY 9,982 0.63% 10,232 0.63% 13,418 0.64% 14,074 0.63% 13,418 0.58% 14,136 0.58%OMAN 1,561 0.10% 1,811 0.11% 1,561 0.07% 2,217 0.10% 1,978 0.09% 2,696 0.11%
PAKISTAN 9,339 0.59% 9,589 0.59% 11,834 0.56% 12,490 0.56% 11,834 0.52% 12,552 0.52%PALAU 16 0.00% 266 0.02% 16 0.00% 672 0.03% 20 0.00% 738 0.03%PANAMA 385 0.02% 635 0.04% 385 0.02% 1,041 0.05% 891 0.04% 1,609 0.07%PAPUA NEW GUINEA 1,294 0.08% 1,544 0.10% 1,294 0.06% 1,950 0.09% 1,864 0.08% 2,582 0.11%PARAGUAY 1,229 0.08% 1,479 0.09% 1,229 0.06% 1,885 0.08% 1,766 0.08% 2,484 0.10%
IBRD Capital Status - Pre Phase 1 and Phase 2(incl. Tuvalu and South Sudan) IBRD Capital Status - Post Phase 1 and Phase 2 IBRD Capital Status - ACTUAL (08/10/2015)

Annex | 9a
57
No. of % of Total % Voting No. of % of Total % Voting No. of % of Total % VotingMember Subscription Subscription votes power Subscription Subscription votes power Subscription Subscription votes power
Shares Shares Shares Shares Shares Shares
PERU 5,331 0.34% 5,581 0.34% 7,365 0.35% 8,021 0.36% 7,691 0.33% 8,409 0.35%PHILIPPINES 6,844 0.43% 7,094 0.44% 9,484 0.45% 10,140 0.46% 9,903 0.43% 10,621 0.44%POLAND 10,908 0.69% 11,158 0.69% 13,517 0.64% 14,173 0.64% 17,129 0.75% 17,847 0.73%PORTUGAL 5,460 0.35% 5,710 0.35% 5,460 0.26% 6,116 0.28% 7,511 0.33% 8,229 0.34%QATAR 1,096 0.07% 1,346 0.08% 1,389 0.07% 2,045 0.09% 1,389 0.06% 2,107 0.09%
ROMANIA 4,011 0.25% 4,261 0.26% 5,418 0.26% 6,074 0.27% 6,866 0.30% 7,584 0.31%RUSSIAN FEDERATION 44,795 2.84% 45,045 2.78% 62,153 2.96% 62,809 2.83% 66,505 2.89% 67,223 2.76%RWANDA 1,046 0.07% 1,296 0.08% 1,046 0.05% 1,702 0.08% 1,502 0.07% 2,220 0.09%SAMOA 531 0.03% 781 0.05% 695 0.03% 1,351 0.06% 777 0.03% 1,495 0.06%SAN MARINO 595 0.04% 845 0.05% 595 0.03% 1,251 0.06% 754 0.03% 1,472 0.06%
SAO TOME AND PRINCIPE 495 0.03% 745 0.05% 495 0.02% 1,151 0.05% 705 0.03% 1,423 0.06%SAUDI ARABIA 44,795 2.84% 45,045 2.78% 66,505 3.17% 67,161 3.02% 66,505 2.89% 67,223 2.76%SENEGAL 2,072 0.13% 2,322 0.14% 2,072 0.10% 2,728 0.12% 2,942 0.13% 3,660 0.15%SERBIA 2,846 0.18% 3,096 0.19% 2,846 0.14% 3,502 0.16% 3,606 0.16% 4,324 0.18%SEYCHELLES 263 0.02% 513 0.03% 263 0.01% 919 0.04% 333 0.01% 1,051 0.04%
SIERRA LEONE 718 0.05% 968 0.06% 823 0.04% 1,479 0.07% 1,043 0.05% 1,761 0.07%SINGAPORE 320 0.02% 570 0.04% 5,569 0.27% 6,225 0.28% 6,105 0.27% 6,823 0.28%SLOVAK REPUBLIC 3,216 0.20% 3,466 0.21% 3,216 0.15% 3,872 0.17% 4,075 0.18% 4,793 0.20%SLOVENIA 1,261 0.08% 1,511 0.09% 1,623 0.08% 2,279 0.10% 1,709 0.07% 2,427 0.10%SOLOMON ISLANDS 513 0.03% 763 0.05% 513 0.02% 1,169 0.05% 729 0.03% 1,447 0.06%
SOMALIA 552 0.04% 802 0.05% 552 0.03% 1,208 0.05% 801 0.03% 1,519 0.06%SOUTH AFRICA 13,462 0.85% 13,712 0.84% 17,079 0.81% 17,735 0.80% 17,831 0.78% 18,549 0.76%SOUTH SUDAN 1,437 0.09% 1,687 0.10% 1,437 0.07% 2,093 0.09% 1,821 0.08% 2,539 0.10%SPAIN 27,997 1.78% 28,247 1.74% 44,159 2.10% 44,815 2.02% 44,159 1.92% 44,877 1.84%SRI LANKA 3,817 0.24% 4,067 0.25% 3,817 0.18% 4,473 0.20% 5,154 0.22% 5,872 0.24%
ST. KITTS AND NEVIS 275 0.02% 525 0.03% 275 0.01% 931 0.04% 348 0.02% 1,066 0.04%ST. LUCIA 552 0.04% 802 0.05% 552 0.03% 1,208 0.05% 699 0.03% 1,417 0.06%ST. VINCENT AND THE GRENADINES 278 0.02% 528 0.03% 278 0.01% 934 0.04% 352 0.02% 1,070 0.04%SUDAN 850 0.05% 1,100 0.07% 850 0.04% 1,506 0.07% 1,989 0.09% 2,707 0.11%SURINAME 412 0.03% 662 0.04% 412 0.02% 1,068 0.05% 522 0.02% 1,240 0.05%
SWAZILAND 440 0.03% 690 0.04% 440 0.02% 1,096 0.05% 632 0.03% 1,350 0.06%SWEDEN 14,974 0.95% 15,224 0.94% 18,996 0.91% 19,652 0.88% 19,833 0.86% 20,551 0.84%SWITZERLAND 26,606 1.69% 26,856 1.65% 34,660 1.65% 35,316 1.59% 34,660 1.51% 35,378 1.45%SYRIAN ARAB REPUBLIC 2,202 0.14% 2,452 0.15% 2,202 0.10% 2,858 0.13% 3,107 0.14% 3,825 0.16%TAJIKISTAN 1,060 0.07% 1,310 0.08% 1,060 0.05% 1,716 0.08% 1,526 0.07% 2,244 0.09%
TANZANIA 1,295 0.08% 1,545 0.10% 1,295 0.06% 1,951 0.09% 1,864 0.08% 2,582 0.11%THAILAND 6,349 0.40% 6,599 0.41% 10,171 0.48% 10,827 0.49% 11,108 0.48% 11,826 0.49%TIMOR-LESTE 517 0.03% 767 0.05% 517 0.02% 1,173 0.05% 753 0.03% 1,471 0.06%TOGO 1,105 0.07% 1,355 0.08% 1,105 0.05% 1,761 0.08% 1,598 0.07% 2,316 0.10%TONGA 494 0.03% 744 0.05% 494 0.02% 1,150 0.05% 705 0.03% 1,423 0.06%
TRINIDAD AND TOBAGO 2,664 0.17% 2,914 0.18% 2,664 0.13% 3,320 0.15% 3,376 0.15% 4,094 0.17%TUNISIA 719 0.05% 969 0.06% 719 0.03% 1,375 0.06% 1,693 0.07% 2,411 0.10%TURKEY 8,328 0.53% 8,578 0.53% 25,643 1.22% 26,299 1.18% 25,643 1.12% 26,361 1.08%TURKMENISTAN 526 0.03% 776 0.05% 526 0.03% 1,182 0.05% 795 0.03% 1,513 0.06%TUVALU 461 0.03% 711 0.04% 461 0.02% 1,117 0.05% 461 0.02% 1,179 0.05%
UGANDA 617 0.04% 867 0.05% 617 0.03% 1,273 0.06% 928 0.04% 1,646 0.07%UKRAINE 10,908 0.69% 11,158 0.69% 10,977 0.52% 11,633 0.52% 13,910 0.61% 14,628 0.60%UNITED ARAB EMIRATES 2,385 0.15% 2,635 0.16% 4,216 0.20% 4,872 0.22% 5,342 0.23% 6,060 0.25%UNITED KINGDOM 69,397 4.40% 69,647 4.29% 86,591 4.13% 87,247 3.93% 90,404 3.93% 91,122 3.75%UNITED STATES 264,969 16.81% 265,219 16.34% 357,848 17.05% 358,504 16.13% 384,502 16.73% 385,220 15.83%
URUGUAY 2,812 0.18% 3,062 0.19% 3,313 0.16% 3,969 0.18% 3,563 0.16% 4,281 0.18%UZBEKISTAN 2,493 0.16% 2,743 0.17% 2,493 0.12% 3,149 0.14% 3,476 0.15% 4,194 0.17%VANUATU 586 0.04% 836 0.05% 586 0.03% 1,242 0.06% 849 0.04% 1,567 0.06%VENEZUELA, REPUBLICA BOLIVARIAN 20,361 1.29% 20,611 1.27% 20,361 0.97% 21,017 0.95% 25,892 1.13% 26,610 1.09%VIETNAM 968 0.06% 1,218 0.08% 968 0.05% 1,624 0.07% 4,173 0.18% 4,891 0.20%
YEMEN, REPUBLIC OF 2,212 0.14% 2,462 0.15% 2,212 0.11% 2,868 0.13% 3,120 0.14% 3,838 0.16%ZAMBIA 2,810 0.18% 3,060 0.19% 2,810 0.13% 3,466 0.16% 3,878 0.17% 4,596 0.19%ZIMBABWE 3,325 0.21% 3,575 0.22% 3,575 0.17% 4,231 0.19% 4,530 0.20% 5,248 0.22%
TOTAL 1,576,213 100.00% 1,623,213 100.00% 2,098,871 100.00% 2,222,199 100.00% 2,297,851 100.00% 2,432,835 100.00%
DEVELOPED MEMBER TOTALS 923,702 58.60% 930,202 57.31% 1,203,802 57.35% 1,220,858 54.94% 1,264,901 55.05% 1,283,569 52.76%
DTC GROUP TOTAL 652,511 41.40% 693,011 42.69% 895,069 42.65% 1,001,341 45.06% 1,032,950 44.95% 1,149,266 47.24%
IBRD Capital Status - Pre Phase 1 and Phase 2(incl. Tuvalu and South Sudan) IBRD Capital Status - Post Phase 1 and Phase 2 IBRD Capital Status - ACTUAL (08/10/2015)

Annex | 9b
58
Annex 9b. Member Shareholding and Voting Power – By Constituency - IBRD
No. of % of Total % Voting No. of % of Total % Voting No. of % of Total % Voting Subscription Subscription votes power Subscription Subscription votes power Subscription Subscription votes power
ED Country ED Name Shares Shares Shares Shares Shares Shares
EDS01 (United States) MCGUIRE 264,969 16.81% 265,219 16.34% 357,848 17.05% 358,504 16.13% 384,502 16.73% 385,220 15.83%
EDS02 (Japan) KAN 127,000 8.06% 127,250 7.84% 165,444 7.88% 166,100 7.47% 165,444 7.20% 166,162 6.83%
EDS03 (United Kingdom) VACANT 69,397 4.40% 69,647 4.29% 86,591 4.13% 87,247 3.93% 90,404 3.93% 91,122 3.75%
EDS04 (France) DE VILLEROCHÉ 69,397 4.40% 69,647 4.29% 86,591 4.13% 87,247 3.93% 90,404 3.93% 91,122 3.75%
EDS05 (Germany) MUELLER 72,399 4.59% 72,649 4.48% 96,574 4.60% 97,230 4.38% 96,574 4.20% 97,292 4.00%
EDS06 (Pakistan) KHOSA 49,794 3.16% 51,544 3.18% 67,107 3.20% 71,699 3.23% 69,545 3.03% 74,571 3.07%
EDS07 (Canada) SMITH 58,967 3.74% 62,217 3.83% 74,760 3.56% 83,288 3.75% 77,711 3.38% 87,045 3.58%
EDS08 (Chile) FOXLEY 35,999 2.28% 37,499 2.31% 41,462 1.98% 45,398 2.04% 51,985 2.26% 56,293 2.31%
EDS09 (Korea) EUN 53,011 3.36% 56,511 3.48% 82,952 3.95% 92,136 4.15% 86,790 3.78% 96,842 3.98%
EDS10 (Belgium) GODTS 73,150 4.64% 75,650 4.66% 105,018 5.00% 111,578 5.02% 110,142 4.79% 117,322 4.82%
EDS11 (Kuwait) HASAN 41,590 2.64% 44,590 2.75% 49,964 2.38% 57,836 2.60% 60,902 2.65% 69,518 2.86%
EDS12 (India) GARG 53,945 3.42% 54,945 3.38% 77,919 3.71% 80,543 3.62% 82,225 3.58% 85,097 3.50%
EDS13 (Djibouti) KAYAD 25,206 1.60% 30,956 1.91% 26,159 1.25% 41,247 1.86% 35,529 1.55% 52,043 2.14%
EDS14 (Seychelles) LAROSE 23,932 1.52% 29,432 1.81% 24,765 1.18% 39,197 1.76% 34,135 1.49% 49,931 2.05%
EDS15 (Brazil) SILVEIRA 55,874 3.54% 58,124 3.58% 70,568 3.36% 76,472 3.44% 86,065 3.75% 92,527 3.80%
EDS16 (Indonesia) SILABAN 38,346 2.43% 41,096 2.53% 55,386 2.64% 62,602 2.82% 64,969 2.83% 72,867 3.00%
EDS17 (China) CHEN 44,799 2.84% 45,049 2.78% 106,594 5.08% 107,250 4.83% 106,594 4.64% 107,312 4.41%
EDS18 (Venezuela) ROJAS 70,786 4.49% 72,786 4.48% 88,114 4.20% 93,362 4.20% 116,837 5.08% 122,581 5.04%
EDS19 (Netherlands) HEEMSKERK 69,896 4.43% 73,146 4.51% 79,538 3.79% 88,066 3.96% 92,134 4.01% 101,468 4.17%
EDS20 (Finland) SANTALA 52,039 3.30% 54,039 3.33% 66,901 3.19% 72,149 3.25% 69,062 3.01% 74,806 3.07%
EDS21 (Italy) PAGANO 54,955 3.49% 56,705 3.49% 64,387 3.07% 68,979 3.10% 82,321 3.58% 87,347 3.59%
EDS22 (Saudi Arabia) ALKHUDAIRY 44,795 2.84% 45,045 2.78% 66,505 3.17% 67,161 3.02% 66,505 2.89% 67,223 2.76%
EDS23 (Russia) LUSHIN 46,997 2.98% 47,497 2.93% 64,355 3.07% 65,667 2.96% 69,612 3.03% 71,048 2.92%
EDS24 (Switzerland) FRIEDEN 50,177 3.18% 52,427 3.23% 60,840 2.90% 66,744 3.00% 69,734 3.03% 76,196 3.13%
EDS25 (Angola) LOURENCO 28,793 1.83% 29,543 1.82% 32,529 1.55% 34,497 1.55% 37,726 1.64% 39,880 1.64%
1,576,213 100.00% 1,623,213 100.00% 2,098,871 100.00% 2,222,199 100.00% 2,297,851 100.00% 2,432,835 100.00%
IBRD Capital Status - ACTUAL (08/10/2015) IBRD Capital Status - Post Phase 1 and Phase 2
TOTALS
IBRD Capital Status - Pre Phase 1 and 2(incl. Tuvalu and South Sudan)

Annex | 9c
59
Annex 9c. Member Shareholding and Voting Power – By Country - IFC
No. of % of Total % Voting No. of % of Total % VotingMember Subscription Subscription votes power Subscription Subscription votes power
Shares Shares Shares Shares
AFGHANISTAN 111 0.00% 361 0.01% 111 0.00% 931 0.03%ALBANIA 1,302 0.05% 1,552 0.06% 1,302 0.05% 2,122 0.08%ALGERIA 5,621 0.24% 5,871 0.24% 5,784 0.23% 6,604 0.24%ANGOLA 1,481 0.06% 1,731 0.07% 1,481 0.06% 2,301 0.08%ANTIGUA AND BARBUDA 13 0.00% 263 0.01% 13 0.00% 833 0.03%
ARGENTINA 38,129 1.61% 38,379 1.59% 42,405 1.65% 43,225 1.59%ARMENIA 992 0.04% 1,242 0.05% 992 0.04% 1,812 0.07%AUSTRALIA 47,329 2.00% 47,579 1.97% 47,329 1.84% 48,149 1.77%AUSTRIA 19,741 0.83% 19,991 0.83% 19,741 0.77% 20,561 0.76%AZERBAIJAN 2,367 0.10% 2,617 0.11% 2,367 0.09% 3,187 0.12%
BAHAMAS, THE 335 0.01% 585 0.02% 335 0.01% 1,155 0.04%BAHRAIN 1,746 0.07% 1,996 0.08% 1,746 0.07% 2,566 0.09%BANGLADESH 9,037 0.38% 9,287 0.38% 9,632 0.38% 10,452 0.38%BARBADOS 361 0.02% 611 0.03% 361 0.01% 1,181 0.04%BELARUS 5,162 0.22% 5,412 0.22% 5,267 0.21% 6,087 0.22%
BELGIUM 50,610 2.13% 50,860 2.10% 50,610 1.97% 51,430 1.89%BELIZE 101 0.00% 351 0.01% 101 0.00% 921 0.03%BENIN 119 0.01% 369 0.02% 119 0.00% 939 0.03%BHUTAN 720 0.03% 970 0.04% 720 0.03% 1,540 0.06%BOLIVIA 1,902 0.08% 2,152 0.09% 1,902 0.07% 2,722 0.10%
BOSNIA AND HERZEGOVINA 620 0.03% 870 0.04% 620 0.02% 1,440 0.05%BOTSWANA 113 0.00% 363 0.02% 113 0.00% 933 0.03%BRAZIL 39,479 1.66% 39,729 1.64% 55,585 2.17% 56,405 2.08%BULGARIA 4,867 0.21% 5,117 0.21% 4,934 0.19% 5,754 0.21%BURKINA FASO 836 0.04% 1,086 0.04% 836 0.03% 1,656 0.06%
BURUNDI 100 0.00% 350 0.01% 100 0.00% 920 0.03%CABO VERDE 15 0.00% 265 0.01% 15 0.00% 835 0.03%CAMBODIA 339 0.01% 589 0.02% 339 0.01% 1,159 0.04%CAMEROON 885 0.04% 1,135 0.05% 885 0.03% 1,705 0.06%CANADA 81,342 3.43% 81,592 3.37% 81,342 3.17% 82,162 3.02%
CENTRAL AFRICAN REPUBLIC 119 0.01% 369 0.02% 119 0.00% 939 0.03%CHAD 1,364 0.06% 1,614 0.07% 1,364 0.05% 2,184 0.08%CHILE 11,710 0.49% 11,960 0.49% 12,647 0.49% 13,467 0.50%CHINA 24,500 1.03% 24,750 1.02% 61,756 2.41% 62,576 2.30%COLOMBIA 12,606 0.53% 12,856 0.53% 13,658 0.53% 14,478 0.53%
COMOROS 14 0.00% 264 0.01% 14 0.00% 834 0.03%CONGO, DEMOCRATIC REPUBLIC OF 2,159 0.09% 2,409 0.10% 2,159 0.08% 2,979 0.11%CONGO, REPUBLIC OF 131 0.01% 381 0.02% 131 0.01% 951 0.04%COSTA RICA 952 0.04% 1,202 0.05% 952 0.04% 1,772 0.07%COTE D'IVOIRE 3,544 0.15% 3,794 0.16% 3,544 0.14% 4,364 0.16%
CROATIA 2,882 0.12% 3,132 0.13% 2,882 0.11% 3,702 0.14%CYPRUS 2,139 0.09% 2,389 0.10% 2,139 0.08% 2,959 0.11%CZECH REPUBLIC 8,913 0.38% 9,163 0.38% 8,913 0.35% 9,733 0.36%DENMARK 18,554 0.78% 18,804 0.78% 18,554 0.72% 19,374 0.71%DJIBOUTI 21 0.00% 271 0.01% 21 0.00% 841 0.03%
DOMINICA 42 0.00% 292 0.01% 42 0.00% 862 0.03%DOMINICAN REPUBLIC 1,187 0.05% 1,437 0.06% 1,187 0.05% 2,007 0.07%ECUADOR 2,161 0.09% 2,411 0.10% 2,161 0.08% 2,981 0.11%EGYPT, ARAB REPUBLIC OF 12,360 0.52% 12,610 0.52% 13,380 0.52% 14,200 0.52%EL SALVADOR 29 0.00% 279 0.01% 29 0.00% 849 0.03%
EQUATORIAL GUINEA 43 0.00% 293 0.01% 43 0.00% 863 0.03%ERITREA 935 0.04% 1,185 0.05% 935 0.04% 1,755 0.06%ESTONIA 1,434 0.06% 1,684 0.07% 1,434 0.06% 2,254 0.08%ETHIOPIA 127 0.01% 377 0.02% 127 0.00% 947 0.03%FIJI 287 0.01% 537 0.02% 287 0.01% 1,107 0.04%
FINLAND 15,697 0.66% 15,947 0.66% 15,697 0.61% 16,517 0.61%FRANCE 121,015 5.10% 121,265 5.02% 121,015 4.72% 121,835 4.48%GABON 1,268 0.05% 1,518 0.06% 1,268 0.05% 2,088 0.08%GAMBIA, THE 94 0.00% 344 0.01% 94 0.00% 914 0.03%GEORGIA 1,380 0.06% 1,630 0.07% 1,380 0.05% 2,200 0.08%
GERMANY 128,908 5.43% 129,158 5.34% 128,908 5.02% 129,728 4.77%GHANA 5,071 0.21% 5,321 0.22% 5,546 0.22% 6,366 0.23%GREECE 6,898 0.29% 7,148 0.30% 6,898 0.27% 7,718 0.28%GRENADA 74 0.00% 324 0.01% 74 0.00% 894 0.03%GUATEMALA 1,084 0.05% 1,334 0.06% 1,084 0.04% 1,904 0.07%
IFC Capital Status - Pre Voice Reform(incl. Suriname and South Sudan)
IFC Capital Status - Post Voice Reform(Current)

Annex | 9c
60
No. of % of Total % Voting No. of % of Total % VotingMember Subscription Subscription votes power Subscription Subscription votes power
Shares Shares Shares Shares
GUINEA 339 0.01% 589 0.02% 339 0.01% 1,159 0.04%GUINEA-BISSAU 18 0.00% 268 0.01% 18 0.00% 838 0.03%GUYANA 1,392 0.06% 1,642 0.07% 1,392 0.05% 2,212 0.08%HAITI 822 0.03% 1,072 0.04% 822 0.03% 1,642 0.06%HONDURAS 495 0.02% 745 0.03% 495 0.02% 1,315 0.05%
HUNGARY 10,932 0.46% 11,182 0.46% 11,771 0.46% 12,591 0.46%ICELAND 42 0.00% 292 0.01% 42 0.00% 862 0.03%INDIA 81,342 3.43% 81,592 3.37% 102,947 4.01% 103,767 3.82%INDONESIA 28,539 1.20% 28,789 1.19% 31,602 1.23% 32,422 1.19%IRAN, ISLAMIC REPUBLIC OF 1,444 0.06% 1,694 0.07% 1,444 0.06% 2,264 0.08%
IRAQ 147 0.01% 397 0.02% 147 0.01% 967 0.04%IRELAND 1,290 0.05% 1,540 0.06% 1,290 0.05% 2,110 0.08%ISRAEL 2,135 0.09% 2,385 0.10% 2,135 0.08% 2,955 0.11%ITALY 81,342 3.43% 81,592 3.37% 81,342 3.17% 82,162 3.02%JAMAICA 4,282 0.18% 4,532 0.19% 4,282 0.17% 5,102 0.19%
JAPAN 141,174 5.95% 141,424 5.85% 162,534 6.33% 163,354 6.01%JORDAN 941 0.04% 1,191 0.05% 941 0.04% 1,761 0.06%KAZAKHSTAN 4,637 0.20% 4,887 0.20% 4,637 0.18% 5,457 0.20%KENYA 4,041 0.17% 4,291 0.18% 4,041 0.16% 4,861 0.18%KIRIBATI 12 0.00% 262 0.01% 12 0.00% 832 0.03%
KOREA, REPUBLIC OF 15,946 0.67% 16,196 0.67% 28,148 1.10% 28,968 1.07%KOSOVO 1,454 0.06% 1,704 0.07% 1,454 0.06% 2,274 0.08%KUWAIT 9,947 0.42% 10,197 0.42% 15,073 0.59% 15,893 0.58%KYRGYZ REPUBLIC 1,720 0.07% 1,970 0.08% 1,720 0.07% 2,540 0.09%LAO PEOPLE'S DEMOCRATIC REPUBL 278 0.01% 528 0.02% 278 0.01% 1,098 0.04%
LATVIA 2,150 0.09% 2,400 0.10% 2,150 0.08% 2,970 0.11%LEBANON 135 0.01% 385 0.02% 135 0.01% 955 0.04%LESOTHO 71 0.00% 321 0.01% 71 0.00% 891 0.03%LIBERIA 83 0.00% 333 0.01% 83 0.00% 903 0.03%LIBYA 55 0.00% 305 0.01% 55 0.00% 875 0.03%
LITHUANIA 2,341 0.10% 2,591 0.11% 2,341 0.09% 3,161 0.12%LUXEMBOURG 2,139 0.09% 2,389 0.10% 2,139 0.08% 2,959 0.11%MACEDONIA, FORMER YUGOSLAV RE 536 0.02% 786 0.03% 536 0.02% 1,356 0.05%MADAGASCAR 432 0.02% 682 0.03% 432 0.02% 1,252 0.05%MALAWI 1,822 0.08% 2,072 0.09% 1,822 0.07% 2,642 0.10%
MALAYSIA 15,222 0.64% 15,472 0.64% 16,606 0.65% 17,426 0.64%MALDIVES 16 0.00% 266 0.01% 16 0.00% 836 0.03%MALI 451 0.02% 701 0.03% 451 0.02% 1,271 0.05%MALTA 1,615 0.07% 1,865 0.08% 1,615 0.06% 2,435 0.09%MARSHALL ISLANDS 663 0.03% 913 0.04% 663 0.03% 1,483 0.05%
MAURITANIA 214 0.01% 464 0.02% 214 0.01% 1,034 0.04%MAURITIUS 1,665 0.07% 1,915 0.08% 1,665 0.06% 2,485 0.09%MEXICO 27,589 1.16% 27,839 1.15% 30,532 1.19% 31,352 1.15%MICRONESIA, FEDERATED STATES O 744 0.03% 994 0.04% 744 0.03% 1,564 0.06%MOLDOVA 1,192 0.05% 1,442 0.06% 1,192 0.05% 2,012 0.07%
MONGOLIA 144 0.01% 394 0.02% 144 0.01% 964 0.04%MONTENEGRO 1,035 0.04% 1,285 0.05% 1,035 0.04% 1,855 0.07%MOROCCO 9,037 0.38% 9,287 0.38% 9,635 0.38% 10,455 0.38%MOZAMBIQUE 322 0.01% 572 0.02% 322 0.01% 1,142 0.04%MYANMAR 666 0.03% 916 0.04% 666 0.03% 1,486 0.05%
NAMIBIA 404 0.02% 654 0.03% 404 0.02% 1,224 0.05%NEPAL 822 0.03% 1,072 0.04% 822 0.03% 1,642 0.06%NETHERLANDS 56,131 2.37% 56,381 2.33% 56,131 2.19% 56,951 2.10%NEW ZEALAND 3,583 0.15% 3,833 0.16% 3,583 0.14% 4,403 0.16%NICARAGUA 715 0.03% 965 0.04% 715 0.03% 1,535 0.06%
NIGER 147 0.01% 397 0.02% 147 0.01% 967 0.04%NIGERIA 21,643 0.91% 21,893 0.91% 27,672 1.08% 28,492 1.05%NORWAY 17,599 0.74% 17,849 0.74% 17,599 0.69% 18,419 0.68%OMAN 1,187 0.05% 1,437 0.06% 1,187 0.05% 2,007 0.07%PAKISTAN 19,380 0.82% 19,630 0.81% 21,292 0.83% 22,112 0.81%
PALAU 25 0.00% 275 0.01% 25 0.00% 845 0.03%PANAMA 1,007 0.04% 1,257 0.05% 1,007 0.04% 1,827 0.07%PAPUA NEW GUINEA 1,147 0.05% 1,397 0.06% 1,147 0.04% 1,967 0.07%PARAGUAY 436 0.02% 686 0.03% 436 0.02% 1,256 0.05%PERU 6,898 0.29% 7,148 0.30% 8,373 0.33% 9,193 0.34%
IFC Capital Status - Pre Voice Reform(incl. Suriname and South Sudan)
IFC Capital Status - Post Voice Reform(Current)

Annex | 9c
61
No. of % of Total % Voting No. of % of Total % VotingMember Subscription Subscription votes power Subscription Subscription votes power
Shares Shares Shares Shares
PHILIPPINES 12,606 0.53% 12,856 0.53% 13,658 0.53% 14,478 0.53%POLAND 7,236 0.31% 7,486 0.31% 7,605 0.30% 8,425 0.31%PORTUGAL 8,324 0.35% 8,574 0.35% 8,324 0.32% 9,144 0.34%QATAR 1,650 0.07% 1,900 0.08% 1,650 0.06% 2,470 0.09%ROMANIA 2,661 0.11% 2,911 0.12% 4,278 0.17% 5,098 0.19%
RUSSIAN FEDERATION 81,342 3.43% 81,592 3.37% 102,853 4.01% 103,673 3.82%RWANDA 306 0.01% 556 0.02% 306 0.01% 1,126 0.04%SAMOA 35 0.00% 285 0.01% 35 0.00% 855 0.03%SAO TOME AND PRINCIPE 439 0.02% 689 0.03% 439 0.02% 1,259 0.05%SAUDI ARABIA 30,062 1.27% 30,312 1.25% 51,038 1.99% 51,858 1.91%
SENEGAL 2,299 0.10% 2,549 0.11% 2,299 0.09% 3,119 0.11%SERBIA 1,803 0.08% 2,053 0.08% 1,803 0.07% 2,623 0.10%SEYCHELLES 27 0.00% 277 0.01% 27 0.00% 847 0.03%SIERRA LEONE 223 0.01% 473 0.02% 223 0.01% 1,043 0.04%SINGAPORE 177 0.01% 427 0.02% 177 0.01% 997 0.04%
SLOVAK REPUBLIC 4,457 0.19% 4,707 0.19% 4,457 0.17% 5,277 0.19%SLOVENIA 1,585 0.07% 1,835 0.08% 1,585 0.06% 2,405 0.09%SOLOMON ISLANDS 37 0.00% 287 0.01% 37 0.00% 857 0.03%SOMALIA 83 0.00% 333 0.01% 83 0.00% 903 0.03%SOUTH AFRICA 15,948 0.67% 16,198 0.67% 17,418 0.68% 18,238 0.67%
SOUTH SUDAN 1,880 0.08% 2,130 0.09% 1,880 0.07% 2,700 0.10%SPAIN 37,026 1.56% 37,276 1.54% 37,026 1.44% 37,846 1.39%SRI LANKA 7,135 0.30% 7,385 0.31% 7,491 0.29% 8,311 0.31%ST. KITTS AND NEVIS 638 0.03% 888 0.04% 638 0.02% 1,458 0.05%ST. LUCIA 74 0.00% 324 0.01% 74 0.00% 894 0.03%
SUDAN 111 0.00% 361 0.01% 111 0.00% 931 0.03%SURINAME 620 0.03% 870 0.04% 620 0.02% 1,440 0.05%SWAZILAND 684 0.03% 934 0.04% 684 0.03% 1,504 0.06%SWEDEN 26,876 1.13% 27,126 1.12% 26,876 1.05% 27,696 1.02%SWITZERLAND 41,580 1.75% 41,830 1.73% 44,063 1.72% 44,883 1.65%
SYRIAN ARAB REPUBLIC 194 0.01% 444 0.02% 194 0.01% 1,014 0.04%TAJIKISTAN 1,212 0.05% 1,462 0.06% 1,212 0.05% 2,032 0.07%TANZANIA 1,003 0.04% 1,253 0.05% 1,003 0.04% 1,823 0.07%THAILAND 10,941 0.46% 11,191 0.46% 11,781 0.46% 12,601 0.46%TIMOR-LESTE 777 0.03% 1,027 0.04% 777 0.03% 1,597 0.06%
TOGO 808 0.03% 1,058 0.04% 808 0.03% 1,628 0.06%TONGA 34 0.00% 284 0.01% 34 0.00% 854 0.03%TRINIDAD AND TOBAGO 4,112 0.17% 4,362 0.18% 4,112 0.16% 4,932 0.18%TUNISIA 3,566 0.15% 3,816 0.16% 3,566 0.14% 4,386 0.16%TURKEY 14,545 0.61% 14,795 0.61% 15,837 0.62% 16,657 0.61%
TURKMENISTAN 810 0.03% 1,060 0.04% 810 0.03% 1,630 0.06%UGANDA 735 0.03% 985 0.04% 735 0.03% 1,555 0.06%UKRAINE 9,505 0.40% 9,755 0.40% 10,159 0.40% 10,979 0.40%UNITED ARAB EMIRATES 4,033 0.17% 4,283 0.18% 4,033 0.16% 4,853 0.18%UNITED KINGDOM 121,015 5.10% 121,265 5.02% 121,015 4.72% 121,835 4.48%
UNITED STATES 569,379 24.01% 569,629 23.56% 569,379 22.19% 570,199 20.99%URUGUAY 3,569 0.15% 3,819 0.16% 3,569 0.14% 4,389 0.16%UZBEKISTAN 3,873 0.16% 4,123 0.17% 3,873 0.15% 4,693 0.17%VANUATU 55 0.00% 305 0.01% 55 0.00% 875 0.03%VENEZUELA, REPUBLICA BOLIVARIAN 27,588 1.16% 27,838 1.15% 27,588 1.08% 28,408 1.05%
VIETNAM 446 0.02% 696 0.03% 446 0.02% 1,266 0.05%YEMEN, REPUBLIC OF 715 0.03% 965 0.04% 715 0.03% 1,535 0.06%ZAMBIA 1,286 0.05% 1,536 0.06% 1,286 0.05% 2,106 0.08%ZIMBABWE 2,120 0.09% 2,370 0.10% 3,215 0.13% 4,035 0.15%
TOTAL 2,371,896 100.00% 2,417,896 100.00% 2,566,199 100.00% 2,717,079 100.00%
DEVELOPED MEMBER TOTALS 1,601,868 67.54% 1,608,118 66.51% 1,625,711 63.35% 1,646,211 60.59%
DTC GROUP TOTAL 770,028 32.46% 809,778 33.49% 940,488 36.65% 1,070,868 39.41%
IFC Capital Status - Pre Voice Reform(incl. Suriname and South Sudan)
IFC Capital Status - Post Voice Reform(Current)

Annex | 9d
62
Annex 9d. Member Shareholding and Voting Power – By Constituency - IFC
No. of % of Total % Voting No. of % of Total % Voting Subscription Subscription votes power Subscription Subscription votes power
ED Country ED Name Shares Shares Shares Shares
EDS01 (United States) MCGUIRE 569,379 24.01% 569,629 23.56% 569,379 22.19% 570,199 20.99%
EDS02 (Japan) KAN 141,174 5.95% 141,424 5.85% 162,534 6.33% 163,354 6.01%
EDS03 (United Kingdom) VACANT 121,015 5.10% 121,265 5.02% 121,015 4.72% 121,835 4.48%
EDS04 (France) DE VILLEROCHÉ 121,015 5.10% 121,265 5.02% 121,015 4.72% 121,835 4.48%
EDS05 (Germany) MUELLER 128,908 5.43% 129,158 5.34% 128,908 5.02% 129,728 4.77%
EDS06 (Pakistan) KHOSA 44,230 1.86% 45,980 1.90% 47,378 1.85% 53,118 1.95%
EDS07 (Canada) SMITH 89,944 3.79% 92,944 3.84% 89,944 3.50% 99,784 3.67%
EDS08 (Chile) FOXLEY 62,644 2.64% 64,144 2.65% 69,332 2.70% 74,252 2.73%
EDS09 (Korea) EUN 70,059 2.95% 73,309 3.03% 82,261 3.21% 92,921 3.42%
EDS10 (Belgium) GODTS 119,538 5.04% 122,038 5.05% 121,774 4.75% 129,974 4.78%
EDS11 (Kuwait) HASAN 32,932 1.39% 35,932 1.49% 39,078 1.52% 48,918 1.80%
EDS12 (India) GARG 98,234 4.14% 99,234 4.10% 120,790 4.71% 124,070 4.57%
EDS13 (Djibouti) KAYAD 17,330 0.73% 23,080 0.95% 17,330 0.68% 36,190 1.33%
EDS14 (Seychelles) LAROSE 16,570 0.70% 22,070 0.91% 17,665 0.69% 35,705 1.31%
EDS15 (Brazil) SILVEIRA 74,600 3.15% 76,850 3.18% 92,810 3.62% 100,190 3.69%
EDS16 (Indonesia) SILABAN 57,412 2.42% 59,912 2.48% 62,699 2.44% 70,899 2.61%
EDS17 (China) CHEN 24,500 1.03% 24,750 1.02% 61,756 2.41% 62,576 2.30%
EDS18 (Venezuela) ROJAS 95,478 4.03% 97,478 4.03% 98,421 3.84% 104,981 3.86%
EDS19 (Netherlands) HEEMSKERK 86,075 3.63% 89,325 3.69% 88,413 3.45% 99,073 3.65%
EDS20 (Finland) SANTALA 84,693 3.57% 86,693 3.59% 84,693 3.30% 91,253 3.36%
EDS21 (Italy) PAGANO 100,258 4.23% 101,758 4.21% 100,258 3.91% 105,178 3.87%
EDS22 (Saudi Arabia) ALKHUDAIRY 30,062 1.27% 30,312 1.25% 51,038 1.99% 51,858 1.91%
EDS23 (Russia) LUSHIN 81,536 3.44% 82,036 3.39% 103,047 4.02% 104,687 3.85%
EDS24 (Switzerland) FRIEDEN 65,238 2.75% 67,488 2.79% 68,090 2.65% 75,470 2.78%
EDS25 (Angola) LOURENCO 39,072 1.65% 39,822 1.65% 46,571 1.81% 49,031 1.80%
2,371,896 100.00% 2,417,896 100.00% 2,566,199 100.00% 2,717,079 100.00%TOTALS
IFC Capital Status - Pre Voice Reform(incl. Suriname and South Sudan)
IFC Capital Status - Post Voice Reform(Current)

Annex | 9e
63
Annex 9e. Member Shareholding and Voting Power – By Country - IDA
Amt of % of Total % Voting Amt of % of Total % VotingMember Subscription Subscription votes power Subscription Subscription votes power
(Valued $m) Total (Hist. $m) Total
AFGHANISTAN 1.48 0.00% 54,983 0.22% 1.68 0.00% 71,483 0.23%ALBANIA 0.35 0.00% 58,180 0.23% 0.39 0.00% 58,481 0.19%ALGERIA 5.53 0.00% 96,693 0.38% 6.69 0.00% 122,467 0.40%ANGOLA 8.92 0.00% 153,438 0.61% 10.47 0.00% 160,931 0.52%ARGENTINA 69.71 0.03% 134,439 0.54% 150.66 0.06% 402,326 1.30%
ARMENIA 0.67 0.00% 54,615 0.22% 0.71 0.00% 61,710 0.20%AUSTRALIA 4,533.41 1.85% 312,566 1.24% 4,968.88 1.99% 352,936 1.14%AUSTRIA 2,922.96 1.19% 207,122 0.82% 3,062.59 1.23% 238,327 0.77%AZERBAIJAN 1.16 0.00% 65,915 0.26% 1.20 0.00% 66,800 0.22%BAHAMAS, THE 8.54 0.00% 58,766 0.23% 8.64 0.00% 60,128 0.19%
BANGLADESH 8.08 0.00% 138,893 0.55% 8.93 0.00% 145,288 0.47%BARBADOS 2.36 0.00% 59,098 0.24% 2.39 0.00% 59,462 0.19%BELGIUM 4,468.75 1.83% 275,958 1.10% 4,440.38 1.78% 321,162 1.04%BELIZE 0.27 0.00% 19,834 0.08% 0.34 0.00% 57,927 0.19%BENIN 0.77 0.00% 60,511 0.24% 0.84 0.00% 63,009 0.20%
BHUTAN 0.07 0.00% 43,467 0.17% 0.09 0.00% 55,410 0.18%BOLIVIA 1.63 0.00% 71,089 0.28% 1.76 0.00% 72,364 0.23%BOSNIA AND HERZEGOVINA 2.48 0.00% 51,994 0.21% 10.23 0.00% 67,313 0.22%BOTSWANA 1.63 0.00% 51,149 0.20% 1.80 0.00% 57,522 0.19%BRAZIL 868.38 0.35% 395,580 1.57% 971.64 0.39% 492,426 1.59%
BURKINA FASO 0.78 0.00% 60,510 0.24% 0.84 0.00% 63,008 0.20%BURUNDI 1.09 0.00% 52,038 0.21% 1.27 0.00% 67,374 0.22%CABO VERDE 0.13 0.00% 43,840 0.17% 0.14 0.00% 55,930 0.18%CAMBODIA 1.58 0.00% 66,849 0.27% 1.70 0.00% 71,854 0.23%CAMEROON 1.61 0.00% 60,782 0.24% 1.68 0.00% 71,482 0.23%
CANADA 11,190.18 4.57% 659,785 2.63% 11,754.14 4.71% 760,876 2.46%CENTRAL AFRICAN REPUBLIC 0.77 0.00% 48,910 0.19% 0.84 0.00% 63,008 0.20%CHAD 0.77 0.00% 48,910 0.19% 0.84 0.00% 63,008 0.20%CHILE 39.12 0.02% 58,505 0.23% 40.67 0.02% 116,492 0.38%CHINA 536.55 0.22% 532,536 2.12% 541.86 0.22% 611,084 1.97%
COLOMBIA 24.92 0.01% 92,384 0.37% 32.76 0.01% 123,689 0.40%COMOROS 0.13 0.00% 43,840 0.17% 0.14 0.00% 55,930 0.18%CONGO, DEMOCRATIC REPUBLIC OF 0.73 0.00% 79,399 0.32% 5.02 0.00% 105,563 0.34%CONGO, REPUBLIC OF 4.59 0.00% 48,910 0.19% 0.84 0.00% 63,008 0.20%COSTA RICA 0.27 0.00% 24,489 0.10% 0.34 0.00% 57,884 0.19%
COTE D'IVOIRE 1.53 0.00% 62,550 0.25% 1.68 0.00% 71,482 0.23%CROATIA 5.81 0.00% 73,491 0.29% 24.05 0.01% 84,524 0.27%CYPRUS 18.91 0.01% 64,553 0.26% 21.20 0.01% 68,296 0.22%CZECH REPUBLIC 120.43 0.05% 113,190 0.45% 125.95 0.05% 125,457 0.41%DENMARK 3,602.21 1.47% 232,492 0.93% 3,672.81 1.47% 275,015 0.89%
DJIBOUTI 0.26 0.00% 44,816 0.18% 0.28 0.00% 57,292 0.19%DOMINICA 0.14 0.00% 55,440 0.22% 0.14 0.00% 55,930 0.18%DOMINICAN REPUBLIC 0.58 0.00% 27,780 0.11% 0.74 0.00% 61,416 0.20%ECUADOR 0.94 0.00% 50,151 0.20% 1.09 0.00% 65,548 0.21%EGYPT, ARAB REPUBLIC OF 11.27 0.00% 108,081 0.43% 14.76 0.01% 142,629 0.46%
EL SALVADOR 0.49 0.00% 46,464 0.18% 0.53 0.00% 59,594 0.19%EQUATORIAL GUINEA 0.41 0.00% 6,167 0.02% 0.54 0.00% 59,998 0.19%ERITREA 0.14 0.00% 43,969 0.18% 0.16 0.00% 56,110 0.18%ESTONIA 12.87 0.01% 48,117 0.19% 13.60 0.01% 48,318 0.16%ETHIOPIA 0.71 0.00% 48,923 0.19% 0.86 0.00% 63,025 0.20%
FIJI 0.76 0.00% 19,462 0.08% 0.94 0.00% 64,063 0.21%FINLAND 1,925.20 0.79% 159,872 0.64% 2,125.61 0.85% 181,995 0.59%FRANCE 17,264.28 7.06% 960,668 3.82% 17,500.89 7.02% 1,106,379 3.57%GABON 0.63 0.00% 2,093 0.01% 0.84 0.00% 63,008 0.20%GAMBIA, THE 0.42 0.00% 51,908 0.21% 0.45 0.00% 59,097 0.19%
GEORGIA 0.99 0.00% 58,401 0.23% 1.16 0.00% 66,287 0.21%GERMANY 25,611.35 10.47% 1,371,924 5.46% 25,611.86 10.27% 1,594,022 5.15%GHANA 3.07 0.00% 77,136 0.31% 3.92 0.00% 94,310 0.30%GREECE 195.78 0.08% 53,146 0.21% 212.19 0.09% 55,357 0.18%GRENADA 0.13 0.00% 26,427 0.11% 0.16 0.00% 56,016 0.18%
IDA Capital Status - ACTUAL (06/30/2015) IDA Expected Capital Status - After IDA17

Annex | 9e
64
Amt of % of Total % Voting Amt of % of Total % VotingMember Subscription Subscription votes power Subscription Subscription votes power
(Valued $m) Total (Hist. $m) Total
GUATEMALA 0.55 0.00% 37,396 0.15% 0.67 0.00% 61,357 0.20%GUINEA 1.31 0.00% 33,987 0.14% 1.68 0.00% 71,482 0.23%GUINEA-BISSAU 0.22 0.00% 44,500 0.18% 0.24 0.00% 56,851 0.18%GUYANA 1.21 0.00% 60,035 0.24% 1.35 0.00% 68,261 0.22%HAITI 1.11 0.00% 52,038 0.21% 1.27 0.00% 67,374 0.22%
HONDURAS 0.43 0.00% 52,855 0.21% 0.51 0.00% 59,584 0.19%HUNGARY 133.27 0.05% 175,434 0.70% 168.02 0.07% 199,419 0.64%ICELAND 68.49 0.03% 58,871 0.23% 95.04 0.04% 59,914 0.19%INDIA 259.78 0.11% 743,566 2.96% 68.41 0.03% 795,617 2.57%INDONESIA 17.32 0.01% 203,606 0.81% 36.31 0.01% 242,840 0.78%
IRAN, ISLAMIC REPUBLIC OF 24.26 0.01% 113,182 0.45% 25.98 0.01% 132,383 0.43%IRAQ 1.08 0.00% 59,301 0.24% 1.27 0.00% 67,374 0.22%IRELAND 709.24 0.29% 93,310 0.37% 731.22 0.29% 98,162 0.32%ISRAEL 70.28 0.03% 67,473 0.27% 94.69 0.04% 92,379 0.30%ITALY 9,255.25 3.78% 573,858 2.28% 10,507.62 4.21% 685,933 2.22%
JAPAN 43,158.01 17.64% 2,123,311 8.45% 39,589.61 15.88% 2,434,384 7.86%JORDAN 0.41 0.00% 24,865 0.10% 0.51 0.00% 59,584 0.19%KAZAKHSTAN 8.35 0.00% 20,383 0.08% 5.72 0.00% 80,685 0.26%KENYA 2.40 0.00% 72,127 0.29% 2.79 0.00% 82,874 0.27%KIRIBATI 0.10 0.00% 43,592 0.17% 0.11 0.00% 55,585 0.18%
KOREA, REPUBLIC OF 1,965.43 0.80% 210,524 0.84% 1,993.34 0.80% 267,184 0.86%KOSOVO 0.84 0.00% 48,357 0.19% 0.92 0.00% 62,593 0.20%KUWAIT 999.08 0.41% 111,474 0.44% 1,006.34 0.40% 113,803 0.37%KYRGYZ REPUBLIC 0.56 0.00% 54,311 0.22% 0.67 0.00% 61,343 0.20%LAO PEOPLE'S DEMOCRATIC REPUBL 0.73 0.00% 48,910 0.19% 0.84 0.00% 63,008 0.20%
LATVIA 12.83 0.01% 54,720 0.22% 14.42 0.01% 55,067 0.18%LEBANON 0.56 0.00% 8,562 0.03% 0.76 0.00% 62,244 0.20%LESOTHO 0.23 0.00% 50,932 0.20% 0.28 0.00% 57,292 0.19%LIBERIA 1.12 0.00% 52,038 0.21% 1.27 0.00% 67,374 0.22%LIBYA 1.41 0.00% 44,771 0.18% 1.68 0.00% 71,482 0.23%
LITHUANIA 10.89 0.00% 48,064 0.19% 11.73 0.00% 54,005 0.17%LUXEMBOURG 273.30 0.11% 63,411 0.25% 345.02 0.14% 74,943 0.24%MACEDONIA, FORMER YUGOSLAV RE 1.09 0.00% 46,885 0.19% 4.51 0.00% 60,180 0.19%MADAGASCAR 1.38 0.00% 60,782 0.24% 1.68 0.00% 71,482 0.23%MALAWI 0.98 0.00% 52,038 0.21% 1.27 0.00% 67,374 0.22%
MALAYSIA 32.87 0.01% 91,778 0.37% 33.42 0.01% 98,802 0.32%MALDIVES 0.05 0.00% 55,016 0.22% 0.06 0.00% 55,077 0.18%MALI 1.34 0.00% 59,145 0.24% 1.45 0.00% 69,197 0.22%MARSHALL ISLANDS 0.01 0.00% 4,902 0.02% 0.03 0.00% 54,750 0.18%MAURITANIA 0.77 0.00% 48,910 0.19% 0.84 0.00% 63,008 0.20%
MAURITIUS 1.33 0.00% 68,113 0.27% 1.47 0.00% 69,164 0.22%MEXICO 168.34 0.07% 142,236 0.57% 395.69 0.16% 254,397 0.82%MICRONESIA, FEDERATED STATES O 0.03 0.00% 18,424 0.07% 0.04 0.00% 54,924 0.18%MOLDOVA 0.88 0.00% 56,582 0.23% 0.94 0.00% 64,088 0.21%MONGOLIA 0.31 0.00% 45,667 0.18% 0.39 0.00% 58,481 0.19%
MONTENEGRO 0.74 0.00% 52,896 0.21% 0.77 0.00% 60,737 0.20%MOROCCO 5.46 0.00% 98,017 0.39% 5.86 0.00% 114,162 0.37%MOZAMBIQUE 2.04 0.00% 59,370 0.24% 2.28 0.00% 77,607 0.25%MYANMAR 2.54 0.00% 76,958 0.31% 3.36 0.00% 88,712 0.29%NEPAL 0.73 0.00% 54,710 0.22% 0.84 0.00% 63,008 0.20%
NETHERLANDS 8,750.73 3.58% 491,112 1.96% 8,583.91 3.44% 570,277 1.84%NEW ZEALAND 345.73 0.14% 72,086 0.29% 357.99 0.14% 75,723 0.24%NICARAGUA 0.42 0.00% 46,457 0.18% 0.51 0.00% 59,584 0.19%NIGER 0.75 0.00% 48,910 0.19% 0.84 0.00% 63,008 0.20%NIGERIA 4.64 0.00% 95,536 0.38% 5.58 0.00% 111,163 0.36%
NORWAY 3,900.20 1.59% 259,974 1.03% 4,200.04 1.68% 306,712 0.99%OMAN 1.41 0.00% 52,997 0.21% 1.54 0.00% 59,755 0.19%PAKISTAN 26.52 0.01% 218,506 0.87% 28.32 0.01% 230,861 0.75%PALAU 0.03 0.00% 3,804 0.02% 0.04 0.00% 54,779 0.18%PANAMA 0.03 0.00% 10,185 0.04% 0.04 0.00% 55,000 0.18%
IDA Capital Status - ACTUAL (06/30/2015) IDA Expected Capital Status - After IDA17

Annex | 9e
65
Amt of % of Total % Voting Amt of % of Total % VotingMember Subscription Subscription votes power Subscription Subscription votes power
(Valued $m) Total (Hist. $m) Total
PAPUA NEW GUINEA 1.30 0.00% 63,134 0.25% 1.44 0.00% 69,143 0.22%PARAGUAY 0.42 0.00% 29,968 0.12% 0.51 0.00% 59,584 0.19%PERU 18.07 0.01% 83,437 0.33% 18.57 0.01% 85,566 0.28%PHILIPPINES 23.86 0.01% 134,587 0.54% 19.77 0.01% 140,600 0.45%POLAND 107.17 0.04% 499,534 1.99% 125.93 0.05% 583,064 1.88%
PORTUGAL 276.23 0.11% 55,993 0.22% 328.02 0.13% 73,921 0.24%ROMANIA 5.24 0.00% 94,036 0.37% 5.60 0.00% 109,538 0.35%RUSSIAN FEDERATION 752.50 0.31% 82,896 0.33% 763.57 0.31% 100,107 0.32%RWANDA 1.13 0.00% 52,038 0.21% 1.27 0.00% 67,374 0.22%SAMOA 0.14 0.00% 43,901 0.17% 0.16 0.00% 56,016 0.18%
SAO TOME AND PRINCIPE 0.12 0.00% 49,519 0.20% 0.13 0.00% 55,762 0.18%SAUDI ARABIA 2,634.57 1.08% 813,491 3.24% 2,714.15 1.09% 964,897 3.12%SENEGAL 2.60 0.00% 68,943 0.27% 2.79 0.00% 82,874 0.27%SERBIA 7.04 0.00% 79,477 0.32% 29.85 0.01% 91,757 0.30%SIERRA LEONE 1.09 0.00% 63,638 0.25% 1.27 0.00% 67,374 0.22%
SINGAPORE 109.73 0.04% 25,551 0.10% 214.24 0.09% 76,306 0.25%SLOVAK REPUBLIC 28.16 0.01% 83,216 0.33% 31.09 0.01% 88,877 0.29%SLOVENIA 39.53 0.02% 56,628 0.23% 52.13 0.02% 57,334 0.19%SOLOMON ISLANDS 0.13 0.00% 43,901 0.17% 0.16 0.00% 56,016 0.18%SOMALIA 0.95 0.00% 10,506 0.04% 1.27 0.00% 67,374 0.22%
SOUTH AFRICA 226.81 0.09% 69,690 0.28% 277.83 0.11% 70,904 0.23%SOUTH SUDAN 0.56 0.00% 52,447 0.21% 0.59 0.00% 59,279 0.19%SPAIN 3,086.46 1.26% 206,661 0.82% 4,633.85 1.86% 332,794 1.08%SRI LANKA 4.46 0.00% 96,296 0.38% 5.03 0.00% 105,614 0.34%ST. KITTS AND NEVIS 0.17 0.00% 13,778 0.05% 0.22 0.00% 56,768 0.18%
ST. LUCIA 0.23 0.00% 30,532 0.12% 0.26 0.00% 57,097 0.18%ST. VINCENT AND THE GRENADINES 0.12 0.00% 46,546 0.19% 0.13 0.00% 55,755 0.18%SUDAN 1.54 0.00% 60,782 0.24% 1.68 0.00% 71,482 0.23%SWAZILAND 0.41 0.00% 19,022 0.08% 0.54 0.00% 60,003 0.19%SWEDEN 8,002.54 3.27% 495,401 1.97% 8,730.17 3.50% 579,070 1.87%
SWITZERLAND 5,062.20 2.07% 284,044 1.13% 5,349.59 2.15% 375,825 1.21%SYRIAN ARAB REPUBLIC 1.19 0.00% 11,027 0.04% 1.58 0.00% 70,534 0.23%TAJIKISTAN 0.54 0.00% 53,918 0.21% 0.62 0.00% 60,868 0.20%TANZANIA 2.34 0.00% 68,943 0.27% 2.79 0.00% 82,874 0.27%THAILAND 9.23 0.00% 98,596 0.39% 9.90 0.00% 105,906 0.34%
TIMOR-LESTE 0.44 0.00% 45,123 0.18% 0.48 0.00% 58,077 0.19%TOGO 1.17 0.00% 57,838 0.23% 1.27 0.00% 67,374 0.22%TONGA 0.11 0.00% 49,514 0.20% 0.13 0.00% 55,755 0.18%TRINIDAD AND TOBAGO 2.13 0.00% 75,722 0.30% 2.25 0.00% 77,347 0.25%TUNISIA 1.89 0.00% 2,793 0.01% 2.51 0.00% 80,117 0.26%
TURKEY 195.03 0.08% 151,314 0.60% 218.39 0.09% 179,926 0.58%TUVALU 0.02 0.00% 6,338 0.03% 0.03 0.00% 53,635 0.17%UGANDA 2.30 0.00% 47,092 0.19% 2.79 0.00% 82,874 0.27%UKRAINE 8.09 0.00% 115,569 0.46% 10.38 0.00% 156,406 0.51%UNITED ARAB EMIRATES 5.58 0.00% 1,367 0.01% 5.20 0.00% 1,367 0.00%
UNITED KINGDOM 29,915.50 12.23% 1,517,718 6.04% 31,117.27 12.48% 1,925,015 6.22%UNITED STATES 50,415.04 20.60% 2,630,631 10.47% 50,907.95 20.42% 3,113,959 10.06%UZBEKISTAN 1.98 0.00% 73,936 0.29% 2.05 0.00% 75,426 0.24%VANUATU 0.31 0.00% 50,952 0.20% 0.32 0.00% 57,762 0.19%VIETNAM 2.23 0.00% 61,168 0.24% 2.51 0.00% 80,117 0.26%
YEMEN, REPUBLIC OF 2.23 0.00% 68,976 0.27% 2.61 0.00% 79,066 0.26%ZAMBIA 3.67 0.00% 81,227 0.32% 4.47 0.00% 100,020 0.32%ZIMBABWE 6.41 0.00% 105,982 0.42% 6.83 0.00% 123,787 0.40%
TOTAL 244,693.99 100.00% 25,120,295 100.00% 249,327.90 100.00% 30,953,509 100.00%
DEVELOPED MEMBER TOTALS 235,022.23 96.05% 13,291,940 52.91% 238,942.54 95.83% 15,753,376 50.89%
DTC GROUP TOTAL 9,671.76 3.95% 11,828,355 47.09% 10,385.36 4.17% 15,200,133 49.11%
PART ONE TOTAL 236,993.13 96.85% 13,632,870 54.27% 240,971.48 96.65% 16,093,606 51.99%
PART TWO TOTAL 7,700.86 3.15% 11,487,425 45.73% 8,356.43 3.35% 14,859,903 48.01%
IDA Capital Status - ACTUAL (06/30/2015) IDA Expected Capital Status - After IDA17

Annex | 9f
66
Annex 9f. Member Shareholding and Voting Power – By Constituency - IDA
Amt of % of Total % Voting Amt of % of Total % Voting Subscription Subscription votes power Subscription Subscription votes power
ED Country ED Name (Valued $m) Shares (Hist. $m) Shares
EDS01 (United States) MCGUIRE 50,415 20.60% 2,630,631 10.47% 50,908 20.42% 3,113,959 10.06%
EDS02 (Japan) KAN 43,158 17.64% 2,123,311 8.45% 39,590 15.88% 2,434,384 7.86%
EDS03 (United Kingdom) VACANT 29,916 12.23% 1,517,718 6.04% 31,117 12.48% 1,925,015 6.22%
EDS04 (France) DE VILLEROCHÉ 17,264 7.06% 960,668 3.82% 17,501 7.02% 1,106,379 3.57%
EDS05 (Germany) MUELLER 25,611 10.47% 1,371,924 5.46% 25,612 10.27% 1,594,022 5.15%
EDS06 (Pakistan) KHOSA 68 0.03% 661,310 2.63% 75 0.03% 845,783 2.73%
EDS07 (Canada) SMITH 11,913 4.87% 1,123,551 4.47% 12,499 5.01% 1,386,382 4.48%
EDS08 (Chile) FOXLEY 129 0.05% 377,438 1.50% 212 0.09% 736,332 2.38%
EDS09 (Korea) EUN 6,849 2.80% 986,640 3.93% 7,325 2.94% 1,338,788 4.33%
EDS10 (Belgium) GODTS 8,182 3.34% 1,174,630 4.68% 8,444 3.39% 1,348,038 4.36%
EDS11 (Kuwait) HASAN 1,023 0.42% 535,410 2.13% 1,035 0.42% 712,381 2.30%
EDS12 (India) GARG 272 0.11% 1,022,222 4.07% 82 0.03% 1,101,929 3.56%
EDS13 (Djibouti) KAYAD 24 0.01% 1,151,885 4.59% 27 0.01% 1,525,928 4.93%
EDS14 (Seychelles) LAROSE 31 0.01% 1,096,169 4.36% 36 0.01% 1,438,090 4.65%
EDS15 (Brazil) SILVEIRA 922 0.38% 838,427 3.34% 1,030 0.41% 1,083,400 3.50%
EDS16 (Indonesia) SILABAN 176 0.07% 730,253 2.91% 302 0.12% 938,517 3.03%
EDS17 (China) CHEN 537 0.22% 532,536 2.12% 542 0.22% 611,084 1.97%
EDS18 (Venezuela) ROJAS 3,257 1.33% 556,558 2.22% 5,032 2.02% 885,194 2.86%
EDS19 (Netherlands) HEEMSKERK 8,866 3.62% 1,227,607 4.89% 8,758 3.51% 1,461,735 4.72%
EDS20 (Finland) SANTALA 17,535 7.17% 1,357,511 5.40% 18,863 7.57% 1,560,096 5.04%
EDS21 (Italy) PAGANO 9,728 3.98% 786,300 3.13% 11,049 4.43% 931,769 3.01%
EDS22 (Saudi Arabia) ALKHUDAIRY 2,635 1.08% 813,491 3.24% 2,714 1.09% 964,897 3.12%
EDS23 (Russia) LUSHIN 754 0.31% 93,923 0.37% 765 0.31% 170,641 0.55%
EDS24 (Switzerland) FRIEDEN 5,189 2.12% 1,131,518 4.50% 5,516 2.21% 1,395,768 4.51%
EDS25 (Angola) LOURENCO 240 0.10% 318,664 1.27% 294 0.12% 342,998 1.11%
244,694 100.00% 25,120,295 100.00% 249,328 100.00% 30,953,509 100.00%
IDA Capital Status - ACTUAL (06/30/2015) IDA Expected Capital Status - After IDA17
TOTALS

Annex | 9g
67
Annex 9g. Member Shareholding and Voting Power – By Country - MIGA
No. of % of Total % VotingMember Subscription Subscription votes power
Shares Shares
AFGHANISTAN 118 0.07% 344 0.16%ALBANIA 102 0.06% 328 0.15%ALGERIA 1,144 0.65% 1,370 0.63%ANGOLA 187 0.11% 413 0.19%ANTIGUA AND BARBUDA 50 0.03% 276 0.13%
ARGENTINA 2,210 1.25% 2,436 1.12%ARMENIA 80 0.05% 306 0.14%AUSTRALIA 3,019 1.70% 3,245 1.49%AUSTRIA 1,366 0.77% 1,592 0.73%AZERBAIJAN 115 0.06% 341 0.16%
BAHAMAS, THE 176 0.10% 402 0.18%BAHRAIN 136 0.08% 362 0.17%BANGLADESH 599 0.34% 825 0.38%BARBADOS 120 0.07% 346 0.16%BELARUS 233 0.13% 459 0.21%
BELGIUM 3,577 2.02% 3,803 1.74%BELIZE 88 0.05% 314 0.14%BENIN 108 0.06% 334 0.15%BHUTAN 50 0.03% 276 0.13%BOLIVIA 220 0.12% 446 0.20%
BOSNIA AND HERZEGOVINA 80 0.05% 306 0.14%BOTSWANA 88 0.05% 314 0.14%BRAZIL 2,606 1.47% 2,832 1.30%BULGARIA 643 0.36% 869 0.40%BURKINA FASO 61 0.03% 287 0.13%
BURUNDI 74 0.04% 300 0.14%CABO VERDE 50 0.03% 276 0.13%CAMBODIA 164 0.09% 390 0.18%CAMEROON 107 0.06% 333 0.15%CANADA 5,225 2.95% 5,451 2.50%
CENTRAL AFRICAN REPUBLIC 60 0.03% 286 0.13%CHAD 60 0.03% 286 0.13%CHILE 855 0.48% 1,081 0.50%CHINA 5,530 3.12% 5,756 2.64%COLOMBIA 770 0.43% 996 0.46%
COMOROS 50 0.03% 276 0.13%CONGO, DEMOCRATIC REPUBLIC OF 596 0.34% 822 0.38%CONGO, REPUBLIC OF 115 0.06% 341 0.16%COSTA RICA 206 0.12% 432 0.20%COTE D'IVOIRE 310 0.17% 536 0.25%
CROATIA 330 0.19% 556 0.25%CYPRUS 183 0.10% 409 0.19%CZECH REPUBLIC 784 0.44% 1,010 0.46%DENMARK 1,265 0.71% 1,491 0.68%DJIBOUTI 50 0.03% 276 0.13%
DOMINICA 50 0.03% 276 0.13%DOMINICAN REPUBLIC 147 0.08% 373 0.17%ECUADOR 321 0.18% 547 0.25%EGYPT, ARAB REPUBLIC OF 809 0.46% 1,035 0.47%EL SALVADOR 122 0.07% 348 0.16%
EQUATORIAL GUINEA 50 0.03% 276 0.13%ERITREA 50 0.03% 276 0.13%ESTONIA 115 0.06% 341 0.16%ETHIOPIA 123 0.07% 349 0.16%FIJI 71 0.04% 297 0.14%
FINLAND 1,057 0.60% 1,283 0.59%FRANCE 8,565 4.83% 8,791 4.03%GABON 169 0.10% 395 0.18%GAMBIA, THE 50 0.03% 276 0.13%GEORGIA 111 0.06% 337 0.15%
GERMANY 8,936 5.04% 9,162 4.20%GHANA 432 0.24% 658 0.30%GREECE 493 0.28% 719 0.33%GRENADA 50 0.03% 276 0.13%GUATEMALA 140 0.08% 366 0.17%
MIGA Capital Status - ACTUAL (08/10/2015)

Annex | 9g
68
No. of % of Total % VotingMember Subscription Subscription votes power
Shares Shares
GUINEA 91 0.05% 317 0.15%GUINEA-BISSAU 50 0.03% 276 0.13%GUYANA 84 0.05% 310 0.14%HAITI 75 0.04% 301 0.14%HONDURAS 178 0.10% 404 0.19%
HUNGARY 994 0.56% 1,220 0.56%ICELAND 90 0.05% 316 0.14%INDIA 5,371 3.03% 5,597 2.56%INDONESIA 1,849 1.04% 2,075 0.95%IRAN, ISLAMIC REPUBLIC OF 1,659 0.94% 1,885 0.86%
IRAQ 350 0.20% 576 0.26%IRELAND 650 0.37% 876 0.40%ISRAEL 835 0.47% 1,061 0.49%ITALY 4,970 2.80% 5,196 2.38%JAMAICA 319 0.18% 545 0.25%
JAPAN 8,979 5.06% 9,205 4.22%JORDAN 171 0.10% 397 0.18%KAZAKHSTAN 368 0.21% 594 0.27%KENYA 303 0.17% 529 0.24%KOREA, REPUBLIC OF 791 0.45% 1,017 0.47%
KOSOVO 96 0.05% 322 0.15%KUWAIT 1,639 0.92% 1,865 0.85%KYRGYZ REPUBLIC 77 0.04% 303 0.14%LAO PEOPLE'S DEMOCRATIC REPUBL 60 0.03% 286 0.13%LATVIA 171 0.10% 397 0.18%
LEBANON 250 0.14% 476 0.22%LESOTHO 88 0.05% 314 0.14%LIBERIA 84 0.05% 310 0.14%LIBYA 549 0.31% 775 0.36%LITHUANIA 187 0.11% 413 0.19%
LUXEMBOURG 204 0.12% 430 0.20%MACEDONIA, FORMER YUGOSLAV RE 88 0.05% 314 0.14%MADAGASCAR 176 0.10% 402 0.18%MALAWI 77 0.04% 303 0.14%MALAYSIA 1,020 0.58% 1,246 0.57%
MALDIVES 50 0.03% 276 0.13%MALI 143 0.08% 369 0.17%MALTA 132 0.07% 358 0.16%MAURITANIA 111 0.06% 337 0.15%MAURITIUS 153 0.09% 379 0.17%
MEXICO 1,192 0.67% 1,418 0.65%MICRONESIA, FEDERATED STATES O 50 0.03% 276 0.13%MOLDOVA 96 0.05% 322 0.15%MONGOLIA 58 0.03% 284 0.13%MONTENEGRO 61 0.03% 287 0.13%
MOROCCO 613 0.35% 839 0.38%MOZAMBIQUE 171 0.10% 397 0.18%MYANMAR 178 0.10% 404 0.19%NAMIBIA 107 0.06% 333 0.15%NEPAL 122 0.07% 348 0.16%
NETHERLANDS 3,822 2.16% 4,048 1.85%NEW ZEALAND 513 0.29% 739 0.34%NICARAGUA 180 0.10% 406 0.19%NIGER 62 0.03% 288 0.13%NIGERIA 1,487 0.84% 1,713 0.78%
NORWAY 1,232 0.69% 1,458 0.67%OMAN 166 0.09% 392 0.18%PAKISTAN 1,163 0.66% 1,389 0.64%PALAU 50 0.03% 276 0.13%PANAMA 231 0.13% 457 0.21%
PAPUA NEW GUINEA 96 0.05% 322 0.15%PARAGUAY 141 0.08% 367 0.17%PERU 657 0.37% 883 0.40%PHILIPPINES 853 0.48% 1,079 0.49%POLAND 764 0.43% 990 0.45%
MIGA Capital Status - ACTUAL (08/10/2015)

Annex | 9g
69
No. of % of Total % VotingMember Subscription Subscription votes power
Shares Shares
PORTUGAL 673 0.38% 899 0.41%QATAR 241 0.14% 467 0.21%ROMANIA 978 0.55% 1,204 0.55%RUSSIAN FEDERATION 5,528 3.12% 5,754 2.64%RWANDA 132 0.07% 358 0.16%
SAMOA 50 0.03% 276 0.13%SAO TOME AND PRINCIPE 50 0.03% 276 0.13%SAUDI ARABIA 5,528 3.12% 5,754 2.64%SENEGAL 256 0.14% 482 0.22%SERBIA 407 0.23% 633 0.29%
SEYCHELLES 50 0.03% 276 0.13%SIERRA LEONE 132 0.07% 358 0.16%SINGAPORE 272 0.15% 498 0.23%SLOVAK REPUBLIC 391 0.22% 617 0.28%SLOVENIA 180 0.10% 406 0.19%
SOLOMON ISLANDS 50 0.03% 276 0.13%SOUTH AFRICA 1,662 0.94% 1,888 0.87%SOUTH SUDAN 155 0.09% 381 0.17%SPAIN 2,265 1.28% 2,491 1.14%SRI LANKA 478 0.27% 704 0.32%
ST. KITTS AND NEVIS 50 0.03% 276 0.13%ST. LUCIA 88 0.05% 314 0.14%ST. VINCENT AND THE GRENADINES 88 0.05% 314 0.14%SUDAN 206 0.12% 432 0.20%SURINAME 82 0.05% 308 0.14%
SWAZILAND 58 0.03% 284 0.13%SWEDEN 1,849 1.04% 2,075 0.95%SWITZERLAND 2,643 1.49% 2,869 1.31%SYRIAN ARAB REPUBLIC 296 0.17% 522 0.24%TAJIKISTAN 130 0.07% 356 0.16%
TANZANIA 248 0.14% 474 0.22%THAILAND 742 0.42% 968 0.44%TIMOR-LESTE 50 0.03% 276 0.13%TOGO 77 0.04% 303 0.14%TRINIDAD AND TOBAGO 358 0.20% 584 0.27%
TUNISIA 275 0.16% 501 0.23%TURKEY 814 0.46% 1,040 0.48%TURKMENISTAN 66 0.04% 292 0.13%UGANDA 233 0.13% 459 0.21%UKRAINE 1,346 0.76% 1,572 0.72%
UNITED ARAB EMIRATES 656 0.37% 882 0.40%UNITED KINGDOM 8,565 4.83% 8,791 4.03%UNITED STATES 32,564 18.36% 32,790 15.02%URUGUAY 202 0.11% 428 0.20%UZBEKISTAN 175 0.10% 401 0.18%
VANUATU 50 0.03% 276 0.13%VENEZUELA, REPUBLICA BOLIVARIAN 1,427 0.80% 1,653 0.76%VIETNAM 388 0.22% 614 0.28%YEMEN, REPUBLIC OF 155 0.09% 381 0.17%ZAMBIA 318 0.18% 544 0.25%
ZIMBABWE 236 0.13% 462 0.21%
TOTAL 177,331 100.00% 218,237 100.00%
DEVELOPED MEMBER TOTALS 103,540 58.39% 109,190 50.03%
DTC GROUP TOTAL 73,791 41.61% 109,047 49.97%
CATEGORY ONE TOTAL 103,486 58.36% 109,136 50.01%
CATEGORY TWO TOTAL 73,845 41.64% 109,101 49.99%
MIGA Capital Status - ACTUAL (08/10/2015)
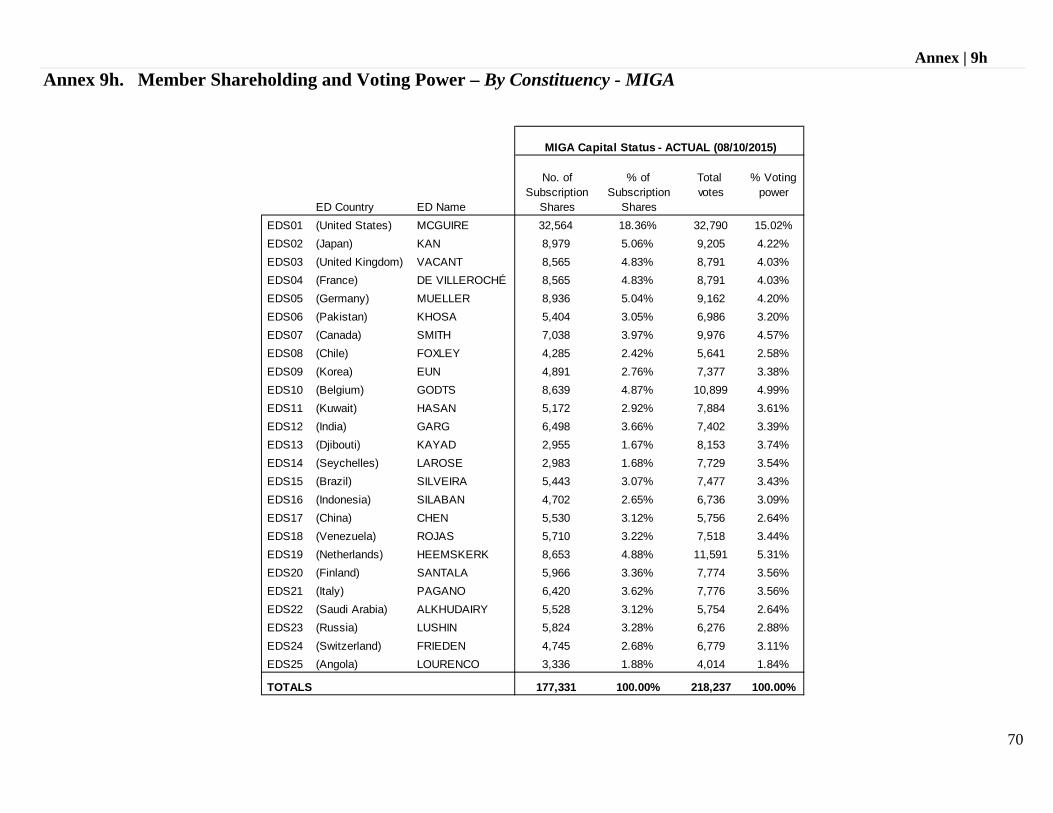
Annex | 9h
70
Annex 9h. Member Shareholding and Voting Power – By Constituency - MIGA
No. of % of Total % Voting Subscription Subscription votes power
ED Country ED Name Shares Shares
EDS01 (United States) MCGUIRE 32,564 18.36% 32,790 15.02%
EDS02 (Japan) KAN 8,979 5.06% 9,205 4.22%
EDS03 (United Kingdom) VACANT 8,565 4.83% 8,791 4.03%
EDS04 (France) DE VILLEROCHÉ 8,565 4.83% 8,791 4.03%
EDS05 (Germany) MUELLER 8,936 5.04% 9,162 4.20%
EDS06 (Pakistan) KHOSA 5,404 3.05% 6,986 3.20%
EDS07 (Canada) SMITH 7,038 3.97% 9,976 4.57%
EDS08 (Chile) FOXLEY 4,285 2.42% 5,641 2.58%
EDS09 (Korea) EUN 4,891 2.76% 7,377 3.38%
EDS10 (Belgium) GODTS 8,639 4.87% 10,899 4.99%
EDS11 (Kuwait) HASAN 5,172 2.92% 7,884 3.61%
EDS12 (India) GARG 6,498 3.66% 7,402 3.39%
EDS13 (Djibouti) KAYAD 2,955 1.67% 8,153 3.74%
EDS14 (Seychelles) LAROSE 2,983 1.68% 7,729 3.54%
EDS15 (Brazil) SILVEIRA 5,443 3.07% 7,477 3.43%
EDS16 (Indonesia) SILABAN 4,702 2.65% 6,736 3.09%
EDS17 (China) CHEN 5,530 3.12% 5,756 2.64%
EDS18 (Venezuela) ROJAS 5,710 3.22% 7,518 3.44%
EDS19 (Netherlands) HEEMSKERK 8,653 4.88% 11,591 5.31%
EDS20 (Finland) SANTALA 5,966 3.36% 7,774 3.56%
EDS21 (Italy) PAGANO 6,420 3.62% 7,776 3.56%
EDS22 (Saudi Arabia) ALKHUDAIRY 5,528 3.12% 5,754 2.64%
EDS23 (Russia) LUSHIN 5,824 3.28% 6,276 2.88%
EDS24 (Switzerland) FRIEDEN 4,745 2.68% 6,779 3.11%
EDS25 (Angola) LOURENCO 3,336 1.88% 4,014 1.84%
177,331 100.00% 218,237 100.00%
MIGA Capital Status - ACTUAL (08/10/2015)
TOTALS

Annex | 10
71
Annex 10. Phases 1 and 2 of Voice Reform and the 2010 Approach to
Realignment
1. Enhancing the participation of developing and transition countries (DTC)1 in World Bank Group (WBG) governance has been on the agenda of the Development Committee since the 2002 conference on Development Financing in Monterrey, where both the World Bank and the International Monetary Fund (IMF) were encouraged “to continue to enhance participation of all developing countries and countries with economies in transition (DTC) in their decision making and thereby to strengthen the international dialogue and the work of these institutions as they address the development needs and concerns of these countries.” (The Monterrey Consensus).2 2. In 2008, World Bank Group (WBG) Shareholders agreed to undertake a two-phase package of reforms (“The Voice Reform”) with the key objectives of ensuring equitable participation in the Bank’s governance of all developing countries and countries with economies in transition, and enhancing the legitimacy, credibility and accountability of WBG operations. Equitable participation of all DTCs would be achieved through two goals: “progress in adjusting voting rights and shareholding in terms of economic weight and responsibilities for development mandate; and strengthen voice and participation of small countries where the Bank plays an important financing and advisory role.” 3. With these objectives and guiding principles agreed by stakeholders, the Voice Reform had three pillars: (1) voice as shareholding; (2) voice as responsiveness; and (3) voice as effective representation at the Board. 4. Phase 1 Voice Reform was approved by the Governors in 2009 and led to an increase in developing countries’ shares in IBRD to 44.06% (and beyond that in IDA) achieved through increase in basic votes. The basic votes were effectively doubled to 5.55% of total votes to strengthen voting power of small countries, most of which were DTCs. In addition, an exceptional allocation of unallocated Bank shares was made to 16 DTCs so that their voting power was not diluted by the proposed increase in basic votes. These DTCs were: Argentina, Brazil, China, India, Indonesia, Islamic Republic of Iran, Republic of Korea, Kuwait, Mexico, Nigeria, Poland, Russian Federation, Saudi Arabia, South Africa, Ukraine, and Republica Bolivariana de Venezuela (R.B. de Venezuela did not subscribe to additional shares) (SecM2013-0316). On Representation, there was an agreement to create a new chair for Sub-Saharan Africa. On Responsiveness, there was commitment to strengthen Board effectiveness, to deepen responsiveness to DTC views on development by expanding field presence and decentralization of Bank staff and increasing access to information of Bank operations to shareholders, and to establish a merit-based and transparent selection of the Bank’s President.
1 “While IBRD does not have formal classifications of members as developed and DTC, the 2008 Phase 1 reforms adopted the same identification of developing members as used in the IMF reforms in that year, to facilitate comparison of the resulting Phase 1 increase in IBRD DTC voting power with the 2008 IMF increase. Since Phase 2 and Phase 1 together form part of the WBG Voice Reforms, the same DTC classification used in Phase 1 would be used to measure the increase in DTC voting power in Phase 2. In future adjustments of IBRD shareholding, there may be need to revise this classification, bearing in mind IBRD's multilateral nature without predetermined membership blocs.” (DC2009-0011). 2 “Monterrey Consensus on Financing for Development”, International Conference on Financing for Development, Monterrey, México, March 18-22, 2002.
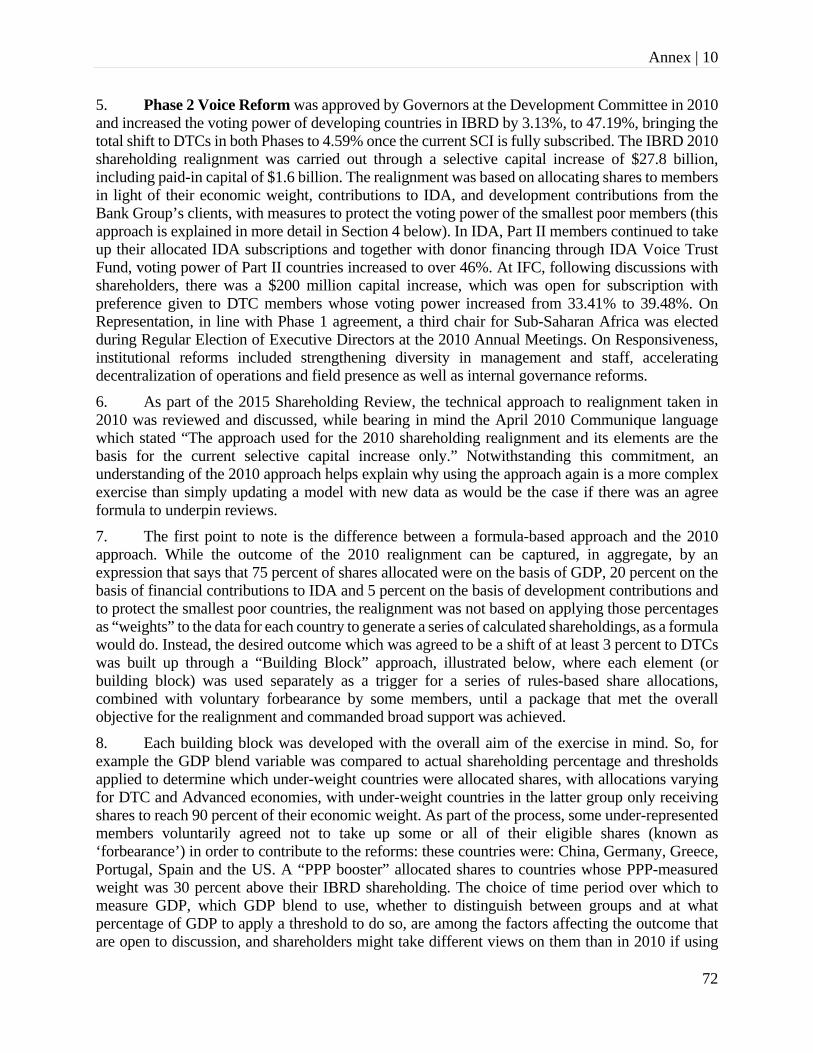
Annex | 10
72
5. Phase 2 Voice Reform was approved by Governors at the Development Committee in 2010 and increased the voting power of developing countries in IBRD by 3.13%, to 47.19%, bringing the total shift to DTCs in both Phases to 4.59% once the current SCI is fully subscribed. The IBRD 2010 shareholding realignment was carried out through a selective capital increase of $27.8 billion, including paid-in capital of $1.6 billion. The realignment was based on allocating shares to members in light of their economic weight, contributions to IDA, and development contributions from the Bank Group’s clients, with measures to protect the voting power of the smallest poor members (this approach is explained in more detail in Section 4 below). In IDA, Part II members continued to take up their allocated IDA subscriptions and together with donor financing through IDA Voice Trust Fund, voting power of Part II countries increased to over 46%. At IFC, following discussions with shareholders, there was a $200 million capital increase, which was open for subscription with preference given to DTC members whose voting power increased from 33.41% to 39.48%. On Representation, in line with Phase 1 agreement, a third chair for Sub-Saharan Africa was elected during Regular Election of Executive Directors at the 2010 Annual Meetings. On Responsiveness, institutional reforms included strengthening diversity in management and staff, accelerating decentralization of operations and field presence as well as internal governance reforms. 6. As part of the 2015 Shareholding Review, the technical approach to realignment taken in 2010 was reviewed and discussed, while bearing in mind the April 2010 Communique language which stated “The approach used for the 2010 shareholding realignment and its elements are the basis for the current selective capital increase only.” Notwithstanding this commitment, an understanding of the 2010 approach helps explain why using the approach again is a more complex exercise than simply updating a model with new data as would be the case if there was an agree formula to underpin reviews. 7. The first point to note is the difference between a formula-based approach and the 2010 approach. While the outcome of the 2010 realignment can be captured, in aggregate, by an expression that says that 75 percent of shares allocated were on the basis of GDP, 20 percent on the basis of financial contributions to IDA and 5 percent on the basis of development contributions and to protect the smallest poor countries, the realignment was not based on applying those percentages as “weights” to the data for each country to generate a series of calculated shareholdings, as a formula would do. Instead, the desired outcome which was agreed to be a shift of at least 3 percent to DTCs was built up through a “Building Block” approach, illustrated below, where each element (or building block) was used separately as a trigger for a series of rules-based share allocations, combined with voluntary forbearance by some members, until a package that met the overall objective for the realignment and commanded broad support was achieved. 8. Each building block was developed with the overall aim of the exercise in mind. So, for example the GDP blend variable was compared to actual shareholding percentage and thresholds applied to determine which under-weight countries were allocated shares, with allocations varying for DTC and Advanced economies, with under-weight countries in the latter group only receiving shares to reach 90 percent of their economic weight. As part of the process, some under-represented members voluntarily agreed not to take up some or all of their eligible shares (known as ‘forbearance’) in order to contribute to the reforms: these countries were: China, Germany, Greece, Portugal, Spain and the US. A “PPP booster” allocated shares to countries whose PPP-measured weight was 30 percent above their IBRD shareholding. The choice of time period over which to measure GDP, which GDP blend to use, whether to distinguish between groups and at what percentage of GDP to apply a threshold to do so, are among the factors affecting the outcome that are open to discussion, and shareholders might take different views on them than in 2010 if using

Annex | 10
73
this approach again. 9. The measures of IDA contributions (recent and historical) each triggered allocations for countries that met a threshold of generosity relative to benchmarks. To minimize dilution of non- participating members, the total number of shares to be allocated to all eligible members was reduced by a fixed percentage of 6.6%. After this reduction was applied, protection for the poorest was achieved by an allocation to low income and low middle income countries whose shareholding was below 0.4% and whose shareholding would have been adversely affected. Again, it should be noted that there are choices to be made when using IDA contributions, for example on which years to be chosen and how to calculate generosity that affect the outcome and where shareholders may not necessarily agree to use the same methods and options used in 2010. 10. Each of these building blocks was assessed separately, with the 75/20/5 “weights” emerging as the overall outcome of the process, not the basis for it. 11. In other words, the 2010 building block approach – unlike a dynamic formula - is not a statistical tool that can simply be updated. It is certainly an approach that can be taken again if there is support to do so. Most importantly, this would require agreement on the overall objective to be achieved – for example on the size of a shift in shareholding and the definition of the group of countries to benefit – in order to be able to determine how to develop the rules for each of the building blocks. There would then need to be discussion and agreement on the multiple next-level decisions necessary, for example on the choices of which data to use and the thresholds and rules to determine the share allocation for each building block in the approach. (In this context, additional elements which were discussed in 2010 but not agreed as part of the outcome, such as whether to allocate shares for contributions to trust funds or for contributions through interest payments to the capital of IBRD, would most likely need to be discussed again). The outcome would not be a dynamic formula as Governors anticipated in 2010, but a further set of building blocks that generate allocations designed to produce the agreed target. (See Figure 1.)

Annex | 10
74
Figure 1: Illustration of the Building Block Model

Annex | 11
75
Annex 11. Representation I. Board Effectiveness
1. The WBG Board has consistently sought to enhance its effectiveness, including through increasing strategic focus. The Board Effectiveness agenda has been discussed regularly at COGAM, informed by Board Self-Assessment exercises, and rules and procedures have been reviewed and updated to improve the work of the Board. For example, more effective linkages are being made between the Standing Board Committees consultations and Board deliberations. Modifications to IFC Streamlined procedures have been implemented. Steering Committee (SC) meetings are now held bi-monthly. 2. The 2015 Shareholding Review provides an opportunity to explore further Board Effectiveness issues under the aegis of the ‘Responsiveness and Representation’ pillars of Voice reforms, as well as to continue to pursue the broader objective of enhancing the fiduciary and oversight role of the Board. This section notes some issues that could be considered further.
(i) Size of Committees 3. The guidelines for appointments to, and membership in, Standing Committees have been the subject of several careful reviews, modifications, and decisions by the Board over the years, with the most recent review completed in 2009. This led to the 2009 Resolution on Standing Committees (No. 2009-0002), which today provides a strong platform and balanced approach to guide the appointment process. The establishment of the 25th Board Chair in 2010, however, has had an impact on Committee composition, in that up to three Executive Directors going forward would have to serve on only one committee at a time (as occurred in the 2010 appointments). 4. The 2011 COGAM retreat considered various scenarios regarding modifications to the size of committees (increasing/decreasing the number of members) to address committee composition issues; however the disadvantages – disturbing the principle of borrowing/non-borrowing balance, possible impact on the role of committees – were felt at that time to outweigh the potential benefits. 5. The two following principles were upheld:
(a) The principle of ‘balanced representation between borrowing and non-borrowing member countries’ as stated in the 2009 Resolution prevails in determining whether the incoming Executive Director is appointed to one or two Standing Committees; if the incoming Executive Director is appointed to only one committee, then membership in the second committee vacated is filled by a ‘single-committee’ Executive Director.
(b) The principle to guide the determination of single-committee members in the possible scenarios for the next Board would continue to be based on voluntary choice by Executive Directors; or based on ‘fairness’ where the Executive Directors who have had the most recent single-committee memberships would not become single-committee members again, and appointments would consider seniority.
6. It was noted at the 2011 retreat that the current system for appointments to committees continues to work well, but should be considered an art, not a science.

Annex | 11
76
II. Strategic focus of the Board
(i) Project Selection 7. In February 2013, the Board approved the Principles Based Approach to selecting projects for Board discussion, designed to improve the selection of projects for discussion with an increased focus on risk and areas of interest to the Board. In May 2014, COGAM completed the one-year review of the implementation of this approach and endorsed its continued operation. 8. As an outcome of enhancing the strategic focus of Board discussions, several initiatives were implemented.
Quarterly discussions on operations, chaired by the Chief Operating Officer, have been introduced;
IEG Annual Report on WBG Results and Performance (RAP) is discussed directly with the Board;
OPCS’s update on Quality was discussed at the Board; and The Board discusses IEG Portfolio Report, and also OPCS Retrospective Reviews.
(ii) Better Board-Committee Alignment
9. The topic of Board-Committee alignment has been discussed previously at COGAM. Several initiatives to better align Board and Committees are already in effect, for example:
Issues requiring policy changes are discussed first in the relevant Committee for endorsement; broader consultations of Directors are conducted via Board Seminars (e.g. Procurement and Safeguards).
Issues that require a policy change should go to CODE for endorsement, while broader consultation of Directors on these is managed through open Board Seminars. For example, the Board will be engaged on the new Country Partnership Framework as it is developed in advance of CODE consideration of changes to the OP in June.
The Corporate Scorecard goes to the Board, unless there is a need to dive into details in specific areas, in which case CODE will consider those areas.
Procurement and Safeguards will come to CODE for specific discussions of policy changes, but Management has conducted a series of Technical Briefings for the whole Board on Procurement and Safeguards Reforms, which will take place once a month.
IEG's Annual Report on Bank Activities and Results (RAP) is already coming to the Board instead of CODE.
OPCS's update on Quality also was brought to the Board instead of CODE. IEG is working on a new product – an overall assessment of Country Programs, which
will also be a candidate for the Board to discuss instead of CODE.
10. In addition, there may be scope to take the realignment further. One set of candidates could be items currently discussed in Joint Meetings of Committees, which already involve half of the Board. Previously, some of these items went both to Committees and Board, which tended to lead to repetitive discussions. Again, consideration of Joint Committee items at the level of the full Board could strengthen the strategic and corporate focus of the discussion. The main candidates are the

Annex | 11
77
IFC Strategy and Business Outlook1 and the MIGA Strategy.
11. It has been suggested by Executive Directors that the Board conduct a ‘risk check’ to determine whether in light of recent changes in the WBG structure, all risks are adequately covered within the mandate and TORs of each Standing Committee of the Board.
III. Building Capacity of Board Members
(i) Tailored training/facilitation module for the Board
12. It has been suggested by Executive Directors to develop existing training opportunities including by developing:
Targeted training for Committee members on core competencies for each Committee. Targeted training for Board members, in smaller groups on collective behaviors to enhance
Board efficiency.
(ii) IT/modernization and simplifications measures 13. There are several information and knowledge tools that are available to EDs and staff in their offices to support them in their functions and in turn, enhance board effectiveness by allowing better and easier collaboration, information sharing and informal discussions among Board members. These include:
eCenter: facilities the processes related to Board and Committee meetings, including preparation and submission of EDs’ statements and actions such abstention, opposition, request for discussion and postponement. eCenter II will provide a comprehensive platform by migrating all other critical tools- including Board and Committee calendars and integrate with other WBG systems.
myOffice: internal system for each of the 25 EDs’ offices, allowing work program assignments, document sharing and collaboration within the office.
Electronic access to Board transcripts: secure database providing Board officials electronic access to current transcripts of Board and Committee meetings
I. Size and Composition of the Board 14. The size of the Board and its constituency structure seeks to strike a balance between representation and efficiency in decision making. The first Board of Executive Directors consisted of 12 Executive Directors, of which 5 were appointed (in line with the Articles) and 7 were elected. The number of elected Executive Directors increased to 192 in 1992 as a result of expansion in the
1 Please note that if the IFC Strategy and Business Outlook is brought to the full Board, it would be to an Informal Board Meeting, as the Board does not approve IFC’s strategy, but endorses it in a Committee of the Whole. 2 When governments of other countries become members, the Board of Governors may, by a four-fifths (80%) majority of the total voting power, increase the total number of directors by increasing the number of Executive Directors to be elected (Article V, Section 4(b), IBRD Articles of Agreement).

Annex | 11
78
Bank's membership. The increase to 20 elected Executive Directors to add a third Director for Sub- Saharan Africa was agreed by the Development Committee in October 2008 and approved by the Board of Governors in January 2009. 15. Executive Directors are either appointed or elected every two years through regular elections. Under Article V, Section 4 (b) (i) of the Bank’s Articles of agreement, the five members having the largest number of shares shall appoint an Executive Director, with the remaining Executive Directors being elected. Appointed Executive Directors may only represent the countries that appoint them and do not form constituencies with other countries. A few elected chairs represent only one country. A move to an all-elected Board with no appointed Executive Directors would create scope for the formation of additional multi-country constituencies over time, and so open up the potential for further rotation among Executive Directors. However, as this would require an IBRD Articles amendment, it would require a high degree of political commitment. (An equivalent change agreed at the IMF in 2010 has not yet been implemented as the required Articles amendment has not yet been approved).
16. With the 2010 voice reforms, China became the third largest shareholder and the United Kingdom and France the joint fifth largest shareholders, as the latter two countries hold the same amount of voting shares. Since the Bank’s Articles provide that five Executive Directors are appointed “one by each of the five members having the largest number of shares”, this raised the question of what to do when two members hold an equal place as the fifth largest shareholder. The Executive Directors opted to resolve “solely as a temporary measure” that France and the United Kingdom could each appoint an Executive Director “until the first Board election of Executive Directors after 2015.”3 An extension of this resolution was submitted to the Board of Executive Directors for approval on August 2015. 17. Executive Directors of the Bank serve ex-officio as Executive Directors of IFC and IDA, as long as the country that appoints them, or any one of the countries that have elected them, is a member of IFC and IDA. All members of the MIGA Board of Directors are elected. 18. Constituency formation is subject to limits on the minimum and maximum percentage of eligible votes that an elected Executive Director casts, with the limits forming part of the election rules approved by Governors. In 2014, the limits were set at a minimum of 2% and a maximum of 10% of eligible votes. Provided they respect these limits on voting power, countries are free to form a constituency with other member countries. Constituencies are typically governed by internal agreements reached by the members of the constituencies. Neither the Articles of Agreement nor the bylaws of the Bank provide guidance on how to come to these arrangements, which are voluntarily entered into by constituency members. Such agreements typically set out the agreement on rotation of available positions within the Executive Director’s office. Changes in the agreed rotation of the Executive Director and Alternate Executive Director positions in particular have the potential to make an impact on how different countries are represented at the Board. As noted, however, constituency agreements are voluntary and a matter for the constituency members.
3 See Executive Directors’ Resolution No. IBRD 2010-0003, “IBRD Articles of Agreement – Interpretation of Article V, Section 4(b)(i), M2010-0047, and the President’s Memorandum entitled “Interpretation of the Bank’s Articles of Agreement Regarding Appointment of Executive Directors by the Five Largest Shareholders – Revised Resolution and Extension of Deadline,” R2010-0165/3, dated July 1, 2010.

Annex | 12
79
Annex 12. Diversity and Inclusion
1. The World Bank Group is recognized as a leader among international organizations in its commitment to excellence through diversity and inclusion, and in its resolve to address issues of fairness and equality irrespective of nationality, gender, race, age, sexual orientation, and disability. Its workforce comprises women and men across four generations from 180 nationalities with over 140 mother tongues, including over 8700 who report speaking two or more languages. 2. The WBG measures its progress towards becoming a more diverse and inclusive workplace based on three pillars: advocacy (leadership and partnerships), accountability (targets and metrics), and inclusion (behavior and learning). In the area of advocacy, the WBG has made significant progress, including the first WBG statement of commitment to diversity and inclusion (D&I) issued by the President and his Senior Management Team (SMT). The statement has been published internally and externally on the WBG website. Additionally, the first top-level D&I Compact, detailing specific D&I targets and concrete actions to achieve them, was developed and signed by the SMT. To cascade the commitment and help take the agenda forward, all VPUs have selected D&I Advocates from among their managers and staff. Working with their Advocates, VPs and their Management teams have developed and signed VPU-level Compacts, which will be monitored by the SMT on a quarterly basis. 3. In order to embed D&I firmly throughout the Bank Group, the Diversity and Inclusion program now reports to both the HRDVP and the President’s office, through the Chief of Staff. Additionally, a World Bank Group Council on Diversity and Inclusion (CDI) has been established. The CDI reports to the President and the SMT, advising them on strategies and initiatives to achieve a fully diverse and inclusive workplace. The CDI is composed of leaders and staff from across the WBG. Furthermore, in order to learn from external best practices, the President has convened an External Advisory Panel on D&I, composed of six D&I champions from the private and public sectors, as well as academia. Initially convened in May 2015, the Panel serves as an advisory board that reviews and guides the implementation of the WBG D&I action plan and helps engage with critical internal and external stakeholders. 4. In the area of accountability, the organization has continued to make incremental progress against the institutional diversity targets over the past several years. Nationality, gender and race are the dimensions of diversity for which the WBG has set and monitored quantitative targets since 1998. Nationality has been measured in the aggregate by Part I/Part II member status, while Sub-Saharan African and Caribbean (SSA/CR) nationality has served as the proxy for race. Since establishment of the initial indicators and targets, the WBG has modified the indicators and increased the targets in order to ensure that the indicators reflect the true diversity of the WBG, foster desired behaviors for an inclusive work environment, and support the culture change needed to meet the twin goals. The most recent update for the indicators and targets was in January 2015:
Part II Managers: target increased from a range of 43-48.5% to 50% Women at grades GF-GG: indicator changed to include all women at Grades GF+ in
technical, non-managerial roles, with a target of 50% Women Managers and Sub-Saharan African/Caribbean Staff at Grades GF+: no change
in indicators, with targets remaining at 50% and 12.5%, respectively
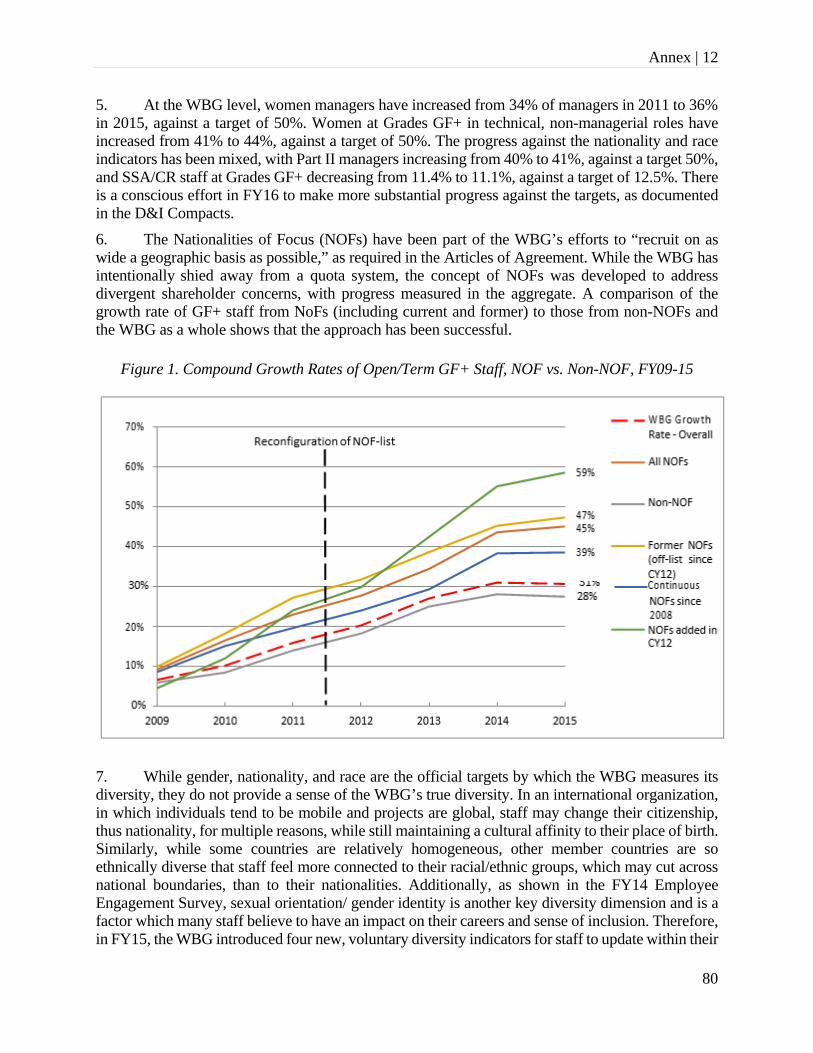
Annex | 12
80
5. At the WBG level, women managers have increased from 34% of managers in 2011 to 36% in 2015, against a target of 50%. Women at Grades GF+ in technical, non-managerial roles have increased from 41% to 44%, against a target of 50%. The progress against the nationality and race indicators has been mixed, with Part II managers increasing from 40% to 41%, against a target 50%, and SSA/CR staff at Grades GF+ decreasing from 11.4% to 11.1%, against a target of 12.5%. There is a conscious effort in FY16 to make more substantial progress against the targets, as documented in the D&I Compacts. 6. The Nationalities of Focus (NOFs) have been part of the WBG’s efforts to “recruit on as wide a geographic basis as possible,” as required in the Articles of Agreement. While the WBG has intentionally shied away from a quota system, the concept of NOFs was developed to address divergent shareholder concerns, with progress measured in the aggregate. A comparison of the growth rate of GF+ staff from NoFs (including current and former) to those from non-NOFs and the WBG as a whole shows that the approach has been successful.
Figure 1. Compound Growth Rates of Open/Term GF+ Staff, NOF vs. Non-NOF, FY09-15
7. While gender, nationality, and race are the official targets by which the WBG measures its diversity, they do not provide a sense of the WBG’s true diversity. In an international organization, in which individuals tend to be mobile and projects are global, staff may change their citizenship, thus nationality, for multiple reasons, while still maintaining a cultural affinity to their place of birth. Similarly, while some countries are relatively homogeneous, other member countries are so ethnically diverse that staff feel more connected to their racial/ethnic groups, which may cut across national boundaries, than to their nationalities. Additionally, as shown in the FY14 Employee Engagement Survey, sexual orientation/ gender identity is another key diversity dimension and is a factor which many staff believe to have an impact on their careers and sense of inclusion. Therefore, in FY15, the WBG introduced four new, voluntary diversity indicators for staff to update within their

Annex | 12
81
HR profile: nationality at birth; multiple nationalities; race/ethnicity; sexual orientation/gender identity. The information is completely confidential and will only be used in the aggregate to identify trends in talent management processes. 8. The third pillar, inclusion, has received increased focus and attention over the past year. In FY14, the WBG introduced the Inclusion Indicator as part of the Corporate Scorecard. Based on questions from the Engagement Survey which measure staff perception of inclusion and management behavior, the indicator provides a comparable measure which can be monitored for improvement year-on-year. Actions taken to increase staff behavior include development and implementation of a D& learning curriculum, with programs on topics such as unconscious bias and gender communications. Additionally, the WBG has increased the opportunity for staff to contribute personally to the D&I agenda through the expansion and support of employee resource groups. Finally, on International Women’s Day 2015, President Kim announced that the World Bank Group would pursue EDGE Certification. Launched at the World Economic Forum in 2011, EDGE is widely regarded as the global standard for workplace gender equality, ensuring that certified organizations have a structured, systematic approach to measure, track, and close the workplace gender gap. Noting that only seven organizations have achieved EDGE Certification to-date, President Kim stated, “I want us to be part of this group because it is the right thing to do and will ensure that we attract and retain the best development talent available. The process will make us both a better place to work and more effective.”