2015 - · pdf fileannual report 2015 orion new zealand limited / 3. ... programme, which...
TRANSCRIPT

Orion New Zealand LimitedAnnual report
2015

Orion New Zealand Limited owns and operates the electricity distribution network in Christchurch and central Canterbury.
We’re one of the largest networks in New Zealand and we’re owned by the Christchurch City Council (89.3%) and Selwyn District Council (10.7%).
Our core purpose is to deliver a safe, secure and cost-effective supply of electricity to our 191,000 customers.
ContentsChairman and chief executive’s review ............................................................... 2
Audited financial statements ...................................................................................... 9
Corporate governance statement ........................................................................ 44
Five-year trends ............................................................................................................. 50
Directory ............................................................................................................................. 52
Who we are

Key financial results$83m net profit > $32m above last year> $24m boost from quake insurance claims
$167m electricity distribution revenue > $19m above last year
$52m network expenses > $1m below last year
$87m capital expenditure > $3m above last year
$56m dividends > $22m above last year
$86m interest bearing debt > $10m above last year
$1,084m total assets > $44m above last year
Key network results3,300GWh electricity delivered > 100GWh above last year
590MW network maximum demand > 29MW below last year
191,000 network connections > 2,100 above last year> 3,500 new connections> 1,400 disconnections
99.98% network reliability
FRONT COVER: We have recently purchased a Nissan Leaf as one of our pool vehicles. It’s fully electric and has a range of 120km for around town running. A full charge takes around six hours and costs around $1.50 at night rates.
THESE PAGES: A Transfield line mechanic replacing earth wires on 66kV pylons near Lincoln.
Annual Report 2015 Orion New Zealand Limited / 1

Chairman and chief executive’s reviewElectricity is vital to the wellbeing of our community.Our role is to provide our 191,000 customers with a safe, dependable and cost-effective power supply. We also aim to meet the needs of the wider post-quake rebuild. To that end, we’re restoring our network to pre-quake levels and we’re well on the way to achieving that by 2019.
Our network connections grew by 2,100 during the year and now exceed our pre-quake level for the first time.
Annual Report 2015 Orion New Zealand Limited / 2
BELOW: Chief executive, Rob Jamieson (left) and chairman, Jeremy Smith at our new Waimakariri zone substation.

Keeping the lights onPrior to the quakes, our electricity distribution network was among the most resilient and reliable in New Zealand. We’re continuing our efforts to restore those levels of service.
We need to balance investment in a safe, high performing electricity network service with the willingness of customers to pay for that. The consistent feedback from our customers is that we’re getting that balance about right.
We’ll invest $300m in our network over the next four years as we continue to support the wider rebuild, restore our customer service levels, and respond to the needs of a changing region.
It’s well known that there’s a general population and business move to the west and north of the city. The Christchurch CBD rebuild has also started in earnest.
As part of our support for these trends, we’re well underway with our major projects to install new high voltage 66kV underground cables across the north of the city. Together with our just completed Waimakariri and our planned Marshland zone substations, we intend to complete these major projects before winter 2018.
After balance date, we substantially completed two important eastern suburbs high voltage 66kV underground cable projects from the Bromley grid exit point. The new cables terminate at our Dallington and Rawhiti zone substations and they replace our underground cables that were damaged beyond repair in the quakes. We’ll remove our two temporary overhead lines this coming spring.
These major projects will effectively complete our city-wide 66kV interconnected ring, and so will enhance the robustness of our whole urban network.
We have also completed more than half of our 11kV underground cable repairs and we have replaced 70% of our damaged power poles.
Two major weather events affected our network during the year. Strong winds and heavy rain struck Banks Peninsula in April 2014 and a wind storm hit rural Canterbury in November. High voltage cable damage or failure caused three significant urban outages.
On average, our customers had 1.2 network outages during the year and around two hours without power. Our network reliability is still better than average by New Zealand standards but our network outages are higher than the pre-quake levels.
We complied with the Commerce Commission’s customised network reliability limits over the last year as well as the Commission’s price limit.
While we forecast that network maximum demand will continue to increase by about 1% per year, actual system peaks can vary significantly from year to year due to weather variations. Our peak of 590 megawatts on 21 July 2014 was 21 megawatts below the previous year’s maximum.
ABOVE: An overhead line corrosion detector, known as a cormon, being used to check for early signs of corrosion damage.
Annual Report 2015 Orion New Zealand Limited / 3

Keeping it safeSafety is our single biggest priority and we take all practicable steps to ensure that our people, our contractors and the public are safe around our network.
The wider rebuild poses particular safety risks – with more contractors working on more projects and sometimes under considerable time pressure, and in difficult conditions.
So we’re continuing to work with third party contractors and the rural community on safety around our network. We run information booths at four local A&P shows and agricultural field days, and we also use radio and print media to promote safety messages, such as the need for tree owners to keep trees away from overhead lines and the importance of emergency preparedness.
We have simplified our network access consent process and we have introduced new innovations such as annual consents for organisations that meet our high safety standards. Pleasingly, since the quakes there have been no serious harm electrical accidents related to consented work.
We’re continuing to improve our safety and risk resources and systems, including a newly-created position on our executive team.
Electricity is essential for heating in Canterbury – especially with our cold winters, clean air regulations and lack of reticulated gas. A resilient and reliable electricity network is essential for keeping our community safe and warm.
ABOVE: A contractor installing a household solar photovoltaic (PV) system. PV and other forms of distributed power generation are becoming more common on our network.
BELOW: Control centre manager Dayle McDrury and network controller Jeremiah Torres reviewing switching arrangements for planned work on our network.
Annual Report 2015 Orion New Zealand Limited / 4

Financial performanceThis year’s net profit was $83m. This was $35m above our statement of intent target and $32m above last year.
A big part of this year’s profit is the final cash settlement of our quake insurance claims. This added $24m after tax to this year’s profit.
The settlement largely related to our many substation repairs and our general business interruption costs. Including settlements in earlier years, our quake insurance proceeds have totalled more than $53m. We’re pleased to have settled these complex claims.
We’re investing far more than our insurance receipts to restore our network, to support the wider rebuild and to meet the needs of a changing region. We’ve invested over $80m in network related capex in each of the last two years, and we’ll top that again in the coming year. This is more than $30m a year above normal capex levels.
We’re continuing to control our operating costs. Our network operating costs were around $1m below last year’s.
We paid $56m of fully imputed dividends to our shareholders, $10m above our statement of intent target and $22m above last year.
As we noted last year, our debt is rising due to our significant capital expenditure programme. Our major expenditure should be largely complete by 31 March 2018.
As we also noted last year, we have reviewed our capital structure. Following that review, we’re now planning to return $90m of capital to our shareholders by way of a pro-rata share buy-back, subject to acceptable rulings from Inland Revenue. This will reduce our shareholders’ equity and increase our interest bearing debt by $90m, moving the company towards a more efficient capital structure, well within prudent levels.
Connetics continues to contribute strongly to the group’s financial performance – its net profit was 37% above last year. Connetics is busy with significant post-quake commercial and residential development workloads, at levels that will continue for some time.
BELOW: A team from Connetics installing a 66kV cable connecting our Papanui and new Waimakariri zone substations.
Annual Report 2015 Orion New Zealand Limited / 5

Our community Our peopleWe’re proud to be a foundation sponsor of Community Energy Action (CEA), a charitable organisation that provides home insulation and energy advice to those with the greatest need in our community. This year, our $150,000 sponsorship helped CEA to insulate more than 1,000 local homes and undertake more than 600 home assessments.
We sponsored the first EVolocity event, where 16 local high school teams designed, built and raced electric vehicles at a local track. We’re continuing our sponsorship of this annual event.
The historic Orion Powerhouse Gallery in Akaroa reopened in November 2014. This 104-year-old brick building was badly damaged in the quakes, and we have restored it to 100% of the new building standard. The restoration of the building and its historic generator was recognised with a 2014 Vero Canterbury Heritage Award.
We also sponsor the Christchurch Arts Festival, the Canterbury Rams basketball team and the large replay screen at AMI Stadium.
We have highly skilled, experienced and committed employees, and we aim to develop and maintain the best possible team. We encourage values-based behaviour from our employees.
We also encourage formal and on-the-job training and development, and we adopt appropriate and flexible working arrangements.
Our engineering development programme is vital for our ongoing succession planning. We also support electrical apprenticeships through the TradeFIT campus at CPIT. Our wider leadership development coaching helps our managers lead their people.
We have high participation in our employee wellness programme, which includes health seminars and checks, counselling services, quake support, and fitness and healthy eating promotions.
Annual Report 2015 Orion New Zealand Limited / 6
ABOVE: The opening of the restored and strengthened Orion Powerhouse Gallery in Akaroa.
LEFT: Canterbury Rams centre Mickell Gladness (left) and coach Mark Dickell talking to Orion staff about the team’s aspirations for the 2015 season.

AcknowledgementsThe futureWe have responded to the damage to our network and wider rebuild needs. This will continue, but also we need to focus on Orion’s long-term future.
We’ll need to assess and adapt to new technologies, and capture the related opportunities. For example, growth in electric vehicles, household solar photovoltaic systems and other forms of distributed power generation systems will most likely become more common.
Even with these technology innovations, we believe that a safe, resilient and reliable electricity distribution network will remain essential for our community for the foreseeable future.
The ongoing dedication of Orion and Connetics employees is critical to our continued success – particularly in this post-quake period of heightened workloads. We thank all of our people for their professionalism and commitment to providing our essential service.
Craig Boyce retired from the board in August 2014 after 12 years’ service – the last eight as chairman. We thank Craig for his astute guidance, particularly in the eventful post-quake years.
Nicola Crauford and Bob Simpson joined the board in August 2014 and have already made welcome contributions. We thank all the directors for their time and commitment to the company during the year.
JEREMY SMITH CHAIRMAN ROB JAMIESON CHIEF EXECUTIVE OFFICER
10 June 2015
Annual Report 2015 Orion New Zealand Limited / 7
TOP: A Tesla S electric vehicle competing at the Orion sponsored EVolocity event last November.
ABOVE: The overall winners of the EVolocity high school competition, Geraldine High School, putting their vehicle through its paces at the event.

Annual Report 2015 Orion New Zealand Limited / 8
ABOVE: Operation services manager Gavin Bonnett (right) discussing load management with Ravensdown works manager Peter Hay.

Audited consolidated financial statements
The board of directors is pleased to present the audited consolidated financial statements of Orion New Zealand Limited and its subsidiaries for the year ended 31 March 2015.
The company’s audited consolidated financial statements include five audited performance statements:• financial• electricity network reliability• earthquake recovery• environment• community and employment.
Authorised for issue on 10 June 2015.
For and on behalf of the board of directors:
JEREMY SMITH DIRECTOR PAUL MUNRO DIRECTOR10 June 2015 10 June 2015
Audited financial statements 2015 Orion New Zealand Limited / 9

Audited financial statements 2015 Orion New Zealand Limited / 10
Table of contentsFor the year ended 31 March 2015
Consolidated statement of comprehensive income .............................11
Consolidated statement of changes in equity ......................................12
Consolidated statement of financial position .......................................13
Consolidated statement of cash flows .................................................14
Notes to the consolidated financial statements...................................161. Statement of accounting policies2. Operating revenues3. Operating expenses4. Depreciation, amortisation and other impairment expenses5. Interest expense6. Remuneration of the auditor7. Income tax and deferred tax8. Trade and other receivables9. Inventories10. Intangible assets11. Property, plant and equipment12. Trade and other payables13. Borrowings14. Provisions 15. Leases16. Financial instruments17. Share capital18. Related party transactions19. Information about subsidiaries20. Key management personnel21. Capital expenditure commitments22. Contingent liabilities and assets23. Significant events after balance date
Performance statement − consolidated financial ................................35
Performance statement − electricity network reliability .....................36
Performance statement – earthquake recovery ..................................37
Performance statement − environment ...............................................39
Performance statement − community and employment .....................40
Independent auditor’s report ................................................................42

Operating revenues 2 332,894 269,510
Operating expenses 3 (174,530) (160,429)Depreciation, amortisation and other impairment expenses 4 (41,981) (36,473)Earnings before net interest expense and tax (EBIT) 116,383 72,608
Interest income 194 161Interest expense 5 (5,781) (4,995)Net change in fair value of derivatives income/(expense) (751) 1,308Profit before income tax 110,045 69,082
Income tax expense 7 (27,430) (18,627)Net profit 82,615 50,455
Other comprehensive income: Gain on revaluation of property, plant and equipment 11 116 108,894Deferred tax expense on revaluation of property, plant and equipment 7 (33) (29,258) 83 79,636Total comprehensive income 82,698 130,091
2015 2014 Notes $000 $000
The accompanying notes form part of and are to be read in conjunction with these financial statements
Consolidated statement of comprehensive incomeFor the year ended 31 March 2015
Audited financial statements 2015 Orion New Zealand Limited / 11

Audited financial statements 2015 Orion New Zealand Limited / 12
Consolidated statement of changes in equityFor the year ended 31 March 2015
Balance as at 1 April 2013 120,000 491,126 25,779 636,905
Net profit - 50,455 - 50,455Other comprehensive income - - 79,636 79,636Total comprehensive income - 50,455 79,636 130,091
Transfers between reserves: Realised gain on disposal of property, plant and equipment - 34 (34) -Deferred tax reversed on sale of property, plant and equipment - (10) 10 -
Dividends paid - (34,000) - (34,000)Balance as at 31 March 2014 120,000 507,605 105,391 732,996
Net profit - 82,615 - 82,615Other comprehensive income - - 83 83Total comprehensive income - 82,615 83 82,698
Transfers between reserves: Realised gain on disposal of property, plant and equipment - 149 (149) -Deferred tax reversed on sale of property, plant and equipment - (42) 42 -
Dividends paid - (56,000) - (56,000)Balance as at 31 March 2015 120,000 534,327 105,367 759,694
Asset Share Retained revaluation Total capital earnings reserve equity $000 $000 $000 $000
The accompanying notes form part of and are to be read in conjunction with these financial statements
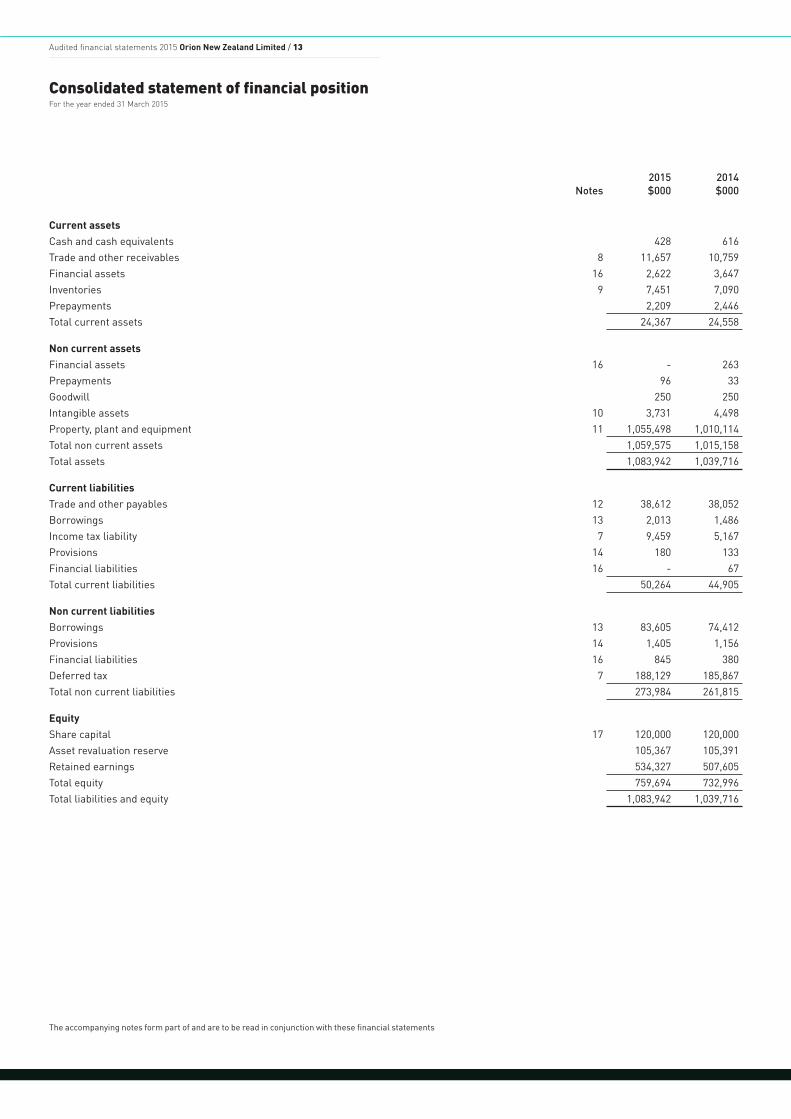
Current assets Cash and cash equivalents 428 616Trade and other receivables 8 11,657 10,759Financial assets 16 2,622 3,647Inventories 9 7,451 7,090Prepayments 2,209 2,446Total current assets 24,367 24,558
Non current assetsFinancial assets 16 - 263Prepayments 96 33Goodwill 250 250Intangible assets 10 3,731 4,498Property, plant and equipment 11 1,055,498 1,010,114Total non current assets 1,059,575 1,015,158Total assets 1,083,942 1,039,716
Current liabilitiesTrade and other payables 12 38,612 38,052Borrowings 13 2,013 1,486Income tax liability 7 9,459 5,167Provisions 14 180 133Financial liabilities 16 - 67Total current liabilities 50,264 44,905
Non current liabilitiesBorrowings 13 83,605 74,412Provisions 14 1,405 1,156Financial liabilities 16 845 380Deferred tax 7 188,129 185,867Total non current liabilities 273,984 261,815
EquityShare capital 17 120,000 120,000Asset revaluation reserve 105,367 105,391Retained earnings 534,327 507,605Total equity 759,694 732,996Total liabilities and equity 1,083,942 1,039,716
2015 2014 Notes $000 $000
The accompanying notes form part of and are to be read in conjunction with these financial statements
Consolidated statement of financial positionFor the year ended 31 March 2015
Audited financial statements 2015 Orion New Zealand Limited / 13

Audited financial statements 2015 Orion New Zealand Limited / 14
Consolidated statement of cash flowsFor the year ended 31 March 2015
Cash flows from operating activitiesReceipts from customers 302,514 264,277Proceeds from earthquake insurance claims 10,876 -Interest received 117 119Payments to suppliers and employees (172,682) (158,722)Payments for interest and other finance costs (5,730) (4,916)Payments for income tax (20,908) (15,545)Net cash provided from operating activities 114,187 85,213
Cash flows from investing activitiesProceeds from earthquake insurance claims 18,124 -Proceeds from the sale of investment property 1,000 7,619Proceeds from the sale of property, plant and equipment 690 1,463Payments for property, plant and equipment (87,670) (60,623)Payments for intangible assets (238) (467)Net cash used in investing activities (68,094) (52,008)
Cash flows from financing activitiesNet proceeds from borrowings 9,719 49Dividends paid (56,000) (34,000)Net cash used in financing activities (46,281) (33,951)Net decrease in cash and cash equivalents (188) (746)
SummaryCash and cash equivalents at beginning of year 616 1,362Net decrease in cash and cash equivalents (188) (746)Cash and cash equivalents at end of year 428 616
2015 2014 $000 $000
The accompanying notes form part of and are to be read in conjunction with these financial statements

Reconciliation of net profit to net cash provided from operating activities
Net profit 82,615 50,455
AdjustmentsProperty, plant and equipment replaced and written off 1,000 1,488Impairment/(reversal) of property, plant and equipment - (1,290)Depreciation of property, plant and equipment 39,658 34,437Amortisation of intangible assets 1,312 1,838Gain on disposal of investment property - (2,314)Earthquake insurance claims – non-operating activities (18,124) -Change in fair value of derivatives 751 (1,308)Internal costs allocated to intangible assets (308) (335)Other (63) (9) 24,226 32,507
Changes in tax balancesIncrease in current tax liability 4,292 1,466Increase in deferred tax liability 2,229 1,617
(Increase)/decrease in assetsTrade and other receivables (2,343) 835Inventories (361) (2,209)Prepayments 174 217
Increase/(decrease) in liabilitiesTrade and other payables 3,059 405Provisions 296 (80) 7,346 2,251Net cash provided from operating activities 114,187 85,213
2015 2014 $000 $000
The accompanying notes form part of and are to be read in conjunction with these financial statements
Consolidated statement of cash flows continuedFor the year ended 31 March 2015
Audited financial statements 2015 Orion New Zealand Limited / 15

Audited financial statements 2015 Orion New Zealand Limited / 16
Notes to the consolidated financial statementsFor the year ended 31 March 2015
1. Statement of accounting policies
Corporate informationOrion New Zealand Limited (the company) is a for-profit company incorporated in New Zealand under the Companies Act 1993 and the Energy Companies Act 1992. The group consists of the company and its subsidiaries.
Statement of compliance The financial statements comply with the Companies Act 1993 and section 44 of the Energy Companies Act 1992. They also comply with the New Zealand equivalents to International Financial Reporting Standards (NZ IFRS), and with International Financial Reporting Standards.
Basis of financial statement preparation The financial statements have been prepared in accordance with Generally Accepted Accounting Practice in New Zealand (NZ GAAP). For the purpose of complying with NZ GAAP, the group is a for-profit entity. The financial statements have been prepared on the basis of historical cost, except for certain financial instruments, land and buildings, and the electricity distribution network, which have been measured at fair value. The financial statements are presented in New Zealand dollars, rounded to the nearest thousand.
Significant judgements, estimates and assumptions In applying the accounting policies, the group has made the following judgements, estimates and assumptions that have the most significant impact on the amounts recognised in these financial statements. The group regularly reviews these estimates and assumptions. Actual results may differ from the group’s estimates and assumptions.
Electricity delivery revenue The company initially invoices its customers (predominantly electricity retailers) monthly for electricity delivery services on the basis of an estimation of usage, later adjusted for (more accurate) metering data when it becomes available from the electricity wholesale market and from electricity retailers. The company has made an allowance in revenue and in current assets/liabilities for estimated amounts under/over charged during the reporting period. Because final metering data is not available for up to 12 months after the initial invoices to customers, the final amounts payable or receivable may vary from that initially invoiced.
Electricity distribution network valuation The company owns and operates an extensive integrated electricity distribution network in Christchurch and central Canterbury, comprising large numbers of individual network asset components.
The company values its electricity distribution network on a discounted cash flow basis. The company has adopted assumptions and estimates in its discounted cash flow valuation, including the amounts and timing of future cash flows and the relevant discount rate.
The Commerce Commission has authorised the company to implement specific network delivery price increases for the five years commencing 1 April 2014. There is less certainty in forecasting the company’s future revenue cash flows from 1 April 2019.
The company acquires certain electricity distribution assets for less than their replacement cost, sometimes at nil cash cost. The non-cash portions of these asset acquisitions are valued at nil on acquisition because they are not recognised under the regulatory price control regime and therefore these assets do not generate additional future cash inflows.
The group estimates and eliminates intra-group profits in new electricity distribution network assets.
Capitalisation of costs and impairment The group makes judgements about whether costs incurred should be capitalised or expensed. The group assesses whether individual assets or groups of related assets (which generate cash flows independently) are impaired by estimating the future cash flows that those assets are expected to generate. The group applies assumptions and estimates when assessing future cash flows and appropriate discount rates.
Other areas of judgementOther areas of judgement include estimating: useful lives of assets, provisions for doubtful debts, unrecoverable work in progress, provisions for employee benefits, income tax, deferred tax, the income tax effects of insurance claim proceeds and network reliability (SAIDI/SAIFI) measures.

Notes to the consolidated financial statements continuedFor the year ended 31 March 2015
1. Statement of accounting policies continued
Significant accounting policiesThe following significant accounting policies have been applied consistently to all periods presented in these financial statements:
(a) Basis of consolidation A subsidiary is an entity over which the group has control. Control is achieved when the group is exposed, or has rights, to variable returns from its involvement with the subsidiary and has the ability to affect those returns through its power over the subsidiary.
The consolidated financial statements are prepared by combining the financial statements of all group entities for the same reporting period, using consistent accounting policies. All intra-group balances and transactions, including unrealised profits arising within the group, are eliminated in full.
Subsidiaries are fully consolidated from the date on which the group obtains control and ceases to be consolidated from the date on which the group ceases to control the subsidiary.
When the group acquires control of a business, the assets, liabilities and contingent liabilities of the acquiree are measured at their fair values at the date of acquisition. Any excess of the cost of acquisition over the fair values of the identifiable net assets acquired is recognised as goodwill. If the fair values of the identifiable net assets acquired exceed the cost of acquisition, the difference is credited to profit or loss.
(b) Goods and services tax Revenues, expenses, cash flows and assets are recognised net of the amount of goods and services tax (GST), except for receivables and payables which are recognised inclusive of GST. Where GST is not recoverable as an input tax it is recognised as part of the related asset or expense. Cash flows in respect of payments to and receipts from the Inland Revenue Department are shown net in the statement of cash flows.
(c) Foreign currency The functional and presentation currency is New Zealand dollars. Transactions in foreign currencies are translated at the foreign exchange rate ruling on the day of the transaction. Foreign currency monetary items at balance date are translated at the exchange rate ruling at that date. Non-monetary assets and liabilities carried at fair value that are denominated in foreign currencies are translated at the rates ruling at the date when the fair value was determined. Exchange differences are recognised in profit or loss in the year in which they arise.
(d) Cash and cash equivalents Cash and cash equivalents comprise cash on hand and cash held in banks (net of bank overdrafts). Net bank overdrafts are shown as borrowings in current liabilities in the statement of financial position.
(e) Financial instrumentsAll financial instruments are initially recognised at fair value plus directly attributable transaction costs where applicable.
Subsequently, the group applies the following accounting policies for financial instruments.
Loans and receivables consist of trade and other receivables. Trade and other receivables are measured at cost, less an allowance for impairment. All known bad debts are written off through profit and loss.
The group’s available-for-sale financial asset is an investment fund managed by Enertech Capital Partners. This asset is measured at fair value, with movements in fair value recognised in profit or loss.
Financial liabilities at amortised cost consist of trade and other payables and borrowings. Financial liabilities at amortised cost are measured using the effective interest rate method. Due to their short term nature, trade and other payables are not discounted.
The group has not designated any derivatives as hedges for financial reporting purposes. Derivatives are subsequently measured at fair value, with movements recognised in profit or loss. Derivatives are carried as assets when their fair value is positive and as liabilities when their fair value is negative, and they are only offset against each other if the group has a legal right of offset.
(f) Inventories Inventories are valued at the lower of cost or net realisable value. Net realisable value is the estimated amount the inventories are expected to realise in the ordinary course of business. Certain inventories are subject to security interests created by retention of title clauses.
Audited financial statements 2015 Orion New Zealand Limited / 17

Audited financial statements 2015 Orion New Zealand Limited / 18
Notes to the consolidated financial statements continuedFor the year ended 31 March 2015
1. Statement of accounting policies continued
(g) Income taxIncome tax expense for the year comprises current tax and deferred tax.
Current tax is the income tax payable based on the taxable profit for the current year, plus adjustments to income tax payable for prior years. Current tax is calculated using rates that have been enacted or substantively enacted by balance date.
Deferred tax is the income tax payable or recoverable in future periods for temporary differences and unused tax losses. Temporary differences are differences between the carrying values of assets and liabilities in these financial statements and the corresponding tax bases used to calculate taxable profit.
Deferred tax liabilities are generally recognised for all taxable temporary differences. Deferred tax assets are recognised to the extent that it is probable that taxable profits will be available, against which the deductible temporary differences or tax losses can be utilised.
Deferred tax is calculated at the tax rates that are expected to apply in the period when the liability is settled or the asset is realised, using tax rates that have been enacted or substantively enacted by balance date.
Current tax and deferred tax are charged or credited to profit or loss. When deferred tax relates to items charged or credited to other comprehensive income, then deferred tax is also recognised in other comprehensive income.
(h) Leased assets and lease liabilities Leases are classified as finance leases whenever the lease terms transfer substantially all the risks and rewards of ownership to the lessee. All other leases are classified as operating leases.
Operating lease receipts are recognised as revenue on a straight-line basis over the lease term.
Operating lease payments are recognised as an expense on a straight-line basis over the lease term.
Finance leases payments are allocated between expense and reduction of the lease liability over the term of the lease. Capitalised leased assets are depreciated over the shorter of the estimated useful life of the asset and the lease term if there is no reasonable certainty that the group will obtain ownership by the end of the lease term.
(i) Impairment of assets The carrying amounts of the group’s assets, other than inventory, investment property and deferred tax assets, are reviewed at each balance date to determine whether there is any indication of impairment. If any such indication exists for an asset, the asset’s recoverable amount is estimated in order to determine the extent of the impairment loss (if any). Where the asset does not generate cash flows that are independent of other assets, the group estimates the recoverable amount of the cash-generating unit to which the asset belongs. A cash-generating unit is defined as the smallest identifiable group of assets that generates cash inflows that are largely independent of the cash inflows from other assets or groups of assets.
The recoverable amounts are the higher of fair value (less costs to sell) or value in use. In assessing value in use, the estimated future cash flows are discounted to their present value using a discount rate that reflects current market assessments of the time value of money and the risks specific to the asset for which the estimates of future cash flows have not been adjusted.
Goodwill is tested for impairment annually, and whenever there is an indication that it may be impaired. An impairment of goodwill is not subsequently reversed.
If a revalued asset is determined to be impaired, then the impairment is firstly applied against the revaluation reserve related to that asset, with any remaining impairment loss expensed in profit or loss. If the impairment loss is subsequently reversed, the reversal is firstly applied to profit or loss to the extent of previously expensed impairment losses relating to that asset, with any further increase taken to the revaluation reserve.
For assets which are not revalued, an impairment loss is expensed immediately in profit or loss. If an impairment loss is subsequently reversed, the carrying value of the asset is stated at not more than what its carrying value would have been had the earlier impairment not occurred.
Equity instruments are deemed to be impaired whenever there is a significant or prolonged decline in fair value below the original purchase price. Any subsequent recovery of an impairment loss in respect of an investment in an equity instrument classified as available-for-sale is not reversed through profit or loss.
(j) Property, plant and equipment Land and buildings are measured at fair value. Fair value is determined on the basis of a periodic independent market valuation prepared by external valuers, based on comparable market sales, discounted cash flows or capitalisation of net income (as appropriate) less subsequent depreciation. The fair values are recognised in these financial statements, and are reviewed at the end of each reporting period to ensure that the carrying value of land and buildings is not materially different from fair value.

1. Statement of accounting policies continued
The electricity distribution network is measured at fair value. Fair value has been determined on the basis of a periodic independent valuation prepared by an external valuer, based on a discounted cash flow methodology. The fair value of the network is recognised in the financial statements and is reviewed at the end of each reporting period to assess whether the carrying value is not materially different from fair value.
Any revaluation increase arising on the revaluation of land and buildings and the electricity distribution network is recorded in other comprehensive income and credited to the asset revaluation reserve in equity, except to the extent that it reverses a revaluation decrease for the same asset previously recognised as an expense in profit or loss, in which case the increase is credited to profit or loss to the extent of the decrease previously charged. A revaluation decrease is charged as an expense in profit or loss to the extent that is exceeds the balance, if any, held in the asset revaluation reserve from previous revaluations of that asset.
Depreciation is provided on property, plant and equipment, including freehold buildings but excluding land. Depreciation on revalued buildings and the electricity distribution network is charged to profit or loss.
Other plant and equipment and leasehold improvements are recognised at cost less accumulated depreciation and impairment. Cost includes expenditure that is directly attributable to the acquisition of the item. The cost of self-constructed assets includes the cost of materials and direct labour and an allowance for overheads.
Depreciation is calculated on a straight-line basis to write off the net cost, or other revalued amount of each asset, over its expected useful life to its estimated residual value. Leasehold improvements are depreciated over the period of the lease or estimated useful life, whichever is the shorter, using the straight-line method. The estimated useful lives, residual values and depreciation method are reviewed at the end of each annual reporting period.
The main bases for the calculation of depreciation are periods not exceeding:
Years YearsElectricity distribution network 60 Cars and vans 5Buildings structures 70 Trucks 10Building services 30 Plant and equipment 10Building fit-out 20 Computer equipment 3
Residual values for an item of property, plant and equipment are reviewed, and adjusted if appropriate, at the end of each reporting period.
The carrying amount for an item of property, plant and equipment is written down immediately to its recoverable amount if the asset’s carrying value is greater than its estimated recoverable amount.
Gains and losses on disposals are determined by comparing proceeds with carrying amounts. These gains and losses are included in profit or loss.
(k) Intangible assets The group has computer software assets which have a finite life and are carried at cost, less accumulated amortisation and impairment. Carrying values are amortised over their estimated useful lives. This period usually does not exceed three years – however for some significant projects, estimated useful lives may be assessed as up to 10 years.
Costs to acquire computer software licences are capitalised. Direct costs to internally develop computer software are capitalised if the software is technically feasible, the group intends to and has the resources to complete and use the software, and the software will generate probable future economic benefits. Direct costs include the software development employee costs and an appropriate portion of relevant overheads.
(l) Goodwill Goodwill, representing the excess of the cost of acquisition over the fair value of the identifiable assets, liabilities and contingent liabilities acquired, is recognised as an asset. Goodwill is not amortised, but it is tested for impairment annually. Impairments are recognised immediately in profit or loss and is not subsequently reversed.
(m) Provisions Provisions are recognised when the group has a present legal or constructive obligation as a result of a past event, the future sacrifice of economic benefits is probable, and the amount of the provision can be measured reliably. The amount recognised as a provision is the best estimate of the consideration required to settle the present obligation at the reporting date, taking into account the risks and uncertainties surrounding the obligation.
Audited financial statements 2015 Orion New Zealand Limited / 19
Notes to the consolidated financial statements continuedFor the year ended 31 March 2015

Audited financial statements 2015 Orion New Zealand Limited / 20
Notes to the consolidated financial statements continuedFor the year ended 31 March 2015
1. Statement of accounting policies continued
Where a provision is measured using the cash flows estimated to settle the present obligation, its carrying value is the present value of those cash flows. When some or all of the economic benefits required to settle a provision are expected to be recovered from a third party, the receivable is recognised as an asset if it is virtually certain that recovery will be received and the amount of the receivable can be measured reliably.
(n) Employee benefits Provisions made in respect of employee benefits expected to be settled within 12 months are measured at their nominal values using the remuneration rate expected to apply at the time of settlement. Provisions made in respect of employee benefits which are not expected to be settled within 12 months, such as long service leave, are measured as the present value of the estimated future cash outflows to be made by the group in respect of services provided by employees up to the reporting date, taking into account years of service, years to entitlement and the likelihood that staff will reach the point of entitlement.
(o) Revenue recognitionRevenue is measured at the fair value of consideration received, or receivable.
Revenue is recognised when the amount of revenue can be measured reliably and it is probable that the economic benefits of the transaction will flow to the group.
Sales of goods are recognised when the significant risks and rewards of ownership of the goods have been transferred to the buyer. Sales of services are recognised as the services are delivered, or if applicable on a percentage of completion basis.
Revenue from earthquake insurance claims is recognised when the group has received the proceeds, or when it is virtually certain that the group will receive the proceeds, provided the amounts can be reliably measured or estimated. In the consolidated statement of cash flows, insurance proceeds related to capital expenditure are classified as investing activities. Other insurance receipts are classified as operating activities.
(p) Capital contributions and grants Capital contributions that are refundable to customers are treated as current liabilities until refunded. Non-refundable cash contributions from customers, relating to the electricity distribution network, are recognised as revenue.
(q) Borrowing costs Borrowing costs directly attributable to the acquisition, construction or production of a qualifying asset (an asset that takes a substantial period of time to get ready for intended sale or use and is of significant cost) are capitalised as part of the cost of that asset. All other borrowing costs are expensed in the period in which they occur.
(r) Changes in accounting policies and disclosuresNo new accounting standards or interpretations that became effective for the period had a material impact on the group.
Those NZ IFRS Standards and Interpretations that have been issued or amended and which may have a significant impact on the group that have been issued or amended, but are not yet effective and have not been adopted by the group for year ended 31 March 2015 are:
Impact on Application Effective group financial date for the date statements groupNZ IFRS 15 Revenue from Contracts with Customers
NZ IFRS 15 will replace NZ IAS 11 Construction Contracts, NZ IAS 18 Revenue 1 Jan 2017 The group is 1 Apr 2017 and related revenue interpretations. The core principle of NZ IFRS 15 is that an evaluating the entity recognises revenue to reflect the transfer of promised goods or services to impact of the customers in an amount that reflects the consideration to which the entity expects new standard. to be entitled in exchange for those goods or services.

2. Operating revenues
Electricity delivery services 242,010 214,464Transmission rental rebates 2,908 4,102Contracting 38,069 31,784Sale of goods and services 10,610 8,614Consumer capital contributions 6,467 4,566Earthquake insurance claim proceeds 29,000 -Gain on disposal of investment property - 2,314Rental − other property 459 426Other 3,371 3,240 332,894 269,510
3. Operating expensesTransmission 74,590 66,187Transmission rental rebates 2,908 4,102Employee benefits 46,336 43,271Network maintenance 23,646 24,963Operating lease payments 1,333 1,238Other 25,717 20,668 174,530 160,429
4. Depreciation, amortisation and other impairment expensesDepreciation of property, plant and equipment 39,658 34,437Amortisation of intangible assets 1,312 1,838Property, plant and equipment replaced and written off 1,000 1,488Reversal of prior year impairments of property plant and equipment - (1,290)Impairment of financial assets 11 - 41,981 36,473
5. Interest expenseBank loans 4,101 3,225Finance leases 1,680 1,770 5,781 4,995
6. Remuneration of the auditorAudit of the financial statements 251 225Audit-related services 55 59 306 284
Audit-related services comprise:• an assurance review of the company’s compliance statement in accordance with the Electricity Distribution Services Default Price-Quality
Path Determination (in 2014)• an assurance review of the company’s compliance statement in accordance with the Orion New Zealand Limited Customised Price-Quality
Path Determination 2013 (in 2015)• assurance reviews of the company’s regulatory information disclosures in accordance with the Electricity Distribution Information Disclosure
Determination (in 2014 and 2015).
2015 2014 $000 $000
Audited financial statements 2015 Orion New Zealand Limited / 21
Notes to the consolidated financial statements continuedFor the year ended 31 March 2015
Audited financial statements 2015 Orion New Zealand Limited / 22
Notes to the consolidated financial statements continuedFor the year ended 31 March 2015
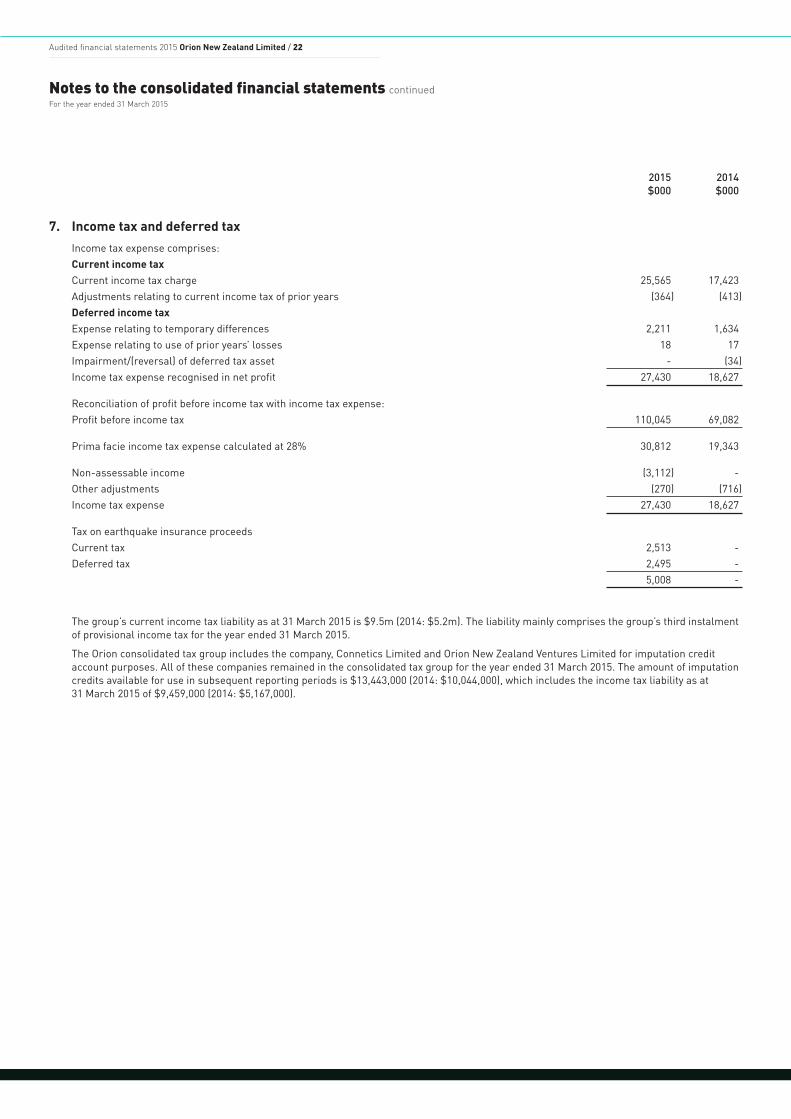
7. Income tax and deferred tax
Income tax expense comprises: Current income tax Current income tax charge 25,565 17,423Adjustments relating to current income tax of prior years (364) (413)Deferred income tax Expense relating to temporary differences 2,211 1,634Expense relating to use of prior years’ losses 18 17Impairment/(reversal) of deferred tax asset - (34)Income tax expense recognised in net profit 27,430 18,627
Reconciliation of profit before income tax with income tax expense: Profit before income tax 110,045 69,082
Prima facie income tax expense calculated at 28% 30,812 19,343
Non-assessable income (3,112) -Other adjustments (270) (716)Income tax expense 27,430 18,627
Tax on earthquake insurance proceeds Current tax 2,513 -Deferred tax 2,495 - 5,008 -
The group’s current income tax liability as at 31 March 2015 is $9.5m (2014: $5.2m). The liability mainly comprises the group’s third instalment of provisional income tax for the year ended 31 March 2015.
The Orion consolidated tax group includes the company, Connetics Limited and Orion New Zealand Ventures Limited for imputation credit account purposes. All of these companies remained in the consolidated tax group for the year ended 31 March 2015. The amount of imputation credits available for use in subsequent reporting periods is $13,443,000 (2014: $10,044,000), which includes the income tax liability as at 31 March 2015 of $9,459,000 (2014: $5,167,000).
2015 2014 $000 $000

7. Income tax and deferred tax continued continued
For the year ended 31 March 2015Taxable and deductible temporary differences arise from:
Deferred tax liabilitiesProperty, plant and equipment 185,807 2,423 33 188,263Depreciation recovered deferred against future purchase 377 (122) - 255Intangible assets 813 (611) - 202Assessable insurance proceeds - 2,495 - 2,495Other 843 (594) - 249 187,840 3,591 33 191,464Deferred tax assets Derivative financial liabilities 26 210 - 236Provisions 1,420 186 - 1,606Doubtful debts and impairment losses 27 (9) - 18Finance lease liability 466 851 - 1,317Tax losses 34 (18) - 16Other - 142 - 142 1,973 1,362 - 3,335Net deferred tax liability 185,867 2,229 33 188,129
For the year ended 31 March 2014 Taxable and deductible temporary differences arise from:
Deferred tax liabilities Property, plant and equipment 155,533 1,016 29,258 185,807Depreciation recovered deferred against future purchase 1,299 (922) - 377Intangible assets 437 376 - 813Other 4 839 - 843 157,273 1,309 29,258 187,840
Deferred tax assets Derivative financial liabilities 393 (367) - 26Provisions 1,421 (1) - 1,420Doubtful debts and impairment losses 45 (18) - 27Finance lease liability 405 61 - 466Tax losses 17 17 - 34 2,281 (308) - 1,973Net deferred tax liability 154,992 1,617 29,258 185,867
Charged to Charged/ other Opening (credited) comprehensive Closing balance to income income balance $000 $000 $000 $000
Audited financial statements 2015 Orion New Zealand Limited / 23
Notes to the consolidated financial statements continuedFor the year ended 31 March 2015

Audited financial statements 2015 Orion New Zealand Limited / 24
Notes to the consolidated financial statements continuedFor the year ended 31 March 2015
8. Trade and other receivablesTrade receivables 11,205 7,564Chargeable work in progress 525 3,295Allowance for impairment of trade receivables (73) (100) 11,657 10,759
The status of trade receivables not impaired:Not past due 9,431 5,973Past due 0 to 30 days 1,078 673Past due 31 to 60 days 118 252Past due greater than 60 days 578 666 11,205 7,564
9. InventoriesGoods for sale 3,722 3,454Maintenance items 3,955 3,682Allowance for impairment (226) (46) 7,451 7,090
10. Intangible assetsCost 15,964 15,391Accumulated amortisation (12,233) (10,893)Net book value 3,731 4,498
2015 2014 $000 $000

11. Property, plant and equipment Gross carrying amount Balance as at 1 April 2013 36,474 9,548 852,354 32,903 931,279
Additions 921 2,495 73,670 6,586 83,672Reclassified assets 92 - (89) (3) -Disposals - (154) (4,510) (1,859) (6,523)Revaluation 5,987 (244) 17,208 - 22,951Balance as at 31 March 2014 43,474 11,645 938,633 37,627 1,031,379
Additions 11,186 494 71,111 3,824 86,615Disposals (209) (31) (1,205) (1,882) (3,327)Revaluation - - 116 - 116Balance as at 31 March 2015 54,451 12,108 1,008,655 39,569 1,114,783
Accumulated depreciation and impairment Balance as at 1 April 2013 - 69 56,783 19,351 76,203
Disposals - (154) (560) (1,428) (2,142)Reclassified assets - 16 (14) (2) -Depreciation expense - 395 30,782 3,260 34,437Revaluation - (242) (86,991) - (87,233)Balance as at 31 March 2014 - 84 - 21,181 21,265
Disposals - (3) (50) (1,585) (1,638)Depreciation expense - 453 35,529 3,676 39,658Balance as at 31 March 2015 - 534 35,479 23,272 59,285
Net book value as at 31 March 2014 43,474 11,561 938,633 16,446 1,010,114Net book value as at 31 March 2015 54,451 11,574 973,176 16,297 1,055,498
Capital work in progress included above: As at 31 March 2014 - - 34,658 956 35,614As at 31 March 2015 - 264 60,137 8 60,409
Assets subject to finance leases included above: As at 31 March 2014 - - 18,477 - 18,477As at 31 March 2015 - - 16,384 - 16,384
Buildings Electricity and land distribution Plant and Freehold land improvements network at equipment at fair value at fair value fair value at cost Total $000 $000 $000 $000 $000
Audited financial statements 2015 Orion New Zealand Limited / 25
Notes to the consolidated financial statements continuedFor the year ended 31 March 2015

Audited financial statements 2015 Orion New Zealand Limited / 26
Notes to the consolidated financial statements continuedFor the year ended 31 March 2015
11. Property, plant and equipment continued
Electricity distribution networkThe electricity distribution network was revalued to fair value of $904m as at 31 March 2014, by independent valuer Ernst & Young Transaction Advisory Services Limited (EY), in accordance with NZ IAS 16 – Property, Plant and Equipment, NZ IAS 36 – Impairment of Assets, and NZ IRFS 13 – Fair Value Measurement. EY has significant experience in undertaking valuations of unlisted entities and assets for unit pricing, accounting and commercial purposes. Including capital work in progress, this resulted in a total network valuation of $939m.
In the absence of an active market for the network, EY calculated fair value using significant unobservable inputs (Level 3, as defined in NZ IFRS 13). EY used a discounted cash flow (DCF) methodology. EY based its cash flow forecasts on the company’s cash flow forecasts and adjusted those cash flow forecasts to remove the impacts of expansionary growth on forecast future revenues, operating expenditure and capital expenditure.
EY’s key valuation assumptions were that:• network revenues will be consistent with the company’s customised price-quality path (CPP) settings for the five years commencing
1 April 2014 and network revenues will return to the Commerce Commission’s default price-quality path (DPP) from 1 April 2019, with prices thereafter forecast to increase at CPI
• non-expansionary “infill” growth will be 0.3% per annum• the appropriate DCF discount rate is 6.7% post-tax.
The valuer performed a sensitivity analysis on a number of variables as follows:• a capital expenditure increase/(decrease) of 5% would decrease/(increase) the network’s fair value by $24m respectively• a discount rate increase of 0.25% would decrease the network’s fair value by $37m• a discount rate decrease of 0.25% would increase the network’s fair value by $40m• an operating expense increase/(decrease) of 10% would decrease/(increase) the network’s fair value by $16m respectively• a 0.7% decrease in the Commerce Commission’s post-tax regulatory cost of capital (from the 75th percentile to the 50th percentile estimate)
would decrease the network’s fair value by $79m, if it is applied to the company’s network revenues from 1 April 2019 onwards. The Commission is investigating whether it should make such a change to the regulatory cost of capital.
EY reviewed the carrying value for the electricity network as at 31 March 2015, using a similar methodology to that described above, based on the company’s updated financial forecasts, and updated DCF discount rate, and the Commerce Commission’s decision to reduce the regulatory cost of capital to a 67th percentile estimate. EY concluded that there are no indicators that the carrying value for the electricity distribution network as at 31 March 2015 is materially different from fair value as at that date.
Land and non-substation buildingsThe company’s land and non-substation buildings were revalued to fair value as at 31 March 2014, by Mr Marius Ogg, in accordance with NZ IAS 16 – Property, Plant and Equipment, NZ IAS 36 – Impairment of Assets, and NZ IFRS 13 – Fair Value Measurement. Mr Ogg is a registered valuer and a director of CBRE Limited. Mr Ogg used significant observable inputs (Level 2, as defined in NZ IFRS 13) and significant unobservable inputs (Level 3, as defined in NZ IFRS 13).
Mr Ogg selected a representative sample of the company’s substation sites and valued land at those sites using sales comparisons and unit metre frontage methodologies (Level 2). Mr Ogg compared his values with their respective rateable values. Mr Ogg used these comparisons to develop standard site multipliers, which he applied to rateable land values for approximately 2,200 substation sites. Fair values for approximately 35% of the company’s land and non-substation buildings (by value) were calculated using significant unobservable inputs (Level 3, as defined in NZ IFRS 13).
Mr Ogg valued land at the company’s two largest substations using discounted cashflow and/or sales comparison approaches, reflecting the highest and best use of each (Level 3).
Mr Ogg valued the company’s head office land and building using a market rental assessment and a capitalisation rate of 7.75% (Level 3), and concluded that the fair value of the company’s head office building was $10.4m, confirming its carrying value. Mr Ogg concluded that the fair value of the company’s head office land was $3.6m confirming its carrying value.
Mr Ogg reviewed the group’s carrying value for land and non-substation buildings as at 31 March 2015, using a similar methodology to that described above, in accordance with NZ IAS 16, NZ IAS 36 and NZ IFRS 13. Mr Ogg concluded that there were no indicators that the group’s carrying value for land and non-substation buildings as at 31 March 2015 is materially different to fair value.
Restrictions over title There are no restrictions over the title of the group’s property, plant and equipment, nor is any property, plant and equipment pledged as security for liabilities.

12. Trade and other payablesTrade payables 30,919 31,412Employee entitlements 6,198 5,572GST payable 1,326 904Other 169 164 38,612 38,052
Trade and other payables are non-interest bearing and are normally settled on the 20th of the month following invoicing. Therefore the carrying value of trade and other payables approximates their fair value.
13. BorrowingsUnsecured at amortised costBank loans 70,000 58,800Finance lease liability 15,618 17,098 85,618 75,898
Current 2,013 1,486Non current 83,605 74,412 85,618 75,898
14. ProvisionsEmployee benefits – actuarial assessment of long service leave liability 1,585 1,289
Current 180 133Non current 1,405 1,156 1,585 1,289
Key assumptions in the calculation of this provision include:• risk-free rate 3.26% (2014: 4.62%)• salary inflation 3.00% (2014: 2.00%).
Audited financial statements 2015 Orion New Zealand Limited / 27
2015 2014 $000 $000
Notes to the consolidated financial statements continuedFor the year ended 31 March 2015

Audited financial statements 2015 Orion New Zealand Limited / 28
Notes to the consolidated financial statements continuedFor the year ended 31 March 2015
15. LeasesOperating lease commitmentsNo later than one year 1,064 1,115Later than one year and not later than five years 355 1,373 1,419 2,488
Non-cancellable operating lease receivablesNo later than one year 204 278Later than one year and not later than five years 8 174 212 452
Operating lease commitments The company leases land and a small building adjacent to its head office site. The lease expires in May 2018, with an optional right of renewal for an additional two years. A group company leases its head office property and other sites under operating leases. These leases have various fixed term commitments of up to two years, with optional rights of renewal until 31 January 2024.
Non-cancellable operating lease receivables The group leases land adjacent to some substation and operational sites to a range of tenants. These leases are incidental to the group’s principal business.
Minimum future lease Present value of minimum payables future lease payables 2015 2014 2015 2014 $000 $000 $000 $000
Finance lease liabilities No later than one year 4,849 3,700 2,013 1,486Later than one year and not later than five years 8,425 8,786 3,603 3,343Later than five years 25,835 29,934 10,002 12,269Minimum lease payments 39,109 42,420 15,618 17,098Less future finance charges (23,491) (25,322) - -Present value of minimum lease payments 15,618 17,098 15,618 17,098
Current 2,013 1,486Non current 13,605 15,612 15,618 17,098
The finance lease liabilities relate to agreements with Transpower New Zealand Limited (Transpower) for Transpower to install new assets at or near its local grid exit points. The agreements are for terms of between eight and 35 years. The company does not own the assets at the end of the lease term and there is no residual value. There is no security provided for the arrangements. The monthly payment amounts are reviewed annually by Transpower and the assessed risk-free portion of the applicable lease interest rate may be adjusted. The company is the only entity in the group which has a finance lease liability.
On 1 April 2015, the company repaid one of the Transpower finance lease liabilities as part of the purchase of spur assets at the Addington and Middleton grid exit points. This repayment reduced finance lease liabilities by $1.3m on that date.
2015 2014 $000 $000

16. Financial instrumentsIntroduction Exposures to interest rates, foreign currency, liquidity and credit risk arise in the normal course of the group’s business. The group has policies to manage the risks associated with financial instruments. The significant accounting policies and methods adopted, including the criteria for recognition and the basis of measurement applied in respect of each class of financial asset, financial liability and equity instrument are disclosed in note 1.
Capital management The group’s capital includes share capital, reserves and retained earnings. The group’s policy is to maintain a strong capital base to maintain investor, creditor and market confidence and to sustain future development of the business.
The board of directors regularly reviews the group’s policies in respect of the management and allocation of capital. There has been no material change to the group’s management and allocation of capital during the year.
The group is not subject to externally imposed capital requirements. All bank loans are unsecured against the group. The group provides certain covenants to its key lenders, by way of a negative pledge deed, that it will not create any material security interest over its assets to any party, except under certain agreed circumstances. The deed has other covenants that restrict certain asset disposals, the lending of money to other parties, non-commercial transactions with related parties, the alteration of share capital where this would have a material adverse effect and any material change of business. The deed includes an EBIT interest coverage requirement and an obligation that the guaranteeing group will comprise at least 75% of the group in terms of assets and earnings. The deed places other undertakings and obligations on the company – for example the obligation to provide relevant lenders with information, comply with the law and to pay taxes as they fall due. The company has complied with all covenants during the two years ended 31 March 2015.
All interest bearing bank loans and finance lease liabilities are in New Zealand dollars.
Liquidity risk management Liquidity risk represents the risk that the group may not be able to meet its financial contractual obligations. Prudent liquidity risk management implies maintaining sufficient cash, sufficient committed credit facilities and the ability to close out market positions.
The group manages its liquidity in accordance with its board-approved treasury policy. This policy requires that the group must have access to funds by securing, as a minimum, sufficient committed financing facilities to cover at least 120% of the anticipated peak borrowing requirement as determined by monthly rolling 12 month cash flow forecasts. If the group has more than $200m of debt facilities the sum of interest bearing debt maturing in any 12 month period is not to exceed 40% of total debt.
In general, the group generates sufficient cash flows from its operating activities to meet its contractual obligations and it has sufficient funding arrangements in place to cover potential shortfalls. The group evaluates its liquidity requirements on an ongoing basis. The group’s current forecasts for its debt/debt-plus-equity and its interest coverage indicate that it will maintain its financial ability to meet its contractual obligations for the foreseeable future (at least over the next 12 month period).
2015 2014 $000 $000
Unsecured bank overdraft facility, payable at call:Amount used - -Amount unused 500 500 500 500
Unsecured bank loan facilities as at 31 March 2015 mature as follows:$20m on 16 November 2015$60m on 27 November 2017 $50m on 27 November 2019
Amount used 70,000 58,800Amount unused 60,000 51,200 130,000 110,000
Audited financial statements 2015 Orion New Zealand Limited / 29
Notes to the consolidated financial statements continuedFor the year ended 31 March 2015

Audited financial statements 2015 Orion New Zealand Limited / 30
Notes to the consolidated financial statements continuedFor the year ended 31 March 2015
16. Financial instruments continued
Interest rate risk management The group has interest bearing floating rate debt, and so the group is exposed to variations in market interest rates.
Interest rates on the group’s bank loans are based on market rates for bank bills plus a margin. As at 31 March 2015, interest rates (including margins) on the group’s bank loans averaged 4.24% (2014: 3.62%). Daily commitment fees are also payable on the bank loan facilities.
Interest rates on the group’s finance lease liabilities are based on Government bond rates plus a margin. As at 31 March 2015, interest rates on the group’s finance lease liabilities averaged 9.94% (2014: 9.88%).The group’s other financial liabilities are non interest bearing.
The group enters into interest rate swaps to manage the company’s interest rate risk. The swaps are with various New Zealand registered bank counterparties with such credit ratings and within limits set by the board of directors. The swaps’ cash requirements are limited to the contracted fixed interest rates for the periods specified in each swap. The group usually enters swaps for periods up to three years in tenor.
Under interest rate swap contracts, the group agrees to pay fixed interest rates and receive floating interest rates, calculated on agreed notional principal amounts for specified periods – usually up to three years. The swaps effectively convert portions of floating rate debt into fixed rate debt. All swaps are held by the company. The fair values of interest rate swaps are based on market values of equivalent instruments at the reporting date and are disclosed below.
The following table details outstanding interest rate swaps as at the reporting date:
Average contracted fixed Notional principal Fair value interest rate amount Asset/(liability) 2015 2014 2015 2014 2015 2014 % % $000 $000 $000 $000 Less than 1 year to maturity - 3.4 - 40,000 - 381 to 2 years 4.6 - 45,000 - (513) -2 to 3 years 3.9 4.6 30,000 45,000 (332) (132) 75,000 85,000 (845) (94)
The following table analyses the group contractual cash out flows for interest on bank loans and interest rate swaps into relevant maturity groupings based on the remaining period at year end to the contractual maturity date. The amounts disclosed are undiscounted outflows.
Contractual Less than 1 to 2 2 to 5 cash outflows 1 year years years $000 $000 $000 $000
As at 31 March 2015 Interest on bank loans 8,763 2,968 2,968 2,827Interest rate swaps 687 440 169 78
As at 31 March 2014 Interest on bank loans 3,637 2,129 1,508 -Interest rate swaps 1,458 586 872 -
The group considers that a reasonably possible movement in New Zealand interest rates is a 1% movement in either direction.
For bank loans, an increase of 1% in interest rates as at 31 March 2015 would increase the group’s profit before income tax by approximately $644,000 (2014: $494,000). A decrease of 1% would decrease the group’s profit before income tax by approximately $681,000 (2014: $524,000). When interest rates rise, the benefit from the revaluation of the company’s multi-year interest rate swaps outweighs the additional one-year interest expense on the company’s floating rate debt. The converse applies when interest rates decrease.
For the group’s other financial assets and liabilities, an increase/decrease of 1% in interest rates would have an immaterial impact on the group’s profit before income tax.

16. Financial instruments continued
Credit risk managementCredit risk refers to the risk that a counterparty will default on its contractual obligations, resulting in financial loss to the group.
Financial instruments that potentially subject the group to concentrations of credit risk consist of cash, short term investments, trade receivables and derivative financial instruments.
The group places its cash, short term investments and derivative financial instruments with registered New Zealand banks. Only independently rated banks with a minimum Standard & Poor’s (or equivalent) credit rating of ‘A’ or better are accepted. The group limits the credit exposure to any one bank in accordance with its board-approved treasury policy.
The group manages its exposure to credit risk from trade receivables by performing credit evaluations on customers requiring credit wherever practicable and monitoring credit exposures to individual customers.
Pursuant to the electricity participation code, the company may only require collateral securities from its electricity retailer customers if those customers do not have a Standard & Poor’s (or equivalent) minimum credit rating of ‘BBB-minus’. The company invoices electricity retailers and its direct major customers on the 10th day of the month of usage (based on an estimation of usage), with payment due on the 20th of that month. Invoiced amounts are subject to subsequent adjustments for later (more accurate) metering data as outlined under critical judgements, estimates and assumptions in note 1. Collateral security is not generally required from the group’s other customers.
The maximum exposure to credit risk for bank balances, accounts receivable and derivative financial instrument assets is equal to the carrying values of these assets.
There are no significant concentrations of credit risk within trade receivables. Trade receivables are non-interest bearing. The carrying value of trade receivables approximates their estimated fair value.
Bad debts written off mostly relate to debtors who have damaged the company’s electricity distribution network assets. The company enters arrangements with some of these debtors to allow them to pay their debts off over time. These rearranged debts form the majority of the ‘past due greater than 60 days’ category in note 8.
Audited financial statements 2015 Orion New Zealand Limited / 31
Notes to the consolidated financial statements continuedFor the year ended 31 March 2015

Audited financial statements 2015 Orion New Zealand Limited / 32
Notes to the consolidated financial statements continuedFor the year ended 31 March 2015
16. Financial instruments continued
Carrying values of financial instruments The following table classifies the financial assets and liabilities of the group between the various valuation categories pursuant to NZ IAS 39 − Financial Instruments: Recognition and Measurement, and NZ IFRS 7 – Financial Instruments: Disclosures:
2015 2015 2014 2014 Current Non current Current Non current $000 $000 $000 $000
Financial assetsFair value through profit or loss:
Derivative financial instruments – level 2 - - 105 248At cost less impairment:
Cash and cash equivalents 428 - 616 -Trade and other receivables 11,657 - 10,759 -Solicitors’ trust account 2,618 - 3,542 -Available-for-sale at fair value:
Enertech Capital Partners II LP – level 3 4 - - 15 14,707 - 15,022 263
Financial liabilitiesFair value through profit or loss:
Derivative financial instruments – level 2 - 845 67 380Amortised cost:
Trade and other payables 32,414 - 32,480 -Borrowings 2,013 83,605 1,486 74,412 34,427 84,450 34,033 74,792
Pursuant to NZ IFRS 13 – Fair Value Measurement, fair values through profit or loss in the table above are determined as follows:
Level 1: Quoted market prices for identical financial instruments in active markets.
Level 2: Quoted market prices for similar financial instruments in active markets, or quoted market prices for identical or similar financial instruments in inactive markets, or using valuation techniques and models where all significant inputs are observable.
Level 3: Valuation techniques and models, where one or more significant inputs are not observable.
2015 2014 $000 $000
17. Share capitalFully paid ordinary shares 120,000 120,000
Eighty million ($1.50) ordinary shares were issued in April 1993 pursuant to the approved establishment plan (under the Energy Companies Act 1992) and sale and purchase agreement, and are fully paid up. There were no issues or redemptions of shares during the year (2014: nil).

18. Related party transactionsGroup structure The parent is Orion New Zealand Limited, which is owned by Christchurch City Holdings Limited (CCHL) (89.275%) and the Selwyn District Council (SDC) (10.725%). CCHL is owned by the Christchurch City Council (CCC).
Related parties include:• CCC and SDC• the subsidiaries of CCC and SDC • the group’s key management personnel.
The group undertakes many transactions with CCC and SDC and their related parties, all of which are carried out on a commercial and arms-length basis. During the year no material transactions, other than the payment of dividends to CCHL and SDC, were entered into with related parties.
2015 2014Transactions during the year $000 $000
Dividends paid to CCHL and SDC 56,000 34,000
Purchases from CCC/SDC 3,184 4,024Sales to CCC/SDC 7,869 6,355
Purchases from other related parties 1,279 1,237Sales to other related parties 2,016 1,633
Outstanding balances as at 31 March
Accounts payable to CCC/SDC 52 228Accounts receivable from CCC/SDC 2,112 584
Accounts payable to other related parties 245 199Accounts receivable from other related parties 58 257
Other transactions involving related partiesThe group paid directors’ fees totalling $300,000 during the year (2014: $255,000).
One director received a retirement gift totalling $935 during the year (2014: two directors $4,000). No other transactions were entered into with any of the company’s directors, other than the payment of directors’ fees and the reimbursement of valid company-related expenses such as travel costs to board meetings.
Key management personnel of the group purchased goods and services from group companies during the year which in total did not exceed $2,000 for any individual (2014: all less than $2,000). A total of $110 was due from key management personnel as at 31 March 2015 (2014: $nil). All transactions were conducted on standard commercial terms.
Close family members of certain key management personnel are employed by the group. The terms and conditions of those arrangements are no more favourable than those that the group would have adopted if there was no relationship to key management personnel.
Audited financial statements 2015 Orion New Zealand Limited / 33
Notes to the consolidated financial statements continuedFor the year ended 31 March 2015

Audited financial statements 2015 Orion New Zealand Limited / 34
Notes to the consolidated financial statements continuedFor the year ended 31 March 2015
19. Information about subsidaries Connetics Limited is a contractor in the electricity distribution and utility sectors. The company has owned a 100% equity interest in Connetics since April 1996.
2015 2014 $000 $000
20. Key management personnelCompensation of the directors and executives, the key management personnel of the company, is:Salaries and short term employee benefits 2,606 2,568Post employment benefits 174 172
21. Capital expenditure commitmentsElectricity distribution network 26,047 17,176Intangible assets - 12Other - 31
Most commitments are expected to be incurred in the next financial year.
22. Contingent liabilities and assetsContingent liabilitiesPerformance bonds in relation to contract work 459 666
The company has a contingent liability related to the sale of the company’s former head office site in the Christchurch CBD to the Crown in September 2013. The amount and timing of the resolution of this potential issue cannot be reliably estimated. Approximately $2.5m of the sale price is held in a solicitors’ trust account, pending resolution of this issue.
23. Significant events after balance date The group is unaware of any significant events between the preparation and authorisation of these financial statements on 10 June 2015.

Performance statement – consolidated financialFor the year ended 31 March 2015
Actual Target Actual Notes 2015 2015 2014
Net profit ($m) 1, 2 82.6 48.0 50.5Net profit to average shareholders’ equity (%) 1, 2 11.1 7.4 7.4Debt to debt plus equity (%) 3 10 17 9Equity to debt plus equity (%) 3 90 83 91Equity to total assets 3 70 67 70Fully imputed dividends ($m) 56 46 34
Notes: Variances
1. Net profit was $34.6m above the group’s statement of intent target because of (all figures post tax): $mAbove-budget earthquake insurance claim proceeds 24.0Below-budget expenses 7.1Above-budget Connetics net profit 2.1Above-budget capital contribution revenues 1.9Below-budget net interest expense 0.9Above-budget depreciation expense (1.8)Other 0.4 34.6
2. Net profit was $32.1m above last year’s net profit because of (all figures post tax): Earthquake insurance claim proceeds in 2015 24.0Higher electricity distribution network delivery revenues in 2015 13.8Higher capital contribution revenues in 2015 1.4Higher Connetics net profit in 2015 1.0Lower operating expenses in 2015 0.5Higher interest expense in 2015 (0.5)Land and building revaluations recognised in profit in 2014 (0.9)Fair value interest rate hedge revaluations (1.5)Profit on sale of the former CBD head office site in 2014 (1.6)Higher depreciation expense in 2015 (2.7)Other (1.4) 32.1
3. Debt is defined as interest bearing group borrowings, net of cash and cash equivalents. Equity is defined as shareholders’ equity.
Audited financial statements 2015 Orion New Zealand Limited / 35

Audited financial statements 2015 Orion New Zealand Limited / 36
Performance statement – network reliabilityFor the year ended 31 March 2015
Approx number of Gazetted NZ consumer weighted connections Actual Target Actual average 31 March 2015 2015 2015 2014 2014 * * *
Orion network interruptions:Duration of supply interruptions in minutes per year per connected customer (SAIDI)
- urban 163,500 69 42 150 - rural 27,500 468 475 2,604 - overall 191,000 126 104 474 229
Number of supply interruptions per year per connected customer (SAIFI)
- urban 163,500 0.6 1.1 0.6 - rural 27,500 4.3 3.4 5.8 - overall 191,000 1.2 1.4 1.3 1.8
Important notes:1. Major storms, natural disasters and other catastrophic events can cause significant numbers and significant durations of network supply
interruptions. The future occurrence and severity of ‘major events’ cannot be predicted.
2. The Commerce Commission sets limits for and assesses the industry’s network reliability performance. The Commission assesses the industry’s actual performance, after ‘normalising’ for the impacts of ‘major events’.
3. The targets above are consistent with the Commission’s 2015 network reliability limits for the company, pursuant to the company’s customised price-quality path (CPP). The Commission’s limits are for the company’s overall network, there is no urban/rural split. After applying the Commission’s normalisation methodology, the company achieved the overall SAIDI and SAIFI targets above in 2015.
4. The columns marked with an asterisk (*) above are stated gross – before normalising for major events using the Commission’s methodology.
5. Airborne debris blown onto high voltage equipment caused significant loss of supply to the Papanui and McFaddens zone substations on 9 July 2014. This incident contributed 22 minutes of SAIDI to the overall network in 2015. An 11kV termination fault caused by a flashover caused a loss of supply to Lyttelton on 22 November 2014. This incident contributed 7 minutes of SAIDI to the overall network in 2015.
6. A severe wind storm on 10 September 2013 severely affected network reliability in 2014.
7. The gazetted industry averages are for all 29 New Zealand electricity distribution networks, and include a mixture of rural and urban networks. The company’s electricity distribution network includes a significant rural component.
8. SAIDI and SAIFI are standard international industry measures of network reliability performance. They include planned and unplanned interruptions.
SAIDI: system average interruption duration index − the average duration of supply interruptions that each consumer experiences. SAIFI: system average interruption frequency index − the average number of supply interruptions that each consumer experiences.

Performance statement – earthquake recoveryFor the year ended 31 March 2015
1. Repair damaged underground cables
Target date: Ongoing
Status: Achieved
The company’s 11kV and low voltage underground cable network was extensively damaged in the earthquakes, especially in the eastern suburbs of Christchurch. The company repaired all known 11kV underground cable faults in 2011. Much of the damage to remaining underground cables will only be found when/if underground cable faults occur over the coming years. This year the underground cable fault rate has been lower than forecast.
2. Lay and commission a permanent 66kV high voltage feed from Transpower’s Bromley grid exit point to the McFaddens, Dallington and Rawhiti Domain zone substations. Then remove the temporary 66kV overhead lines installed after the February 2011 earthquake
Target date: 31 December 2014
Status: Completion will be delayed into late 2015 due to events outside the company’s control
In the days after the 22 February 2011 earthquake, the company urgently built temporary 66kV overhead lines from Transpower’s Bromley grid exit point to the Dallington zone substation, and to the company’s new Rawhiti zone substation. The Brighton zone substation was uneconomic to repair, so the company rebuilt it 1.5km away at Rawhiti.
The temporary overhead lines replaced severely damaged 66kV underground cables that previously supplied the eastern suburbs.
The company’s major project to replace the 66kV temporary overhead lines with underground cables has three main stages: • stage 1 – from the upgraded McFaddens Road zone substation to the upgraded Dallington zone substation. This stage is complete and
operational• stage 2 – from Transpower’s Bromley grid exit point to the Dallington zone substation. This stage was delayed, pending the repair/rebuild of
the Gayhurst Road bridge. The new 66kV cables use this bridge to cross the Avon River. McConnell Dowell completed the bridge repairs in May 2015 and the new cables have now been installed and we expect they will be commissioned in July 2015
• stage 3 – from Transpower’s Bromley grid exit point to the Rawhiti zone substation. This stage was delayed, pending the repair of the Bridge Street bridge in South New Brighton. The bridge repair was completed in May 2015 and the new cables have now been installed and we expect that they will be commissioned in July 2015.
The company intends to remove the temporary lines in spring 2015.
3. Work with the Canterbury Earthquake Recovery Authority (CERA) and the CCC to re-establish power and network resilience to the central business district (CBD) according to agreed priorities and timeframes
Target date: Ongoing
Status: Achieved
The company is working with CERA, SCIRT, and property developers on an ongoing basis. The company has decommissioned and relivened connection points as necessary and provided comprehensive information about the process to connect to the network so that developers and their advisors know what to expect and can plan accordingly. The company is working with CERA and property developers to decommission and remove old substations and infrastructure, and install new substations and infrastructure in alternative locations, if development of the CBD requires this.
The company’s underground cable assets in the CBD sustained relatively little damage in the earthquakes. The company expects to provide a resilient and reliable network to CBD businesses and residents in the years ahead.
In order to ensure network resilience, the company will no longer house new substations in building basements in the CBD. All future substations in the CBD must be at ground level. Access in the event of any future emergencies is a priority.
Audited financial statements 2015 Orion New Zealand Limited / 37

Audited financial statements 2015 Orion New Zealand Limited / 38
Performance statement – earthquake recovery continuedFor the year ended 31 March 2015
4. Continue to support the key regional earthquake recovery planning documents
Target date: Ongoing
Status: Achieved
‘The Recovery Strategy for Greater Christchurch’ was released by the Government in May 2012. The Christchurch Central Development Unit (part of CERA) released ‘The Christchurch Central Recovery Plan’ in July 2012. CERA also released ‘An Accessible City’ in November 2012. These are three of the Government’s key quake recovery planning documents.
The region’s local authorities – the Christchurch City Council, the Selwyn District Council and Environment Canterbury – also develop, administer and enforce key regional and city planning documents that are relevant to regional earthquake recovery.
The company’s key quake recovery role is to restore resilience and reliability to its electricity distribution network, and to anticipate and plan for future new customer connections and load growth in the network area.
The company’s key network planning and accountability document is its ten year network asset management plan (AMP). The company expects to continue to ensure that its network AMP remains up to date and consistent with good industry practice, while taking approved regional recovery planning documents fully into account.
5. Review the ten-year network asset management plan (AMP)
Target date: 31 March 2015
Status: Achieved
In this review, the company refined its work plans and forecasts based on: • updated connection growth and consumer demand forecasts• target service levels for network security, resilience and reliability • key planning criteria.
The company published its updated AMP in March 2015.

Performance statement – environmentFor the year ended 31 March 2015
1. Continue to undertake and encourage demand side management
Target date: Ongoing
Status: Achieved
Over 90% of the company’s carbon footprint comes from electrical losses, a natural phenomenon that is caused by the heating of equipment as electricity passes through it, and from carbon embedded in the company’s physical electricity distribution network assets.
The company can and does achieve carbon savings through demand side management (DSM). The company continues to promote and enable DSM through: • cost-reflective network pricing – pricing that reflects to the long run marginal costs of supplying peak loads • co-operating with other upper South Island electricity distributors on a centralised load management control system. This system enables
co-ordinated load control to reduce long term investment in the national grid • help for local businesses installing peak load lopping and emergency diesel generation.
2. Continue to support and sponsor Community Energy Action (CEA)
Target date: Ongoing
Status: Achieved
The company has sponsored and supported CEA since its inception in 1994. For several years, the company has made financial sponsorship grants to CEA of $150,000 per year. The company continued that financial sponsorship in 2015. The company also continued to assist CEA with other day to day operational issues. More than 20,000 local homes have benefited from CEA’s services.
3. Support the Christchurch City Council’s sustainable energy strategy
Target date: Ongoing
Status: Achieved
The company: • continues to seek ways to reduce network peak loads and increase the network load factor• obtains accurate real-time data of network loadings. This allows for more efficient network planning• has policies for the connection of distributed generation to the network to enable the safe and efficient connection of a range of local
generation.
The company’s policies and activities support the CCC’s sustainable energy strategy.
Audited financial statements 2015 Orion New Zealand Limited / 39
Audited financial statements 2015 Orion New Zealand Limited / 40
Performance statement – community and employmentFor the year ended 31 March 2015
1. Zero work related lost time accidents for employees and contractors
Target date: Ongoing
Status: Not achieved
The company’s aim is zero harm. This target covers Orion and its contractors (including Connetics) and is a challenging one due to the physical nature of the work required on the electricity distribution network.
The company had four employee lost time accidents during the year, resulting in 46 days of lost time (2014: two accidents and 14 days of lost time).
Nine employees of the company’s contractors had lost time accidents during the year, resulting in 54 days of lost time (2014: two accidents and 19 days of lost time).
2. Zero number of injury accidents (excluding car versus pole traffic accidents) involving members of the public
Target date: Ongoing
Status: Achieved
No members of the public had injury accidents related to the company’s electricity distribution network or work sites (2014: no accidents).
3. Continue with the company’s local public safety education and awareness programme in the safe use of electricity
Target date: Ongoing
Status: Achieved
The company’s public safety education programme covers issues such as tree owner responsibilities near overhead lines, close approach to overhead lines by irrigators and other operators of plant, scaffolding near lines, householder maintenance near lines, digging near underground cables and safety and security near electricity equipment.
The company delivers its safety messages through a series of community shows, presentations to targeted groups and through regular media outlets such as local newspapers and radio. The company especially targets contractors and their principals, because they are exposed to significant electricity distribution network hazards in the field – this includes third party contractors involved in the wider post-quake recovery and rebuild.
The sheer scale of the post-quake recovery and rebuild, and the fact that contractors in the rebuild are experiencing high staff turnover, means that safety risks for those working near the company’s network assets remain high.
The Ministry of Business, Innovation and Employment has published a mandatory code of practice for working within four metres of the overhead network (prior written consent from network owners is required for this), and there’s an industry best practice guide for working near underground electricity distribution networks.
The company continues to:• develop and grow constructive and mutually beneficial relationships with contractors, their principals and other interested parties to
promote safety around the company’s electricity network assets - this has included safety briefings for over 4,000 contractor employees, during and outside of normal working hours
• process the large increase in minimum safe approach consent applications. Pre-quake, the company received less than 400 of these applications per year, the company now processes around 400 per month
• work with the Electricity Engineers Association and representatives from across the electricity industry on a public safety working group. The objective is to foster a resource of educational and promotional material on electrical safety. This will enable all sectors of the industry to deliver consistent safety information to the public.

Performance statement – community and employment continuedFor the year ended 31 March 2015
4. Follow up on the November 2013 staff culture survey results
Target date: 31 March 2015
Status: Achieved
The company’s employees completed an organisational culture survey in November 2013. The survey measured employees’ perceptions of preferred and current workplace culture attributes. The company’s key initiatives arising from the survey are to: • encourage everyone to set goals, and agree them with their manager – employees and managers should review progress and reset goals at
regular intervals• encourage ongoing training and development – this includes increasing opportunities for all employees to learn more about the wider
business• encourage ongoing culture of open communication within and between teams – so that everyone sees the bigger picture• encourage a customer service culture.
The company expects to run the next survey in November 2015.
5. Achieve voluntary annual staff turnover of less than 5% for Orion and less than 10% for Connetics
Target date: Ongoing
Status: Achieved
During the year employee turnover was: • 3.3% for Orion (2014: 4.5%)• 6.7% for Connetics (2014: 8.7%).
This target excludes the impacts of employees leaving for reasons of retirement, redundancy, on completion of a fixed term (or casual) employment contract or disciplinary related.
6. Continue with the Orion engineering development programme
Target date: Ongoing
Status: Achieved
As at 31 March 2015, the company had six employees on this programme (2014: six employees). The development programme continues to successfully place talented and motivated people into key positions within the business. Positions in the programme are advertised internally and externally. Successful candidates are selected on merit.
Engineering trainees are trained and gain work experience in several parts of the business, with a view to placing them in areas with skill shortages and/or succession opportunities. On average, employees are in the programme for around three years, and after that they are generally placed into permanent roles in the company.
7. Continue to develop the Connetics apprentice scheme
Target date: Ongoing
Status: Not achieved
As at 31 March 2015, Connetics had 31 electricity distribution apprentices (2014: 33): • 15 electrical – including substations, street lighting and wider electrician units and experience • 13 multi-skill – overhead lines and underground cable jointing• 3 multi-skill – overhead lines and electrical.
The apprentice programme assists Connetics to sustainably develop and improve its industry competencies.
8. Continue to support the CPIT Trades Innovation Centre
Target date: Ongoing
Status: Achieved
The Christchurch Polytechnic Institute of Technology (CPIT) has a simulated subdivision at its Sullivan Avenue site, where trades trainees can be trained in real life situations. Electricity distribution is a significant part of the simulated subdivision.
The facility is fully operational for electricity distribution – including overhead lines, underground cables and substations. The facility is an important part of the group’s competence training for employees and contractors.
Audited financial statements 2015 Orion New Zealand Limited / 41

Audited financial statements 2015 Orion New Zealand Limited / 42
Independent auditor’s reportFor the year ended 31 March 2015
The Auditor-General is the auditor of Orion New Zealand Limited and its subsidiaries. The Auditor-General has appointed me, Scott Tobin, using the staff and resources of Audit New Zealand, to carry out the audit of the financial statements and the statement of service performance of the group, consisting of Orion New Zealand Limited and its subsidiaries (collectively referred to as “the Group”), on her behalf.
Opinion on the financial statements and the statement of service performanceWe have audited:• the financial statements of the Group on pages 9 to 34, that
comprise the statement of financial position as at 31 March 2015, the statement of comprehensive income, statement of changes in equity and statement of cash flows for the year ended on that date and the notes to the financial statements that include accounting policies and other explanatory information; and
• the statement of service performance of the Group on pages 35 to 41.
In our opinion:• the financial statements of the Group:
• present fairly, in all material respects:– its financial position as at 31 March 2015; and– its financial performance and cash flows for the year
then ended; and• have been prepared in accordance with New Zealand
equivalents to International Financial Reporting Standards.
• the statement of service performance of the Group:• presents fairly, in all material respects, the Group’s
achievements measured against the performance targets adopted for the year ended 31 March 2015; and
• has been prepared in accordance with generally accepted accounting practice.
Our audit was completed on 10 June 2015. This is the date at which our opinion is expressed.The basis of our opinion is explained below. In addition, we outline the responsibilities of the Board of Directors and our responsibilities, and explain our independence.
Basis of opinionWe carried out our audit in accordance with the Auditor-General’s Auditing Standards, which incorporate the International Standards on Auditing (New Zealand). Those standards require that we comply with ethical requirements and plan and carry out our audit to obtain reasonable assurance about whether the financial statements and the statement of service performance are free from material misstatement. Material misstatements are differences or omissions of amounts and disclosures that, in our judgement, are likely to influence readers’ overall understanding of the financial statements and the statement of service performance. If we had found material misstatements that were not corrected, we would have referred to them in our opinion.An audit involves carrying out procedures to obtain audit evidence about the amounts and disclosures in the financial statements and in the statement of service performance. The procedures selected depend on our judgement, including our assessment of risks of material misstatement of the financial statements and the statement of service performance whether due to fraud or error. In making those risk assessments, we consider internal control relevant to the preparation of the Group’s financial statements and statement of service performance in order to design audit procedures that are appropriate in the circumstances but not for the purpose of expressing an opinion on the effectiveness of the Group’s internal control.An audit also involves evaluating:• the appropriateness of accounting policies used and
whether they have been consistently applied;• the reasonableness of the significant accounting estimates
and judgements made by the Board of Directors;• the adequacy of the disclosures in the financial statements
and in the statement of service performance; and• the overall presentation of the financial statements and the
statement of service performance.
We did not examine every transaction, nor do we guarantee complete accuracy of the financial statements and the statement of service performance. Also we did not evaluate the security and controls over the electronic publication of the financial statements and the statement of service performance.We believe we have obtained sufficient and appropriate audit evidence to provide a basis for our audit opinion.
TO THE READERS OF ORION NEW ZEALAND LIMITED GROUP’S FINANCIAL STATEMENTS AND STATEMENT OF SERVICE PERFORMANCE FOR THE YEAR ENDED 31 MARCH 2015

Independent auditor’s report continuedFor the year ended 31 March 2015
Responsibilities of the Board of DirectorsThe Board of Directors is responsible for the preparation and fair presentation of financial statements and a statement of service performance for the Group, in accordance with New Zealand equivalents to International Financial Reporting Standards and generally accepted accounting practice.The Board of Directors is also responsible for such internal control as it determines is necessary to enable the preparation of financial statements and a statement of service performance that are free from material misstatement, whether due to fraud or error. The Board of Directors is also responsible for the publication of the financial statements and the statement of service performance, whether in printed or electronic form.The Board of Directors’ responsibilities arise from the Energy Companies Act 1992.
Responsibilities of the AuditorWe are responsible for expressing an independent opinion on the financial statements and the statement of service performance and reporting that opinion to you based on our audit. Our responsibility arises from section 15 of the Public Audit Act 2001 and section 45(1) of the Energy Companies Act 1992.
IndependenceWhen carrying out the audit, we followed the independence requirements of the Auditor-General, which incorporate the independence requirements of the External Reporting Board.In addition to the audit, we have carried out two assurance engagements for the company. These engagements were in respect of the company’s disclosure information prepared under the Electricity Distribution Information Disclosure Determination 2012 and the Compliance Statement prepared under the Orion New Zealand Limited Customised Price-Quality Path Determination 2013. These assignments are compatible with the independence requirements.Other than the audit, and these assignments, we have no relationship with or interests in the Group.
Scott TobinAudit New ZealandOn behalf of the Auditor-GeneralChristchurch, New Zealand
Audited financial statements 2015 Orion New Zealand Limited / 43

Annual report 2015 Orion New Zealand Limited / 44
Corporate governance statement
OwnershipThe company is owned by:
• Christchurch City Holdings Limited (which is 100% owned by the Christchurch City Council) 89.275%• Selwyn District Council 10.725% 100.000%
Principal activitiesThe group’s principal activities during the year were to:
• provide electricity distribution network services to customers in the Christchurch and central Canterbury region• provide contracting services in the utilities sector• seek investment opportunities in the infrastructure and energy sectors.
Role of the boardThe company’s shareholders appoint the directors to govern and direct the company’s activities. The board of directors is the overall and final body responsible for the proper direction and control of the company’s activities and decision-making within the company. The board’s responsibility includes areas of stewardship such as:
• commercial performance• business plans and budgets• company policies• financial and dividend policies• management oversight and development• delegations of authority• identification and management of business risks• identification and management of business opportunities• internal control systems• integrity of management information systems• relationships with stakeholders and external parties• compliance with relevant law• reports to shareholders.
In accordance with section 36 of the Energy Companies Act 1992, the company’s principal objective is to operate as a successful business.
Statement of intentIn accordance with section 39 of the Energy Companies Act 1992 and the company’s constitution, in February each year the board submits a draft statement of intent (SOI) to its shareholders. The draft SOI sets out the company’s overall objectives and intentions, as well as financial, earthquake recovery, network reliability, environmental, community, employment and health and safety performance targets for the next three financial years.
After due consultation with the company’s shareholders and after considering comments from those shareholders, the board approves the final SOI and delivers it to the company’s shareholders. A copy is also placed on the company’s public website.
The board also aims to ensure that shareholders are informed of all major developments and issues affecting the company.
Board membershipPursuant to the company’s constitution:
• one director is appointed by the Selwyn District Council• all other directors are appointed by Christchurch City Holdings Limited.
The board chairman is elected by the board.
Board operationThe operation of the board is governed by the company’s constitution and the board’s code of conduct.
The board chairman has a leadership role in the conduct of the board and its relationship with the shareholders and other major stakeholders. The chairman maintains a close professional relationship with the company’s chief executive officer, and through him, the senior management team.
New directors undertake an induction process to familiarise them with matters related to the company.

Corporate governance statement continued
Code of conductThe board has adopted a code of conduct. The code clarifies how the board and directors shall undertake their responsibilities, including:
• the role and fundamental obligations of the board and directors• the terms of reference and operation of board committees• independence and conflicts of interest, including any conflicts with management• board procedures• the role of the chairman • interaction with the chief executive officer and the senior management team• reliance on information and independent advice• confidentiality of company information• shareholder participation• board and director performance review and development.
The board reviews the code of conduct every year.
PoliciesThe board formally reviews the company’s key policies, and any recommendations for changes from management, at least annually.
Board performance and reviewThe board regularly reviews its performance and the performance of the chief executive officer. The reviews aim to identify opportunities and set plans for performance development and improvement.
Board meetingsThe board meets approximately ten times per year. Additional meetings are convened as and when required. The board’s annual work programme is set by the board before the start of each calendar year.
The board receives formal agenda papers and regular reports, generally a week in advance of meetings.
Senior managers are regularly involved in board discussions. Directors also have opportunities to obtain information and seek independent expert advice.
Board committeesThe board delegates some responsibilities and tasks to board committees. However, the board retains the ultimate responsibility and accountability for any committee’s actions or inactions. All directors receive agenda papers for committee meetings and all directors have the right to attend committee meetings.
The board’s two standing committees are as follows:• the audit committee liaises with the company’s independent auditor and it reviews the quality and reliability of internal controls and financial
information used by and issued by the board• the remuneration committee reviews the company’s remuneration policies and practices, and reviews and sets the remuneration of the
company’s chief executive officer and senior management team respectively.
The following directors served as standing committee members during the year ended 31 March 2015:
Audit committee Remuneration committeePaul Munro – chairman Geoff Vazey – chairman from 21 August 2014John Austin – appointed 1 May 2014 Jeremy Smith – chairman until 20 August 2014Nicola Crauford – appointed 21 August 2014 Craig Boyce – resigned 20 August 2014Jeremy Smith Craig Boyce – resigned 20 August 2014
Annual report 2015 Orion New Zealand Limited / 45

Annual report 2015 Orion New Zealand Limited / 46
Subsidiary companiesThe following served as directors of subsidiary companies during the year ended 31 March 2015:Connetics Limited Rob Jamieson (chairman), Brendan Kearney, Geoff VazeyOrion New Zealand Ventures Limited Brendan Kearney
Legislative complianceThe board receives regular updates and representations from management on legislative compliance. Areas of relevant law include corporate, taxation, financial reporting, electricity industry regulation, commercial, environmental, human resources, health and safety and privacy. Compliance manuals and training are made available to all employees and the company engages independent experts for advice on some issues.
Directors’ insuranceThe company arranges comprehensive liability insurance policies for the group, directors and officers within the limits and requirements as set out in the Companies Act 1993 and the company’s constitution.
Loans to directorsThe group does not make loans to directors.
DonationsThe group made $2,000 of donations to charitable causes during the year (2014: $2,000).
AuditorIn accordance with section 45 of the Energy Companies Act 1992 and section 15 of the Public Audit Act 2001, Audit New Zealand on behalf of the Auditor-General is the auditor of the company.
Conflicts of interestThe board operates a formal directors’ interests register and this register is reviewed for any necessary updates at the start of every board meeting. Directors are required to:
• not have any significant conflict of interest and/or the appearance of a conflict of interest that is potentially detrimental to the company• declare any interest immediately to the board and refrain from voting on an issue or transaction in which they have an interest• disclose to the board all business relationships relevant to the company• if requested by any other director, withdraw from any meeting where discussion of an issue or a transaction will occur in which they have an
interest• comply with sections 139 to 149 of the Companies Act 1993• not generally provide business or professional services of an ongoing nature to the company.
Employees are also required to not become involved in any activity that may affect or compromise their ability to perform their duties, or may be in conflict with the interests of the company. If employees become aware that they (or their family members or associates) have a potential conflict of interest, they are required to advise their manager.
Corporate governance statement continued

Interests registerDirectors recorded the following interests in the interests register during the year ended 31 March 2015.
John Austin Thomas Austin Securities Limited Director
Craig Boyce Datacom Group Limited Director Equipment Hire Company Limited Director Extra Strength No.164 Limited Director Farmlands Co-Operative Society Limited Director Farmlands Finance Limited Director Horizon Farming Limited Director Ovation New Zealand Limited Director Progressive Leathers Limited Director Smiths City Group Limited and subsidiaries Director Snowy Peak Limited Director Transdiesel Limited Director
Nicola Crauford Wellington Water Limited (formerly Capacity Infrastructure Services Limited) Director Co-operative Bank Limited – electoral authority Member Crauford Robertson Consulting Limited Director Environmental Protection Authority Director Martin Crauford Limited Director Riposte Consulting Limited Director Watercare Services Limited Director Wellington Rural Fire Authority Director WorleyParsons New Zealand Limited Consultant
Paul Munro Central Plains Water Limited Director Deloitte Limited Director
Bob Simpson Electricity Engineers Association Director New Zealand Engineering Diploma Director Simpson & Associates Limited Director
Jeremy Smith AML Limited Director Atlas Resources Limited Director Holcim (New Zealand) Limited Managing Director Fiji Industries Limited Director McDonald’s Lime limited Director Milburn New Zealand Limited Director Millbrook Quarries Limited Director NZ Portland Cement Association Limited Director South Pacific Cement Limited Director
Geoff Vazey Consult GV Limited Director HEB Construction Limited Director Cook Islands Port Authority Director Maphona Farms Limited Director Green Valley Dairies Limited Director Green Valley Distribution Limited Director
Annual report 2015 Orion New Zealand Limited / 47
Corporate governance statement continued

Annual report 2015 Orion New Zealand Limited / 48
Directors’ remunerationThe total remuneration received by the group’s directors during the year was as follows:
Orion Connetics $000 $000John Austin 42 -Craig Boyce 34 -Nicola Crauford 26 -Paul Munro 52 -Bob Simpson 26 -Jeremy Smith 74 -Geoff Vazey 46 13 300 13
Employee remunerationThe group aims to attract, retain, develop and motivate high calibre employees at all levels of the organisation. The group’s employee remuneration strategy aims for consistency, fairness and alignment with the group’s principal objective – to operate as a successful business. The group regularly compares its employee remuneration against market data. In general, the group aims to meet the market, subject to employee performance.
All individual employment agreement terms and conditions are subject to “one-up” approval. For example, the board approves the chief executive’s employment terms and conditions and the board remuneration committee approves those of the direct reports to the chief executive. Four collective employment agreements cover around 45% of the group’s employees.
Chief executive officer’s remunerationThe board negotiates the chief executive officer’s remuneration, after taking independent expert advice on relevant market data and the remuneration of chief executives for comparable companies. The board reviews the chief executive officer’s remuneration annually.
The company employed Mr Jamieson as chief executive officer in August 2011. Mr Jamieson’s employment agreement provided for a one-off deferred payment at the end of three years, subject to achieving performance objectives throughout those three years, and subject to Mr Jamieson remaining in the role. The one-off deferred payment was the equivalent of six months’ total remuneration.
In early 2014, the Orion board carefully considered Mr Jamieson’s performance and confirmed that Mr Jamieson had achieved the requirements to earn the deferred one-off payment. In taking the company’s overall best interests into account, the board then decided to:
• pay half of the one-off deferred payment in the year ended 31 March 2014 • pay one quarter in the year ended 31 March 2015. • pay one quarter in the year ended 31 March 2016.
Following the final payment above, Mr Jamieson’s employment agreement now has no deferred payment component to it.
Mr Jamieson’s total remuneration over the last two financial years has been as follows:
2015 2014 Notes $000 $000
Fixed remuneration 1 597 575One-off deferred payment 79 150One-off holiday pay effect 2 29 -Total 705 725
Notes:
1. Following its annual review, the board authorised a 3% increase in Mr Jamieson’s base salary, effective from 1 June 2014.
2. Pursuant to the Holidays Act, holiday pay must be paid at the average of an employee’s average gross taxable earnings for the previous twelve months. The first two one-off deferred payments noted above increased Mr Jamieson’s average gross taxable earnings for Mr Jamieson’s holiday pay entitlements during the year ended 31 March 2015.
Corporate governance statement continued

Annual report 2015 Orion New Zealand Limited / 49
Group employee remunerationThe number of group employees and former employees, whose remuneration and benefits fall within specified bands is listed below. Remuneration includes all non-cash benefits and redundancy payments where applicable.
Remuneration $000 2015 2014
100 - 110 33 35 110 - 120 21 28 120 - 130 27 19 130 - 140 14 9 140 - 150 6 10 150 - 160 8 8 160 - 170 5 - 170 - 180 1 - 180 - 190 - 1 190 - 200 1 - 200 - 210 - 3 210 - 220 2 2 220 – 230 1 1 230 - 240 2 - 250 - 260 1 - 300 - 310 1 - 310 - 320 - 1 330 - 340 - 1 370 - 380 1 - 430 - 440 - 1 440 - 450 1 - 470 - 480 1 1 700 - 710 1 - 720 - 730 - 1
Corporate governance statement continued

Annual report 2015 Orion New Zealand Limited / 50
Five-year trends – group
2015 2014 2013 2012 2011 $m $m $m $m $m
Statement of comprehensive income Operating revenue 333 270 261 245 222EBIT 116 73 70 73 49Profit before income tax 110 69 66 68 45Net profit 83 50 49 54 28Other comprehensive income - 79 - - (97)Total comprehensive income 83 130 49 54 (69) Balance sheet Current assets Cash and cash equivalents - 1 1 1 -Trade and other receivables 12 11 10 19 6Investment property - - 9 - -Other 12 13 8 7 7 24 25 28 27 13 Non current assets Property, plant and equipment 1,055 1,010 855 820 794Investment property - - - 8 8Other 5 5 6 6 6 1,060 1,015 861 834 808Total assets 1,084 1,040 889 861 821 Current liabilities Trade and other payables 39 38 29 28 29Borrowings 2 2 - - -Other 9 5 4 3 3 50 45 33 31 32 Non current liabilities Borrowings 84 74 61 53 36Deferred tax 188 186 155 153 151Other 2 2 3 4 2 274 262 219 210 189 Equity Issued capital 120 120 120 120 120Reserves 105 105 26 26 26Retained earnings 535 508 491 474 454 760 733 637 620 600Total liabilities and equity 1,084 1,040 889 861 821 Statement of cash flows Operating cash flows 114 85 78 61 76Investing cash flows (68) (52) (53) (43) (33)Financing cash flows (46) (34) (25) (17) (43)

Annual report 2015 Orion New Zealand Limited / 51
2015 2014 2013 2012 2011 $m $m $m $m $m
Financial performance indicators Dividends paid 56 34 32 34 38Net profit to average shareholders’ equity (%) 11.1 7.4 7.8 8.9 4.3Net interest bearing debt to debt-plus-equity (%) 10 9 9 8 6
Non financial measures Electricity maximum demand (MW) 590 619 592 633 616Electricity deliveries into the network – including from embedded electricity generation (GWh) 3,277 3,162 3,165 3,070 3,308Number of customer connections (000) 191 189 189 191 193
Five-year trends – group continued

Annual report 2015 Orion New Zealand Limited / 52
Directory As at 10 June 2015
Sources of informationA range of information about our policies and operations is available on our website at oriongroup.co.nz.
Other websites which contain information of interest include:
• Canterbury Earthquake Recovery Authority cera.govt.nz
• Christchurch City Council ccc.govt.nz
• Commerce Commission comcom.govt.nz
• Community Energy Action cea.co.nz
• Connetics connetics.co.nz
• Consumer electricity information powerswitch.org.nz and whatsmynumber.org.nz
• Electricity and Gas Complaints Commission egcomplaints.co.nz
• Electricity Authority ea.govt.nz
• Electricity Networks Association electricity.org.nz
• Environment Canterbury Regional Council ecan.govt.nz
• Energy Efficiency and Conservation Authority eeca.govt.nz
• Ministry of Economic Development med.govt.nz
• Selwyn District Council selwyn.govt.nz
DirectorsJeremy Smith CHAIRMAN
John Austin
Nicola Crauford
Paul Munro
Bob Simpson
Geoff Vazey
Corporate managementRob Jamieson CHIEF EXECUTIVE OFFICER
David Freeman-Greene GENERAL MANAGER COMMERCIAL
Brendan Kearney GENERAL MANAGER CORPORATE SERVICES
Craig Kerr GENERAL MANAGER INFORMATION SOLUTIONS
John O’Donnell CHIEF OPERATING OFFICER
Adrienne Sykes GENERAL MANAGER HUMAN RESOURCES
Contact us565 Wairakei RoadPO Box 13896Christchurch 8141New Zealand
Phone + 64 3 363 9898Fax + 64 3 363 9899Email [email protected] oriongroup.co.nzTwitter twitter.com/OrionNZ
AuditorAudit New Zealand, on behalf of the Auditor-General
Principal solicitorsChapman TrippChristchurch