2015 management report group results - edf france · equity (non-controlling interests) 5,491 5,419...
TRANSCRIPT
Page 1 of 52
2015 MANAGEMENT REPORT
-
GROUP RESULTS

Page 2 of 52
CONTENTS
1 KEY FIGURES............................ .......................................................................................................... 3
2 ECONOMIC ENVIRONMENT...... ......................................................................................................... 5
2.1 MARKET PRICES FOR ELECTRICITY AND THE PRINCIPAL ENERGY SOURCES ........................................................ 5 2.2 ELECTRICITY AND GAS CONSUMPTION ................................................................................................................. 9 2.3 ELECTRICITY AND NATURAL GAS SALES TARIFFS .................................................................................................. 9 2.4 WEATHER CONDITIONS: TEMPERATURES AND RAINFALL ................................................................................... 9
3 SIGNIFICANT EVENTS OF 2015 11
3.1 EUROPEAN COMMISSION DECISION ON THE TAX TREATMENT OF PROVISIONS ESTABLISHED BETWEEN 1987 AND 1996 FOR RENEWAL OF THE GENERAL NETWORK ........................................................................... 11
3.2 LIBERALISATION OF HYDROPOWER CONCESSIONS IN FRANCE ......................................................................... 11 3.3 STRATEGIC DEVELOPMENT .................................................................................................................................. 11 3.4 NEW INVESTMENTS AND PARTNERSHIPS ............................................................................................................ 12 3.5 INVESTMENT PROJECTS ........................................................................................................................................ 16 3.6 REGULATORY ENVIRONMENT .............................................................................................................................. 18 3.7 OTHER SIGNIFICANT EVENT .................................................................................................................................. 21 3.8 GOVERNANCE – BOARD OF DIRECTORS .............................................................................................................. 21
4 SUBSEQUENT EVENTS.............. ........................................................................................................ 22
5 ANALYSIS OF THE BUSINESS AND THE CONSOLIDATED INCOME STATEMENTS
FOR 2014 AND 2015................. ........................................................................................................ 23
5.1 SALES ..................................................................................................................................................................... 24 5.2 EBITDA ................................................................................................................................................................... 27 5.3 OPERATING PROFIT (EBIT) .................................................................................................................................... 30 5.4 FINANCIAL RESULT ................................................................................................................................................ 32 5.5 INCOME TAXES...................................................................................................................................................... 32 5.6 SHARE IN NET INCOME OF ASSOCIATES AND JOINT VENTURES ........................................................................ 32 5.7 NET INCOME ATTRIBUTABLE TO NON-CONTROLLING INTERESTS ..................................................................... 33 5.8 EDF NET INCOME .................................................................................................................................................. 33 5.9 NET INCOME EXCLUDING NON-RECURRING ITEMS ............................................................................................ 33
6 NET INDEBTEDNESS, CASH FLOWS AND INVESTMENTS .................................................................. 34
6.1 OPERATING CASH FLOW ...................................................................................................................................... 34 6.2 CHANGE IN WORKING CAPITAL ........................................................................................................................... 35 6.3 NET INVESTMENTS ................................................................................................................................................ 35 6.4 FRENCH GENERAL ELECTRICITY NETWORK ......................................................................................................... 36 6.5 DEDICATED ASSETS ............................................................................................................................................... 36 6.6 CASH FLOW BEFORE DIVIDENDS .......................................................................................................................... 37 6.7 DIVIDENDS PAID IN CASH ..................................................................................................................................... 37 6.8 GROUP CASH FLOW .............................................................................................................................................. 37 6.9 EFFECT OF CHANGE IN EXCHANGE RATE ............................................................................................................ 37 6.10 NET INDEBTEDNESS ............................................................................................................................................... 37 6.11 FINANCIAL RATIOS ................................................................................................................................................ 37
7 MANAGEMENT AND CONTROL OF MARKET RISKS ......................................................................... 38
7.1 MANAGEMENT AND CONTROL OF FINANCIAL RISKS ......................................................................................... 38 7.2 MANAGEMENT AND CONTROL OF ENERGY MARKET RISKS .............................................................................. 49 7.3 MANAGEMENT OF INSURABLE RISKS .................................................................................................................. 50
8 TRANSACTIONS WITH RELATED PARTIES ........................................................................................ 52
9 SCOPE OF CONSOLIDATION.... ........................................................................................................ 52
10 PRINCIPAL RISKSAND UNCERTAINTIES ............................................................................................ 52
11 FINANCIAL OUTLOOK.............. ........................................................................................................ 52

Page 3 of 52
1 KEY FIGURES
Pursuant to European regulation 1606/2002 of 19 July 2002 on the adoption of international accounting standards, the EDF group’s consolidated financial statements for the year ended 31 December 2015 are prepared under the international accounting standards published by the IASB and approved by the European Union for application at 31 December 2015. These international standards are IAS (International Accounting Standards), IFRS (International Financial Reporting Standards), and SIC and IFRIC interpretations.
The Group’s accounting policies are presented in note 1 to the consolidated financial statements at 31 December 2015.
The figures presented in this document are taken from the EDF group’s consolidated financial statements at 31 December 2015.
The comparative figures for 2014 have been restated to reflect the impact of retrospective application of IFRIC 21 “Levies”. This interpretation has been applicable since 1 January 2015 and is applied retrospectively in compliance with IAS 8 “Accounting Policies, Changes in Accounting Estimates and Errors”.
For the Group, the main consequence of this change in accounting method concerns the recognition of certain taxes, which are no longer spread over the year but recorded as soon as the triggering event for those taxes arises, which in most cases is during the first half-year.
The taxes concerned by this change in recognition practice essentially relate to operation of the EDF group’s businesses in France. Many of them are taxes for which the triggering event arises on 1 January, such as the tax on nuclear facilities, the tax on network firms (IFER), land tax, pylon tax and hydropower tax.
The application of IFRIC 21 has no significant impact on the annual consolidated financial statements.
The Group’s key figures for 2015 are shown in the following tables.
Extract from the consolidated income statements
(in millions of Euros)
2015 2014 (1) Variation
Variation (%)
Organic growth
(%)
Sales 75,006 73,383 1,623 +2.2 -1.8
Operating profit before depreciation and amortisation (EBITDA)
17,601 17,279 322 +1.9 -0.6
Operating profit (EBIT) 4,280 7,984 (3,704) -46.4 -48.8
Income before taxes of consolidated companies
1,692 5,433 (3,741) -68.9 -71.3
EDF net income 1,187 3,701 (2,514) -67.9 -69.7
Net income excluding non-recurring items (2) 4,822 4,852 (30) -0.6 -2.1
(1) EDF Energy’s transactions on the wholesale electricity markets (excluding trading activities), which showed a net short position at 31 December 2014, have been reclassified from energy purchases to sales in the amount of €509 million.
(2) Net income excluding non-recurring items is not defined by IFRS, and is not directly visible in the consolidated income statements. It corresponds to the net income excluding non-recurring items and the net change in fair value on Energy and Commodity derivatives, excluding trading activities, net of tax (see section 5.9, “Net income excluding non-recurring items”).

Page 4 of 52
Extract from the consolidated balance sheets
(in millions of Euros) 31/12/2015 31/12/2014 (1)
Non-current assets 149,439 146,078
Inventories and trade receivables 36,973 37,923
Other assets 69,536 65,567
Cash and cash equivalents, other liquid assets, loans to RTE and joint ventures 22,993 18,361
Assets held for sale - 18
TOTAL ASSETS 278,941 267,947
Equity (EDF share) 34,749 35,246
Equity (non-controlling interests) 5,491 5,419
Special concession assets 45,082 44,346
Provisions 75,327 73,850
Loans and other financial liabilities 60,388 52,569
Other liabilities 57,904 56,517
Liabilities related to assets classified as held for sale - -
TOTAL EQUITY AND LIABILITIES 278,941 267,947
(1) The comparative figures for 2014 have been restated to reflect the impact of retrospective application of IFRIC 21.
Group cash flow
(in millions of Euros) 2015 2014 Variation
Variation
(%)
Group cash flow (1) (2,064) (4,007) 1,943 +48.5
(1) Group cash flow is not an aggregate defined by IFRS as a measure of financial performance, and is not comparable with indicators of the same name reported by other companies. It is equivalent to the operating cash flow after the net change in working capital, net investments, the impact of the European Commission decision concerning the French general electricity network, allocations and withdrawals from dedicated assets, and dividends.
Details of net indebtedness
(in millions of Euros) 31/12/2015 31/12/2014 Variation
Variation
(%)
Loans and other financial liabilities 64,183 55,652 8,531 +15.3
Derivatives used to hedge liabilities (3,795) (3,083) (712) +23.1
Cash and cash equivalents (4,182) (4,701) 519 -11.0
Available-for-sale financial assets – Liquid assets (18,141) (12,990) (5,151) +39.7
Loan to RTE (670) (670) - -
NET INDEBTEDNESS (1) 37,395 34,208 3,187 +9.3
(1) Net indebtedness is not defined in the accounting standards and is not directly visible in the Group’s consolidated balance sheets. It comprises total loans and financial liabilities, less cash and cash equivalents and liquid assets. Liquid assets are financial assets consisting of funds or securities with initial maturity of over three months that are readily convertible into cash and are managed according to a liquidity-oriented policy. It also includes the Group’s loan to RTE.

Page 5 of 52
2 ECONOMIC ENVIRONMENT
2.1 MARKET PRICES FOR ELECTRICITY AND THE PRINCIPAL ENERGY SOURCES
In an increasingly interconnected European market, analysis of market prices in France and the rest of Europe provides vital context.
Spot electricity prices in Europe were higher overall during 2015 than 2014. The sharper temperatures of 2015, with a colder first quarter and hotter summer than the previous year, counterbalanced the downward pressure on prices associated with the fall in fuel prices. Only German spot prices decreased, due to a substantial rise in energy generation from renewable sources.
2.1.1 Spot electricity prices in Europe1
The comments below concern baseload prices.
In France, spot electricity prices stood at an average €38.5/MWh in 2015, €3.8 MWh higher than in 2014. This price rise was mainly driven by temperatures which, compared to 2014, were 1.8°C colder in the first quarter and 0.7°C higher in the third quarter, and also by lower water levels.
The rise in demand in the first quarter was partly met by more extensive use of fossil-fired thermal plants. Despite the higher demand, the increase in spot prices was limited by the fall in gas and coal prices. Second and third quarter spot prices were relatively similar to 2014, although consumption levels were lower year-on-year in May (which contained several public holidays) and December (when temperatures were well above normal for the month).
2015 was marked by stable availability for the nuclear power plants, higher wind power and photovoltaic power output, and lower levels of hydropower generation.
In the United Kingdom, spot electricity prices rose by €3.5/MWh compared to 2014 to an average €55.7/MWh. The rise occurred in the second and third quarters, which showed respective year-on-year increases of €10.1/MWh and €9.0/MWh.
In Italy, average spot prices remained stable (+0.2%) compared to 2014, at €52.3/MWh.
In Germany, spot prices stood at an average €31.6/MWh, €1.1/MWh lower than their 2014 level. This was the lowest average price since 2005. Despite lower temperatures than the previous year, the supply/demand balance was relaxed on the whole, helped by plentiful supplies of wind power in particular while photovoltaic solar power output remained stable overall. Total wind power output for 2015 was 8.6GW, up by 2.5GW from 2014.
In Belgium, spot prices were up by €3.9/MWh compared to 2014, with an average price of €44.7/MWh. This rise is attributable to the markedly lower available nuclear capacity. The Doel 1 plant, which was shut down in February 2015 to prepare for a 10-year extension of its operating life after 40 years of use, only started up again on 30 December 2015. Two nuclear power plants (Doel 3 and Tihange 2) which had been shut down in late March 2014 also received authorisation to restart in December 2015.
1. France and Germany: average previous day EPEXSPOT price for same-day delivery;
Belgium: average previous day Belpex price for same-day delivery; United Kingdom: average previous day EDF Trading OTC price for same-day delivery; Italy: average previous day GME price for same-day delivery.
France United
Kingdom Italy Germany Belgium
Average baseload price for 2015 (€/MWh) 38.5 55.7 52.3 31.6 44.7
Variation in average baseload prices, 2015/2014 +11.1% +6.7% +0.4% -3.5% +9.5%
Average peakload price for 2015 (€/MWh) 46.6 61.8 58.6 39.1 54.0
Variation in average peakload prices, 2015/2014 +6.4% +5.3% 0.0% -4.7% +11.1%
Page 6 of 52
2.1.2 Forward electricity prices in Europe1
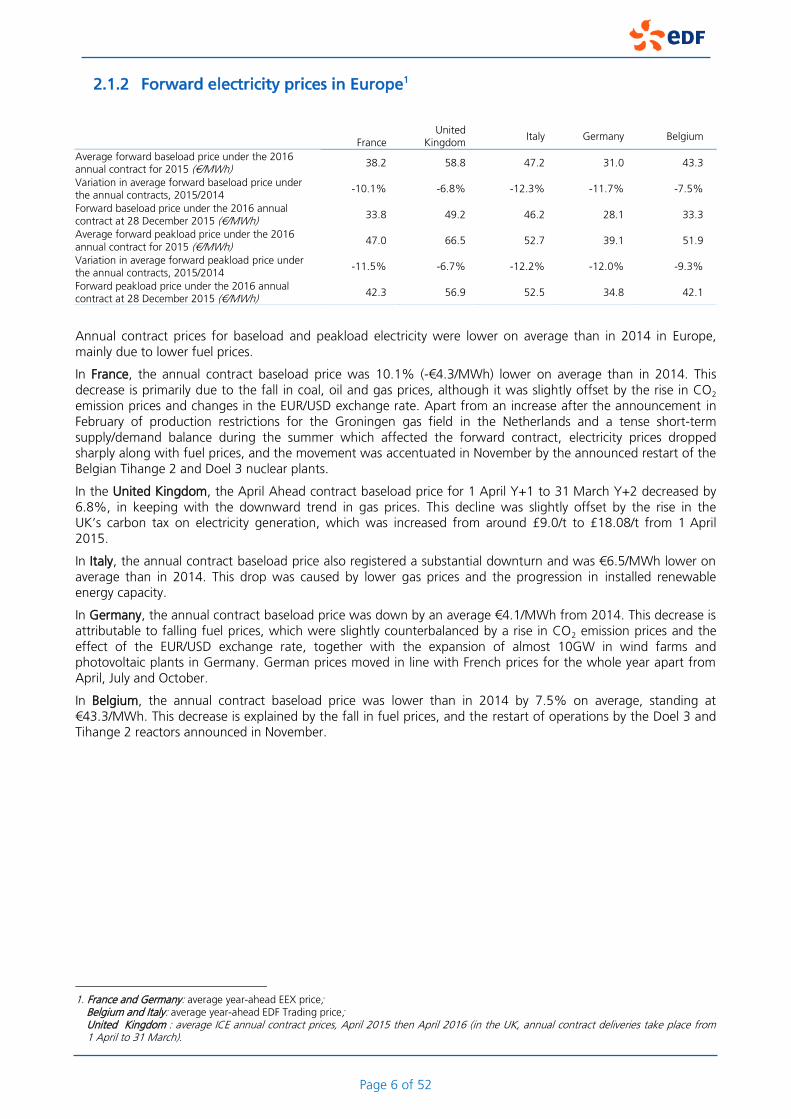
Annual contract prices for baseload and peakload electricity were lower on average than in 2014 in Europe, mainly due to lower fuel prices.
In France, the annual contract baseload price was 10.1% (-€4.3/MWh) lower on average than in 2014. This decrease is primarily due to the fall in coal, oil and gas prices, although it was slightly offset by the rise in CO2 emission prices and changes in the EUR/USD exchange rate. Apart from an increase after the announcement in February of production restrictions for the Groningen gas field in the Netherlands and a tense short-term supply/demand balance during the summer which affected the forward contract, electricity prices dropped sharply along with fuel prices, and the movement was accentuated in November by the announced restart of the Belgian Tihange 2 and Doel 3 nuclear plants.
In the United Kingdom, the April Ahead contract baseload price for 1 April Y+1 to 31 March Y+2 decreased by 6.8%, in keeping with the downward trend in gas prices. This decline was slightly offset by the rise in the UK’s carbon tax on electricity generation, which was increased from around £9.0/t to £18.08/t from 1 April 2015.
In Italy, the annual contract baseload price also registered a substantial downturn and was €6.5/MWh lower on average than in 2014. This drop was caused by lower gas prices and the progression in installed renewable energy capacity.
In Germany, the annual contract baseload price was down by an average €4.1/MWh from 2014. This decrease is attributable to falling fuel prices, which were slightly counterbalanced by a rise in CO2 emission prices and the effect of the EUR/USD exchange rate, together with the expansion of almost 10GW in wind farms and photovoltaic plants in Germany. German prices moved in line with French prices for the whole year apart from April, July and October.
In Belgium, the annual contract baseload price was lower than in 2014 by 7.5% on average, standing at €43.3/MWh. This decrease is explained by the fall in fuel prices, and the restart of operations by the Doel 3 and Tihange 2 reactors announced in November.
1. France and Germany: average year-ahead EEX price;
Belgium and Italy: average year-ahead EDF Trading price; United Kingdom : average ICE annual contract prices, April 2015 then April 2016 (in the UK, annual contract deliveries take place from 1 April to 31 March).
France United
Kingdom Italy Germany Belgium
Average forward baseload price under the 2016 annual contract for 2015 (€/MWh)
38.2 58.8 47.2 31.0 43.3
Variation in average forward baseload price under the annual contracts, 2015/2014
-10.1% -6.8% -12.3% -11.7% -7.5%
Forward baseload price under the 2016 annual contract at 28 December 2015 (€/MWh)
33.8 49.2 46.2 28.1 33.3
Average forward peakload price under the 2016 annual contract for 2015 (€/MWh)
47.0 66.5 52.7 39.1 51.9
Variation in average forward peakload price under the annual contracts, 2015/2014
-11.5% -6.7% -12.2% -12.0% -9.3%
Forward peakload price under the 2016 annual contract at 28 December 2015 (€/MWh)
42.3 56.9 52.5 34.8 42.1

Page 7 of 52
Principal forward electricity prices in Europe (baseload)
2.1.3 CO2 emission rights prices1
The price of CO2 emission rights for delivery in December 2016 rose by €1.1/t to end the year at €8.3/t. This increase took place gradually, with rising phases followed by stabilisation phases. The main factor in CO2 price movements was the votes and announcements concerning the Market Stability Reserve (MSR), a system set up to support CO2 prices, which monitors volumes accessible through auction and places the surplus volumes in a reserve. The MSR was adopted by the European Parliament in early July 2015, but uncertainties over its application and its effective date (2019 or 2021) helped to keep up market activity until the summer.
CO2 emission rights prices
1. Average ICE prices for the annual contract, Phase III (2013-2020).
Page 8 of 52
2.1.4 Fossil fuel prices1
Coal ($/t)
Oil ($/bbl)
Natural gas (€/MWhg)
Average price for 2015 54.6 53.5 20.4
Average price variation, 2015/2014 -30.2% -46.2% -17.7%
Highest price in 2015 65.3 67.8 23.6
Lowest price in 2015 43.7 36.1 15.6
Closing price, 2014 65.9 57.3 21.8
Closing price, 2015 44.0 37.3 15.8
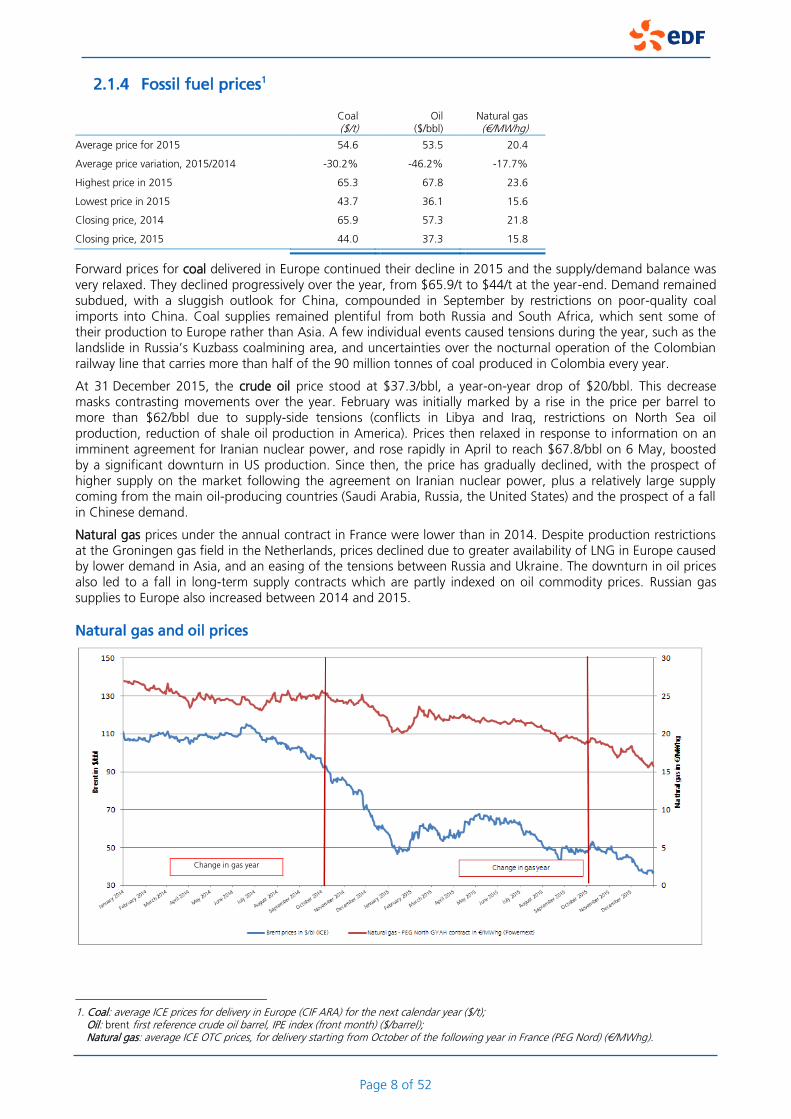
Forward prices for coal delivered in Europe continued their decline in 2015 and the supply/demand balance was very relaxed. They declined progressively over the year, from $65.9/t to $44/t at the year-end. Demand remained subdued, with a sluggish outlook for China, compounded in September by restrictions on poor-quality coal imports into China. Coal supplies remained plentiful from both Russia and South Africa, which sent some of their production to Europe rather than Asia. A few individual events caused tensions during the year, such as the landslide in Russia’s Kuzbass coalmining area, and uncertainties over the nocturnal operation of the Colombian railway line that carries more than half of the 90 million tonnes of coal produced in Colombia every year.
At 31 December 2015, the crude oil price stood at $37.3/bbl, a year-on-year drop of $20/bbl. This decrease masks contrasting movements over the year. February was initially marked by a rise in the price per barrel to more than $62/bbl due to supply-side tensions (conflicts in Libya and Iraq, restrictions on North Sea oil production, reduction of shale oil production in America). Prices then relaxed in response to information on an imminent agreement for Iranian nuclear power, and rose rapidly in April to reach $67.8/bbl on 6 May, boosted by a significant downturn in US production. Since then, the price has gradually declined, with the prospect of higher supply on the market following the agreement on Iranian nuclear power, plus a relatively large supply coming from the main oil-producing countries (Saudi Arabia, Russia, the United States) and the prospect of a fall in Chinese demand.
Natural gas prices under the annual contract in France were lower than in 2014. Despite production restrictions at the Groningen gas field in the Netherlands, prices declined due to greater availability of LNG in Europe caused by lower demand in Asia, and an easing of the tensions between Russia and Ukraine. The downturn in oil prices also led to a fall in long-term supply contracts which are partly indexed on oil commodity prices. Russian gas supplies to Europe also increased between 2014 and 2015.
Natural gas and oil prices
1. Coal: average ICE prices for delivery in Europe (CIF ARA) for the next calendar year ($/t);
Oil: brent first reference crude oil barrel, IPE index (front month) ($/barrel); Natural gas: average ICE OTC prices, for delivery starting from October of the following year in France (PEG Nord) (€/MWhg).
Change in gas year

Page 9 of 52
2.2 ELECTRICITY1 AND GAS2 CONSUMPTION
Overall electricity consumption in France in 2015 was up by 2.2% from 2014. Electricity consumption for the first half-year was 4.2% higher in 2015 than 2014 because of colder temperatures, principally in the first four months. July and August were warmer in 2015 than 2014, boosting demand. But the last quarter, despite a cool October which caused a 7.8% increase in consumption, could not offset the 10.6% year-on-year decrease observed for the single month of December.
After correction for weather effects, electricity consumption in France was up slightly by 0.5% after three years of stability. Consumption by small and medium-sized businesses and residential customers was also up by 0.6%, while consumption by large industrial customers was stable (+0.2%) compared to 2014.
In the United Kingdom, estimated electricity consumption was down by 0.4% from 2014, mainly due to improvements in energy efficiency. In Italy, electricity consumption was up by 1.5% as a result of exceptional temperatures in the third quarter of 2015.
Natural gas consumption in France rose by 8.1% in 2015. The main reason for this increase was the relatively mild weather of 2014 and a colder February and October 2015 with below-normal temperatures. But in December 2015, temperatures were 3.9°C above seasonal norms: it was the warmest December on record in France since 1900, with lower year-on-year gas consumption.
Estimated natural gas consumption in the United Kingdom was up by 4.1% from 2014 due to lower temperatures and higher demand. In Italy, domestic demand for natural gas increased by +9.1% as a result of favourable weather conditions, leading to a rise in consumption on the residential market and for thermal power generation.
2.3 ELECTRICITY AND NATURAL GAS SALES TARIFFS
For details of recent developments concerning tariffs in France, see section 3.6.1.5, “Regulated electricity sales tariffs in France”.
In the United Kingdom, there were two tariff changes in 2015:
on 11 February 2015, fixed gas tariffs were reduced by 1.3%. This decrease is explained by the fall in gas prices on the wholesale markets and is coherent with the reduction in fixed gas tariffs applied by the five other largest energy suppliers in the UK;
in early March 2015, new, more competitive fixed-tariff products were introduced on the B2C segment. The “Blue Price Promise June 2016” guarantees a fixed price of £965 per year up to and including June 2016, and the “Blue Price Promise February 2017” guarantees a fixed price of £999 a year up to and including February 2017.
2.4 WEATHER CONDITIONS: TEMPERATURES AND RAINFALL
2015 was a particularly warm year. In France, average temperatures were 0.3°C above normal levels, making 2015 the third-warmest year since 1900 after 2014 and 2011.
Widely contrasting temperatures were recorded during the year:
February temperatures were 2°C below normal, and the early autumn (September and October) was relatively cool;
the summer (July and August) was around 2°C warmer than in 2014;
December was exceptionally warm, registering average temperatures that were 3.9°C above normal.
1. Sources: France: unadjusted data and data adjusted for weather effects provided by RTE.
United Kingdom: Department of Energy and Climate Change for the first three quarters, local subsidiary estimation for the final quarter. Italy: unadjusted data and data provided by Terna, the Italian national grid operator and adjusted by Edison.
2. Sources: France: S unadjusted data from Smart GRTgaz. United Kingdom: Department of Energy and Climate Change data for the first three quarters, local subsidiary estimation for the final quarter. Italy: Ministry for Economic Development (MSE), Snam Rete Gas data restated by Edison on the basis 1Bcm = 10.76TWh.

Page 10 of 52
Temperatures (1) (2) in France in 2015 and 2014
(1) Average temperatures recorded in 32 cities weighted by electricity consumption.
(2) Source: Miréor (data from Météo-France).
2015 was marked by a significant shortfall in annual precipitation in many European countries contained in a wide band of land stretching from the Iberian peninsula to the former USSR countries, and therefore comprising France.
The opposite situation was observed in Northern Europe (the British Isles and Scandinavia) and Southern Europe (South Italy, the Balkans and Turkey), where there was surplus precipitation.
Water levels in France in 2015 and 2014 (1)
(1) Weekly monitoring by EDF’s OSGE energy observatory of French reservoir levels (Miréor project) as far as the coast.
In France, except in the Pyrenees which registered surplus precipitation, there was a shortfall in precipitation in the first half of 2015, particularly in the Southern Alps and the central regions. A heat wave in July accentuated this shortfall and led to severely low water levels before a rainy month of August improved the situation. Autumn brought further shortfalls, especially in December, which was a very mild, dry month.
+0.2
-2.0
+0.1 +0.5
-0.7
+0.5
+1.1 +0.7
-1.4 -1.0
+2.2
+3.9
-5
-4
-3
-2
-1
0
1
2
3
4
5
0
5
10
15
20
25
Janurary February March April May June July August September October November December
40%
60%
80%
100%
120%
140%
January February March April May June July August September October November December
Variance from normal
in 2015 in °C
2014
2015
Monthly average temperatures in °C
Usual level of water levels
Min-max 2005-2015
2014
2015

Page 11 of 52
As a consequence of these unusual weather conditions, French hydropower capacity was below normal for every month of the year, particularly in the second half of the year when the shortage gradually worsened until it reached the lowest point of the year in December. The cumulative shortfall for the year 2015 was the fourth most serious in more than 30 years after 1989, 2005 and 2011.
3 SIGNIFICANT EVENTS OF 2015 1
3.1 EUROPEAN COMMISSION DECISION ON THE TAX TREATMENT OF PROVISIONS ESTABLISHED BETWEEN 1987 AND 1996 FOR RENEWAL OF THE GENERAL
NETWORK
On 22 July 2015 the European Commission adopted a new decision classifying the tax treatment of provisions established between 1987 and 1996 for renewal of the General Network facilities as state aid that is incompatible with European Union rules.
This decision followed the European Union General Court’s cancellation, through a decision of December 2009 upheld by the Court of Justice of the European Union in June 2012, of the Commission’s initial decision of 16 December 2003 on the grounds that when making its decision the Commission should have applied the private investor principle to determine whether or not the action constituted state aid.
Following this cancellation the French state repaid €1,224 million to EDF on 30 December 2009, corresponding to the sum paid by EDF to the French state in February 2004 (the respective shares of ERDF and RTE2 had already been transferred). The European Commission then decided in May 2013 to reopen the proceedings.
In the decision of 22 July 2015 the Commission concluded that State aid incompatible with the common market had indeed been given. As a result of this decision the French state ordered EDF to reimburse the amount corresponding to the alleged aid, plus interest calculated as determined by the Commission.
In response to this decision EDF reimbursed the sums demanded. However, the Group contests the existence of unlawful State aid and filed an action for annulment before the European Union General Court on 22 December 2015.
Following this decision, on 13 October 2015 EDF made a payment of €1,383 million to the French state, which was partly offset by a reimbursement of €375 million received from RTE. The detailed impact on the Group’s consolidated financial statements at 31 December 2015 is presented in note 3.3 to these financial statements.
3.2 LIBERALISATION OF HYDROPOWER CONCESSIONS IN FRANCE
The European Commission (EC) Directorate-General for Competition has begun proceedings against the French state concerning hydropower concessions in France, on the grounds of article 106, chapter 1 of the Treaty on the Functioning of the EU (TFEU), read in conjunction with article 102 of the same treaty.
The European Commission therefore sent a formal notice to the French State on 22 October 2015, stating that it considered the fact that most hydropower concessions in France are attributed to and reserved for EDF as a violation of the above articles, since these measures reinforced EDF’s dominant position on the French retail electricity markets.
The State had two months to reply to this notice, which marked the beginning of an adversarial exchange of positions between the State and the EC, without prejudice to the final outcome. As the principal interested party, EDF received a copy of this notice. It sent the EC its observations in response to the notice on 4 January 2016, firmly contesting the EC’s analysis and the grounds for this analysis.
3.3 STRATEGIC DEVELOPMENT
Agreements for construction of the Hinkley Point C nuclear power plant
EDF and China General Nuclear Power Corporation (CGN) signed a Strategic Investment Agreement on 21 October 2015 for a joint investment in the construction of two reactors at Hinkley Point C.
The agreement includes a broad UK partnership to develop new nuclear power plants at Sizewell and Bradwell. Contracts between the British Government and EDF, and contracts with Hinkley Point C‘s four main suppliers, have also been finalised.
1. A full list of press releases is available from the EDF website: www.edf.fr. 2. ERDF and RTE are independently-managed regulated subsidiaries in the EDF Group, referred to in the rest of this document simply as RTE
and EDF without necessarily repeating this information.
Page 12 of 52
Under the Strategic Investment Agreement, EDF’s share in Hinkley Point C should be 66.5% and CGN’s should be 33.5%. Without reducing this initial stake below 50%, EDF will in due course consider bringing other investors into the project.
EDF and CGN have also agreed the principal terms of a wider partnership for the joint development of new nuclear power stations at Sizewell in Suffolk and Bradwell in Essex. These terms will be finalised before the final investment decision for Hinkley Point C.
The stages involved in a final investment decision are as follows:
finalisation by EDF of its financing plan and contribution by CGN of guarantees for its own financing ;
approval by the EDF and CGN Boards of Directors;
clearance by merger control and other governmental authorities in China and Europe;
finalisation of contractual documentation based on agreements signed in October 2015.
3.4 NEW INVESTMENTS AND PARTNERSHIPS
3.4.1 New investments and partnerships concerning EDF
3.4.1.1 Investment by Electranova in an eighth start-up: FirstFuel
On 27 May 2015 Electranova Capital, an investment fund managed by Idinvest Partners in partnership with EDF and backed by Allianz and BPI, announced its eighth investment, in the North American start-up FirstFuel. FirstFuel’s software platform provides an understanding of energy expenditure for commercial and office buildings, developing new opportunities for energy efficiency. Since its commercial launch in 2012, FirstFuel has analysed more than a million electricity meters, and identified annual savings of more than $400 million and 5TWh.
3.4.1.2 Extension of a series of existing agreements with EDF’s Chinese partners
As part of their strategic partnerships, EDF and China General Nuclear Power Group (CGN) announced on 29 January 2015 that they had signed a new agreement to share their experience of plant operation and engineering for existing nuclear fleets, with the aim of preserving the highest safety levels and maintaining consistency between French and Chinese procedures and standards. EDF also signed an agreement with Huadian, a leading Chinese electric utility, paving the way for future cooperation on joint projects in China and at international level. The three key areas of focus are combined-cycle gas-turbine power plants, hydropower plants and renewable energies.
During his visit to France on 30 June 2015 the Chinese Prime Minister and French Prime Ministers made a joint declaration on French-Chinese cooperation in nuclear energy. They asked industrial operators to work together more closely to design safe, competitive new third-generation reactors that meet the needs of the global market.
Together with AREVA, EDF therefore signed agreements with its Chinese partners CGN and CNNC to develop the approaches required by the two governments.
3.4.1.3 Snam, GIC and EDF Invest sign an agreement with Crédit Agricole Assurances for its investment in TIGF
In January 2015, Snam, GIC, and EDF Invest announced that they had concluded an agreement with Crédit Agricole Assurances for its entry into the share capital of TIGF with a 10% stake. The transaction was finalised on 26 February 2015. Upon its completion, Snam, GIC, EDF Invest and Crédit Agricole Assurances now hold respectively 40.5%, 31.5%, 18% and 10% of the share capital of TIGF indirectly.
3.4.1.4 EDF Invest finalises the acquisition of Madrileña Red de Gas
In May 2015, EDF Invest and two other long-term investors finalised the acquisition of a minority shareholding in Madrileña Red de Gas (MRG). MRG was formed in 2009 after a spinoff of some of the assets of Gas Natural Fenosa, and is a regulated gas distribution network operator exclusively in the Madrid region. The company is accounted for by the equity method in the Group’s consolidated financial statements at 31 December 2015.

Page 13 of 52
3.4.1.5 Ardian and EDF Invest sign a firm agreement for acqusition of a majority stake in Géosel from Total
In December 2015 Ardian and EDF Invest, as equal shareholders in a consortium, completed their acquisition from the Total group of an investment of more than 50% in Géosel, a hydrocarbon storage company based in Manosque, France.
Total has retained a minority stake and will continue to use Géosel’s infrastructures for its own requirements.
With a capacity of almost 9 million m3, Géosel owns a critical site for management of French strategic hydrocarbon reserves. The company owns and operates underground storage cavities and related pipelines linked to the Fos-Marseille seaport terminals and the petrochemical facilities of Etang de Berre (Fos-Lavera), all located in France.
This investment has been allocated to EDF Invest’s infrastructures pocket alongside TIGF, Porterbrook and RTE.
3.4.2 New investments and partnerships concerning Group subsidiaries
3.4.2.1 ERDF: rollout of the “Linky” smart meter
The work done by ERDF throughout 2015 on the Linky smart meter project reached a key Part 1 milestone on 1 December: the start of the rollout phase. Installation of Linky meters began all over France except in the Paris region where union negotiations were not yet complete. By the end of December 2015, more than 24,000 smart meters were in service and more than 3,000 data concentrators had been installed in substations.
3.4.2.2 Dalkia
Finalisation of Dalkia’s acquisition of Cesbron
On 24 March 2015, Dalkia announced the completion of its acquisition of 100% of Cesbron, an industrial and commercial refrigeration and HVAC (heating, ventilation and air conditioning) specialist. Dalkia and Cesbron will develop commercial synergies in order to improve their market shares and respond positively to the challenges posed by the energy transition. The closer relationship between the two companies means that integrated offerings can be developed for customers looking for energy savings.
Dalkia’s acquisition of Zaklady Energetyki Cieplnej Katowice SA
On 2 September 2015 Dalkia announced its acquisition of 100% of Zaklady Energetyki Cieplnej Katowice SA (ZEC), a company that essentially specialises in production and distribution of heat in the Katowice region of Poland, and its subsidiary EC Szopienice.
The company’s development plan, which focuses on mine gas recovery and expanding heating networks, is set to decarbonise the region’s energy mix while making the best use of local resources and drawing on more efficient processes.
The acquisition of ZEC is Dalkia’s first international external growth operation since it became part of the EDF group. This ambitious project will make full use of Dalkia’s expertise in heat networks and energy services for industrial customers.
3.4.2.3 EDF Luminus
Finalisation of the agreement between EDF Luminus and ATS
On 27 May 2015, EDF Luminus’ acquisition of a majority stake in ATS SA was finalised after clearance by the Belgian competition authority. As well as electric equipment, ATS sells fully-integrated solutions for electricity and heating: design and engineering, installation and maintenance of industrial electric networks, automation projects, industrial refrigeration, fire detection and hydraulics. EDF Luminus and ATS will be able to better assist their industrial customers and the service and public sectors through an enhanced range of solutions for energy efficiency and optimisation of consumption.

Page 14 of 52
New agreement on the EDF Luminus shareholder pact
On 26 October 2015 Publilec, Socofe, Ethias and Nethys, shareholders of EDF Luminus, and the EDF group signed an amendment to the shareholder pact, reaffirming their intent to support the company’s development. This move put an end to the IPO process initiated the previous May.
The amendment signed extends the shareholder pact to 2025, providing for the following reorganisation in the ownership structure (the control exercised by the Group is unaffected):
four Belgian shareholders will remain: Publilec (26.4%), Socofe (4.7%), Ethias (0.2%) and Nethys (0.1%). Under the shareholder pact, they will benefit from a liquidity mechanism allowing them to exit the capital of EDF Luminus from the end of 2018, subject to certain conditions;
the EDF Group’s stake will rise from 63.5% to 68.6%, as a result of the Group’s acquisition of the shares in EDF Luminus held by Publilum and VEH for €58 million.
3.4.2.4 EDF Énergies Nouvelles
Investments and disposals by EDF Énergies Nouvelles
Following the third call for tenders from Hydro-Québec Distribution in 2013, EDF Énergies Nouvelles announced on 17 February 2015 that it had won the contract for the Nicolas-Riou wind farm project (224.4MW) in Quebec, through its local subsidiary EDF EN Canada. Construction should start in the spring of 2016 and the plant is expected to be commissioned at the end of 2017. This project is owned 50% by EDF EN Canada and 33% by Énergie Éolienne Bas-St-Laurent. The remaining 17% belongs to La Régie Inter-Municipale de l’Énergie Gaspésie-Îles-de-la-Madeleine. The companies have jointly signed a 25-year electricity supply contract with Hydro-Québec Distribution.
On 25 February 2015, EDF Énergies Nouvelles announced the creation of a local subsidiary, EDF EN do Brasil based in Rio, marking its move into the Brazilian market. EDF EN do Brasil started its local activities by acquiring a majority stake in an 800MW portfolio of wind farm projects from SOWITEC, a leading international renewable energy developer. This portfolio will be jointly developed by EDF EN do Brasil and SOWITEC, which continues to be involved in the projects in development through a minority 20% stake. Located in one of the windiest areas in the state of Bahia, the portfolio includes an initial 70MW project due to be commissioned by the end of 2017. The electricity produced will be sold under a 20-year Power Purchase Agreement (PPA) that has been signed with ANEEL. On 26 November 2015, following an auction organised by the Brazilian government, EDF Énergies Nouvelles announced through its subsidiary EDF EN do Brasil that it had been awarded a long-term PPA for 117 MW of wind power capacity.
On 14 April 2015, EDF Énergies Nouvelles announced its arrival on the Chilean market. Its new local subsidiary, EDF EN Chile, signed a financing contract and a partnership agreement for a 146MWp solar photovoltaic generation plant named Laberinto. Located in the Atacama Desert in northern Chile, this project is owned in equal shares by EDF Énergies Nouvelles and Marubeni. EDF Énergies Nouvelles has obtained long-term project funding from a consortium of local and international banks. A local dedicated subsidiary of EDF Énergies Nouvelles will handle construction, operating and maintenance of the solar plant.
On 23 June 2015 EDF Énergies Nouvelles announced the acquisition of the Salt Fork wind farm project in Texas via its North American subsidiary EDF Renewable Energy. With a maximum capacity of 200MW, this wind farm, initially developed by Cielo Wind Power, is due to be commissioned in late 2016. The electricity generated by the first 150MW from Salt Fork will be sold to Garland Power & Light under a long-term power purchase agreement.
On 12 November 2015 EDF Énergies Nouvelles announced the acquisition of the Dorenell wind farm project in Scotland by its UK subsidiary, EDF Energy Renewables, which will build the facility. This large-scale project of at least 177MW capacity will ultimately be the largest onshore wind farm built by the Group in the United Kingdom.
On 26 November 2015 EDF Énergies Nouvelles announced its acquisition of two wind farms with total capacity of 44MW, located in the départements of Meuse (Trois-Sources) and Doubs (Lomont). They have been in operation since 2007 and 2008. With this acquisition, after the commissioning of several wind farms throughout France, the Group reached the 1GW milestone for installed onshore wind power capacity in France.
EDF Énergies Nouvelles also sold several power plants during 2015 for a net total capacity of 623 MW. Most of the facilities sold were wind farms. The principal disposal took place in Canada and concerned 42.5% of the Rivière-du-Moulin plant (148.8MW).

Page 15 of 52
Development of EDF Énergies Nouvelles’ operating and maintenance activities
On 5 March 2015, EDF Énergies Nouvelles announced the deployment through its dedicated subsidiary EDF EN Services of its operating and maintenance (O&M) service activities for renewable energy installations in Belgium, with the creation of EDF EN Services Belgium. The new subsidiary is jointly held with EDF Luminus, one of the EDF group’s companies in Belgium, and offers wind farm and solar plant management services in Belgium for EDF Luminus and non-group owner-operators.
Long-term power purchase agreement between EDF Énergies Nouvelles and Google
On 3 December 2015 EDF Énergies Nouvelles announced the signature of a long-term Power Purchase Agreement (PPA) between Google and its north American subsidiary EDF Renewable Energy. The electricity will be generated by the future 201MW Great Western wind farm in Oklahoma. The Great Western project is the second wind farm operation concerned by an agreement between EDF Renewable Energy and Google.
Agreement between EDF Énergies Nouvelles and Procter & Gamble for construction of wind farms in Texas
On 20 October 2015, EDF Énergies Nouvelles, through its subsidiary EDF Renewable Energy, entered into a partnership with Procter & Gamble (P&G) to supply wind-generated electricity to all P&G’s North American sites manufacturing laundry and household cleaning products. The electricity sold to P&G, under a long-term Power Purchase Agreement, will be generated by a wind farm in Cooke County, Texas, due to start operation in late 2016.
3.4.2.5 EDF Energy: acquisition of a wind farm in the United Kingdom
On 2 April 2015 EDF Energy Renewables (owned 50% by EDF Energy and 50% by EDF Énergies Nouvelles) announced the takeover of the plan to construct a wind farm at Corriemoillie in Scotland, which will ultimately have 19 turbines and total installed capacity of 45MW.
3.4.2.6 Edison: arbitration concerning the long-term Libyan gas supply contract
On 27 November 2015, the International Chamber of Commerce Court of Arbitration notified Edison and ENI of its decision regarding arbitration concerning the long-term Libyan gas contract price. This decision led to a positive impact of €855 million on the Group’s operating profit before depreciation and amortisation for 2015.
3.4.2.7 Finalisation of the sales of Budapesti Erömu ZRt. (BE Zrt) and Energie Steiermark Holding AG (Estag)
Sale of BE Zrt
On 10 December 2015, the EDF group finalised the sale of its majority 95.6% stake in the Hungarian company Budapesti Erőmű ZRt (BE ZRt) to EP Energy.
Sale of Estag
On 21 December 2015, the EDF group completed the sale of its minority 25% stake in Energie Steiermark Holding AG (Estag) following the signature on 10 July 2015 of an agreement for this operation with Macquarie Infrastructure and Real Assets.
The impact of these two sales on the Group’s consolidated financial statements is not very significant.

Page 16 of 52
3.5 INVESTMENT PROJECTS
3.5.1 France
3.5.1.1 Flamanville EPR
On 7 April 2015, AREVA and EDF announced that they had informed the French Nuclear Safety Authority (ASN) that a new series of tests would be launched to qualify the Flamanville EPR reactor vessel head and bottom. This series of tests follows chemical and mechanical tests performed on a representative component of the reactor vessel head and bottom, which showed that one of the criteria was not fulfilled. The industrial processes used on the Flamanville 3 reactor vessel are compliant with the mechanical requirements implemented and validated for the French nuclear reactor programme. The robustness of these processes has been demonstrated through the 1,700 nuclear reactor years of safe operation. However, since the 2005 order on nuclear pressure equipment (ESPN Order), the ASN has required equipment to comply with new mechanical specifications to be implemented at Flamanville 3. The EDF and AREVA teams are working to complete the additional tests as soon as possible, following ASN approval of the test conditions, and will provide the ASN with all the information required to demonstrate the safety and quality of the equipment concerned.
On 12 December 2015, the ASN issued a position statement concerning the approach used to demonstrate the mechanical properties of the Flamanville 3 EPR reactor pressure vessel (RPV) closure head and bottom head proposed by AREVA. Subject to its observations and requests being taken into consideration, the ASN considers the approach proposed by AREVA acceptable in principle, and has no objection to the initiation of a new test programme.
In a letter of 12 June 2015, the President of the ASN acknowledged receipt of the application for commissioning of Flamanville 3 remitted by EDF on 19 March 2015, and requested additional information.
On 3 September 2015, EDF presented a new organisational structure for the Flamanville EPR project, with a view to improving industrial construction site management until commissioning has been completed. The new structure involves:
a complete review of the project organisation and working methods, centred around streamlined management reporting directly to Xavier Ursat, Group Senior Executive VP in charge of New Nuclear Projects and Engineering, and Jean-Bernard Lévy, EDF’s Chairman and CEO;
introduction of new bodies with involvement of both EDF and its partners, to provide close leadership, coordination and monitoring of the project;
greater on-site accountability and stronger managerial presence as the construction phase comes to a close and test preparation gets underway;
new contractual frameworks with key suppliers;
enhanced dialogue with the ASN, particularly in respect of the new regulations on nuclear pressure equipment.
Significant progress have been made on the construction site recently. 98% of the civil engineering structure has been completed, as has 60% of the electromechanical assembly. Pre-stressing operations on the reactor building inner containment have been carried out, and the control room has been commissioned.
The new roadmap, to which EDF and its partners are committed, aims to optimise management of the project. The new timetable sets outs three key milestones:
primary circuit mechanical erection to be finalised in the first quarter of 2016;
electromechanical erection to be completed and system performance testing to begin in the first quarter of 2017;
first fuel loading and start-up of the reactor in the fourth quarter of 2018.
In response to this new start-up date, on 9 October 2015 EDF submitted a request to the Ministry for Ecology, Sustainable Development and Energy to change the final deadline for commissioning of the new reactor, which was initially set at April 2017 in the authorisation decree.
Following assessment of all the industrial and financial parameters, project costs have been revised to €10.5 billion.

Page 17 of 52
3.5.1.2 Commissioning of new facilities by the subsidiary EDF Production Électrique Insulaire (EDF PEI)
In keeping with its objectives to implement guaranteed-power electricity generation facilities for Corsica and French overseas territories, the subsidiary EDF PEI (standing for Production Électrique Insulaire or Island Electricity Generation) commissioned the final five Diesel generators of the Pointe-Jarry plant in Guadeloupe during the first half of 2015. By the end of the year, all four of EDF PEI’s power plants were in operation, with a total generation capacity of close to 750MW.
3.5.1.3 Programme of investment in existing nuclear facilities in France
On 22 January 2015, EDF’s Board of Directors approved the principle of the major industrial overhaul programme (Grand carénage) to refurbish the French nuclear fleet, enhance reactor safety, and extend operating lives when the circumstances are suitable. The Board of Directors also expressed its wish that the investment programme should be conducted, monitored and controlled to the most exacting standards.
The cost of this investment programme is estimated at a maximum of €201355 billion by 2025 for the 58 reactors currently operating. This estimated figure will be progressively confirmed after the optimisation of solutions for rolling out the programme, additional review work, and consideration of the multi-year energy plans (Programmations Pluriannuelles de l’Énergie or PPE, and the strategic plan) as set out in the energy transition law for green growth.
This industrial programme will be implemented gradually, in compliance with that law, the multi-year energy plans, the opinions and orders of the French Nuclear Security Authority (ASN), and the authorisation procedures required for reactors to run for more than 40 years.
3.5.2 Other activities
3.5.2.1 Principal wind farms and photovoltaic power plants commissioned
EDF Énergies Nouvelles commissioned a number of wind farms in North America during 2015. With the new Longhorn (200MW) and Spinning Spur 3 (194MW) facilities in Texas, the Roosevelt (250MW) wind farm in New Mexico, the Pilot Hill (175MW) plant in Illinois and Slate Creek (150MW) in Kansas, the Group now has more than 3GW of gross installed capacity for renewable energy. In Canada, with the second tranche of the Rivière-du-Moulin (200MW) and Mont-Rothery (74MW) wind farms, EDF Énergies Nouvelles has reached a total of 1.4GW in renewable energy.
EDF Énergies Nouvelles also continued its development in Europe, notably Turkey where the third section of the Soma wind farm (100MW) was commissioned, and Poland where 58MW of capacity was installed at the Rzepin wind farm.
Since starting up in South Africa early in the year, the Group has constructed three wind farms (Grassridge, Chaba and Waainek) with total installed capacity of more than 100MW.
In solar power, the Group commissioned two solar power plants totalling 150MWp of installed capacity in the Indian states of Rajasthan and Odisha.
3.5.2.2 Green bonds: issuance and allocation
In October 2015, EDF successfully placed the largest ever US dollar green bond issue by an industrial company. With a maturity of 10 years, a total amount of $1.25 billion and an annual fixed coupon of 3.625%, this new green bond will support further investment by the Group in renewable energies. By 31 December 2015, $500 million had been allocated to construction of three wind farms.
The Group successfully issued its first green bond in Euros in November 2013, raising €1.4 billion to finance EDF Énergies Nouvelles’ renewable energy projects. The total €1.4 billion had been allocated by 30 June 2015.
The funds raised by these two issues have financed a total of fifteen renewable energy projects (wind power, photovoltaic solar power, and biomethane plants), located in France and North America and developed by EDF Énergies Nouvelles. These projects represent total capacity of nearly 2.1GW.

Page 18 of 52
3.6 REGULATORY ENVIRONMENT
3.6.1 France
3.6.1.1 Energy transition law for green growth
After a final reading, on 22 July 2015 the French National Assembly adopted the energy transition law for green growth, marking the end of a long legislative process. The resulting law n° 2015-992 of 17 August 2015 on the energy transition for green growth was promulgated in the Journal Officiel of 18 August 2015 after a decision by the Constitutional Council of 13 August 2015.
3.6.1.2 The NOME law and the ARENH system
Supplies of electricity to EDF’s competitors under the ARENH scheme for regulated access to nuclear power supplies concerned a volume of 12.3TWh for the first half of 2015. This volume decreased substantially in the second half of 2015 to 3.8TWh, principally because of the sharp decline in prices on the wholesale market, which is becoming a more attractive source of energy supplies, and also due to termination of framework contracts with several suppliers. No ARENH applications were made at the end of 2015 for supplies in the first half of 2016.
The ARENH price has been set at €42/MWh since 1 January 2012, and is intended to reflect the economic conditions of generation by the existing nuclear fleet. The draft decree stipulating the valuation method for costs making up the ARENH price was examined by France’s Higher Energy Board (CSE) on 19 June 2014, and has also been examined by France’s Competition Authority and the French Energy Regulator CRE. It is still under examination by the European Commission, which must approve the price formula. The French government has deferred the application date of the new decree until the conclusions of discussions with the European Commission are available.
3.6.1.3 CSPE
The Contribution to the Public Electricity Service (Contribution au Service Public de l’Électricité or CSPE) exists to compensate for certain public service charges assigned to EDF in particular1. The CSPE is collected directly from the end-user.
The CSPE system was reformed by the amended finance law for 2015, published in the Journal Officiel on 30 December 2015. The charges for the public energy service (electricity and gas) will be incorporated into the French national budget in 2016. The finance law introduces a special “Energy Transition” budget item of €4.4 billion, which will be funded in 2016 by the TICFE tax on consumption of electricity (Taxe intérieure sur la consommation finale d'électricité), less €2 billion, plus 2.16% of the TICGN tax on gas consumption (Taxe Intérieure de Consommation sur le Gaz Naturel). This budget will cover expenses borne by obligated suppliers, such as the additional cost associated with contracts obliging them to purchase renewable energies and biogas, the difference between forecast and actual expenses, the annual contribution to repayment of the accumulated shortfall due to EDF, for which the schedule will be set by an official decision, and reimbursement of CSPE advances for industrial operators who were exempt prior to 2016. Solidarity charges, purchase obligations excluding renewable energies, and the cost of applying the standard national tariffs to areas not connected to France’s mainland network are covered by the national budget through the €2 billion “Public Energy Service” budget item.
The law also introduces changes to energy taxes, increasing the TICGN and coal tax in 2016 and 2017 and replacing the TICFE by the new CSPE. CSPE rates are set at €22.5/MWh for 2016, €2/MWh, €5/MWh or €7.5/MWh for electro-intensive users based on a criterion of kWh/€ of value added, and €0.5/MWh for hyper-electro-intensive users.
The draft “CSPE” decree was presented to France’s Higher Energy Board (Conseil supérieur de l’énergie, or “CSE”) on 21 December 2015. Under this proposed decree, the public financial organisation Caisse des Dépôts et Consignations (“CDC”) would be required to make the payments to obligated suppliers, one of which is EDF, and keep the “Public Energy Service” and “Energy Transition” accounts. The CRE would be required to determine the amount of the charges for the public energy service (actual and forecast). The procedures for compensating obligated suppliers for these charges are also laid down in the proposed decree.
The estimated amount of expenses to be covered by compensation for EDF for 2015 is €6.3 billion, 7% more
1. Local distribution companies and Électricité de Mayotte also make small contributions to the system.

Page 19 of 52
than in 2014. The main explanation for this rise is the lower level of market prices, which increases the surplus costs of energy covered by purchase obligations to be compensated by the CSPE, and a rise in the volume output by photovoltaic and wind power facilities. The amounts received during 2015 total €6.1 billion, 17.6% more than in 2014. This rise principally results from the CSPE increase applicable since 1 January 2015 (an increase of €3/MWh compared to 2014, taking the CSPE to €19.5/MWh for the year 2015).
The agreement signed in early 2013 by EDF and the French authorities, providing for progressive reimbursement to EDF by 31 December 2018 of the receivable consisting of the CSPE shortfall at 31 December 2012 and the costs of bearing this shortfall for the Group, was updated in late 2015 by a ministerial letter received on 26 January 2016. The State has acknowledged the further shortfalls that arose between 2013 and 2015 and the associated interest, estimated at a total €644 million, and authorises EDF to allocate this receivable to dedicated assets in 2016.
The amount of the receivable due to EDF is thus €5.9 billion at 31 December 2015 (see note 36.3 of the consolidated financial statements at 31 December 2015). The repayment schedule has been adjusted such that this receivable will be fully reimbursed by 2020. It will be set out in a ministerial order.
3.6.1.4 “TURPE 4” Network Access tariffs
On 28 May 2015 the French Energy Regulator (Commission de Régulation de l’Énergie – CRE) published its resolution on changes from 1 August 2015 in the TURPE distribution tariffs, which were raised by 0.4%. This rise reflects the stabilisation of the clearance coefficient for the income and expenses adjustment account (CRCP)1, and a 0.4% increase in inflation.
TURPE transmission tariffs were also increased by 2.4% from 1 August 2015, again corresponding to 2% for the clearance of the CRCP, and 0.4% for inflation.
On 7 May 2014, the CRE had also decided to apply an exceptional 50% reduction to the electricity transmission bills of industrial sites that are large electricity consumers. This measure was initially applicable from 1 August 2014 to 31 July 2015. In its decision of 11 June 2015 setting the changes in TURPE transmission tariffs, the CRE extended this 50% reduction for electro-intensive users to 31 December 2015. It is now laid down in article L.341-4-2 of the energy code introduced by article 157 of the energy transition law, and can be increased up to 90%. The loss of income for RTE will be compensated through future tariff changes thanks to the CRCP mechanism.
The CRE also began during 2015 to examine the future structure of tariffs for using the public electricity networks (the “TURPE 5” tariffs). On 22 July 2015 it presented its preliminary analyses on the TURPE 5 tariff structure for a consultation process. The responses, submitted by 25 September 2015, specifically concerned the tariff structure, i.e. the way network costs are allocated between different user types through tariff components, chiefly extraction, injection, metering and management. A further consultation will take place concerning the tariff scale itself.
3.6.1.5 Regulated electricity sales tariffs in France
On 15 July 2015 the CRE published its 2015 report on France’s regulated sales tariffs for electricity, in which it reported a tariff shortfall of €922 million for 2014 in addition to previous shortfalls that had not been compensated.
A decision of 30 July 2015 set the regulated sales tariffs that took effect from 1 August 2015. The average increases were 2.5% for the “blue” residential customers’ tariffs, 0.9% for the “yellow” tariffs and 4% for the “green” tariffs, while the “blue” tariffs for non-residential customers remained unchanged.
31 December 2015 saw the end of the “yellow” and “green” regulated tariffs. By 1 January 2016 around three quarters of the sites concerned had signed a market-rate contract with their chosen supplier. The remaining quarter who had not yet signed up with a supplier continued to receive electricity from their former supplier, under a transitional contract valid for a maximum period of six months.
3.6.1.6 Ministerial order concerning the cost of the Cigéo storage project
On 15 January 2016 the Ministry of Ecology, Sustainable Development and Energy issued an order setting the cost associated with implementation of long-term management solutions for long-lived medium and high-level radioactive waste under the Cigéo storage project at €25 billion under 2011 economic conditions. This cost valuation is required by article L542-12 of France’s Energy Code.
1. A mechanism to measure and offset differences between the actual figures and the forecasts on which tariffs are based.

Page 20 of 52
The cost stated in the order constitutes an objective to be met by the French Agency for Radioactive Waste Management (ANDRA), in compliance with safety standards set by the Nuclear Safety Authority (ASN), in close cooperation with operators of nuclear installations. In application of this order, the cost of the Cigéo project will be regularly updated, at least at each key milestone of the project’s development (authorisation to create the facility, commissioning, end of the “pilot industrial phase”, safety reviews) in accordance with the opinion of the ASN.
The cost of the Cigéo project set by the ministerial order is €25 billion under the economic conditions of 2011. This figure replaces the estimated benchmark cost of €20.8 billion used by the EDF Group for its consolidated financial statements at 31 December 2014 and 30 June 2015.
At 31 December 2015, the new cost figure has resulted in an increase of around €820 million in the provisions for long-term radioactive waste management established to cover future expenses relating to the Cigéo deep storage project.
This increase in provisions has a negative impact of €509 million, net of taxes, on EDF net income for 2015.
3.6.1.7 AGIRC–ARRCO agreement of 30 October 2015
On 30 October 2015 the social partners reached an agreement intended to balance the accounts of the AGIRC-ARRCO public pension body.
This agreement contains several sets of measures, some of which apply from 1 January 2016: smaller adjustments to pensions from 2016 to 2018, moving the pension value adjustment date from 1 April to 1 November, a lower return on plan assets, extending the basis for AGFF’s contribution to tranche C of the AGIRC scheme, and other measures aiming to improve management of pension and related systems.
The special pension system for France’s electricity and gas sector has been affiliated to the AGIRC-ARRCO standard national system since 2005. Since the new agreement does not change IEG beneficiaries’ pension rights, the increase in obligations resulting from this affiliation, amounting to €1 billion, is recorded in actuarial adjustments.
3.6.2 United Kingdom
On 19 March 2014, the British government confirmed that it was setting up a capacity market. EDF Energy took part in the second capacity auction in December 2015 for agreements starting from October 2019, with 94.6% of its capacity or 8.8GW qualified.
In 2011, to meet its objectives in the fight against climate change, the British government introduced a Carbon Price Support mechanism intended to guarantee a minimum price for carbon, consisting of a tax added to the price of CO2 emission rights. The aim of this mechanism is to bring the overall carbon price (emission right and tax) to £30/t in 2020, a target set when the price of CO2 stood at around £15/t. In March 2014, in view of the significant decline in CO2 prices on the markets, the British government decided to cap the carbon tax at £18/t from April 2016 until 2020.
During the week of 6 July 2015, the British Competition and Markets Authority (CMA) published its provisional findings and proposals for possible solutions as identified during its preliminary investigation into the “supply and acquisition of energy in Great Britain”.
These provisional findings confirmed the lack of any significant effect concerning generation, sharing generation and supply resources (vertical integration) and the efficiency of wholesale electricity and gas markets. However, the CMA provisionally reached the conclusion that the “weak customer response” both by residential and very small business customers gives suppliers a competitive advantage over inactive customers, and that they exploit that advantage through their pricing policies.
The CMA therefore proposed 18 solutions, many of them stated only in general terms at this stage, which will be the basis for consultation with stakeholders. The majority of these potential solutions focus on selling and the regulatory framework as expected, particularly measures that can improve customer involvement. Later in the year, the CMA will publish a provisional decision document covering all the solutions it will recommend applying. This will be followed by a further consultation period.
In late September 2015, the regulatory deadline for publication of the CMA’s final report, initially set at 25 December 2015, was put back to 25 June 2016. This extension will enable the CMA to take the view of consumer associations and industrial operators into account.

Page 21 of 52
3.6.3 Belgium
Nuclear power plants
The Law of 18 December 2013 amending the Law of 2003 on the timetable for withdrawal from nuclear energy laid down the principles of a three-party agreement between Electrabel, EDF and the Belgian government defining the terms for extension of operation by Tihange 1 (in which EDF Belgium directly owns a 50% stake) to 2025, particularly the fees due by the owners to the State. The agreement was signed on 12 March 2014 and sets out the operating, financial and legal conditions of this extension.
In June 2015 the Belgian federal parliament approved the law (known as the first bill) to extend the operating lifetimes of the oldest nuclear reactors in Belgium. On 30 November 2015, the Prime Minister’s office announced that an agreement had been reached between Electrabel and the federal government to extend operations at Doel 1 and Doel 2, which are wholly-owned by Electrabel, until 2025. Associations opposing this extension filed an action to cancel this law before the Constitutional Court. The Council of State, in its opinion on this bill, expressed doubts as to its compatibility with European law.
In parallel to the decision to extend operations by Doel 1 and Doel 2, an agreement was reached concerning the nuclear annuity, which affects EDF Luminus for the Tihange 2, Doel 3 and Doel 4 plants. The agreement sets a transitional period for 2015 and 2016, when the nuclear tax is a standard amount (€200 million in 2015 and €130 million in 2016) followed for the years 2017 to 2026 by a variable nuclear operator’s contribution, consisting of 38% (before a sliding scale) of the margin generated by nuclear activities, with a guaranteed minimum for the State which is set at €150 million for the three-year period 2017 to 2019.
Thermal power plants
The Belgian government organised a strategic reserve through a call for tenders from thermal power plants that had announced their temporary or permanent shutdown, in order to secure the country’s energy supply during the winter periods. In 2014 the Seraing CCGT plant, fully-owned by EDF Luminus, was selected for a 3-year period starting in winter 2014, ending preparations for the plant’s temporary shutdown announced in March 2013. The open cycle plants Izegem and Angleur 3, also fully-owned by EDF Luminus, were selected in the 2015 call for tenders for a 1-year period from winter 2015. Since 1 Novbember 2015, the three selected power plants can be activated by the Belgian network operator Elia at any moment in the event of a risk of energy shortages during the winter.
Offshore wind farms
The Belgian government has reached an agreement on a new system of subsidies for offshore wind farms. Firms will receive fewer subsidies. The aim of reducing subsidies for offshore wind farms is to avoid further rises in the cost of electricity for consumers.
3.7 OTHER SIGNIFICANT EVENT
Nuclear plants in Belgium
After 10 months of outage for the Doel 3 and Tihange 2 nuclear power plants (in which EDF Luminus holds 10.2% drawing rights) for inspections of the reactor vessels, which had been found to have microcracks during the summer of 2012, the Federal Nuclear Control Agency (AFCN) gave its authorisation on 17 May 2013 for both plants to resume operation. The operator Electrabel had agreed on a battery of additional tests with the AFCN to evaluate the long-term behaviour of the reactor vessels. Since one of the tests conducted did not give the results experts had expected, Electrabel took the initiative on 25 March 2014 to shut both plants down temporarily as a precautionary measure until further test results were available. On 13 May 2015 Electrabel issued a statement that the shutdown of Doel 3 and Tihange 2 would be extended to 1 November 2015, to give the AFCN further time to finalise the additional analyses.
On 17 November 2015, the AFCN announced its authorisation for resumption of operation by Doel 3 and Tihange 2 until 2022 and 2023, the date set for their final shutdown. Further tests are to be conducted during the next reactor outage in September 2016 and February 2017. Both plants were in operation in January 2016.
3.8 GOVERNANCE – BOARD OF DIRECTORS
Martin Vial, Commissioner of State Holdings, succeeded Régis Turrini as Representative of the French State on EDF’s Board of Directors from 9 September 2015.
Page 22 of 52
4 SUBSEQUENT EVENTS
Board of directors’ decision of 27 January 2016: further progress on the strategic partnership agreement between EDF and AREVA
At its meeting on 27 January 2016, EDF’s Board of Directors was informed that following due diligence work conducted during the second half of 2015, discussions with AREVA regarding EDF’s takeover of the activities of AREVA NP (the company in charge of services, and reactor equipment and fuel manufacturing) had been finalised.
The Board approved the final valuation of the activities to be acquired by EDF, amounting to €2.5 billion for 100% of the capital of AREVA NP, without transfer of its financial debt. This amount may be revised upwards or downwards depending on the financial statements drawn up at the transaction’s completion date, with a possible earn-out payment of up to €350 million based on achievement of certain performance objectives measured after the completion date.
EDF will be in a position to make a binding offer for its intended investment of between 51% and 75% on this basis, after consultation with the Central Works Council and authorisation by the Board of Directors, once the arrangements to completely immunise EDF against the costs and risks of the Olkiluoto 3 (OL3) project and all the final contractual documents are finalised.
This decision follows the memorandum of understanding signed on 30 July 2015, which formally recorded progress on discussions concerning the proposed partnership between EDF and AREVA. This memorandum comprises 3 sections:
a general strategic and industrial agreement, principally in order to improve and develop the efficiency of cooperation in areas such as research and development, international sales of new reactors, spent fuel storage and dismantling;
acquisition by EDF of exclusive control over AREVA NP. It provides for majority control (at least 51%) of AREVA NP by EDF, a maximum 25% investment by AREVA as part of a strategic partnership, and potential investments by other minority partners. This plan will enhance security for the most critical activities involved in the “Grand carénage” industrial programme for the existing fleet in France, and improve the efficiency of engineering services, project management, and some manufacturing activities based on EDF's experience;
formation of a dedicated company, 80% owned by EDF and 20% owned by AREVA NP, to optimise design and project management for new reactors. The purpose of this company will be to improve the preparation and management of projects, and enhance the French industry’s export offering through better coordination of strategic marketing to prepare offerings in the upstream project phase, development of more competitive products that are better-suited to customers’ needs, and harmonisation and expansion of the range of reactors, all the while continuing partnerships with the major industrial companies in Japan and China. This new company will be part of an integrated generator/supplier model, which has been tried and tested in several countries.

Page 23 of 52
5 ANALYSIS OF THE BUSINESS AND THE CONSOLIDATED INCOME STATEMENTS
FOR 2014 AND 2015
Presentation and analysis of the consolidated income statements for 2014 and 2015 is shown on two levels for sales and EBITDA: a first focusing on the Group, then a second examining the different business segments (France, United Kingdom, Italy, Other international and Other activities). EBIT (operating profit) and net income are analysed from a more general standpoint.
(in millions of Euros) 2015 2014 (1)
Sales 75,006 73,383
Fuel and energy purchases (38,775) (37,213)
Other external purchases (9,526) (9,181)
Personnel expenses (12,529) (11,785)
Taxes other than income taxes (3,641) (3,593)
Other operating income and expenses 7,066 5,668
Operating profit before depreciation and amortisation (EBITDA) 17,601 17,279
Net changes in fair value on Energy and Commodity derivatives, excluding trading activities
175 203
Net depreciation and amortisation (9,009) (7,940)
Net increases in provisions for renewal of property, plant and equipment operated under concessions
(102) (157)
(Impairment)/Reversals (3,500) (1,189)
Other income and expenses (885) (212)
Operating profit (EBIT) 4,280 7,984
Cost of gross financial indebtedness (1,994) (2,243)
Discount effect (2,812) (2,996)
Other financial income and expenses 2,218 2,688
Financial result (2,588) (2,551)
Income before taxes of consolidated companies 1,692 5,433
Income taxes (483) (1,839)
Share in net income of associates and joint ventures 192 179
GROUP NET INCOME 1,401 3,773
EDF net income 1,187 3,701
Net income attributable to non-controlling interests 214 72
Earnings per share (EDF share) in Euros:
Earnings per share 0.32 1.78
Diluted earnings per share 0.32 1.78
(1) EDF Energy’s transactions on the wholesale electricity markets (excluding trading activities), which showed a net short position at 31 December 2014, have been reclassified from energy purchases to sales in the amount of €509 million.

Page 24 of 52
5.1 SALES
Consolidated sales were up by 2.2% while showing an organic decline of 1.8%.
5.1.1 Change in Group sales
(in millions of Euros)
2015 2014 (1) Variation
Variation (%)
Organic growth (%)
Sales 75,006 73,383 1,623 +2.2 -1.8
(1) EDF Energy’s transactions on the wholesale electricity markets (excluding trading activities), which showed a net short position at
31 December 2014, have been reclassified from energy purchases to sales in the amount of €509 million.
Sales amounted to €75,006 million in 2015, an increase of €1,623 million (+2.2%) from 2014. Excluding the effects of exchange rates (+€1,216 million), principally the pound sterling’s rise against the Euro, and changes in the scope of consolidation (+€1,727 million) essentially relating to the takeover of Dalkia in France on 25 July 2014, sales showed an organic decline of 1.8%. After eliminating the €921 million impact of 2012-2013 regulated sales tariffs which were recognised in 2014, the organic decline in Group sales was 0.6%.
5.1.2 Change in sales by segment
(in millions of Euros) 2015 2014 Variation
Variation
(%) Organic growth
(%)
France 39,619 39,910 (291) -0.7 -0.3
United Kingdom (1) 11,618 10,669 949 +8.9 -1.7
Italy 11,677 12,687 (1,010) -8.0 -8.1
Other International 5,634 5,603 31 +0.6 -0.3
Other activities 6,458 4,514 1,944 +43.1 +0.4
Total excluding France 35,387 33,473 1,914 +5.7 -3.6
GROUP SALES 75,006 73,383 1,623 +2.2 -1.8
(1) EDF Energy’s transactions on the wholesale electricity markets (excluding trading activities), which showed a net short position at 31 December 2014, have been reclassified from energy purchases to sales in the amount of €509 million.
Sales outside the France segment represented 47.2% of total consolidated sales in 2015, compared to 45.6% in 2014.
5.1.2.1 France
Change in sales in the France segment
France’s contribution to Group sales amounted to €39,619 million, corresponding to an organic decline of €115 million (-0.3%) compared to 2014. Excluding the €908 million impact of 2012-2013 regulated sales tariffs which were recognised in 2014, sales showed organic growth of 2.0% (€793 million). This growth mainly results from favourable weather effects with a €562 million impact, reflected in higher sales volumes (+7.7TWh). Sales revenues benefited from the rise in tariffs (€724 million), but were adversely affected by falling market prices resulting in lower volumes sold under the ARENH system (-55TWh) and an equivalent rise in volumes sold at market prices.
Gas sales to final customers increased by €99 million, largely driven by the weather (+0.6TWh).
At 31 December 2015, EDF's volume market share for electricity sales to all final customers was 77.4%, down by 1.4 point from 31 December 2014. EDF’s share of the natural gas market was 5.0%, a year-on-year gain of 0.3 point.

Page 25 of 52
Breakdown of sales for the France segment between generation and supply (deregulated) activities1, network activities2 and island activities3
(in millions of Euros)
2015 2014 Variation
Variation (%)
Organic growth
(%)
Generation and supply (deregulated) activities 37,088 37,678 (590) -1.6 -1.1
Network activities 13,544 13,276 268 +2.0 +2.0
Island activities 1,083 1,071 12 +1.1 +1.1
Eliminations (12,096) (12,115) 19
SALES FOR THE FRANCE SEGMENT 39,619 39,910 (291) -0.7 -0.3
There was a 1.1% organic decline in sales by the deregulated activities. Excluding the €881 million impact of 2012-2013 regulated sales tariffs which were recognised in 2014, sales showed an organic increase of 1.3% (€467 million) driven by colder weather in the early part of the year compared to 2014. It also reflects the higher energy component in regulated tariffs at 1 November 2014 and 1 August 2015.
Sales by the network activities were up by 2.0%, as the transmission volumes rose due to the colder weather at the start of 2015 compared to 2014.
Electricity generation
Nuclear generation produced 416.8TWh in 2015, compared to 415.9TWh for 2014, an increase of +0.9TWh. This surpassed the Group’s 410-415TWh target announced to the market for 2015. This improvement was achieved by controlling the duration of scheduled outages.
Hydropower output stood at 32.1TWh, down by 5.4TWh from 2014 due to less favourable hydrological conditions (see section 2.4 “Weather conditions: temperatures and rainfall”).
Fossil-fired thermal generation produced 6.8TWh, -0.1TWh less than in 2014.
Sales volumes to final customers (a market segment that includes local distribution firms) were up by +1.2TWh, including +7.9TWh resulting from the temperature differential. The impact of lost customers was -7.8TWh, including -5.4TWh concerning customers who paid the regulated “yellow” and “green” tariffs.
The effects of discontinuation of the VPP4 system, which had begun in 2012, caused a 2.7TWh downturn in sales compared to 2014. Electricity supplies under the ARENH system totalled 16.2TWh, 55.1TWh less than in 2014.
EDF was a net seller on the wholesale markets to the extent of 82.7TWh. The 55.8TWh increase in market sales compared to 2014 is explained by a 54.5TWh decline in structured demand (ARENH supplies).
5.1.2.2 United Kingdom
The United Kingdom’s contribution to Group sales amounted to €11,618 million in 2015, an increase of €949 million including a foreign exchange effect of €1,129 million. The organic change was -1.7% compared to 2014.
The primary reason for the lower level of sales is the decrease in electricity sales to final customers, which reflects the falling customer numbers resulting from strong competition, and lower gas tariffs.
1. Generation, Supply and Optimisation in mainland France, and sales of engineering and consulting services. 2. Network activities now only include Distribution, as a result of application of the equity method to the Transmission activity since 31 December 2010. In mainland France, network activities are regulated via the network access tariff TURPE (Tarifs d’Utilisation des Réseaux Publics d’Électricité). Sales for the regulated activities include the delivery cost included in integrated tariffs. 3. EDF’s generation and distribution activities in the island energy systems (IES and PEI). 4. Virtual Power Plant capacity auction system, generating deliveries for periods ranging from a few months to 3 years.
Page 26 of 52
5.1.2.3 Italy
Italy contributed €11,677 million to consolidated sales, down by 8.0% from 2014 (-8.1% in organic terms).
This decrease, which principally concerns Edison, was essentially driven by the market context, which saw a sharp drop in Brent oil prices and falling average sales prices on the electricity and gas markets.
In the electricity business, sales were down by 18%, mainly due to the fall in sale prices, but also due to a decrease in volumes.
In the hydrocarbon business, in contrast, sales increased by 9%: demand recovered after the significantly negative weather effect experienced in 2014 which had a strong impact on volumes sold to residential customers and thermal power plants. This trend, combined with a high increase in sales volumes on the wholesale markets, more than offset the fall in gas and Brent oil prices.
Fenice registered sales of €387 million, an organic decline of -€9 million compared to 2014.
5.1.2.4 Other international
The Other international segment principally covers operations in Europe, excluding the United Kingdom and Italy, and operations in the United States, Brazil and Asia (China, Vietnam and Laos).
This segment contributed €5,634 million to Group sales in 2015, €31 million or +0.6% more than in 2014. Excluding foreign exchange effects (-€3 million) and changes in the scope of consolidation (+€52 million), sales declined by 0.3% in organic terms from 2014.
The downturn essentially comes from:
Asia (-€74 million organic decline), where the decrease in sales is essentially explained by the handover of the Figlec concession in early September 2015;
Brazil (-€9 million organic decline), due to the lower spot market prices;
Hungary (-€23 million organic decline), where sales were affected by the decrease in regulated tariffs for electricity and heat introduced in the second half of 2014, and the lower market prices for electricity associated with declining gas prices.
In Belgium, however, sales registered organic growth of €62 million. The rise in gas volumes sold, driven by a very positive weather effect, and the growth in business for auxiliary services largely offset the fall in wholesale market prices for electricity and gas.
Poland also saw organic growth of €26 million in its sales, thanks to higher electricity prices and heat tariffs.
5.1.2.5 Other activities
Other activities comprise, among other entities, EDF Énergies Nouvelles, EDF Trading, Électricité de Strasbourg and Dalkia.
The contribution by the Other activities segment to Group sales amounted to €6,458 million in 2015, an increase of €1,944 million or 43.1% from 2014, corresponding to organic growth of €19 million (+0.4%). The effect of changes in scope totalled +€1,833 million and mostly reflects the takeover of Dalkia’s activities in France from July 2014.
EDF Énergies Nouvelles’ contribution to Group sales showed an organic increase of €14 million (+1.7%) compared to 2014. In 2015 EDF Énergies Nouvelles continued to develop its operation and maintenance activity.
EDF Trading’s sales also showed an organic decline of €210 million (-24.5%) from 2014, explained by a poorer performance on the North American market after the particularly good levels of business in 2014, and difficult market conditions, particularly in Europe.
Sales by Électricité de Strasbourg totalled €802 million, with organic growth of €33 million (+4.3%) compared to 2014. The rise was mainly attributable to the higher volumes of electricity and gas sold as a result of more favourable weather early in the year in 2015 than 2014.
Sales by the gas activities amounted to €594 million in 2015, compared to €191 million in 2014. These activities were part of the “France” segment in the first half of 2014. The organic growth of €227 million corresponds to an increase in volumes, driven by a favourable weather effect and optimisation of storage activities.
Dalkia contributed €2,878 million to Group sales, reflecting the takeover of Dalkia’s activities in France from

Page 27 of 52
25 July 2014. The organic decline of €70 million1 (-5.3%) is principally explained by a downturn in energy prices and the industrial work activity, which was not offset by the positive impact of commercial development.
5.2 EBITDA
EBITDA rose by 1.9%, with an organic decrease of -0.6%. Excluding the impact of the regulated tariff catch-up for 2012-2013 recognised in 2014, organic growth was 3.9%.
(in millions of Euros) 2015 2014 (1)
Variation
Variation
(%) Organic
growth (%)
Sales 75,006 73,383 1,623 +2.2 -1.8
Fuel and energy purchases (38,775) (37,213) (1,562) +4.2 +1.1
Other external expenses (9,526) (9,181) (345) +3.8 -5.1
Personnel expenses (12,529) (11,785) (744) +6.3 +1.4
Taxes other than income taxes (3,641) (3,593) (48) +1.3 +0.6
Other operating income and expenses 7,066 5,668 1,398 +24.7 +23.9
EBITDA 17,601 17,279 322 +1.9 -0.6
(1) EDF Energy’s transactions on the wholesale electricity markets (excluding trading activities), which showed a net short position at 31 December 2014, have been reclassified from energy purchases to sales in the amount of €509 million
5.2.1 Change in consolidated EBITDA and analysis
Consolidated EBITDA for 2015 amounted to €17,601 million, up by 1.9% from 2014. After adjustment for the positive €155 million scope effect, essentially related to the takeover of Dalkia’s activities in France in July 2014 and favourable foreign exchange effects of €271 million, mainly resulting from the pound sterling’s rise against the Euro, organic growth was -0.6%.
The Group’s fuel and energy purchases amounted to €38,775 million in 2015, up by €1,562 million (+4.2%) from 2014, or an organic increase of €415 million (+1.1%). In France, the organic increase of €1,144 million (+7.6%) is essentially driven by obligations to purchase renewable energies, nuclear fuel costs and ERDF network access costs. Italy registered an organic decline of €793 million (-7.4%), essentially due to the fall in prices and the arbitration ruling on the Libyan gas contract, which offset the effect of higher fuel and energy purchase volumes. The organic decrease observed in the United Kingdom (€173 million or -2.8%) relates to the organic downturn in sales.
Other external expenses amounted to €9,526 million for 2015, €345 million (+3.8%) higher than in 2014 but corresponding to an organic decline of €464 million (-5.1%). In the United Kingdom, the organic decrease of €156 million (-12.9%) reflects EDF Energy’s efforts to control its costs, the lower year-on-year charges on the ECO energy efficiency programme, and costs associated with inspections and repairs of steam generators in 2014, which had no equivalent in 2015. In Italy, the organic decrease of €112 million mainly relates to an operating cost-cutting plan. In France, the €81 million decline (-1.5%) reflects efforts made to reduce costs, particularly in thermal generation and commercial activities.
The Group’s personnel expenses totalled €12,529 million, an increase of €744 million from 2014, or €166 million (+1.4%) in organic growth. In France, personnel expenses totalled €9,209 million, an organic rise of €138 million (+1.5%) compared to 2014, notaby due to growth in the workforce, particularly in the nuclear activities in 2014. Excluding the Linky project, the workforce was 0.5% lower than in 2014, thanks to efforts in the thermal generation, commercial and general functions.
Taxes other than income taxes amounted to €3,641 million for 2015, up by €48 million or +1.3% from 2014 (+0.6% in organic growth).
Other operating income and expenses generated net income of €7,066 million for 2015, up by €1,398 million from 2014 (an organic rise of €1,355 million or +23.9%). In France, other operating income and expenses registered organic growth of €610 million, particularly because of the rise in the CSPE. In Italy the organic rise was €588 million, mainly attributable to the effects in 2015 of arbitration concerning the long-term gas contract with Libya, and a significant reduction in bad debt following action to recover outstanding payments. The Other activities segment saw an organic increase of €278 million, principally as a result of real estate sales.
1. Dalkia’s contribution for the first half-year of 2015 is considered non-organic.

Page 28 of 52
5.2.1.1 Change in consolidated EBITDA and analysis by segment
(in millions of Euros) 2015 2014 Variation
Variation
(%) Organic
growth (%)
France 11,517 12,198 (681) -5.6 -6.0
United Kingdom 2,242 1,941 301 +15.5 +4.9
Italy 1,345 886 459 +51.8 +51.5
Other International 609 632 (23) -3.6 -3.5
Other activities 1,888 1,622 266 +16.4 +6.2
Total excluding France 6,084 5,081 1,003 +19.7 +12.4
GROUP EBITDA 17,601 17,279 322 +1.9 -0.6
5.2.1.2 France
Change in EBITDA for the France segment
France contributed €11,517 million of consolidated EBITDA for 2015, down by 5.6% (organic decline of -6.0%) compared to 2014. After eliminating the effect of the regulated sales tariff catch-up for the period 23 July 2012 to 31 July 2013 following the Council of State’s decision of 11 April 2014, which was recorded in 2014 in the amount of €731 million, EBITDA was stable.
The France segment’s contribution represented 65.4% of EBITDA in 2015 compared to 70.6% in 2014.
Breakdown1 of EBITDA for the France segment between Generation and Supply (deregulated) activities, network activities and island activities
(in millions of Euros) 2015 2014 Variation
Variation
(%) Organic
growth (%)
Generation and Supply (deregulated) activities
6,936 7,929 (993) -12.5 -13.2
Network activities 3,834 3,558 276 +7.8 +7.8
Island activities 747 711 36 +5.1 +5.1
EBITDA FOR THE FRANCE SEGMENT 11,517 12,198 (681) -5.6 -6.0
EBITDA for the generation and supply (deregulated) activities was down by 12.5%. After adjustment for the €731 million impact of the regulated sales tariff catch-up for 2012-2013 recognised in 2014 and the €53 million scope effect related to the transfer of upstream gas portfolio management activities to the “Other activities” segment, EBITDA was down by €317 million or -4.4%.
The good performance by nuclear generation +0.9TWh and more favourable weather conditions (+7.9TWh) had a combined effect of +€41 million. Hydropower output, in contrast, was down by 5.4TWh (-€207 million).
2015 was marked by less favourable market conditions which had a -€437 million impact. With the discontinuation of the “yellow” and “green” regulated sales tariffs, losses of customers (-7.9TWH) had a negative impact of -€149 million. The decline in market prices led to lower volumes sold under the ARENH system and an equivalent increase in sales at market prices. The impact of lower take-up of the ARENH system amounted to approximately -€230 million in 2015.
These effects were counterbalanced by the rise in regulated sales tariffs at 1 November 2014 and 1 August 2015 which contributed +€800 million to EBITDA.
The growth in other external purchases and personnel expenses was controlled (+0.1%). Cost adjustment campaigns have been initiated, particularly in the commercial and thermal generation activities and general functions.
A final factor in the decrease in EBITDA for the deregulated activities was the non-recurring changes in provisions, including for nuclear fuel processing.
EBITDA for the network activities increased by +7.8%. This rise is explained by the less mild weather in the early part of the year in 2015 than 2014 (+€122 million), a lower cost of purchases to compensate for network losses due to falling electricity market prices, and favourable changes in provisions and non-recurring expenses.
1. Further details of this breakdown can be found in section 5.1.2.1.

Page 29 of 52
EBITDA for the island activities was up by €36 million (+5.1%), primarily due to new power plants commissioned by the subsidiary EDF Production Électrique Insulaire (EDF PEI).
5.2.1.3 United Kingdom
The United Kingdom’s contribution to Group EBITDA for 2015 was €2,242 million, up by +15.5% from 2014 corresponding to organic growth of +4.9%. The decline in the Euro against the pound sterling had a favourable impact of €205 million compared to 2014.
Nuclear generation output amounted to 60.6TWh for 2015, a rise of +4.4TWh over 2014. This increase essentially resulted from the end of inspection and repair work on the steam generators at the Heysham 1 and Hartlepool power plants: three of the reactors resumed operation in late 2014, and the fourth in early 2015. Generation by the rest of the nuclear fleet registered a very good operating performance.
EDF Energy also began a cost saving plan across all activities and successfully reduced its charges under the ECO energy efficiency programme in 2015.
5.2.1.4 Italy
The Italy segment contributed €1,345 million to the Group’s consolidated EBITDA, 51.8% more than in 2014 corresponding to organic growth of 51.5%.
This movement essentially concerned Edison, and includes the €855 million positive effects of the international arbitration court’s decision in the dispute between Edison and ENI over revision of the long-term Libyan gas contract prices.
This growth in EBITDA covers contrasting situations across the different activities.
EBITDA for the electricity activities reflects a contraction in margins on thermal power generation, less favourable hydrological conditions than the exceptionally good weather conditions of 2014, and an adverse trend in average sales prices.
In contrast, EBITDA in the hydrocarbon activities registered a rise of €749 million. The positive impact of the arbitration decision was partly counterbalanced by falling Brent oil prices which adversely affected exploration and production activities.
A cost-cutting plan was also implemented from the start of the year, to adapt to the new market situation.
Excluding the effects of revisions of Russian contract prices in 2014 and Libyan contract prices in 2015, the rise in EBITDA for the hydrocarbon activities was €294 million. EBITDA for the overall Italy segment was nonetheless stable despite an unfavourable price environment.
Fenice contributed €85 million to Group EBITDA in 2015, a decrease of 1.2% from 2014 due to unfavourable foreign exchange effects, but an organic increase of 1.2%.
5.2.1.5 Other international
EBITDA for the Other international segment stood at €609 million in 2015, a decrease of 3.6% from 2014 corresponding to an organic decline of -3.5%.
This change was essentially attributable to Asia, with the end of the Figlec concession in early September 2015, and Brazil, where the €26 million organic decline in EBITDA principally related to the maintenance programme of 2015 which had no equivalent in 2014. The impact of falling electricity prices on the spot market was counterbalanced by the decrease in the purchase price for gas.
However, EBITDA for Belgium showed an organic rise of €44 million, thanks to progression in wind power output following the start of operations by new facilities (+37% of installed wind power capacity since 31 December 2014) and the rise in business for auxiliary services. EBITDA was affected by the shutdown since 25 March 2014 of the Doel 3 and Tihange 2 plants, which only received authorisation to restart in December 2015.
There was an organic rise of €37 million in EBITDA in Poland, thanks to better margins due to higher prices and control of operating costs.

Page 30 of 52
5.2.1.6 Other activities
Other activities contributed €1,888 million to Group EBITDA for 2015, an organic rise of 6.2% from 2014.
EDF Énergies Nouvelles’ contribution to consolidated EBITDA totalled €818 million in 2015. The organic year-on-year growth of €69 million (+10.0%) was mainly driven by higher generation output following commissioning of new facilities in 2015, good weather conditions in Europe and active business in Development and Sales of Structured Assets.
EBITDA at EDF Trading amounted to €495 million in 2015, an organic decline of €139 million (-22.0%) from 2014. This decrease is directly associated with a deterioration of the trading margin observed on sales (see section 5.1.2.5) which was partly offset by gains on sales made in 2015.
Dalkia contributed €217 million to Group EBITDA, corresponding to organic growth of €38 million1 compared to 2014, notably achieved through operating efficiency and commercial development plans.
Sales of real estate property in 2015 also contributed to the organic growth in Group EBITDA.
5.3 OPERATING PROFIT (EBIT)
EBIT decreased by 46.4%.
(in millions of Euros) 2015 2014 Variation
Variation
(%)
EBITDA 17,601 17,279 322 +1.9
Net changes in fair value on Energy and Commodity derivatives, excluding trading activities
175 203 (28) -13.8
Net depreciation and amortisation (9,009) (7,940) (1,069) +13.5
Net increases in provisions for renewal of property, plant and equipment operated under concessions
(102) (157) 55 -35.0
(Impairment) / reversals (3,500) (1,189) (2,311) +194.4
Other income and expenses (885) (212) (673) +317.5
OPERATING PROFIT (EBIT) 4,280 7,984 (3,704) -46.4
The Group’s consolidated EBIT amounted to €4,280 million for 2015, down by €3,704 million from 2014. This decrease is primarily explained by higher net depreciation and amortisation, especially in France and the United Kingdom, and an increase in impairment.
5.3.1 Net changes in fair value on Energy and Commodity derivatives, excluding trading activities
The net changes in fair value on Energy and Commodity derivatives, excluding trading activities, decreased from +€203 million in 2014 to +€175 million in 2015. This change was mainly located in Italy, where it concerned economic hedging of the industrial gas portfolio. It principally reflects settlement upon maturity of economic hedging instruments that generated positive results in 2014, plus the change in positive fair value of hedging instruments hedging gas positions beyond 2015.
5.3.2 Net depreciation and amortisation
Net depreciation and amortisation was €1,069 million higher than in 2014.
France registered a €347 million increase in net depreciation and amortisation, essentially explained by investments in the generation fleet (new industrial facilities commissioned and nuclear maintenance) and distribution assets.
In the United Kingdom, the €409 million rise in net depreciation and amortisation (an organic increase of €303 million) essentially reflects the higher investments in maintenance for nuclear plants and coal-fired plants.
In Italy, net depreciation and amortisation was up by €142 million, particularly due to the rise in exploration expenses.
The €95 million increase in EBITDA in the Other activities segment essentially relates to the inclusion of Dalkia in the consolidation since July 2014.
1. Dalkia’s contribution for the first half-year of 2015 is considered non-organic.

Page 31 of 52
5.3.3 Net increases in provisions for renewal of property, plant and equipment
operated under concessions
The €55 million decrease between 2014 and 2015 in the net increases in provisions for renewal of property, plant and equipment operated under concessions is mainly attributable to ERDF.
5.3.4 Impairment/reversals
In 2015, impairment amounted to €3,500 million and principally concerned:
the United Kingdom (€1,096 million). In view of the low additional income generated by the capacity premium mechanism, the narrower spreads on forward and long-term horizons and the lack of an upward market response to the 2015 announcement of reduced operating time for certain assets, impairment of €811 million was booked in respect of the Cottam and West Burton A coal-fired power plants, and to a lesser extent the West Burton B gas-fired plant commissioned in 2013. Finally, lower volatility levels affected the possible benefits of flexibility in gas storage cavities, leading to recognition of impairment of €285 million on gas storage assets.
Edison (€1,419 million). Poor market conditions that led to significantly reduced options for asset portfolio optimisation, low demand, and downward revision of the capacity premium led to recognition of €868 million of impairment, mainly concerning the thermal, hydropower and wind power plants. In view of the long-term downturn in Brent crude oil and gas prices over the market horizon, impairment of €551 million was also recorded on Edison’s exploration-production activities.
Poland (€206 million). The worsening of clean dark spreads adversely affected performance at certain Polish fossil-fired plants, particularly facilities that are fully exposed to market prices.
Details of other impairment are given in note 13 to the 2015 consolidated financial statements, “Impairment/reversals”.
In 2014, impairment amounted to €1,189 million and essentially concerned:
Belgium : €586 million in respect of the subsidiary EDF Luminus, due to the deterioration in long-term market price assumptions;
the United Kingdom: €169 million in respect of the West Burton B combined cycle gas turbine plant due to the decline in market prices for gas, and the Hill Top Farm gas storage cavities in Cheshire after the number of storage cavities put into development was reduced for reasons of site security and unfavourable market conditions;
Edison: €167 million, mostly in respect of hydropower and wind power assets, which were affected by falling market prices.
5.3.5 Other income and expenses
Other income and expenses generated a net expense of €885 million in 2015, compared to €212 million in 2014.
In 2015, the main components of other income and expenses were:
a €820 million increase to provisions following the decision of 15 January 2016 concerning the cost of implementing long-term management solutions for long-lived medium and high-level radioactive waste under the Cigéo storage project (see section 3.6.1.6 “Ministerial order concerning the cost of the Cigéo storage project”);
a €590 million increase to provisions following updating of the industrial scenario and contractor quotes for decommissioning nuclear power plants that are permanently shut down, less a reversal of €332 million from the provision for long-term radioactive waste management resulting from updating of this scenario, giving a net effect of €258 million;
income of €287 million in connection with the agreement signed on 30 June 2015 between EDF and Engie concerning the compensation system for employee benefits in kind in the form of energy. This agreement entailed a contractual change in the number of beneficiaries covered by the Group;
income of €154 million associated with the change in EDF Energy’s defined-benefit pension plans.

Page 32 of 52
Other income and expenses in 2014 included:
a gain on sale of €217 million from operations in connection with the Group’s investment in Dalkia;
an expense of €388 million relating to decommissioning of French nuclear power plants that have been permanently shut down (natural uranium graphite gas-cooled (UNGG) plants, Creys-Malville, Brennilis and Chooz A).
5.4 FINANCIAL RESULT
The financial result for 2015 corresponds to a financial expense of €2,588 million, €37 million more than in 2014. This change is explained by:
a decrease in net indebtedness due notably to the positive impact of variabilisation of the debt;
a €184 million decrease in discount expenses compared to 2014, essentially concerning provisions for employee benefits;
a €470 million downturn in other financial income and expenses, as the increase in capital gains on divestment of dedicated assets was more than outweighed by the €360 million financial interest associated with the European Commission’s decision of 22 July 2015 (see section 3.1 “European commission decision on the tax treatment of provisions established between 1987 and 1996 for renewal of the general network”).
5.5 INCOME TAXES
Income taxes amounted to €483 million, corresponding to an effective tax rate of 28.5% in 2015. The effective tax rate was 33.8% in 2014.
The effective tax rate was driven up by impairment; after adjustment to eliminate this factor, it stood at 24.3% in 2015 compared to 32.2% in 2014.
The main explanations for the fall in the effective tax rate between 2014 and 2015 are the lower income tax rate and cancellation of the “Robin Hood” tax in Italy, and the lower income tax rate in the United Kingdom.
5.6 SHARE IN NET INCOME OF ASSOCIATES AND JOINT VENTURES
The Group’s share in net income of associates and joint ventures was a positive €192 million in 2015, compared to €179 million in 2014. This rise essentially results from higher year-on-year net income at RTE, as the weather was more favourable than in 2014.
The share in net income of associates in 2015 also includes impairment totalling €549 million, including:
Alpiq (€196 million). Against a background of persistently low prices on the wholesale markets, the Group booked impairment in respect of Alpiq’s Swiss assets, corresponding to its share of the impairment recorded in Alpiq’s published financial statements at 30 June 2015.
If the Alpiq group finds itself obliged to recognise additional impairment in its consolidated financial statements for 2015, the EDF group will be obliged to reflect that in its half-yearly financial statements at 30 June 2016.
CENG (€271 million). This impairment was booked in view of lower forward prices and long-term electricity prices caused by the long-term decline in gas prices.
In 2014 impairment of €425 million was recorded, including €206 million in respect of Alpiq, €122 million on CENG and €83 million on the investment in the joint venture Estag (Austria).
(in millions of Euros) 2015 2014
Variation
Variation
(%)
Cost of gross financial indebtedness (1,994) (2,243) 249 -11.1
Discount effect (2,812) (2,996) 184 -6.1
Other financial income and expenses 2,218 2,688 (470) -17.5
FINANCIAL RESULT (2,588) (2,551) (37) +1.5

Page 33 of 52
5.7 NET INCOME ATTRIBUTABLE TO NON-CONTROLLING INTERESTS
Net income attributable to non-controlling interests amounted to €214 million in 2015, €142 million more than in 2014. This change is essentially explained by the rise in Centrica’s revenues on nuclear generation activities.
5.8 EDF NET INCOME
EDF net income totalled €1,187 million for 2015, down by €2,514 million (-67.9%) compared to 2014.
5.9 NET INCOME EXCLUDING NON-RECURRING ITEMS
The Group’s net income excluding non-recurring items1 stood at €4,822 million for 2015, down by 0.6% from 2014.
1. Group net income excluding non-recurring items and net changes in fair value on Energy and Commodity derivatives, excluding trading activities, net of tax. Non-recurring items and net changes in fair value on Energy and Commodity derivatives, excluding trading activities, net of tax:
-€3,759 million for miscellaneous risks and impairment in 2015, compared to -€1,290 million in 2014. +€124 million of net changes in fair value on Energy and Commodity derivatives, excluding trading activities, net of tax in 2015,
compared to +€139 million in 2014.

Page 34 of 52
6 NET INDEBTEDNESS, CASH FLOWS AND INVESTMENTS
Net indebtedness comprises total loans and financial liabilities, less cash and cash equivalents and liquid assets. Liquid assets are financial assets consisting of funds or securities with initial maturity of over three months that are readily convertible into cash and are managed according to a liquidity-oriented policy. It also includes the Group’s loan to RTE.
Changes in the Group’s net indebtedness were as follows:
(in millions of Euros) 2015 2014
restated (1) Variation Variation
(%)
Operating profit before depreciation and amortisation (EBITDA) 17,601 17,279 322 +1.9
Cancellation of non-monetary items included in EBITDA (1,610) (1,901) 291 -
Net financial expenses disbursed (1,252) (1,752) 500 -
Income taxes paid (1,508) (2,614) 1,106 -
Other items including dividends received from associates and joint ventures
271 679 (408) -
Operating cash flow (2) 13,502 11,691 1,811 +15.5
Change in working capital 132 (1,041) 1,173 -
Net investments (3) (12,672) (11,887) (785) -
Cash flow after net investments 962 (1,237) 2,199 -
European Commission decision (4) (906) - (906) -
Dedicated assets 217 174 43 -
Cash flow before dividends (5) 273 (1,063) 1,336 -
Dividends paid in cash (2,337) (2,944) 607 -
Group cash flow (2,064) (4,007) 1,943 -
Issuance of perpetual subordinated bonds - 3,970 (3,970) -
Other monetary changes (278) (44) (234) -
(Increase) / decrease in net indebtedness, excluding the impact of changes in exchange rate
(2,342) (81) (2,261) -
Effect of change in exchange rate (951) (990) 39 -
Effect of other non-monetary changes 106 296 (190) -
(Increase)/Decrease in net indebtedness (3,187) (775) (2,412) -
NET INDEBTEDNESS AT BEGINNING OF PERIOD 34,208 33,433 775 -
NET INDEBTEDNESS AT END OF PERIOD 37,395 34,208 3,187 -
(1) 2014 figures are restated following reclassification of investments in strategic operations as net investments. (2) Operating cash flow is not an aggregate defined by IFRS as a measure of financial performance, and is not directly comparable with
indicators of the same name reported by other companies. This indicator, also known as Funds From Operations (“FFO”), is equivalent to net cash flow from operating activities excluding changes in working capital after adjustment where relevant for the impact of non-recurring effects, less net financial expenses disbursed and income taxes paid.
(3) Net investments are operating investments and financial investments for growth, net of disposals. They also include net debts acquired or transferred in acquisitions or disposals of securities, investment subsidies received, non-Group partner investments, and new developments including the Linky project and the asset disposals that finance them.
(4) On 22 July 2015 the European Commission issued a new decision classifying the tax treatment of provisions established between 1987 and 1996 for renewal of the General Network facilities as state aid that is incompatible with European Union rules (see section 3.1).
(5) Cash flow before dividends is not an aggregate defined by IFRS as a measure of financial performance, and is not comparable with indicators of the same name reported by other companies. It is equal to the operating cash flow defined in note (2) after the change in working capital, net investments (see note (3)), the European Commission decision concerning the French General Electricity Network and net allocations to dedicated assets.
6.1 OPERATING CASH FLOW
The operating cash flow amounted to €13,502 million in 2015 compared to €11,691 million in 2014, an increase of €1,811 million (+15.5%).
This change mainly reflects:
the rise in EBITDA (+€322 million), and lower eliminations of non-monetary items included in EBITDA (-€1,610 million in 2015, compared to -€1,901 million in 2014), notably due to the closing of favourable positions on trading activities recorded in late 2014;

Page 35 of 52
the lower level of net financial expenses disbursed (€1,252 million in 2015 compared to €1,752 million in 2014), essentially explained by the full-year effect in 2015 of the campaign to variabilise rates on borrowings between January and June 2014;
a decrease in income taxes paid (-€1,508 million in 2015 versus -€2,614 million in 2014), essentially as a result of differences in France in the balance of income tax due for previous years, and the lower advance instalments of income tax paid in France in 2015 as a result of lower taxable income.
These rises were partly offset by the lower amount of dividends received (-€350 million), primarily explained by the exceptional dividend received from CENG in 2014 which had no equivalent in 2015.
6.2 CHANGE IN WORKING CAPITAL
The change in working capital over 2015 amounted to +€132 million, and is mainly explained by:
collection of trade receivables related to the regulated sales tariff catch-up for 2012-2013 (increase of +€775 million);
gains resulting from the working capital improvement plan, essentially on inventories and trade receivables (approximately +€700 million);
an unfavourable foreign exchange and price effect on uranium in France and the United Kingdom (approximately -€400 million);
the rise in the CSPE operating receivable (-€230 million);
the weather impact in France, which was not very significant in 2015;
other operating effects (approximately -€300 million).
The difference between the 2015 and 2014 change in working capital (+€1,173 million) essentially results from the favourable effect of the regulated sales tariff catch-up for 2012-2013 (approximately +€1.8 billion), gains resulting from the working capital improvement plan (approximately -€350 million), and an unfavourable price and foreign exchange effect in 2015 on nuclear fuel inventories in France and the United Kingdom (approximately -€200 million).
6.3 NET INVESTMENTS
Net investments amounted to €12,672 million in 2015 compared to €11,887 million in 2014, an increase of €785 million (+6.6%). Details are as follows:
(in millions of Euros) 2015 2014 (1) Variation
Variation
(%)
Generation and Supply (deregulated) activities 5,684 5,574 110 +2.0
Network activities 2,885 2,722 163 +6.0
Island activities 430 438 (8) -1.8
France 8,999 8,734 265 +3.0
United Kingdom 1,111 977 134 +13.7
Italy 585 78 507 n.a
Other International 922 488 434 +88.9
International 2,618 1,543 1,075 +69.7
Other activities 825 1,198 (373) -31.1
NET INVESTMENTS EXCLUDING NEW DEVELOPMENTS AND ASSET DISPOSALS
12,442 11,475 967 +8.4
NEW DEVELOPMENTS NET OF ASSET DISPOSALS 230 412 (182) -44.2
NET INVESTMENTS 12,672 11,887 785 +6.6
(1) 2014 figures are restated, principally by eliminating net investments in the UK Nuclear New Build programme, which are now included in new developments.
In France, net investments were up by +€265 million or +3%:
in the Generation and Supply (deregulated) activities, the increase in net investments (+€110 million) mainly resulted from nuclear maintenance activities;

Page 36 of 52
in the network activities, the rise in net investments (+€163 million) primarily resulted from payments made during 2015 for investments undertaken in late 2014. The lower investments in customer connections were offset by higher investments to improve network coverage quality and network reinforcement.
In the International segment, net investments were up by €1,075 million or +69.7%.
In the United Kingdom, the increase of €134 million or +13.7% is largely explained by an unfavourable foreign exchange effect.
In Italy, the rise of €507 million was principally due to development of projects already launched in exploration-production, and sales of assets during 2014 which had no equivalent in 2015.
The increase in the Other International segment’s net investments (+€434 million) is notably explained by investments to bring coal-fired and cogeneration plants in Poland up to the latest standards, and investments in Belgium relating to reorganisation of EDF Luminus’ shareholding structure.
In the Other activities segment, net investments were down by €373 million or -31.1%. This decrease primarily resulted from EDF Énergies Nouvelles, where the ongoing capacity development required high levels of investment but benefited from higher subsidies received in 2015, mainly for wind farm projects in the United States.
New developments and asset disposals correspond to the Group’s new development projects and sales of assets undertaken to fund them. They also include Linky investments. In 2015 and 2014 these new developments mainly concerned New Nuclear investments in the United Kingdom, and to a smaller degree investments in Linky meters and offshore wind farm projects. Asset disposals essentially concerned real estate property, sales of assets by EDF Trading and sales of the Group’s investments in Estag and BE Zrt.
6.4 FRENCH GENERAL ELECTRICITY NETWORK
Following the European Commission’s decision of 22 July 2015 classifying the tax treatment of provisions established between 1987 and 1996 for renewal of the General Network facilities as state aid that is incompatible with European Union rules, EDF repaid the sums demanded: the amount of the state aid (€889 million) plus interest (€494 million) as calculated on terms set by the Commission.
The impact relating to the French General Network totals €906 million, comprising:
payment to the State of €1,383 million, which was partly offset by a reimbursement of €375 million received from RTE;
a tax saving of €102 million associated with the decline in taxable income.
6.5 DEDICATED ASSETS
In compliance with the French Law of 28 June 2006 on the sustainable management of radioactive materials and waste, EDF has built up a portfolio of dedicated assets for secure financing of its long-term nuclear obligations which amounted to €23,480 million at 31 December 2015.
Overall, the changes in dedicated assets comprise:
allocations to reach full coverage of obligations;
reinvestment of financial income (dividends and interest) generated by these assets;
withdrawals of assets corresponding to the costs incurred over the period in application of long-term nuclear obligations falling within the scope of the Law of 28 June 2006;
exceptional withdrawals proposed to the governance bodies in charge of managing dedicated assets when the value of the portfolio exceeds the amount of the obligations to be financed; such withdrawals must be validated by these bodies.
The net movement of €217 million in 2015 corresponds to the second and third types of change described above.

Page 37 of 52
6.6 CASH FLOW BEFORE DIVIDENDS
The cash flow before dividends in 2015 was positive at €273 million (compared to a negative €1,063 million in 2014) and is mainly explained by the following factors:
operating cash flow of +€13,502 million;
net investments of -€12,672 million;
the payment related to the French General Network with a net effect of -€906 million.
The +€1,336 million improvement from 2014 is essentially due to the €1,811 million increase in operating cash flow, although this effect was reduced by the payment related to the French General Network in 2015 (-€906 million).
6.7 DIVIDENDS PAID IN CASH
Dividends paid in cash during 2015 (-€2,337 million) comprise:
the balance of the 2014 dividends (€1,268 million);
the interim dividend for 2015 (€152 million) decided by the Board of Directors on 4 November 2015 and paid on 18 December 2015 at the rate of €0.57 per share;
payments made in 2015 to bearers of perpetual subordinated bonds for the “hybrid” bond issues of January 2013 and January 2014 (€591 million);
dividends paid by Group subsidiaries to their minority shareholders (€326 million).
The favourable difference of €607 million compared to 2014 is principally attributable to payment of the interim dividend for 2015 in the form of a scrip dividend to 85.63% of shareholders.
6.8 GROUP CASH FLOW
The Group cash flow after dividends amounted to -€2,064 million compared to -€4,007 in 2014. The €1,943 million improvement primarily reflects the €1,336 million change in cash flow before dividends and €607 million decrease on dividends paid in cash.
6.9 EFFECT OF CHANGE IN EXCHANGE RATE
The foreign exchange effect (rise of the pound sterling and US dollar against the Euro1) had an unfavourable impact of -€951 million on the Group’s net indebtedness at 31 December 2015.
6.10 NET INDEBTEDNESS
The Group’s net indebtedness stood at €37,395 million at 31 December 2015 compared to €34,208 million at 31 December 2014. The €3,187 million increase is principally explained by a negative Group cash flow (-€2,064 million) and an unfavourable foreign exchange effect (-€951 million).
6.11 FINANCIAL RATIOS
2015 2014 2013
restated
Net indebtedness / EBITDA 2.1 2.0 2.1
Net indebtedness / (Net indebtedness +equity) 1) 48% 46% 46%
(1) Equity including non-controlling interests. The ratios for 2013 were restated following application of IFRS 10 and IFRS 11.
1. The pound sterling rose by 6.1% against the Euro, from €1.284/£1 at 31 December 2014 to €1.362/£1 at 31 December 2015.
The US dollar rose by 11.5% against the Euro, from €0.824/$1 at 31 December 2014 to €0.919/$1 at 31 December 2015.

Page 38 of 52
7 MANAGEMENT AND CONTROL OF MARKET RISKS
7.1 MANAGEMENT AND CONTROL OF FINANCIAL RISKS
This section sets forth the policies and principles for management of the Group’s financial risks defined in the Strategic Financial management framework (liquidity, interest rate, foreign exchange rate and equity risks), and the Group counterparty risk management policy set up by the EDF group. These principles apply only to EDF and operationally controlled subsidiaries or subsidiaries that do not benefit by law from specific guarantees of independent management such as ERDF. In compliance with IFRS 7, the following paragraphs describe the nature of risks resulting from financial instruments, based on analyses of sensitivities and credit (counterparty) risks.
Since 2002, a dedicated body – the Financial Risks Control department (département Contrôle des Risques Financiers et Investissements – CRFI) – has been in charge of financial risk control at Group level by ensuring correct application of the principles of the Strategic Financial Management Framework (July 2015). This department, which has reported to the Group’s Risk Division since 2008, is an independent unit that also has the task of carrying out a second-level check (methodology and organisation) of EDF entities and operationally controlled Group subsidiaries (excluding ERDF), and a first-level check of financing activities at parent company level, including Trading room activities.
The CRFI Department issues daily monitoring reports of risk indicators relevant to activities in EDF’s trading room.
Regular internal audits are carried out to ensure controls are actually applied and are effective.
7.1.1 Liquidity position and management of liquidity risks
7.1.1.1 Liquidity position
At 31 December 2015, the Group’s liquidities, consisting of liquid assets, cash and cash equivalents, totalled €22,323 million and available credit lines amounted to €11,380 million.
For 2016, the Group’s scheduled debt repayments (principal and interest) are forecast at €12,799 million at 31 December 2015, including €3,751 million for bonds (excluding hybrid bonds).
At 31 December 2015, no Group company was in default on any borrowing.
7.1.1.2 Management of liquidity risk
On 18 April 1996, EDF set up a programme to issue debt securities in the form of Euro Medium Term Notes (the “EMTN” programme). This programme was regularly renewed until May 2009, when an EMTN programme governed by French law was established for EDF’s EMTN issues from that date. The new programme has also been regularly renewed since then, and its current ceiling is €45 billion.
On 25 September 2015, EDF issued a senior “Formosa bond” on the Taiwanese market for a total $1,500 million, with 30-year maturity and a 4.75% fixed coupon.
On 8 October 2015 EDF also issued a US$4,750 million senior bond in five tranches:
A US$1,500 million bond with 5-year maturity and a 2.35% fixed coupon;
A US$1,250 million green bond with 10-year maturity and a 3.625% fixed coupon;
A US$500 million bond with 20-year maturity and a 4.75% fixed coupon;
A US$1,150 million bond with 30-year maturity and a 4.95% fixed coupon;
A US$350 million bond with 40-year maturity and a 5.25% fixed coupon.
The green bond issue of US$1.25 billion with 10-year maturity and a 3.625% fixed coupon is enabling EDF to continue its investments for development of renewable energies. This operation is based on the structure of EDF’s bond issue of November 2013 which is a benchmark for the market, and demonstrates EDF’s ongoing commitment to development of the green bond market and its support for best practices, in line with the Green Bond Principles1:
1. The Green Bond Principles, updated in March 2015, are voluntary guidelines for issuance of green bonds. They recommend transparency
and disclosure to support development of the green bond market and promote integrity. For more information, see http://www.icmagroup.org/Regulatory-Policy-and-Market-Practice/green-bonds/green-bond-principles

Page 39 of 52
The funds raised by the green bond are exclusively dedicated to financing renewable energy projects developed by EDF Énergies Nouvelles;
The projects funded are selected through a stringent, documented process based on ESG criteria validated by the extra-financial rating agency, Vigeo1;
The funds raised are managed and monitored under strict segregation principle, from their receipt in EDF’s cash until allocation to eligible green projects.
EDF will regularly report on the amounts allocated from the green bond, the portfolio of projects financed and the associated environmental benefits. A statement by Deloitte & Associés on respect of EDF’s commitments will be included in the 2015 Reference Document.
These operations contribute to the Group’s investment strategy and are part of its policy to extend the average maturity of its debt.
Details of the Group’s bond borrowings are given in note 38.2 to the 2015 consolidated financial statements.
The average maturity of Group debt was 13 years at 31 December 2015, compared to 13.2 years at 31 December 2014. For EDF SA, the average maturity of debt was 13.9 years at 31 December 2015, against 14.4 years at 31 December 2014.
At 31 December 2015, the residual maturities of financial liabilities (including interest payments) are as follows under IAS 39 (valued based on exchange and interest rates at 31 December 2015):
(1) Data on hedging instruments include both assets and liabilities.
The EDF group was able to meet its financing needs by conservative liquidity management, and has obtained financing on satisfactory terms.
A range of specific levers are used to manage the Group’s liquidity risk:
the Group’s cash pooling system, which centralises cash management for controlled subsidiaries. The subsidiaries’ cash balances are made available to EDF SA in return for interest, so as to optimise the Group’s cash management and provide subsidiaries with a system that guarantees them market-equivalent financial terms;
centralisation of financing for controlled subsidiaries at the level of the Group’s cash management department. Changes in subsidiaries’ working capital are financed by this department in the form of stand-by credit lines provided for subsidiaries, which may also be granted revolving credit from the Group. EDF SA and the investment subsidiary EDF Investissements Groupe (EDF IG), set up in partnership with the bank Natixis Belgique Investissements, also provide medium and long-term financing for EDF group operations outside France, arranged by EDF SA and EDF IG on a totally independent basis: each company sets its own terms, which are the same as the subsidiary would have in an arm’s-length market transaction;
active management and diversification of financing sources used by the Group: the Group has access to short-term resources on various markets through programmes for French commercial paper (billets de trésorerie), US commercial paper and Euro market commercial paper. For EDF, the ceilings for these programmes are €6 billion for its French commercial paper, $10 billion for its US commercial paper and €1.5 billion for its Euro market commercial paper.
At 31 December 2015, the amount of commercial paper outstanding was €3,744 million for French commercial paper, and $3,232 million for US commercial paper. No Euro market commercial paper has been issued. EDF has access to the world’s main bond markets: the Euro markets through its EMTN programme, which currently has a
1. ESG (Environmental, Social, Governance) criteria cover five areas: respect for human rights and governance in the project’s host country;
management of environmental impacts; protection of employee health and safety; promotion of responsible relationships with suppliers; and dialogue with local stakeholders.
31 December 2015 (in millions of Euros)
Debt Hedging instruments (1)
Interest rate swaps Currency swaps
Guarantees given on bonds
2015 12,799 (554) 11 407
2016-2019 23,024 (1,916) 38 497
2020 and later 64,176 (3,093) (32) 146
TOTAL 99,999 (5,563) 17 1 050
Debt repayment 62,882
Interest expense 37,117

Page 40 of 52
ceiling of €45 billion, particularly for Euro and sterling issues; and the domestic markets used for stand-alone issues in US dollars (144a bonds), yen (samurai bonds) and Swiss francs.
The table below sets forth the Group’s borrowings of more than €650 million or the equivalent value in other currencies at issue as reported in the consolidated financial statements, by type and by maturity at 31 December 2015: Type of borrowing (in millions of currency units)
Entity Issue date (1) Maturity Nominal amount Currency Rate
Euro MTN EDF 10/2001 10/2016 1,100 EUR 5.50%
Bond EDF 01/2014 01/2017 1,000 USD 1.15%
Euro MTN EDF 02/2008 02/2018 1,500 EUR 5.00%
Bond EDF 01/2009 01/2019 2,000 USD 6.50%
Bond EDF 01/2014 01/2019 1,250 USD 2.15%
Bond EDF 01/2010 01/2020 1,400 USD 4.60%
Bond EDF 10/2015 10/2020 1,500 USD 2.35%
Euro MTN EDF 05/2008 05/2020 1,200 EUR 5.38%
Euro MTN EDF 01/2009 01/2021 2,000 EUR 6.25%
Euro MTN (green bond) EDF 11/2013 04/2021 1,400 EUR 2.25%
Euro MTN EDF 01/2012 01/2022 2,000 EUR 3.88%
Euro MTN EDF 09/2012 03/2023 2,000 EUR 2.75%
Euro MTN EDF 09/2009 09/2024 2,500 EUR 4.63%
Euro MTN EDF 11/2010 11/2025 750 EUR 4.00%
Bond (green bond) EDF 10/2015 10/2025 1,250 USD 3.63%
Euro MTN EDF 03/2012 03/2027 1,000 EUR 4.13%
Euro MTN EDF 04/2010 04/2030 1,500 EUR 4.63%
Euro MTN EDF 07/2001 07/2031 650 GBP 5.88%
Euro MTN EDF 02/2003 02/2033 850 EUR 5.63%
Euro MTN EDF 06/2009 06/2034 1,500 GBP 6.13%
Bond EDF 01/2009 01/2039 1,750 USD 6.95%
Euro MTN EDF 11/2010 11/2040 750 EUR 4.50%
Euro MTN EDF 10/2011 10/2041 1,250 GBP 5.50%
Bond EDF 01/2014 01/2044 1,000 USD 4.88%
Bond EDF 10/2015 10/2045 1,500 USD 4.75%
Bond EDF 10/2015 10/2045 1,150 USD 4.95%
Euro MTN EDF 09/2010 09/2050 1,000 GBP 5.13%
Bond EDF 01/2014 01/2114 1,350 GBP 6.00%
(1) Date funds were received.
EDF has an overall amount of €9,906 million in available credit facilities (syndicated credit and bilateral lines).
Syndicated credit lines amount to €4 billion with maturities extending to November 2020. No drawings had been made on these syndicated credit lines at 31 December 2015.
Credit lines represent an available amount of €5,906 million, with expiry dates extending to November 2019. The level of these credit facilities is regularly reviewed to ensure that the Group has sufficient back-up facilities.
The €500 million credit line between EDF and the European Investment Bank was totally drawn at 31 December 2015, and the other credit line of €200 million between EDF and the European Investment Bank was drawn to the extent of €70 million at the same date.
EDF Energy has an external credit line of £500 million which was totally drawn.
Since December 2015, EDF IG has had a new syndicated credit facility for €1,000 million (maturing in September 2020). At 31 December 2015 drawings on this credit facility amounted to €488 million.
In 2014 Edison subscribed a €500 million credit line with a pool of banks (maturing in November 2016). No

Page 41 of 52
drawings had been made on this credit line at 31 December 2015. Edison also has an external €140 million credit line which was drawn to the extent of €5 million.
7.1.2 Credit ratings
The financial ratings agencies Standard & Poor’s, Moody’s and Fitch Ratings attributed the following long-term and short-term ratings to EDF group entities at 31 December 2015:
7.1.3 Management of foreign exchange risk
Due to the diversification of its activities and geographical locations, the Group is exposed to the risk of exchange rate fluctuations, which may have an impact on the translation differences affecting balance sheet items, Group financial expenses, equity and net income.
To limit exposure to foreign exchange risks, the Group has introduced the following management principles:
local currency financing: to the extent possible given the local financial markets’ capacities, each entity finances its activities in its own accounting currency. When financing is contracted in other currencies, derivatives may be used to limit foreign exchange risk;
matching of assets and liabilities: the net assets of subsidiaries located outside the Euro zone expose the Group to a foreign exchange risk. The foreign exchange risk in the consolidated balance sheet is managed either by matching with liabilities for acquisitions in the same currency, or by market hedging involving use of financial derivatives. Hedging of net assets in foreign currencies complies with risk/return targets, and the hedging ratio varies from 41% to 73% depending on the currency (apart from the BRL and CNY). If no hedging instruments are available, or if hedging costs are prohibitive, the foreign exchange positions remain open and the risk on such positions is monitored by sensitivity calculations;
hedging of operating cash flows in foreign currencies: in general, the operating cash flows of EDF and its subsidiaries are in the relevant local currencies, with the exception of flows related to fuel purchases which are primarily in US dollars, and certain flows related to purchases of equipment, which concern lower amounts. Under the principles of the Strategic Financial Management Framework, EDF and the main subsidiaries concerned by foreign exchange risks (EDF Energy, EDF Trading, Edison, EDF Énergies Nouvelles) are required to hedge firm or highly probable commitments related to these future operating cash flows.
As a result of the financing and foreign exchange risk hedging policy, the Group’s gross debt at 31 December 2015 breaks down as follows by currency after hedging:
Gross debt structure by currency, before and after hedging
(1) Hedges of liabilities and net assets of foreign subsidiaries.
The table below presents the impact of a variation in exchange rates on the Group’s gross debt at 31 December 2015.
Company Agency Long-term rating (LT) Short-term rating (ST)
EDF Standard & Poor’s
Moody’s Fitch Ratings
A+, negative outlook A1, negative outlook
A stable outlook
A-1 P-1 F1
EDF Trading Moody’s Baa1, negative outlook unrated
EDF Energy Standard & Poor’s A-, negative outlook A-1
Edison Standard & Poor’s
Moody’s BBB+, negative outlook
Baa3, stable outlook A-2
unrated
31 December 2015 (in millions of Euros)
Initial debt structure
Impact of hedging instruments(1)
Debt structure after hedges
% of debt
EUR 31,731 16,731 48,462 76%
USD 19,137 (17,250) 1,887 3%
GBP 11,677 382 12,059 19%
Other currencies 1,638 137 1,775 3%
TOTAL DEBT 64,183 - 64,183 100%

Page 42 of 52
Sensitivity of the Group’s gross debt to foreign exchange rate risks
Due to the Group’s foreign exchange risk hedging policy for liabilities, the income statement for companies controlled by the Group is marginally exposed to foreign exchange rate risk.
The table below sets forth the foreign exchange position relating to net assets in foreign currencies of the Group’s subsidiaries:
Net asset position
(1) Net assets at 31 December 2015 including significant adjustments made in the final quarter; derivatives and bonds at 31 December 2015. The net positions shown exclude certain non-significant exposures.
The above table shows the assets of the Group’s foreign subsidiaries in foreign currencies, adjusted for changes in the fair value of cash flow hedges and available-for-sale financial assets recorded in equity, and changes in the fair value of financial instruments recorded in income.
The following table sets forth the risk of foreign exchange loss in equity on net assets in foreign currencies of the Group’s principal subsidiaries at 31 December 2015, assuming unfavourable, uniform exchange rate variations of 10% against the Euro. Net assets are converted at the closing rate and impacts are reported in absolute value.
Sensitivity of net assets to exchange rate risks
(1) Net assets at 30 September 2015.
The foreign exchange risk on available-for-sale securities is mostly concentrated in EDF’s dedicated asset portfolio, which is discussed in section 7.1.6 “Management of financial risk on EDF’s dedicated asset portfolio”.
The foreign exchange risk associated with short-term investments and operating liabilities in foreign currencies remains restricted for the Group at 31 December 2015.
31 December 2015 (in millions of Euros)
Debt after hedging instruments
converted into Euros
Impact of a 10% unfavourable variation in
exchange rates
Debt after a 10% unfavourable variation in
exchange rates
EUR 48,462 - 48,462
USD 1,887 188 2,075
GBP 12,059 1,206 13,265
Other currencies 1,775 176 1,951
TOTAL DEBT 64,183 1,570 65,753
31 December 2015 (1)
(in millions of currency units) Net assets Bonds Derivatives Net assets after
management
USD 5,268 3,200 (848) 2,916
CHF (Switzerland) 681 600 (100) 181
HUF (Hungary) 105,289 - 43,000 62,289
PLN (Poland) 2,892 - 2,085 807
GBP (United Kingdom) 14,994 5,435 2,158 7,401
BRL (Brazil) 1,065 - - 1,065
CNY (China) 9,770 - - 9,770
31 December 2015 (1) 31 December 2014
(in millions)
Net assets after
management, in currency
Net assets after management, converted into
Euros
Impact on equity of a 10% variation in
exchange rates
Net assets after management, in
currency
Net assets after management, converted into
Euros
Impact on equity of a 10%
variation in exchange rates
USD 2,916 2,678 268 2,241 1,845 185
CHF (Switzerland) 181 167 17 420 349 35
HUF (Hungary) 62,289 197 20 7,480 24 2
PLN (Poland) 807 189 19 1,967 460 46
GBP (United Kingdom) 7,401 10,084 1,008 6,390 8,204 820
BRL (Brazil) 1,065 247 25 833 259 3
CNY (China) 9,770 1,384 138 8,007 1,063 106

Page 43 of 52
7.1.4 Management of interest rate risk
The exposure of the Group’s net indebtedness to interest rate fluctuations covers two types of risk: a risk of change in the net financial expenses on floating-rate financial assets and liabilities, and a risk of change in the value of financial assets invested at fixed rates. These risks are managed by monitoring the floating-rate portion of net indebtedness, defined by reference to the risk/return for net financial expenses, taking into consideration expected movements in interest rates.
Some of the debt is variabilised and the Group may use interest rate derivatives for hedging purposes. The distribution of exposure between fixed and floating rates is monitored.
The Group’s debt after hedging instruments at 31 December 2015 comprised 54.09% at fixed rates and 45.91% at floating rates.
A 1% uniform annual rise in interest rates would generate an approximate €296 million increase in financial expenses at 31 December 2015, based on gross floating-rate debt after hedging.
The average cost of Group debt (weighted interest rate on outstanding amounts) was 2.92% at the end of 2015.
The table below sets forth the structure of Group debt and the impact of a 1% variation in interest rates at 31 December 2015. The impact of the change in interest rates was €73 million higher than in 2014.
Group debt structure and sensitivity to interest rates
Interest rate variations on fixed-rate debt have no accounting impact.
Concerning financial assets, the table below presents the interest rate risk on floating-rate bonds and negotiable
debt securities held by EDF, and their sensitivity to interest rate risks (impact on net income)
Sensitivity to interest rates of floating-rate instruments
7.1.5 Management of equity risks
The equity risk is concentrated in the following areas:
Coverage of EDF’s nuclear obligations
Analysis of the equity risk is presented in section 7.1.6 “Management of financial risk on EDF’s dedicated asset portfolio”.
Coverage of employee benefit obligations for EDF SA, EDF Energy and British Energy
Assets covering EDF’s employee benefit liabilities are partly invested on the international and European equities markets. Market trends therefore affect the value of these assets, and a downturn in equity prices would lead to a rise in balance sheet provisions.
29.5% of the assets covering EDF’s employee benefit obligations were invested in equities at 31 December 2015, representing an amount of €3.1 billion of equities.
At 31 December 2015, the two pension funds sponsored by EDF Energy (EDF Energy Pension Scheme and EDF Energy Group Electricity Supply Pension Scheme) were invested to the extent of 36.2% in equities and equity
31 December 2015 (in millions of Euros)
Initial debt structure Impact of hedging instruments
Debt structure after hedging
Impact on income of a 1% variation in interest rates
Fixed rate 56,840 (22,261) 34,579 -
Floating rate 7,343 22,261 29,604 296
TOTAL 64,183 64,183 296
31 December 2015 (in millions of Euros)
Value Impact on income of a 1% variation
of interest rates
Value after a 1% variation in interest rates
FLOATING-RATE INSTRUMENTS 1,824 (18) 1,806

Page 44 of 52
funds, representing an amount of £438 million of equities.
At 31 December 2015, the British Energy pension funds were invested to the extent of 33.9% in equities and equity funds, representing an amount of £1,707 million of equities.
CENG fund
CENG is exposed to equity risks in the management of its funds established to cover nuclear decommissioning and employee benefit obligations.
EDF’s long-term cash management
As part of its long-term cash management policy, EDF has continued its strategy to reduce the portion of equity-correlated investments, resulting in a non-significant position well below €1 million at 31 December 2015.
Direct investment
At 31 December 2015, EDF’s investment in AREVA amounted to €46.5 million, with estimated volatility of 36.0% (annualised volatility of monthly returns observed over three years).
7.1.6 Management of financial risk on EDF’s dedicated asset portfolio
Dedicated assets have been built up progressively by EDF since 1999 to secure financing of its long-term nuclear commitments. The Law of 28 June 2006 and its implementing regulations defined provisions not related to the operating cycle, which must therefore be covered by dedicated assets; they are listed in note 47 to the consolidated financial statements at 31 December 2014, “Dedicated assets”.
The dedicated asset portfolio is managed under the supervision of the Board of Directors and its advisory committees (Nuclear commitments monitoring committee, Audit committee).
The Nuclear Commitments Monitoring Committee (CSEN) is a specialised Committee set up by EDF’s Board of Directors in 2007.
A Nuclear Commitments Financial Expertise Committee (CEFEN) exists to assist the company and its governance bodies on questions of matching assets and liabilities and asset management. The members of this Committee are independent of EDF. They are selected for their skills and diversity of experience, particularly in the fields of asset/liability management, economic and financial research, and asset management.
Governance and management principles
The governance principles setting forth the structure, decision-making and control processes for the management of dedicated assets are validated by EDF’s Board of Directors. These principles also lay down rules for the asset portfolio’s structure, selection of financial managers, and the legal, accounting and tax structure of the funds.
Strategic asset allocation is based on asset / liability reviews carried out to define the most appropriate target portfolio for financing long-term nuclear expenses. Strategic allocation is validated by EDF’s Board of Directors and reviewed every three years unless circumstances require otherwise. Since 2013, this target allocation has consisted of a financial portfolio and around one quarter of unlisted assets. The unlisted assets are managed by EDF Invest (formed in July 2013 following the decree of 24 July 2013) and comprise infrastructures, real estate and investment funds.
The financial portfolio principally contains two sub-portfolios, “equities” and “bonds”, themselves divided into “secondary asset classes” or “pockets” that correspond to specific markets. The strategic allocation of the financial portfolio is 49% international equities and 51% bonds. A benchmark index is set for monitoring performance and controlling the risk on the financial portfolio: MSCI World AC DN hedged in Euros 50% (excluding emerging country currencies) for the equities sub-portfolio, and a composite index of 60% Citigroup EGBI and 40% Citigroup EuroBIG corporate for the bonds sub-portfolio.
A third “cash” sub-portfolio exists to provide secure coverage for the disbursements related to the purpose of the asset covered, and may be reinforced tactically, particularly when a prudent approach is required in the event of a market crisis.
The CSPE receivable was allocated to dedicated assets on 13 February 2013.
Tactical management of the financial portfolio has several focal areas:
monitoring of exposure between the “equities” and “bonds” sub-portfolios;

Page 45 of 52
within each sub-portfolio, allocation by “secondary asset class”;
selection of investment funds, aiming for diversification :
by style (growth securities, unlisted securities, high-return securities),
by capitalisation (major stocks, medium and small stocks),
by investment process (macroeconomic and sector-based approach, selection of securities on a “quantitative” basis, etc.),
by investment vehicle (for compliance with maximum investment ratios);
for bonds, a choice of securities held directly, through brokers, or via investment funds incorporating the concern for diversification:
by type of issue (fixed income, indexed income),
by type of instrument (government or supranational bonds, covered bonds and similar, corporate bonds),
by issuer and by maturity.
The allocation policy for the financial portfolio was developed by the Operational Management Committee1 on the basis of the economic and financial outlook for each market and geographical area, a review of market appreciation in different markets and market segments, and risk analyses produced by the CRFI department.
Change in regulations
The decree of 24 March 2015 contains two new measures concerning dedicated assets:
the annual allocation to dedicated assets, net of any increases to provisions, must be positive or zero as long as their realisable value is below 110% of the amount of the provisions concerned;
subject to certain conditions, real estate property owned by the operators of nuclear facilities may be allocated to coverage of these provisions.
Changes in the portfolio during 2015
In 2015 EDF Invest and two other long-term investors completed acquisition of a minority shareholding in Madrileña Red de Gas (MRG), a regulated operator for the Madrid region gas distribution network.
Also, EDF Invest and Ardian, through a consortium held in equal shares, acquired an investment of more than 50% in Géosel, a hydrocarbon storage company based in Manosque in France, from the Total Group.
Both these investments (see sections 3.4.1.4 “EDF Invest finalises the acquisition of Madrileña Red de Gas” and 3.4.1.5 “Ardian and EDF Invest sign a firm agreement for acqusition of a majority stake in Géosel from Total”) were allocated to EDF Invest’s “infrastructures” pocket along with RTE, TIGF and Porterbrook.
Over the year EDF Invest also continued to build up its real estate and investment fund portfolio.
The non-exclusive real estate investment fund created in late 2014 at the initiative of EDF Invest and Amundi undertook a second real estate investment in Germany during 2015.
EDF Invest also signed a contract with Nexity in September 2015 for the off-plan purchase of the Smart Side office and service “campus”. This development will be located on the edge of Paris in the towns of Saint-Ouen and Clichy, and its address will be in Paris’ 17th arrondissement.
Changes in the financial portfolio are described in the following section, under the heading “Performance of EDF’s dedicated asset portfolio”.
The CSPE receivable is a financial receivable (bearing interest at 1.72%). It will be repaid under a revised schedule extending to the end of 2020, which is to be set out in a decision as stated in a ministerial letter of 26 January 2016. In that letter the State also acknowledged the shortfall that arose between 2013 and 2015, estimated at €644 million and included in the revised repayment schedule, and authorised its allocation to dedicated assets.
The allocation to dedicated assets for 2015 was €38 million, resulting from allocation during the second half-year of shares already owned by EDF SA (no allocations were made to dedicated assets in 2014). As increases to provisions that must be offset by allocations to dedicated assets under the decree of 24 March 2015 amount to €1,010 million over the year 2015, the allocations to dedicated assets yet to be made amount to €972 million at 31 December 2015. These allocations must be made within a maximum of three years from that date.
Disbursements relating to decommissioning expenses incurred in 2015 were financed by the dedicated asset
1. A permanent internal committee for evaluation, consultation and operational decision-making in the management of dedicated assets.

Page 46 of 52
portfolio to the extent of €378 million, compared to €403 million in 2014.
Content and performance of EDF’s dedicated asset portfolio
Breakdown of the portfolio
At 31 December 2015, the total value of the portfolio was €23,480 million compared to €23,033 million in 2014.
The content of the financial portfolio is also presented in note 47 to the 2015 consolidated financial statements.
Portfolio content under the classification from article 4, decree 2007-243 of 23 February 2007
Categories (in millions of Euros)
31 December 2015 31 December 2014
Book value Realisable value Book value Realisable value
OECD government bonds and similar 3,486 3,784 3,332 3,627
OECD corporate (non-government) bonds 595 630 901 968
Funds investing in the above two categories 2,701 2,840 2,300 2,483
Equities traded on a recognised market - - - -
Funds not exclusively invested in OECD bonds 5,643 7,019 5,891 7,578
Hedges, deposits, amounts receivable 7 7 (23) (23)
TOTAL FINANCIAL PRODUCT PORTFOLIO 12,432 14,280 12,401 14,633
RTE (50% of the Group’s investment) 2,015 2,580 2,015 2,555
Other unlisted securities and real estate assets 1,249 1,395 604 709
TOTAL EDF INVEST 3,264 3,975 2,619 3,264
CSPE after funding 5,225 5,225 5,136 5,136
TOTAL DEDICATED ASSETS 20,921 23,480 20,156 23,033
31/12/2015 31/12/2014
Equities sub-portfolio 31.1% 32.9%
Bonds sub-portfolio 28.5% 27.9%
Cash sub-portfolio 1.2% 2.8%
CSPE after funding 22.3% 22.3%
Unlisted assets (EDF Invest) 16.9% 14.2%
TOTAL 100% 100%

Page 47 of 52
Performance of EDF’s dedicated asset portfolio
The table below presents the performance by portfolio at 31 December 2015 and 31 December 2014:
(in millions of Euros)
31/12/2015
Stock market or realisable value
Performance for 2015
31/12/2014
Stock market or realisable value
Performance for 2014
Portfolio
Benchmark index (1)
Portfolio
Benchmark index (1)
Equities sub-portfolio 7,304 6.1 % 4.9% 7,574 11.8% 14.1%
Bonds sub-portfolio 6,694 1.3 % 0.8% 6,419 9.9% 11.2%
TOTAL FINANCIAL PORTFOLIO
13,998 3.5 % 3.0% 13,993 10.7% 12.6%
Cash sub-portfolio 282 0.4 % -0. % 640 0.7% 0.1%
TOTAL FINANCIAL AND CASH PORTFOLIO
14,280 3.5 % 3.0% 14,633 10.3% 12.6%
CSPE after funding 5,225 1.7 % - 5,136 1.7% -
EDF INVEST (2) 3,975 5.3 % - 3,264 8.4% -
including RTE shares 2,580 4.6 % - 2,555 4.4% -
TOTAL DEDICATED ASSETS 23,480 3.5 % - 23,033 7.9% -
(1) Benchmark index: MSCI World AC DN hedged in Euros 50% (excluding emerging country currencies) for the equities sub-portfolio, composite index of 60% Citigroup EGBI and 40% Citigroup EuroBIG corporate for the bonds sub-portfolio, Eonia Capitalisé for the cash subportfolio, 49% equities index +51% bonds index for the total financial portfolio.
(2) Performance for assets held at the start of the year. The RTE shares are included at their equity value in the consolidated financial statements (to the extent of their allocation to the dedicated asset portfolio), i.e. they are not adjusted to fair value. By limiting the value of certain investments in compliance with article 16 of decree 2007-243 concerning calculation of the regulatory realisable value of dedicated assets which must be equal to or greater than long-term nuclear provisions, the amount of this regulatory realisable value has been reduced to €3,887 million for EDF Invest assets and a total €23,392 million for all dedicated assets.
There were three major events in 2015: the continued decline in oil prices, which accelerated towards the end of the year, the growth dichotomy between developed countries and emerging countries, and the divergent developments in the principal countries’ monetary policies.
After recovering by almost 30% in the first half-year, oil resumed its dramatic fall and the price per barrel was halved. This had major impacts for emerging countries that produce commodities, while the positive impact on consumers remained more diffuse. This “black gold” price pattern certainly contributed to the economic divergence between developed countries, although growth figures were satisfactory, including in Europe and emerging countries. The situation was particularly worrying in Brazil and Russia, but the slowdown in China and the decision by the People’s Bank of China to widen the yuan-dollar rate band were the main causes of the summer’s emphatic stock market correction. The ongoing fall in oil prices and anxieties over Chinese policy affected the markets again at the end of the year. The first increase for more than 10 years in Federal Reserve rates also added to the climate of feverish uncertainty, and investors did not consider further monetary policy relaxation by the ECB sufficient to make up for these points of concern. The geopolitical environment was another source of volatility, with terrorist attacks in France, poorly coordinated international intervention in the Middle East, rivalry between Iran and Saudi Arabia, and more.
In the Euro zone, tensions appear to have faded after an acute crisis phase in Greece during the summer. Action by the ECB, especially its Quantitative Easing policy, helped considerably to stabilise peripheral spreads at low levels, although the fragile political situation in the Iberian peninsula is still being closely watched by the market.
These events led to a deliberate but moderate devaluation of the Euro against the dollar.
Against this background, after a relatively volatile year, stock markets rose over the year. The world equities markets (MSCI World AC DN index hedged in Euros 50%, excluding emerging country currencies) were up by 4.9%. The European bond index (60% Citigroup EGBI and 40% Citigroup EuroBIG corporate) progressed by 0.8%. This is close to the coupon on bonds, as rates ultimately moved little overall. After a marked decrease early in the year and a strong rebound in the second quarter, rates stabilised during the second part of the year at close to their initial level.
In this market environment, the financial portfolio performance was positive at +3.5%. This should be compared with the composite benchmark, which rose by +3.0%. Given the lack of visibility from the summer onwards, the bond/equities allocation was kept close to neutral in the second part of the year. However, geographical allocations that prioritised Europe and Japan over North America and emerging countries in particular were continued. The +50 bp difference is principally explained by the good active management performance in Europe and North America, and foreign exchange exposures: overweighting in the Swiss franc and pound sterling at the beginning of the year, and in the Yen at the end of the year. In bonds, sensitivity management

Page 48 of 52
and credit management brought profitable results.
In 2015, the overall after-tax performance of dedicated assets (impacts on reserves and net income) was +€516 million: +€309 million on the financial portfolio and cash (+506 million before tax), +€53 million for the CSPE receivable after funding (+€86 million before tax) and +€153 million for EDF Invest (including +€113 million for the RTE shares allocated to dedicated assets)
Dedicated assets’ exposure to risks
EDF is exposed to equity risks, interest rate risks and foreign exchange risks through its dedicated asset portfolio.
The market value of the equities sub-portfolio in EDF’s dedicated asset portfolio was €7,304 million at 31 December 2015. The volatility of the equities sub-portfolio can be estimated through the volatility of its benchmark index, which at 31 December 2015 was 15.5% based on 52 weekly performances, compared to 12.4% at 31 December 2014. Applying this volatility to the value of equity assets at the same date, the Group estimates the annual volatility of the equities portion of dedicated assets at €1,132 million. This volatility is likely to affect the Group’s equity.
At 31 December 2015, the sensitivity of the bond sub-portfolio (€6,694 million) was 5.52, i.e. a uniform 100 base point rise in interest rates would result in a €369 million decline in market value which would be recorded in consolidated equity. The sensitivity was 5.38 at the end of 2014. While the sensitivity of the bond sub-portfolio was higher than in 2014, it remained below the sensitivity of the benchmark index (6.19).
7.1.7 Management of counterparty/credit risks
Counterparty risk is defined as the total loss that the EDF group would sustain on its business and market transactions if a counterparty defaulted and failed to perform its contractual obligations. The Group has a counterparty risk management policy which applies to the parent company and all operationally controlled subsidiaries. This policy, updated in September 2014, sets out the governance associated with monitoring for this type of risk, and organisation of the counterparty risk management and monitoring (including definition of limits and Group indicators). The policy also involves monthly consolidation of the Group’s exposures, updated monthly for financial and energy market activities and quarterly for other activities. The CRFI department closely monitors Group counterparties (daily review of alerts, special cautionary measures for certain counterparties). The table below gives details, by rating, of the EDF group’s consolidated exposure to counterparty risk. At 30 September 2015, 86% of the Group’s exposure concerns “investment grade” counterparties, mainly as a result of the predominance of exposures generated by the cash and asset management activity, with most short-term investments in low-risk assets:
The exposure to counterparty risk by nature of activity is distributed as follows:
Exposure in the energy trading activities is concentrated at the level of EDF Trading, where each counterparty is assigned a limit that depends on its financial robustness. A range of methods are used to reduce counterparty risk at EDF Trading, primarily position netting agreements, cash-collateral agreements and establishment of guarantees from banks or affiliates.
For counterparties dealing with EDF’s trading room, the CRFI department has drawn up a framework specifying counterparty authorisation procedures and the methodology for calculation of allocated limits. The level of exposure can be consulted in real time and is systematically monitored on a daily basis. The suitability of limits is reviewed without delay in the event of an alert or unfavourable development affecting a counterparty.
AAA AA A BBB BB B CCC/C Unrated Total
31/03/2015 2% 20% 41% 22% 4% 1% 0% 10% 100%
30/09/2015 2% 19% 37% 21% 11% 1% 0% 9% 100%
Purchases Insurance
Distribution and sales
Cash and asset management
Fuel purchases and energy trading
Total
31/03/2015 6% 1% 8% 74% 11% 100%
30/09/2015 11% 1% 8% 70% 10% 100%
Page 49 of 52
As the situation in the Euro zone is still unstable, EDF has continued to apply a prudent management policy for its cash investments in non-core countries. Apart from dedicated assets, purchases of sovereign debt are restricted to maximum maturities of three years for Italy and Spain (no exposure in Portugal, Greece, Cyprus, etc.). Only “investment grade” banking counterparties are authorised, for limited amounts and maturities.
7.2 MANAGEMENT AND CONTROL OF ENERGY MARKET RISKS
7.2.1 Framework for management and control of energy market risks
In keeping with the opening of the final customer market, development of the wholesale markets and on the international scene, the EDF group is exposed to price variations on the energy market which can significantly affect its financial statements.
Consequently, the Group has an “energy markets” risk policy for all energy commodities, applicable to EDF and entities over which it has operational control.
The purpose of this policy is to:
define the general framework for management of energy market risks, governing the various Group entities’ asset portfolio management activities (energy generation, optimisation and sale, and trading for EDF Trading;
define the responsibilities of asset managers and traders, and the various levels of control of activities;
implement a coordinated Group-wide hedging policy that is coherent with the Group’s financial commitments;
consolidate the exposure of the various entities operationally controlled by EDF on the structured energy-related markets.
At Dalkia, EDF Énergies Nouvelles and Edison, the principles of the energy market risk policy continue to be rolled out. These entities are managed under a risk management framework approved by the Group’s Executive Committee (Comex) and their respective Boards of Directors.
At entities not operationally controlled by EDF, the risk management framework is reviewed by the governance bodies.
7.2.2 Organisation of risk control
The process for controlling energy market risks for entities operationally controlled by the Group is based on:
a governance and market risk exposure measurement system, clearly separating management and risk control responsibilities;
an express delegation to each entity, defining hedging strategies and establishing the associated risk limits. This enables the Comex to set out and monitor an annual Group risk profile consistent with the financial objectives, and thus direct operational management of energy market risks over market horizons (generally 3 years).
Given its close interaction with the decisions made in the generation, supply and trading activities, this process involves Group management and is based on a risk indicator and measurement system incorporating escalation procedures in the event risk limits are exceeded.
The Group’s exposure to energy market risks through operationally controlled entities is reported to the Comex on a quarterly basis. The control processes are regularly evaluated and audited.
7.2.3 Principles for operational management and control of energy market risks
The principles for operational management and control of energy market risks for the Group’s operationally controlled entities are based on clearly-defined responsibilities for managing those risks, distinguishing between management of assets (generation and supply) and trading.
Managers of generation and supply assets are responsible for implementing a risk management strategy that minimises the impact of energy market risks on the variability of their financial statements (the accounting classifications of these hedges are described in note 41 to the 2015 consolidated financial statements). However, a residual risk remains that cannot be hedged on the market due to factors such as insufficient liquidity or market depth, uncertainty over volumes, etc.
Page 50 of 52
For operationally controlled entities in the Group, positions on the energy markets are taken predominantly by EDF Trading, the Group’s trading entity, which operates on the markets on behalf of other Group entities and for the purposes of its own trading activity associated with the Group’s industrial assets. Consequently, EDF Trading is subject to a strict governance and control framework, particularly the European regulations on trading companies.
EDF Trading trades on organised or OTC markets in derivatives such as futures, forwards, swaps and options (regardless of the accounting classification applied at Group level). Its exposure on the energy markets is strictly controlled through daily limit monitoring overseen by the subsidiary’s management and by the division in charge of energy market risk control at Group level. Automatic escalation procedures also exist to inform members of EDF Trading’s Board of Directors of any breach of risk limits (value at risk limit) or loss limits (stop-loss limits). Value at Risk (VaR) is a statistical measure of the potential maximum loss in market value on a portfolio in the event of unfavourable market movements, over a given time horizon and with a given confidence interval1. The stop-loss limit stipulates the acceptable risk for the trading business by setting a maximum level of loss over a rolling three-month period. If the limit is exceeded, EDF Trading’s Board of Directors takes appropriate action, which may include closing certain positions
In 2015, EDF Trading’s commitment on the markets was subject to a daily VaR limit of €36 million (with a daily confidence interval of 97.5%), and a stop-loss limit of €180 million2. The VaR and stop-loss limits were not exceeded in 2015, and EDF Trading’s risks remained within the limits of the mandate from EDF at all times. The stop-loss has never been triggered since its introduction.
At Edison, for operational purposes net exposure3 is calculated based on the entire portfolio of assets and contracts (industrial portfolio), and on assets and contracts related to its trading business for the company’s own purposes (trading portfolio). The level of economic capital engaged in the markets, expressed in terms of Profit at Risk (PaR)4 is then determined using this net exposure.
For an analysis of fair value hedges of the Group’s commodities, see note 41.5 to the 2015 consolidated financial statements. For details of commodity derivatives not classified as hedges by the Group, see note 42.3 to the same consolidated financial statements.
7.3 MANAGEMENT OF INSURABLE RISKS
The EDF group has an extensive insurance programme that covers EDF SA and its controlled subsidiaries as they are integrated. The coverage, exclusions, excesses and limits are appropriate to each business and the specificities of these subsidiaries.
The main insurance programmes cover:
Conventional damage to Group property: EDF is a member of the international mutual insurance company for energy operators, OIL5. Additional insurance coverage is provided by EDF’s captive insurance subsidiary Wagram Insurance Company Ltd.6, other insurers and reinsurers.
Damage to the EDF group’s nuclear facilities: In addition to coverage through EDF’s membership of OIL, physical damage (including following a nuclear accident) to EDF’s nuclear installations in France and EDF Energy’s nuclear facilities in the United Kingdom, and nuclear decontamination costs, are covered by a Group insurance policy involving the French nuclear pool (Assuratome), the British atomic pool National Risk Insurers (NRI), European Mutual Association for Nuclear Insurance (EMANI), and the insurer Northcourt.
In connection with CENG’s operations in the United States, EDF Inc. is a member of NEIL7.
Damage to merchandise transported.
1. EDF Trading estimates the VaR by the “Monte Carlo” method, which is based on volatilities and historical correlations measured using
observed market prices over the 40 most recent business days. The VaR limit applies to the total EDF Trading portfolio. 2. Five times the VaR: €180 million. 3. Net exposure is the residual exposure after using all natural hedging options provided by vertical and horizontal integration of the various
techniques. 4. Profit at Risk or PaR is a statistical measure of the maximum potential decline, related to unfavourable market movements, in the margin
compared to budget for a given time horizon and confidence interval. 5. Oil Insurance Limited. 6. An Irish insurance company fully-owned by EDF. 7. Nuclear Electric Insurance Limited.
Page 51 of 52
Nuclear operator’s civil liability: EDF’s current insurance policies comply with French Law n°.68-943 of 31 October 1968, as amended by Law n° 90-488 of 16 June 1990, which codified the civil liability obligations imposed on nuclear facility operators by the Paris Convention. To guarantee availability of the funds required to meet such obligations, EDF opted to use insurance policies with the insurance company AGCS (formerly called Allianz) and the mutual insurance company European Liability Insurance for the Nuclear Industry (ELINI).
For onsite accidents, total cover is €91.5 million per nuclear accident, for a maximum of two occasions per site within a three-year period. In accordance with the law, these insurance policies do not include an excess. However, Oceane Re, a Group reinsurance company, shares this risk through reinsurance agreements entered into with the insurers stated above.
The €91.5 million cover will be raised to €700 million from 18 February 2016 in line with the law of 17 August 2015 on the energy transition for green growth, which raises the ceilings for indemnities in the event of a nuclear accident (to €700 million for installations, €70 million for lower-risk installations and €80 million for transport), without extending the scope of liability.
Consequently, EDF put out a call for tenders in August 2015 to set up the appropriate coverage and related claim management.
In the United Kingdom, where EDF Energy operates nuclear plants, the liability scheme applicable to operators of nuclear facilities is similar to that in France. EDF Energy is insured to the extent of £140 million, the current limit for civil liability applicable to nuclear plant operators in the United Kingdom. Since 1 January 2014, this insurance has been provided by the European mutual insurance company ELINI and Wagram Insurance Company Ltd. Oceane Re is associated with this risk through the reinsurance contract issued to the benefit of Wagram Insurance Company Ltd.
In the United States, the specific Price-Anderson Act regime would apply in the event of a significant nuclear accident (above $300 million).
General civil liability: this programme covers the Group against the possible financial consequences for third parties of the (non-nuclear) risks inherent to the EDF group’s businesses.
Civil liability of directors and senior executives: EDF’s insurance programme covers defence costs and other financial consequences arising from third party claims against the Group’s managers and key executives, either individually or jointly, for any proven or alleged misconduct in the course of their duties.
Construction risks: for these risks, EDF takes out insurance policies covering specific worksite risks (general worksite risks/ general assembly risks). These policies are not part of a Group programme but are purchased on an ad hoc basis for major projects such as the Flamanville EPR, or construction of combined cycle power plants, dams, combustion turbines, etc. This cover is recorded as an investment in the EDF SA financial statements.
Exploration and production: Edison had a specific insurance policy providing damage and civil liability coverage worth €2.2 billion for these assets, both onshore and offshore. Through optimised use of EDF’s membership of OIL, Edison was able to construct a new specific “Exploration and Production” programme from 1 January 2013.
ERDF’s overhead distribution network: on 11 August 2011, ERDF took out a policy with Natixis/Swiss Re that runs until 5 May 2016 for coverage of its overhead distribution network against the consequences of exceptional events such as storms and gales. This “cat-bond” provided maximum cover of €150 million, with payouts based on a parametric index dependent on wind speed. It was redeemed early on 15 September 2015 in accordance with the conditions for ERDF trigger levels, as stipulated in the issuance contract for Pylon II Capital Ltd Catastrophe Bonds.
ERDF therefore put out a European call for tenders to select an arrangement, structuring and placement company to set up new cover for storm risks, through parametric insurance running for five winters.
In the meantime, on 25 September 2015 ERDF signed a “bridge policy” equivalent to Pylon II for the period 25 September 2015 to 30 April 2016, so that the network is insured against high-intensity gales and storms during that time.
The underlying Pylon II cover with €40 million capacity, which was signed on 16 November 2011, terminated on 27 December 2015. Until its storm cover is renewed, ERDF signed a “bridge cover” contract on 14 December 2015, providing equivalent coverage to the Pylon II underlying for the period 28 December 2015 to 30 April 2016. This reinforces the network insurance for storm and gale risks during that period.
The total value of premiums for all types of coverage provided by EDF’s insurance programmes and Group programmes managed by EDF Assurances was €154.3 million in 2015, excluding insurance covering people, and €17.5 million for coverage of ERDF’s overhead networks.

Page 52 of 52
8 TRANSACTIONS WITH RELATED PARTIES
The types of transaction undertaken with related parties are detailed in note 48 to the 2015 consolidated financial statements, “Related parties”.
9 SCOPE OF CONSOLIDATION
A list of all consolidated companies is presented in note 51 to the 2015 consolidated financial statements; “Scope of consolidation”.
10 PRINCIPAL RISKSAND UNCERTAINTIES
The principal risk factors to which the EDF Group considers itself exposed are presented in section 2 of the 2015 Reference Document.
The Group’s policies for risk management and control are described in section 2 of the 2015 Reference Document.
This presentation of the principal risks describes the major risks and uncertainties affecting the Group. The Group remains subject to the usual risks specific to its business.
11 FINANCIAL OUTLOOK
In challenging market conditions, EDF Group is adapting and responding to lower power prices and to increased competition by implementing strong management action. These actions include continuous improvement of nuclear output, reduction of operational expenditures, investments selectivity, the working capital requirement improvement plan, funding new development projects through disposals, and examining a new regulation in France.
Against this backdrop, the Group is announcing the following financial guidance for 2016:
EBITDA1: €16.3 – €16.8 billion;
Net financial debt/EBITDA: between 2x and 2.5x;
Pay-out ratio of net income excluding non-recurring items2: 55% to 65%.
EDF carries on with the roadmap, which allows it to confirm its ambition to reach positive cash flow after dividends3 excluding Linky in 2018.
In accordance with the December 2015 announcement, net investments will gradually decline, to reach a maximum amount of €10.5 billion in 2018, excluding new developments.
The investments associated to new developments will be financed by reallocating the proceeds from asset disposals.
The action plan also aims to continue improving working capital requirements, with an objective of €1.8 billion reduction by 2018.
1. At constant scope and exchange rate. 2. Adjusted for interest payments on hybrid issues booked in equity. 3. Excluding Linky and new developments net of asset disposals.