2015 half-year results - lloyds banking · pdf filelloyds banking group plc 2015 half-year...
TRANSCRIPT

2015 HALF-YEAR RESULTSNews Release

BASIS OF PRESENTATION This release covers the results of Lloyds Banking Group plc together with its subsidiaries (the Group) for the half-year ended 30 June 2015.
Statutory basis Statutory information is set out on pages 54 to 89. However, a number of factors have had a significant effect on the comparability of the Group’s financial position and results. As a result, comparison on a statutory basis of the 2015 results with 2014 is of limited benefit.
Underlying basis In order to present a more meaningful view of business performance, the results are presented on an underlying basis excluding items that in management’s view would distort the comparison of performance between periods. Based on this principle the following items are excluded from underlying profit:
– the amortisation of purchased intangible assets and the unwind of acquisition-related fair value adjustments;
– the effects of certain asset sales, the impact of liability management actions and the volatility relating to the Group’s own debt and hedging arrangements as well as that arising in the insurance businesses and insurance gross up;
– Simplification costs, which for 2015 are limited to severance costs relating to the programme announced in October 2014. Costs in 2014 include severance, IT and business costs relating to the programme started in 2011;
– TSB build and dual running costs and the loss relating to the TSB sale;
– payment protection insurance and other conduct provisions; and
– certain past service pensions credits or charges in respect of the Group’s defined benefit pension arrangements.
Unless otherwise stated, income statement commentaries throughout this document compare the half-year ended 30 June 2015 to the half-year ended 30 June 2014, and the balance sheet analysis compares the Group balance sheet as at 30 June 2015 to the Group balance sheet as at 31 December 2014.
Segment information and TSB On 24 March 2015 the Group sold a 9.99 per cent interest in TSB reducing its holding to 40 per cent. This sale resulted in a loss of control over TSB and its deconsolidation. Accordingly, the Group’s results in 2015 include TSB for the first quarter only. To facilitate meaningful period-on-period comparison, the operating results of TSB have been reported separately within underlying profit in all periods. Amounts receivable by the Group in respect of the sale of TSB are included within ‘Other assets’ on the Group balance sheet as at 30 June 2015.
FORWARD LOOKING STATEMENTS
This document contains certain forward looking statements with respect to the business, strategy and plans of Lloyds Banking Group and its current goals and expectations relating to its future financial condition and performance. Statements that are not historical facts, including statements about Lloyds Banking Group’s or its directors’ and/or management’s beliefs and expectations, are forward looking statements. By their nature, forward looking statements involve risk and uncertainty because they relate to events and depend upon circumstances that will or may occur in the future. Factors that could cause actual business, strategy, plans and/or results to differ materially from the plans, objectives, expectations, estimates and intentions expressed in such forward looking statements made by the Group or on its behalf include, but are not limited to: general economic and business conditions in the UK and internationally; market related trends and developments; fluctuations in exchange rates, stock markets and currencies; the ability to access sufficient sources of capital, liquidity and funding when required; changes to the Group’s credit ratings; the ability to derive cost savings; changing customer behaviour including consumer spending, saving and borrowing habits; changes to borrower or counterparty credit quality; instability in the global financial markets, including Eurozone instability, the potential for one or more countries to exit the Eurozone or European Union (EU) (including the UK as a result of a referendum on its EU membership) and the impact of any sovereign credit rating downgrade or other sovereign financial issues; technological changes and risks to cyber security; pandemic, natural and other disasters, adverse weather and similar contingencies outside the Group’s control; inadequate or failed internal or external processes or systems; acts of war, other acts of hostility, terrorist acts and responses to those acts, geopolitical, pandemic or other such events; changes in laws, regulations, accounting standards or taxation, including as a result of further Scottish devolution; changes to regulatory capital or liquidity requirements and similar contingencies outside the Group’s control; the policies, decisions and actions of governmental or regulatory authorities in the UK, the EU, the US or elsewhere including the implementation of key legislation and regulation; the ability to attract and retain senior management and other employees; requirements or limitations imposed on the Group as a result of HM Treasury’s investment in the Group; actions or omissions by the Group’s directors, management or employees including industrial action; changes to the Group’s post-retirement defined benefit scheme obligations; the provision of banking operations services to TSB Banking Group plc; the extent of any future impairment charges or write-downs caused by, but not limited to, depressed asset valuations, market disruptions and illiquid markets; the value and effectiveness of any credit protection purchased by the Group; the inability to hedge certain risks economically; the adequacy of loss reserves; the actions of competitors, including non-bank financial services and lending companies; and exposure to regulatory or competition scrutiny, legal, regulatory or competition proceedings, investigations or complaints. Please refer to the latest Annual Report on Form 20-F filed with the US Securities and Exchange Commission for a discussion of certain factors together with examples of forward looking statements. Except as required by any applicable law or regulation, the forward looking statements contained in this document are made as of today’s date, and Lloyds Banking Group expressly disclaims any obligation or undertaking to release publicly any updates or revisions to any forward looking statements.
CONTENTS
Page
Key highlights 1
Consolidated income statement 2
Balance sheet and key ratios 2
Summary consolidated balance sheet 3
Group Chief Executive’s statement 4
Chief Financial Officer’s review of financial performance 7
Underlying basis segmental analysis 13
Underlying basis quarterly information 14
Divisional highlights
Retail 15
Commercial Banking 17
Consumer Finance 19
Insurance 21
Run-off and Central items 24
Additional information
Reconciliation between statutory and underlying basis results 25
Banking net interest margin 26
Volatility arising in insurance businesses 26
Number of employees 27
Risk management 28
Principal risks and uncertainties 28
Credit risk portfolio 30
Funding and liquidity management 42
Capital management 47
Statutory information 54
Primary statements
Consolidated income statement 55
Consolidated statement of comprehensive income 56
Consolidated balance sheet 57
Consolidated statement of changes in equity 59
Consolidated cash flow statement 62
Notes 63
Contacts 93

LLOYDS BANKING GROUP PLC 2015 HALF-YEAR RESULTS
Page 1 of 93
RESULTS FOR THE HALF-YEAR ‘Today’s results demonstrate the strong progress we have made in the first half of the year. The improvement in our
profitability and capital position has enabled the Group to announce an interim dividend payment of 0.75 pence per share
to our shareholders. We remain focused on our aim to become the best bank for customers and shareholders while at
the same time supporting the UK economy.’
António Horta-Osório
Group Chief Executive Improvement in underlying and statutory profit with balance sheet further strengthened
Underlying profit of £4,383 million, an increase of 15 per cent on the first half of 2014
Total income up 2 per cent to £8,968 million1
− Net interest income of £5,715 million, up 6 per cent, primarily driven by margin improvement to 2.62 per cent
− Other income lower at £3,253 million, largely due to disposals and run-off, but up 4 per cent in last quarter
Operating costs flat after increased investment; cost:income ratio improved by 0.7 percentage points to 48.3 per cent
Impairment charge down 75 per cent to £179 million; asset quality ratio improved 21 basis points to 0.09 per cent
Underlying return on required equity of 16.2 per cent, up 2.2 percentage points on the first half of 2014
Statutory profit before tax up 38 per cent to £1,193 million (2014: £863 million), including charge of £1,400 million for
PPI and £660 million charge relating to the disposal of TSB
Statutory return on required equity of 3.7 per cent, up 0.6 percentage points on the first half of 2014
Strong balance sheet and liquidity position with a CET1 ratio of 13.3 per cent (31 Dec 2014: 12.8 per cent); a total
capital ratio of 21.7 per cent; and a leverage ratio of 4.9 per cent
Tangible net assets per share post dividend of 53.5 pence (31 Dec 2014: 54.9 pence) Continued focus on supporting customers and the UK economy through the successful delivery of our strategy
Creating the best customer experience through multi-channel, multi-brand strategy and increased investment in
digital; key customer satisfaction metrics continue to improve, with net promoter scores up 3 points this year and by
60 per cent since 2010
Continue to become simpler and more efficient through process redesign and automation; run-rate savings of
£225 million in the new Simplification programme and we remain on track to deliver the targeted savings of £1 billion
by the end of 2017
Delivering sustainable growth in key customer segments over last 12 months
− Meeting our Helping Britain Prosper Plan commitments by supporting 1 in 4 first-time buyers and 1 in 5 new
business start-ups
− Net lending of £1.5 billion to SMEs, up 5 per cent and ahead of the market
− UK Consumer Finance lending growth of 17 per cent, with 34 per cent growth in motor finance
Completion of sale of TSB to Banco Sabadell will enable the Group to meet its commitment to the European
Commission ahead of the mandated deadline
UK government stake reduced to less than 15 per cent (as at 15 July 2015) Guidance for 2015 net interest margin and asset quality ratio improved with other guidance reconfirmed
Net interest margin for the full year improved to around 2.60 per cent
Full year asset quality ratio improved to around 15 basis points (previously around 25 basis points)
Continue to expect other income to be broadly stable in 2015
Continue to expect full year cost:income ratio to be lower than full year 2014 ratio of 49.8 per cent Dividend
Interim dividend of 0.75 pence per share amounting to £535 million
Further guidance on capital and dividend policy
1 Total income, operating costs and impairment exclude TSB.

LLOYDS BANKING GROUP PLC 2015 HALF-YEAR RESULTS
Page 2 of 93
CONSOLIDATED INCOME STATEMENT − UNDERLYING BASIS
Half-yearto 30 June
2015
Half-year to 30 June
2014 Change
%
Half-year to 31 Dec
2014 Change
% £ million £ million £ million
Net interest income 5,715 5,404 6 5,571 3
Other income 3,253 3,376 (4) 3,091 5
Total income 8,968 8,780 2 8,662 4
Operating costs (4,150) (4,134) − (4,188) 1
Operating lease depreciation (374) (346) (8) (374) −
Costs (4,524) (4,480) (1) (4,562) 1
Impairment (179) (707) 75 (395) 55
Underlying profit excluding TSB 4,265 3,593 19 3,705 15
TSB 118 226 232
Underlying profit 4,383 3,819 15 3,937 11
Asset sales and other items (578) (1,028) (317)
Simplification costs (32) (519) (447)
TSB costs (745) (309) (249)
Payment Protection Insurance provision (1,400) (600) (1,600)
Other conduct provisions (435) (500) (425)
Profit before tax – statutory 1,193 863 38 899 33
Taxation (268) (164) (99)
Profit for the period 925 699 32 800 16
Underlying earnings per share 4.6p 4.1p 0.5p 4.0p 0.6p
Earnings per share 1.0p 0.8p 0.2p 0.9p 0.1p Banking net interest margin1 2.62% 2.35% 27bp 2.45% 17bp
Cost:income ratio2 48.3% 49.0% (0.7)pp 50.5% (2.2)pp
Asset quality ratio1 0.09% 0.30% (21)bp 0.17% (8)bp
Return on risk-weighted assets 3.78% 2.90% 88bp 3.14% 64bp
Return on assets 1.05% 0.92% 13bp 0.92% 13bp
Underlying return on required equity 16.2% 14.0% 2.2pp 13.3% 2.9pp
Statutory return on required equity 3.7% 3.1% 0.6pp 2.9% 0.8pp
BALANCE SHEET AND KEY RATIOS
At 30 June
2015 At 31 Dec
2014 Change
% Loans and advances to customers3 £452bn £478bn (5)
Customer deposits £417bn £447bn (7)Loan to deposit ratio 109% 107% 2pp
Common equity tier 1 ratio 13.3% 12.8% 0.5pp
Transitional total capital ratio 21.7% 22.0% (0.3)pp Risk-weighted assets £227bn £240bn (5)Leverage ratio 4.9% 4.9% −
Tangible net assets per share 53.5p 54.9p (1.4)p
1 Excluding TSB. 2 Operating lease depreciation deducted from income and costs and excluding TSB. 3 Excludes reverse repos of £0.1 billion (31 December 2014: £5.1 billion).

LLOYDS BANKING GROUP PLC 2015 HALF-YEAR RESULTS
Page 3 of 93
SUMMARY CONSOLIDATED BALANCE SHEET
At 30 June
2015 At 31 Dec
2014 Assets £ million £ million
Cash and balances at central banks 67,687 50,492
Trading and other financial assets at fair value through profit or loss 147,849 151,931
Derivative financial instruments 27,980 36,128
Loans and receivables:
Loans and advances to customers 452,427 482,704
Loans and advances to banks 23,548 26,155
Debt securities 1,569 1,213
477,544 510,072
Available-for-sale financial assets 32,173 56,493
Held-to-maturity investments 19,960 −
Other assets 49,639 49,780
Total assets 822,832 854,896
Liabilities
Deposits from banks 16,966 10,887
Customer deposits 416,595 447,067
Trading and other financial liabilities at fair value through profit or loss 63,328 62,102
Derivative financial instruments 27,778 33,187
Debt securities in issue 77,776 76,233
Liabilities arising from insurance and investment contracts 107,604 114,486
Subordinated liabilities 22,639 26,042
Other liabilities 42,105 34,989
Total liabilities 774,791 804,993
Shareholders’ equity 42,256 43,335
Other equity instruments 5,355 5,355
Non-controlling interests 430 1,213
Total equity 48,041 49,903
Total liabilities and equity 822,832 854,896

LLOYDS BANKING GROUP PLC 2015 HALF-YEAR RESULTS
Page 4 of 93
GROUP CHIEF EXECUTIVE’S STATEMENT
The first half of 2015 saw us make further progress in the next phase of our strategic journey to become the best bank
for customers and shareholders. We have delivered significant improvements in both underlying and statutory
profitability, while at the same time strengthening the balance sheet, improving our customers’ experiences and
continuing to support and benefit from UK economic growth.
Financial performance and balance sheet strength
Underlying profit increased 15 per cent to £4,383 million, compared with the first half of 2014, driven by increased
income, flat costs and lower impairment charges. This led to an increase in our underlying return on required equity
which increased to 16.2 per cent. The Group reported a statutory profit before tax of £1,193 million, up 38 per cent, and
our statutory return on required equity increased to 3.7 per cent, despite the additional £1,400 million taken for Payment
Protection Insurance (PPI) and the impact of TSB, amounting to £660 million. The additional provision for PPI is
disappointing. It mostly reflects higher than expected reactive complaints with higher associated redress and is covered
in more detail in the Chief Financial Officer’s review of financial performance.
During the year we also continued to strengthen our balance sheet position with a common equity tier 1 ratio of 13.3 per
cent post dividend. Our capital ratios also remain among the strongest of our major banking peers worldwide.
We are a low-risk bank, and the continued reduction in our asset quality ratio and gross impaired loans reflects this
ongoing focus. Our progress is also reflected in our credit default swap spread which has reduced from over 300 basis
points at the end of 2011 to 55 basis points as of mid-July, making it the best amongst major banks within the UK
banking sector. The successful transformation of the Group’s risk profile in the last few years is now also being widely
recognised, and in the first six months, Fitch, Moody’s and Standard & Poor’s have all either reaffirmed or upgraded the
Bank’s credit ratings.
Regulatory environment
The Group is well positioned in an evolving regulatory environment, which is placing greater emphasis on protecting
consumers and small business customers. The Treasury and the Prudential Regulation Authority are working towards
creating a stable and safer banking sector, without exposing taxpayers to the unacceptable costs of banks failing in a
disorderly manner. The principles of ring-fencing are entirely appropriate as sustainable retail and commercial banking is
paramount to the success of the UK economy and capital requirements would certainly have to increase further, should
ring-fencing not be implemented. Given that we are a UK focused retail and commercial bank, the vast majority of our
business will be within the ring-fence.
Strategic progress
In October 2014 we outlined three strategic priorities to take us through to the end of 2017: creating the best customer
experience; becoming simpler and more efficient; and delivering sustainable growth.
Creating the best customer experience
Our multi-brand, multi-channel approach allows us to meet customer needs more effectively. By offering products
through our respected brands including Lloyds Bank, Halifax, Bank of Scotland and Scottish Widows and a range of
channels including our branch networks, our telephone banking services and our digital propositions, customers can
interact with us when and how they wish, which is why our multi-channel approach remains key to our strategy.
We are adapting to the digital revolution and today we have more than 11 million online users and nearly 6 million mobile
users. This provides significant opportunities for serving our customers in new and more efficient ways. Earlier this year
we launched our Halifax Motor Finance offer, the market’s first direct-to-consumer secured car finance proposition,
providing a simple hire purchase and personal contract purchase offering via our digital channels. Halifax also launched
‘snap to switch’, a service that allows prospective customers to move their current account by taking a photo of their debit
card with a smartphone or tablet and then sending it to the bank. Meanwhile, Lloyds Bank launched an online Eligibility
Checker which customers can use to find out how likely they are to be accepted for a current account and overdraft
without affecting their credit profile. In addition, we continue to streamline our processes and have reduced the average
intermediary mortgage application to offer time from around 25 days to 14 days.

LLOYDS BANKING GROUP PLC 2015 HALF-YEAR RESULTS
Page 5 of 93
GROUP CHIEF EXECUTIVE’S STATEMENT (continued)
Our progress in creating the best customer experience has been reflected in higher net promoter scores in the first six
months, having increased by 60 per cent since 2010. Group reportable banking complaints (excluding PPI), have
reduced significantly over the same period and are now approximately 50 per cent lower than the average of our major
banking peers.
Becoming simpler and more efficient
We have continued to increase our investment in IT in the first half, resulting in simpler, more efficient processes, more
resilient systems and better digital experiences for our customers as well as cost reductions for the Group. In the first six
months of the year we have delivered run-rate savings of £225 million through our new Simplification programme as we
continue to work towards our target of achieving a further £1 billion of savings by the end of 2017. These reductions,
together with our strong underlying financial performance have resulted in further strengthening of our already
market-leading cost:income ratio, which is now 48.3 per cent, providing us with strategic differentiation and competitive
advantage.
Delivering sustainable growth
We remain the largest provider of mortgages to first-time buyers and have helped 1 in 4 customers to get on the housing
ladder in the first half of the year. We have also continued to lend to our other key customer segments, including
approximately £1 billion to SMEs, where our growth outstrips the market overall. Since our first strategic review in 2011,
our SME net lending has increased by 23 per cent while the market has fallen by 16 per cent. In the first half, we have
also continued to see strong growth in Consumer Finance.
Government stake and TSB sale
This strategic progress, along with our strong financial performance, has enabled the UK government to make further
substantial progress in returning the Group to full private ownership. Following the announcement in December 2014 of a
trading plan to carry out a measured and orderly sell down of shares, the government’s holding is now less than 15 per
cent, around a third of its original stake. Furthermore, the completion of the sale of our interest in TSB to Banco Sabadell
represents the continued delivery of our commitment to the European Commission under the terms of the state aid
agreement.
Dividend
Following the resumption of dividend payments at the 2014 full year, today we are announcing an interim dividend of
0.75 pence per share. Our aim is to have a dividend policy that is both progressive and sustainable, and as previously
indicated, we expect ordinary dividends to increase over the medium term with a dividend payout ratio of at least 50 per
cent of sustainable earnings.
In addition, going forward the Board will give due consideration, subject to the circumstances at the time, to the
distribution of surplus capital through the use of special dividends or share buy-backs. Surplus capital represents capital
over and above the amount management wish to retain to grow the business, meet regulatory requirements and cover
uncertainties. The amount of retained capital is likely to vary from time to time depending on circumstances, but is
currently around 12 per cent plus an amount broadly equivalent to a further year’s ordinary dividend.
Helping Britain Prosper and delivering growth in our key customer segments
2015 is a milestone year for the Group in which we commemorate the 250th anniversary of Lloyds Bank and the 200th
anniversary of Scottish Widows. We have supported the households, businesses and communities of Britain successfully
for 250 years and remain focused on becoming the best bank for customers and continuing to help the people,
businesses and communities of Britain to prosper. This is embodied in our Helping Britain Prosper plan, which was
reshaped earlier this year to keep it relevant to the business and our stakeholders.
As a UK centric bank, our future is inextricably linked to the success of the UK economy. The economy is steadily
continuing to recover, with GDP growing, low unemployment, and consumer confidence increasing. The sustainability of
the recovery is further evidenced with consumers spending more but household debt as a proportion of disposable
income reducing. UK house prices continue to recover and against this backdrop, bank base rates are expected to rise
slowly.

LLOYDS BANKING GROUP PLC 2015 HALF-YEAR RESULTS
Page 6 of 93
GROUP CHIEF EXECUTIVE’S STATEMENT (continued) In our Retail division, as well as maintaining leadership in the first-time buyer market, we remain the largest lender in the
UK government’s Help to Buy scheme, lending £2.5 billion since launch. We have also supported 1 in 5 new business
start-ups via the Retail Business Banking segment.
Commercial Banking continues to take a lead role in supporting the UK economy recovery. SME lending has grown
5 per cent in a contracting market, and we remain a leading participant in the Funding for Lending scheme, having
reported the largest increase in net lending to SMEs under the scheme in the first quarter. We have also maintained our
lending to Mid Market clients in a declining market. We continued to expand our Environmental, Social and Governance
(ESG) programme by issuing our second ESG bond and an ESG term deposit to finance SMEs, healthcare providers
and renewable energy projects in the most economically disadvantaged areas of the UK.
We have built on the strong progress made in 2014 by Consumer Finance with UK loan growth of 17 per cent over the
last 12 months. This has been delivered through new business growth of 34 per cent in motor finance supported by the
Jaguar Land Rover partnership and strong underlying business performance, as well as growth of 5 per cent in the credit
cards business.
Our Insurance business is a market leader for corporate pensions and, following the roll out of compulsory workplace
pensions, assets under management increased £1.4 billion to £28.4 billion. During the first half of the year, the division
completed a bulk annuity transaction with the Scottish Widows With-Profits fund, representing the first stage of plans to
participate in the defined benefit pension scheme de-risking market. In addition, we launched a new retirement planning
website to inform and educate customers about the options and choices available to them in retirement.
As well as providing ongoing support to our communities through our commitment to the Helping Britain Prosper Plan,
we also achieved a milestone for our Charity of the Year, BBC Children in Need, by raising over £1 million.
Building the best team
We recognise the importance of colleague engagement and the impact this has on our ability to deliver for our
customers. The latest colleague survey results show that employee engagement is at its highest level ever with all Group
scores increasing over the last 12 months. This provides strong evidence of progress in embedding a customer-focused
culture, and our colleagues are increasingly engaged with our aim of becoming the best bank for customers.
Rebuilding trust
Rebuilding customer trust remains a key imperative for the business. Regrettably, the UK banking sector is still being
impacted by conduct issues, including litigation and PPI. We reached a settlement with the Financial Conduct Authority in
June in relation to aspects of our past PPI complaint handling processes. We are fully committed to improving our
operational procedures and ensuring we do the right thing for our customers.
In support of rebuilding customer trust, we have continued to transform the corporate culture and have completely
overhauled the performance and reward framework for our customer-facing colleagues, with performance now
predominantly assessed on the basis of customer feedback.
We have also strengthened the control environment through changes to our organisational design and the introduction of
new processes across the Group to assess and monitor our risk appetite. While these improvements have been
essential in helping us to rebuild customer trust, we recognise there is more to do.
Summary and outlook
The continued improvement in financial performance and strong start to the next phase of our strategic journey in the first
six months of the year position us well for the future, despite the uncertainties around the economic, regulatory,
competitive and political environment. We believe we are well placed to become the best bank for our customers while
delivering strong and sustainable returns for our shareholders and supporting the UK economic recovery.
António Horta-Osório
Group Chief Executive

LLOYDS BANKING GROUP PLC 2015 HALF-YEAR RESULTS
Page 7 of 93
CHIEF FINANCIAL OFFICER’S REVIEW OF FINANCIAL PERFORMANCE Overview: strong underlying profitability and balance sheet
The Group’s underlying profit increased by 15 per cent in the first half of the year to £4,383 million, driven by a 2 per cent
increase in income and a 75 per cent improvement in impairments, with operating costs flat despite increased investment
in the business. Statutory profit before tax was £1,193 million, up 38 per cent from £863 million in 2014. This was after a
charge of £660 million relating to the disposal of TSB as well as provisions for PPI totalling £1,400 million.
Total loans and advances to customers were £452 billion at 30 June 2015, 5 per cent lower than at 31 December 2014.
Similarly, customer deposits of £417 billion at 30 June 2015 were 7 per cent lower than at 31 December 2014, with both
of these trends principally reflecting the sale of TSB. Excluding TSB, loans and advances were 1 per cent lower,
principally driven by reductions in the run-off portfolio. Customer deposits on an equivalent basis were also down 1 per
cent, with increases in Commercial Banking more than offset by reductions in retail tactical deposits and online deposits
within Consumer Finance.
The combination of strong underlying profitability and a 5 per cent reduction in risk-weighted assets resulted in a further
improvement in the Group’s common equity tier 1 ratio to 13.3 per cent at 30 June 2015 (31 December 2014: 12.8 per
cent) after the 0.2 per cent impact of the interim dividend. The leverage ratio post dividend was maintained at 4.9 per
cent (31 December 2014: 4.9 per cent). Tangible net asset value per share decreased to 53.5 pence with underlying
profit more than offset by the impact of the sale of TSB, conduct provisions, adverse reserve movements and the
payment of the 2014 dividend.
Total income
Half-yearto 30 June
2015
Half-year to 30 June
2014 Change
Half-year to 31 Dec
2014
Change £ million £ million % £ million %
Net interest income 5,715 5,404 6 5,571 3
Other income 3,253 3,376 (4) 3,091 5
Total income 8,968 8,780 2 8,662 4
Banking net interest margin 2.62% 2.35% 27bp 2.45% 17bp
Banking net interest margin incl. TSB 2.65% 2.40% 25bp 2.49% 16bp
Average interest-earning banking assets £444.8bn £465.6bn (4) £456.7bn (3)
Average interest-earning banking assets incl. TSB £455.6bn £488.7bn (7) £478.8bn (5)
Total income of £8,968 million was 2 per cent higher than in the first half of 2014, reflecting strong growth in net interest
income, which more than offset a reduction in other income.
Net interest income increased 6 per cent to £5,715 million, largely driven by the continued improvement in net interest
margin. The net interest margin of 2.62 per cent strengthened by 27 basis points compared to the first half of 2014 and
by 17 basis points compared to the second half of 2014, with the continued pressure on asset prices more than offset by
improved deposit pricing, lower funding costs, and the disposal of lower margin run-off assets.
In light of the strong trend in the first half and our future expectations, we have improved our net interest margin guidance
for the 2015 full year to around 2.60 per cent.
Other income was 4 per cent lower at £3,253 million, principally reflecting a £155 million reduction from disposals and the
run-off portfolio. The continued pressure in Retail due to changes in the regulatory environment has been more than
offset by an improved performance in the other divisions. Insurance benefited from our entry into the bulk annuity market
and the absence of the one-off charge relating to the corporate pensions fee cap, which affected the prior year result. In
light of the 4 per cent increase in other income between the first and second quarters, the Group continues to expect
other income to be broadly stable in 2015.

LLOYDS BANKING GROUP PLC 2015 HALF-YEAR RESULTS
Page 8 of 93
CHIEF FINANCIAL OFFICER’S REVIEW OF FINANCIAL PERFORMANCE (continued)
Costs
Half-yearto 30 June
2015
Half-year to 30 June
2014 Change
Half-year to 31 Dec
2014
Change £ million £ million % £ million %
Operating costs 4,150 4,134 − 4,188 1
Operating lease depreciation 374 346 (8) 374 −
Costs 4,524 4,480 (1) 4,562 1
Cost:income ratio1 48.3% 49.0% (0.7)pp 50.5% (2.2)pp 1 Operating lease depreciation deducted from income and costs.
Operating costs of £4,150 million were flat against the same period of 2014, with £276 million of incremental savings
from the Simplification programmes and £79 million of reductions from business disposals, offset by pay and inflation of
£54 million and a £191 million increase in investment in the business and £126 million of other costs.
The next phase of the Simplification programme has delivered £225 million of run-rate savings as at 30 June 2015
towards our target of £1 billion by the end of 2017.
The cost:income ratio of 48.3 per cent in the first half has improved compared with the first half of 2014 (49.0 per cent),
reflecting the combined effect of higher income and a stable operating cost base as we continue to manage our cost
base tightly. We continue to target year-on-year reductions in our market-leading cost:income ratio, which was 49.8 per
cent for the full year 2014. Impairment
Half-yearto 30 June
2015
Half-year to 30 June
2014 Change
Half-year to 31 Dec
2014
Change £ million £ million % £ million %
Ongoing business impairment charge 211 383 45 516 59
Run-off impairment charge (32) 324 − (121) (74)
Total impairment charge 179 707 75 395 55
Asset quality ratio 0.09% 0.30% (21)bp 0.17% (8)bp
Impaired loans as a % of advances 2.7% 5.1% (2.4)pp 2.9% (0.2)pp
The impairment charge was £179 million, 75 per cent lower than in the same period of 2014, driven by a significant
reduction in run-off business and improvements in all banking divisions. This improvement reflects the result of effective
risk management, improving economic conditions and the continued low interest rate environment. As in prior periods,
the net charge has also benefited from significant provision releases, although these were lower than the level seen in
the first half of 2014. The asset quality ratio in the first half was 0.09 per cent.
Given the low impairment charge and future expectations, we have improved our asset quality ratio guidance for the
2015 full year to around 15 basis points (previously around 25 basis points).
Impaired loans as a percentage of closing advances fell from 2.9 per cent at 31 December 2014 to 2.7 per cent, driven
by reductions within both Commercial Banking and the run-off portfolios. Provisions as a percentage of impaired loans
fell from 56.4 per cent to 55.1 per cent over the same period, reflecting the reduction in highly impaired assets.
On 30 July the Group announced the sale of a portfolio of Irish commercial loans. The pro forma impact of this sale
would be to reduce the impaired loans as a percentage of closing advances from 2.7 per cent at 30 June to 2.2 per cent
and to reduce the provisions as a percentage of impaired loans from 55.1 per cent at 30 June to 48.3 per cent.

LLOYDS BANKING GROUP PLC 2015 HALF-YEAR RESULTS
Page 9 of 93
CHIEF FINANCIAL OFFICER’S REVIEW OF FINANCIAL PERFORMANCE (continued) Statutory profit
Statutory profit before tax was £1,193 million compared to a pre-tax profit of £863 million in the first half of 2014. More
detailed information on the reconciliation of underlying to statutory results is included on page 25.
Half-yearto 30 June
2015
Half-year to 30 June
2014 Change
Half-year to 31 Dec
2014
Change £ million £ million % £ million %
Underlying profit 4,383 3,819 15 3,937 11
Asset sales and other items:
Asset sales and volatility (337) (1,252) 62
Fair value unwind (77) (315) (214)
Other items (164) 539 (165)
(578) (1,028) (317)
Simplification costs (32) (519) (447)
TSB:
Build and dual running costs (85) (309) (249)
Charge relating to disposal (660) − −
(745) (309) (249)
Payment protection insurance provision (1,400) (600) (1,600)
Other conduct provisions (435) (500) (425)
Profit before tax – statutory 1,193 863 38 899 33
Taxation (268) (164) (99)
Profit for the period 925 699 32 800 16
Asset sales and other items
The charge of £337 million for asset sales and volatility in the first half was largely driven by a £390 million reduction in
the value of the Enhanced Capital Notes (ECN) embedded derivative, reflecting the change in value of the associated
equity conversion feature. Asset sales and volatility in the first half of 2014 included the net loss of £1,136 million relating
to the exchange of ECNs for Additional Tier 1 securities, partly offset by the £122 million gain on the disposal of Scottish
Widows Investment Partnership.
The fair value unwind of £77 million was significantly lower than the equivalent figure of £315 million, reflecting the
accelerated amortisation of a fair value adjustment.
The charge for other items of £164 million related to the amortisation of purchased intangibles. The equivalent charge of
£171 million in the first half of 2014 was offset by £710 million of gains relating to the changes made to the Group’s
defined benefit pension schemes.
TSB
The Group’s results in 2015 include TSB for the first quarter only following the agreement in March to sell our remaining
stake in the business to Banco Sabadell. The charge of £660 million relating to this sale reflects the net costs of the
Transitional Service Agreement between the Group and TSB, the contribution to be provided by the Group to TSB in
migrating to an alternative IT platform and the gain on sale. The sale to Banco Sabadell has now completed following the
receipt of all regulatory and other approvals.

LLOYDS BANKING GROUP PLC 2015 HALF-YEAR RESULTS
Page 10 of 93
CHIEF FINANCIAL OFFICER’S REVIEW OF FINANCIAL PERFORMANCE (continued)
PPI
The Group increased the provision for expected PPI costs by a further £1.4 billion in the first half of 2015. This brings the
total amount provided to £13.4 billion, of which £2.2 billion remains unutilised. The unutilised provision comprises
elements to cover the Past Business Review (PBR), remediation activity and future reactive complaints including
associated administration costs.
Our Past Business Review activity is nearing completion, with no further provisions taken in the first half. We have mailed
98 percent of the total PBR scope and the remaining 2 per cent of customers are expected to be mailed by the end
of 2015.
We continue to progress with remediation. At the end of 2014, we had identified approximately 1.2 million previously
defended and redressed cases for re-review. During the first half the scope of the programme has been extended by 0.2
million to approximately 1.4 million cases. We have now completed the review of 96 per cent of previously defended
cases, which were prioritised given their complexity and the level of potential redress required. The remaining scope,
including the review of previously redressed cases, is expected to be substantially completed by the end of the year. The
changes in the scope of the programme, together with higher overturn and redress rates, has resulted in an additional
provision of approximately £0.4 billion in the second quarter.
The volume of reactive PPI complaints in the first half of 2015 fell by 8 per cent compared with the first half of 2014, but
was marginally higher than the fourth quarter 2014 run-rate and above expectations. Reactive complaints continue to be
driven by Claims Management Company (CMC) activity. Higher than expected average redress, coupled with the revised
forecast of complaint volumes and associated operational costs accounts for £1.0 billion of the provision taken in the
second quarter.
The cash payment in the first half of 2015 was £1.7 billion and included remediation and PBR payments. As indicated,
the PBR and remediation programmes are expected to be substantially complete by the end of this year, slightly later
than originally envisaged. The monthly run-rate spend of these programmes is expected to reduce significantly from the
current level of around £140 million to around £30 million at the end of this year with an associated reduction in
operating costs.
A number of risks and uncertainties remain, in particular in respect of complaint volumes, which are primarily driven by
CMC activity. The current provision assumes a significant decrease in reactive complaint volumes over the next
18 months, compared with trends in recent quarters. If this decline is delayed by six months and reactive complaints
remain at the same level as the first half of 2015, this would lead to an additional provision of approximately £1.0 billion
at the end of the year; a similar level of provisioning would be required for each six months of flat complaint volumes in
2016.
Other conduct provisions
In the first half of 2015, the Group incurred a further charge of £435 million in respect of a number of matters affecting the
Retail, Commercial Banking and Consumer Finance divisions. Within this total, £318 million of provisions related to
potential claims and remediation in respect of products sold through the branch network and continuing investigation of
matters highlighted through industry wide regulatory reviews, as well as legacy product sales and historical systems and
controls such as those governing legacy incentive schemes. This includes £175 million in respect of complaints relating
to Packaged Bank Accounts. In addition, the charge included the previously announced settlement of £117 million that
the Group reached with the Financial Conduct Authority with regard to aspects of its PPI complaint handling process
during the period March 2012 to May 2013.
Taxation
The tax charge for the first half of 2015 was £268 million, representing an effective tax rate of 22.5 per cent.
Following recent tax changes, we now expect our medium term tax rate to be around 30 per cent.

LLOYDS BANKING GROUP PLC 2015 HALF-YEAR RESULTS
Page 11 of 93
CHIEF FINANCIAL OFFICER’S REVIEW OF FINANCIAL PERFORMANCE (continued)
Return on equity
Half-yearto 30 June
2015
Half-year to 30 June
2014 Change
Half-year to 31 Dec
2014
Change
Underlying return on required equity 16.2% 14.0% 2.2pp 13.3% 2.9pp
Statutory return on required equity 3.7% 3.1% 0.6pp 2.9% 0.8pp
The underlying return on required equity of 16.2 per cent and statutory return on required equity of 3.7 per cent have
both improved significantly compared to both the first and the second half of 2014, reflecting the strong growth in
underlying profit and the higher statutory profit.
Funding, liquidity and capital ratios At 30 June
2015 At 31 Dec
2014 Change
%
Wholesale funding £116bn £116bn −
Wholesale funding <1 year maturity £39bn £41bn (5)
Of which money-market funding <1 year maturity1 £20bn £19bn 5
Loan to deposit ratio 109% 107% 2pp
Primary liquid assets £109bn £109bn −
Common equity tier 1 capital ratio2 13.3% 12.8% 0.5pp
Transitional tier 1 capital ratio 16.8% 16.5% 0.3pp
Transitional total capital ratio 21.7% 22.0% (0.3)pp
Leverage ratio 4.9% 4.9% −
Risk-weighted assets £227bn £240bn (5)
Shareholders’ equity £42bn £43bn (2) 1 Excludes balances relating to margins of £1.9 billion (31 December 2014: £2.8 billion) and settlement accounts of £1.4 billion
(31 December 2014: £1.4 billion). 2
Common equity tier 1 ratio is the same on both fully loaded and transitional bases.
Wholesale funding has remained stable at £116 billion, of which £39 billion, or 34 per cent, has a maturity of less than
one year (31 December 2014: £41 billion, representing 35 per cent). The Group’s total wholesale funding remains
broadly matched by its strong primary liquid asset portfolio, which is unchanged at £109 billion.
The Group continued to strengthen its capital position, with the common equity tier 1 (CET1) ratio post dividend
increasing from 12.8 per cent to 13.3 per cent in the first half, after a net 0.3 percentage point decrease as a result of the
TSB disposal, of which 0.2 percentage points was recognised in the first quarter. The overall improvement in the ratio
was driven by a combination of underlying profit and a reduction in risk-weighted assets, partly offset by the charges
relating to PPI and other conduct provisions.
Risk-weighted assets reduced by 5 per cent, or £13 billion, in the first half of the year, to £227 billion (31 December 2014:
£240 billion), primarily due to the completion of the sale of TSB, active portfolio management, and improvements in credit
quality.
The Group’s leverage ratio has remained stable at 4.9 per cent, with the impact of the reduction in tier 1 capital broadly
offset by the reduction in balance sheet assets arising, in part, from the disposal of TSB.

LLOYDS BANKING GROUP PLC 2015 HALF-YEAR RESULTS
Page 12 of 93
CHIEF FINANCIAL OFFICER’S REVIEW OF FINANCIAL PERFORMANCE (continued)
Dividend
The Group is announcing today an interim dividend of 0.75 per share, amounting to £535 million.
The Group has a strong capital position with a CET1 ratio of 13.3 per cent and a leverage ratio of 4.9 per cent. We
continue to expect to generate 150-200 basis points of capital per year enabling us to support sustainable growth in the
business and help Britain prosper whilst delivering sustainable returns for shareholders.
The Group’s aim is to have a dividend policy that is both progressive and sustainable. We recommenced payment at the
full year and, as we have previously indicated, we expect ordinary dividends to increase over the medium term with a
dividend payout ratio of at least 50 per cent of sustainable earnings.
In addition, going forward the Board will give due consideration, subject to the circumstances at the time, to the
distribution of surplus capital through the use of special dividends or share buy-backs. Surplus capital represents capital
over and above the amount management wish to retain to grow the business, meet regulatory requirements and cover
uncertainties. The amount of retained capital is likely to vary from time to time depending on circumstances, but is
currently around 12 per cent plus an amount broadly equivalent to a further year’s ordinary dividend.
Conclusion
The Group has made a strong start to the next phase of its strategic journey in the first half of 2015, with loan growth in
key customer segments, an improved net interest margin, tight cost management and a significant reduction in
impairment charges reflected in a strong underlying performance and a statutory profit of £1,193 million. This
performance, coupled with the continued strengthening of the Group’s common equity tier 1 ratio, has enabled us to
declare an interim dividend of 0.75 pence per share. The combination of the Group’s balance sheet strength, clear
strategic focus and differentiated business model positions the Group well for further progress in 2015 and beyond.
George Culmer
Chief Financial Officer

LLOYDS BANKING GROUP PLC 2015 HALF-YEAR RESULTS
Page 13 of 93
UNDERLYING BASIS – SEGMENTAL ANALYSIS
Half-year to 30 June 2015 Retail Commercial
Banking Consumer
Finance Insurance
Run-off and Central
items Group £m £m £m £m £m £mNet interest income 3,743 1,234 658 (73) 153 5,715 Other income 559 1,023 677 1,025 (31) 3,253
Total income 4,302 2,257 1,335 952 122 8,968
Operating costs (2,300) (1,043) (403) (368) (36) (4,150)Operating lease depreciation − (14) (353) − (7) (374)
Costs (2,300) (1,057) (756) (368) (43) (4,524)Impairment (163) (7) (40) − 31 (179)
Underlying profit excl. TSB 1,839 1,193 539 584 110 4,265
TSB 118
Underlying profit 4,383 Banking net interest margin1 2.44% 2.81% 6.26% 2.62% Asset quality ratio1 0.10% 0.04% 0.38% 0.09% Return on risk-weighted assets 5.55% 2.29% 5.19% 3.78% Return on assets 1.17% 1.06% 4.16% 1.05%
Half-year to 30 June 2014 Retail Commercial
Banking Consumer
Finance Insurance
Run-off and Central
items Group £m £m £m £m £m £m Net interest income 3,493 1,234 645 (64) 96 5,404 Other income 700 984 675 854 163 3,376
Total income 4,193 2,218 1,320 790 259 8,780
Operating costs (2,207) (1,022) (389) (329) (187) (4,134)Operating lease depreciation − (11) (319) − (16) (346)
Costs (2,207) (1,033) (708) (329) (203) (4,480)Impairment (276) (29) (78) − (324) (707)
Underlying profit (loss) excl. TSB 1,710 1,156 534 461 (268) 3,593
TSB 226
Underlying profit 3,819 Banking net interest margin1 2.28% 2.63% 6.69% 2.35% Asset quality ratio1 0.18% 0.05% 0.78% 0.30% Return on risk-weighted assets 4.82% 1.96% 5.20% 2.90% Return on assets 1.09% 1.01% 4.30% 0.92%
Half-year to 31 Dec 2014 Retail Commercial
Banking Consumer
Finance Insurance
Run-off and Central
items Group £m £m £m £m £m £m Net interest income 3,586 1,246 645 (67) 161 5,571 Other income 512 972 689 871 47 3,091
Total income 4,098 2,218 1,334 804 208 8,662
Operating costs (2,257) (1,101) (373) (343) (114) (4,188)Operating lease depreciation − (13) (348) − (13) (374)
Costs (2,257) (1,114) (721) (343) (127) (4,562)Impairment (323) (54) (137) − 119 (395)
Underlying profit excl. TSB 1,518 1,050 476 461 200 3,705
TSB 232
Underlying profit 3,937 Banking net interest margin1 2.29% 2.70% 6.30% 2.45% Asset quality ratio1 0.20% 0.10% 1.30% 0.17% Return on risk-weighted assets 4.36% 1.88% 4.49% 3.14% Return on assets 0.95% 0.87% 3.79% 0.92% 1
Excluding TSB.

LLOYDS BANKING GROUP PLC 2015 HALF-YEAR RESULTS
Page 14 of 93
UNDERLYING BASIS – SEGMENTAL ANALYSIS
Loans and advances
Customerdeposits
Total customer balances1
Risk-weighted assets
30 June
2015 31 Dec
2014 30 June
2015 31 Dec
2014 30 June
2015 31 Dec
2014 30 June
2015 31 Dec
2014 £bn £bn £bn £bn £bn £bn £bn £bn Retail 312.9 315.2 278.2 285.5 591.1 600.7 65.9 67.7
Commercial Banking 100.2 100.9 125.4 119.9 225.6 220.8 102.8 106.2
Consumer Finance 21.8 20.9 11.4 15.0 36.4 39.0 21.0 20.9
Run-off and Central items 17.4 19.0 1.5 2.1 18.9 21.1 27.1 28.9 Threshold risk-weighted assets 10.2 10.8
Group excl. TSB 452.3 456.0 416.5 422.5 872.0 881.6 227.0 234.5
TSB − 21.6 − 24.6 − 46.2 − 5.2
Group 452.3 477.6 416.5 447.1 872.0 927.8 227.0 239.7 1 Total customer balances include loans and advances to customers, customer deposit balances and Consumer Finance operating
lease assets.
UNDERLYING BASIS – QUARTERLY INFORMATION
Group
Quarterended
30 June 2015
Quarter ended
31 Mar 2015
Quarter ended
31 Dec 2014
Quarter ended
30 Sept 2014
Quarter ended
30 June 2014
£m £m £m £m £m Net interest income 2,886 2,829 2,730 2,841 2,794
Other income 1,661 1,592 1,513 1,578 1,696
Total income 4,547 4,421 4,243 4,419 4,490
Costs
Operating costs (2,130) (2,020) (2,221) (1,967) (2,103)
Operating lease depreciation (191) (183) (195) (179) (173)
Costs (2,321) (2,203) (2,416) (2,146) (2,276)
Impairment (21) (158) (159) (236) (300)
Underlying profit excluding TSB 2,205 2,060 1,668 2,037 1,914
TSB − 118 114 118 105
Underlying profit 2,205 2,178 1,782 2,155 2,019
Asset sales and other items (385) (193) (49) (268) (1,063)
Simplification costs (6) (26) (316) (131) (225)
TSB costs − (745) (144) (105) (137)
Conduct provisions (1,835) − (1,125) (900) (1,100)
Statutory (loss) profit before tax (21) 1,214 148 751 (506)
Banking net interest margin1 2.65% 2.60% 2.42% 2.47% 2.44%
Cost:income ratio1,2 48.9% 47.7% 54.9% 46.4% 48.7%
Asset quality ratio1 0.03% 0.14% 0.14% 0.19% 0.25%
Return on risk-weighted assets 3.84% 3.73% 2.89% 3.37% 3.09%
Return on assets 1.06% 1.05% 0.83% 1.01% 0.97% 1 Excluding TSB. 2 Operating lease depreciation deducted from income and costs.

LLOYDS BANKING GROUP PLC 2015 HALF-YEAR RESULTS
Page 15 of 93
DIVISIONAL HIGHLIGHTS
RETAIL
Retail offers a broad range of financial service products, including current accounts, savings, personal loans and
mortgages, to UK personal customers, including Wealth and small business customers. It is also a distributor of
insurance, protection and credit cards, and a range of long-term savings and investment products. Retail’s aim is to be
the best bank for customers in the UK, by building deep and enduring relationships that deliver value to customers, and
by providing them with greater choice and flexibility. Retail will maintain its multi-brand and multi-channel strategy, and
continue to simplify the business and provide more transparent products, helping to improve service levels and reduce
conduct risks.
Progress against strategic initiatives
Continued development of our digital capability. Our online user base has increased to over 11 million customers,
with over 5.9 million active mobile users.
Continued to attract new customers through positive switching activity, particularly through the Halifax challenger
brand which has attracted around 120,000 customers in the first half of 2015.
Club Lloyds proposition has been strengthened by the addition of new home insurance and cards offers, helping to
attract a further 200,000 customers in the first half of 2015.
Developed a market leading Young Savers proposition, with around 250,000 children’s savings accounts opened in
the first half of 2015, helping develop a savings culture in young people and allowing us to start building long lasting
relationships with these customers.
Achieved £16 billion of gross new mortgage lending in in the first half of 2015. Launched a new online application
process that allows customers to reach Agreement in Principle to borrow, improving efficiency for both customers and
the business.
On track to deliver our lending commitment to first-time buyers, providing 1 in 4 mortgages. Retail continues to be a
leading supporter of the UK government’s Help to Buy scheme, with lending of £2.5 billion under the mortgage
guarantee element of the scheme since launch.
Exceeded our lending commitment, supporting over 1 in 5 new business start-ups. Improved our proposition to small
business customers, launching a range of new to market products and services.
Enhanced proposition for investment customers, becoming the first UK Bank to offer investment advice through
video-conferencing and screen sharing.
Increased Net Promoter Scores across all channels in in the first half of 2015.
Financial performance
Underlying profit increased 8 per cent to £1,839 million.
Net interest income increased 7 per cent. Margin has increased 16 basis points to 2.44 per cent, driven by improved
deposit margin and mix, more than offsetting reduced lending rates.
Other income down 20 per cent. Lower protection income following the removal of face-to-face advised standalone
protection roles in branches, lower wealth income following regulatory changes.
Costs increased 4 per cent to £2,300 million, with operational efficiencies funding increased investment in the
business.
Impairment reduced 41 per cent to £163 million, driven by lower unsecured charges due to lower impaired loan and
arrears balances. Secured coverage was broadly flat at 36 per cent.
Return on risk-weighted assets increased 73 basis points driven by 3 per cent reduction to risk-weighted assets and
8 per cent increase to underlying profit.
Balance sheet
Loans and advances to customers fell 1 per cent to £312.9 billion with the open mortgage book (excluding specialist
mortgage book and Intelligent Finance) increasing 1 per cent versus June 2014.
Customer deposits decreased 3 per cent to £278.2 billion, with more expensive tactical balances down 12 per cent to
£33.2 billion, reflecting lower lending growth and actions to protect interest margins.
Risk-weighted assets decreased by £1.8 billion to £65.9 billion, driven by an improvement in the credit quality of
assets and a modest contraction to lending balances.

LLOYDS BANKING GROUP PLC 2015 HALF-YEAR RESULTS
Page 16 of 93
RETAIL (continued)
Half-yearto 30 June
2015
Half-year to 30 June
2014 Change
Half-year to 31 Dec
2014
Change £m £m % £m %
Net interest income 3,743 3,493 7 3,586 4
Other income 559 700 (20) 512 9
Total income 4,302 4,193 3 4,098 5
Costs (2,300) (2,207) (4) (2,257) (2)
Impairment (163) (276) 41 (323) 50
Underlying profit 1,839 1,710 8 1,518 21
Banking net interest margin 2.44% 2.28% 16bp 2.29% 15bp
Asset quality ratio 0.10% 0.18% (8)bp 0.20% (10)bp
Return on risk-weighted assets 5.55% 4.82% 73bp 4.36% 119bp
Return on assets 1.17% 1.09% 8bp 0.95% 22bp
Key balance sheet items
At30 June
2015
At 31 Dec
2014 Change £bn £bn %
Loans and advances excluding closed portfolios 283.9 284.7 −
Closed portfolios 29.0 30.5 (5)
Loans and advances to customers 312.9 315.2 (1)
Relationship balances 245.0 247.9 (1)
Tactical balances 33.2 37.6 (12)
Customer deposits 278.2 285.5 (3)
Total customer balances 591.1 600.7 (2)
Risk-weighted assets 65.9 67.7 (3)

LLOYDS BANKING GROUP PLC 2015 HALF-YEAR RESULTS
Page 17 of 93
COMMERCIAL BANKING
Commercial Banking supports UK businesses from SMEs to large corporates and financial institutions. It has a client led,
low risk strategy targeting sustainable returns on risk weighted assets above 2 per cent by 2015 and more than 2.4 per
cent by the end of 2017, whilst simplifying operating processes, building digital capability and maintaining capital
discipline. Commercial Banking aims to be the best bank for clients, delivering a through-the-cycle relationship approach
that provides affordable, simple and transparent finance, as well as support for complex needs and access to
Government funding schemes. Progress against strategic initiatives
Increased lending to SMEs by 5 per cent supported by strong relationship banking and remain the largest net lender to SMEs under the Funding for Lending Scheme (FLS), with over £3 billion of gross FLS lending in the first half of 2015.
Maintained lending to Mid Market clients in a declining market, delivering an improved local service with an overall increase in client advocacy and ongoing investment in relationship manager capability.
Grown both SME and Mid Market client base and have committed over £735 million of funding support to UK manufacturing.
Global Corporates was ranked first in Sterling capital markets financing of UK corporates in the first half of 2015, raising more than £1.8 billion for clients. It continues to help Britain prosper globally by providing UK clients with overseas capability and leveraging its considerable domestic capabilities in support of major international companies seeking a gateway into the UK.
Financial Institutions (FI) actively supports the Financial Services industry in the UK, a sector critical to the success of the UK economy. Our leading FI franchise continued to deliver through deep sector expertise as illustrated by the growing number of lead financing roles, helping our clients to raise £30 billion of funding in the year to date.
Strong deposit growth underpinned by continued investment in Transaction Banking platforms and further helped by the Group’s improving credit rating.
Continued our commitment to Helping Britain Prosper, raising over £500 million through our Environmental, Social and Governance (ESG) programmes including the issuance of our second ESG bond for £250 million and launch of an ESG Term Deposit to finance SMEs, healthcare providers and renewable energy projects in the most economically disadvantaged areas of the UK.
Supporting over £2.6 billion of UK national infrastructure financing including developing and leading the first CPI-linked bond in the sterling market, used by the Greater London Authority to partly fund the extension of the London Underground Northern Line; a development which will lead to the creation of 24,000 new jobs and 18,000 new homes.
Financial performance
Underlying profit of £1,193 million, up 3 per cent, driven by income growth and a significant reduction in impairments. Income increased by 2 per cent to £2,257 million, reflecting strong growth in our Core Client franchises, offset by
lower revaluation income from Lloyds Development Capital (LDC). Net interest margin increased by 18 basis points to 2.81 per cent due to disciplined pricing of new lending and a
continued reduction in funding costs as a result of attracting high quality transactional deposits in SME, Mid Markets and Global Corporates.
Other income increased 4 per cent, driven by significant refinancing activity support provided to Global Corporate clients and increases in Mid Markets and Financial Institutions, offset by a reduction in LDC.
Asset quality ratio of 0.04 per cent improved by 1 basis point, reflecting lower gross charges, improved credit quality and continued progress in executing the strategy of building a low risk commercial bank.
Return on risk-weighted assets increased by 33 basis points to 2.29 per cent. We remain on target to deliver sustainable returns in excess of 2 per cent in 2015 and more than 2.40 per cent by the end of 2017.
Balance sheet
Loans and advances to customers fell by 1 per cent to £100.2 billion with growth in SME offset by transfers to the Insurance division.
Customer deposits increased by 5 per cent, with growth in all client segments.
Risk-weighted assets decreased by £3.4 billion, reflecting continued optimisation of the balance sheet. Reductions in
credit and market risk-weighted assets were the result of active portfolio management across Financial Markets and
Global Corporates, and Market Risk model changes.

LLOYDS BANKING GROUP PLC 2015 HALF-YEAR RESULTS
Page 18 of 93
COMMERCIAL BANKING (continued)
Half-yearto 30 June
2015
Half-year to 30 June
2014 Change
Half-year to 31 Dec
2014
Change £m £m % £m %
Net interest income 1,234 1,234 − 1,246 (1)
Other income 1,023 984 4 972 5
Total income 2,257 2,218 2 2,218 2
Operating costs (1,043) (1,022) (2) (1,101) 5
Operating lease depreciation (14) (11) (27) (13) (8)
Costs (1,057) (1,033) (2) (1,114) 5
Impairment (7) (29) 76 (54) 87
Underlying profit 1,193 1,156 3 1,050 14
Banking net interest margin 2.81% 2.63% 18bp 2.70% 11bp
Asset quality ratio 0.04% 0.05% (1)bp 0.10% (6)bp
Return on risk-weighted assets 2.29% 1.96% 33bp 1.88% 41bp
Return on assets 1.06% 1.01% 5bp 0.87% 19bp
Key balance sheet items
At30 June
2015
At 31 Dec
2014 Change £bn £bn %
SME 28.8 27.9 3
Other 71.4 73.0 (2)
Loans and advances to customers 100.2 100.9 (1)
Customer deposits 125.4 119.9 5
Total customer balances 225.6 220.8 2
Risk-weighted assets 102.8 106.2 (3)

LLOYDS BANKING GROUP PLC 2015 HALF-YEAR RESULTS
Page 19 of 93
CONSUMER FINANCE Consumer Finance aims to extend its market leadership in motor finance by building its digital capability and creating new propositions in both the Black Horse and Lex Autolease businesses. In Credit Cards, better use will be made of Group customer relationships and insight, with investment into digital strategic initiatives to seek growth within its current risk appetite from franchise customers, as well as a focus on attracting non-franchise customers. Progress against strategic objectives Investing in our growth strategy:
− Successfully launched the market’s first direct-to-consumer, secured car finance proposition, providing a simple,
digital hire purchase and personal contract purchase offering through online banking and mobile devices.
− Further digital developments within Credit Cards improving our customers’ experience, particularly within mobile.
Significant improvements in our customer propositions, including a broadened, more competitive product range,
along with improved switching and multiple product holding capabilities. Focus on new business in a competitive market:
− 17 per cent growth in Black Horse new lending year-on-year with strong underlying business performance
including the Jaguar Land Rover partnership, while leading the industry in embedding significant Consumer Credit
regulatory change.
− 6 per cent growth in Lex Autolease fleet size year-on-year with leads from the franchise up 14 per cent.
− 21 per cent increase in Cards balance transfer volumes year-on-year from both new and existing customers and a
net gainer from competitors.
− 25 per cent growth in transaction volumes year-on-year within the Cardnet Acquiring solutions business, driven by
increased activity from existing customers. Growing balances in under-represented markets:
− UK Consumer Finance loan growth of 17 per cent year-on-year.
− Growth in Credit Cards lending balances of 5 per cent year-on-year.
− Black Horse lending up 33 per cent and Lex operating leases 10 per cent higher year-on-year. Customer satisfaction improved with increased Net Promoter Scores year-on-year across the UK businesses
including a significant improvement in Credit Cards.
Financial performance Underlying profit up to £539 million, with new business volume driven income growth in Black Horse and Lex
Autolease and reductions in impairments reflecting improved quality of the portfolio, offsetting an increase in costs largely reflecting investment in our growth strategy.
Net interest income increased by 2 per cent to £658 million driven by strong growth across all lending businesses, partly offset by a 43 basis point reduction in net interest margin to 6.26 per cent including the impact of lower Euribor rates on the online deposit businesses. The lower margin underlies a shift towards higher quality and hence lower margin lending which in turn is consistent with the lower impairment charges being experienced.
Increase in other income to £677 million as a result of the continued fleet growth in Lex Autolease in a competitive environment.
Costs increased by 7 per cent to £756 million with operational efficiencies more than offset by investment in growth initiatives and increased operating lease depreciation as a result of growth in the Lex Autolease fleet.
Impairment charges reduced by 49 per cent to £40 million, with an improvement in the asset quality ratio, driven by continued improvement in portfolio quality supported by the sale of recoveries assets in the Credit Cards portfolio.
Return on risk-weighted assets in line with the prior year at 5.19 per cent with growth in underlying profit offset by a small increase in average risk-weighted assets.
Balance sheet
Net lending increased by 4 per cent since December driven by Black Horse with growth of 18 per cent. In Credit
Cards we have seen growth accelerate to 5 per cent year-on-year. Balances in the European businesses were down
8 per cent since December driven by foreign exchange rate movements.
Operating lease assets up by 3 per cent since December to £3.2 billion reflecting growth in the Lex Autolease fleet.
Customer deposits reduced by 24 per cent since December to £11.4 billion driven by deposit re-pricing activity in
response to lower Euribor rates and foreign exchange rate movements.
Risk weighted assets unchanged since December, with growth in net lending offset by active portfolio management
and improvements in credit quality.

LLOYDS BANKING GROUP PLC 2015 HALF-YEAR RESULTS
Page 20 of 93
CONSUMER FINANCE (continued)
Half-yearto 30 June
2015
Half-year to 30 June
2014 Change
Half-year to 31 Dec
2014
Change £m £m % £m % Net interest income 658 645 2 645 2
Other income 677 675 − 689 (2)
Total income 1,335 1,320 1 1,334 −
Operating costs (403) (389) (4) (373) (8)
Operating lease depreciation (353) (319) (11) (348) (1)
Costs (756) (708) (7) (721) (5)
Impairment (40) (78) 49 (137) 71
Underlying profit 539 534 1 476 13
Banking net interest margin 6.26% 6.69% (43)bp 6.30% (4)bp
Asset quality ratio 0.38% 0.78% (40)bp 1.30% (92)bp
Impaired loans as a % of closing advances 2.8% 4.2% (1.4)pp 3.4% (0.6)pp
Return on risk-weighted assets 5.19% 5.20% (1)bp 4.49% 70bp
Return on assets 4.16% 4.30% (14)bp 3.79% 37bp
Key balance sheet items
At30 June
2015
At 31 Dec
2014 Change £bn £bn % Loans and advances to customers 21.8 20.9 4
Of which UK 17.3 16.0 8
Operating lease assets 3.2 3.1 3
Total customer assets 25.0 24.0 4
Of which UK 20.5 19.1 7
Customer deposits 11.4 15.0 (24)
Total customer balances 36.4 39.0 (7)
Risk-weighted assets 21.0 20.9 −

LLOYDS BANKING GROUP PLC 2015 HALF-YEAR RESULTS
Page 21 of 93
INSURANCE
The Insurance division is committed to meeting the changing needs of our customers by working with our Group partners
to provide a range of trusted and value for money products via multiple channels. Since it was founded 200 years ago
Scottish Widows has been protecting what our customers value most and helping them plan financially for the future,
currently with almost six million life and pensions customers and over £95 billion of funds under management.
Progress against strategic initiatives
Corporate Pensions assets under management increased by £1.4 billion to £28.4 billion in the first half of the year
following continued growth in contributions under auto enrolment. As a leading provider in this sector, Insurance is
well positioned to benefit from the expected growth in the workplace savings market.
Launched a new retirement planning website to inform and educate customers about the options and choices
available to them in retirement. This provides customers with increased flexibility in how they access guidance on
their retirement options. In the four months since launch more than 150,000 customers have utilised this site.
Home Insurance sales through online channels continued to grow, supported by strong retention, following the
decision taken to bring the underwriting in house. Continued investment in the Group’s direct digital capability will
deliver a more flexible Home Insurance product later this year.
Customer access to protection products has been extended with the launch of an online product which gives
customers the opportunity to acquire life insurance through a quick and easy digital journey.
Successfully executed a bulk annuity transaction with the Scottish Widows With-Profits fund. This represented a key
stage in plans to participate in the growing and attractive defined benefit pensions scheme de-risking market via a
bulk annuities offering.
Continued optimisation of assets across the Group through the acquisition of attractive higher yielding assets from
the Group to match long duration annuity liabilities. Total assets acquired to date are circa £5 billion.
Increased focus on the core UK business with the agreed sale of the Isle of Man based Clerical Medical International
insurance business.
Financial performance
Underlying profit up 27 per cent to £584 million, primarily driven by the £98 million new business value of the bulk
annuity transaction with the With-Profits fund.
LP&I sales (PVNBP) increased by 25 per cent in the year, boosted by £2,386 million from the With-Profits fund
annuity transaction. Excluding this, PVNBP fell by 26 per cent, driven by significant regulatory and market change.
Operating cash generation increased by £11 million, to £391 million, primarily reflecting benefits from the acquisition
of higher yielding assets more than offsetting the initial impact of the bulk annuity transaction with the
With-Profits fund.
General Insurance Gross Written Premiums (GWP) decreased 7 per cent, reflecting the competitive market
environment and the run off of products closed to new customers.
Capital
Estimated Pillar 1 capital surplus is £2.7 billion (Scottish Widows plc, £2.6 billion in 2014) and for Insurance Groups
Directive is £3.1 billion (Insurance Group, £3.0 billion in 2014) with the changes in both Pillar 1 and IGD reflecting
earnings in the first half of the year.
Preparations are on track for Solvency II implementation on 1 January 2016. Implementation is expected to have a
minimal impact on the Insurance division capital position given the anticipated impact of transitional arrangements.
Plans are progressing well to simplify the corporate structure of the life insurance entities to deliver capital and
simplification benefits.

LLOYDS BANKING GROUP PLC 2015 HALF-YEAR RESULTS
Page 22 of 93
INSURANCE (continued)
Performance summary
Half-yearto 30 June
2015
Half-year to 30 June
2014 Change
Half-year to 31 Dec
2014
Change £m £m % £m % Net interest income (73) (64) (14) (67) (9)
Other income 1,025 854 20 871 18
Total income 952 790 21 804 18
Costs (368) (329) (12) (343) (7)
Underlying profit 584 461 27 461 27
Operating cash generation 391 380 3 357 10
UK LP&I sales (PVNBP)1 5,837 4,680 25 3,921 49 General Insurance total GWP2 561 604 (7) 593 (5)
General Insurance combined ratio 73% 80% (7)pp 76% (3)pp 1 Present value of new business premiums. 2 Gross written premiums.
Profit by product group
Half-year to 30 June 2015
Half-year to 30 June
2014
Half-year to 31 Dec
2014
Pensions & investments
Protection & retirement
Bulk annuities
General insurance Other1 Total Total Total
£m £m £m £m £m £m £m £m
New business income 91 15 98 − − 204 151 116
Existing business income 307 64 − − 34 405 441 442 Long-term investment strategy − 52 39 − − 91 95 65
Assumption changes and experience variances (16) 66 − − 10 60 (105) (29) General Insurance income net of claims − − − 192 − 192 208 210
Total income 382 197 137 192 44 952 790 804
Costs (220) (72) (7) (69) − (368) (329) (343)
Underlying profit 162 125 130 123 44 584 461 461
Underlying profit 30 June 20142 144 141 − 138 38 461 1 ‘Other’ is primarily income from return on free assets, interest expense plus certain provisions. 2 Full 2014 comparator tables for the profit and cash disclosures can be found on the Lloyds Banking Group investor site.

LLOYDS BANKING GROUP PLC 2015 HALF-YEAR RESULTS
Page 23 of 93
INSURANCE (continued)
New business income has increased by £53 million, with the primary driver being a £98 million benefit from the bulk
annuity transaction with the Scottish Widows With-Profits fund. This has been offset by a reduction in Protection income
following the removal of face-to-face advised standalone protection roles in branches and a reduction in income from
individual annuities following Pensions Freedom. Corporate pension income remained robust although decreased
relative to significant sales in 2014 driven by auto enrolment.
The fall in existing business income reflects a reduction in the expected rate of return used to calculate the life and
pensions income. The rate of return is largely set by reference to an average 15 year swap rate (rate of return 2.82 per
cent in the first half of 2015 and 3.48 per cent in 2014).
Long-term investments strategy includes the benefit from the successful acquisition of a further £0.8 billion of higher
yielding assets to match the long duration liabilities in both the standard annuity book as well as the newly acquired bulk
annuity business.
Assumption changes and experience variances include a £40 million benefit from changes to assumptions on longevity
reflecting experience in the annuity portfolio. The prior year included a one-off £100 million charge relating to the
corporate pensions fee cap.
General Insurance income net of claims has fallen by £16 million, reflecting the run-off of products closed to new
customers.
Costs are £39 million higher, reflecting significant investment spend in the first half of 2015 supporting our strategic
growth initiatives and significant regulatory and change agendas.
Operating cash generation
Half-year to 30 June 2015
Half-year to 30 June
2014
Half-year to 31 Dec
2014
Pensions & investments
Protection & retirement
Bulk annuities
General insurance Other Total Total Total
£m £m £m £m £m £m £m £m
Cash invested in new business (91) (17) (105) − − (213) (153) (135)Cash generated from existing business 280 105 63 − 33 481 395 366 Cash generated from General Insurance − − − 123 − 123 138 126
Operating cash generation1 189 88 (42) 123 33 391 380 357 Intangibles and other adjustments2 (27) 37 172 − 11 193 81 104
Underlying profit 162 125 130 123 44 584 461 461
Operating cash generation 30 June 2014 143 36 − 138 63 380 1 Derived from underlying profit by removing the effect of movements in intangible (non-cash) items and assumption changes. For 2015
reporting this measure has been refined to include the cash benefits from the ‘long-term investments strategy’. 2 Intangible items include the value of in-force life business, deferred acquisition costs and deferred income reserves.
The Insurance business generated £391 million of operating cash in the first half of 2015, £11 million higher than the
prior year. Within Protection & retirement, cash benefits of £53 million were recognised in respect of the successful
acquisition of attractive higher yielding assets to match long duration annuity liabilities. Within Bulk annuities, the cash
benefits from such transactions was £63 million, partially offsetting the initial strain of the bulk annuity transaction with the
With-Profits fund contained within ‘Cash invested in new business’. In addition, the sale of a reinsurance asset
contributed £48 million to operating cash.

LLOYDS BANKING GROUP PLC 2015 HALF-YEAR RESULTS
Page 24 of 93
RUN-OFF AND CENTRAL ITEMS RUN-OFF
Half-yearto 30 June
2015
Half-year to 30 June
2014 Change
Half-year to 31 Dec
2014 Change £m £m % £m %
Net interest income (19) (67) 72 (49) 61
Other income 105 260 (60) 191 (45)
Total income 86 193 (55) 142 (39)
Operating costs (74) (153) 52 (126) 41
Operating lease depreciation (7) (16) 56 (13) 46
Costs (81) (169) 52 (139) 42
Impairment 32 (324) 121 (74)
Underlying profit (loss) 37 (300) 124 (70)
Key balance sheet items
At 30 June
2015
At 31 Dec
2014 Change £bn £bn %
Loans and advances to customers 12.2 14.4 (15)
Total assets 14.4 16.9 (15)
Risk-weighted assets 14.3 16.8 (15)
Run-off includes certain assets previously classified as non-core and the results and gains or losses on sale of
businesses sold in 2014.
The reduction in income and costs largely related to the sale of Scottish Widows Investment Partnership in the first
quarter of 2014.
The net release of impairment charge in the first half of 2015 reflected the reduction in the run-off book and improving
economic conditions. This has led to a low level of new charges which have been more than offset by releases and
write-backs. A breakdown of the impairment charge is shown on page 31.
CENTRAL ITEMS
Half-year to 30 June
2015
Half-year to 30 June
2014
Half-year to 31 Dec
2014 £m £m £m
Total underlying income 36 66 66
Costs 38 (34) 12
Impairment (1) − (2)
Underlying profit 73 32 76
Central items include income and expenditure not recharged to divisions, including the costs of certain central and
head office functions.
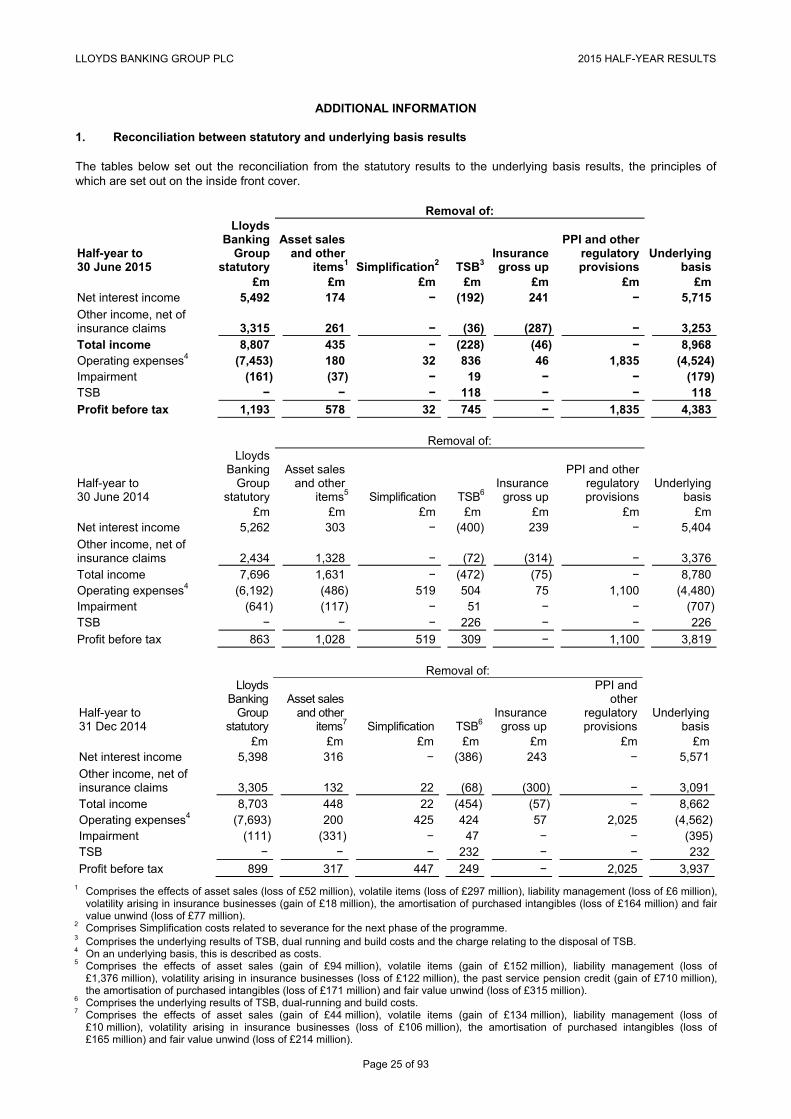
LLOYDS BANKING GROUP PLC 2015 HALF-YEAR RESULTS
Page 25 of 93
ADDITIONAL INFORMATION 1. Reconciliation between statutory and underlying basis results The tables below set out the reconciliation from the statutory results to the underlying basis results, the principles of which are set out on the inside front cover. Removal of:
Half-year to 30 June 2015
Lloyds Banking
Group statutory
Asset sales and other
items1 Simplification2 TSB3Insurance gross up
PPI and other regulatory provisions
Underlying basis
£m £m £m £m £m £m £m Net interest income 5,492 174 − (192) 241 − 5,715
Other income, net of insurance claims 3,315 261 − (36) (287) − 3,253 Total income 8,807 435 − (228) (46) − 8,968 Operating expenses4 (7,453) 180 32 836 46 1,835 (4,524)Impairment (161) (37) − 19 − − (179)TSB − − − 118 − − 118
Profit before tax 1,193 578 32 745 − 1,835 4,383 Removal of:
Half-year to 30 June 2014
Lloyds Banking
Group statutory
Asset sales and other
items5 Simplification TSB6Insurance gross up
PPI and other regulatory provisions
Underlying basis
£m £m £m £m £m £m £m Net interest income 5,262 303 − (400) 239 − 5,404
Other income, net of insurance claims 2,434 1,328 − (72) (314) − 3,376 Total income 7,696 1,631 − (472) (75) − 8,780 Operating expenses4 (6,192) (486) 519 504 75 1,100 (4,480)Impairment (641) (117) − 51 − − (707)TSB − − − 226 − − 226
Profit before tax 863 1,028 519 309 − 1,100 3,819 Removal of:
Half-year to 31 Dec 2014
Lloyds Banking
Group statutory
Asset sales and other
items7 Simplification TSB6Insurance gross up
PPI and other
regulatory provisions
Underlying basis
£m £m £m £m £m £m £m Net interest income 5,398 316 − (386) 243 − 5,571
Other income, net of insurance claims 3,305 132 22 (68) (300) − 3,091 Total income 8,703 448 22 (454) (57) − 8,662 Operating expenses4 (7,693) 200 425 424 57 2,025 (4,562)Impairment (111) (331) − 47 − − (395)TSB − − − 232 − − 232
Profit before tax 899 317 447 249 − 2,025 3,937 1 Comprises the effects of asset sales (loss of £52 million), volatile items (loss of £297 million), liability management (loss of £6 million),
volatility arising in insurance businesses (gain of £18 million), the amortisation of purchased intangibles (loss of £164 million) and fair value unwind (loss of £77 million).
2 Comprises Simplification costs related to severance for the next phase of the programme. 3 Comprises the underlying results of TSB, dual running and build costs and the charge relating to the disposal of TSB. 4 On an underlying basis, this is described as costs. 5 Comprises the effects of asset sales (gain of £94 million), volatile items (gain of £152 million), liability management (loss of
£1,376 million), volatility arising in insurance businesses (loss of £122 million), the past service pension credit (gain of £710 million), the amortisation of purchased intangibles (loss of £171 million) and fair value unwind (loss of £315 million).
6 Comprises the underlying results of TSB, dual-running and build costs. 7 Comprises the effects of asset sales (gain of £44 million), volatile items (gain of £134 million), liability management (loss of
£10 million), volatility arising in insurance businesses (loss of £106 million), the amortisation of purchased intangibles (loss of £165 million) and fair value unwind (loss of £214 million).

LLOYDS BANKING GROUP PLC 2015 HALF-YEAR RESULTS
Page 26 of 93
ADDITIONAL INFORMATION (continued)
2. Banking net interest margin
Banking net interest margin is calculated by dividing banking net interest income by average interest-earning banking
assets. A reconciliation of banking net interest income to Group net interest income showing the items that are excluded
in determining banking net interest income follows:
Half-yearto 30 June
2015
Half-year to 30 June
2014
Half-year to 31 Dec
2014 £m £m £m
Banking net interest income – underlying basis 5,789 5,426 5,633
Insurance division (73) (64) (67)
Other net interest income (including trading activity) (1) 42 5
Net interest income – underlying basis excluding TSB 5,715 5,404 5,571
Asset sales and other items (174) (303) (316)
TSB 192 400 386
Insurance gross up (241) (239) (243)
Group net interest income – statutory 5,492 5,262 5,398
Average interest-earning banking assets exclude TSB and are calculated gross of related impairment allowances, and
relate solely to customer and product balances in the banking businesses on which interest is earned or paid.
Half-yearto 30 June
2015
Half-year to 30 June
2014
Half-year to 31 Dec
2014 £bn £bn £bn
Average loans and advances (gross) 457.4 477.4 468.8
Non-banking assets and other adjustments1 (12.6) (11.8) (12.1)
Average interest-earning assets excluding TSB 444.8 465.6 456.7 1 Other adjustments include assets that are netted for interest earning purposes and reverse repos.
3. Volatility arising in insurance businesses
The Group’s statutory result before tax included positive volatility totalling £18 million compared to negative volatility of
£122 million in 2014.
Volatility comprises the following:
Half-yearto 30 June
2015
Half-year to 30 June
2014
Half-year to 31 Dec
2014 £m £m £m
Insurance volatility (109) (133) (86)
Policyholder interests volatility 83 43 (26)
Total volatility (26) (90) (112)
Insurance hedging arrangements 44 (32) 6
Total 18 (122) (106)

LLOYDS BANKING GROUP PLC 2015 HALF-YEAR RESULTS
Page 27 of 93
ADDITIONAL INFORMATION (continued)
Insurance volatility
The Group’s insurance business has policyholder liabilities that are supported by substantial holdings of investments.
IFRS requires that the changes in both the value of the liabilities and investments are reflected within the income
statement. The value of the liabilities does not move exactly in line with changes in the value of the investments. As the
investments are substantial, movements in their value can have a significant impact on the profitability of the Group.
Management believes that it is appropriate to disclose the division’s results on the basis of an expected return in addition
to results based on the actual return. The impact of the actual return on these investments differing from the expected
return is included within insurance volatility.
The expected gross investment returns used to determine the underlying profit of the business are based on prevailing
market rates and published research into historical investment return differentials for the range of assets held. Where
appropriate, rates are updated throughout the year to reflect changing market conditions and changes in the asset mix.
In 2015 the basis for calculating these expected returns has been enhanced to reflect an average of the 15 year swap
rate over the preceding 12 months and where appropriate, rates are updated throughout the year to reflect changing
market conditions. The negative insurance volatility during the period ended 30 June 2015 of £109 million primarily
reflects an adverse performance on cash investments in the period relative to the expected return and an increase
in yields.
Policyholder interests volatility
Accounting standards require that tax on policyholder investment returns should be included in the Group’s tax charge
rather than being offset against the related income. The result is, therefore, to either increase or decrease profit before
tax with a related change in the tax charge. Timing and measurement differences exist between provisions for tax and
charges made to policyholders. Consistent with the expected approach taken in respect of insurance volatility,
differences in the expected levels of the policyholder tax provision and policyholder charges are adjusted through
policyholder interests volatility. In the first half of 2015, the statutory results before tax included a credit to other income
which relates to policyholder interests volatility totalling £83 million (first half of 2014: £43 million) relating to offsetting
movements in equity, bond and gilt returns.
Insurance hedging arrangements
The Group purchased put option contracts in 2015 to protect against deterioration in equity market conditions and the
consequent negative impact on the value of in-force business on the Group balance sheet. These were financed by
selling some upside potential from equity market movements. On a mark-to-market basis a gain of £44 million was
recognised in relation to these contracts in the first half of 2015.
4. Number of employees
At 30 June
2015 At 31 Dec
2014
Retail 33,130 35,032 Commercial Banking 6,473 6,212 Consumer Finance 3,413 3,483 Insurance 1,963 2,015 Group operations, functions and run-off 33,274 32,407 TSB − 7,685
78,253 86,834 Agency staff, interns and scholars (2,628) (2,344)
Total number of employees (full-time equivalent) 75,625 84,490
Total number of employees excluding TSB 76,978
LLOYDS BANKING GROUP PLC 2015 HALF-YEAR RESULTS
Page 28 of 93
RISK MANAGEMENT
PRINCIPAL RISKS AND UNCERTAINTIES
The most significant risks faced by the Group which could impact the success of delivering against the Group’s long-term
strategic objectives and through which global macro-economic, regulatory developments and market liquidity dynamics
could manifest, are detailed below. Except where noted, there has been no significant change to the description of these
risks or key mitigating actions disclosed in the Group’s 2014 Annual Report and Accounts, with any quantitative
disclosures updated herein.
Credit risk – Adverse changes in the economic and market environment or the credit quality of our counterparties and
customers could reduce asset values; potentially increase write-downs and allowances for impairment losses thereby
adversely impacting profitability. Refer to 2014 Annual Report and Accounts for mitigating actions and further details.
Conduct risk – We face significant potential conduct risk, including selling products which do not meet customer needs;
failing to deal with complaints effectively and exhibiting behaviours which do not meet market or regulatory standards.
Refer to 2014 Annual Report and Accounts for mitigating actions and further details.
Market risk – Key market risks include interest rate and credit spread in the Banking business, credit spread and equity
in the Insurance business and the defined benefit pension schemes where asset and liability movements impact on our
capital position. Refer to 2014 Annual Report and Accounts for mitigating actions and further details. In addition, a Group
hedge has been implemented to provide protection from Insurance equity volatility.
Operational risk – Significant operational risks which may result in financial loss, disruption or damage to the reputation
of the Group, including the availability, resilience and security of our core IT systems and the potential for failings in our
customer processes. Refer to 2014 Annual Report and Accounts for mitigating actions and further details.
Capital risk – Future capital position is potentially at risk from a worsening macroeconomic environment, which could
lead to adverse financial performance and deplete capital resources and/or increase capital requirements. Refer to 2014
Annual Report and Accounts for mitigating actions and further details.
Funding and liquidity risk – Our funding and liquidity position is supported by a significant and stable customer deposit
base. A deterioration in either our or the UK’s credit rating, or a sudden and significant withdrawal of customer deposits
could adversely impact our funding and liquidity position. Refer to 2014 Annual Report and Accounts for mitigating
actions and further details. In addition, the Group has a contingency funding plan providing management actions and
strategies available in stressed conditions.

LLOYDS BANKING GROUP PLC 2015 HALF-YEAR RESULTS
Page 29 of 93
PRINCIPAL RISKS AND UNCERTAINTIES (continued)
Legal and regulatory risk – The Group and its businesses are subject to ongoing regulation, associated legal and
regulatory risks, and legal and regulatory actions. They are also subject to the effects of changes in the laws, regulations,
policies, voluntary codes of practice (as well as in their respective interpretations) and court rulings in the UK, the
European Union and the other markets in which the Group operates. These laws and regulations include (i) increased
regulatory oversight, particularly in respect of conduct issues; (ii) prudential regulatory developments; and (iii) industry-
wide initiatives. Depending on the specific nature of the requirements and how they are enforced, such changes could
have a significant impact on the Group's operations, business prospects, structure, costs and/or capital requirements.
Mitigating actions
The Legal, Regulatory and Mandatory Change Committee ensure we drive forward activity to develop plans for
ensuring delivery of all legal and regulatory changes and track their progress against those plans.
Continued investment in our people, processes, training and IT systems is assisting us in meeting our legal and
regulatory commitments.
Engagement with the regulatory authorities on forthcoming regulatory changes, market reviews and CMA
investigations.
Defined and embedded conduct risk strategy.
Governance risk – Against a background of increased regulatory focus on governance and risk management the most
significant challenges arise from the Senior Managers and Certification Regime (SMR) which comes into operation in
March 2016 and the requirement to Ring Fence core UK financial services and activities from January 2019.
Mitigating actions
The Group’s response to SMR is managed through a programme with workstreams addressing the implementation of
each of the major components.
A programme is in place to address the requirements of ring fencing and the Group is in close and regular contact
with regulators to develop the plans for our anticipated operating and legal structures.
Our aim is to ensure that evolving risk and governance arrangements continue to reflect the balance of business in
the Group while adhering to regulatory objectives.
People risk – Key people risks include the risk that the Group may fail to attract and retain talent in an increasingly
competitive marketplace, particularly in the light of the introduction of the Senior Managers and Certification Regime in
2016 which introduces a reverse burden of proof and increased accountability.
Mitigating actions
Focused actions on delivery of strategies to attract, retain and develop high calibre people.
Maintain compliance with legal and regulatory requirements relating to Senior Managers and Certification Regime,
embedding compliant and appropriate colleague behaviours.
Continue focus on the Group’s culture, delivering initiatives which reinforce behaviours to generate the best long-term
outcomes for customers and colleagues.

LLOYDS BANKING GROUP PLC 2015 HALF-YEAR RESULTS
Page 30 of 93
CREDIT RISK PORTFOLIO
Significant reduction in impairments and impaired assets
The impairment charge decreased by 75 per cent from £707 million to £179 million in the first half of 2015 compared
to the first half of 2014. The impairment charge has decreased across all divisions.
The reduction reflects lower levels of new impairment as a result of effective risk management, improving economic
conditions and the continued low interest rate environment.
The impairment charge also benefited from provision releases but at lower levels than seen during the first half of
2014.
The impairment charge as a percentage of average loans and advances to customers improved to 0.09 per cent
compared to 0.30 per cent during the first half of 2014.
Impaired loans as a percentage of closing advances reduced to 2.7 per cent at 30 June 2015, from 2.9 per cent at
31 December 2014 driven by improvements in all divisions. Impaired loans reduced by £1,828 million during the
period, mainly due to disposals, write-offs and lower levels of newly impaired loans.
Low risk culture and prudent risk appetite
The Group is delivering sustainable lending growth by maintaining its lower risk origination discipline despite terms
and conditions in the market being impacted by excess liquidity. The overall quality of the portfolio has improved over
the last 12 months.
The Group continues to deliver above market lending growth in SME whilst maintaining its prudent risk appetite.
The Group continues to adopt a conservative stance across the Eurozone, maintaining close portfolio scrutiny and
oversight. The Group has minimal direct exposure to Greece. Detailed contingency plans are in place and exposures
to financial institutions domiciled in peripheral Eurozone countries remain modest and managed within tight risk
parameters.
Re-shaping of the Group is fundamentally complete
Run-off net external assets have reduced from £16,857 million to £14,411 million during the first half of 2015 in a
capital accretive way.
The Run-off portfolio now represents only 2.7 per cent of the overall Group’s loans and advances and poses
substantially less downside risk to the Group. The remaining assets are the subject of frequent review, and are
impaired to appropriate levels based on external evidence and internal reviews.
The Group continues to reduce its exposure to Ireland with gross loans and advances further reduced by
£1,258 million to £6,642 million gross (net £4,437 million) during the first half of 2015; due to disposals, write-offs and
net repayments.
The Irish wholesale portfolio remains significantly impaired at 91.5 per cent, with provision coverage of 85.8 per cent.
Net exposure in Ireland wholesale has fallen to £572 million (31 December 2014: £956 million).
The Irish Retail portfolio has reduced from £4,464 million at 31 December 2014 to £3,984 million at 30 June 2015.

LLOYDS BANKING GROUP PLC 2015 HALF-YEAR RESULTS
Page 31 of 93
CREDIT RISK PORTFOLIO (continued)
Impairment charge by division
Half-year to 30 June
2015
Half-year to 30 June
2014
Change since
30 June 2014
Half-year to 31 Dec
2014 £m £m % £m Retail:
Secured 49 94 48 187
Loans and overdrafts 102 165 38 114
Other 12 17 29 22
163 276 41 323
Commercial Banking:
SME (4) 5 10
Other 11 24 54 44
7 29 76 54
Consumer Finance:
Credit Cards 21 69 70 117
Asset Finance UK 21 8 22
Asset Finance Europe (2) 1 (2)
40 78 49 137
Run-off:
Ireland retail (2) 13 (19)
Ireland commercial real estate 16 56 71 11
Ireland corporate 59 182 68 65
Corporate real estate and other corporate (52) 92 (120)
Specialist finance (25) 30 (8)
Other (28) (49) (43) (50)
(32) 324 (121)
Central items 1 − 2
Total impairment charge 179 707 75 395 Impairment charge as a % of average advances 0.09% 0.30% (21)bp 0.17%
Total impairment charge comprises:
Half-yearto 30 June
2015
Half-year to 30 June
2014
Half-year to 31 Dec
2014 £m £m £m
Loans and advances to customers 198 705 380
Debt securities classified as loans and receivables (2) − 2
Available-for-sale financial assets − 2 3
Other credit risk provision (17) − 10
Total impairment charge 179 707 395

LLOYDS BANKING GROUP PLC 2015 HALF-YEAR RESULTS
Page 32 of 93
CREDIT RISK PORTFOLIO (continued) Group impaired loans and provisions
At 30 June 2015
Loans and advances to
customers Impaired
Loans
Impaired loans as % of closing advances
Impairment provisions1
Impairmentprovision
as % of impaired
loans2
£m £m % £m %
Retail:
Secured 301,044 3,880 1.3 1,414 36.4
Loans and overdrafts 10,149 641 6.3 195 78.9
Other 3,775 280 7.4 48 19.0
314,968 4,801 1.5 1,657 37.8
Commercial Banking:
SME 29,016 1,352 4.7 264 19.5
Other 72,319 1,357 1.9 919 67.7
101,335 2,709 2.7 1,183 43.7
Consumer Finance:
Credit Cards 9,189 424 4.6 156 78.8
Asset Finance UK 8,386 154 1.8 117 76.0
Asset Finance Europe 4,516 45 1.0 21 46.7
22,091 623 2.8 294 74.1
Run-off:
Ireland retail 3,984 121 3.0 119 98.3
Ireland commercial real estate 1,411 1,326 94.0 1,151 86.8
Ireland corporate 1,247 1,105 88.6 935 84.6
Corporate real estate and other corporate 2,623 1,147 43.7 691 60.2 Specialist finance 4,942 530 10.7 366 69.1
Other 1,386 118 8.5 121 102.5
15,593 4,347 27.9 3,383 77.8
Reverse repos and other items3 5,329 − − − −
Total gross lending 459,316 12,480 2.7 6,517 55.1
Impairment provisions (6,517)
Fair value adjustments4 (372)
Total Group 452,427 1 Impairment provisions include collective unimpaired provisions. 2 Impairment provisions as a percentage of impaired loans are calculated excluding Retail and Consumer Finance loans in recoveries
(£394 million in Retail loans and overdrafts, £27 million in Retail other and £226 million in Consumer Finance credit cards). 3 Includes £5.1 billion (31 December 2014: £4.4 billion) of lower risk loans transferred from Commercial Banking and Retail divisions
into Insurance division’s shareholder funds to support the Insurance division’s annuity portfolio. 4 The fair value adjustments relating to loans and advances were those required to reflect the HBOS assets in the Group’s consolidated
financial records at their fair value and took into account both the expected losses and market liquidity at the date of acquisition. Theunwind relating to future impairment losses requires significant management judgement to determine its timing which includes anassessment of whether the losses incurred in the current period were expected at the date of the acquisition and assessing whetherthe remaining losses expected at the date of the acquisition will still be incurred. The element relating to market liquidity unwinds tothe income statement over the estimated expected lives of the related assets, although if an asset is written-off or suffers previouslyunexpected impairment then this element of the fair value will no longer be considered a timing difference (liquidity) but permanent(impairment). The fair value unwind in respect of impairment losses incurred was £37 million for the period ended 30 June 2015(30 June 2014: £90 million). The fair value unwind in respect of loans and advances is expected to continue to decrease in futureyears as fixed-rate periods on mortgages expire, loans are repaid or written-off, and will reduce to zero over time.

LLOYDS BANKING GROUP PLC 2015 HALF-YEAR RESULTS
Page 33 of 93
CREDIT RISK PORTFOLIO (continued) Group impaired loans and provisions (continued)
At 31 December 2014
Loans and advances to
customers Impaired
Loans
Impaired loans as %
of closing advances
Impairment provisions1
Impairment provision
as % of impaired
loans2
£m £m % £m %
Retail:
Secured 303,121 3,911 1.3 1,446 37.0
Loans and overdrafts 10,395 695 6.7 220 85.3
Other 3,831 321 8.4 68 23.1
317,347 4,927 1.6 1,734 38.8
Commercial Banking:
SME 28,256 1,546 5.5 398 25.7
Other 74,203 1,695 2.3 1,196 70.6
102,459 3,241 3.2 1,594 49.2
Consumer Finance:
Credit Cards 9,119 499 5.5 166 76.5
Asset Finance UK 7,204 160 2.2 112 70.0
Asset Finance Europe 4,950 61 1.2 31 50.8
21,273 720 3.4 309 70.5
Run-off:
Ireland retail 4,464 120 2.7 141 117.5
Ireland commercial real estate 1,797 1,659 92.3 1,385 83.5
Ireland corporate 1,639 1,393 85.0 1,095 78.6
Corporate real estate and other corporate 3,947 1,548 39.2 911 58.9 Specialist finance 4,835 364 7.5 254 69.8
Other 1,634 131 8.0 141 107.6
18,316 5,215 28.5 3,927 75.3
TSB 21,729 205 0.9 88 42.9
Reverse repos and other items3 9,635
Total gross lending 490,759 14,308 2.9 7,652 56.4
Impairment provisions (7,652)
Fair value adjustments (403)
Total Group 482,704 1 Impairment provisions include collective unimpaired provisions. 2 Impairment provisions as a percentage of impaired loans are calculated excluding Retail and Consumer Finance loans in recoveries
(£437 million in Retail loans and overdrafts, £26 million in Retail other and £282 million in Consumer Finance credit cards). 3 Includes £4.4 billion of lower risk loans (social housing, infrastructure and education) transferred from Commercial Banking division
into Insurance division’s shareholder funds to support the Group’s annuity portfolio.

LLOYDS BANKING GROUP PLC 2015 HALF-YEAR RESULTS
Page 34 of 93
CREDIT RISK PORTFOLIO (continued)
Retail
The impairment charge was £163 million in the first half of 2015, a decrease of 41 per cent against the first half of
2014. Reductions were seen across all portfolios.
The impairment charge, as a percentage of average loans and advances to customers, improved to 0.10 per cent in
the first half of 2015 from 0.18 per cent in the first half of 2014.
Impaired loans decreased by £126 million in the first half of 2015 to £4,801 million which represented 1.5 per cent of
closing loans and advances to customers (31 December 2014: 1.6 per cent).
Secured
The impairment charge was £49 million in the first half of 2015, a decrease of 48 per cent against the first half of
2014. The impairment charge as a percentage of average loans and advances to customers, improved to 0.03 per
cent in the first half of 2015 from 0.06 per cent in the first half of 2014.
Impaired loans reduced by £31 million in the first half of 2015 to £3,880 million. Impairment provisions as a
percentage of impaired loans decreased to 36.4 per cent from 37.0 per cent at 31 December 2014.
The value of mortgages greater than three months in arrears (excluding repossessions) decreased by £175 million to
£6,169 million at 30 June 2015 compared to £6,344 million at 31 December 2014.
The average indexed loan to value (LTV) on the mortgage portfolio at 30 June 2015 decreased to 45.9 per cent
compared with 49.2 per cent at 31 December 2014. The percentage of closing loans and advances with an indexed
LTV in excess of 100 per cent decreased to 1.2 per cent at 30 June 2015, compared with 2.2 per cent at
31 December 2014.
The average LTV for new mortgages and further advances written in the first half of 2015 was 64.6 per cent
compared with 64.8 per cent for 2014.
Loans and overdrafts
The impairment charge was £102 million in the first half of 2015, a decrease of 38 per cent against the first half of
2014. The reduction was driven by a continued underlying improvement of portfolio quality supported by write-backs
from the sale of recoveries assets.
The impairment charge as a percentage of average loans and advances to customers, improved to 1.94 per cent in
the first half of 2015 from 3.09 per cent in the first half of 2014.
Impaired loans reduced by £54 million in the first half of 2015 to £641 million representing 6.3 per cent of closing
loans and advances to customers, compared with 6.7 per cent at 31 December 2014. Retail secured and unsecured loans and advances to customers
At 30 June
2015 At 31 Dec
2014 £m £m
Mainstream 226,174 228,176
Buy-to-let 54,172 53,322
Specialist1 20,698 21,623
301,044 303,121 Loans 8,068 8,204
Overdrafts 2,081 2,191
Wealth 2,895 2,962
Retail Business Banking 880 869
13,924 14,226
Total 314,968 317,347 1 Specialist lending has been closed to new business since 2009.

LLOYDS BANKING GROUP PLC 2015 HALF-YEAR RESULTS
Page 35 of 93
CREDIT RISK PORTFOLIO (continued) Retail (continued) Retail mortgages greater than three months in arrears (excluding repossessions)
Number of cases Total mortgage
accounts % Value of loans1 Total mortgage
balances %
June 2015
Dec 2014
June2015
Dec 2014
June2015
Dec 2014
June 2015
Dec 2014
Cases Cases % % £m £m % % Mainstream 36,556 37,849 1.6 1.7 3,960 4,102 1.8 1.8
Buy-to-let 5,147 5,077 1.1 1.1 651 658 1.2 1.2
Specialist 9,252 9,429 6.4 6.3 1,558 1,584 7.5 7.3
Total 50,955 52,355 1.8 1.8 6,169 6,344 2.0 2.1 1 Value of loans represents total book value of mortgages more than three months in arrears. The stock of repossessions decreased to 601 cases at 30 June 2015 compared to 1,740 cases at 31 December 2014. Period end and average LTVs across the Retail mortgage portfolios At 30 June 2015 Mainstream Buy-to-let Specialist Total Unimpaired Impaired % % % % % %
Less than 60% 52.9 44.5 41.0 50.6 50.9 30.0
60% to 70% 21.1 29.3 21.2 22.5 22.6 18.1
70% to 80% 15.4 14.1 17.5 15.3 15.3 18.6
80% to 90% 7.6 8.9 12.3 8.2 8.1 13.9
90% to 100% 2.1 2.1 4.2 2.2 2.1 9.3
Greater than 100% 0.9 1.1 3.8 1.2 1.0 10.1
Total 100.0 100.0 100.0 100.0 100.0 100.0
Outstanding loan value (£m) 226,174 54,172 20,698 301,044 297,164 3,880 Average loan to value:1
Stock of residential mortgages 43.3 56.7 54.4 45.9
New residential lending 65.0 62.7 n/a 64.6
Impaired mortgages 55.3 74.4 67.3 59.9 At 31 December 2014 Mainstream Buy-to-let Specialist Total Unimpaired Impaired % % % % % %
Less than 60% 44.6 32.4 31.4 41.5 41.7 22.5
60% to 70% 19.9 27.3 19.5 21.2 21.3 15.3
70% to 80% 18.5 21.8 19.8 19.2 19.2 17.8
80% to 90% 10.6 9.4 14.9 10.7 10.6 16.7
90% to 100% 4.5 6.8 8.7 5.2 5.2 11.9
Greater than 100% 1.9 2.3 5.7 2.2 2.0 15.8
Total 100.0 100.0 100.0 100.0 100.0 100.0
Outstanding loan value (£m) 228,176 53,322 21,623 303,121 299,210 3,911 Average loan to value:1
Stock of residential mortgages 46.3 61.3 59.2 49.2
New residential lending 65.3 62.7 n/a 64.8
Impaired mortgages 60.1 81.0 72.6 64.9 1 Average loan to value is calculated as total loans and advances as a percentage of the total collateral of these loans and advances.

LLOYDS BANKING GROUP PLC 2015 HALF-YEAR RESULTS
Page 36 of 93
CREDIT RISK PORTFOLIO (continued)
Commercial Banking
The impairment charge was £7 million in the first half of 2015, 76 per cent lower than the £29 million in the first half of
2014. This has been driven by lower levels of new impairment as a result of effective risk management, improving
economic conditions and the continued low interest rate environment.
The charge also benefited from provision releases but at lower levels than seen during 2014.
The obligor quality of the Commercial Banking lending portfolio is predominantly rated good or better. New business
is generally of good quality and better than the overall back book average. Surplus market liquidity continues to lead
to some relaxation of credit conditions in the marketplace, although the Group remains disciplined within its low risk
appetite.
The impairment charge as a percentage of average loans and advances improved to 0.04 per cent in the first half of
2015 from 0.05 per cent in the first half of 2014, and from 0.10 per cent for the half year to 31 December 2014.
Impaired loans reduced by 16.4 per cent to £2,709 million at 30 June 2015 compared with 31 December 2014
(£3,241 million). Impaired loans as a percentage of closing loans and advances to customers reduced to 2.7 per cent
from 3.2 per cent at 31 December 2014.
Impairment provisions reduced to £1,183 million at 30 June 2015 (December 2014: £1,594 million) and includes
collective unimpaired provisions of £277 million (December 2014: £338 million).
SME
The SME Banking portfolio continues to grow within prudent credit risk appetite parameters. As a result of the
Group’s customer driven relationship management, net lending has increased 5 per cent since June 2014. This also
reflects the Group’s commitment to the UK economy and the Funding for Lending Scheme.
Portfolio credit quality has remained stable or improved across all key metrics.
There was a net release of £4 million compared to a net charge of £5 million in the first half of 2014. SME continues
to benefit from provision releases which offset minimal gross charges incurred.
Other Commercial Banking
Other Commercial Banking comprises £72,319 million of gross loans and advances to customers in Mid Markets,
Global Corporates and Financial Institutions.
The Mid Markets portfolio remains UK focused and dependent on the performance of the domestic economy. Overall
credit quality remained stable.
The Global Corporate portfolio continues to be predominantly investment grade focused and is performing well
against the backdrop of a stable economic UK environment. The quality of the portfolio remains good and is
managed within the bank’s prudent agreed risk appetite.
The real estate business within the Group’s Mid Markets and Global Corporate portfolio is focused upon the larger
end of the UK property market ranging from medium sized and substantial unquoted private real estate portfolios up
to the publicly listed and funds sector. Portfolio credit quality remains good being underpinned by seasoned
management teams with proven asset management skills. The number of new impaired connections is minimal and
new business propositions continue to be written in line with agreed risk appetite.
Financial Institutions serves predominantly investment grade counterparties with whom relationships are either client
focused or held to support the Group’s funding, liquidity or general hedging requirements.
Trading exposures continue to be predominantly short-term and/or collateralised with inter-bank activity mainly
undertaken with fully acceptable investment grade counterparties.
The Group continues to adopt a conservative stance across the Eurozone maintaining close portfolio scrutiny and
oversight particularly given the current macro environment and horizon risks.
LLOYDS BANKING GROUP PLC 2015 HALF-YEAR RESULTS
Page 37 of 93
CREDIT RISK PORTFOLIO (continued)
Consumer Finance
The impairment charge reduced by 49 per cent to £40 million in the first half of 2015 compared to £78 million in the
first half of 2014. The reduction was driven by a continued underlying improvement of portfolio quality supported by
write-backs from the sale of recoveries assets in the Credit Cards portfolio.
Impaired loans decreased by £97 million in the first half of 2015 to £623 million which represented 2.8 per cent of
closing loans and advances to customers (31 December 2014: 3.4 per cent).
Run-off
Ireland
Within the Ireland book the most significant contribution to impaired loans is the Commercial Real Estate portfolio
where 94.0 per cent of the portfolio is impaired. The impairment coverage ratio has increased to 86.8 per cent from
83.5 per cent at 31 December 2014, predominantly due to the impact of deleveraging activities. Net lending in Ireland
Commercial Real Estate has reduced to £260 million (31 December 2014: £412 million).
Total impaired loans within the Irish retail mortgage portfolio are broadly stable at £121 million (31 December 2014:
£118 million). The average indexed loan to value (LTV) at 30 June 2015 increased to 89.5 per cent compared with
88.5 per cent at December 2014. The percentage of closing loans and advances with an indexed LTV in excess of
100 per cent decreased to 38.2 per cent at 30 June 2015, compared with 38.9 per cent at 31 December 2014.
Corporate real estate and other corporate
This portfolio predominantly consists of UK real estate loans together with other Corporate loans relating to real
estate sectors, supported by trading activities (such as hotels, housebuilders and care homes).
The continuing proactive management by the specialist teams in line with improvement in real estate market
conditions has enabled a number of write-backs on previously impaired loans during 2015, with a net impairment
write-back of £52 million in the first half of 2015, compared to an impairment charge of £92 million in the first half of
2014.
Net loans and advances reduced by £1,104 million, from £3,036 million to £1,932 million for the first six months of
2015 (36 per cent reduction versus 35 per cent for first six months of 2014) as the portfolio continues to reduce
significantly ahead of expectations.
Specialist Finance
Net loans and advances for the Specialist Finance Asset Based Run-off portfolio stood at £4,576 million at 30 June
2015 (gross £4,942 million), and include Ship Finance, Aircraft Finance and Infrastructure, with around half of the
remaining lending in the lower risk leasing sector.
The portfolio also includes a reducing Treasury Asset legacy investment portfolio, which together with operating
leases, gives total net external assets of £6,226 million at 30 June 2015 (gross £6,592 million).

LLOYDS BANKING GROUP PLC 2015 HALF-YEAR RESULTS
Page 38 of 93
CREDIT RISK PORTFOLIO (continued)
Run-off (continued)
Ireland retail mortgage LTV analysis
At 30 June 2015 Unimpaired Impaired Total £m % £m % £m %
Less than 60% 878 22.7 17 14.1 895 22.5
60% to 70% 322 8.3 5 4.1 327 8.2
70% to 80% 373 9.7 6 5.0 379 9.5
80% to 100% 843 21.8 19 15.7 862 21.6
100% to 120% 842 21.8 16 13.2 858 21.5
120% to 140% 445 11.5 17 14.1 462 11.6
Greater than 140% 160 4.2 41 33.8 201 5.1
Total 3,863 100.0 121 100.0 3,984 100.0
Average loan to value:
Stock of residential mortgages 89.5
Impaired mortgages 151.2
At 31 December 2014 Unimpaired Impaired Total £m % £m % £m %
Less than 60% 979 22.5 18 15.2 997 22.4
60% to 70% 356 8.2 4 3.4 360 8.1
70% to 80% 425 9.8 4 3.4 429 9.6
80% to 100% 925 21.3 14 11.9 939 21.0
100% to 120% 933 21.5 15 12.7 948 21.2
120% to 140% 505 11.6 14 11.9 519 11.6
Greater than 140% 221 5.1 49 41.5 270 6.1
Total 4,344 100.0 118 100.0 4,462 100.0
Average loan to value:
Stock of residential mortgages 88.5
Impaired mortgages 124.7

LLOYDS BANKING GROUP PLC 2015 HALF-YEAR RESULTS
Page 39 of 93
CREDIT RISK PORTFOLIO (continued)
Forbearance
The Group operates a number of schemes to assist borrowers who are experiencing financial stress. Forbearance
policies are disclosed in Note 54 of the Group’s 2014 Annual Report and Accounts, pages 305 to 314.
Retail forbearance
At 30 June 2015, UK retail secured loans and advances currently or recently subject to forbearance were 1.3 per cent
(31 December 2014: 1.4 per cent) of total UK retail secured loans and advances.
At 30 June 2015, unsecured retail loans and advances currently or recently subject to forbearance were 1.4 per cent
(31 December 2014: 1.6 per cent) of total unsecured retail loans and advances. Further analysis of the forborne loan
balances is set out below.
UK retail lending
Total loans and advances which are currently or recently
forborne
Total current and recent forborne loans and advances which are
impaired1
Impairment provisions as % of loans and
advances which are currently or recently
forborne
At June
2015 At Dec
2014 At June
2015 At Dec
2014 At June
2015 At Dec
2014 £m £m £m £m % % UK secured lending:
Temporary forbearance arrangements
Reduced contractual monthly payment 82 146 9 29 2.1 6.0 Reduced payment arrangements 428 552 55 69 4.4 3.4
510 698 64 98 4.0 4.0 Permanent treatments Repair and term extensions 3,263 3,696 159 168 4.5 3.5
Total 3,773 4,394 223 266 4.4 3.5
UK unsecured lending:
Loans and overdrafts 147 162 120 139 37.2 39.4 1
£3,550 million of current and recent forborne UK Secured loans and advances were not impaired at 30 June 2015 (31 December2014: £4,128 million). £27 million of current and recent forborne loans and overdrafts were not impaired at 30 June 2015(31 December 2014: £23 million).

LLOYDS BANKING GROUP PLC 2015 HALF-YEAR RESULTS
Page 40 of 93
CREDIT RISK PORTFOLIO (continued)
Commercial Banking forbearance
At 30 June 2015, £3,927 million (December 2014: £5,137 million) of total loans and advances were forborne of which
£2,709 million (December 2014: £3,241 million) were impaired. The coverage ratio for forborne loans decreased from
31.0 per cent at 31 December 2014 to 30.1 per cent at 30 June 2015.
Unimpaired forborne loans and advances were £1,218 million at 30 June 2015 (December 2014: £1,896 million). The
table below sets out the Group’s largest unimpaired forborne loans and advances to commercial customers (exposures
over £5 million) as at 30 June 2015 by type of forbearance:
30 June
2015 31 Dec
2014 £m £m Type of unimpaired forbearance:
UK1 exposures > £5m
Covenants 421 1,018
Extensions 333 426
Multiple 72 6
826 1,450
Exposures < £5m and other non-UK1 392 446
Total 1,218 1,896 1 Based on location of the office recording the transaction.
Consumer Finance forbearance
At 30 June 2015, Consumer Credit Cards loans and advances currently or recently subject to forbearance were
2.6 per cent (31 December 2014: 2.6 per cent) of total Consumer Credit Cards loans and advances. At 30 June 2015,
Asset Finance retail loans and advances on open portfolios currently subject to forbearance were 1.7 per cent
(31 December 2014: 2.1 per cent) of total Asset Finance retail loans and advances.
Analysis of the forborne loan balances
Total loans and advances which are
forborne
Total forborne loans and advances which are
impaired1
Impairment provisions as % of loans and
advances which are forborne
30 June
2015 31 Dec
2014 30 June
2015 31 Dec
2014 30 June
2015 31 Dec
2014 £m £m £m £m % %
Consumer Credit Cards 234 234 127 140 26.4 29.1
Asset Finance 103 109 52 53 25.8 20.5 1 £158 million of current and recent forborne loans and advances (Consumer Credit Cards: £107 million, Asset Finance: £51 million)
were not impaired at 30 June 2015 (31 December 2014: Consumer Credit Cards: £94 million, Asset Finance: £56 million).
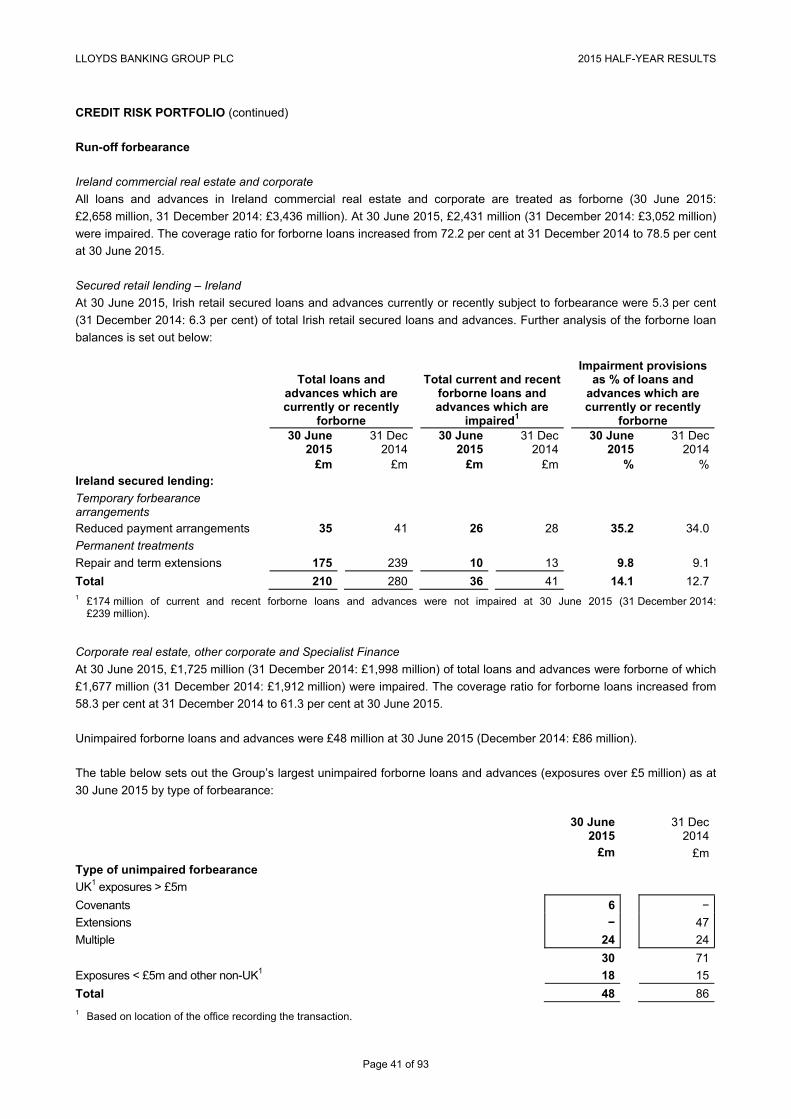
LLOYDS BANKING GROUP PLC 2015 HALF-YEAR RESULTS
Page 41 of 93
CREDIT RISK PORTFOLIO (continued)
Run-off forbearance
Ireland commercial real estate and corporate
All loans and advances in Ireland commercial real estate and corporate are treated as forborne (30 June 2015:
£2,658 million, 31 December 2014: £3,436 million). At 30 June 2015, £2,431 million (31 December 2014: £3,052 million)
were impaired. The coverage ratio for forborne loans increased from 72.2 per cent at 31 December 2014 to 78.5 per cent
at 30 June 2015.
Secured retail lending – Ireland
At 30 June 2015, Irish retail secured loans and advances currently or recently subject to forbearance were 5.3 per cent
(31 December 2014: 6.3 per cent) of total Irish retail secured loans and advances. Further analysis of the forborne loan
balances is set out below:
Total loans and advances which are currently or recently
forborne
Total current and recent forborne loans and advances which are
impaired1
Impairment provisions as % of loans and
advances which are currently or recently
forborne
30 June
2015 31 Dec
2014 30 June
2015 31 Dec
2014 30 June
2015 31 Dec
2014 £m £m £m £m % % Ireland secured lending:
Temporary forbearance arrangements Reduced payment arrangements 35 41 26 28 35.2 34.0
Permanent treatments
Repair and term extensions 175 239 10 13 9.8 9.1
Total 210 280 36 41 14.1 12.7 1 £174 million of current and recent forborne loans and advances were not impaired at 30 June 2015 (31 December 2014:
£239 million).
Corporate real estate, other corporate and Specialist Finance
At 30 June 2015, £1,725 million (31 December 2014: £1,998 million) of total loans and advances were forborne of which
£1,677 million (31 December 2014: £1,912 million) were impaired. The coverage ratio for forborne loans increased from
58.3 per cent at 31 December 2014 to 61.3 per cent at 30 June 2015.
Unimpaired forborne loans and advances were £48 million at 30 June 2015 (December 2014: £86 million).
The table below sets out the Group’s largest unimpaired forborne loans and advances (exposures over £5 million) as at
30 June 2015 by type of forbearance:
30 June
2015 31 Dec
2014 £m £m Type of unimpaired forbearance
UK1 exposures > £5m
Covenants 6 −
Extensions − 47
Multiple 24 24
30 71
Exposures < £5m and other non-UK1 18 15
Total 48 86 1 Based on location of the office recording the transaction.

LLOYDS BANKING GROUP PLC 2015 HALF-YEAR RESULTS
Page 42 of 93
FUNDING AND LIQUIDITY MANAGEMENT
The Group’s funding position has been significantly strengthened and the Group has transformed its balance sheet
structure in recent years. As a result the Group has set a new loan to deposit ratio range of 105 per cent to 110 per cent,
which the Group remained comfortably within during the first half of 2015. During this period the Group has also
maintained the liquidity buffer at a broadly consistent level.
Total funded assets reduced by £25.3 billion to £468.1 billion. Loans and advances to customers, excluding reverse
repos, reduced by £25.3 billion and customer deposits, excluding repos, decreased by £30.6 billion all primarily driven by
the sale of TSB. Excluding TSB, loans and advances decreased by £3.7 billion with increased net lending in Consumer
Finance offset by reductions in the run off portfolio. Customer deposits on an equivalent basis decreased by £6 billion
with increases in Commercial Banking offset by reductions in retail tactical deposits and online deposits within Consumer
Finance.
Wholesale funding has reduced by £0.5 billion to £116.0 billion, with the volume with a residual maturity less than one
year remaining broadly stable at £38.9 billion (£41.1 billion at 31 December 2014). The Group’s term funding ratio
(wholesale funding with a remaining life of over one year as a percentage of total wholesale funding) increased to
66 per cent (65 per cent at 31 December 2014).
During the first half of 2015 the Group’s term issuance costs have remained broadly in line with 2014 and significantly
lower than previous years. Term wholesale funding demand has been lower in recent years as the Group contracted its
balance sheet. The Group now has a stable and managed term wholesale funding programme, consistent with the stable
balance sheet. Term funding volumes are expected to remain broadly consistent with 2015 over the next few years.
Standard and Poor’s, Moody’s and Fitch have now completed their reviews of Lloyds Bank's ratings following the UK
implementation of the EU Bank Recovery and Resolution Directive. In all cases, Lloyds Bank’s ratings were either
reaffirmed or upgraded due to the delivery of our strategy to be a low risk, customer focused UK bank and/or recognition
of the protection Lloyds’ sizeable subordinated debt buffer provides to senior creditors. In particular, Fitch upgraded
Lloyds Bank to ‘A+’ from ‘A’ and revised the outlook to ‘Stable’ from ‘Negative’. Moody’s affirmed Lloyds’ rating at ‘A1’
and improved the outlook to ‘Positive’ from ‘Rating Under Review Negative’. S&P affirmed Lloyds’ rating at ‘A’ and
improved the outlook to ‘Stable’ from ‘Credit Watch Negative’. Following these rating actions, Lloyds Bank's median
rating has improved to ‘A+’ (previously ‘A’). The effects of a potential downgrade from all three rating agencies are
included in the Group liquidity stress testing.
The Liquidity Coverage Ratio (LCR) is due to become the Pillar 1 standard for liquidity in the UK from October 2015.
Following finalisation of requirements from the PRA, the Group expects to meet the minimum requirements and has a
robust and well governed reporting framework in place for both regulatory reporting and internal management
information.
The combination of a strong balance sheet and access to a wide range of funding markets, including government and
central bank schemes, provides the Group with a broad range of options with respect to funding the balance sheet in the
future, including in the event of a severe market dislocation.

LLOYDS BANKING GROUP PLC 2015 HALF-YEAR RESULTS
Page 43 of 93
FUNDING AND LIQUIDITY MANAGEMENT (continued)
Group funding position
At 30 June
2015 At 31 Dec
2014 Change £bn £bn % Funding requirement
Loans and advances to customers1 452.3 477.6 (5)
Loans and advances to banks2 4.8 3.0 60
Debt securities 1.6 1.2 33
Reverse repurchase agreements − − −
Available-for-sale financial assets – secondary3 5.1 8.0 (36)
Cash balances4 4.3 3.6 19
Funded assets 468.1 493.4 (5)
Other assets5 253.1 265.2 (5)
721.2 758.6 (5)
On balance sheet primary liquidity assets6
Reverse repurchase agreements 0.5 7.0 (93)
Balances at central banks – primary4 63.4 46.9 35
Available-for-sale financial assets – primary 27.1 48.5 (44)
Held-to-maturity financial assets – primary 20.0 −
Trading and fair value through profit and loss (3.1) (6.1) (49)
Repurchase agreements (6.3) −
101.6 96.3 6
Total Group assets 822.8 854.9 (4)
Less: other liabilities5 (242.0) (240.3) 1
Funding requirement 580.8 614.6 (5)
Funded by
Customer deposits7 416.5 447.1 (7)
Wholesale funding8 116.0 116.5 −
532.5 563.6 (6)
Repurchase agreements 0.3 1.1 (73)
Total equity 48.0 49.9 (4)
Total funding 580.8 614.6 (5) 1 Excludes £0.1 billion (31 December 2014: £5.1 billion) of reverse repurchase agreements. 2 Excludes £18.3 billion (31 December 2014: £21.3 billion) of loans and advances to banks within the Insurance business and
£0.4 billion (31 December 2014: £1.9 billion) of reverse repurchase agreements. 3 Secondary liquidity assets comprise a diversified pool of highly rated unencumbered collateral (including retained issuance). 4 Cash balances and balances at central banks – primary are combined in the Group’s balance sheet. 5 Other assets and other liabilities primarily include balances in the Group’s Insurance business and the fair value of derivative assets
and liabilities. 6 Primary liquidity assets are PRA eligible liquid assets, including UK Gilts, US Treasuries, Euro AAA government debt, designated
multilateral development bank debt and unencumbered cash balances held at central banks. 7 Excluding repurchase agreements at 30 June 2015 of £0.1 billion (31 December 2014: £nil). 8 The Group’s definition of wholesale funding aligns with that used by other international market participants; including interbank
deposits, debt securities in issue and subordinated liabilities.

LLOYDS BANKING GROUP PLC 2015 HALF-YEAR RESULTS
Page 44 of 93
FUNDING AND LIQUIDITY MANAGEMENT (continued)
Reconciliation of Group funding to the balance sheet
At 30 June 2015
Included in funding
analysis Repos
Fair value and other
accounting methods
Balance sheet
£bn £bn £bn £bn
Deposits from banks 8.9 8.1 − 17.0
Debt securities in issue 84.0 − (6.2) 77.8
Subordinated liabilities 23.1 − (0.5) 22.6
Total wholesale funding 116.0 8.1
Customer deposits 416.5 0.1 − 416.6
Total 532.5 8.2
At 31 December 2014
Included in funding
analysis Repos
Fair value and other
accounting methods
Balance sheet
£bn £bn £bn £bn
Deposits from banks 9.8 1.1 − 10.9
Debt securities in issue 80.6 − (4.4) 76.2
Subordinated liabilities 26.1 − (0.1) 26.0
Total wholesale funding 116.5 1.1
Customer deposits 447.1 − − 447.1
Total 563.6 1.1
Analysis of 2015 total wholesale funding by residual maturity
Less than one
month
One to three
months
Three to six
months
Six to nine
months
Ninemonths
to one year
One to two
years
Two to five
years
More than five
years
Totalat
30 June 2015
Total at
31 Dec 2014
£bn £bn £bn £bn £bn £bn £bn £bn £bn £bn
Deposit from banks 6.8 1.1 0.3 0.3 − 0.1 − 0.3 8.9 9.8
Debt securities in issue:
Certificates of deposit 1.0 2.5 1.3 3.1 1.0 − − − 8.9 6.8
Commercial paper 2.4 2.6 0.3 0.4 0.2 − − − 5.9 7.3
Medium-term notes1 0.8 1.1 1.2 1.5 1.9 4.8 10.8 11.9 34.0 29.2
Covered bonds 1.2 − − − 1.2 6.7 4.5 10.6 24.2 25.2
Securitisation 0.5 1.3 2.0 1.1 0.6 2.7 1.8 1.0 11.0 12.1
5.9 7.5 4.8 6.1 4.9 14.2 17.1 23.5 84.0 80.6
Subordinated liabilities − 0.6 0.2 0.2 0.2 3.3 6.5 12.1 23.1 26.1
Total wholesale funding2 1 12.7 9.2 5.3 6.6 5.1 17.6 23.6 35.9 116.0 116.5 1 Medium-term notes include funding from the National Loan Guarantee Scheme (30 June 2015: £1.4 billion; 31 December 2014:
£1.4 billion). 2 The Group’s definition of wholesale funding aligns with that used by other international market participants; including interbank
deposits, debt securities in issue and subordinated liabilities.

LLOYDS BANKING GROUP PLC 2015 HALF-YEAR RESULTS
Page 45 of 93
FUNDING AND LIQUIDITY MANAGEMENT (continued)
Analysis of 2015 term issuance
Sterling US Dollar Euro Other
currencies Total £bn £bn £bn £bn £bn
Securitisation 0.7 0.9 − − 1.6
Medium-term notes 0.3 3.5 1.8 0.8 6.4
Covered bonds 1.5 − − − 1.5
Private placements1 0.7 1.3 1.3 − 3.3
Subordinated liabilities − − − − −
Total issuance 3.2 5.7 3.1 0.8 12.8 1 Private placements include structured bonds and term repurchase agreements (repos).
Term issuance for the first half of 2015 totalled £12.8 billion with the majority across medium term notes and private
placements. Utilisation of the UK government’s Funding for Lending Scheme (FLS) has further underlined the Group’s
support to the UK economic recovery and the Group remains committed to passing the benefits of this low cost funding
on to its customers. As of 30 June 2015, the Group had drawn £24 billion under the FLS. The maturities for the FLS are
fully factored into the Group’s funding plan.
Liquidity portfolio
At 30 June 2015, the Banking business had £109.0 billion (31 December 2014: £109.3 billion) of highly liquid
unencumbered assets in its primary liquidity portfolio which are available to meet cash and collateral outflows and PRA
regulatory requirements. A separate liquidity portfolio to mitigate Insurance liquidity risk is managed within the Insurance
business. Primary liquid assets are broadly equivalent to the Group’s total wholesale funding, and thus provides a
substantial buffer in the event of continued market dislocation.
Primary liquidity At 30 June
2015 At 31 Dec
2014 Average
2015 Average
2014 £bn £bn £bn £bn
Central bank cash deposits 63.4 46.9 64.6 62.3
Government/MDB bonds1 45.6 62.4 47.6 47.9
Total 109.0 109.3 112.2 110.2
Secondary liquidity At 30 June
2015 At 31 Dec
2014 Average
2015 Average
2014 £bn £bn £bn £bn
High-quality ABS/covered bonds2 3.4 3.9 3.7 3.6
Credit institution bonds2 0.1 0.9 0.6 1.4
Corporate bonds2 0.2 0.6 0.5 0.3
Own securities (retained issuance) 16.4 20.6 17.8 22.2
Other securities 5.7 5.7 6.0 5.5
Other3 62.7 67.5 66.7 74.1
Total 88.5 99.2 95.3 107.1
Total liquidity 197.5 208.5 1 Designated multilateral development bank (MDB). 2 Assets rated A- or above. 3 Includes other central bank eligible assets.

LLOYDS BANKING GROUP PLC 2015 HALF-YEAR RESULTS
Page 46 of 93
FUNDING AND LIQUIDITY MANAGEMENT (continued)
In addition the Banking business had £88.5 billion (31 December 2014: £99.2 billion) of secondary liquidity, the vast
majority of which is eligible for use in a range of central bank or similar facilities and the Group routinely makes use of as
part of its normal liquidity management practices. Future use of such facilities will be based on prudent liquidity
management and economic considerations, having regard for external market conditions.
The entire primary liquidity portfolio and a subset of the secondary portfolio are LCR eligible. The Group considers
diversification across geography, currency, markets and tenor when assessing appropriate holdings of primary and
secondary liquid assets. This liquidity is managed as a single pool in the centre and is under the control of the function
charged with managing the liquidity of the Group. It is available for deployment at immediate notice, subject to complying
with regulatory requirements, and is a key component of the Group’s liquidity management process.
Encumbered assets
The Board and Group Asset & Liability Committee monitor and manage total balance sheet encumbrance via a number
of risk appetite metrics. At 30 June 2015, the Group had £134.7 billion (31 December 2014: £134.9 billion) of externally
encumbered and £688.1 billion (31 December 2014: £720.0 billion) of unencumbered on balance sheet assets. Primarily
the Group encumbers mortgages, lending and credit card receivables through the issuance programmes and tradable
securities through securities financing activity. Refer to the 2014 Annual Report and Accounts for further details on how
the Group classifies assets for encumbrance purposes.

LLOYDS BANKING GROUP PLC 2015 HALF-YEAR RESULTS
Page 47 of 93
CAPITAL MANAGEMENT
The Group continued to strengthen its Common Equity Tier 1 (CET1) ratio during the first half of 2015 through increased
underlying profits and a reduction in risk-weighted assets. The positive impact of these items was partly offset by the
interim dividend, conduct charges and the disposal of TSB.
The CET1 ratio increased 0.5 percentage points from 12.8 per cent to 13.3 per cent.
The leverage ratio has remained stable at 4.9 per cent.
The transitional total capital ratio reduced 0.3 percentage points from 22.0 per cent to 21.7 per cent.
Regulatory capital developments
The regulatory capital framework within which the Group operates continues to be developed at global, European and
UK levels focusing on RWA calibration, leverage and bail in requirements, examples of which include the following:
At a global level the Basel Committee has issued consultation papers on the capital treatment of interest rate risk in
the banking book (IRRBB) and on proposed revisions to the framework for the capital charge relating to Credit
Valuation Adjustment (CVA) variability. We also await the outcome of the, now closed, consultations on proposed
revisions to the Standardised Approach risk-weight framework in addition to initial proposals on the design of a new
capital floors framework. In the meantime the fundamental review of the trading book (FRTB) is ongoing.
At a European level the European Banking Authority (EBA) has issued recommendations about the CVA capital
treatment, including the possible removal of EU exemptions and final draft Regulatory Technical Standards (RTS) on
Prudent Valuation Adjustments (PVA) and the criteria for determining minimum requirements for own funds and
eligible liabilities (MREL).
In the UK the PRA is consulting on proposals for implementing the UK leverage ratio framework as recommended
by the Financial Policy Committee. It has also recently finalised proposals to reform the Pillar 2 framework, including
new approaches for determining Pillar 2A capital requirements and the setting of Pillar 2B capital requirements (the
PRA buffer).
The Group continues to monitor these developments very closely, analysing the potential capital impacts to ensure the
Group continues to maintain a strong capital position that exceeds the minimum regulatory requirements and the Group’s
risk appetite and is consistent with market expectations.
The Group is subject to Pillar 2A Individual Capital Guidance (ICG) from the PRA. This reflects a point in time estimate
by the PRA, which may change over time, of the amount of capital that is needed in relation to risks not covered by
Pillar 1. The Group’s underlying ICG remains unchanged over the half-year and as at 30 June 2015 equated to 3.9 per
cent of risk-weighted assets, of which 2.2 per cent must be covered by CET1 capital. The 10 basis point increase in
these percentages over the half-year is as a result of lower risk-weighted assets.
Capital position at 30 June 2015
The Group’s capital position as at 30 June 2015 is presented in the following section applying CRD IV transitional
arrangements, as implemented in the UK by the PRA, and also on a fully loaded CRD IV basis.

LLOYDS BANKING GROUP PLC 2015 HALF-YEAR RESULTS
Page 48 of 93
CAPITAL MANAGEMENT (continued)
Transitional Fully loaded
Capital resources At 30 June
2015 At 31 Dec
2014 At 30 June
2015 At 31 Dec
2014 £m £m £m £m Common equity tier 1
Shareholders’ equity per balance sheet 42,256 43,335 42,256 43,335 Adjustment to retained earnings for foreseeable dividends (535) (535) (535) (535)Deconsolidation of insurance entities1 (1,262) (824) (1,262) (824)
Adjustment for own credit 116 158 116 158
Cash flow hedging reserve (429) (1,139) (429) (1,139)
Other adjustments 239 333 239 333
40,385 41,328 40,385 41,328
less: deductions from common equity tier 1
Goodwill and other intangible assets (1,779) (1,875) (1,779) (1,875)Excess of expected losses over impairment provisions and value adjustments (394) (565) (394) (565)Removal of defined benefit pension surplus (718) (909) (718) (909)
Securitisation deductions (211) (211) (211) (211)
Significant investments1 (2,575) (2,546) (2,575) (2,546)
Deferred tax assets (4,551) (4,533) (4,551) (4,533)
Common equity tier 1 capital 30,157 30,689 30,157 30,689
Additional tier 1
Other equity instruments 5,355 5,355 5,355 5,355
Preference shares and preferred securities2 4,528 4,910 − -
Transitional limit and other adjustments (706) (537) − -
9,177 9,728 5,355 5,355
less: deductions from tier 1
Significant investments1 (1,180) (859) − −
Total tier 1 capital 38,154 39,558 35,512 36,044
Tier 2
Other subordinated liabilities2 18,111 21,132 18,111 21,132
Deconsolidation of instruments issued by
insurance entities1 (2,133) (2,522) (2,133)
(2,522)
Adjustments for non-eligible instruments (467) (675) (1,095) (1,857)
Amortisation and other adjustments (3,224) (3,738) (4,840) (5,917)
12,287 14,197 10,043 10,836
Eligible provisions 475 333 475 333
less: deductions from tier 2
Significant investments1 (1,759) (1,288) (2,939) (2,146)
Total capital resources 49,157 52,800 43,091 45,067
Risk-weighted assets 226,980 239,734 226,980 239,734
Common equity tier 1 capital ratio 13.3% 12.8% 13.3% 12.8%
Tier 1 capital ratio 16.8% 16.5% 15.6% 15.0%
Total capital ratio 21.7% 22.0% 19.0% 18.8% 1 For regulatory capital purposes, the Group’s Insurance business is deconsolidated and replaced by the amount of the Group’s
investment in the business. A part of this amount is deducted from capital (shown as ‘significant investments’ in the table above) andthe remaining amount is risk weighted, forming part of threshold risk-weighted assets.
2 Preference shares, preferred securities and other subordinated liabilities are categorised as subordinated liabilities in the balancesheet.

LLOYDS BANKING GROUP PLC 2015 HALF-YEAR RESULTS
Page 49 of 93
CAPITAL MANAGEMENT (continued)
The key differences between the transitional capital calculation as at 30 June 2015 and the fully loaded equivalent are as
follows:
Capital securities that previously qualified as tier 1 or tier 2 capital, but do not fully qualify under CRD IV, can be
included in tier 1 or tier 2 capital (as applicable) up to specified limits which reduce by 10 per cent per annum
until 2022.
The significant investment deduction from AT1 will gradually transition to tier 2.
The movements in the transitional CET1, AT1, tier 2 and total capital positions in the period are provided below.
Common
Equity Tier 1 Additional
Tier 1 Tier 2 Total
capital £m £m £m £m
At 31 December 2014 30,689 8,869 13,242 52,800
Profit attributable to ordinary shareholders1 600 600
Eligible minority interest (470) (470)Adjustment to retained earnings for foreseeable dividends (535) (535)
Movement in treasury shares and employee share schemes (269) (269)Pension movements:
Removal of defined benefit pension surplus 191 191
Movement through other comprehensive income (242) (242)
Available-for-sale reserve (67) (67)
Deferred tax asset (18) (18)
Goodwill and other intangible assets 96 96
Excess of expected losses over impairment provisions and value adjustments 171 171 Significant investments (29) (321) (471) (821)
Eligible provisions 142 142
Subordinated debt movements:
Repurchases, redemptions and other (551) (1,910) (2,461)
Other movements 40 40
At 30 June 2015 30,157 7,997 11,003 49,157
1 Profits made by Insurance are removed from CET1 capital. However, when dividends are paid to the Group by Insurance these are
recognised through CET1 capital.
CET1 capital resources have reduced by £532 million in the period, largely due to the removal of eligible minority interest
related to TSB, the interim dividend and movements in treasury shares and employee share schemes. The reductions
were partially offset by profit attributable to ordinary shareholders, reflecting underlying profit offset by conduct charges
and the disposal of TSB, and a reduction in the excess of expected losses over impairment provisions and value
adjustments.
AT1 capital resources have reduced by £872 million in the period, primarily reflecting the annual reduction in the
transitional limit applied to grandfathered AT1 capital instruments and an increase in significant investments.
Tier 2 capital resources have reduced by £2,239 million in the period largely reflecting calls and redemptions,
amortisation of dated instruments, foreign exchange movements and an increase in significant investments, partially
offset by an increase in eligible provisions.

LLOYDS BANKING GROUP PLC 2015 HALF-YEAR RESULTS
Page 50 of 93
CAPITAL MANAGEMENT (continued)
Risk-weighted assets At 30 June
2015 At 31 Dec
2014 £m £m Foundation Internal Ratings Based (IRB) Approach 70,367 72,393
Retail IRB Approach 67,529 72,886
Other IRB Approach 17,385 15,324
IRB Approach 155,281 160,603
Standardised Approach 21,117 25,444
Contributions to the default fund of a central counterparty 280 515
Credit risk 176,678 186,562
Counterparty credit risk 8,006 9,108
Credit valuation adjustment risk 2,172 2,215
Operational risk 26,279 26,279
Market risk 3,629 4,746
Underlying risk-weighted assets 216,764 228,910
Threshold risk-weighted assets1 10,216 10,824
Total risk-weighted assets 226,980 239,734 1 Threshold risk-weighted assets reflect the element of significant investments and deferred tax assets that are permitted to be
risk-weighted instead of deducted from common equity tier 1 capital under threshold rules. Significant investments primarily arise frominvestment in the Group’s Insurance business.
Risk-weighted assets movement by key driver
Credit risk1
Counterparty
credit risk1Market
risk Operational
risk Total £m £m £m £m £mRisk-weighted assets at 31 December 2014 186,562 11,323 4,746 26,279 228,910 Management of the balance sheet (1,849) (572) (309) − (2,730)
Disposals (5,818) (2) − − (5,820)
External economic factors (3,185) (491) (19) − (3,695)
Model and methodology changes 1,054 (108) (789) − 157 Regulatory policy change − − − − − Other (86) 28 − − (58)
Risk-weighted assets 176,678 10,178 3,629 26,279 216,764
Threshold risk-weighted assets 10,216
Total risk-weighted assets 226,980 1 Credit risk includes movements in contributions to the default fund of central counterparties and counterparty credit risk includes the
movements in credit valuation adjustment risk.
LLOYDS BANKING GROUP PLC 2015 HALF-YEAR RESULTS
Page 51 of 93
CAPITAL MANAGEMENT (continued)
The risk-weighted assets movement tables provide analyses of the movement in risk-weighted assets in the period by
risk type and an insight into the key drivers of the movements. The key driver analysis is compiled on a monthly basis
through the identification and categorisation of risk-weighted asset movements and is subject to management judgment.
Credit risk-weighted assets reduced from £186.6 billion to £176.7 billion driven by the following key movements:
Management of the balance sheet includes risk-weighted asset movements arising from new lending and asset
run-off. During the first half of 2015, risk-weighted assets decreased by £1.8 billion as a result of the active
management of lending portfolios, partially offset by targeted lending growth.
Disposals include risk-weighted asset reductions arising from the sale of assets, portfolios and businesses. Disposals
reduced risk-weighted assets by £5.8 billion, primarily driven by the completion of the sale of TSB as well as other
small disposals and related reductions in sundry debtors.
External economic factors capture movements driven by changes in the economic environment. The reduction in
risk-weighted assets of £3.2 billion is mainly due to improvements in credit quality and favourable foreign exchange
rate movements.
Model and methodology changes include the movement in risk-weighted assets arising from new model
implementation, model enhancement and changes in credit risk approach applied to certain portfolios. The increase
in risk-weighted assets of £1.1 billion is principally driven by an update to models in Commercial Banking.
Counterparty credit risk reductions of £1.1 billion reflect reduced mark to market valuations and trade compressions.
Market risk-weighted assets reduced by £1.1 billion, reflecting continued optimisation of the balance sheet as a result of
active portfolio management across Financial Markets, and market risk model changes.
Enhanced Capital Notes (ECNs)
In 2009 the Group undertook a significant capital raising exercise which included the issuance of approximately
£8.3 billion of ECNs. Approximately £3.3 billion of these ECNs remain outstanding.
Upon issuance, the ECNs contributed to going concern capital in stress tests applied by the regulator and were
structured with a conversion trigger in excess of the then minimum regulatory requirements and stress test threshold.
However, given subsequent changes to regulatory capital rules, including changes in the definition of core capital, the
conversion trigger for the ECNs is substantially below today’s minimum regulatory requirements and stress test
thresholds. The terms of the ECNs provide the Group with the right to call any series of these ECNs at par or a
make-whole price in the event that they cease to be taken into account as core capital for the purposes of any stress test
applied by the Prudential Regulation Authority (PRA) (a Capital Disqualification Event).
After the ECNs were not taken into account for the purpose of core capital for the 2014 PRA stress test, the Group
announced on 16 December 2014 that it intended to approach the PRA to seek permission to redeem certain series of
ECNs. On 31 March 2015 such permission was received from the PRA under Article 78 of the Capital Requirements
Regulation (Regulation 575/2013/EU). The Group also notified investors that the Trustee intended to seek a declaratory
judgment in respect of the interpretation of certain terms of the ECNs.
On 3 June 2015, the Chancery Division of the High Court handed down its judgment in respect of the ECNs, in which it
found that a Capital Disqualification Event had not occurred. The Group has filed an appeal with the Court of Appeal and
the hearing is expected to take place in the week commencing 24 August 2015.

LLOYDS BANKING GROUP PLC 2015 HALF-YEAR RESULTS
Page 52 of 93
CAPITAL MANAGEMENT (continued)
Leverage ratio
In January 2015 the existing CRD IV rules on the calculation of the leverage ratio were amended to align with the
European Commission’s interpretation of the revised Basel III leverage ratio framework. The Group’s leverage ratio has
been calculated in accordance with the amended CRD IV rules on leverage.
Fully loaded
At 30 June
2015 At 31 Dec
20141
£m £m Total tier 1 capital for leverage ratio
Common equity tier 1 capital 30,157 30,689
Additional tier 1 capital 5,355 5,355
Total tier 1 capital 35,512 36,044 Exposure measure Statutory balance sheet assets
Derivative financial instruments 27,980 36,128
Securities financing transactions (SFTs) 33,668 43,772
Loans and advances and other assets 761,184 774,996
Total assets 822,832 854,896 Deconsolidation adjustments2
Derivative financial instruments (1,421) (1,663)
Securities financing transactions (SFTs) 1,908 1,655
Loans and advances and other assets (145,491) (144,114)
Total deconsolidation adjustments (145,004) (144,122) Derivatives adjustments
Adjustment for regulatory netting (18,515) (24,187)
Adjustment to cash collateral 1,058 (1,024)
Net written credit protection 309 425
Regulatory potential future exposure 12,407 12,722
Total derivatives adjustments (4,741) (12,064) Counterparty credit risk add-on for SFTs 1,022 1,364 Off-balance sheet items 55,695 50,980 Regulatory deductions and other adjustments (9,636) (10,362)
Total exposure 720,168 740,692 Leverage ratio 4.9% 4.9% 1 Restated to align with the amended CRD IV rules on leverage implemented in January 2015. 2 Deconsolidation adjustments predominantly reflect the deconsolidation of assets related to Group subsidiaries that fall outside the
scope of the Group’s regulatory capital consolidation (primarily the Group’s insurance entities).

LLOYDS BANKING GROUP PLC 2015 HALF-YEAR RESULTS
Page 53 of 93
CAPITAL MANAGEMENT (continued)
Key movements
The Group’s fully loaded leverage ratio remained stable at 4.9 per cent with the impact of the reduction in tier 1 capital
entirely offset by the £20.5 billion reduction in the exposure measure, the latter largely reflecting the reduction in balance
sheet assets arising, in part, from the disposal of TSB.
The derivatives exposure measure, representing derivative financial instruments per the balance sheet net of
deconsolidation and derivatives adjustments, reduced by £0.6 billion primarily reflecting market movements and trade
compressions offset by adjustments for ineligible cash collateral.
The SFT exposure measure, representing SFTs per the balance sheet inclusive of deconsolidation adjustments and
counterparty credit risk add-on, reduced by £10.2 billion reflecting active balance sheet management, reduced trading
volumes and further application of eligible on-balance sheet netting.
Off-balance sheet items increased by £4.7 billion, partly reflecting new mortgage offers placed during the period.

LLOYDS BANKING GROUP PLC 2015 HALF-YEAR RESULTS
Page 54 of 93
STATUTORY INFORMATION
Page
Condensed consolidated half-year financial statements (unaudited)
Consolidated income statement 55
Consolidated statement of comprehensive income 56
Consolidated balance sheet 57
Consolidated statement of changes in equity 59
Consolidated cash flow statement 62
Notes
1 Accounting policies, presentation and estimates 63
2 Segmental analysis 64
3 Operating expenses 67
4 Impairment 67
5 Taxation 68
6 Earnings per share 68
7 Trading and other financial assets at fair value through profit or loss 69
8 Derivative financial instruments 69
9 Loans and advances to customers 70
10 Debt securities in issue 70
11 Post-retirement defined benefit schemes 71
12 Provisions for liabilities and charges 72
13 Contingent liabilities and commitments 75
14 Fair values of financial assets and liabilities 78
15 Related party transactions 86
16 Disposal of interest in TSB Banking Group plc 87
17 Ordinary dividends 88
18 Events since the balance sheet date 88
19 Future accounting developments 88
20 Other information 89

LLOYDS BANKING GROUP PLC 2015 HALF-YEAR RESULTS
Page 55 of 93
CONDENSED CONSOLIDATED HALF-YEAR FINANCIAL STATEMENTS (UNAUDITED)
CONSOLIDATED INCOME STATEMENT
Half-year to30 June
2015
Half-year to 30 June
2014
Half-year to 31 Dec
2014 Note £ million £ million £ million
Interest and similar income 8,975 9,728 9,483
Interest and similar expense (3,483) (4,466) (4,085)
Net interest income 5,492 5,262 5,398
Fee and commission income 1,598 1,836 1,823
Fee and commission expense (607) (609) (793)
Net fee and commission income 991 1,227 1,030
Net trading income 3,018 4,588 5,571
Insurance premium income 1,414 3,492 3,633
Other operating income 890 (535) 226
Other income 6,313 8,772 10,460
Total income 11,805 14,034 15,858
Insurance claims (2,998) (6,338) (7,155)
Total income, net of insurance claims 8,807 7,696 8,703
Regulatory provisions (1,835) (1,100) (2,025)
Other operating expenses (5,618) (5,092) (5,668)
Total operating expenses 3 (7,453) (6,192) (7,693)
Trading surplus 1,354 1,504 1,010
Impairment 4 (161) (641) (111)
Profit before tax 1,193 863 899
Taxation 5 (268) (164) (99)
Profit for the period 925 699 800
Profit attributable to ordinary shareholders 677 574 551
Profit attributable to other equity holders1 197 91 196
Profit attributable to equity holders 874 665 747
Profit attributable to non-controlling interests 51 34 53
Profit for the period 925 699 800
Basic earnings per share 6 1.0p 0.8p 0.8p
Diluted earnings per share 6 1.0p 0.8p 0.8p 1 The profit after tax attributable to other equity holders of £197 million (half-year to 30 June 2014: £91 million; half-year to
31 December 2014: £196 million) is offset in reserves by a tax credit attributable to ordinary shareholders of £40 million (half-year to 30 June 2014: £20 million; half-year to 31 December 2014: £42 million).

LLOYDS BANKING GROUP PLC 2015 HALF-YEAR RESULTS
Page 56 of 93
CONDENSED CONSOLIDATED HALF-YEAR FINANCIAL STATEMENTS (UNAUDITED) (continued)
CONSOLIDATED STATEMENT OF COMPREHENSIVE INCOME
Half-year to
30 June 2015
Half-year to 30 June
2014
Half-year to 31 Dec
2014 £ million £ million £ million
Profit for the period 925 699 800
Other comprehensive income
Items that will not subsequently be reclassified to profit
or loss:
Post-retirement defined benefit scheme remeasurements (note 11):
Remeasurements before taxation (302) (599) 1,273
Taxation 60 120 (255)
(242) (479) 1,018
Items that may subsequently be reclassified to profit or loss:
Movements in revaluation reserve in respect of available-for-sale financial assets:
Change in fair value (16) 557 133
Income statement transfers in respect of disposals (49) (85) (46)
Income statement transfers in respect of impairment − 2 −
Taxation (2) (51) 38
(67) 423 125
Movements in cash flow hedging reserve:
Effective portion of changes in fair value (404) 1,008 2,888
Net income statement transfers (481) (572) (581)
Taxation 175 (86) (463)
(710) 350 1,844
Currency translation differences (tax: nil) 27 (1) (2)
Other comprehensive income for the period, net of tax (992) 293 2,985
Total comprehensive income for the period (67) 992 3,785
Total comprehensive income attributable to ordinary shareholders (315) 867 3,536
Total comprehensive income attributable to other equity holders 197 91 196
Total comprehensive income attributable to equity holders (118) 958 3,732 Total comprehensive income attributable to non-controlling interests 51 34 53
Total comprehensive income for the period (67) 992 3,785

LLOYDS BANKING GROUP PLC 2015 HALF-YEAR RESULTS
Page 57 of 93
CONDENSED CONSOLIDATED HALF-YEAR FINANCIAL STATEMENTS (UNAUDITED) (continued)
CONSOLIDATED BALANCE SHEET
At 30 June
2015
At 31 Dec
2014 Assets Note £ million £ million
Cash and balances at central banks 67,687 50,492
Items in course of collection from banks 1,159 1,173
Trading and other financial assets at fair value through profit or loss 7 147,849 151,931
Derivative financial instruments 8 27,980 36,128
Loans and receivables:
Loans and advances to banks 23,548 26,155
Loans and advances to customers 9 452,427 482,704
Debt securities 1,569 1,213
477,544 510,072
Available-for-sale financial assets 32,173 56,493
Held-to-maturity investments 19,960 −
Investment properties 4,702 4,492
Goodwill 2,016 2,016
Value of in-force business 4,863 4,864
Other intangible assets 1,942 2,070
Tangible fixed assets 8,154 8,052
Current tax recoverable 195 127
Deferred tax assets 4,039 4,145
Retirement benefit assets 11 908 1,147
Other assets 21,661 21,694
Total assets 822,832 854,896

LLOYDS BANKING GROUP PLC 2015 HALF-YEAR RESULTS
Page 58 of 93
CONDENSED CONSOLIDATED HALF-YEAR FINANCIAL STATEMENTS (UNAUDITED) (continued)
CONSOLIDATED BALANCE SHEET (continued)
At 30 June
2015
At 31 Dec
2014 Equity and liabilities Note £ million £ million
Liabilities
Deposits from banks 16,966 10,887
Customer deposits 416,595 447,067
Items in course of transmission to banks 790 979
Trading and other financial liabilities at fair value through profit or loss 63,328 62,102
Derivative financial instruments 8 27,778 33,187
Notes in circulation 1,090 1,129
Debt securities in issue 10 77,776 76,233
Liabilities arising from insurance contracts and participating investment contracts 81,183 86,918 Liabilities arising from non-participating investment contracts 26,131 27,248
Unallocated surplus within insurance businesses 290 320
Other liabilities 35,251 28,105
Retirement benefit obligations 11 467 453
Current tax liabilities 24 69
Deferred tax liabilities 40 54
Other provisions 4,443 4,200
Subordinated liabilities 22,639 26,042
Total liabilities 774,791 804,993
Equity
Share capital 7,146 7,146
Share premium account 17,292 17,281
Other reserves 12,455 13,216
Retained profits 5,363 5,692
Shareholders’ equity 42,256 43,335
Other equity instruments 5,355 5,355
Total equity excluding non-controlling interests 47,611 48,690
Non-controlling interests 430 1,213
Total equity 48,041 49,903
Total equity and liabilities 822,832 854,896

LLOYDS BANKING GROUP PLC 2015 HALF-YEAR RESULTS
Page 59 of 93
CONDENSED CONSOLIDATED HALF-YEAR FINANCIAL STATEMENTS (UNAUDITED) (continued)
CONSOLIDATED STATEMENT OF CHANGES IN EQUITY
Attributable to equity shareholders
Share capital
and premium
Other reserves
Retained profits Total
Other equity
instruments
Non-
controlling interests Total
£ million £ million £ million £ million £ million £ million £ million
Balance at 1 January 2015 24,427 13,216 5,692 43,335 5,355 1,213 49,903
Comprehensive income
Profit for the period – − 874 874 – 51 925
Other comprehensive income
Post-retirement defined benefit scheme remeasurements, net of tax – – (242) (242) – – (242)
Movements in revaluation reserve in respect of available-for-sale financial assets, net of tax – (67) – (67) – – (67)Movements in cash flow hedging reserve, net of tax – (710) – (710) – – (710)Currency translation differences (tax: nil) – 27 – 27 – – 27
Total other comprehensive income – (750) (242) (992) – – (992)
Total comprehensive income – (750) 632 (118) – 51 (67)
Transactions with owners
Dividends – − (535) (535) – (10) (545)
Distributions on other equity instruments, net of tax – – (157) (157) – – (157)Redemption of preference shares 11 (11) – – – – – Movement in treasury shares – – (479) (479) – – (479)
Value of employee services:
Share option schemes – – 60 60 – – 60
Other employee award schemes – – 150 150 – – 150
Adjustment on sale of interest in TSB Banking Group plc (TSB) (note 16) – – – – – (825) (825)Other changes in non-controlling interests – – – – – 1 1
Total transactions with owners 11 (11) (961) (961) – (834) (1,795)Balance at 30 June 2015 24,438 12,455 5,363 42,256 5,355 430 48,041

LLOYDS BANKING GROUP PLC 2015 HALF-YEAR RESULTS
Page 60 of 93
CONDENSED CONSOLIDATED HALF-YEAR FINANCIAL STATEMENTS (UNAUDITED) (continued)
CONSOLIDATED STATEMENT OF CHANGES IN EQUITY (continued)
Attributable to equity shareholders
Share capital
and premium
Other reserves
Retained profits Total
Other equity
instruments
Non-
controlling interests Total
£ million £ million £ million £ million £ million £ million £ million
Balance at 1 January 2014 24,424 10,477 4,088 38,989 – 347 39,336
Comprehensive income
Profit for the period – − 665 665 – 34 699
Other comprehensive income
Post-retirement defined benefit scheme remeasurements, net of tax – – (479) (479) – – (479)
Movements in revaluation reserve in respect of available-for-sale financial assets, net of tax – 423 – 423 – – 423 Movements in cash flow hedging reserve, net of tax – 350 – 350 – – 350 Currency translation differences (tax: nil) – (1) – (1) – – (1)
Total other comprehensive income – 772 (479) 293 – – 293
Total comprehensive income – 772 186 958 – 34 992
Transactions with owners
Dividends – − − − – (8) (8)
Distributions on other equity instruments, net of tax – – (71) (71) – – (71)Issue of ordinary shares 3 – – 3 – – 3
Issue of Additional Tier 1 securities – – (26) (26) 5,355 – 5,329 Movement in treasury shares – – (263) (263) – – (263)
Value of employee services:
Share option schemes – – 21 21 – – 21
Other employee award schemes – – 99 99 – – 99
Adjustment on sale of non-controlling interest in TSB – – (135) (135) – 565 430 Other changes in non-controlling interests – – – – – 10 10
Total transactions with owners 3 – (375) (372) 5,355 567 5,550
Balance at 30 June 2014 24,427 11,249 3,899 39,575 5,355 948 45,878

LLOYDS BANKING GROUP PLC 2015 HALF-YEAR RESULTS
Page 61 of 93
CONDENSED CONSOLIDATED HALF-YEAR FINANCIAL STATEMENTS (UNAUDITED) (continued)
CONSOLIDATED STATEMENT OF CHANGES IN EQUITY (continued)
Attributable to equity shareholders
Share capital
and premium
Other reserves
Retained profits Total
Other equity
instruments
Non-
controlling interests Total
£ million £ million £ million £ million £ million £ million £ million
Balance at 1 July 2014 24,427 11,249 3,899 39,575 5,355 948 45,878
Comprehensive income
Profit for the period – − 747 747 – 53 800
Other comprehensive income
Post-retirement defined benefit scheme remeasurements, net of tax – – 1,018 1,018 – – 1,018
Movements in revaluation reserve in respect of available-for-sale financial assets, net of tax – 125 – 125 – – 125 Movements in cash flow hedging reserve, net of tax – 1,844 – 1,844 – – 1,844 Currency translation differences (tax: nil) – (2) – (2) – – (2)
Total other comprehensive income – 1,967 1,018 2,985 – – 2,985
Total comprehensive income – 1,967 1,765 3,732 – 53 3,785
Transactions with owners
Dividends – − − − – (19) (19)
Distributions on other equity instruments, net of tax – – (154) (154) – – (154)Issue of other equity instruments – – 5 5 – – 5 Movement in treasury shares – – (23) (23) – – (23)
Value of employee services:
Share option schemes – – 102 102 – – 102
Other employee award schemes – – 134 134 – – 134
Adjustment on sale of non-controlling interest in TSB (36) (36) – 240 204 Other changes in non-controlling interests – – – – – (9) (9)
Total transactions with owners − – 28 28 – 212 240
Balance at 31 December 2014 24,427 13,216 5,692 43,335 5,355 1,213 49,903

LLOYDS BANKING GROUP PLC 2015 HALF-YEAR RESULTS
Page 62 of 93
CONDENSED CONSOLIDATED HALF-YEAR FINANCIAL STATEMENTS (UNAUDITED) (continued)
CONSOLIDATED CASH FLOW STATEMENT
Half-year to30 June
2015
Half-year to 30 June
2014
Half-year to 31 Dec
2014 £ million £ million £ million
Profit before tax 1,193 863 899
Adjustments for:
Change in operating assets 26,512 1,932 (2,804)
Change in operating liabilities 81 3,172 8,820
Non-cash and other items (6,417) 1,651 (4,147)
Tax (paid) received (49) 2 (35)
Net cash provided by operating activities 21,320 7,620 2,733
Cash flows from investing activities
Purchase of financial assets (12,358) (7,363) (4,170)
Proceeds from sale and maturity of financial assets 14,838 1,685 2,983
Purchase of fixed assets (1,564) (1,651) (1,791)
Proceeds from sale of fixed assets 526 725 1,318
Acquisition of businesses, net of cash acquired − (1) −
Disposal of businesses, net of cash disposed (4,282) 536 7
Net cash used in investing activities (2,840) (6,069) (1,653)
Cash flows from financing activities
Dividends paid to ordinary shareholders (535) − −
Distributions on other equity instruments (197) (91) (196)
Dividends paid to non-controlling interests (10) (8) (19)
Interest paid on subordinated liabilities (1,250) (1,416) (789)
Proceeds from issue of subordinated liabilities − − 629
Proceeds from issue of ordinary shares − 3 −
Repayment of subordinated liabilities (2,068) (1,240) (1,783)
Changes in non-controlling interests 1 440 195
Net cash used in financing activities (4,059) (2,312) (1,963)
Effects of exchange rate changes on cash and cash equivalents (2) 4 (10)
Change in cash and cash equivalents 14,419 (757) (893)
Cash and cash equivalents at beginning of period 65,147 66,797 66,040
Cash and cash equivalents at end of period 79,566 66,040 65,147
Cash and cash equivalents comprise cash and balances at central banks (excluding mandatory deposits) and amounts
due from banks with a maturity of less than three months.

LLOYDS BANKING GROUP PLC 2015 HALF-YEAR RESULTS
Page 63 of 93
1. Accounting policies, presentation and estimates
These condensed consolidated half-year financial statements as at and for the period to 30 June 2015 have been
prepared in accordance with the Disclosure Rules and Transparency Rules of the Financial Conduct Authority (FCA) and
with International Accounting Standard 34 (IAS 34), Interim Financial Reporting as adopted by the European Union and
comprise the results of Lloyds Banking Group plc (the Company) together with its subsidiaries (the Group). They do not
include all of the information required for full annual financial statements and should be read in conjunction with the
Group’s consolidated financial statements as at and for the year ended 31 December 2014 which were prepared in
accordance with International Financial Reporting Standards (IFRS) as adopted by the European Union. Copies of the
2014 Annual Report and Accounts are available on the Group’s website and are available upon request from Investor
Relations, Lloyds Banking Group plc, 25 Gresham Street, London EC2V 7HN.
The British Bankers’ Association’s Code for Financial Reporting Disclosure (the Disclosure Code) sets out disclosure
principles together with supporting guidance in respect of the financial statements of UK banks. The Group has adopted
the Disclosure Code and these condensed consolidated half-year financial statements have been prepared in
compliance with the Disclosure Code’s principles. Terminology used in these condensed consolidated half-year financial
statements is consistent with that used in the Group’s 2014 Annual Report and Accounts where a glossary of terms can
be found.
The directors consider that it is appropriate to continue to adopt the going concern basis in preparing the condensed
consolidated half-year financial statements. In reaching this assessment, the directors have considered projections for
the Group’s capital and funding position and have had regard to the factors set out in Principal risks and uncertainties:
Funding and liquidity on page 28.
The accounting policies are consistent with those applied by the Group in its 2014 Annual Report and Accounts.
During the half-year to 30 June 2015, government debt securities with a carrying value of £19,938 million, previously
classified as available-for-sale, were reclassified to held-to-maturity. Unrealised gains on the transferred securities of
£194 million previously taken to equity continue to be held in the available-for-sale revaluation reserve and will be
amortised to the income statement over the remaining lives of the securities using the effective interest method or until
the assets become impaired.
Future accounting developments
Details of those IFRS pronouncements which will be relevant to the Group but which will not be effective at 31 December
2015 and which have not been applied in preparing these financial statements are set out in note 19.
Critical accounting estimates and judgements
The preparation of the Group’s financial statements requires management to make judgements, estimates and
assumptions that impact the application of accounting policies and the reported amounts of assets, liabilities, income and
expenses. Due to the inherent uncertainty in making estimates, actual results reported in future periods may include
amounts which differ from those estimates. Estimates, judgements and assumptions are continually evaluated and are
based on historical experience and other factors, including expectations of future events that are believed to be
reasonable under the circumstances. There have been no significant changes in the basis upon which estimates have
been determined, compared to that applied at 31 December 2014.

LLOYDS BANKING GROUP PLC 2015 HALF-YEAR RESULTS
Page 64 of 93
2. Segmental analysis
Lloyds Banking Group provides a wide range of banking and financial services in the UK and in certain locations
overseas. The Group Executive Committee (GEC) remains the chief operating decision maker for the Group.
The segmental results and comparatives are presented on an underlying basis, the basis reviewed by the chief operating
decision maker. The effects of asset sales, volatile items, the insurance grossing adjustment, liability management,
Simplification costs, TSB build and dual-running costs, the charge relating to the TSB disposal, regulatory provisions,
certain past service pension credits or charges, the amortisation of purchased intangible assets and the unwind of
acquisition-related fair value adjustments are excluded in arriving at underlying profit.
Following the announcement of the sale of TSB to Banco Sabadell, the Group no longer considers TSB to be a separate
financial reporting segment and as a consequence its results are included in Other. The Group’s activities are organised
into four financial reporting segments: Retail; Commercial Banking; Consumer Finance and Insurance. There has been
no change to the descriptions of these segments as provided in note 4 to the Group’s financial statements for the year
ended 31 December 2014.
There has been no change to the Group’s segmental accounting for internal segment services or derivatives entered into
by units for risk management purposes since 31 December 2014.
Half-year to 30 June 2015
Net interest income
Otherincome,
net of insurance
claims
Totalincome,
net of insurance
claims
Profit (loss)
before tax External revenue
Inter- segment revenue
£m £m £m £m £m £mUnderlying basis
Retail 3,743 559 4,302 1,839 4,629 (327)
Commercial Banking 1,234 1,023 2,257 1,193 1,842 415
Consumer Finance 658 677 1,335 539 1,462 (127)
Insurance (73) 1,025 952 584 1,241 (289)
Other 345 − 345 228 17 328
Group 5,907 3,284 9,191 4,383 9,191 −
Reconciling items:
Insurance grossing adjustment (241) 287 46 −
Asset sales, volatile items and liability management1 26 (384) (358) (355) Volatility relating to the insurance business − 18 18 18 Simplification costs − − − (32)
TSB build and dual-running costs − − − (85)
Charge relating to the TSB disposal − 5 5 (660) Payment protection insurance provision − − − (1,400) Other conduct provisions − − − (435)
Amortisation of purchased intangibles − − − (164) Fair value unwind (200) 105 (95) (77)
Group – statutory 5,492 3,315 8,807 1,193 1 Comprises (i) losses on disposals of assets which are not part of normal business operations (£52 million); (ii) the net effect of
banking volatility, changes in the fair value of the equity conversion feature of the Group’s Enhanced Capital Notes and net derivativevaluation adjustments (losses of £297 million); and (iii) the results of liability management exercises (losses of £6 million).

LLOYDS BANKING GROUP PLC 2015 HALF-YEAR RESULTS
Page 65 of 93
2. Segmental analysis (continued)
Half-year to 30 June 2014
Net interest income
Other income,
net of insurance
claims
Total income,
net of insurance
claims
Profit (loss)
before tax External revenue
Inter- segment revenue
£m £m £m £m £m £m Underlying basis
Retail 3,493 700 4,193 1,710 4,497 (304)
Commercial Banking 1,234 984 2,218 1,156 1,785 433
Consumer Finance 645 675 1,320 534 1,377 (57)
Insurance (64) 854 790 461 859 (69)
Other 496 235 731 (42) 734 (3)
Group 5,804 3,448 9,252 3,819 9,252 –
Reconciling items:
Insurance grossing adjustment (239) 314 75 –
Asset sales, volatile items and liability management1 10 (1,135) (1,125) (1,130) Volatility relating to the insurance business – (122) (122) (122) Simplification costs – – – (519)
TSB build and dual-running costs – – – (309)
Payment protection insurance provision – – – (600) Other conduct provisions – – – (500)
Past service credit2 – – – 710
Amortisation of purchased intangibles – – – (171) Fair value unwind (313) (71) (384) (315)
Group – statutory 5,262 2,434 7,696 863 1 Comprises (i) gains or losses on disposals of assets which are not part of normal business operations (£94 million); (ii) the net effect
of banking volatility, changes in the fair value of the equity conversion feature of the Group’s Enhanced Capital Notes and net derivative valuation adjustments (gain of £152 million); and (iii) the results of liability management exercises (losses of £1,376 million).
2 This represents the curtailment credit of £843 million following the Group’s decision to reduce the cap on pensionable pay (see note 3) partly offset by the cost of other changes to the pay, benefits and reward offered to employees.

LLOYDS BANKING GROUP PLC 2015 HALF-YEAR RESULTS
Page 66 of 93
2. Segmental analysis (continued)
Half-year to 31 December 2014
Net interest income
Other income,
net of insurance
claims
Total income,
net of insurance
claims Profit (loss)
before tax External revenue
Inter- segment revenue
£m £m £m £m £m £m Underlying basis
Retail 3,586 512 4,098 1,518 4,537 (439)
Commercial Banking 1,246 972 2,218 1,050 2,015 203
Consumer Finance 645 689 1,334 476 1,426 (92)
Insurance (67) 871 804 461 347 457
Other 547 115 662 432 791 (129)
Group 5,957 3,159 9,116 3,937 9,116 −
Reconciling items:
Insurance grossing adjustment (243) 300 57 –
Asset sales, volatile items and liability management1 (3) 16 13 168 Volatility relating to the insurance business – (106) (106) (106) Simplification costs – (22) (22) (447)
TSB build and dual-running costs – – – (249)
Payment protection insurance provision – – – (1,600) Other conduct provisions – – – (425) Amortisation of purchased intangibles – – – (165) Fair value unwind (313) (42) (355) (214)
Group – statutory 5,398 3,305 8,703 899 1 Comprises (i) gains on disposals of assets which are not part of normal business operations (£44 million); (ii) the net effect of banking
volatility, changes in the fair value of the equity conversion feature of the Group’s Enhanced Capital Notes and net derivativevaluation adjustments (gains of £134 million); and (iii) the results of liability management exercises (losses of £10 million).
Segment external
assets Segment customer
deposits Segment external
liabilities
At 30 June
2015
At 31 Dec
2014
At30 June
2015
At 31 Dec
2014
At 30 June
2015
At 31 Dec
2014 £m £m £m £m £m £m
Retail 315,088 317,246 278,231 285,539 286,376 295,880
Commercial Banking 179,530 241,754 125,407 119,882 232,024 231,400
Consumer Finance 26,514 25,646 11,423 14,955 16,502 18,581
Insurance 150,899 150,615 − − 144,915 144,921
Other 150,801 119,635 1,534 26,691 94,974 114,211
Total Group 822,832 854,896 416,595 447,067 774,791 804,993

LLOYDS BANKING GROUP PLC 2015 HALF-YEAR RESULTS
Page 67 of 93
3. Operating expenses
Half-year to30 June
2015
Half-year to 30 June
2014
Half-year to 31 Dec
2014 £m £m £m Administrative expenses
Staff costs:
Salaries and social security costs 1,859 2,074 1,892
Pensions and other post-retirement benefit schemes1 278 (530) 304
Restructuring and other staff costs 273 513 492
2,410 2,057 2,688
Premises and equipment 360 444 447
Other expenses:
Communications and data processing 436 595 523
UK bank levy − − 237
TSB disposal (note 16) 665 – –
Other 740 1,046 788
1,841 1,641 1,548
4,611 4,142 4,683
Depreciation and amortisation 1,007 950 985
Total operating expenses, excluding regulatory provisions 5,618 5,092 5,668
Regulatory provisions:
Payment protection insurance provision (note 12) 1,400 600 1,600
Other regulatory provisions (note 12) 435 500 425
1,835 1,100 2,025
Total operating expenses 7,453 6,192 7,693 1 On 11 March 2014 the Group announced a change to its defined benefit pension schemes, revising the existing cap on the increases
in pensionable pay used in calculating the pension benefit, from 2 per cent to nil with effect from 2 April 2014. The effect of thischange was to reduce the Group's retirement benefit obligations recognised on the balance sheet by £843 million with acorresponding curtailment gain recognised in the income statement in the half-year to 30 June 2014, partly offset by a charge of£21 million following changes to pension arrangements for staff within the TSB business.
4. Impairment
Half-year to30 June
2015
Half-year to 30 June
2014
Half-year to 31 Dec
2014 £m £m £m Impairment losses on loans and receivables:
Loans and advances to customers 181 639 96
Debt securities classified as loans and receivables (2) − 2
Impairment losses on loans and receivables 179 639 98
Impairment of available-for-sale financial assets − 2 3
Other credit risk provisions (18) − 10
Total impairment charged to the income statement 161 641 111

LLOYDS BANKING GROUP PLC 2015 HALF-YEAR RESULTS
Page 68 of 93
5. Taxation
A reconciliation of the tax charge that would result from applying the standard UK corporation tax rate to the profit before
tax, to the actual tax charge, is given below:
Half-year to30 June
2015
Half-year to 30 June
2014
Half-year to 31 Dec
2014 £m £m £m
Profit before tax 1,193 863 899
Tax charge thereon at UK corporation tax rate of 20.25 per cent (2014: 21.5 per cent) (242) (186) (193)Factors affecting tax charge:
UK corporation tax rate change and related impacts 7 − (24)
Disallowed items (99) (113) (82)
Non-taxable items 46 58 95
Overseas tax rate differences (8) (17) (7)
Gains exempted or covered by capital losses 47 147 34
Policyholder tax (39) (23) 9
Adjustments in respect of previous years 21 (19) 53
Effect of results of joint ventures and associates − (3) 10
Other items (1) (8) 6
Tax charge (268) (164) (99)
In accordance with IAS 34, the Group’s income tax expense for the half-year to 30 June 2015 is based on the best
estimate of the weighted-average annual income tax rate expected for the full financial year. The tax effects of one-off
items are not included in the weighted-average annual income tax rate, but are recognised in the relevant period.
On 8 July 2015, the Government announced that the corporation tax rate applicable from 1 April 2017 would be 19 per
cent and from 1 April 2020 would be 18 per cent. In addition, the Government announced that from 1 January 2016
banking profits will be subject to an additional tax surcharge of 8 per cent. The proposed reductions in the rate of
corporation tax and the introduction of the banking surcharge are expected to be enacted, and the impact accounted for,
in the second half of 2015.
6. Earnings per share
Half-year to30 June
2015
Half-year to 30 June
2014
Half-year to 31 Dec
2014 £m £m £m Basic
Profit attributable to ordinary shareholders 677 574 551
Tax credit on distributions to other equity holders 40 20 42
717 594 593 Weighted average number of ordinary shares in issue 71,349m 71,350m 71,350m
Earnings per share 1.0p 0.8p 0.8p
Fully diluted
Profit attributable to ordinary shareholders 677 574 551
Tax credit on distributions to other equity holders 40 20 42
717 594 593 Weighted average number of ordinary shares in issue 72,463m 72,399m 72,494m
Earnings per share 1.0p 0.8p 0.8p

LLOYDS BANKING GROUP PLC 2015 HALF-YEAR RESULTS
Page 69 of 93
7. Trading and other financial assets at fair value through profit or loss
At 30 June
2015
At 31 Dec
2014 £m £m
Trading assets 43,419 48,494
Other financial assets at fair value through profit or loss:
Treasury and other bills 22 22
Debt securities 40,520 41,839
Equity shares 63,888 61,576
104,430 103,437
Total trading and other financial assets at fair value through profit or loss 147,849 151,931
Included in the above is £95,201 million (31 December 2014: £94,314 million) of assets relating to the insurance
businesses.
8. Derivative financial instruments
30 June 2015 31 December 2014
Fair valueof assets
Fair valueof liabilities
Fair value of assets
Fair value of liabilities
£m £m £m £m Hedging
Derivatives designated as fair value hedges 1,662 763 2,472 962
Derivatives designated as cash flow hedges 1,070 1,814 1,761 2,654
2,732 2,577 4,233 3,616
Trading and other
Exchange rate contracts 6,586 8,020 7,034 6,950
Interest rate contracts 16,784 15,527 22,506 20,374
Credit derivatives 254 468 279 1,066
Embedded equity conversion feature 256 – 646 −
Equity and other contracts 1,368 1,186 1,430 1,181
25,248 25,201 31,895 29,571
Total recognised derivative assets/liabilities 27,980 27,778 36,128 33,187
The embedded equity conversion feature of £256 million (31 December 2014: £646 million) reflects the value of the
equity conversion feature contained in the Enhanced Capital Notes issued by the Group in 2009; a loss of £390 million
arose from the change in fair value in the half-year to 30 June 2015 (half-year to 30 June 2014: gain of £226 million;
half-year to 31 December 2014: gain of £175 million) and is included within net trading income. In addition, £967 million
of the embedded derivative, being that portion of the embedded equity conversion feature related to ECNs derecognised
pursuant to the Group’s exchange and retail tender transactions completed in April 2014, was derecognised on
completion of those transactions in the half-year to 30 June 2014.
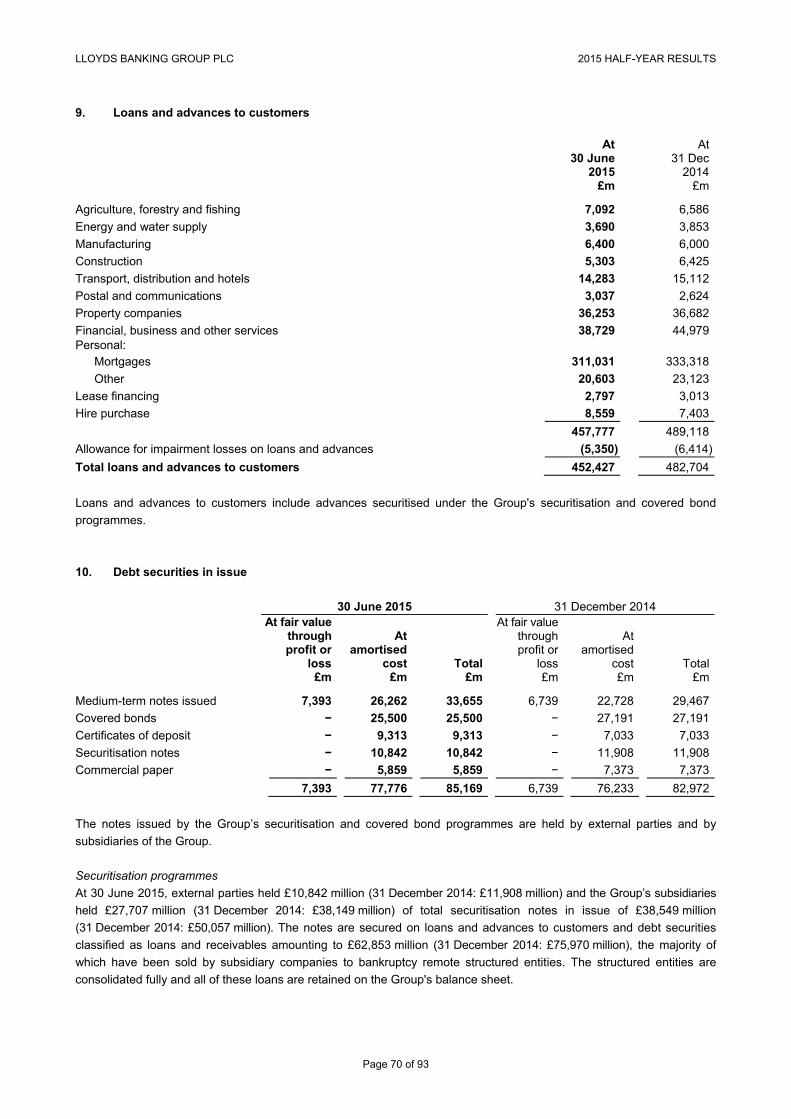
LLOYDS BANKING GROUP PLC 2015 HALF-YEAR RESULTS
Page 70 of 93
9. Loans and advances to customers
At 30 June
2015
At 31 Dec
2014 £m £m
Agriculture, forestry and fishing 7,092 6,586
Energy and water supply 3,690 3,853
Manufacturing 6,400 6,000
Construction 5,303 6,425
Transport, distribution and hotels 14,283 15,112
Postal and communications 3,037 2,624
Property companies 36,253 36,682
Financial, business and other services 38,729 44,979 Personal:
Mortgages 311,031 333,318
Other 20,603 23,123
Lease financing 2,797 3,013
Hire purchase 8,559 7,403
457,777 489,118
Allowance for impairment losses on loans and advances (5,350) (6,414)
Total loans and advances to customers 452,427 482,704
Loans and advances to customers include advances securitised under the Group's securitisation and covered bond
programmes.
10. Debt securities in issue
30 June 2015 31 December 2014
At fair valuethrough profit or
loss
At amortised
cost Total
At fair value through profit or
loss
At amortised
cost Total £m £m £m £m £m £m
Medium-term notes issued 7,393 26,262 33,655 6,739 22,728 29,467
Covered bonds − 25,500 25,500 − 27,191 27,191
Certificates of deposit − 9,313 9,313 − 7,033 7,033
Securitisation notes − 10,842 10,842 − 11,908 11,908
Commercial paper − 5,859 5,859 − 7,373 7,373
7,393 77,776 85,169 6,739 76,233 82,972
The notes issued by the Group’s securitisation and covered bond programmes are held by external parties and by
subsidiaries of the Group.
Securitisation programmes
At 30 June 2015, external parties held £10,842 million (31 December 2014: £11,908 million) and the Group’s subsidiaries
held £27,707 million (31 December 2014: £38,149 million) of total securitisation notes in issue of £38,549 million
(31 December 2014: £50,057 million). The notes are secured on loans and advances to customers and debt securities
classified as loans and receivables amounting to £62,853 million (31 December 2014: £75,970 million), the majority of
which have been sold by subsidiary companies to bankruptcy remote structured entities. The structured entities are
consolidated fully and all of these loans are retained on the Group's balance sheet.

LLOYDS BANKING GROUP PLC 2015 HALF-YEAR RESULTS
Page 71 of 93
10. Debt securities in issue (continued)
Covered bond programmes
At 30 June 2015, external parties held £25,500 million (31 December 2014: £27,191 million) and the Group’s subsidiaries
held £4,970 million (31 December 2014: £6,339 million) of total covered bonds in issue of £30,470 million (31 December
2014: £33,530 million). The bonds are secured on certain loans and advances to customers that have been assigned to
bankruptcy remote limited liability partnerships. These loans are retained on the Group's balance sheet.
Cash deposits of £9,210 million (31 December 2014: £11,251 million) held by the Group are restricted in use to repayment
of the debt securities issued by the structured entities, the term advances relating to covered bonds and other legal
obligations.
11. Post-retirement defined benefit schemes
The Group’s post-retirement defined benefit scheme obligations are comprised as follows:
At 30 June
2015
At 31 Dec
2014 £m £m
Defined benefit pension schemes:
- Fair value of scheme assets 38,041 38,133
- Present value of funded obligations (37,399) (37,243)
Net pension scheme asset 642 890
Other post-retirement schemes (201) (196)
Net retirement benefit asset 441 694
Recognised on the balance sheet as:
Retirement benefit assets 908 1,147
Retirement benefit obligations (467) (453)
Net retirement benefit asset 441 694
The movement in the Group’s net post-retirement defined benefit scheme asset during the period was as follows:
£m
At 1 January 2015 694
Income statement charge (154)
Employer contributions 203
Remeasurement (302)
At 30 June 2015 441
The principal assumptions used in the valuations of the defined benefit pension scheme were as follows:
At 30 June
2015
At 31 Dec
2014 % %
Discount rate 3.80 3.67
Rate of inflation:
Retail Prices Index 3.14 2.95
Consumer Price Index 2.14 1.95
Rate of salary increases 0.00 0.00
Weighted-average rate of increase for pensions in payment 2.69 2.59

LLOYDS BANKING GROUP PLC 2015 HALF-YEAR RESULTS
Page 72 of 93
11. Post-retirement defined benefit schemes (continued)
The application of the revised assumptions as at 30 June 2015 to the Group’s principal post-retirement defined benefit
schemes has resulted in a remeasurement loss of £302 million which has been recognised in other comprehensive income,
net of deferred tax of £60 million.
12. Provisions for liabilities and charges
Payment protection insurance
The Group made provisions totalling £12,025 million to 31 December 2014 against the costs of paying redress to
customers in respect of past sales of PPI policies, including the related administrative expenses.
The Group has increased the provision by a further £1,400 million which brings the total amount provided to
£13,425 million, of which, at 30 June 2015, £2,237 million remained unutilised (17 per cent of total provision). The
remaining provision covers the Past Business Review (PBR), remediation activity and future reactive complaints
including associated administration expenses.
The main drivers of the provision are as follows:
Proactive mailing resulting from Past Business Reviews (PBR)
The Group has mailed 98 per cent of the total PBR scope, with the remaining mailings scheduled for completion in the
second half of 2015. The Group is confident that the scope of proactive mailing is final, albeit monitoring continues, and
there has consequently been no change to the amount provided.
Remediation
The Group continues to progress the re-review of previously handled cases. Approximately 1.2 million cases were
included within the scope of remediation at 31 December 2014 covering both previously defended and previously
redressed complaints for re-review. The Group has completed the review of approximately 96 per cent of all complaints
previously defended, which were prioritised given their complexity and the level of potential redress required, with some
residual payments expected in the second half of 2015. During the half-year, the scope was extended by 0.2 million to
1.4 million cases. The remaining scope is expected to be substantially complete by the end of the year. The change in
scope, together with higher overturn rates and average redress, has resulted in an additional provision of approximately
£400 million.
Volumes of reactive complaints (after excluding complaints from customers where no PPI policy was held)
At 31 December 2014, the provision assumed a total of 3.6 million complaints would be received. During the first half of
2015 complaint volumes were 8 per cent lower than over the same period of 2014 and 2 per cent lower than the second
half of 2014. The run rate of complaints in the first half of 2015 was, however, marginally higher than the fourth quarter
2014 run-rate and above expectations. Complaint volumes continue to be largely driven by Claims Management
Company (CMC) activity. As a result, the Group has increased the total expected complaint volumes to 3.9 million with
approximately 0.7 million still to be received. Coupled with higher than expected average redress and the additional
associated administration costs, this has resulted in a further provision of approximately £1,000 million.

LLOYDS BANKING GROUP PLC 2015 HALF-YEAR RESULTS
Page 73 of 93
12. Provisions for liabilities and charges (continued)
Quarter
Average monthly reactive complaint
volume Quarter on quarter %
Q1 2013 61,259 (28%)Q2 2013 54,086 (12%)Q3 2013 49,555 (8%)Q4 2013 37,457 (24%)Q1 2014 42,259 13%Q2 2014 39,426 (7%)Q3 2014 40,624 3% Q4 2014 35,910 (12%) During the second quarter of 2015 the Group has seen a fall of
approximately 2 per cent in complaint levels. However, the provision remains sensitive to future trends.
Q1 2015 37,791 5% Q2 2015 36,957 (2%)
Average redress
Average redress has trended higher than expected by approximately £200 per policy due to a change in the product and
age mix of complaints.
Expenses
The Group expects to maintain the PPI operation on its current scale for longer than previously anticipated given the
update to volume related assumptions and the re-review of previously handled cases continuing into the second half of
2015. The estimate for administrative expenses, which comprise complaint handling costs and costs arising from cases
subsequently referred to the FOS, is included in the provision increase outlined above.
Sensitivities
The Group estimates that it has sold approximately 16 million policies since 2000. These include policies that were not
mis-sold as they were suitable for, and appropriately disclosed to, the customer. Since the commencement of the PPI
redress programme in 2011 the Group estimates that it has contacted, settled or provided for in excess of 45 per cent of
the policies sold since 2000, covering both customer-initiated complaints and actual and expected proactive mailings
undertaken by the Group.
The cash payments in the first half of 2015 were approximately £1.7 billion covering PBR, remediation and reactive
complaints and associated administration costs. The PBR and remediation programmes are expected to be substantially
complete by the end of this year, slightly later than envisaged. The monthly run-rate spend of these programmes is
expected to reduce significantly from the current level of around £140 million to around £30 million by the end of the year
with an associated reduction in operating costs.
The total amount provided for PPI represents the Group’s best estimate of the likely future costs. A number of risks and
uncertainties remain, in particular with respect to future complaint volumes, which are primarily driven by the level of
CMC initiated complaints. The current provision assumes a significant decrease in reactive complaint volumes over the
next 18 months compared with recent quarterly trends. If this decline is delayed by six months and reactive complaints
remain at the same level as the first half of 2015, this would lead to an additional provision of approximately £1.0 billion
at the end of the year; a similar level of provisioning would be required for each six months of flat complaint volumes in
2016.

LLOYDS BANKING GROUP PLC 2015 HALF-YEAR RESULTS
Page 74 of 93
12. Provisions for liabilities and charges (continued)
Key metrics and sensitivities are highlighted in the table below:
Sensitivities1 To date unless noted Future Sensitivity
Reactive complaints since origination (m)2 3.2 0.7 0.1 = £240m Proactive mailing:
– number of policies (m)3 2.7 0.1 n/a
– response rate4 34% 30% 1% = £3m Average uphold rate per policy5 78% 75% 1% = £12m Average redress per upheld policy6 £1,935 £2,000 £100 = £90m Remediation cases (m) 7 0.7 0.7 1 case = £400 Administrative expenses (£m) 2,420 400 1 case = £500
1 All sensitivities exclude claims where no PPI policy was held. 2 Sensitivity includes complaint handling costs, and have increased as a result of higher average redress and a shift towards older
policies. 3 To date volume includes customer initiated complaints. 4 Metric relates to mature mailings only. Future response rates are expected to be lower than experienced to date as mailings to higher
risk customers have been prioritised. 5 The percentage of complaints where the Group finds in favour of the customer. This is a blend of proactive and customer initiated
complaints. The 78 per cent uphold rate is based on six months to June 2015. The lower uphold rate in the future reflects a lowerproportion of PBR related cases which typically have a higher uphold rate, reflecting the higher risk nature of those policy sales.
6 The amount that is paid in redress in relation to a policy found to have been mis-sold, comprising, where applicable, the refund ofpremium, compound interest charged and interest at 8 per cent per annum. Actuals are based on the six months to June 2015. Theincrease in future average redress is influenced by a shift in the reactive complaint mix towards older, and therefore more expensive,policies.
7 Remediation to date is based on cases reviewed as at 30 June 2015, but not necessarily settled. The sensitivity is based on theexpected future average cost of a remediation case. It is an average of full payments, top-up payments and nil payouts where theoriginal decision is retained. It is lower than experienced to date as future remediation largely comprises top-up payments onpreviously redressed cases.
Other regulatory provisions
Litigation in relation to insurance branch business in Germany
Clerical Medical Investment Group Limited (CMIG) has received a number of claims in the German courts relating to
policies issued by CMIG but sold by independent intermediaries in Germany, principally during the late 1990s and early
2000s. Following decisions in July 2012 from the Federal Court of Justice in Germany the Group recognised provisions
totalling £520 million during the period to 31 December 2014. Recent experience has been broadly in line with
expectations and, accordingly, no further provision has been recognised in the half-year to 30 June 2015. The remaining
unutilised provision as at 30 June 2015 is £137 million.
The validity of the claims facing CMIG depends upon the facts and circumstances in respect of each claim. As a result
the ultimate financial effect, which could be significantly different from the current provision, will only be known once all
relevant claims have been resolved.
Interest rate hedging products
In June 2012, a number of banks, including the Group, reached agreement with the FSA (now FCA) to carry out a review
of sales made since 1 December 2001 of interest rate hedging products (IRHP) to certain small and medium-sized
businesses. As at 30 June 2015 the Group had identified 1,723 sales of IRHPs to customers within scope of the
agreement with the FCA which have opted in and are being reviewed and, where appropriate, redressed. The Group
agreed that it would provide redress to any in-scope customers where appropriate. The Group continues to review the
remaining cases within the scope of the agreement with the FCA and has met all of the regulator’s requirements to date.
At 30 June 2015, the total amount provided for redress and related administration costs for in-scope customers was
£680 million (31 December 2014: £680 million). As at 30 June 2015, the Group has utilised £617 million (31 December
2014: £571 million), with £63 million (31 December 2014: £109 million) of the provision remaining.

LLOYDS BANKING GROUP PLC 2015 HALF-YEAR RESULTS
Page 75 of 93
12. Provisions for liabilities and charges (continued)
FCA review of complaint handling
On 5 June 2015 the FCA announced a settlement with the Group totalling £117 million following its investigation into
aspects of the Group’s PPI complaint handling process during the period March 2012 to May 2013. The FCA did not find
that the Group acted deliberately. The Group has reviewed all customer complaints fully defended during the Relevant
Period. The remediation costs of reviewing these affected cases are not materially in excess of existing provisions.
Other legal actions and regulatory matters
In the course of its business, the Group is engaged in discussions with the PRA, FCA and other UK and overseas
regulators and other governmental authorities on a range of matters. The Group also receives complaints and claims
from customers in connection with its past conduct and, where significant, provisions are held against the costs expected
to be incurred as a result of the conclusions reached. During the half-year to 30 June 2015, the Group charged an
additional £318 million (half-year to 30 June 2014: £225 million) in respect of a number of matters affecting the Retail,
Commercial Banking and Consumer Finance divisions. This includes a provision of £175 million for customer redress
and associated administration costs in response to complaints concerning Packaged Bank Accounts. At 30 June 2015,
provisions for other legal actions and regulatory matters of £732 million remained unutilised.
13. Contingent liabilities and commitments
Interchange fees
With respect to interchange fees, the Group is following closely the course of investigations, litigation and recent
regulation (as described below) which involve card schemes such as Visa and MasterCard. The Group is not directly
involved in these matters but is a member of certain card schemes, in particular, Visa and MasterCard. The matters
referred to above include the following:
A new European Regulation to regulate cross-border and domestic fallback multilateral interchange fees (MIFs) in the
EU. This regulation came into force on 8 June 2015 and it will introduce interchange fee caps for credit card MIFs (to
30 bps) and debit card MIFs (to 20bps). The interchange fee caps come in to force on 9 December 2015;
The European Commission also continues to pursue other competition investigations into MasterCard and Visa
probing, amongst other things, interchange paid in respect of cards issued outside the EEA;
Litigation continues in the English High Court against both Visa and MasterCard. This litigation has been brought by
several retailers who are seeking damages for allegedly ‘overpaid’ MIFs;
The new UK payments regulator may exercise its powers to regulate domestic interchange fees. In addition, the FCA
has undertaken a market study in relation to the UK credit cards market.
The ultimate impact on the Group of the above investigations, regulatory or legislative developments and the litigation
against VISA and MasterCard can only be known at the conclusion of these matters.
LIBOR and other trading rates
In July 2014, the Group announced that it had reached settlements totalling £217 million (at 30 June 2014 exchange
rates) to resolve with UK and US federal authorities legacy issues regarding the manipulation several years ago of Group
companies’ submissions to the British Bankers’ Association (BBA) London Interbank Offered Rate (LIBOR) and Sterling
Repo Rate. The Group continues to cooperate with various other government and regulatory authorities, including the
Serious Fraud Office, the Swiss Competition Commission, and a number of US State Attorneys General, in conjunction
with their investigations into submissions made by panel members to the bodies that set LIBOR and various other
interbank offered rates.
LLOYDS BANKING GROUP PLC 2015 HALF-YEAR RESULTS
Page 76 of 93
13. Contingent liabilities and commitments (continued)
Certain Group companies, together with other panel banks, have also been named as defendants in private lawsuits,
including purported class action suits, in the US in connection with their roles as panel banks contributing to the setting of
US Dollar, Japanese Yen and Sterling LIBOR. The lawsuits, which contain broadly similar allegations, allege violations of
the Sherman Antitrust Act, the Racketeer Influenced and Corrupt Organizations Act (RICO) and the Commodity
Exchange Act (CEA), as well as various state statutes and common law doctrines. Certain of the plaintiffs’ claims,
including those asserted under US anti-trust laws, have been dismissed by the US Federal Court for Southern District of
New York (the District Court). That court’s dismissal of plaintiffs’ anti-trust claims has been appealed to the New York
Federal Court of Appeal.
Certain Group Companies are also named as defendants in UK based claims raising LIBOR manipulation allegations in
connection with interest rate hedging products.
The Group also reviewed its activities in relation to the setting of certain foreign exchange daily benchmark rates and
related matters. The Group has been co-operating with the FCA and other regulators and has been providing information
about the Group’s review to those regulators. In addition, the Group, together with a number of other banks, was named
as a defendant in several actions filed in the District Court between late 2013 and February 2014, in which the plaintiffs
alleged that the defendants manipulated WM/Reuters foreign exchange rates in violation of US antitrust laws. On
31 March 2014, plaintiffs effectively withdrew their claims against the Group (but not against all defendants) by filing a
superseding consolidated and amended pleading against a number of other defendants without naming any Group entity
as a defendant.
It is currently not possible to predict the scope and ultimate outcome on the Group of the various outstanding regulatory
investigations not encompassed by the settlements, any private lawsuits or any related challenges to the interpretation or
validity of any of the Group’s contractual arrangements, including their timing and scale.
UK shareholder litigation
In August 2014, the Group and a number of former directors were named as defendants in a claim filed in the English
High Court by a number of claimants who held shares in Lloyds TSB Group plc (LTSB) prior to the acquisition of HBOS
plc, alleging breaches of fiduciary and tortious duties in relation to information provided to shareholders in connection
with the acquisition and the recapitalisation of LTSB. The claim is at an early stage and so it is currently not possible to
determine the ultimate impact on the Group (if any), but it intends to defend the claim vigorously.
Financial Services Compensation Scheme
The Financial Services Compensation Scheme (FSCS) is the UK’s independent statutory compensation fund of last
resort for customers of authorised financial services firms and pays compensation if a firm is unable or likely to be unable
to pay claims against it. The FSCS is funded by levies on the authorised financial services industry. Each deposit-taking
institution contributes towards the FSCS levies in proportion to their share of total protected deposits on 31 December of
the year preceding the scheme year, which runs from 1 April to 31 March.
Following the default of a number of deposit takers in 2008, the FSCS borrowed funds from HM Treasury to meet the
compensation costs for customers of those firms. At 31 March 2015, the principal balance outstanding on these loans
was £15,797 million (31 March 2014: £16,591 million). Although the substantial majority of this loan will be repaid from
funds the FSCS receives from asset sales, surplus cash flow or other recoveries in relation to the assets of the firms that
defaulted, any shortfall will be funded by deposit-taking participants of the FSCS. The amount of future levies payable by
the Group depends on a number of factors including the amounts recovered by the FSCS from asset sales, the
Group’s participation in the deposit-taking market at 31 December, the level of protected deposits and the population of
deposit-taking participants.
PRA/FCA report on HBOS
On 12 September 2012 the FSA announced that it was starting work on a public interest report on HBOS. That report is
now being produced as a joint PRA/FCA report but has not yet been published.

LLOYDS BANKING GROUP PLC 2015 HALF-YEAR RESULTS
Page 77 of 93
13. Contingent liabilities and commitments (continued)
Tax authorities
The Group provides for potential tax liabilities that may arise on the basis of the amounts expected to be paid to tax
authorities. This includes open matters where Her Majesty's Revenue and Customs (HMRC) adopt a different
interpretation and application of tax law which might lead to additional tax. The Group has an open matter in relation to a
claim for group relief of losses incurred in its former Irish banking subsidiary, which ceased trading on 31 December
2010. In the second half of 2013 HMRC informed the Group that their interpretation of the UK rules, permitting the offset
of such losses, denies the claim; if HMRC’s position is found to be correct management estimate that this would result in
an increase in current tax liabilities of approximately £600 million and a reduction in the Group’s deferred tax asset of
approximately £400 million. The Group does not agree with HMRC's position and, having taken appropriate advice, does
not consider that this is a case where additional tax will ultimately fall due.
Residential mortgage repossessions
In August 2014, the Northern Ireland High Court handed down judgment in favour of the borrowers in relation to three
residential mortgage test cases, concerning certain aspects of the Group’s practice with respect to the recalculation of
contractual monthly instalments of customers in arrears. The Group is reviewing the issues raised by the judgment and
will respond as appropriate to any investigations or proceedings that may in due course be instigated as a result of these
issues.
Plevin v Paragon Personal Finance Limited
On 27 May 2015 the FCA gave an update on its announcement from January 2015 that it would be collecting evidence
on current trends in PPI complaints to assess whether the current approach to PPI complaint handling is continuing to
meet its objectives. The FCA stated that it expects to give its view in the summer. In that announcement the FCA also
noted that in November 2014 the Supreme Court had ruled in Plevin v Paragon Personal Finance Limited [2014] UKSC 6
(Plevin) that the lender’s failure to disclose a large commission payment on a single premium PPI policy made the
relationship between that lender and the borrower unfair under section 140A of the Consumer Credit Act 1974. The FCA
is considering whether additional rules and/or guidance are required to deal with the potential impact of the Plevin
decision on complaints about PPI and indicated that it expects to announce its views on this aspect, including next steps,
in its announcement in the summer. The Financial Ombudsman Service are also considering the implications for PPI
complaints. Given the current uncertainty, it is not presently possible to estimate the financial impact of the Plevin
decision and accordingly no additional provision has been established at this stage, but it is possible that the impact
could be material.
Other legal actions and regulatory matters
In addition, during the ordinary course of business the Group is subject to other complaints and threatened or actual legal
proceedings (including class or group action claims) brought by or on behalf of employees, customers, investors or other
third parties, as well as regulatory reviews, challenges, investigations and enforcement actions, both in the UK and
overseas. All such material matters are periodically reassessed, with the assistance of external professional advisers
where appropriate, to determine the likelihood of the Group incurring a liability. In those instances where it is concluded
that it is more likely than not that a payment will be made, a provision is established to management's best estimate of
the amount required at the relevant balance sheet date. In some cases it will not be possible to form a view, for example
because the facts are unclear or because further time is needed properly to assess the merits of the case, and no
provisions are held in relation to such matters. However the Group does not currently expect the final outcome of any
such case to have a material adverse effect on its financial position, operations or cash flows.

LLOYDS BANKING GROUP PLC 2015 HALF-YEAR RESULTS
Page 78 of 93
13. Contingent liabilities and commitments (continued)
Contingent liabilities and commitments arising from the banking business
At 30 June
2015
At 31 Dec
2014 £m £m Contingent liabilities
Acceptances and endorsements 130 59
Other:
Other items serving as direct credit substitutes 405 330
Performance bonds and other transaction-related contingencies 2,034 2,293
2,439 2,623
Total contingent liabilities 2,569 2,682
Commitments
Documentary credits and other short-term trade-related transactions 42 101
Forward asset purchases and forward deposits placed 428 162
Undrawn formal standby facilities, credit lines and other commitments to lend:
Less than 1 year original maturity:
Mortgage offers made 10,463 8,809
Other commitments 59,901 64,015
70,364 72,824
1 year or over original maturity 35,679 34,455
Total commitments 106,513 107,542
Of the amounts shown above in respect of undrawn formal standby facilities, credit lines and other commitments to lend,
£55,027 million (31 December 2014: £55,029 million) was irrevocable.
14. Fair values of financial assets and liabilities
The valuations of financial instruments have been classified into three levels according to the quality and reliability of
information used to determine those fair values. Note 51 to the Group’s 2014 financial statements describes the
definitions of the three levels in the fair value hierarchy.
Valuation control framework Key elements of the valuation control framework, which covers processes for all levels in the fair value hierarchy including level 3 portfolios, include model validation (incorporating pre-trade and post-trade testing), product implementation review and independent price verification. Formal committees meet quarterly to discuss and approve valuations in more judgemental areas. Transfers into and out of level 3 portfolios Transfers out of level 3 portfolios arise when inputs that could have a significant impact on the instrument’s valuation become market observable; conversely, transfers into the portfolios arise when consistent sources of data cease to be available. Valuation methodology For level 2 and level 3 portfolios, there is no significant change to what was disclosed in the Group’s 2014 Annual Report and Accounts in respect of the valuation methodology (techniques and inputs) applied to such portfolios.

LLOYDS BANKING GROUP PLC 2015 HALF-YEAR RESULTS
Page 79 of 93
14. Fair values of financial assets and liabilities (continued)
The table below summarises the carrying values of financial assets and liabilities presented on the Group’s balance sheet. The fair values presented in the table are at a specific date and may be significantly different from the amounts which will actually be paid or received on the maturity or settlement date.
30 June 2015 31 December 2014
Carrying
value Fair
value Carrying
value Fair
value £m £m £m £m Financial assets
Trading and other financial assets at fair value through profit or loss 147,849 147,849 151,931 151,931 Derivative financial instruments 27,980 27,980 36,128 36,128
Loans and receivables:
Loans and advances to banks 23,548 23,892 26,155 26,031
Loans and advances to customers 452,427 450,322 482,704 480,631
Debt securities 1,569 1,491 1,213 1,100
Available-for-sale financial instruments 32,173 32,173 56,493 56,493
Held-to-maturity investments 19,960 19,785 − −
Financial liabilities
Deposits from banks 16,966 16,978 10,887 10,902
Customer deposits 416,595 416,933 447,067 450,038
Trading and other financial liabilities at fair value through profit or loss 63,328 63,328 62,102 62,102 Derivative financial instruments 27,778 27,778 33,187 33,187
Debt securities in issue 77,776 80,400 76,233 80,244
Liabilities arising from non-participating investment contracts 26,131 26,131 27,248 27,248 Financial guarantees 44 44 51 51
Subordinated liabilities 22,639 26,751 26,042 30,175 The carrying amount of the following financial instruments is a reasonable approximation of fair value: cash and balances at central banks, items in the course of collection from banks, items in course of transmission to banks and notes in circulation. The Group manages valuation adjustments for its derivative exposures on a net basis; the Group determines their fair values on the basis of their net exposures. In all other cases, fair values of financial assets and liabilities measured at fair value are determined on the basis of their gross exposures.

LLOYDS BANKING GROUP PLC 2015 HALF-YEAR RESULTS
Page 80 of 93
14. Fair values of financial assets and liabilities (continued)
The following tables provide an analysis of the financial assets and liabilities of the Group that are carried at fair value in
the Group’s consolidated balance sheet, grouped into levels 1 to 3 based on the degree to which the fair value is
observable.
Financial assets Level 1 Level 2 Level 3 Total £m £m £m £mAt 30 June 2015
Trading and other financial assets at fair value through profit or loss: Loans and advances to customers − 26,601 − 26,601
Loans and advances to banks − 6,564 − 6,564
Debt securities 24,155 22,949 3,670 50,774
Equity shares 62,071 337 1,480 63,888
Treasury and other bills 22 − − 22
Total trading and other financial assets at fair value through profit or loss 86,248 56,451 5,150 147,849
Available-for-sale financial assets:
Debt securities 24,896 5,366 − 30,262
Equity shares 47 709 303 1,059
Treasury and other bills 852 − − 852
Total available-for-sale financial assets 25,795 6,075 303 32,173
Derivative financial instruments 51 25,696 2,233 27,980
Total financial assets carried at fair value 112,094 88,222 7,686 208,002
At 31 December 2014
Trading and other financial assets at fair value through profit or loss: Loans and advances to customers − 28,513 − 28,513
Loans and advances to banks − 8,212 − 8,212
Debt securities 24,230 24,484 3,457 52,171
Equity shares 59,607 322 1,647 61,576
Treasury and other bills 1,459 − − 1,459
Total trading and other financial assets at fair value through profit or loss 85,296 61,531 5,104 151,931
Available-for-sale financial assets:
Debt securities 47,437 7,151 − 54,588
Equity shares 45 727 270 1,042
Treasury and other bills 852 11 − 863
Total available-for-sale financial assets 48,334 7,889 270 56,493
Derivative financial instruments 94 33,263 2,771 36,128
Total financial assets carried at fair value 133,724 102,683 8,145 244,552

LLOYDS BANKING GROUP PLC 2015 HALF-YEAR RESULTS
Page 81 of 93
14. Fair values of financial assets and liabilities (continued)
Financial liabilities Level 1 Level 2 Level 3 Total £m £m £m £mAt 30 June 2015 Trading and other financial liabilities at fair value through profit or loss: Liabilities held at fair value through profit or loss − 7,393 1 7,394
Trading liabilities 3,592 52,342 − 55,934
Total trading and other financial liabilities at fair value through profit or loss 3,592 59,735 1 63,328
Derivative financial instruments 108 26,337 1,333 27,778
Financial guarantees − − 44 44
Total financial liabilities carried at fair value 3,700 86,072 1,378 91,150
At 31 December 2014
Trading and other financial liabilities at fair value through profit or loss: Liabilities held at fair value through profit or loss − 6,739 5 6,744
Trading liabilities 2,700 52,658 − 55,358
Total trading and other financial liabilities at fair value through profit or loss 2,700 59,397 5 62,102
Derivative financial instruments 68 31,663 1,456 33,187
Financial guarantees − − 51 51
Total financial liabilities carried at fair value 2,768 91,060 1,512 95,340

LLOYDS BANKING GROUP PLC 2015 HALF-YEAR RESULTS
Page 82 of 93
14. Fair values of financial assets and liabilities (continued)
Movements in level 3 portfolio
The tables below analyse movements in the level 3 financial assets portfolio.
Tradingand other financial
assets at fair value through profit or loss
Available- for-sale
financial assets
Derivative assets
Total financial
assets carried at fair value
£m £m £m £m
At 1 January 2015 5,104 270 2,771 8,145
Exchange and other adjustments (1) − (44) (45)
Losses recognised in the income statement within other income (61) − (534) (595)
Gains recognised in other comprehensive income within the revaluation reserve in respect of available-for-sale financial assets − 1 − 1 Purchases 785 38 182 1,005
Sales (649) (6) (105) (760)
Transfers into the level 3 portfolio 20 − − 20
Transfers out of the level 3 portfolio (48) − (37) (85)
At 30 June 2015 5,150 303 2,233 7,686
Losses recognised in the income statement within other income relating to those assets held at 30 June 2015 (39) − (533) (572)
Trading and other
financial assets at fair
value through profit or loss
Available- for-sale
financial assets
Derivative assets
Total financial
assets carried at fair value
£m £m £m £m
At 1 January 2014 4,232 449 3,019 7,700
Exchange and other adjustments − (9) (10) (19)
Gains recognised in the income statement within other income 167 (78) 277 366
Gains recognised in other comprehensive income within the revaluation reserve in respect of available-for-sale financial assets − 15 − 15 Purchases 432 199 10 641
Sales (367) (173) (1,072) (1,612)
Transfers into the level 3 portfolio 441 − 22 463
Transfers out of the level 3 portfolio − (74) (53) (127)
At 30 June 2014 4,905 329 2,193 7,427
Gains recognised in the income statement within other income relating to those assets held at 30 June 2014 140 − 50 190
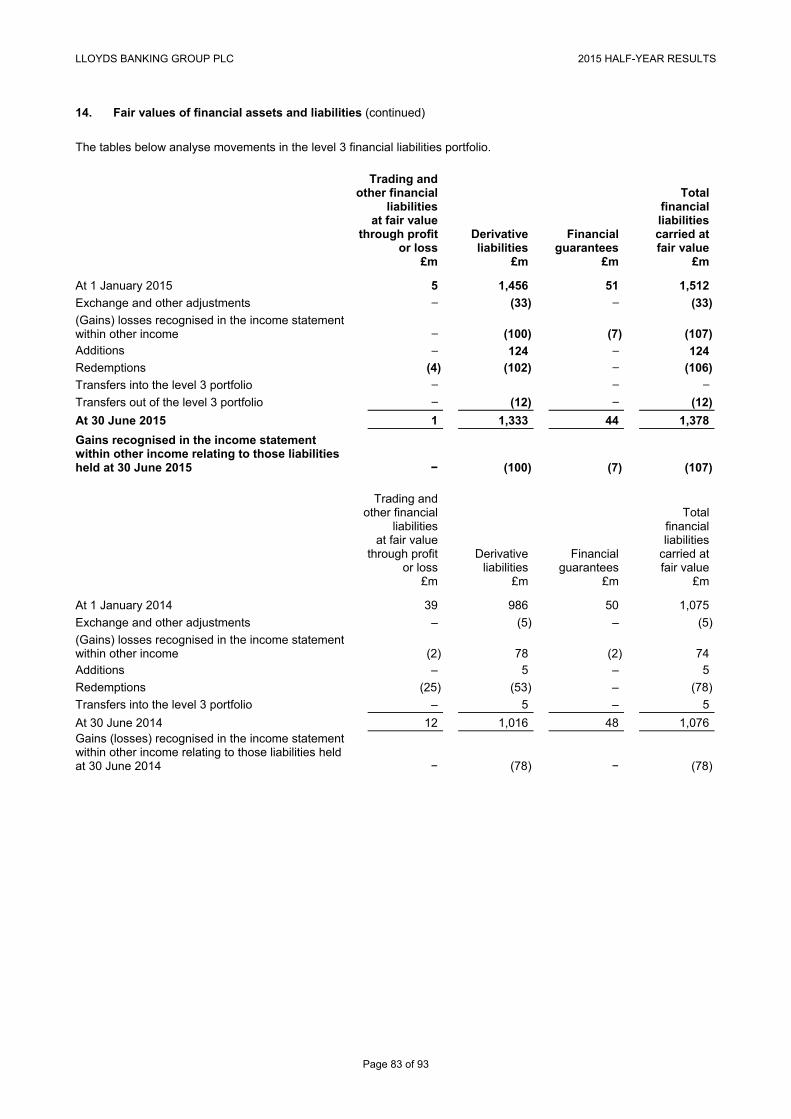
LLOYDS BANKING GROUP PLC 2015 HALF-YEAR RESULTS
Page 83 of 93
14. Fair values of financial assets and liabilities (continued)
The tables below analyse movements in the level 3 financial liabilities portfolio.
Trading andother financial
liabilities at fair value
through profit or loss
Derivative liabilities
Financial guarantees
Total financial liabilities carried at fair value
£m £m £m £m
At 1 January 2015 5 1,456 51 1,512
Exchange and other adjustments − (33) − (33)
(Gains) losses recognised in the income statementwithin other income − (100) (7) (107)Additions − 124 − 124 Redemptions (4) (102) − (106)
Transfers into the level 3 portfolio − − −
Transfers out of the level 3 portfolio − (12) − (12)
At 30 June 2015 1 1,333 44 1,378
Gains recognised in the income statement within other income relating to those liabilities held at 30 June 2015 − (100) (7) (107)
Trading and other financial
liabilities at fair value
through profit or loss
Derivative liabilities
Financial guarantees
Total financial liabilities
carried at fair value
£m £m £m £m
At 1 January 2014 39 986 50 1,075
Exchange and other adjustments – (5) – (5)
(Gains) losses recognised in the income statement within other income (2) 78 (2) 74 Additions – 5 – 5
Redemptions (25) (53) – (78)
Transfers into the level 3 portfolio – 5 – 5
At 30 June 2014 12 1,016 48 1,076 Gains (losses) recognised in the income statement within other income relating to those liabilities held at 30 June 2014 − (78) − (78)
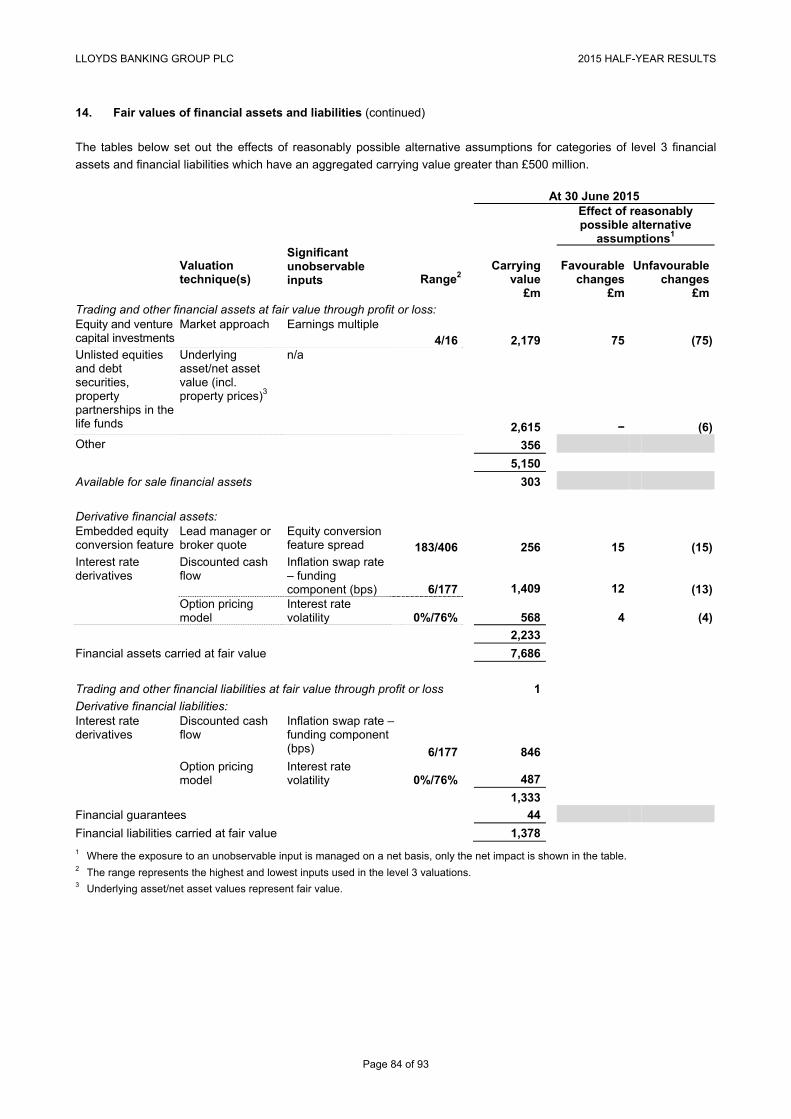
LLOYDS BANKING GROUP PLC 2015 HALF-YEAR RESULTS
Page 84 of 93
14. Fair values of financial assets and liabilities (continued)
The tables below set out the effects of reasonably possible alternative assumptions for categories of level 3 financial
assets and financial liabilities which have an aggregated carrying value greater than £500 million.
At 30 June 2015
Effect of reasonably possible alternative
assumptions1
Valuation technique(s)
Significant unobservable inputs Range2
Carrying value
Favourable changes
Unfavourable changes
£m £m £mTrading and other financial assets at fair value through profit or loss: Equity and venture capital investments
Market approach Earnings multiple 4/16 2,179 75 (75)
Unlisted equities and debt securities, property partnerships in the life funds
Underlying asset/net asset value (incl. property prices)3
n/a
2,615 − (6)
Other 356
5,150
Available for sale financial assets 303
Derivative financial assets: Embedded equity conversion feature
Lead manager or broker quote
Equity conversion feature spread 183/406 256 15 (15)
Interest rate derivatives
Discounted cash flow
Inflation swap rate – funding component (bps) 6/177 1,409 12 (13)
Option pricing model
Interest rate volatility 0%/76% 568 4 (4)
2,233
Financial assets carried at fair value 7,686
Trading and other financial liabilities at fair value through profit or loss 1
Derivative financial liabilities: Interest rate derivatives
Discounted cash flow
Inflation swap rate – funding component (bps) 6/177 846
Option pricing model
Interest rate volatility 0%/76% 487
1,333
Financial guarantees 44
Financial liabilities carried at fair value 1,378 1 Where the exposure to an unobservable input is managed on a net basis, only the net impact is shown in the table. 2 The range represents the highest and lowest inputs used in the level 3 valuations. 3 Underlying asset/net asset values represent fair value.

LLOYDS BANKING GROUP PLC 2015 HALF-YEAR RESULTS
Page 85 of 93
14. Fair values of financial assets and liabilities (continued)
At 31 December 2014
Effect of reasonably possible
alternative assumptions1
Valuation technique(s)
Significant unobservable inputs Range2
Carrying value
Favourable changes
Unfavourable changes
£m £m £m Trading and other financial assets at fair value through profit or loss: Equity and venture capital investments
Market approach Earnings multiple 4/14 2,214 75 (75)
Unlisted equities and debt securities, property partnerships in the life funds
Underlying asset/net asset value (incl. property prices)3
n/a
n/a 2,617 4 (2)Other 273 5,104
Available for sale financial assets 270
Derivative financial assets: Embedded equity conversion feature
Lead manager or broker quote
Equity conversion feature spread 175/432 646 21 (21)
Interest rate derivatives
Discounted cash flow
Inflation swap rate – funding component (bps) 3/167 1,382 17 (16)
Option pricing model
Interest rate volatility 4%/120% 743 6 (6)
2,771
Financial assets carried at fair value 8,145
Trading and other financial liabilities at fair value through profit or loss 5
Derivative financial liabilities: Interest rate derivatives
Discounted cash flow
Inflation swap rate – funding component (bps) 3/167 807
Option pricing model
Interest rate volatility 4%/120% 649
1,456
Financial guarantees 51
Financial liabilities carried at fair value 1,512 1 Where the exposure to an unobservable input is managed on a net basis, only the net impact is shown in the table. 2 The range represents the highest and lowest inputs used in the level 3 valuations. 3 Underlying asset/net asset values represent fair value.
Unobservable inputs
Significant unobservable inputs affecting the valuation of debt securities, unlisted equity investments and derivatives are
unchanged from those described in the Group’s 2014 financial statements.
Reasonably possible alternative assumptions
Valuation techniques applied to many of the Group’s level 3 instruments often involve the use of two or more inputs
whose relationship is interdependent. The calculation of the effect of reasonably possible alternative assumptions
included in the table above reflects such relationships and are unchanged from those described in the Group’s 2014
financial statements.

LLOYDS BANKING GROUP PLC 2015 HALF-YEAR RESULTS
Page 86 of 93
15. Related party transactions
UK government
In January 2009, the UK government through HM Treasury became a related party of the Company following its
subscription for ordinary shares issued under a placing and open offer. As at 30 June 2015, HM Treasury held an
interest of 16.87 per cent in the Company’s ordinary share capital, with its interest having fallen below 20 per cent on
11 May 2015. As a consequence of HM Treasury no longer being considered to have a significant influence, it ceased to
be a related party of the Company for IAS 24 purposes at that date.
In accordance with IAS 24, UK government-controlled entities were related parties of the Group; the Group regarded the
Bank of England and entities controlled by the UK government, including The Royal Bank of Scotland Group plc (RBS),
NRAM plc and Bradford & Bingley plc, as related parties.
The Group has participated in a number of schemes operated by the UK government and central banks and made
available to eligible banks and building societies.
National Loan Guarantee Scheme
The Group has participated in the UK government’s National Loan Guarantee Scheme, which was launched on 20 March
2012. Through the scheme, the Group is providing eligible UK businesses with discounted funding, subject to
continuation of the scheme and its financial benefits, and based on the Group’s existing lending criteria. Eligible
businesses who have taken up the funding benefit from a 1 per cent discount on their funding rate for a pre-agreed
period of time.
Funding for Lending
In August 2012, the Group announced its support for the UK Government’s Funding for Lending Scheme and confirmed
its intention to participate in the scheme. The Funding for Lending Scheme represents a further source of cost effective
secured term funding available to the Group. The original initiative supported a broad range of UK based customers,
providing householders with more affordable housing finance and businesses with cheaper finance to invest and grow. In
November 2013, the Group entered into extension letters with the Bank of England to take part in an extension of the
Funding for Lending Scheme until the end of January 2015. This extension of the Funding for Lending Scheme focused
on providing businesses with cheaper finance to invest and grow. In December 2014, the Bank of England announced a
further extension to the Funding for Lending Scheme running to the end of January 2016 with an increased focus on
supporting small businesses. At 30 June 2015, the Group had drawn down £24 billion (31 December 2014: £20 billion)
under the Funding for Lending Scheme, of which £14 billion had been drawn down under the extension to the scheme
announced in 2013.
Enterprise Finance Guarantee
The Group participates in the Enterprise Finance Guarantee Scheme which was launched in January 2009 as a
replacement for the Small Firms Loan Guarantee Scheme. The scheme is a UK government-backed loan guarantee,
which supports viable businesses with access to lending where they would otherwise be refused a loan due to a lack of
lending security. The Department for Business, Innovation and Skills (formerly the Department for Business, Enterprise
and Regulatory Reform) provides the lender with a guarantee of up to 75 per cent of the capital of each loan subject to
the eligibility of the customer within the rules of the scheme. As at 30 June 2015, the Group had offered 6,378 loans to
customers, worth over £539 million. Under the most recent renewal of the terms of the scheme, Lloyds Bank plc and
Bank of Scotland plc, on behalf of the Group, contracted with The Secretary of State for Business, Innovation and Skills.

LLOYDS BANKING GROUP PLC 2015 HALF-YEAR RESULTS
Page 87 of 93
15. Related party transactions (continued)
Help to Buy
On 7 October 2013, Bank of Scotland plc entered into an agreement with The Commissioners of Her Majesty's Treasury
by which it agreed that the Halifax Division of Bank of Scotland plc would participate in the Help to Buy Scheme with
effect from 11 October 2013 and that Lloyds Bank plc would participate from 3 January 2014. The Help to Buy Scheme is
a scheme promoted by the UK government and is aimed to encourage participating lenders to make mortgage loans
available to customers who require higher loan-to-value mortgages. Halifax and Lloyds are currently participating in the
Scheme whereby customers borrow between 90 per cent and 95 per cent of the purchase price. In return for the
payment of a commercial fee, HM Treasury has agreed to provide a guarantee to the lender to cover a proportion of any
loss made by the lender arising from a higher loan-to-value loan being made. £2,484 million of outstanding loans at
30 June 2015 (31 December 2014: £1,950 million) had been advanced under this scheme.
Business Growth Fund
The Group has invested £151 million (31 December 2014: £118 million) in the Business Growth Fund (under which an
agreement was entered into with RBS amongst others) and, as at 30 June 2015, carries the investment at a fair value of
£142 million (31 December 2014: £105 million). Big Society Capital
The Group has invested £33 million in the Big Society Capital Fund under which an agreement was entered into with
RBS amongst others.
Housing Growth Partnership
The Group has committed to invest up to £50 million into the Housing Growth Partnership under which an agreement
was entered into with the Homes and Communities Agency.
Central bank facilities
In the ordinary course of business, the Group may from time to time access market-wide facilities provided by central banks. Other government-related entities
There were no significant transactions with other UK government-controlled entities (including UK government-controlled
banks) during the year that were not made in the ordinary course of business or that were unusual in their nature or
conditions.
Other related party transactions
Other related party transactions for the half-year to 30 June 2015 are similar in nature to those for the year ended
31 December 2014.
16. Disposal of interest in TSB Banking Group plc
On 20 March 2015 the Group announced that it had agreed to sell a 9.99 per cent interest in TSB Banking Group plc
(TSB) to Banco de Sabadell S.A. (Banco Sabadell) and that it had entered into an irrevocable undertaking to accept
Banco Sabadell’s recommended cash offer in respect of its remaining 40.01 per cent interest in TSB. The offer by Banco
Sabadell was conditional upon, amongst other things, regulatory approval.
The sale of the 9.99 per cent interest completed on 24 March 2015, reducing the Group’s holding in TSB to 40.01 per
cent; this sale led to a loss of control and the deconsolidation of TSB. The Group’s residual investment in 40.01 per cent
of TSB was then recorded at fair value, as an asset held for sale. The Group recognised a loss of £660 million reflecting
the net costs of the Transitional Service Agreement between Lloyds and TSB, the contribution to be provided by Lloyds
to TSB in moving to alternative IT provision and the net result on sale of the 9.99 per cent interest and fair valuation of
the residual investment.
LLOYDS BANKING GROUP PLC 2015 HALF-YEAR RESULTS
Page 88 of 93
16. Disposal of interest in TSB Banking Group plc (continued)
The Group announced on 30 June 2015 that all relevant regulatory clearances had been received and that the sale was
therefore unconditional in all respects, so that at 30 June 2015 the Group was carrying a receivable from Banco Sabadell
in respect of the final proceeds of sale. The proceeds were received on 10 July 2015.
17. Ordinary dividends
An interim dividend for 2015 of 0.75 pence per ordinary share (half-year to 30 June 2014: nil) will be paid on 28
September 2015. The total amount of this dividend is £535 million.
Shareholders who have already joined the dividend reinvestment plan will automatically receive shares instead of the
cash dividend. Key dates for the payment of the dividend are:
Shares quoted ex-dividend 13 August 2015
Record date 14 August 2015
Final date for joining or leaving the dividend reinvestment plan 28 August 2015
Interim dividend paid 28 September 2015
On 19 May 2015, a dividend in respect of 2014 of 0.75 pence per ordinary share was paid to shareholders. This dividend
totalled £535 million.
18. Events since the balance sheet date
On 30 July 2015, the Group announced that it had agreed the sale of a portfolio of Irish commercial loans, with a book
value of £724 million, for a cash consideration of approximately £827 million; after transaction and other costs the gain
on disposal is not expected to be significant. The transaction is expected to complete in the fourth quarter of 2015.
19. Future accounting developments
The following pronouncements are not applicable for the year ending 31 December 2015 and have not been applied in
preparing these financial statements. Save as disclosed below, the full impact of these accounting changes is being
assessed by the Group.
IFRS 9 Financial Instruments
IFRS 9 replaces IAS 39 Financial Instruments: Recognition and Measurement. IFRS 9 requires financial assets to be
classified into one of three measurement categories, fair value through profit or loss, fair value through other
comprehensive income and amortised cost, on the basis of the objectives of the entity’s business model for managing its
financial assets and the contractual cash flow characteristics of the instruments. These changes are not expected to
have a significant impact on the Group.
IFRS 9 also replaces the existing ‘incurred loss’ impairment approach with an expected credit loss approach. This
change is likely to result in an increase in the Group’s balance sheet provisions for credit losses although the extent of
any increase will depend upon, amongst other things, the composition of the Group’s lending portfolios and forecast
economic conditions at the date of implementation. In February 2015, the Basel Committee on Banking Supervision
published a consultative document outlining supervisory expectations regarding sound credit risk practices associated
with implementing and applying an expected credit loss accounting framework. A final version is expected to be issued at
the end of 2015.

LLOYDS BANKING GROUP PLC 2015 HALF-YEAR RESULTS
Page 89 of 93
19. Future accounting developments (continued)
The hedge accounting requirements of IFRS 9 are more closely aligned with risk management practices and follow a
more principle-based approach than IAS 39. The revised requirements are not expected to have a significant impact on
the Group.
IFRS 9 is effective for annual periods beginning on or after 1 January 2018. As at 30 July 2015, this pronouncement is
awaiting EU endorsement.
IFRS 15 Revenue from Contracts with Customers
IFRS 15 replaces IAS 18 Revenue and IAS 11 Construction Contracts. IFRS 15 establishes principles for reporting
useful information about the nature, amount, timing and uncertainty of revenue and cash flows arising from an entity’s
contracts with customers. Revenue is recognised at an amount that reflects the consideration to which the entity expects
to be entitled in exchange for goods and services. Financial instruments, leases and insurance contracts are out of scope
and so this standard is not expected to have a significant impact on the Group.
IFRS 15 is effective for annual periods beginning on or after 1 January 2017, although in May 2015, the IASB issued an
exposure draft proposing to defer the effective date to 1 January 2018. In addition, on 30 July 2015 another exposure
draft was issued proposing targeted amendments to the standard. As at 30 July 2015, this standard is awaiting EU
endorsement.
20. Other information
The financial information included in these condensed consolidated half-year financial statements does not constitute
statutory accounts within the meaning of section 434 of the Companies Act 2006. Statutory accounts for the year ended
31 December 2014 have been delivered to the Registrar of Companies. The auditors’ report on those accounts was
unqualified and did not include a statement under sections 498(2) (accounting records or returns inadequate or accounts
not agreeing with records and returns) or 498(3) (failure to obtain necessary information and explanations) of the
Companies Act 2006.

LLOYDS BANKING GROUP PLC 2015 HALF-YEAR RESULTS
Page 90 of 93
STATEMENT OF DIRECTORS’ RESPONSIBILITIES
The directors listed below (being all the directors of Lloyds Banking Group plc) confirm that to the best of their knowledge
these condensed consolidated half-year financial statements have been prepared in accordance with International
Accounting Standard 34, Interim Financial Reporting, as adopted by the European Union, and that the half-year
management report herein includes a fair review of the information required by DTR 4.2.7R and DTR 4.2.8R, namely:
an indication of important events that have occurred during the six months ended 30 June 2015 and their impact on
the condensed consolidated half-year financial statements, and a description of the principal risks and uncertainties
for the remaining six months of the financial year; and
material related party transactions in the six months ended 30 June 2015 and any material changes in the related
party transactions described in the last annual report.
Signed on behalf of the board by
António Horta-Osório
Group Chief Executive
30 July 2015
Lloyds Banking Group plc board of directors:
Executive directors:
António Horta-Osório (Group Chief Executive)
George Culmer (Chief Financial Officer)
Juan Colombás (Chief Risk Officer)
Non-executive directors:
Lord Blackwell (Chairman)
Anita Frew (Deputy Chairman)
Alan Dickinson
Carolyn Fairbairn
Simon Henry
Dyfrig John CBE
Nicholas Luff
Nicholas Prettejohn
Anthony Watson CBE
Sara Weller CBE

LLOYDS BANKING GROUP PLC 2015 HALF-YEAR RESULTS
Page 91 of 93
INDEPENDENT REVIEW REPORT TO LLOYDS BANKING GROUP PLC
Report on the condensed consolidated half-year financial statements
Our conclusion
We have reviewed the condensed consolidated half-year financial statements, defined below, in the 2015 half-year
results of Lloyds Banking Group plc for the six months ended 30 June 2015. Based on our review, nothing has come to
our attention that causes us to believe that the condensed consolidated half-year financial statements are not prepared,
in all material respects, in accordance with International Accounting Standard 34 as adopted by the European Union and
the Disclosure and Transparency Rules of the United Kingdom's Financial Conduct Authority.
This conclusion is to be read in the context of what we say in the remainder of this report.
What we have reviewed
The condensed consolidated half-year financial statements, which are prepared by Lloyds Banking Group plc, comprise:
the consolidated income statement for the six months ended 30 June 2015;
the consolidated statement of comprehensive income for the six months ended 30 June 2015;
the consolidated balance sheet as at 30 June 2015;
the consolidated statement of changes in equity for the six months ended 30 June 2015;
the consolidated cash flow statement for the six months ended 30 June 2015; and
the explanatory notes to the condensed consolidated half-year financial statements.
As disclosed in note 1, the financial reporting framework that has been applied in the preparation of the full annual
financial statements of the group is applicable law and International Financial Reporting Standards (IFRSs) as adopted
by the European Union.
The condensed consolidated half-year financial statements included in the 2015 half-year results have been prepared in
accordance with International Accounting Standard 34, ‘Interim Financial Reporting’, as adopted by the European Union
and the Disclosure and Transparency Rules of the United Kingdom's Financial Conduct Authority.
What a review of condensed consolidated financial statements involves
We conducted our review in accordance with International Standard on Review Engagements (UK and Ireland) 2410,
‘Review of Interim Financial Information Performed by the Independent Auditor of the Entity’ issued by the Auditing
Practices Board for use in the United Kingdom. A review of interim financial information consists of making enquiries,
primarily of persons responsible for financial and accounting matters, and applying analytical and other review
procedures.
A review is substantially less in scope than an audit conducted in accordance with International Standards on Auditing
(UK and Ireland) and, consequently, does not enable us to obtain assurance that we would become aware of all
significant matters that might be identified in an audit. Accordingly, we do not express an audit opinion.
We have read the other information contained in the 2015 half-year results and considered whether it contains any
apparent misstatements or material inconsistencies with the information in the condensed consolidated half-year
financial statements.

LLOYDS BANKING GROUP PLC 2015 HALF-YEAR RESULTS
Page 92 of 93
INDEPENDENT REVIEW REPORT TO LLOYDS BANKING GROUP PLC (continued)
Responsibilities for the condensed consolidated half-year financial statements and the review
Our responsibilities and those of the directors
The 2015 half-year results, including the condensed consolidated half-year financial statements, are the responsibility of,
and have been approved by, the directors. The directors are responsible for preparing the 2015 half-year results in
accordance with the Disclosure and Transparency Rules of the United Kingdom's Financial Conduct Authority.
Our responsibility is to express to the company a conclusion on the condensed consolidated half-year financial
statements in the 2015 half-year results based on our review. This report, including the conclusion, has been prepared
for and only for the company for the purpose of complying with the Disclosure and Transparency Rules of the Financial
Conduct Authority and for no other purpose. We do not, in giving this conclusion, accept or assume responsibility for any
other purpose or to any other person to whom this report is shown or into whose hands it may come save where
expressly agreed by our prior consent in writing.
PricewaterhouseCoopers LLP
Chartered Accountants
30 July 2015
London
Notes:
(a) The maintenance and integrity of the Lloyds Banking Group plc website is the responsibility of the directors; the work carried out
by the auditors does not involve consideration of these matters and, accordingly, the auditors accept no responsibility for any
changes that may have occurred to the financial statements since they were initially presented on the website.
(b) Legislation in the United Kingdom governing the preparation and dissemination of financial statements may differ from
legislation in other jurisdictions.

LLOYDS BANKING GROUP PLC 2015 HALF-YEAR RESULTS
Page 93 of 93
CONTACTS
For further information please contact:
INVESTORS AND ANALYSTS
Douglas Radcliffe
Investor Relations Director
020 7356 1571
Mike Butters
Director of Investor Relations
020 7356 1187
Duncan Heath
Director of Investor Relations
020 7356 1585
CORPORATE AFFAIRS
Matthew Young
Group Corporate Affairs Director
020 7356 2231
Ed Petter
Group Media Relations Director
020 8936 5655
Copies of this news release may be obtained from:
Investor Relations, Lloyds Banking Group plc, 25 Gresham Street, London EC2V 7HN
The full news release can also be found on the Group’s website – www.lloydsbankinggroup.com
Registered office: Lloyds Banking Group plc, The Mound, Edinburgh, EH1 1YZ
Registered in Scotland no. 95000