2015 community benchmark report
TRANSCRIPT

2015 Community Benchmarking Report

WELCOME!
Andy StegglesPresident & Chief Customer OfficerHigher Logic
www.higherlogic.com/andysteggles
2

ABOUT HIGHER LOGIC
• 7 Years Old
• Private
• 300,000+ Communities
• 30m+ Members
• 500+ Clients
• Inc 500|5000 - 3 Years in a Row
• Top 50 Places to Work” (Washingtonian Magazine)
3
Goals are to Identify:
• Best Practices for Engaging Members
• Quantify Benchmarking Metrics for Different Sized Organizations
• Identify Trending Over Time
• Connect Engagement with Retention
• Make Recommendations based on Findings
• Demonstrate a Strong Correlation Between Engagement and Satisfaction

Methodology
• Perform Correlation Analysis
• Compare with 2014 MGI MM Benchmark and last
years Engagement Benchmarking Report
• 70+ Engagement Variables (plus Ratios
Between Variables)
• Create a Composite Engagement Score (CES)

Success is Subjective
• Most Common Discussion Success Metrics
• Number of Discussion Messages (Activity)• Percentage of Members Subscribed (Reach)• Number of Responses per Thread (Value)• Number of Authors (Distribution)
• What is Important to Your Organization?
Composite Engagement Score (CES)
• Subscribers to Members
•Messages to Members
•Responses per Thread
Summary Stats
• 16m Users (+4m from 2014)• 5m Members (+ 1m from 2014)• 2.3m Subscribers (+0.5 from 2014)• 318 Orgs (+65 from 2014)•Median CES: 25x
8

Timeframe and Assumptions
• Point in Time Data for Some Elements
• Focus is on Subscribers vs. Members
• Date range is 2014 (where applicable)
• Size Categories by Number of Members

Inclusion Criteria
• Org must have ALL of the below to qualify. Greater than:• 50 members• 50 subscribers• 50 messages• 0.005 Message per Member Ratio
• Must have been launched for the majority of 2014.
Email Metrics and Frictionless Content
• Full Email Support/Least Friction
• Partial Email Support/Less Friction
• Least Email Support/Most Friction


YoY Difference with Email
• Least Friction: • 37% Increase in Messages• 16% Increase in CES
• Less Friction:• 25% Increase in Messages• 16% Increase in CES
• Most Friction:• 1% Increase in Messages• 6% Increase in CES

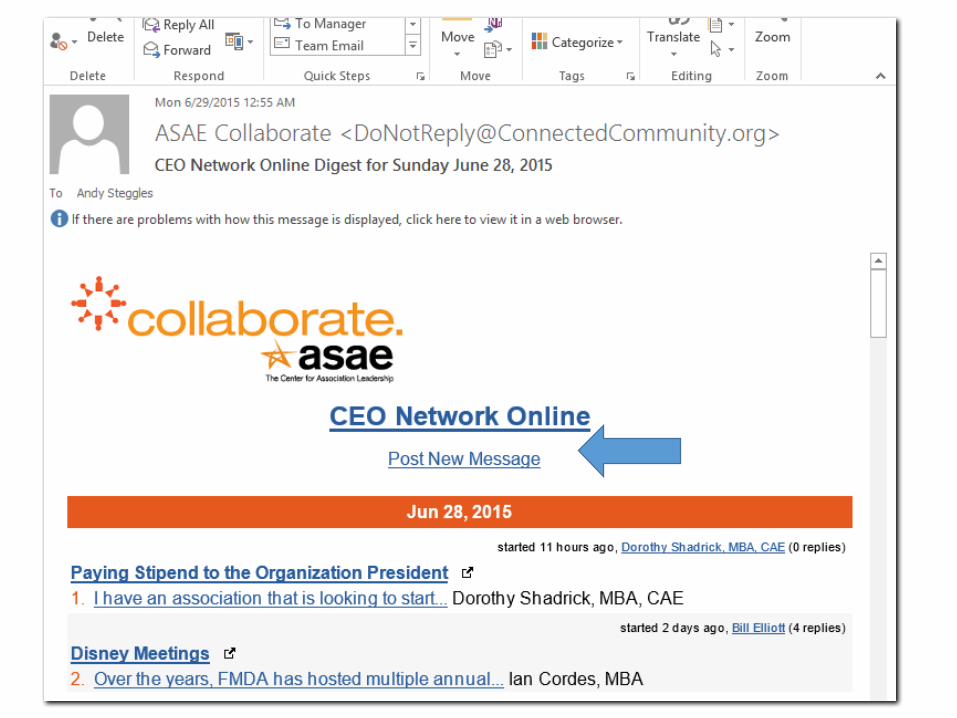
YoY Email Threads and Replies
• 150% Increase in Replies via Email (8% to 20% of all replies are via email)• How are Members Using Email?• 4.7 Email Replies per Email Thread vs• 1.09 Web Replies per Web Thread
• Breakdown based on Friction• Least Friction: 1 Thread to 1.6 Replies• Less Friction: 1 Thread to 1.15 Replies• Limited Friction: 1 Thread to 0.9 Replies
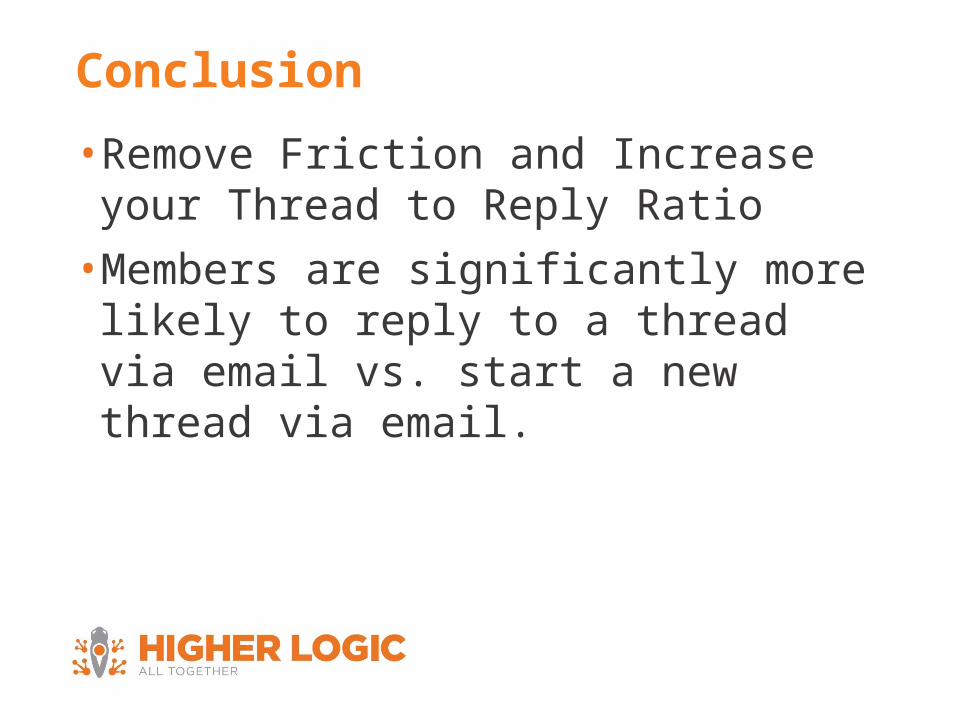
Conclusion
• Remove Friction and Increase your Thread to Reply Ratio
•Members are significantly more likely to reply to a thread via email vs. start a new thread via email.
18
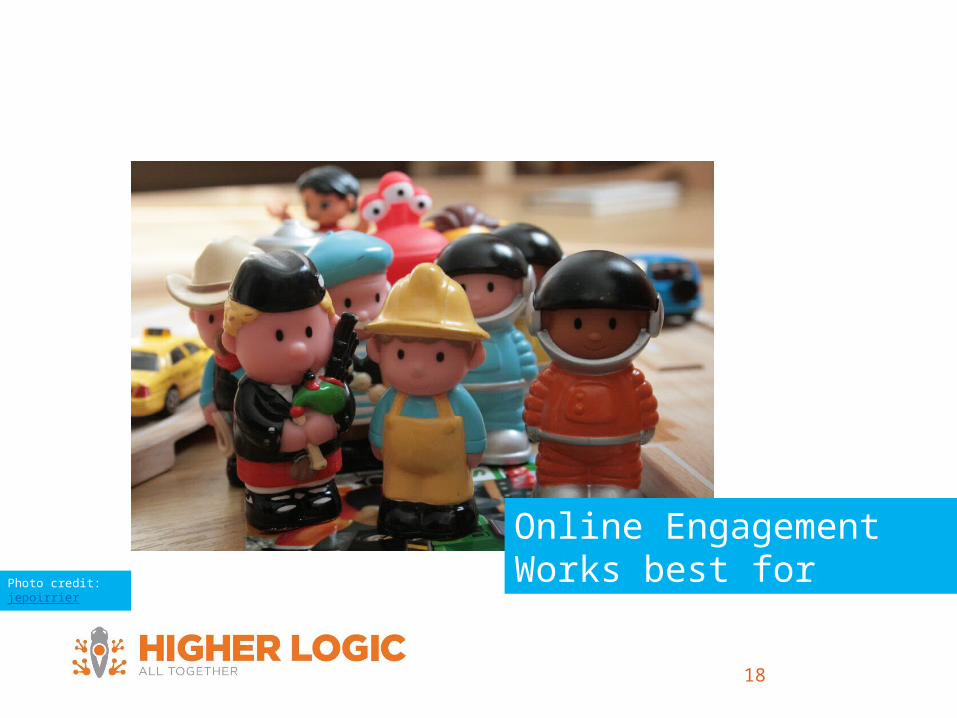
Online Engagement Works best for Photo credit: jepoirrier
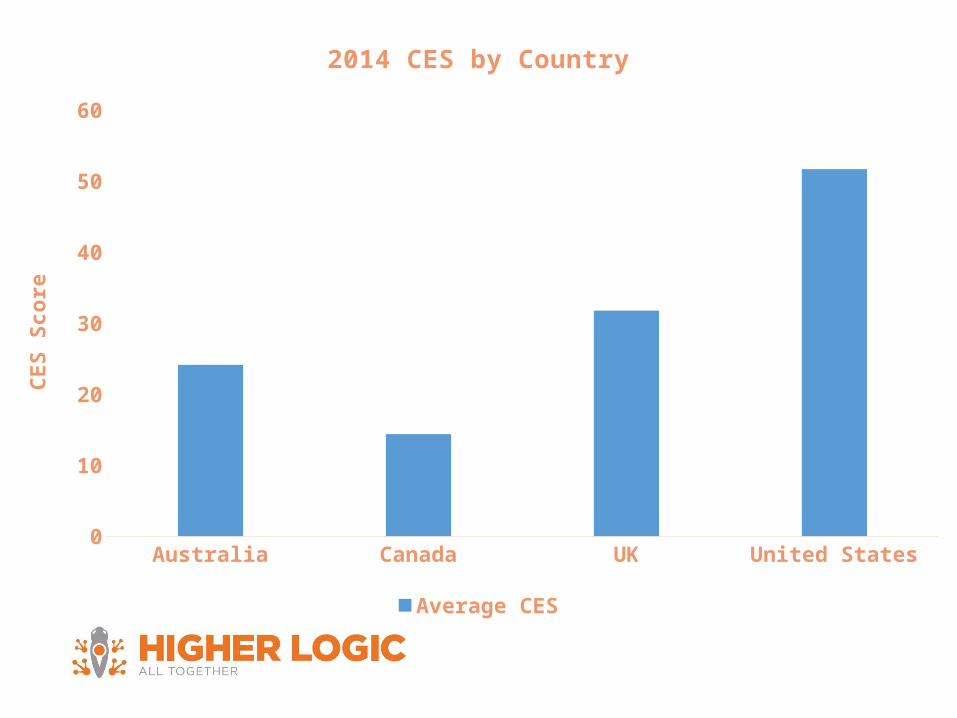
Australia Canada UK United States0
10
20
30
40
50
60
2014 CES by Country
Average CES
CES
Scor
e

Advocacy Networking Training0
10
20
30
40
50
60
70
80
90
100
2014 Primary Community Objective of Organization by CES
Average CES
CES
Scor
e

1. X-Large (100k+)
2. Large (50k to 99k)
3. Medium/
Large (20k to 49k)
4. Medium (5k to 19k)
5. Small/Medium
(1.5k to 4.9k)
6. Small (>1.4k)
0
20
40
60
80
100
120
140
2014 Size of Org by CES
Average CES
CES
Scor
e
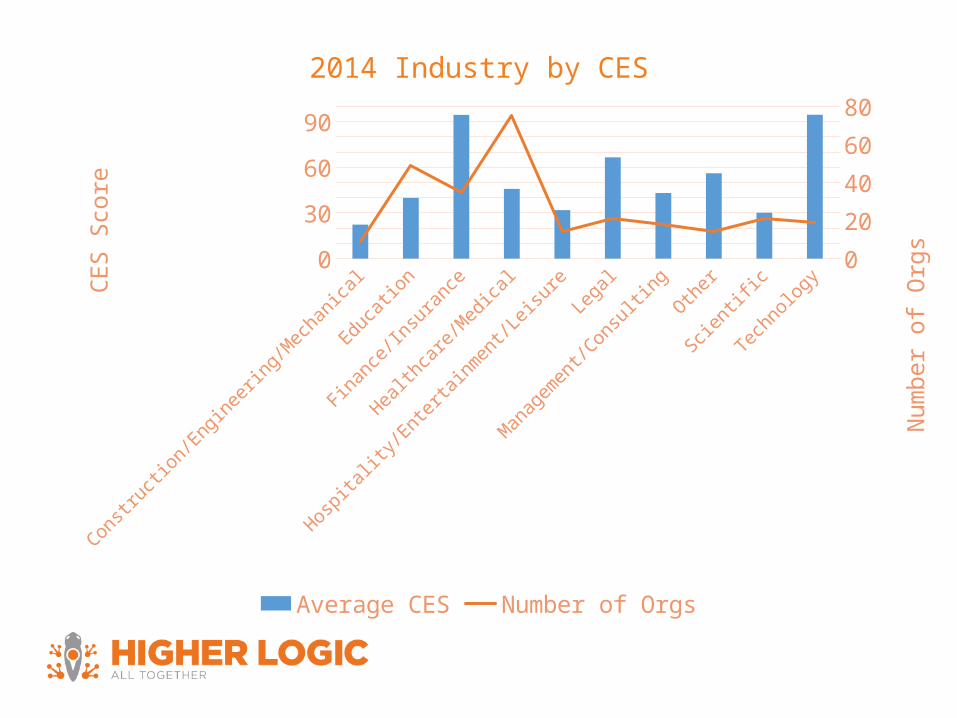
Constructi
on/Engineering/M
echanica
l
Education
Finance/In
surance
Healthca
re/Medica
l
Hospita
lity/Enterta
inment/Leisu
reLe
gal
Management/Consu
ltingOther
Scientific
Technology
0102030405060708090
100
01020304050607080
2014 Industry by CES
Average CES Number of Orgs
CES
Scor
e
Num
ber o
f Org
s

Accountan
ts
Attorneys
& Lega
l Pro
s
Business
Dev/Sale
s
Creative
/Arti
stic
Engineers
& Scientists
Medica
l Docto
rs
Non-Profit P
rofessi
onals
Nurses &
Oth
er Medica
l Pro
s
Operational/
Man
agement
Other P
rofessi
onal Se
rvice
s
Technologis
ts0
20
40
60
80
100
120
0510152025303540
2014 Type of Member by CES
Average CES Number of Orgs
CES
Scor
e
Num
ber o
f Org
s
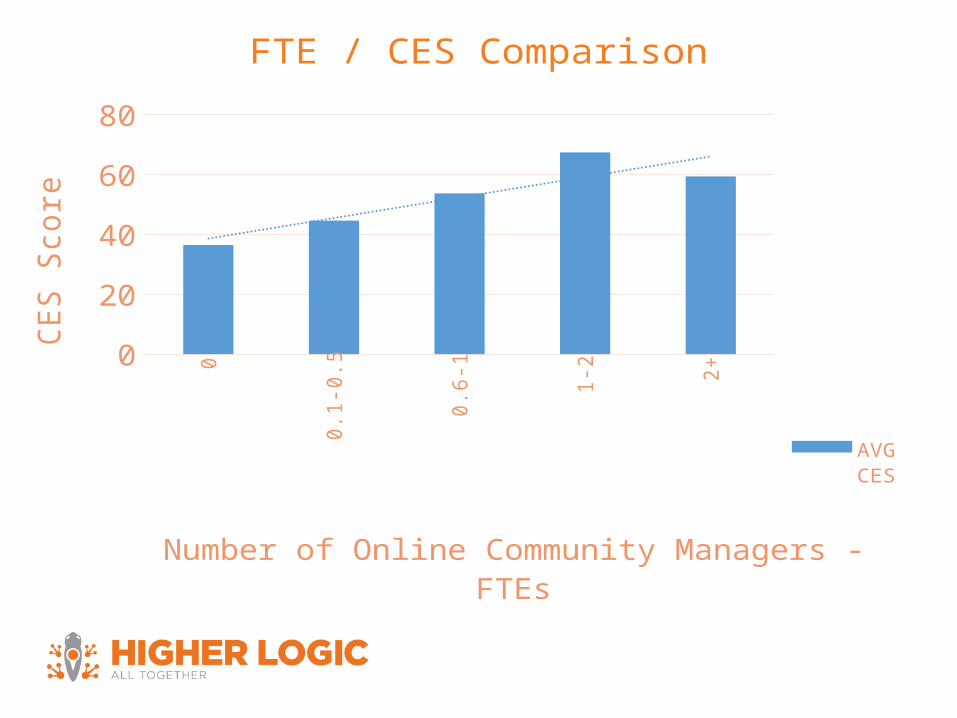
0
0.1
-0.5
0.6
-1
1-2 2+0
1020304050607080
FTE / CES Comparison
AVG CES
Number of Online Community Managers - FTEs
CES S
core
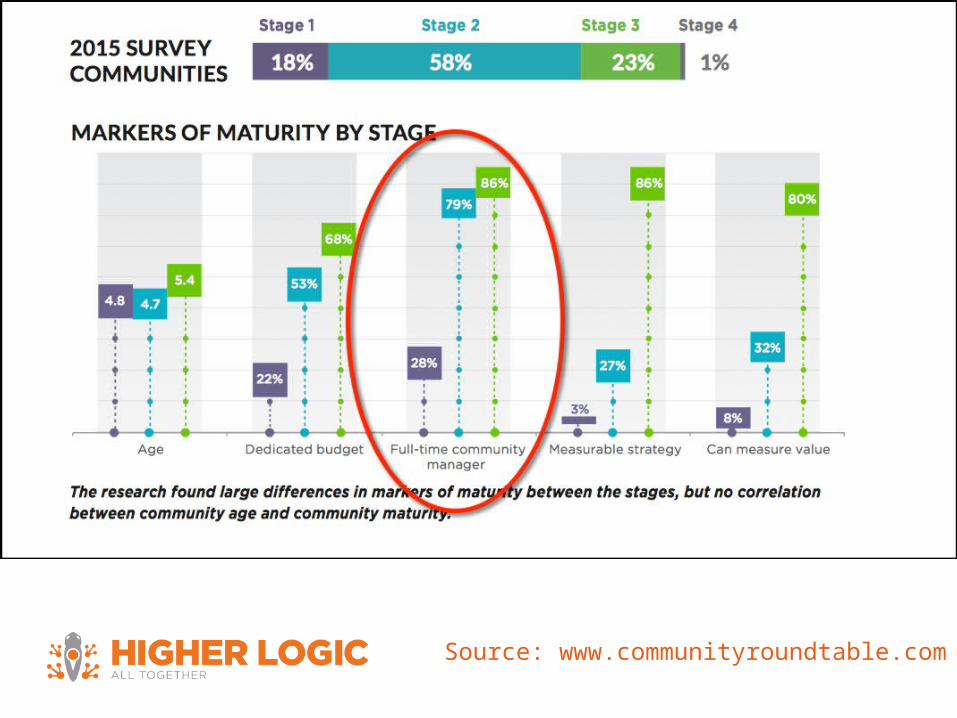
Source: www.communityroundtable.com
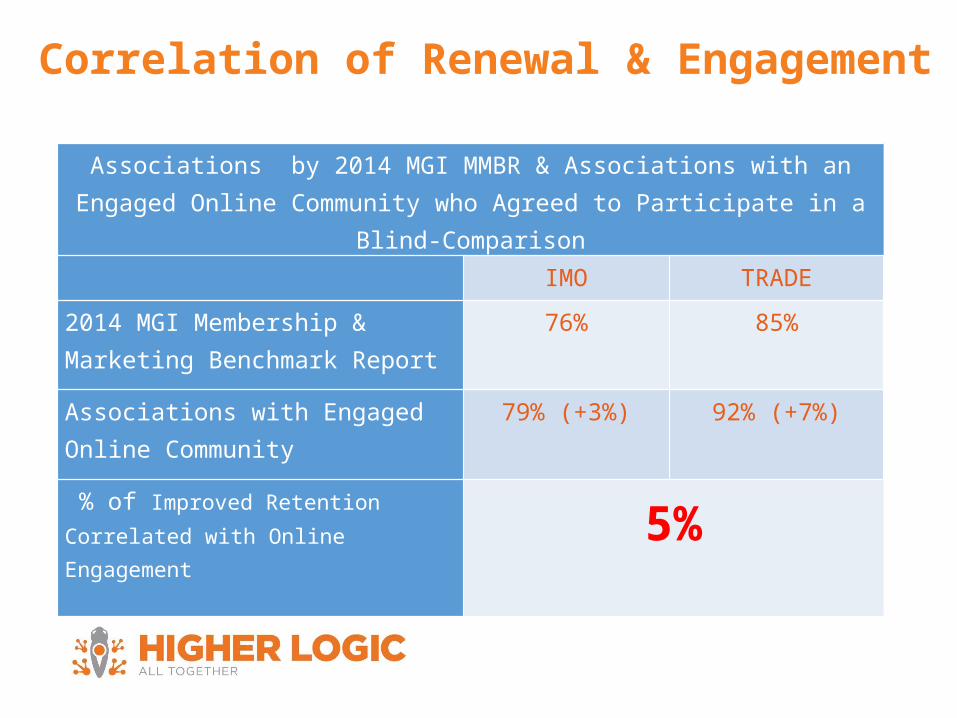
Correlation of Renewal & Engagement
Associations by 2014 MGI MMBR & Associations with an Engaged Online Community who Agreed to Participate in a Blind-
Comparison
IMO TRADE
2014 MGI Membership & Marketing Benchmark Report
76% 85%
Associations with Engaged Online Community
79% (+3%) 92% (+7%)
% of Improved Retention Correlated with Online Engagement 5%

Case Study: ASAE
Personalized Benchmark Report

User Metrics and KPIs
2013 2014
YOY % Change
Description ASAEAvg. Org
ASAEAvg. Org
ASAEAvg. Org
Total Number of (Active) Members22,244
16,226
21,95015,48
0-1.3% -4.6%
Total Number of ~Subscribers 13,165 7,41813,125
7,441-0.3% 0.3%
Subscriber to Member Ratio59% 46% 60% 48%
1.0% 5.1%
Percentage of Subscribers with a Photo15% 4% 15% 4%
1.1% -3.8%
Percentage of Subscribers with a Bio31.3% 8% 33% 8%
5.9% 3.3%
Percentage of Subscribers with a Photo OR Bio 33.9% 9% 36% 9%
5.2% 3.3%
Percentage of Subscribers with a Photo AND Bio 12.6% 3% 12.8% 3%
2.0% -5.9%

2013 20140%
10%
20%
30%
40%
50%
60%
70%
Subscriber to Member Ratio 2013-2014
ASAE Linear (ASAE)Average Org Linear (Average Org)
% M
em
bers
Subscr
ibed
2013 20140.0%
10.0%
20.0%
30.0%
40.0%
Percentage of Subscribers with Photo or Bio
ASAELinear (ASAE)Average OrgLinear (Average Org)
% w
ith P
hoto
or
Bio

Message Related KPIs
2013 2014 YOY % Change
Description ASAEAvg. Org
ASAEAvg. Org
ASAEAvg. Org
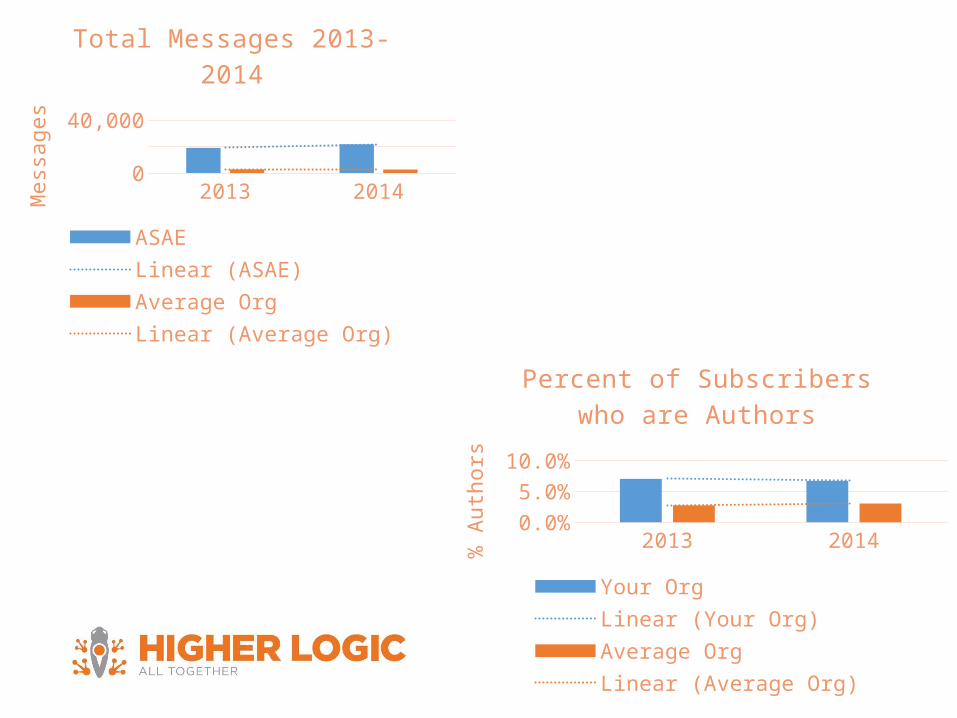
Total Number of Group Messages14,647 2,308 16,892 2,269 15% -2%
Total Number of Messages19,002 2,779 21,669 2,683 14% -3%
Total Number of Authors 925 204 881 225 -5% 11%
% of Subscribers who are Authors 7.0% 2.7% 6.7% 3.0% -4% 10%
Avg Messages per Author 6 6 6 5 4% -12%
% of Authors who posted more than one thread 119% 62% 136% 54% 14% -13%
Subscriber to Message Ratio 1 3 1 3 -13% 4%
2013 20140
10,000
20,000
Total Messages 2013-2014
ASAELinear (ASAE)Average OrgLinear (Average Org)
Mess
ages
2013 20140.0%
4.0%
8.0%
Percent of Subscribers who are Authors
Your OrgLinear (Your Org)Average OrgLinear (Average Org)
% A
uth
ors

Thread Related KPIs
2013 2014 YOY % Change
Description ASAEAvg. Org
ASAEAvg. Org
ASAEAvg. Org
Total Number Of Threads 6,141 969 6,882 933
12.1% -3.7%
Authors of Threads 1,879 252 1,975 256
5.1% 1.7%
Avg Threads per Author 3.27 3.85 3.48 3.65
6.6% -5.3%

2013 20140
2,000
4,000
6,000
8,000
Total Number of Threads 2013-2014
ASAELinear (ASAE)Average OrgLinear (Average Org)
To
tal T
hre
ad
s
2013 20142.80
3.00
3.20
3.40
3.60
3.80
4.00
Average Threads per Author 2013-2014
ASAELinear (ASAE)Average OrgLinear (Av-erage Org)
Ave
rag
e T
hre
ad
s
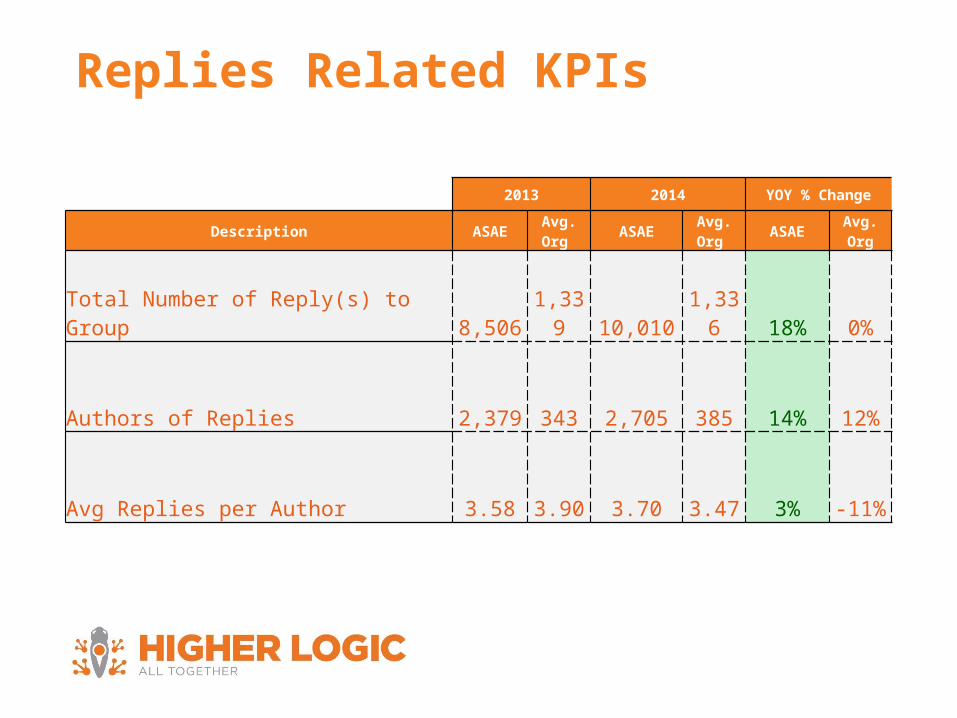
Replies Related KPIs
2013 2014 YOY % Change
Description ASAEAvg. Org
ASAEAvg. Org
ASAEAvg. Org
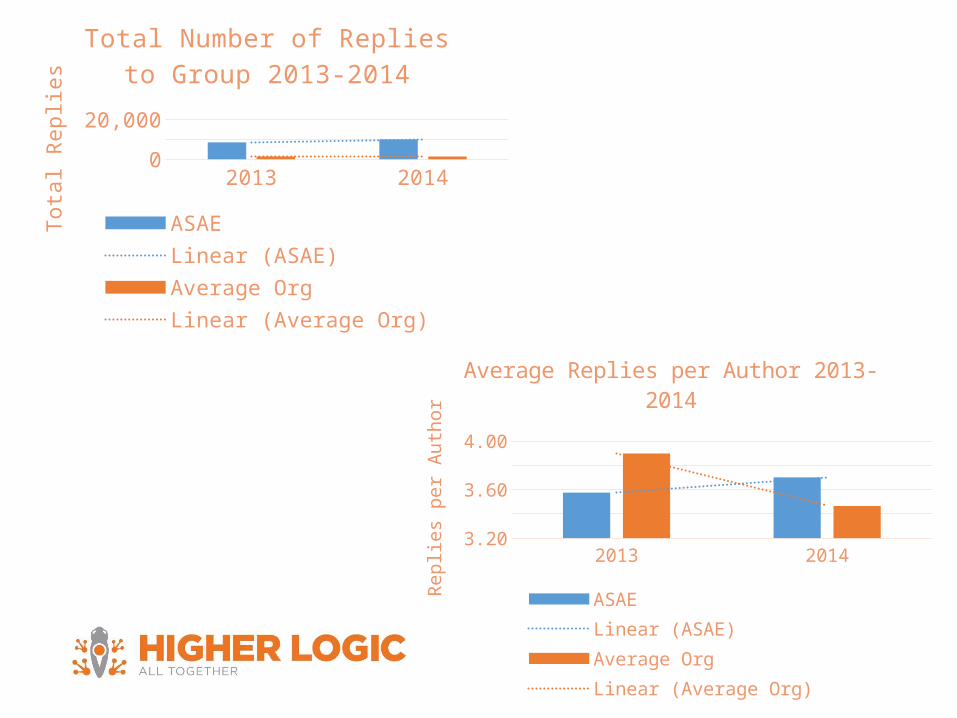
Total Number of Reply(s) to Group 8,506 1,339 10,010 1,336 18% 0%
Authors of Replies 2,379 343 2,705 385 14% 12%
Avg Replies per Author 3.58 3.90 3.70 3.47 3% -11%
2013 20140
5,00010,00015,000
Total Number of Replies to Group 2013-2014
ASAELinear (ASAE)Average OrgLinear (Average Org)
Tota
l R
eplie
s
2013 20143.20
3.40
3.60
3.80
4.00
Average Replies per Author 2013-2014
ASAELinear (ASAE)Average OrgLinear (Average Org)
Re
plie
s p
er
Au
tho
r
ASAE MEMBERS WHO ARE ENGAGED IN THEIR ONLINE
COMMUNITY ARE:
•30% more likely to renew
•23% more likely to recommend ASAE to their peers

Discussion Activity by Quartile

Of those who Replied to Group, percentage who:
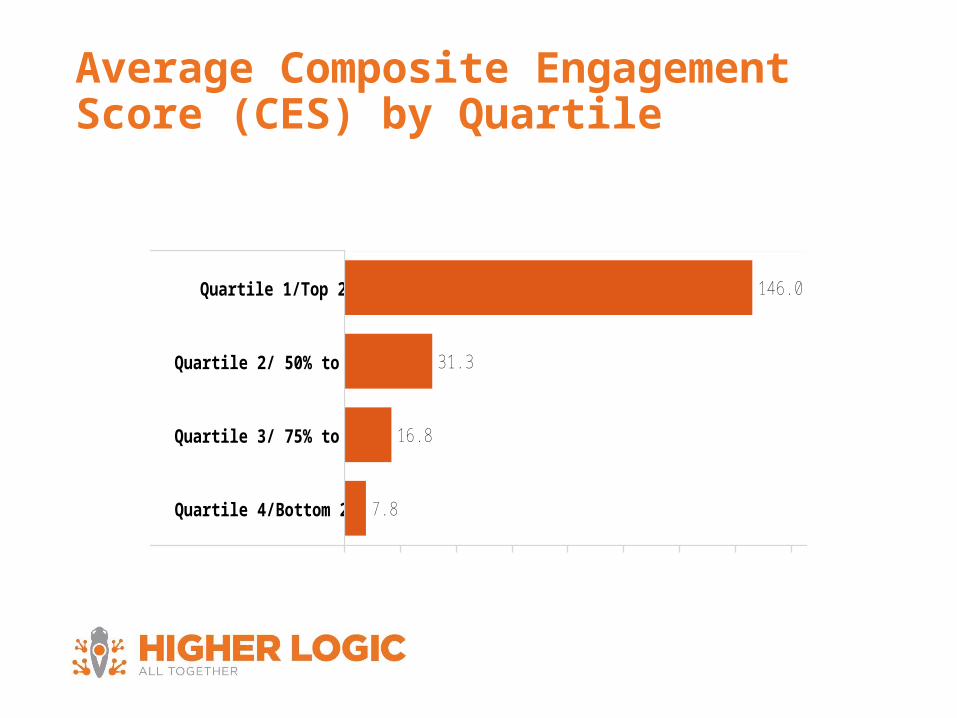
Average Composite Engagement Score (CES) by Quartile
0 20 40 60 80 100 120 140 160
Quartile 1/Top 25%
Quartile 2/ 50% to 25%
Quartile 3/ 75% to 50%
Quartile 4/Bottom 25%
146.0
16.8
31.3
7.8
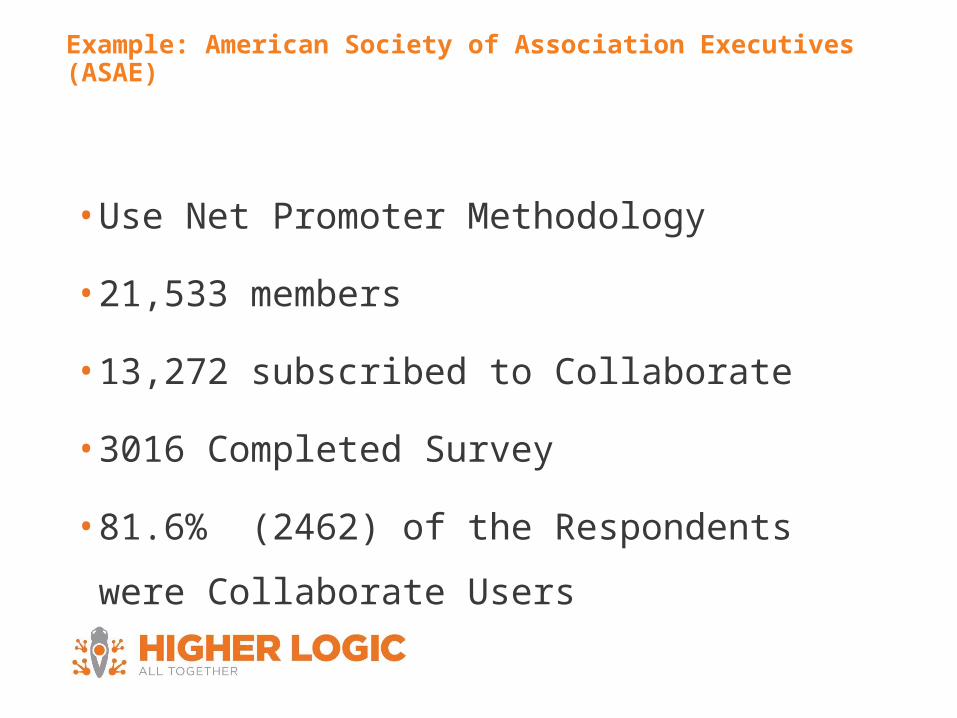
Example: American Society of Association Executives (ASAE)
• Use Net Promoter Methodology
• 21,533 members
• 13,272 subscribed to Collaborate
• 3016 Completed Survey
• 81.6% (2462) of the Respondents were Collaborate
Users

The Hall of Fame
OrganizationTNOM TNOS TNOT TNORTG TGM CES
Size Category
Alliance of Comprehensive Planners 242 236 1,808 4,056 5,864 2195.70 Small
National Employment Lawyer's Association 2,146 1,998 4,874 6,230 11,104 476.74 Small/Medium
American Society of Ophthalmic Administrators 2,640 2,562 3,181 7,731 10,912 386.85 Small/Medium
Piano Technicians Guild 3,579 3,377 2,970 11,543 14,513 379.67 Small/Medium
Veterinary Hospital Managers Association 2,170 2,036 1,240 3,796 5,036 223.57 Small/Medium
International Association of Rehabilitation Professionals 2,661 2,570 2,000 3,949 5,949 215.90 Small/Medium
National Society of Accountants 9,438 9,525 3,027 14,997 18,024 186.88 Medium
Avectra Users Group 1,095 547 788 1,136 1,924 167.83 Small
Higher Logic Users Group 2,837 1,235 1,272 2,849 4,121 142.86 Small/Medium
University Risk Management and Insurance Association, Inc., 2,178 2,546 1,156 1,920 3,076 140.41 Small/Medium
The ALS Association 392 381 205 269 474 120.25 Small
The American Association of Nurse Assessment Coordinators 13,553 13,567 6,735 9,065 15,800 116.65 Medium
VOLUNTEERISM.
Act of Engagement | Social Learning| Community
TASK-BASED VOLUNTEERISM
•Focus on Expertise vs. Availability
•Time Commitment: Hours to Days

Volunteer Metrics Comparison
Traditional Association | Result: 100 Member Volunteers
• 10 Committees | 10 Members on Each
Emerging Association | Result: 1610 Member Volunteers
• 5 Committees for 1 year term, 10 members on each (50)
• 10 Task Based Opportunities per month (120 per year), average 3
members per opportunity (360)
• 200 Micro-Opportunities per month, 0.5 member per opportunity
(1200)

45
3 KEYS TO VOLUNTEER SUCCESS
Frictionless | Increased Opportunities | Enjoyable

Volunteerism Engagement Community
46

How to Improve Your
CES?

AUTOMATION

MEMBER JOURNEY MAPPING
Where to Start?

Help Members up to Engagement Ladder

Community can Positively Impact Every Department
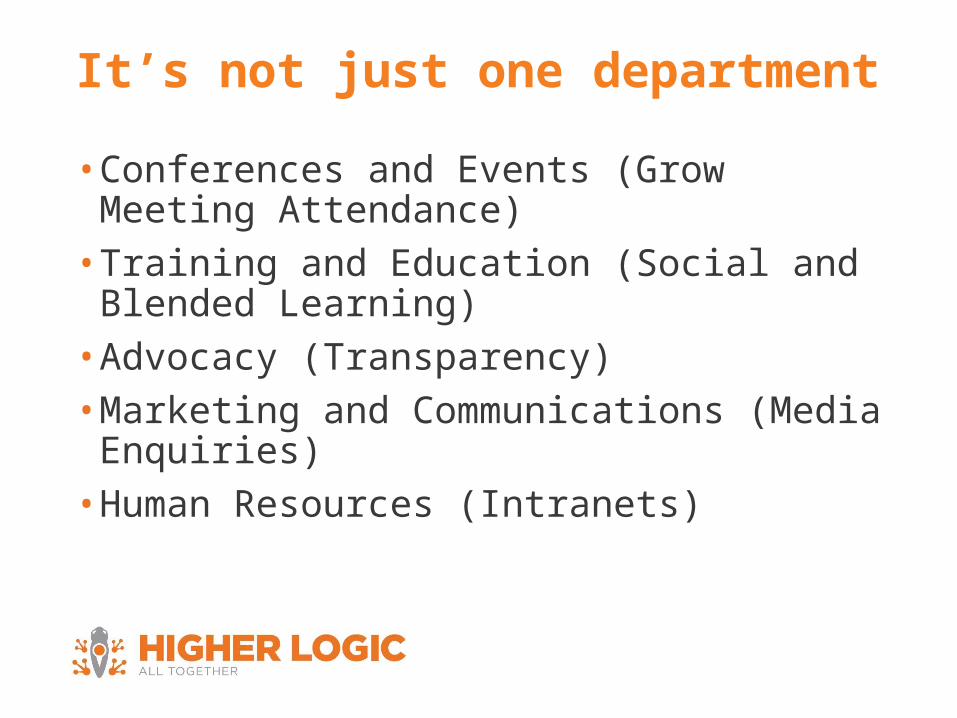
It’s not just one department
• Conferences and Events (Grow Meeting Attendance)• Training and Education (Social and
Blended Learning)• Advocacy (Transparency)• Marketing and Communications (Media
Enquiries)• Human Resources (Intranets)
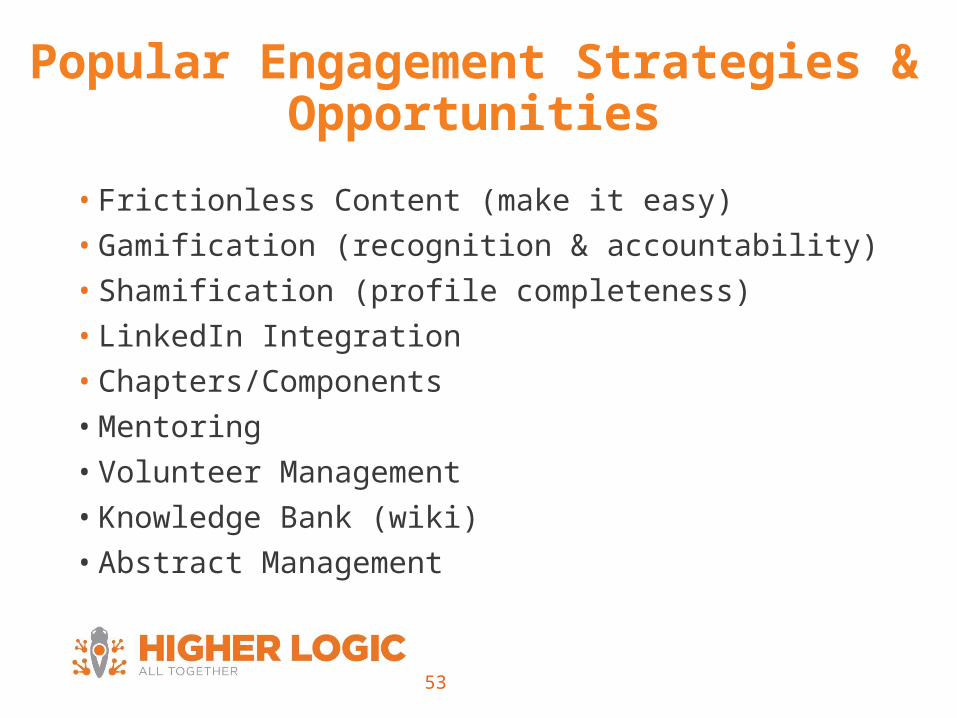
Popular Engagement Strategies & Opportunities
• Frictionless Content (make it easy)
• Gamification (recognition & accountability)
• Shamification (profile completeness)
• LinkedIn Integration
• Chapters/Components
• Mentoring
• Volunteer Management
• Knowledge Bank (wiki)
• Abstract Management
53

54
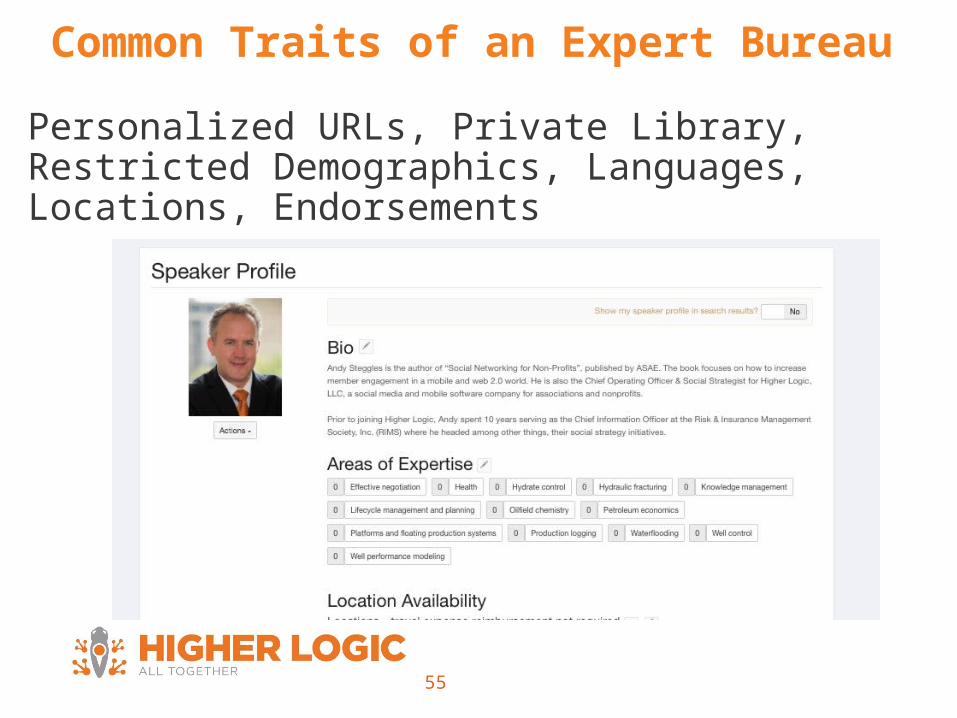
Common Traits of an Expert Bureau
Personalized URLs, Private Library, Restricted Demographics, Languages, Locations, Endorsements
55

Measuring&Recognizing
56

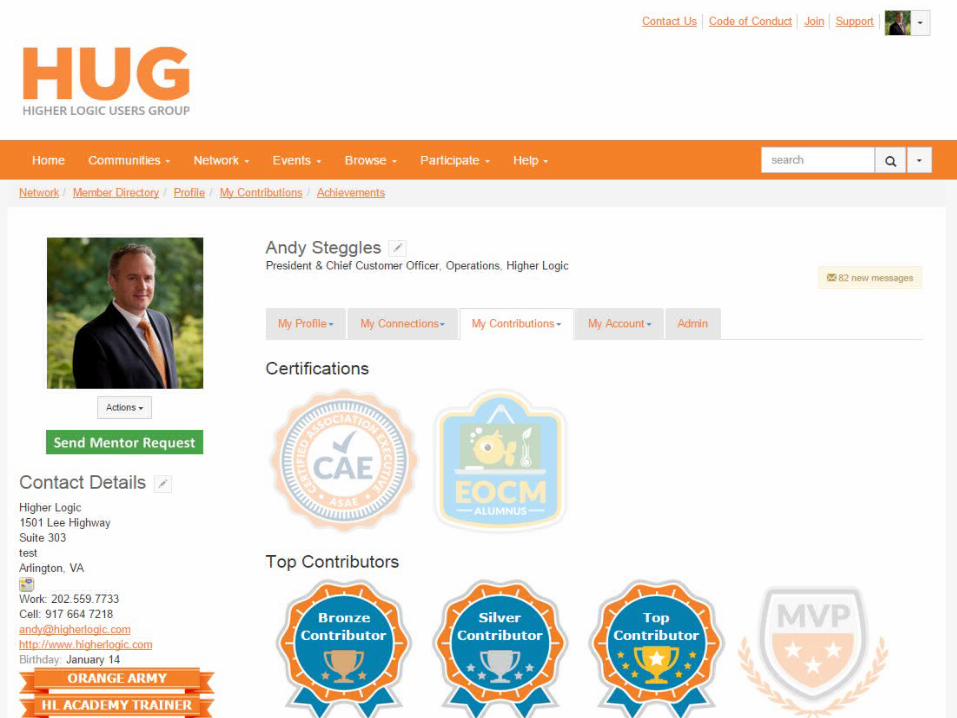
Recognition…

58


THANK YOU
Andy StegglesPresident & Chief Customer [email protected]
Signup for the report:higherlogic.com/2015cbr