2015 benefit system performance report · 2015 benefit system performance report ... eric judd bsc...
TRANSCRIPT

2015 Benefit System Performance Report
for the year ended 30 June 2015

Page 2 Benefit System Performance Report for the year ended 30 June 2015
Authors
Herwig Raubal BEc FNZSA FIAA
Chief Actuary
Eric Judd BSc FNZSA FIAA
Head of Actuarial
Dan Stoner BSc FNZSA (primary regulator) FIA
Senior Actuary
Published
November 2016
Ministry of Social Development
PO Box 1556
Wellington 6140
New Zealand
ISSN
2422-8761 (Print)
2422-877X (Online)

Benefit System Performance Report for the year ended 30 June 2015 Page 3
Table of Contents
1 Executive Summary .......................................................................................... 5
Purpose of this Report ............................................................................................. 5
Recent Experience .................................................................................................. 5
Valuation Results: Life-time Liability ......................................................................... 6
Future Focus: Risks and Opportunities ...................................................................... 7
Return on Investment: Employment Assistance Programmes and Trials ........................ 8
Comment .............................................................................................................. 9
2 Recent Experience .......................................................................................... 10
Profile of the Benefit System ...................................................................................10
Better Public Services Targets .................................................................................14
Benefit System Gateways .......................................................................................16
Gateway 1 – New Jobseeker Support Clients .............................................................18
Gateway 2 – Exits from Jobseeker Support ...............................................................20
Gateway 3 – Exits from Sole Parent Support .............................................................23
Gateway 4 – Transition of Youth to Working-Age Benefits ...........................................25
Gateway 5 – Transition of JS-WR Clients to JS-HCD ...................................................26
Gateway 6 – Transition to Supported Living Payment .................................................28
Post 30 June 2015 Experience .................................................................................30
3 Valuation Results: Life-time Liability .............................................................. 31
Summary of Approach and Valuation Assumptions .....................................................31
Core Valuation Results ...........................................................................................32
Child, Youth and Family and Department of Corrections .............................................35
Social Housing Valuation ........................................................................................37
Conclusions ..........................................................................................................38
4 Future Focus – Risk and Opportunities ........................................................... 39
Introduction ..........................................................................................................39
The Economy ........................................................................................................40
Health Trends .......................................................................................................41
Financial Incentives from Accommodation Related Benefits .........................................42
Population and Demographic Factors .......................................................................45
Sole Parents – Birth Rates ......................................................................................46
Policy Changes ......................................................................................................47
5 Return on Investment: Employment Assistance Programmes and Trials ........ 49
Skills for Industry ..................................................................................................50
Flexi-Wage ...........................................................................................................50
Training for Work ..................................................................................................51
Work Confidence ...................................................................................................52
Work Experience ...................................................................................................53
Flexible Childcare Assistance ...................................................................................53
In-Work Support ...................................................................................................54
Intensive Client Support .........................................................................................54
Young SLP ............................................................................................................55
Page 4 Benefit System Performance Report for the year ended 30 June 2015
6 Progress against Previous Report Recommendations ..................................... 56
Appendix A: Background .................................................................................. 61
Review of the Benefit System .................................................................................61
Purpose of this Report ............................................................................................61
Professional Standards ...........................................................................................62
Scope ..................................................................................................................62
Appendix B: Nature of the Business ................................................................. 64
Purpose ................................................................................................................64
Governance ..........................................................................................................64
Benefit Structure ...................................................................................................65
Recent Reforms .....................................................................................................67
Investment Approach .............................................................................................69
Appendix C: Return on Investment Methodology ............................................. 72
Appendix D: Glossary ....................................................................................... 74

Benefit System Performance Report for the year ended 30 June 2015 Page 5
1 Executive Summary
This report has been prepared by Herwig Raubal, FNZSA, FIAA; Eric Judd, FNZSA, 1.1
FIAA; and Daniel Stoner, FNZSA (primary regulator), FIA; and is in respect of the year
ended 30 June 2015.
Purpose of this Report
This report is addressed to the Chief Executive (CE) of the Ministry of Social 1.2
Development (MSD) with the understanding that it will also be provided to the Minister
of Finance and Minister for Social Development.
This report: 1.3
reviews exit rates, numbers of new clients and clients transitioning between
benefits over the year
reviews overall performance of the benefit system and the effectiveness of
investments made to reduce benefit dependency
reviews and comments on the valuation of the forward liability
identifies areas for attention to assist in managing long-term benefit dependency.
Recent Experience
As at 30 June 2015, the total number of working-age people receiving a main benefit 1.4
was 284,960. This was a decrease of 8,132 compared to 30 June 2014. Based on a
continuation of current entry and exit rates we forecast a range of 258,000 to 286,000
at June 2018 (cf. Better Public Services (BPS) 1 target of 220,000).
The accumulated actuarial release for the period from 30 June 2014 to 30 June 2015 1.5
is $2.3bn. Our central forecast of the actuarial release at 30 June 2018 is $6.1bn (cf.
BPS 1 target of $13bn).
Meeting the BPS 1 targets will depend on: 1.6
Economic conditions – will need to be at a level consistent with full employment
in 2018 (at least similar to pre-GFC lows)
BPS initiatives – need to be implemented, effective and scaled up as soon as
practically possible
Further investment and/or policy change – further action is required, particularly
with supporting work-capable Jobseeker Support – Health Conditions and
Disabilities (JS-HCD) and Supported Living Payment (SLP) clients into
employment. Any further actions will need to be designed, approved and funded
in the near future to materially contribute to meeting the BPS 1 targets.
Having two BPS 1 targets presents some challenges. In isolation they would likely 1.7
result in different management strategies. Considered together, they can conflict
depending on economic conditions.

Page 6 Benefit System Performance Report for the year ended 30 June 2015
Recommendation 1
To ensure focus is directed towards reducing long-term benefit dependency, ensure priority
is given to the actuarial release target. Operational targets may need to be amended to
reflect this.
Overall, the performance of the benefit system has been better than projected by the 1.8
valuation, but there are significant risks to achieving the BPS 1 targets. Client
numbers were 5,5541 lower than projected. As was the case last year, Sole Parent
Support (SPS) and Jobseeker Support (JS) clients accounted for the majority of this.
The reduction in SPS client numbers is significantly ahead of projections. This is 1.9
despite exit rate assumptions being increased for the 2014 valuation. Since welfare
reform, and particularly after the introduction of Work-Focused Case Management
(WFCM) in 2013, decreases in SPS client numbers have consistently bettered
projections despite tightened valuation assumptions each year. Exit rate assumptions
were further adjusted for the 2015 valuation to reflect this trend.
JS client numbers also fell over the year. JS-Work-Ready (JS-WR) client numbers 1.10
decreased by 3,9611 and JS-HCD client numbers decreased by 1,6871. The 30 June
2014 valuation anticipated JS-WR client numbers would increase, principally because
the unemployment rate increased over the year. The reduction in JS client numbers is
therefore a pleasing result.
SLP client numbers were broadly unchanged over the year and in line with valuation 1.11
projections. The increasing prevalence of SLP clients suffering from mental illness
remains a risk to the liability.
Youth benefit client numbers have stabilised. Compared with an increasing trend since 1.12
the introduction of the Youth Service, this is a positive outcome. Youth Payment (YP)
and Young Parent Payment (YPP) clients represent 23% of all clients under the age of
20.
The total number of clients under the age of 20 is only slightly higher than before the 1.13
Global Financial Crisis (GFC). This is a very positive outcome given early entry into the
benefit system is a strong predictor of long-term benefit dependency.
Valuation Results: Life-time Liability
The liability2 has decreased by $0.6bn to $68.4bn over the year to 30 June 2015. This 1.14
breaks down as follows:
A $2.4bn increase due to changes in economic assumptions. +$2.0bn of this was
due to lower discount and inflation rates and +$0.4bn due to higher
unemployment rates.
An expected liability decrease over the year of $1.0bn based on experience
observed up to 30 June 2014. This expected change incorporates the impact of
the actual unemployment rate over the year.
1 Based on the valuation client count methodology (see paragraphs 2.3 to 2.4) and differs from official counts
2 Expected future benefit payments up to age 65 for all people aged 16-64 who have received a benefit at any time in the 12 months
preceding the valuation date

Benefit System Performance Report for the year ended 30 June 2015 Page 7
A $2.2bn decrease attributable to welfare reform and operational changes not
already reflected in the 30 June 2014 valuation. Most of this decrease is due to
higher rates of exit from SPS.
A $0.1bn increase due to methodology changes unrelated to experience or
performance.
The cumulative liability impact over the last four years attributed to policy and 1.15
operational changes, including the $2.2bn above, is estimated to be $12.0bn.
By ethnicity, Māori made the greatest contribution to the $2.2bn in both absolute and 1.16
relative terms.
This valuation contains new analysis of the interaction between long-term benefit 1.17
dependency and a person’s Child, Youth and Family (CYF) history and/or history of
criminal convictions, improving understanding of the drivers of long-term benefit
receipt. It also contains further analysis of the impact of family benefit history.
CYF history and a history of criminal convictions are both significant predictors of 1.18
future benefit cost. Across all benefit categories, clients with CYF history have a $47k
(or over 40%) higher average liability than clients with no history. The liability
difference is more pronounced the more CYF interactions a person has had, and when
their first event occurred in the first three years of life.
The valuation results highlight that some significant predictors of long-term benefit 1.19
dependency manifest themselves many years before a person becomes eligible for
benefits. In particular, protecting vulnerable children and improving their childhood
experience is expected to improve their long-term outcomes including reducing their
likelihood of long-term benefit dependency.
An actuarial valuation of the social housing system is being developed. The social 1.20
housing valuation will be integrated with the benefit system valuation. This will
provide a more detailed understanding of people’s pathways in both systems and how
household dynamics impact social housing and benefit dependency.
Future Focus: Risks and Opportunities
Risks and opportunities are categorised into the fundamental areas that influence the 1.21
number of people needing support from the benefit system and their degree of long-
term benefit dependency.
The Economy – Labour market conditions have significant bearing on the benefit 1.22
system. For example, we estimate that a significant recession involving an
unemployment rate peak of 12% could add over 100,000 main benefit clients and
$10bn to the valuation liability. Most of this liability increase dissipates as the
economy recovers, though we estimate a $1bn-$1.5bn lasting effect on the liability.
This mainly relates to clients who wouldn’t have otherwise entered the benefit system.
Health Trends – Since 2000 the number of JS-HCD and SLP clients suffering from 1.23
mental illness has increased by approximately 31,000 (to about 60,000). This is
equivalent to about $5.5bn in liability. More connectivity is needed between health
treatment providers and Work and Income.

Page 8 Benefit System Performance Report for the year ended 30 June 2015
Recommendation 2
We recommend that management explore opportunities to work more closely with health
providers to ensure that clients suffering from mental illness receive appropriate care and
support. The viability of MSD directly purchasing mental health services for clients should
also be explored.
Management should consider the introduction of specialised resources or further
contracting-out of services to best manage the specific needs of client groups such as those
suffering from mental illness.
Financial Incentives from Accommodation Related Benefits – The current 1.24
design of Income Related Rent Subsidy (IRRS), Accommodation Supplement (AS) and
Temporary Additional Support (TAS) creates financial disincentives for clients to move
out of social housing into the private market and into employment. This impacts about
100,000 people in the BPS target group.
Recommendation 3
We recommend the design of IRRS, AS and TAS is reviewed to ensure that incentives are
aligned with the objective to reduce welfare dependency.
Population and Demographic Factors – The potential liability impact of projected 1.25
population and demographic changes by 30 June 2018 is +$2.3bn (cf. $13bn actuarial
release target).
Sole Parents –The long-term trend is to have children later in life. Birth rates for 1.26
women under 30 have been consistently declining. This is likely to have had a gradual
impact on SPS and YPP client numbers.
Policy Changes – The Child Material Hardship Package is expected to add $1.0bn to 1.27
$1.5bn to the valuation liability. In assessing the actuarial release the impact will
largely be removed. This will ensure that the assessed actuarial release reflects the
performance of the system rather than the effect of the structural changes.
Return on Investment: Employment Assistance Programmes and Trials
Work and Income operate a number of employment assistance programmes aimed at 1.28
supporting clients into sustainable employment. It also operates a number of trial
services/products with the intent that they may be rolled out if they are assessed as
being effective. We have evaluated a number of key programmes and trials, leading to
the following assessments:
Flexi-wage – The programme is delivering value
Skills for Industry – The programme is delivering value
Training for Work – The programme shows variable performance
Work Confidence – The programme appears not to be delivering value
Work Experience – The programme appears not to be delivering value

Benefit System Performance Report for the year ended 30 June 2015 Page 9
Flexible Childcare Assistance – The product appears to be delivering value
In-work Support – The service is not showing signs of being effective
Intensive Client Support – The service is showing signs of being effective
Management should consider these results as part of its review of funding within the 1.29
Multi-Category Appropriation (MCA).
Comment
This report is focused on the benefit system. Recommendations made are restricted to 1.30
actions within the control or influence of MSD management. However, the analysis in
this report highlights the potential value of broadening thinking beyond a client’s
history of benefit receipt. A person’s interactions with different social sector services at
different stages of their life are correlated. There is merit in taking a more holistic
view, recognising that a person’s likelihood of using a particular social sector service
can be influenced by their experience long before they become eligible for that
service. Equally, the impact of a particular agency’s work with people may extend
beyond that agency and/or have intergenerational effects.
Trying to materially influence people’s likelihood of long-term benefit dependency 1.31
when they are already in the benefit system has its limitations. Prevention is likely to
be more effective in the long term. Childhood and intergenerational risk factors
demonstrate that fundamentally reducing people’s risk of poor outcomes in adulthood,
including benefit dependency, requires a focus on childhood experience and vulnerable
families. We expect that recent years’ success in supporting sole parents into
employment will have lasting effects by reducing their children’s likelihood of long-
term benefit dependency, and other poor outcomes in adulthood.
The Investment Approach applied to a single social sector can add significant value, as 1.32
has been demonstrated by the application to the benefit system. However, the real
opportunity is to apply it across the whole social sector, taking a citizen-centric
approach.

Page 10 Benefit System Performance Report for the year ended 30 June 2015
2 Recent Experience
Summary
Overall, client numbers (valuation methodology) decreased by 10,871 over the
year and were 5,554 below projections. A large part of this variance relates to
SPS clients who had higher rates of exit from benefit than assumed in the 2014
valuation. JS-WR client numbers also reduced despite the unemployment rate
increasing over the year.
Forecasts suggest working-age main benefit client numbers will be between
258,000 and 286,000 at 30 June 2018, with a central forecast for the actuarial
release of $6.1bn. These numbers are materially behind the BPS 1 targets.
Meeting BPS 1 targets will require unemployment to be materially below Half-
year Economic and Fiscal Update (HYEFU) 2015 forecasts, existing BPS initiatives
to be quickly implemented and further investment in JS-HCD and SLP clients.
Improving the sustainability of JS exits is an important factor in reducing long-
term benefit dependency. More work could be done to better understand the risk
factors associated with an increased likelihood of returning to benefit.
The two BPS 1 targets have the potential to conflict. A focus on the actuarial
release target better aligns to the objective of reducing long-term benefit
dependency.
Profile of the Benefit System
The following chart shows how client numbers have changed since 2003 and how they 2.1
are forecast to change to 2018. Where information in this section is broken down by
benefit category, data prior to benefit structure changes in July 2013 have been
adjusted to ensure a consistent basis. Appendix B provides details on the July 2013
benefit structure changes.
0
50,000
100,000
150,000
200,000
250,000
300,000
350,000
400,000
2003 2004 2005 2006 2007 2008 2009 2010 2011 2012 2013 2014 2015 2016 2017 2018
Number of Clients by Main Benefit
JS-WR
JS-HCD
SLP
SPS
Forecast

Benefit System Performance Report for the year ended 30 June 2015 Page 11
The impact of the GFC is evident through 2008 to 2010, particularly on JS-WR clients. 2.2
The gradual increase in clients with health conditions (JS-HCD and SLP combined) is
also evident. The proportion of clients with health conditions represented 52.0% of
main benefits at 30 June 2015, up from 50.7% a year ago and 42.1% ten years ago.
We forecast this to increase to 55.7% by June 2018.
Client numbers noted in the rest of this chapter, except BPS numbers or where 2.3
otherwise specified, are based on the valuation methodology and differ to official
counts because:
client numbers in the valuation include all clients who have received a benefit in
the quarter whereas official reporting is at a point in time
client numbers in the valuation count partners as separate clients whereas official
reporting does not
the valuation includes 16-17 year olds whereas the working age count is for 18-
64 year olds
the valuation includes recent exits (anyone not receiving a benefit but who has
within the past 12 months) and people receiving orphan benefits and/or
supplementary payments that are not included in the main benefit numbers
the extraction dates for the valuation data and the official count data are
different. The valuation data is collected one month after the reporting date to
allow for any back-dated changes to be made.
A brief reconciliation is given in the following table: 2.4
Main working age benefits at 30 June 2015 (excl Student Hardship) 284,960
Quarterly count definition and back-dating of data 14,746
Partners 44,661
16-17 year olds 2,797
Recent exits / Supplementary benefits only 114,793
Other adjustments -688
Total receiving benefit in the quarter to 30 June 2015 461,269
All projections in this report come from the valuation model and will differ to Treasury 2.5
forecasts because they are used for a different purpose and adopt different
methodologies and assumptions. Projections incorporate the actual unemployment
rates between June 2014 and December 2015.
The following table, using valuation counts, provides further detail on the change in 2.6
client numbers over the year, and compares them with projected numbers.

Page 12 Benefit System Performance Report for the year ended 30 June 2015
Benefit Category Actual –
Quarter to 30 June 2014
Actual – Quarter to 30
June 2015 % Change
Projected – Quarter to 30
June 2015
Actual vs Projected
Ratio
Jobseeker – Work Ready incl. Emergency Benefit
100,466 96,505 -3.9% 103,412 93%
Jobseeker – Health Conditions and Disabilities
73,398 71,711 -2.3% 71,615 100%
Sole Parent Support 82,840 77,299 -6.7% 79,833 97%
Supported Living Payment 105,475 105,956 +0.5% 105,622 100%
Youth Payment 2,045 2,194 +7.3% 2,139 103%
Young Parent Payment 1,233 1,109 -10.1% 1,152 96%
Supplementary Benefits Only
101,452 101,089 -0.4% 97,764 103%
Orphans Benefit 5,231 5,406 +3.3% 5,285 102%
Total 472,140 461,269 -2.3% 466,823 99%
Overall, the performance of the benefit system has been slightly ahead of projections, 2.7
but there are significant risks to achieving the BPS 1 targets. Client numbers were
10,871 lower than the same time in 2014, and 5,554 lower than projected. SPS and
JS clients account for most of this, as was the case in the previous year.
SPS client numbers fell 5,541 over the year, a decrease of 6.7%. This is significant 2.8
because it is materially below projections despite exit rate assumptions being
increased for the 2014 valuation. This is a recurring theme – since welfare reform and
particularly after the introduction of WFCM in 2013, decreases in SPS client numbers
have consistently bettered projections despite tightened valuation assumptions each
year. Exit rate assumptions were further adjusted for the 2015 valuation to reflect this
trend.
JS client numbers also fell over the year. JS-WR client numbers decreased by 3,961 2.9
and JS-HCD client numbers by 1,687. The 30 June 2014 valuation anticipated JS-WR
client numbers would increase, principally because the unemployment rate increased
over the year. The reduction in JS client numbers is therefore a pleasing result.
SLP client numbers were broadly unchanged over the year in line with valuation 2.10
projections. The increasing prevalence of SLP clients suffering from mental illness
remains a risk to achieving BPS 1 targets (see chapter four).
YP and YPP client numbers combined were generally unchanged and marginally above 2.11
the level projected. The stabilisation of youth benefit client numbers is an
improvement on the previous increasing trend since the introduction of the Youth
Service. YP and YPP clients represent 23% of all clients under the age of 20. The total
number of clients under 20 years old on 30 June 2015 was only slightly higher than at
the economic peak shortly before the GFC. This is a pleasing outcome, noting that
early entry into the benefit system is a strong predictor of long-term benefit
dependency.

Benefit System Performance Report for the year ended 30 June 2015 Page 13
The following chart shows client numbers over time by age band. Generally, the 2.12
younger the client the higher the liability as young people have more potential future
years on benefit. The chart shows that:
The number of clients aged 30-39 has fallen back past its pre-GFC low. This
contrasts with the number of clients aged 20-29 which remains 27% above pre-
GFC levels. Clients currently aged 20-29 are more likely to have had little or no
work experience prior to the GFC and as a consequence may have found it more
difficult than older clients to find employment.
The number of clients aged 50-64 has not decreased materially from its post-GFC
high. At 30 June 2015 there were 91,938 clients aged 50-64, compared to
95,257 at the post-GFC high (Sep 2012) and 73,809 at the pre-GFC low (May
2008). While older clients tend to be lower liability as they have less future
potential time on benefits, over 80% have been continuously on main benefit for
over a year and 55% have been continuously on main benefit for over five years.
Given that 56% of the BPS 1 target group (over 160,000 clients) are aged either 20-2.13
29 or 50-64, further work should be done to better understand why client numbers in
these age bands have not decreased as much as others since the GFC. Changes in the
general population account for some of the differences, but not all.
The following chart shows client numbers over time by ethnicity. The number of Māori 2.14
clients at 30 June 2015 was 24% above the pre-GFC low. This compares to 4% for NZ
Europeans and 12% for Pacific People. Māori client numbers remain close to post-GFC
highs. Māori clients have a higher average liability than other ethnic groups, indicating
a higher risk of long-term benefit dependency. However, as shown in paragraphs 3.15
to 3.17, some improvements have been made over the 2014/15 year.
0
20,000
40,000
60,000
80,000
100,000
120,000
Jan
-03
Jan
-04
Jan
-05
Jan
-06
Jan
-07
Jan
-08
Jan
-09
Jan
-10
Jan
-11
Jan
-12
Jan
-13
Jan
-14
Jan
-15
Number of Clients by Age Band
50-64
40-49
30-39
20-29
<20

Page 14 Benefit System Performance Report for the year ended 30 June 2015
Better Public Services Targets
The Better Public Services Result Area 1: Reducing Long-Term Welfare Dependence 2.15
target is to ‘reduce the total number of people receiving benefit by 25 per cent, from
295,000 in June 2014 to 220,000 by June 2018, and reduce the long-term cost of
benefit dependency by $13 billion as measured by an accumulated Actuarial Release,
by June 2018’.
Receiving a benefit in the context of the BPS 1 beneficiary count target means being 2.16
aged between 18 and 64 and receiving a main benefit. These are: Jobseeker Support,
Sole Parent Support, Supported Living Payment, Youth Payment, Young Parent
Payment, Emergency Benefit or Emergency Maintenance Allowance.
The following charts show progress towards the BPS 1 targets: 2.17
0
20,000
40,000
60,000
80,000
100,000
120,000
140,000
160,000
180,000
Jan
-03
Jan
-04
Jan
-05
Jan
-06
Jan
-07
Jan
-08
Jan
-09
Jan
-10
Jan
-11
Jan
-12
Jan
-13
Jan
-14
Jan
-15
Number of Clients by Ethnicity
Māori
NZ European
Pacific People
Other
200,000
220,000
240,000
260,000
280,000
300,000
320,000
340,000
Dec05
Jun06
Dec06
Jun07
Dec07
Jun08
Dec08
Jun09
Dec09
Jun10
Dec10
Jun11
Dec11
Jun12
Dec12
Jun13
Dec13
Jun14
Dec14
Jun15
Dec15
Jun16
Dec16
Jun17
Dec17
Jun18
BPS 1 Client Count Target - Progress to Target 2005-2018
Actual Low Mid High Target
Forecast based on HYEFU 2015 forecast unemployment rates

Benefit System Performance Report for the year ended 30 June 2015 Page 15
As at 30 June 2015, the total number of people receiving a benefit was 284,960. 2.18
Nearly 60% of the decrease since 30 June 2014 relates to SPS clients. A further 24%
and 12% relates to JS-WR and JS-HCD clients respectively. SPS clients have a higher
average liability than other main benefit categories, and so contribute more to the
actuarial release.
Based on a continuation of current entry and exit rates and unemployment rates 2.19
consistent with HYEFU 2015, we forecast the working-age beneficiary count to be
approximately 272,000 at 30 June 2018 with a range of 258,000 to 286,000.
Actuarial release is intended to broadly represent the Government’s impact on the 2.20
benefit system. While this is a liability-based measure, it is different to the change in
valuation liability attributable to policy and operational changes (experience item)
reported in chapter three. This is due to a number of reasons including:
The actuarial release is relative to a 295,000 June 2014 beneficiary count starting
point, whereas the experience item is relative to a decreasing beneficiary count
forecast implied by valuation assumptions. All else being equal, if the number of
people on benefits is decreasing, the actuarial release will be greater than the
experience item.
The calculation methodology for the actuarial release uses the 30 June 2014
valuation model and assumptions. It does not update each year with new
valuation assumptions and so does not include changes in liability due to changes
in assumptions. For example, if the valuation liability decreased because the SPS
exit rate assumption had been increased, this would not impact the actuarial
release. This removes subjectivity from the calculation process.
The change in valuation liability excludes the estimated impact of changes in
labour market conditions on client numbers. The actuarial release includes this
impact.
The accumulated actuarial release for the period from 30 June 2014 to 30 June 2015 2.21
is $2.3bn. The forecast is for this to have grown to $6.1bn by June 2018, well behind
$-
$1
$2
$3
$4
$5
$6
$7
$8
$9
$10
$11
$12
$13
Jun
14
Sep
14
Dec
14
Mar
15
Jun
15
Sep
15
Dec
15
Mar
16
Jun
16
Sep
16
Dec
16
Mar
17
Jun
17
Sep
17
Dec
17
Mar
18
Jun
18
Bill
ions
BPS 1 Actuarial Release Target - Progress to Target 2014-2018
Actual Mid Forecast
Low in actuarial release forecast caused by a peak in unemployment rate forecast (HYEFU 2015)

Page 16 Benefit System Performance Report for the year ended 30 June 2015
the $13bn target. This forecast is based on the mid-client number forecast.
The beneficiary count and actuarial release forecasts are sensitive to economic 2.22
conditions, population and demographic changes, and Work and Income’s
performance in supporting clients into sustainable employment.
Meeting the BPS 1 targets will require: 2.23
Economic conditions – Client numbers are heavily influenced by the state of the
economy and demand for labour. The unemployment rate will need to be at a
level similar to pre-GFC lows (less than 4%), which is materially below the HYEFU
forecast of 5.3%.
Approved and funded initiatives - MSD is working on a number of new initiatives
aimed at achieving the BPS 1 targets. This includes initiatives that require
funding through the budget process. In order to materially contribute to the
targets, these initiatives need to be implemented, effective and scaled up as soon
as practically possible.
Further investment and/or policy change – Further action is almost certainly
required to meet the target, particularly initiatives to support work capable JS-
HCD and SLP clients into employment. Given the timing, any further actions will
need to be designed, approved and funded in the near term to materially
contribute to meeting the BPS 1 targets.
The use of multiple targets
The existence of two BPS 1 targets can cause conflicting incentives. A numerical target 2.24
may drive a focus on supporting those closest to the labour market. However, a focus
on the liability requires support to be directed towards those with greatest barriers to
employment.
Recommendation 1
To ensure focus is directed towards reducing long-term benefit dependency, ensure priority
is given to the actuarial release target. Operational targets may need to be amended to
reflect this.
Benefit System Gateways
The rest of this section focuses on six key gateways in, through and out of the benefit 2.25
system. Collectively, these gateways explain the majority of the change in the shape
of the benefit system over time and the impact this has on the liability (as a proxy for
long-term benefit dependency). The following table (with the six key gateways
marked) gives a snapshot view of how clients have transitioned over the year to 30
June 2015 compared with projections from the 30 June 2014 valuation.
For clients in each benefit category in the quarter to 30 June 2014, reading across the 2.26
row shows how many of these clients received a benefit in the quarter to 30 June
2015. For example, of the 100,466 JS-WR clients in the quarter to 30 June 2014,
2,859 received SPS in the quarter to 30 June 2015, and 37,051 were no longer
receiving a benefit.
Conversely, the columns show for each benefit category in the quarter to 30 June 2.27
2015, what category they were in the quarter 30 June 2014. For example, of the

Benefit System Performance Report for the year ended 30 June 2015 Page 17
77,299 clients who received SPS in the quarter to 30 June 2015, 60,609 were
receiving SPS in the quarter to 30 June 2014. 432 were SLP clients in the quarter to
30 June 2014. The ‘Recent exits’ row represents people who exited benefit in the year
to 30 June 2014.
The colours indicate if the actual result was better or broadly the same (green) or 2.28
worse (red) than projected.
30 June 2014 Benefit Category
30 June 2015 Benefit Category
JS-WR JS-HCD
SPS SLP YP or YPP
SUP or OB
Exits
JS-WR 100,466 Actual Projected A/P
46,035 48,008
96%
7,222 6,976 104%
2,859 3,086 93%
1,479 1,482 100%
- 3 -
5,820 5,278 110%
37,051 35,650 104%
JS-HCD
73,398 Actual Projected A/P
5,268 5,814 91%
44,270 43,389 102%
1,846 2,306 80%
5,403 5,199 104%
- - -
2,200 2,249 98%
14,411 14,441 100%
SPS 82,840 Actual Projected A/P
4,210 4,299 99%
1,284 1,228 105%
60,609 62,191
97%
1,035 891
116%
- - -
5,978 4,928 121%
9,724 9,304 105%
SLP 105,475 Actual Projected A/P
901 1,006 90%
1,102 1,191 93%
432 478
90%
92,543 92,399 100%
- 2 -
547 533
103%
9,950 9,866 101%
YP or YPP
3,278 Actual Projected A/P
823 875
94%
97 109
89%
605 639
95%
15 21
-
836 811
103%
38 48
-
864 759
114%
SUP or OB
106,683 Actual Projected A/P
3,330 3,775 88%
1,883 2,126 89%
2,532 2,763 92%
438 517
85%
3 1 -
69,184 65,280 106%
29,313 32,220
91%
Sub-Total
472,140 Actual Projected A/P
60,567 63,776
95%
55,858 55,019 102%
68,883 71,463
96%
100,913 100,508
100%
839 817
103%
83,767 78,316 107%
101,313 102,240
99%
Recent Exits
105,748 Actual Projected A/P
8,825 9,046 98%
3,653 4,092 89%
2,236 2,399 93%
695 788
88%
30 13
-
3,900 4,602 85%
86,409 84,808 102%
Sub-Total
577,888 Actual Projected A/P
69,392 72,822
95%
59,511 59,111 101%
71,119 73,862
96%
101,608 101,296
100%
869 830
105%
87,667 82,918 106%
187,722 187,048
100%
New Clients
92,035 96,024
96%
Actual Projected A/P
27,113 30,589
89%
12,200 12,505
98%
6,180 5,971 104%
4,348 4,326 101%
2,434 2,461 99%
18,828 20,131
94%
20,932 20,040 104%
Total Actual Projected A/P
96,505 103,412
93%
71,711 71,615 100%
77,299 79,833
97%
105,956 105,622
100%
3,303 3,291 100%
106,495 103,049
103%
208,654 207,089
101%
Aside from the six benefit gateways themselves, some overall observations from the 2.29
table are:
66% of people were in the same benefit category in the quarter to 30 June 2015
as they were in the quarter to 30 June 2014. This was 4% less than the 2013/14
year mainly as a result of more clients exiting benefit (21% 2014/15 vs 18%
2013/14).
Of those people who exited the benefit system in the year to 30 June 2014, 18%
received a benefit in the quarter to 30 June 2015. This was down from 21% in
the 2013/14 year.
9.5% of people receiving a main benefit in the quarter to 30 June 2014
transitioned to another main benefit category over the year. 5.4% of this
represented a transition to a higher liability benefit category, particularly JS-WR
to JS-HCD and JS-HCD to SLP. These are important gateways. For context, the
average liability of 20-29 year old clients who have recently transitioned from JS-
HCD to SLP is $301k, compared to $168k for 20-29 year old JS-HCD clients.
More SPS client exits than projected and less people transitioning to SPS from
another benefit category has resulted in a materially lower than projected
number of SPS clients in the quarter to 30 June 2015 (77,299 vs 79,833). New
1
2
3
4
5
6
1

Page 18 Benefit System Performance Report for the year ended 30 June 2015
SPS client numbers were actually higher than projected over the year (6,180 vs.
5,971).
More people are receiving supplementary benefits only than projected. This is a
good outcome as it represents more people exiting and less people returning to
main benefits than projected. The average liability of a client who has recently
stopped receiving SPS, but is receiving supplementary benefits, is $79k,
compared to the average SPS client liability of $188k.
Next, the six gateways are discussed in more detail. 2.30
Gateway 1 – New Jobseeker Support Clients
JS is the most significant entry point into the benefit system representing 2.31
approximately 75% of new main benefit clients.
The following charts show quarter-by-quarter comparisons against the previous year 2.32
and projections from the valuation. Over the 2014/15 year there were 88,662 new JS
clients. This was 3,265 less than projected by the valuation and 49 more than the
previous year. The 2016/17 peak in the projections reflects a higher unemployment
rate forecast by the Treasury (HYEFU 2015).
The following chart shows the yearly average number of non-transfer benefit grants to 2.33
new JS-WR clients split by the time since they were last on benefit, based on official
beneficiary counts rather than valuation methodology. The unemployment rate is
included for reference.
10,000
12,000
14,000
16,000
18,000
20,000
Q1
14/
15
Q2
14/
15
Q3
14/
15
Q4
14/
15
Q1
15/
16
Q2
15/
16
Q3
15/
16
Q4
15/
16
Q1
16/
17
Q2
16/
17
Q3
16/
17
Q4
16/
17
New clients - JS-WR
Actual Projected 2014 Projected 2015
5,000
5,500
6,000
6,500
7,000
7,500Q
1 1
4/1
5
Q2
14/
15
Q3
14/
15
Q4
14/
15
Q1
15/
16
Q2
15/
16
Q3
15/
16
Q4
15/
16
Q1
16/
17
Q2
16/
17
Q3
16/
17
Q4
16/
17
New clients - JS-HCD
Actual Projected 2014 Projected 2015
Benefit System Performance Report for the year ended 30 June 2015 Page 19
Chart shows 12 month rolling averages
The chart highlights how during the last economic recession (GFC – 2008/2009) 2.34
people having no prior benefit history or who had not been on benefit for at least
three years came onto benefit at significantly increased rates. As economic conditions
began to stabilise, grants to this group of people fell significantly. By late 2012, where
the unemployment rate was still close to 7%, the number of grants to this group had
fallen to near pre-GFC levels.
On the other hand, the number of grants to JS-WR clients who had been on benefit at 2.35
some time in the year prior remains high. Sustainability of employment outcomes is a
key determinant of liability.
By the time the unemployment rate started to decrease, most people who had come 2.36
into the benefit system for the first time had already done so. Hence, grants
decreased significantly after this point. Grants to regular users of the benefit system
took much longer to decrease despite improved labour market conditions.
The following chart shows the number of non-transfer benefit grants to new JS-HCD 2.37
clients.
Chart shows 12 month rolling averages
0%
1%
2%
3%
4%
5%
6%
7%
8%
0
1,000
2,000
3,000
4,000
5,000
6,000
De
c-0
5
Jun
-06
De
c-0
6
Jun
-07
De
c-0
7
Jun
-08
De
c-0
8
Jun
-09
De
c-0
9
Jun
-10
De
c-1
0
Jun
-11
De
c-1
1
Jun
-12
De
c-1
2
Jun
-13
De
c-1
3
Jun
-14
De
c-1
4
Jun
-15
JS-WR Non-Transfer Grants by Time off Benefit
0-1 years 1-3 years
>3 years or never previously on benefit Unemployment Rate (RHS)
0%
1%
2%
3%
4%
5%
6%
7%
8%
0
500
1,000
1,500
2,000
De
c-0
5
Jun
-06
De
c-0
6
Jun
-07
De
c-0
7
Jun
-08
De
c-0
8
Jun
-09
De
c-0
9
Jun
-10
De
c-1
0
Jun
-11
De
c-1
1
Jun
-12
De
c-1
2
Jun
-13
De
c-1
3
Jun
-14
De
c-1
4
Jun
-15
JS-HCD Non-Transfer Grants by Time off Benefit
0-1 years 1-3 years
>3 years or never previously on benefit Unemployment Rate (RHS)

Page 20 Benefit System Performance Report for the year ended 30 June 2015
JS-HCD grants were influenced much less by economic conditions. Grants were 2.38
increasing before the GFC, but have since fallen to below pre-GFC levels, before
stabilising in the year to June 2015.
Conclusion – The level of new JS clients over the year was broadly in line with
expectations given labour market conditions. However, the number of grants to JS-WR
clients who had been on a benefit within the last year has remained high. This is
discussed more in Gateway 2.
Gateway 2 – Exits from Jobseeker Support
There were 86,966 exits from JS (excluding transfers to another benefit) over the 2.39
2014/15 year. Quarterly exit rates for JS-WR ranged from 14.5% to 19.6% and were
higher than projected for three out of the four quarters. Quarterly exit rates for JS-
HCD ranged from 6.6% to 8.0%, broadly in line with projections.
Projected JS-WR and JS-HCD exit rates for 2015/16 and 2016/17 are at similar levels 2.40
to 2014/15, including seasonal peaks and troughs.
The following chart shows monthly exit rates over a longer time frame. 2.41
10%
12%
14%
16%
18%
20%
Q1
14/
15
Q2
14/
15
Q3
14/
15
Q4
14/
15
Q1
15/
16
Q2
15/
16
Q3
15/
16
Q4
15/
16
Q1
16/
17
Q2
16/
17
Q3
16/
17
Q4
16/
17
Quarterly Exit Rates - JS-WR
Actual Projected 2014 Projected 2015
5%
6%
7%
8%
9%
Q1
14/
15
Q2
14/
15
Q3
14/
15
Q4
14/
15
Q1
15/
16
Q2
15/
16
Q3
15/
16
Q4
15/
16
Q1
16/
17
Q2
16/
17
Q3
16/
17
Q4
16/
17
Quarterly Exit Rates - JS-HCD
Actual Projected 2014 Projected 2015
8%
9%
10%
11%
12%
13%
20
03
/04
20
04
/05
20
05
/06
20
06
/07
20
07
/08
20
08
/09
20
09
/10
20
10
/11
20
11
/12
20
12
/13
20
13
/14
20
14
/15
Average Monthly Exit Rates - Jobseeker
JS-WR
JS-HCD

Benefit System Performance Report for the year ended 30 June 2015 Page 21
The JS-WR exit rate has been consistent over the last four years at about 12.2% per 2.42
month. This is greater than the GFC low of 10.9% in 2009/10.
All else being equal, a sustained 1% increase in monthly JS-WR exit rates, which is 2.43
within the bounds of historical variability, would reduce the BPS 1 target group by
approximately 8,000 to 12,000 and increase the actuarial release by about $1.0bn to
$1.5bn by June 2018.
The JS-HCD exit rate decreased from 9.8% in 2013/14 to 9.3% in 2014/15. While this 2.44
is not a significant decrease, it is notable that JS-HCD exit rates are lower than pre-
GFC highs. Whilst the economic conditions at the time no doubt contributed to this, it
does show that under the right conditions JS-HCD clients are able to obtain
employment at a greater rate than is currently the case.
Sustainability of Jobseeker Exits
As shown in the graphs in paragraphs 2.33 and 2.37, a large number of benefit grants 2.45
are to former clients returning to the benefit system. In fact, of all JS-WR benefit
grants in the year to 30 June 2015, 47% were to clients who had received a main
benefit in the year prior to being granted a new benefit.
Sustainability of exits is a key determinant of long-term benefit dependency and hence 2.46
the liability. The longer a person remains independent of benefits, the lower the
likelihood they have of returning to the benefit system.
An existing trial is providing targeted in-work support and incentive payments to JS 2.47
clients who have moved into employment. The intent is to improve the sustainability
of employment (see paragraphs 5.30 to 5.33).
The table below paragraph 2.28 showed that more clients than forecast who exited a 2.48
benefit in 2013/14 remained off through 2014/15. However, as discussed later in
paragraph 3.10, assumption changes associated with re-entry rates of recent exits
have increased the liability by $0.5bn, indicating that performance has been worse in
high liability segments.
The following charts, different to the analysis in the table below paragraph 2.28, show 2.49
the proportion of people who remain independent of main benefits after exiting JS-WR
and JS-HCD. Each line represents a different year of data so that the year-on-year
change in exit sustainability can be tracked.

Page 22 Benefit System Performance Report for the year ended 30 June 2015
The sustainability of exits is influenced by the characteristics of the people exiting 2.50
benefits, the types of jobs they go to, and labour market conditions in general. This
means that comparing rates over time is not straightforward. However, the charts
suggest that sustainability rates have marginally decreased up to twelve months since
30%
40%
50%
60%
70%
80%
90%
100%
0 2 4 6 8 10 12 14 16 18 20 22 24 26 28 30 32 34 36 38 40 42 44 46 48 50 52 54 56 58
% o
f Ex
its
Still
Off
Mai
n B
en
efi
t
Months Since Exit
Sustainability of Exit - JS-WR
2010 2011 2012 2013 2014
The proportion of former JS-WR clients still off main benefits after 12 months has decreased by 4% since 2012 (black line compared to green line)
The proportion remaining off for two years or more has increased marginally (green line compared to blue line)
30%
40%
50%
60%
70%
80%
90%
100%
0 2 4 6 8 10 12 14 16 18 20 22 24 26 28 30 32 34 36 38 40 42 44 46 48 50 52 54 56 58
% o
f Ex
its
Still
Off
Mai
n B
en
efi
t
Months Since Exit
Sustainability of Exit - JS-HCD
2010 2011 2012 2013 2014
The proportion of former JS-HCD clients still off benefits for up to 24 months has decreased in the last year (black line and second half of the purple line)
The proportion remaining off for two or more years has increased (green line compared to red and blue lines)s

Benefit System Performance Report for the year ended 30 June 2015 Page 23
exit and marginally improved for longer periods since exit. This was reflected in
changes to valuation re-entry rate assumptions (see paragraph 3.10). Overall though,
we see little evidence to suggest that the sustainability of JS exits has materially
improved in recent years, despite generally improving economic conditions.
For context, we estimate that a lasting 5% improvement in the sustainability of JS-WR 2.51
exits would by June 2018 reduce the BPS 1 target group by approximately 10,000 to
12,500 and increase the actuarial release by about $1.2bn to $1.6bn.
Conclusion – JS-WR exit rates have been higher than projected for three out of the
four quarters. However, improving the sustainability of such exits is an important
factor in reducing long-term benefit dependency. More work could be done to better
understand the risk factors associated with an increased likelihood of returning to
benefit. Prioritising the actuarial release target (see recommendation 1) is better
aligned to supporting a focus on sustainability of employment outcomes.
Gateway 3 – Exits from Sole Parent Support
The number of people receiving SPS decreased from 82,840 to 77,299 over the 2.52
2014/15 year, principally as a result of high rates of exit. This includes clients who no
longer receive SPS, but receive some form of supplementary assistance.
The following charts show that the rate at which SPS clients are exiting main benefits 2.53
is above projections from the 2014 valuation. Projections for 2015/16 and 2016/17
are for exit rates to moderate. This is because the clients that remain on benefit are
likely to have more significant barriers to employment than those that have already
exited. Therefore, the fact that exit rates have remained high throughout the 2014/15
is a very positive result.
Furthermore, as client numbers decrease there is also an increase in the proportion of 2.54
SPS clients receiving other benefits, which can act as a disincentive to move into
employment (e.g. about 40% of SPS clients receive Temporary Additional Support
(TAS), Special Benefit (SPB) or Income Related Rent Subsidy (IRRS)). This is
discussed further in chapter four.
2.5%
3.0%
3.5%
4.0%
4.5%
Q1
14/
15
Q2
14/
15
Q3
14/
15
Q4
14/
15
Q1
15/
16
Q2
15/
16
Q3
15/
16
Q4
15/
16
Q1
16/
17
Q2
16/
17
Q3
16/
17
Q4
16/
17
Quarterly Exit Rates - SPS
Actual Projected 2014 Projected 2015
1.0%
1.5%
2.0%
2.5%
3.0%
Q1
14/
15
Q2
14/
15
Q3
14/
15
Q4
14/
15
Q1
15/
16
Q2
15/
16
Q3
15/
16
Q4
15/
16
Q1
16/
17
Q2
16/
17
Q3
16/
17
Q4
16/
17
Quarterly Transition Rate from SPS to SUP Only
Actual Projected 2014 Projected 2015

Page 24 Benefit System Performance Report for the year ended 30 June 2015
A sustained 0.5% increase in SPS exit rates, which is within the bounds of historical 2.55
variability, would reduce the BPS 1 target group by approximately 6,500 to 8,000 and
increase the actuarial release by about $1.3bn to $1.6bn.
From April 2016, SPS clients whose youngest child is aged three or four will be subject 2.56
to the same part-time work obligations as SPS clients with youngest child aged five or
older. The part-time work obligations are also increasing from 15 to 20 hours per
week.
SPS clients with youngest child aged three or four have already been exiting at a 2.57
higher rate than pre-welfare reform. Also, given the age of the youngest child, there
are potentially additional barriers to employment (like childcare costs). It is therefore
likely that exit rates for this cohort will not increase as much as rates for SPS clients
whose youngest child is aged five or older did after welfare reform phase II and the
introduction of WFCM. This is discussed further in our analysis on the Budget 2015
Child Material Hardship Package in chapter four.
Sustainability of Sole Parent Support Exits
As with JS clients, it is important to focus on the sustainability of exits and not just the 2.58
number of exits. The following chart shows the proportion of people who have
returned to a main benefit after previously exiting SPS.
The sustainability of exits up to twelve months off benefit is down slightly in 2014/15 2.59
compared to the prior three years.
For context, we estimate a lasting 5% improvement in exit sustainability would by 2.60
June 2018 reduce the BPS 1 target group by approximately 4,000 to 5,500 and
increase the actuarial release by about $0.8bn to $1.1bn.
30%
40%
50%
60%
70%
80%
90%
100%
0 2 4 6 8 10 12 14 16 18 20 22 24 26 28 30 32 34 36 38 40 42 44 46 48 50 52 54 56 58
% o
f Ex
its
Still
Off
Mai
nB
en
efi
t
Months Since Exit
Sustainability of Exit - SPS
2010 2011 2012 2013 2014
Long-term sustainability has improved year on year (comparing the purple, green, red and blue lines from 12 months onwards)
Short-term sustainability (0-12 months) for the most recent year of observation (black line) was down by 2-3% on the prior three years

Benefit System Performance Report for the year ended 30 June 2015 Page 25
Conclusion – SPS continues to be a key area of success. The combination of policy
changes through welfare reform and investment in WFCM has had a significant and
sustained impact on encouraging and supporting clients into work. Forecasts suggest
the number of people on SPS will continue to decrease in the short term. There may
still be further opportunities to improve outcomes for this group, given that 40% of
SPS clients receive TAS or IRRS (see chapter four). Similar to JS, more work could be
done to understand risk factors associated with increased likelihood of re-entry to
benefit.
Gateway 4 – Transition of Youth to Working-Age Benefits
People receiving YP or YPP represent less than 1% of the liability. However, nearly 2.61
75% of the liability relates to clients who first came onto benefit during their teenage
years, reflecting their high likelihood of long-term benefit dependency. This highlights
the importance of the youth benefit categories and particularly the rate at which
YP/YPP clients transition onto working-age benefits.
In August 2012, the Youth Service was introduced to improve future outcomes for 2.62
youth clients and teenagers not in education, employment or training (NEET). The aim
is to help young people build an independent future and reduce their risk of
transitioning to working-age benefits after age 18, through achievement of a
qualification of NCEA Level 2 or higher and development of life skills.
The following charts show former clients’ status a year after they became eligible for 2.63
working-age benefits. Each vertical bar represents the cohort of YP clients who turned
17 (first chart) or YPP clients who turned 18 (second chart) in each quarter. The colour
coding of the vertical bars represents the benefit these clients were receiving two
years later. In both charts the yellow bars representing ‘not on benefit’ have grown
i.e. fewer YP/YPP clients are transitioning to working age benefits.
Source: Valuation of the Benefit System for Working-age Adults as at 30 June 2015
Youth Service outcomes were evaluated in March 2015. Findings include: 2.64
9% higher NCEA 1 and 11% higher NCEA 2 achievement for YP participants than
the comparison group over a two-year follow-up period.
0%
20%
40%
60%
80%
100%
Quarter of 17 year old IYB/YP snapshot
JS SPS/Other Not on benefits
Fully affected by youth service
0%
20%
40%
60%
80%
100%
Quarter of 18 year old DPB/YPP snapshot
SPS JS/Other Not on benefits
Fully affected by youth service
Youth Program Payt Young Parent Payt

Page 26 Benefit System Performance Report for the year ended 30 June 2015
No difference in educational achievement of YPP and NEET participants versus the
comparison group.
YP participants spent 33 more days receiving a main benefit then their
comparison group over a two-year follow-up period. This is partly because the
Youth Service allows YP participants to continue in the service until the end of the
calendar year they turn 18, and partly because clients spend more time on
benefit in the short term as they participate in education and training assistance.
There was no difference in the time YPP participants spend on a main benefit
compared to their comparison group.
Overall, whilst there is insufficient data to make firm conclusions, the service appears 2.65
to be working, with a reduction of transitions to main benefits. It will be important to
continue tracking the rate at which Youth Service clients transition to working-age
benefits, and their rate of re-entry into the benefit system should they exit.
To supplement future quantitative analysis, qualitative research may be a useful tool 2.66
to develop a richer understanding of the impact of the Youth Service on clients’ lives.
Conclusion – Although it is not possible to make firm conclusions about the
performance of the Youth Service, fewer YP/YPP clients have transitioned to main
benefits than projected. Given the small numbers involved, qualitative evaluation
techniques are important to understand what is working and potential improvements
in this area.
Gateway 5 – Transition of JS-WR Clients to JS-HCD
The transition of JS clients from WR to HCD status represents a movement to a client 2.67
segment with higher risk of long-term benefit dependence. JS-HCD clients have a
lower rate of benefit exit and higher rate of transition to SLP.
Over the 2014/15 year, 4% (246) more clients transitioned to JS-HCD than was 2.68
projected (see the following chart). Projections for 2015/16 and 2016/17 suggest a
slight declining trend as residual temporary impacts from the 2013 benefit restructure
diminish.
2.0%
2.5%
3.0%
3.5%
4.0%
Q114/15
Q214/15
Q314/15
Q414/15
Q115/16
Q215/16
Q315/16
Q415/16
Q116/17
Q216/17
Q316/17
Q416/17
Quarterly Transition Rates - JS-WR to JS-HCD
Actual Projected 2014 Projected 2015
Benefit System Performance Report for the year ended 30 June 2015 Page 27
The higher than projected rate in 2014/15 is partly attributable to the benefit 2.69
restructure in July 2013 (described in appendix B). The impacts of the restructure had
not had sufficient time to be represented as sustained changes in the 2014 valuation
assumptions. It is expected that future transition rates will be closer to the 2015
projections.
There were both temporary and permanent impacts resulting from the benefit 2.70
restructure. For example, the re-classification of widows and former Domestic
Purposes Benefit (DPB) clients (youngest child aged 14 or older) into JS has had a
mainly temporary impact on JS-WR to JS-HCD transition rates. It is likely that many
of these clients would have qualified for the Sickness Benefit (SB) before July 2013
but had no clear incentive to transfer at the time, but perhaps do now given JS-WR
work obligations.
The merging of two separate benefit categories, Unemployment Benefit (UB) and SB 2.71
into JS, appears to have permanently increased the rate of transition between JS-WR
and JS-HCD in both directions. While we cannot be certain of the reason, it seems
likely that it is partly due to a simplified administrative process.
The transition rates increased materially at the time of the benefit restructure. 2.72
Transition from JS-WR to JS-HCD appears to show some degree of reversion after an
initial peak, before broadly settling at a level significantly above the pre-benefit
restructure rates.
Transition from JS-HCD to JS-WR does not show any reversion to previous rates after 2.73
the initial increase. JS-HCD is materially similar to SB. Hence, clients have no greater
or lesser incentive to transition from JS-HCD to JS-WR than before the benefit
restructure (leaving just the permanent effect described in 2.71).
In broad terms, the higher transition rates from JS-WR to JS-HCD and from JS-HCD to 2.74
JS-WR net each other out, and so have no material impact on the valuation liability.
All else being equal, the higher transition rates should be expected to continue.
Conclusion – Transition rates from JS-WR to JS-HCD appear reasonable, despite
being higher than projections from the 2014 valuation. Assumptions have been
adjusted to reflect the expected future experience.
0.0%
0.5%
1.0%
1.5%
2.0%
2.5%
Jan-10 Jan-11 Jan-12 Jan-13 Jan-14 Jan-15
Monthly Transition Rates - JS-WR to/from JS-HCD
JS-WR to JS-HCD JS-HCD to JS-WR
Benefit Restructure

Page 28 Benefit System Performance Report for the year ended 30 June 2015
Gateway 6 – Transition to Supported Living Payment
As for gateway 5, gateway 6 is important because it represents a movement to a 2.75
higher average liability segment. Most SLP clients receive a benefit until they reach
retirement age.
The number of clients being granted SLP is relatively low compared with other benefit 2.76
categories. However, a small change can have a material impact on the liability if it is
sustained over a long period.
The chart above shows that the number of people who transitioned from other benefit 2.77
categories to SLP over the 2014/15 year is broadly in line with projections from the
2014 valuation and below the level for the year before. In that sense, transition rates
to SLP over the 2014/15 year have been relatively unremarkable. Projections for
2015/16 and 2016/17 suggest a slight declining trend.
Following phases II and III of welfare reform it was anticipated that an increased level 2.78
of transfers would be experienced in the short-term because greater work
expectations impacted some JS and SPS clients. In particular, SPS clients previously
had little incentive to transfer to the SLP equivalent benefit. In total, 48% of clients
who transitioned to SLP from other benefit categories over 2013/14 were receiving
Disability Allowance (DA) prior to the benefit structure changes in July 2013.
The following chart shows that transition rates from JS-WR to SLP increased from 2.79
early 2013, coinciding with the timing of welfare reform phase II. Following a peak in
June 2013, the rates have moderated to some degree, but still remain above pre-
welfare reform levels. Pre-welfare reform, sole parents whose youngest child was aged
14 or older did not have work obligations and so had little incentive to transfer to the
Invalids Benefit. All else being equal, we expect transition rates to remain above pre-
welfare reform levels.
1,500
1,700
1,900
2,100
2,300
2,500
2,700
2,900
Q114/15
Q214/15
Q314/15
Q414/15
Q115/16
Q215/16
Q315/16
Q415/16
Q116/17
Q216/17
Q316/17
Q416/17
Transfers to SLP
Actual Projected 2014 Projected 2015

Benefit System Performance Report for the year ended 30 June 2015 Page 29
The increase in transition rates from SPS to SLP started later than for JS-WR. This 2.80
mirrors our observations of SPS exit rates which increased slightly around welfare
reform phase II, but then increased significantly when the new service delivery model
was introduced in July 2013.
Actively managing these clients has resulted in some benefit reclassification toward 2.81
SLP. To the extent that these clients remain actively case managed, we expect the
transition rate from SPS to SLP to remain above pre-welfare reform levels. Both a
higher SPS exit rate and a higher transition rate from SPS to SLP are not unexpected
outcomes of active case management and work obligations.
The increasing transition rate from JS-HCD to SLP highlighted in the chart above is 2.82
more moderate than for JS-WR and SPS. However, it is harder to explain. SB had
broadly the same eligibility definition as JS-HCD and is not materially different in
terms of benefit design and work obligations. Hence, there is no obvious reason why
transition rates from JS-HCD to SLP have increased since welfare reform.
WFCM places for JS-HCD clients were increased by 12,000 in the second half of 2015. 2.83
Whilst this is designed to support clients into work, some transition to SLP may also
occur.
0.00%
0.05%
0.10%
0.15%
0.20%
0.25%
Jan-10 Jan-11 Jan-12 Jan-13 Jan-14 Jan-15
Monthly Transition Rates to SLP
JS-WR to SLP SPS to SLP
Welfare Reform Phase II
0.0%
0.2%
0.4%
0.6%
0.8%
1.0%
1.2%
Jan-10 Jan-11 Jan-12 Jan-13 Jan-14 Jan-15
Monthly Transition Rates - JS-HCD to SLP
Welfare Reform Phase II

Page 30 Benefit System Performance Report for the year ended 30 June 2015
Conclusion – Transition rates to SLP increased following welfare reform and changes
to the service delivery model in 2013. Increased transition rates from JS-WR and SPS
to SLP appear to be an outcome of these significant operational and policy changes. As
such, they seem reasonable when compared to pre-2013 rates, though ideally need to
be reduced to support progress towards BPS 1 targets. The increased transition rate
from JS-HCD to SLP is harder to explain and warrants further investigation.
Post 30 June 2015 Experience
As at 31 December 2015, the total number of working-age people receiving a main 2.84
benefit was 288,961, compared to the 220,000 BPS 1 target at June 2018. This is an
increase of 4,001 from 30 June 2015. The number of people receiving a main benefit
tends to be highest in December and January. 288,961 is 6,175 lower than at 31
December 2014.
The accumulated actuarial release for the period from 30 June 2014 to 31 December 2.85
2015 is +$2.6bn. This is an increase of $0.3bn since 30 June 2015.
Benefit trends between 30 June 2015 and 31 December 2015 are in line with 2.86
projections from the 2015 valuation. In particular, JS-WR, JS-HCD, SPS and SLP client
numbers are all within 1% of valuation projections at 31 December 2015.
Benefit System Performance Report for the year ended 30 June 2015 Page 31
3 Valuation Results: Life-time Liability
Summary
The liability has decreased by $0.6bn to $68.4bn over the year to 30 June 2015.
This includes a $2.2b decrease attributable to welfare reform, policy and
operational changes not reflected in the 2014 valuation.
Most of the $2.2bn reflects higher rates of exit from SPS.
The largest contribution to the $2.2bn by ethnicity in absolute and relative terms
was from Māori.
This valuation contains new analysis of the interaction between long-term benefit
dependency and a person’s CYF history and/or history of criminal convictions,
enhancing understanding of the drivers of long-term benefit receipt. CYF history
and a history of criminal convictions are both significant predictors of liability.
Across all benefit segments, 38% of 16-25 year old clients have some form of
CYF history. They have a $47k (or over 40%) higher average liability than clients
having no CYF history. Combined this means that clients having CYF history
represent 47% of the total liability for clients aged 16-25.
Across all benefit segments, 25% of clients have at least one criminal conviction.
They have a $37k (or 37%) higher average liability than clients without criminal
convictions. Combined this means that clients having criminal convictions
represent 32% of the total liability.
Summary of Approach and Valuation Assumptions
The performance of the benefit system as a whole is assessed via an annual valuation 3.1
of the benefit system. The 30 June 2015 liability assessment was undertaken by
Taylor Fry Consulting Actuaries (Taylor Fry). Their report, Valuation of the Benefit
System for Working-age Adults as at 30 June 2015, (the 2015 Valuation Report) was
prepared by Alan Greenfield FIAA, Dr Hugh Miller FIAA, Kari Wolanski MA Social
Development and Dr Gráinne McGuire FIAA.
The liability is calculated by forecasting expected future benefit payments up to age 65 3.2
for all people aged 16-64 who have received a benefit at any time in the 12 months
preceding the valuation date. These payments are then discounted back to the
valuation date using risk-free interest rates. Allowance is also made for future benefit
indexation, the projected cost of employment support and services, the costs to
administer the system, as well as loans and debts.
The liability calculation is derived from a number of models. The models make 3.3
assumptions about the probabilities of clients moving between benefit categories
(including into and out of the benefit system) in the future and the amounts of
associated benefit payments.

Page 32 Benefit System Performance Report for the year ended 30 June 2015
The assumptions aim to be ‘best estimate’ (i.e. they should not contain any deliberate 3.4
bias towards conservatism or optimism).
Economic assumptions including national and regional unemployment rates, inflation 3.5
and discount rates are all based on Treasury forecasts.
Rates of transition between benefit categories and in and out of the benefit system are 3.6
set with reference to observed experience. The general approach is to partially allow
for experience changes until there is sufficient evidence that the change is likely to be
sustained.
Transition rate assumptions depend on a number of risk factors, including: 3.7
Time-related variables – unemployment rate (at a national and regional level)
Client-related variables – age, gender, ethnicity, education level and region
Client history – Child, Youth and Family history, criminal convictions and whether
their parents received benefits during the client’s childhood
Benefit history – including the current and previous periods receiving a benefit
Family-related variables – age of youngest child and number of children
Health and disability-related variables – incapacity type for JS-HCD and SLP
More detail on the valuation approach and assumptions can be found in part C, 3.8
appendix B and appendix C of the 2015 Valuation Report.
Core Valuation Results
Overall the liability decreased marginally by $0.6bn from $69.0bn to $68.4bn over the 3.9
year to 30 June 2015. This relatively small decrease masks some important factors. In
particular, there was a $2.2bn decrease in liability reflecting better than projected
performance over the year (experience item). This is attributed to policy and
operational changes over recent years that have influenced benefit dynamics e.g.
welfare reform and the 2013 changes to the service delivery model. Given that
valuation assumptions were tightened for the 30 June 2014 valuation, this is a strong
result.
Included within the $2.2bn experience item is the impact of updating a number of 3.10
transition rate assumptions to reflect experience:
increasing exit and transfer rates from SPS – liability impact -$1.2bn.
increasing exit and transfer rates from JS-WR – liability impact -$0.5bn.
changing re-entry rates onto benefit for previous clients (increased for recent
exits, decreased for people out of the benefit system for one to five years) –
liability impact +$0.5bn.
Overall, changes to transition rate assumptions had a -$1.2bn impact on the liability.
The following factors also contributed to the overall $0.6bn decrease in liability: 3.11
A $2.4bn increase due to changes in economic assumptions. +$2.0bn of this was
due to lower discount and inflation rates and +$0.4bn was due to higher
unemployment rates.

Benefit System Performance Report for the year ended 30 June 2015 Page 33
An expected liability decrease over the year of $1.0bn based on experience
observed up to 30 June 2014. This expected change has been adjusted to allow
for the actual unemployment rate over the year to June 2015.
A $0.1bn increase due to methodology changes unrelated to experience or
performance
The cumulative liability impact over the last four years attributed to policy and 3.12
operational changes (including the $2.2bn) is estimated to be -$12.0bn.
The actuarial release for the year was $2.3bn. The following table reconciles the 3.13
valuation experience item with the actuarial release (also explained in paragraph
2.20):
Valuation Experience Item - 30 June 2014 to 30 June 2015 $2.2bn
2015 Valuation assumption changes – economic -$0.1bn
2015 Valuation assumption changes – transition Rates -$1.2bn
Difference between 295,000 clients and valuation forecast at 30
June 2015 +$1.5bn
Impact of changes in labour market conditions $0.0bn
Other -$0.1bn
Actuarial Release - 30 June 2014 to 30 June 2015 $2.3bn
The following chart breaks the $2.2bn down by benefit segment. SPS clients 3.14
contributed the most as a result of sustained high exit rates. However, all benefit
segments contributed to some degree.

Page 34 Benefit System Performance Report for the year ended 30 June 2015
Source: Valuation of the Benefit System for Working-age Adults as at 30 June 2015
The following chart breaks the $2.2bn down by ethnicity and benefit type. 3.15
The largest contribution to the -$2.2bn was from Māori. Māori make up a significant 3.16
proportion of the benefit population (40%) and a higher proportion of Māori liability
relates to SPS and JS-WR clients, where the largest gains have been made. However,
-600 -500 -400 -300 -200 -100 0 100
WR<1
WR>1
HCD<1
HCD>1
Ch 0-2
Ch 3-4
Ch 5-13 <1
Ch 5-13 >1
Carer
Partner
HCD
YP
YPP
SUP<1
SUP>1
OB
Recent exits
Job
see
kers
So
le p
aren
tsSL
PYo
uth
No
n-b
enJJ
OO
Change on expected liability from Roll-forward ($m)
Higher exits from JS-WR, fewer subsequent re‐entries as well as lower
future SPS receipt
SPS exit rates once youngest child is aged 5 or more remain high post-
reform
Limited change
Slightly faster exits than expected
Recognising lower re-entryrates, although partly offset by longer time on
Supp only benefits
Joins
Other
-6%
-6%
-4%
0%
-5%
-8%
-10%
-9%
-2%
0%
-1%
-4%
-4%
-3%
-5%
-1%
-4%
-1%
-$1,000 -$800 -$600 -$400 -$200 $0
Other
Pacific People
NZ European
Māori
Asian
Break Down of -$2.2bn by Ethnicity ($m)
JS
SPS
SLP
YP/YPP
NOMB

Benefit System Performance Report for the year ended 30 June 2015 Page 35
even after taking compositional differences into consideration, Māori make up more of
the -$2.2bn than other ethnicities in relative terms.
This breakdown of the -$2.2bn by ethnicity paints a different picture to the chart in 3.17
paragraph 2.14 which showed that Māori client numbers remain significantly above
pre-GFC levels. This demonstrates that gains in reducing long-term benefit
dependency can be made without total client numbers decreasing materially in the
short term by focusing on the drivers of long term dependency.
The chart below shows that over 80% of the -$2.2bn relates to female clients. This is 3.18
similar to last year, and not surprising given that welfare reform and the 2013 service
delivery model changes were focused on SPS clients. The JS component of the female
bar partly reflects reduced likelihood and length of potential future spells on SPS.
Child, Youth and Family and Department of Corrections
This was the first valuation where CYF and Department of Corrections (Corrections) 3.19
data have been used to inform the valuation model. By merging these datasets with
Work and Income data, the interaction between benefit system liability and a person’s
CYF history and/or history of criminal convictions has been quantified. This does not
involve valuing CYF and/or Corrections related costs.
The results, while not surprising, are significant in both statistical and practical terms. 3.20
Clients with CYF history and/or a history of criminal convictions are significantly over-
represented in the benefit system, and once in the system have much higher average
liabilities than other clients.
CYF has legal powers to intervene to protect and help children who are being abused 3.21
or neglected or who have behavioural problems. CYF works with the Police and the
Courts when dealing with young offenders under the youth justice system, and
provides residential and care services for children in need of care and protection.
Services are broadly split into ‘Care and Protection’ (CYF-CP) and ‘Youth Justice’ (CYF-
YJ).
CYF data goes back far enough for us to consider current clients up to age 25. The 3.22
-$2,000 -$1,500 -$1,000 -$500 $0
Male
Female
Break Down of -$2.2bn by Gender ($m)
JS
SPS
SLP
YP/YPP
NOMB

Page 36 Benefit System Performance Report for the year ended 30 June 2015
scale of the results is likely to be indicative for most age bands over 25. The key
points are:
38% of clients aged 16-25 have some CYF history. 30% have had previous
interaction with Care and Protection services and 10% with Youth Justice, and
2% have had contact with both. For context, of all children born between 1 July
1993 and 30 June 1994, about 20% have had previous interaction with Care and
Protection services.
Across all benefit segments, clients with CYF history have a $47k (or over 40%)
higher average liability than clients without history. The liability difference is
more pronounced the more CYF events (reports of concern, investigations,
assessments and/or placement in care) a person has had, and when their first
event occurred in the first three years of life (albeit these factors are positively
correlated).
The combination of over-representation and higher average liabilities means that
clients with CYF history represent 47% of the total liability for clients aged 16-25.
Amongst other things, these results highlight that some significant predictors of long-3.23
term benefit dependency manifest themselves many years before a person becomes
eligible for benefits. The analysis strongly suggests that poor outcomes in early
childhood (characterised by interaction with CYF) significantly increases the risk of
poor outcomes in adulthood (characterised by interaction with the benefit system).
Corrections data goes back far enough for us to consider criminal convictions of all 3.24
benefit system clients up to age 65. Note that most criminal convictions result in
community based sentencing rather than prison sentencing. As for CYF, the results are
significant:
Approximately a quarter of the benefit population have criminal convictions.
About two-thirds of these relate to sentencing in the last ten years. Clients with
criminal convictions are heavily skewed to younger males receiving JS.
Across all benefit segments, clients having criminal convictions have a $37k (or
37%) higher average liability than clients without criminal convictions.
Over-representation and higher average liabilities combined, mean that clients
having criminal convictions represent a third of the total benefit system liability.
Regardless of age, gender, ethnicity or education level, average liability is higher for 3.25
clients having criminal convictions. This is unsurprising, given that having a criminal
conviction may inhibit employment prospects.
The connection between the benefit and corrections systems is two-way. Existing and 3.26
former benefit system clients are over-represented in the corrections system.
Approximately half of those entering prison receive a main benefit immediately prior.
MSD and Corrections are working together to run a trial focused on prisoners. The trial 3.27
will target people who churn in and out of the benefit and corrections systems with a
view to improving their employment prospects and reducing recidivism and the
likelihood of long-term benefit dependency.
Benefit System Performance Report for the year ended 30 June 2015 Page 37
Intergenerational dependency
The valuation also considers family benefit history. Data only allows us to consider this 3.28
for current clients aged up to 25. As for CYF, the scale of the results is likely to be
indicative for age bands over age 25:
Children of benefit system clients are significantly more likely to become clients
themselves. Looking at a group of children of beneficiaries born in 1993/94 and
1994/95 (83,000 children), 47% had entered the benefit system themselves by
age 23.
About three quarters of clients had a parent who received benefits during their
childhood. For YP/YPP clients the proportion is closer to 90%. Over a third of
clients had a parent who was on benefit for more than 80% of their teenage
years.
Children of benefit system clients who come on to benefits themselves have a
significantly higher average liability. For those clients who had a parent on benefit
for more than 80% of their teenage years, their average liability is $63k (or
80%) higher than those whose parents did not receive any main benefits.
Clients who had a parent who received benefits during their childhood represent
83% of the total liability for under-25’s.
It is important to note that many of the variables we consider as predictors of long-3.29
term benefit dependency are correlated. In particular, poor outcomes such as low
educational attainment and high prevalence of certain health conditions tend to be
positively correlated. For example, a client who had a parent who received benefits
during their childhood is 60% more likely to have CYF history.
These relationships partly explain why Māori have higher average liabilities than other 3.30
ethnicities. Māori clients are 30% more likely to have a CYF (Care and Protection)
history, 40% more likely to have a youth justice or corrections history and 40% more
likely to have had a parent who received benefits during their childhood.
As a consequence, materially improving social outcomes of the most vulnerable 3.31
members of society, as well as their current or future children, requires a cohesive,
citizen-centric social sector approach.
Social Housing Valuation
An actuarial valuation of the social housing system is under development. 3.32
The goals of the social housing valuation are: 3.33
to promote pathways to independence and management of lifetime housing costs
to inform MSD purchasing intentions (forecast demand)
to support effective housing register management
The social housing valuation will be integrated with the benefit system valuation. This 3.34
will provide a more detailed understanding of people’s pathways through both
systems, and importantly an understanding of how household dynamics impact on
social housing and benefit dependency.
Page 38 Benefit System Performance Report for the year ended 30 June 2015
By understanding risk factors and expected pathways in, through and out of both 3.35
systems we will be able to help clients in a more holistic manner.
Conclusions
The performance of the benefit system overall remains strong as measured by the 3.36
$2.2bn reduction in liability attributable to policy and operational changes. The
reduction in liability has been most profound for SPS.
A person’s likelihood of long-term benefit dependency is significantly impacted by their 3.37
family environment during childhood. Protecting vulnerable children and improving
their childhood experience is expected to improve their long-term outcomes including
reducing their likelihood of long-term benefit dependency. While the valuation focuses
on the benefit system, it is almost certain that a child’s family environment also
significantly impacts their long-term health outcomes, educational attainment and
likelihood of committing and being a victim of crime.
There are limits to our ability to materially influence people’s likelihood of long-term 3.38
benefit dependency once they are already in the benefit system. Prevention is likely to
be a more effective long-term investment strategy. Childhood and intergenerational
risk factors demonstrate that reducing people’s risk of poor outcomes in adulthood
requires long-term thinking with a focus on childhood experience and vulnerable
families. We expect that recent years’ success in supporting sole parents into
employment will reduce the likelihood of their children becoming dependent on
benefits.
The results presented in this chapter demonstrate the impact of some intuitive 3.39
childhood risk factors. Work to refine our understanding of these risk factors is
warranted and would help management and government to consider:
(i) How to support existing clients having these risk factors
(ii) How to reduce the likelihood of children having these risk factors experiencing
poor outcomes in the future
(iii) How to reduce the prevalence of these risk factors among children
While (i) cannot be ignored, our view is that focusing on (ii) and (iii) with a citizen 3.40
centric cross-agency Investment Approach will have the greatest impact on societal
well-being in the long-term.
Benefit System Performance Report for the year ended 30 June 2015 Page 39
4 Future Focus – Risk and Opportunities
Summary
Labour market conditions have a significant effect on the benefit system. For
example, a significant recession involving an unemployment rate peak of 12%
could add over 100,000 main benefit clients and $10bn to the valuation liability.
Most of this liability increase would dissipate as the economy recovers, though
we estimate a $1bn-$1.5bn lasting effect on clients, many of whom wouldn’t
otherwise enter the benefit system.
Since 2000 the number of JS-HCD and SLP clients suffering from mental illness
has increased by approximately 31,000 (to about 60,000). This is equivalent to
about $5.5bn in liability. More connectivity is needed between health treatment
providers and Work and Income.
The current design of Income Related Rent Subsidy (IRRS), Accommodation
Supplement (AS) and Temporary Additional Support (TAS) has some financial
disincentives for clients to move into employment. This impacts about 100,000
people in the BPS target group. We recommend a review of the design of these
benefits to ensure that incentives are aligned to objectives.
The potential liability impact of projected population and demographic changes
by the BPS target date of 30 June 2018 is +$2.3bn (cf. $13bn actuarial release
target).
The Child Material Hardship Package will add $1.0bn to $1.5bn to the valuation
liability, though the impact on the actuarial release will be relatively minor.
Introduction
This chapter reviews potential risks and opportunities in coming years that could 4.1
significantly impact the benefit system. Some may evolve over an extended period of
time and shape the benefit system in the long term.
We have categorised risks and opportunities into the areas that influence the number 4.2
of people needing support from the benefit system, as well as their degree of long-
term benefit dependency. These are:
the economy
health trends
core factors including work incentives in the benefit system
population and demographic factors (including birth rates)
known upcoming policy changes
To the extent that these factors can be predicted, they act as lead indicators of risks 4.3
to the benefit system.

Page 40 Benefit System Performance Report for the year ended 30 June 2015
The Economy
The state of the economy and its impact on labour market conditions has a significant 4.4
bearing on the benefit system. For example, the number of people receiving a main
benefit increased by nearly 83,000 between May 2008 and September 2010 as the
GFC led the New Zealand economy into recession. The potential for another significant
recession represents the single greatest risk to the benefit system, given the impact it
would have and the relatively short time-frame it could materialise over.
To demonstrate the impact that labour market conditions have on the benefit system, 4.5
the following chart outlines the potential liability impact of a significant recession. It is
indicative only, with the exact liability impact dependent on how a recessionary
scenario plays out and the impact this has on the economic variables that influence
the valuation liability. Unemployment assumptions aside, we have maintained the
same economic assumptions as the 2014 valuation to allow for an objective
comparison.
This significant recession scenario assumes that the unemployment rate increases 4.6
sharply to a high of 12% at June 2016 (the unemployment rate exceeded 11% in the
early 1990’s) before reducing to 11% at June 2017, 9% at June 2018 and 7% at June
2019. This would result in a large number of new clients entering the system, while
existing clients would find it much harder to find employment and exit the system. By
comparison the 2014 valuation baseline assumes an unemployment rate of 5.4% at
June 2016 falling gradually to 4.6% by June 2019.
The impact on client numbers would be substantial, with well over 100,000 more 4.7
clients in the benefit system. However, the impact on liability ($10bn at June 2016)
would not be as significant, as most of the increase would be JS-WR clients where
average liability is relatively low. Also, a significant proportion of clients would be
either completely new to the benefit system or would have relatively little previous
benefit history, and so most would be expected to find employment relatively quickly
once the economy recovers.
64
66
68
70
72
74
76
78
80
2015 2016 2017 2018 2019
$ B
illio
ns
Significant Recession - Liability Impact
Significant Recession
2014 Valuation Baseline

Benefit System Performance Report for the year ended 30 June 2015 Page 41
By 2019, there is still a difference to the baseline scenario of $4.5bn. This is 4.8
predominantly due to the difference in the assumed unemployment rate at this point.
It is also because there is likely to be a residual impact of about $1bn-$1.5bn resulting
from a lasting effect on the liability. This mainly relates to clients who wouldn’t
otherwise have entered the benefit system. This effect was observed after the GFC. Of
clients entering the benefit system for the first time in 2008/2009, 4,200 were
continuously on benefit to June 2013 at least, with a total liability of $0.8bn.
Health Trends
A significant proportion of clients are unable to work due to health reasons. As at 30 4.9
June 2015, 148,776 clients were receiving JS-HCD or SLP. This is 52% of all main
benefit clients. Further, 110,560 clients were receiving DA and 34,307 were receiving
Child Disability Allowance.
Mental Illness
The following chart shows how JS-HCD/SLP client numbers have grown over the last 4.10
two decades. Since 2000, the number of JS-HCD and SLP clients with a reported
mental illness has increased by approximately 31,000 to about 60,000. This is
equivalent to about $5.5bn in liability. Growth in clients suffering from mental illness
accounts for 97% of the overall increase in JS-HCD/SLP client numbers over the last
10 years. This predominantly occurred between 2005 and 2010, with numbers leveling
since.
With no agreed understanding of why mental illness is increasing it is hard to predict 4.11
whether it will rise further. However, there is a clear risk that it will, with a resulting
impact on long-term benefit dependency.
The increase in clients suffering from mental illness has a material impact on the 4.12
valuation liability, particularly given their high average liability ($176k vs. $145k for
other JS-HCD and SLP clients). Mental illness presents particular challenges because:
-
20,000
40,000
60,000
80,000
100,000
120,000
140,000
160,000
180,000
200,000
19
97
19
98
19
99
20
00
20
01
20
02
20
03
20
04
20
05
20
06
20
07
20
08
20
09
20
10
20
11
20
12
20
13
20
14
20
15
JS-HCD and SLP clients by Primary Incapacity Type
Other
Sensory
Respiratory
Psych
Nervous Sys
Musc-skel
Metabolic
Intl hndcp
Congenital
Cardio
Cancer
Accident

Page 42 Benefit System Performance Report for the year ended 30 June 2015
It covers a broad spectrum of health conditions including psychotic disorders such
as bi-polar and schizophrenia and non-psychotic disorders such as anxiety and
depression. Severity of conditions and treatment needs vary widely.
A person’s mental illness symptoms and capacity to work can vary over time.
This impacts a person’s ability to find and sustain employment.
For some people, being out of work can trigger or exacerbate mental illness
symptoms.
The complexity of mental illness creates potential imprecision in diagnosis for the
purposes of a medical certificate supporting a benefit application.
Primary health support responsibilities reside with mental health services
operating through district health boards. Control of clients’ health management
therefore sits mainly outside Work and Income’s control. Equally, control of
employment assistance sits outside of mental health services’ control.
Recommendation 2
We recommend that management explore opportunities to work more closely with health
providers to ensure that clients suffering from mental illness are receiving appropriate care
and support. The viability of MSD directly purchasing mental health services for clients
should also be explored.
Management should consider the introduction of specialised resources or further
contracting-out of services to best manage the specific needs of client groups such as those
suffering from mental illness.
Financial Incentives from Accommodation Related Benefits
We have investigated areas of the benefit system that may provide material dis-4.13
incentives to return to work. These include:
Temporary Additional Support (TAS) and its predecessor Special Benefit (SPB)
Income Related Rent Subsidy (IRRS) paid on behalf of social housing tenants and
its relationship to Accommodation Supplement (AS) and TAS
TAS and AS represent the welfare system’s private housing support package and IRRS 4.14
is the social housing package. Of the BPS 1 client group, there are about 54,000
clients receiving TAS and about 45,000 benefiting from IRRS, with very little overlap
between the two. The rate at which these clients exit the benefit system is
significantly less than that of similar clients who don’t receive TAS or IRRS.
Disincentives to move into employment may be contributing to this. Based on recent
experience, this component of the BPS 1 group is unlikely to materially reduce in
number by 30 June 2018 or beyond.
Temporary Additional Support
Introduced in April 2006, TAS was designed as a non-taxable benefit to be paid for a 4.15
maximum of 13 weeks and intended to be a last resort to help clients with regular

Benefit System Performance Report for the year ended 30 June 2015 Page 43
essential living costs that cannot be met from their income and other resources. In
practice, it is mainly used to meet accommodation costs, particularly rent. Clients can
re-apply for TAS if they still need help beyond the maximum 13-week period.
SPB is a non-taxable benefit intended to provide assistance to clients whose 4.16
circumstances are causing them hardship. It was grand-parented with the introduction
of TAS in April 2006. Despite the intended purpose of TAS and SPB, many clients
receive TAS or SPB for prolonged periods of time. Clients receiving TAS at 30 June
2015 had been receiving it continuously for an average of 17 months.
In terms of incentives to find employment, the key aspect of both TAS and SPB is that 4.17
they abate dollar for dollar.
As at 30 June 2015, there were 54,286 clients receiving TAS or SPB at an average 4.18
weekly rate of $59. Over the last six years client numbers have been very steady at
this level. Over the same time period average weekly payments have increased by
about 15%.
Clients receiving TAS/SPB exit the benefit system at a lower rate than other clients. As 4.19
a representative example, the chart below shows monthly exit rates for 20-29 year old
SPS clients. The average exit rate over this period for clients receiving TAS or SPB is
2.6%, compared to 3.9% for those who aren’t.
While there is likely to be a range of characteristics of clients receiving TAS that 4.20
influence these differences, the disincentive effect of dollar-for-dollar abatement is
likely to be a material factor.
All else being equal, we estimate a sustained 1.3% improvement in monthly SPS exit 4.21
rates for those receiving TAS or SPB would, by June 2018, reduce the BPS 1 target
group by approximately 4,000 and increase the actuarial release by about $0.8bn.
Income Related Rent Subsidy
IRRS is part of the Government’s financial support for social housing. Social housing 4.22
providers are paid the difference between the market rate rent for their properties and
the rent that the social housing tenants pay directly. The higher the income earned by
a household the lower the subsidy and hence the higher the amount of rent the
0%
1%
2%
3%
4%
5%
6%
Jul-
20
12
Oct
-20
12
Jan
-20
13
Ap
r-2
01
3
Jul-
20
13
Oct
-20
13
Jan
-20
14
Ap
r-2
01
4
Jul-
20
14
Oct
-20
14
Jan
-20
15
Ap
r-2
01
5
SPS Exit Rates (20-29 Year Olds)
Not Receiving TAS/SPB Receiving TAS/SPB
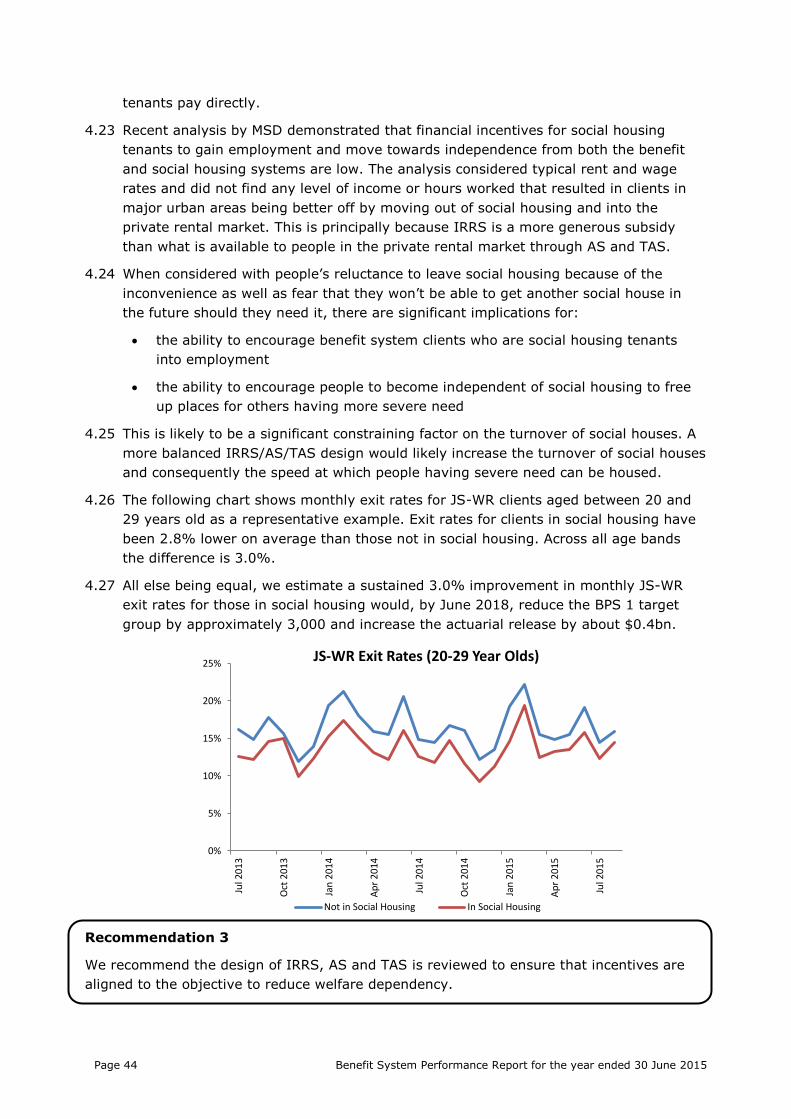
Page 44 Benefit System Performance Report for the year ended 30 June 2015
tenants pay directly.
Recent analysis by MSD demonstrated that financial incentives for social housing 4.23
tenants to gain employment and move towards independence from both the benefit
and social housing systems are low. The analysis considered typical rent and wage
rates and did not find any level of income or hours worked that resulted in clients in
major urban areas being better off by moving out of social housing and into the
private rental market. This is principally because IRRS is a more generous subsidy
than what is available to people in the private rental market through AS and TAS.
When considered with people’s reluctance to leave social housing because of the 4.24
inconvenience as well as fear that they won’t be able to get another social house in
the future should they need it, there are significant implications for:
the ability to encourage benefit system clients who are social housing tenants
into employment
the ability to encourage people to become independent of social housing to free
up places for others having more severe need
This is likely to be a significant constraining factor on the turnover of social houses. A 4.25
more balanced IRRS/AS/TAS design would likely increase the turnover of social houses
and consequently the speed at which people having severe need can be housed.
The following chart shows monthly exit rates for JS-WR clients aged between 20 and 4.26
29 years old as a representative example. Exit rates for clients in social housing have
been 2.8% lower on average than those not in social housing. Across all age bands
the difference is 3.0%.
All else being equal, we estimate a sustained 3.0% improvement in monthly JS-WR 4.27
exit rates for those in social housing would, by June 2018, reduce the BPS 1 target
group by approximately 3,000 and increase the actuarial release by about $0.4bn.
Recommendation 3
We recommend the design of IRRS, AS and TAS is reviewed to ensure that incentives are
aligned to the objective to reduce welfare dependency.
0%
5%
10%
15%
20%
25%
Jul 2
01
3
Oct
201
3
Jan
20
14
Ap
r 2
014
Jul 2
01
4
Oct
201
4
Jan
20
15
Ap
r 2
015
Jul 2
01
5
JS-WR Exit Rates (20-29 Year Olds)
Not in Social Housing In Social Housing
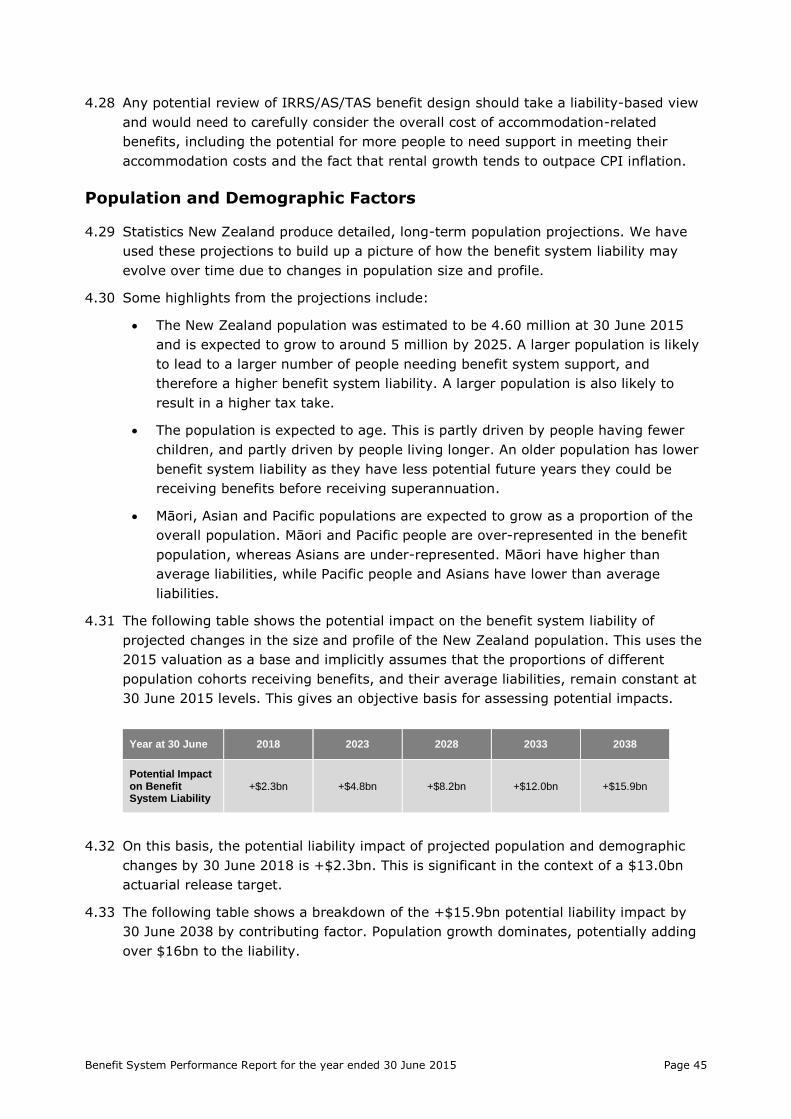
Benefit System Performance Report for the year ended 30 June 2015 Page 45
Any potential review of IRRS/AS/TAS benefit design should take a liability-based view 4.28
and would need to carefully consider the overall cost of accommodation-related
benefits, including the potential for more people to need support in meeting their
accommodation costs and the fact that rental growth tends to outpace CPI inflation.
Population and Demographic Factors
Statistics New Zealand produce detailed, long-term population projections. We have 4.29
used these projections to build up a picture of how the benefit system liability may
evolve over time due to changes in population size and profile.
Some highlights from the projections include: 4.30
The New Zealand population was estimated to be 4.60 million at 30 June 2015
and is expected to grow to around 5 million by 2025. A larger population is likely
to lead to a larger number of people needing benefit system support, and
therefore a higher benefit system liability. A larger population is also likely to
result in a higher tax take.
The population is expected to age. This is partly driven by people having fewer
children, and partly driven by people living longer. An older population has lower
benefit system liability as they have less potential future years they could be
receiving benefits before receiving superannuation.
Māori, Asian and Pacific populations are expected to grow as a proportion of the
overall population. Māori and Pacific people are over-represented in the benefit
population, whereas Asians are under-represented. Māori have higher than
average liabilities, while Pacific people and Asians have lower than average
liabilities.
The following table shows the potential impact on the benefit system liability of 4.31
projected changes in the size and profile of the New Zealand population. This uses the
2015 valuation as a base and implicitly assumes that the proportions of different
population cohorts receiving benefits, and their average liabilities, remain constant at
30 June 2015 levels. This gives an objective basis for assessing potential impacts.
Year at 30 June 2018 2023 2028 2033 2038
Potential Impact on Benefit System Liability
+$2.3bn +$4.8bn +$8.2bn +$12.0bn +$15.9bn
On this basis, the potential liability impact of projected population and demographic 4.32
changes by 30 June 2018 is +$2.3bn. This is significant in the context of a $13.0bn
actuarial release target.
The following table shows a breakdown of the +$15.9bn potential liability impact by 4.33
30 June 2038 by contributing factor. Population growth dominates, potentially adding
over $16bn to the liability.

Page 46 Benefit System Performance Report for the year ended 30 June 2015
Contributing Factor
Population Growth
Ethnic Mix Age Mix Gender Mix Residual Item Total
Potential Impact on Benefit System Liability at 30 June 2038
+$16.7bn +$4.0bn -$3.3bn -$0.8bn -$0.6bn +$15.9bn
The $4.0bn increase from ethnic mix is driven by Māori, who have the highest average 4.34
liability. This emphasises the need to find ways of supporting more Māori into
employment.
In summary, independent of other factors influencing the benefit system, the liability 4.35
is likely to grow by an average of $0.6bn to $0.8bn per year due to projected
population and demographic changes. This should be factored into future target
setting.
Sole Parents – Birth Rates
A person is eligible for SPS if they have children under the age of 14, are not in a 4.36
relationship, and do not have adequate financial support. Two clear influences on the
number of people who find themselves in this situation are the rate at which people
are having children, and the extent to which people with children are supported by
partners. In both respects there have been significant changes over the last few
decades as societal attitudes towards marriage, relationships and raising children have
changed.
Overall, birth rates have reduced marginally in the last five years, but are broadly at 4.37
the same level as in the 1980’s. However, the key trend is that females are having
children later in life. This is shown in the following chart, with birth rates for females
under the age of 30 declining consistently, while rates for females over age 30 have
been increasing.
0
20
40
60
80
100
120
140
160
19
81
19
83
19
85
19
87
19
89
19
91
19
93
19
95
19
97
19
99
20
01
20
03
20
05
20
07
20
09
20
11
20
13
20
15
Birth Rates per 1,000 Females
15-19 Years
20-24 Years
25-29 Years
30-34 Years
35-39 Years
40-44 Years
45-49 Years
Benefit System Performance Report for the year ended 30 June 2015 Page 47
In the context of the benefit system, this is significant for two reasons: 4.38
Over 90% of SPS clients first come into the benefit system under the age of 30.
Older mothers are more likely to be in stable relationships and more likely to
have financial stability.
Average liability is significantly higher for SPS clients who first come into the
benefit system at an early age. For example, 30-34 year old SPS clients who first
come into the benefit system under the age of 30 have a 50% (or $67k) higher
average liability than those who first come into the benefit system aged 30-34.
The age somebody first comes into the benefit system is correlated with other
significant liability predictors such as intergenerational benefit dependency.
While it is difficult to quantify, lower birth rates among young females are likely to 4.39
have had a gradual impact on SPS client numbers. They are also likely to be
contributing to a lower level of long-term benefit dependency amongst SPS clients.
Policy Changes
As part of Budget 2015, the Child Material Hardship Package (CMHP) aimed at 4.40
reducing hardship among vulnerable children was announced. The package contains a
number of changes to the benefit system and other aspects of government support
(including Working for Families tax credits). The main changes (effective from April
2016) are:
$25 per week increase in benefit rates (after tax) for families with children
clients with part-time work obligations will be expected to find work for 20 hours
a week, rather than the current 15 hour obligation
sole parents, and partners of clients, will have to be available for part-time work
once their youngest child turns three, rather than five currently
SPS clients will have to re-apply for their benefit every year
an increase to the childcare subsidy for low-income working families
We have estimated the impact of these changes on the future valuation liability. The 4.41
changes will impact the benefit system in five key ways:
a) Direct impacts of changing benefit rate levels
b) Indirect impacts of changing benefit rate levels e.g. the level of Accommodation
Supplement will change for some clients because the entry threshold and
abatement threshold are both linked to the benefit rate.
c) Direct behavioural impacts e.g. the extension of part-time work obligations to sole
parents with youngest child aged three or four
d) Indirect behavioural impacts e.g. the $25 a week benefit rate increase impacting
clients’ incentive to find employment
e) Indirect impacts from changes to settings outside the benefit system e.g. the
changes to Working for Families tax credits may increase clients’ incentive to find
employment and exit the benefit system.

Page 48 Benefit System Performance Report for the year ended 30 June 2015
a) and b) will impact the valuation liability immediately in April 2016. The impact of c), 4.42
d) and e) will flow through over time as any changes in exit/entry rate experience are
observed and reflected in valuation assumptions.
The package also has effects outside the benefit system. For example, the increase in 4.43
benefit rates for families with children will cause an increase in rent they pay if they
are social housing tenants. We have not quantified these effects.
The following table contains liability estimates for the impact of the CMHP based on 4.44
the 2014 valuation model. The estimates of behavioural impacts largely cancel each
other out, albeit they are subjective. This leaves the impact of changes to benefit rate
levels.
Impact Category 2016 2017 2018 2019
Rate levels – direct and indirect
+$1.20bn to +$1.40bn +$1.20bn to +$1.40bn +$1.20bn to +$1.40bn +$1.15bn to $1.35bn
Behavioural -direct
- -$0.20bn to -$0.05bn -$0.35bn to -$0.10bn -$0.50bn to -$0.15bn
Behavioural - indirect
- +$0.05bn to +$0.25bn +$0.10bn to +$0.40bn +$0.15bn to +$0.60bn
Total +$1.20bn to
+$1.40bn +$1.20bn to
+$1.50bn +$1.10bn to
+$1.50bn +$1.05bn to
+$1.55bn
The CMHP is expected to add about $1.0bn to $1.5bn to the valuation liability. Given 4.45
that the $13bn actuarial release target was set prior to CMHP being announced, we
intend to adjust our actuarial release calculations to remove the impact from changes
in rate levels.

Benefit System Performance Report for the year ended 30 June 2015 Page 49
5 Return on Investment: Employment
Assistance Programmes and Trials
Work and Income run a number of employment assistance programmes aimed at 5.1
supporting clients into sustainable employment. It is also trialing products and
services that may be rolled out wider if assessed as being effective. This chapter
evaluates the key employment assistance programmes and trials.
The table below provides a summary of results. Each programme is then described in 5.2
more detail.
Name Type of Programme Total 2013/14 Programme Expenditure
Total 2014/15 Programme Expenditure
Assessment
Employment Assistance Programmes
Skills For Industry
Job-Focused Training $14.0m $12.4m Delivering value
Flexi-Wage Wage Subsidy $30.0m $29.2m Delivering value
Training For Work
Job-Focused Training $34.4m $32.9m Variable
performance
Work Confidence
Core Skills Training Not available $2.1m Unlikely to be
delivering value
Work Experience
Work Experience Placements
$0.4m $0.2m Unlikely to be
delivering value
Investment Approach Trials
Flexible Childcare Assistance
Payment to Sole Parents
- $0.31m Delivering value
In-Work Support
Inbound/outbound calling plus incentive
payments (opt-in) -
$0.01m (incentive
payments only)
Not showing signs of being
effective
Intensive Client Support
Intensive case management support
for clients with complex needs
- Not available Showing signs
of being effective
Young SLP Case management
(opt-in) - $0.02m
Too small to assess
Appendix C covers methodological points on how Return on Investment (RoI) has 5.3
been calculated. The key point to note is that we use RoI calculations both including
and excluding estimates of liability. This gives an understanding of the likely full
lifetime value of a programme as well as the return on investment to date. The
inclusion of liability can introduce some volatility to RoI. It is important to focus on
overall trends rather than month-to-month variation.

Page 50 Benefit System Performance Report for the year ended 30 June 2015
The assessed programmes represent about 40% of the 2014/15 Programme 5.4
Expenditure MCA. The performance of the programmes assessed is mixed, highlighting
the opportunity to improve the effectiveness of programme expenditure.
Management should consider the results in this chapter as part of its review of funding 5.5
within the MCA.
Employment Assistance Programmes
Skills for Industry
The Skills for Industry programme provides short-term job-focused training to prepare 5.6
clients who need up-skilling for specific requirements identified by industry. The
programmes are tailored to job-specific requirements for particular vacancies. Training
can be offered as pre-employment or in-work training, and programmes can be
delivered by industry providers or employers.
The charts above show RoI for each calendar year of people starting in the programme 5.7
in that year. Duration measures the time since a person started the programme. The
chart on the left excludes liability and shows that RoI increases with duration, but is
less than one until at least three years’ duration. The chart on the right includes
liability and is consistently above one.
Collectively this tells us that at three years’ duration the programme has probably not 5.8
yet broken even, but that it will in the future. It is ultimately expected to have an RoI
above one and is therefore assessed to be delivering value.
Flexi-Wage
Flexi-wage (Basic/Plus) is a wage subsidy that invests in job seekers who are 5.9
disadvantaged in the job market by making a temporary contribution to their wages.
The amount paid and the duration of the subsidy is based on a client’s needs and
reflects the level of assistance the client needs to reach the entry-level requirements
of the job.
-0.2
0.0
0.2
0.4
0.6
0.8
1.0
1.2
1 4 7 10 13 16 19 22 25 28 31 34
Duration (months)
Return on Investment - Excluding Liability
2014
2013
2012
0.0
0.5
1.0
1.5
2.0
2.5
3.0
3.5
4.0
1 4 7 10 13 16 19 22 25 28 31 34
Duration (months)
Return on Investment - Including Liability

Benefit System Performance Report for the year ended 30 June 2015 Page 51
Flexi-wage RoI excluding liability (left-hand chart) increases with duration and reaches 5.10
one at about twelve months, suggesting that it takes about a year to breakeven.
When liability is included (right-hand chart) RoI is significantly above one. We can be
reasonably confident that Flexi-wage is delivering value.
Value may be tempered by substitution and displacement effects. For example, paying 5.11
an employer to employ a client may result in another person who would otherwise
have got that job being on benefit. These effects are difficult to reliably estimate and
are not included in the RoI calculation.
The substitution effects of wage subsidy programmes are likely to be minimised by 5.12
targeting clients having significant barriers to employment, particularly those who
employers may screen out as applicants. For example, approximately two-thirds of ex-
prisoners receive a main benefit within one month of leaving prison. A criminal record
is a permanent characteristic that can impact employment prospects. A subsidy may
help address some of the perceived risk of hiring a person with a criminal record.
The targeting of Flexi-wage should be reviewed in order to maximise the value of the 5.13
programme.
Training for Work
Training for Work (TFW) assists clients to acquire industry-focused skills that are 5.14
needed to enter employment. TFW courses run for a maximum duration of 13 weeks
and on completion include job placement and post-placement support for clients.
Training is provided in a variety of learning environments including Polytechnics,
Marae, Private Training Establishments and workplaces. Providers of TFW courses are
usually registered and accredited by the New Zealand Qualifications Authority to
enable participants to gain recognised national qualifications.
0.0
0.5
1.0
1.5
2.0
2.5
3.0
1 4 7 10 13 16 19 22 25 28 31 34
Duration (months)
Return on Investment - Excluding Liability
2014
2013
2012
0
1
2
3
4
5
6
7
8
9
10
1 4 7 10 13 16 19 22 25 28 31 34
Duration (months)
Return on Investment - Including Liability

Page 52 Benefit System Performance Report for the year ended 30 June 2015
RoI outcomes for Training for Work are variable. Excluding liability, RoI increases with 5.15
duration, but after four years remains less than one. Negative RoI at early durations
may be due to lock-in effects, as participants are less likely to exit benefit while in the
programme.
Including liability, RoI is mainly above one, albeit with significant variation between 5.16
years.
The Training for Work programme should be reviewed with a view to understanding 5.17
the variation in performance. Consideration should be given as to how Training for
Work differs to other job-focused training programmes and whether there are
particular providers that perform better than others.
Work Confidence
Work Confidence programmes are short-term courses designed specifically to provide 5.18
the skills, motivation and confidence needed to help participants move into
employment.
For Work Confidence, RoI including liability shows significant volatility, and so we only 5.19
show RoI excluding liability. With the exception of people starting the programme in
2010, RoI is consistently below one, implying that the programme is unlikely to be
-0.2
-0.1
0.0
0.1
0.2
0.3
0.4
0.5
0.6
1 4 7 10 13 16 19 22 25 28 31 34 37 40 43 46
Duration (months)
Return on Investment - Excluding Liability
2014
2013
2012
2011
0.0
0.5
1.0
1.5
2.0
2.5
3.0
1 4 7 10 13 16 19 22 25 28 31 34 37 40 43 46
Duration (months)
Return on Investment - Including Liability
-1.0
-0.5
0.0
0.5
1.0
1.5
2.0
1 7 13 19 25 31 37 43 49 55
Duration (months)
Return on Investment - Excluding Liability
2014
2013
2012
2011
2010

Benefit System Performance Report for the year ended 30 June 2015 Page 53
delivering value.
Management should consider the value of Work Confidence compared to other 5.20
programmes, and whether there was anything fundamentally different about the
programme in 2010 that may explain the better performance in that year.
Work Experience
Work Experience provides unpaid opportunities in a workplace or work-type 5.21
environment and helps clients gain up-to-date work experience and to develop
informal contacts.
The RoI is consistently below zero. Results for 2012 have been omitted from the chart 5.22
above due to unreliable data. Management should consider ceasing the programme or
establish if changes can be made to improve its performance.
Investment Approach Trials
It is too early to perform robust RoI analysis on the Investment Approach trials. We 5.23
have built the infrastructure to be able to regularly calculate RoI and will report this to
management on a quarterly basis.
In the absence of RoI analysis, it is difficult to draw firm conclusions about the value 5.24
of a product or service. However, we are able to make some statements about the
performance of the trials.
Flexible Childcare Assistance
Flexible Childcare Assistance (FCA) is a non-taxable payment designed to help sole 5.25
parents receiving SPS and JS take up work during non-standard hours i.e. outside the
times that the OSCAR (Out of School Care and Recreation) and ECE (Early Childcare
Education) programmes operate. The weekly payment is $50 for one child and $25 for
each additional dependent child (up to a maximum of $150), and is for up to 13
weeks.
The trial started in August 2014 with a promotional mail-out to approximately 26,000 5.26
sole parent clients in January 2015. By 30 June 2015, about 470 clients had been
granted FCA payments.
Based on evidence to date, those receiving FCA appear to remain off benefit longer 5.27
than other exiting SPS clients. 5%-10% more remain off benefit at 13, 26 and 39
-1.0
-0.5
0.0
0.5
1 4 7 10 13 16 19 22 25 28 31 34 37 40 43 46
Duration (months)
Return on Investment - Excluding Liability
2014
2013
2011
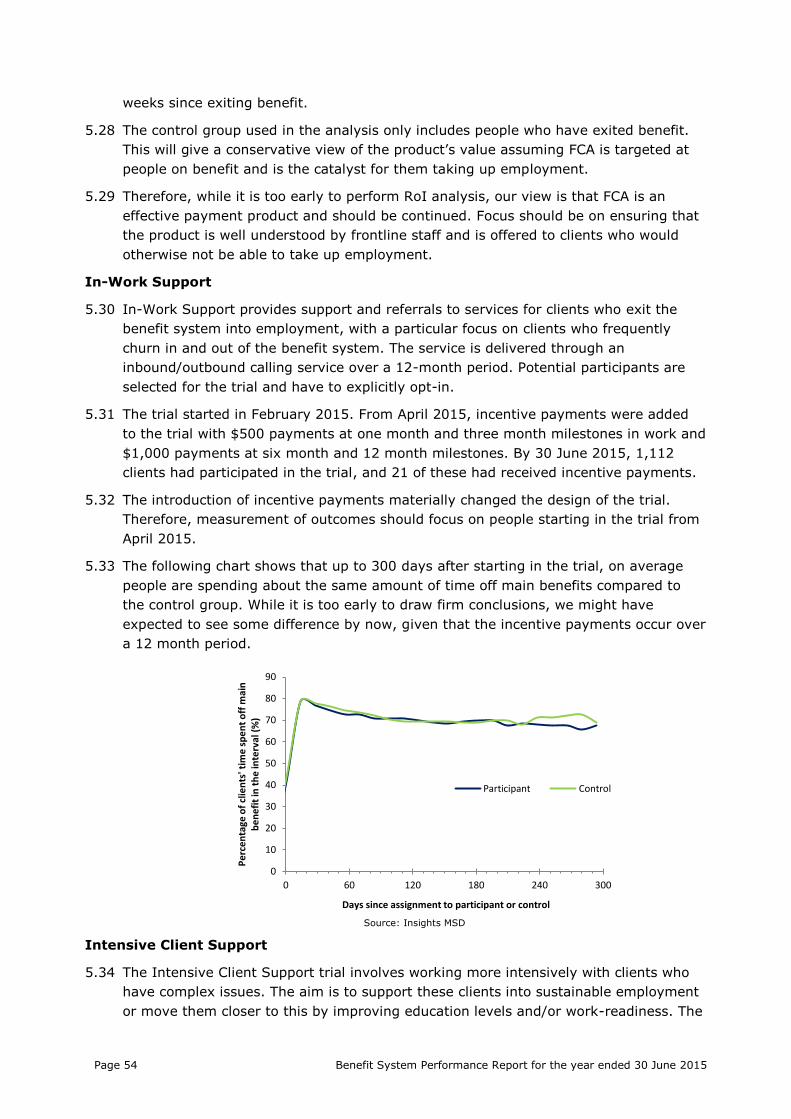
Page 54 Benefit System Performance Report for the year ended 30 June 2015
weeks since exiting benefit.
The control group used in the analysis only includes people who have exited benefit. 5.28
This will give a conservative view of the product’s value assuming FCA is targeted at
people on benefit and is the catalyst for them taking up employment.
Therefore, while it is too early to perform RoI analysis, our view is that FCA is an 5.29
effective payment product and should be continued. Focus should be on ensuring that
the product is well understood by frontline staff and is offered to clients who would
otherwise not be able to take up employment.
In-Work Support
In-Work Support provides support and referrals to services for clients who exit the 5.30
benefit system into employment, with a particular focus on clients who frequently
churn in and out of the benefit system. The service is delivered through an
inbound/outbound calling service over a 12-month period. Potential participants are
selected for the trial and have to explicitly opt-in.
The trial started in February 2015. From April 2015, incentive payments were added 5.31
to the trial with $500 payments at one month and three month milestones in work and
$1,000 payments at six month and 12 month milestones. By 30 June 2015, 1,112
clients had participated in the trial, and 21 of these had received incentive payments.
The introduction of incentive payments materially changed the design of the trial. 5.32
Therefore, measurement of outcomes should focus on people starting in the trial from
April 2015.
The following chart shows that up to 300 days after starting in the trial, on average 5.33
people are spending about the same amount of time off main benefits compared to
the control group. While it is too early to draw firm conclusions, we might have
expected to see some difference by now, given that the incentive payments occur over
a 12 month period.
Source: Insights MSD
Intensive Client Support
The Intensive Client Support trial involves working more intensively with clients who 5.34
have complex issues. The aim is to support these clients into sustainable employment
or move them closer to this by improving education levels and/or work-readiness. The
0
10
20
30
40
50
60
70
80
90
0 60 120 180 240 300
Pe
rce
nta
ge o
f cl
ien
ts' t
ime
sp
en
t o
ff m
ain
b
en
efi
t in
th
e in
terv
al (
%)
Days since assignment to participant or control
Participant Control
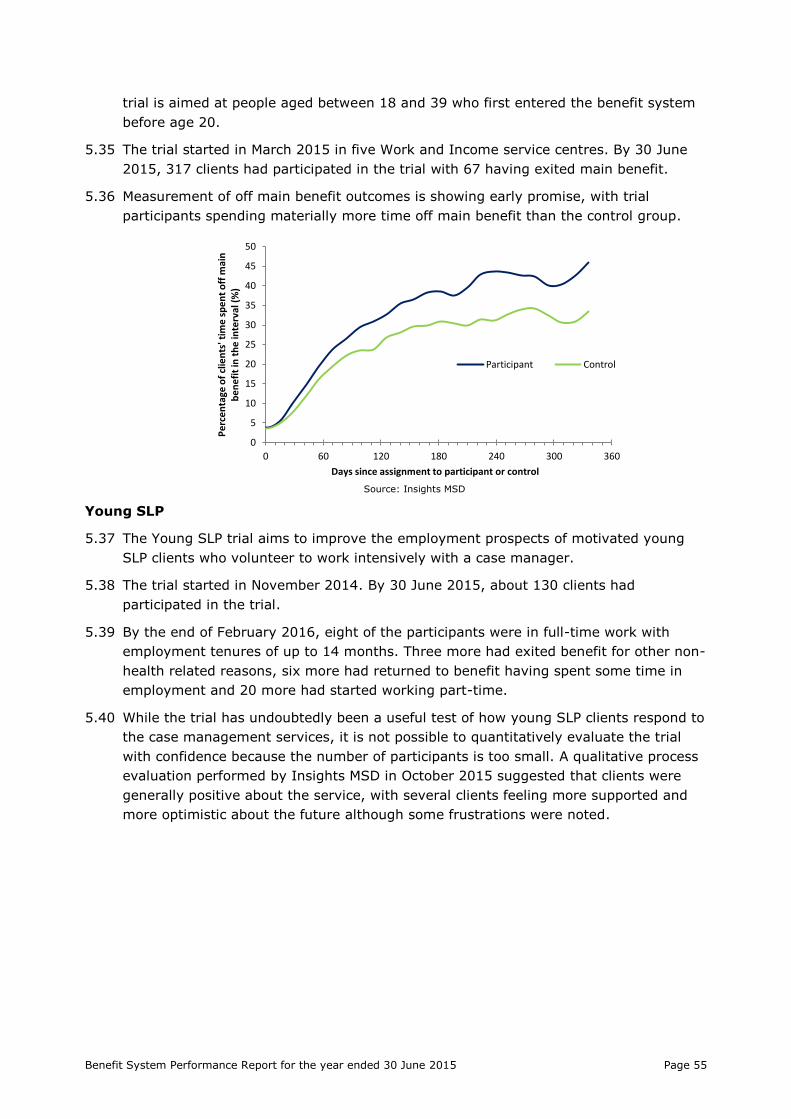
Benefit System Performance Report for the year ended 30 June 2015 Page 55
trial is aimed at people aged between 18 and 39 who first entered the benefit system
before age 20.
The trial started in March 2015 in five Work and Income service centres. By 30 June 5.35
2015, 317 clients had participated in the trial with 67 having exited main benefit.
Measurement of off main benefit outcomes is showing early promise, with trial 5.36
participants spending materially more time off main benefit than the control group.
Source: Insights MSD
Young SLP
The Young SLP trial aims to improve the employment prospects of motivated young 5.37
SLP clients who volunteer to work intensively with a case manager.
The trial started in November 2014. By 30 June 2015, about 130 clients had 5.38
participated in the trial.
By the end of February 2016, eight of the participants were in full-time work with 5.39
employment tenures of up to 14 months. Three more had exited benefit for other non-
health related reasons, six more had returned to benefit having spent some time in
employment and 20 more had started working part-time.
While the trial has undoubtedly been a useful test of how young SLP clients respond to 5.40
the case management services, it is not possible to quantitatively evaluate the trial
with confidence because the number of participants is too small. A qualitative process
evaluation performed by Insights MSD in October 2015 suggested that clients were
generally positive about the service, with several clients feeling more supported and
more optimistic about the future although some frustrations were noted.
0
5
10
15
20
25
30
35
40
45
50
0 60 120 180 240 300 360
Pe
rce
nta
ge o
f cl
ien
ts' t
ime
sp
en
t o
ff m
ain
b
en
efi
t in
th
e in
terv
al (
%)
Days since assignment to participant or control
Participant Control

Page 56 Benefit System Performance Report for the year ended 30 June 2015
6 Progress against Previous Report
Recommendations
This section details progress MSD has made against the recommendations from 6.1
previous Benefit System Performance Reports. Progress has been reported to the
former Work and Income Board on a quarterly basis. Many of these recommendations
related to broad areas of focus and were not necessarily expected to be completed
within a short space of time. Therefore, some are carried forward for the next year.
Operational Design and Strategy
Recommendation 1
Management consider differentiated operational responses for clients in households 6.2
with two or more people receiving a main benefit to reflect the different barriers to
employment these clients may face (2014 BSPR).
Management comment
Management has considered this recommendation and agree this is a factor in risk 6.3
assessment for long-term benefit receipt. Household data-based insights are being
used to strengthen the delivery of case management and contracted services within
Work and Income’s operating model.
A liability-based risk assessment tool has been developed which factors in multiple risk 6.4
factors in assessing the risk of long-term benefit receipt. Work is underway to
incorporate household-related characteristics into the tool and a project has
commenced to incorporate the output from the tool into streaming rules and other
intervention decisions. We expect this to be achieved by the end of 2016.
This recommendation has been actioned by management and is on the current work-
plan. This recommendation is now closed.
Recommendation 2
Management consider differentiated operational responses for clients who live in social 6.5
housing to better reflect client needs given the overlap between benefit system and
Housing New Zealand (HNZ) clients (2014 BSPR).
Management comment
A social housing valuation is currently underway. The results of the 2015 social 6.6
housing valuation and subsequent segmentation exercise will influence service
delivery for these clients. In particular, the valuation will include a household lens of
benefit system clients in social housing.
Results from the social housing valuation will be available in Q4 2015/16, with 6.7
segmentation work scheduled for Q1 2016/17.
This recommendation is still in progress and has been held over for the following year.
Benefit System Performance Report for the year ended 30 June 2015 Page 57
Recommendation 3
Management consider differentiated operational responses for clients who were 6.8
supported by parents (or a parent) on benefit during childhood, to reflect their higher
likelihood of long-term benefit receipt (2014 BSPR).
Management comment
Management has considered this recommendation and agree this is a factor in risk 6.9
assessment for long-term benefit receipt.
The project to incorporate the output from the liability-based risk model into 6.10
streaming rules and other intervention decisions will also support this recommendation
(see paragraph 6.4).
MSD is also working on a number of cross-agency initiatives that address some of the 6.11
drivers of intergenerational benefit dependency. We expect these will be in place by
July 2016.
This recommendation has been actioned by management and is on the current work-
plan. This recommendation is now closed.
Recommendation 4
Management consider extending the education and training goals of the Youth Service 6.12
to those who recently would have qualified for a youth benefit but have transferred
onto a main benefit without the encouragement into education or training that the
Youth Service now provides (2013 BSPR).
Management comment
In July 2015 the Government introduced a Bill to extend the Youth Service approach 6.13
to all 19 year old teen parents, and to young Jobseeker Support clients aged 18 and
19 who are assessed as being at risk of long term welfare dependency.
The extension of these services is now on management’s work-plan and is due for 6.14
implementation in 2016.
This recommendation has been actioned by management and is on the current work-
plan. This recommendation is now closed.
Recommendation 5
Investigation into the causes of greater levels of vulnerability to long-term benefit 6.15
receipt for Māori. Strategies should be considered for supporting more Māori into work
and new initiatives trialed to target the barriers that cause the disparity between
ethnic groups (2013 BSPR).
Management comment
Further analysis has been conducted on Māori as recommended. 6.16
MSD has initiated a Māori Strategy and is investigating a range of strategies to 6.17
support Māori into independence. Options are to be considered by management and
forwarded to the Leadership Team for decisions by June 2016.
In advance of this decision point, an MSD working group has been established to 6.18
develop partnerships with Iwi work programmes.

Page 58 Benefit System Performance Report for the year ended 30 June 2015
This recommendation is still in progress and has been held open for the following year.
Data Access and Analytics
Recommendation 6
Child, Youth and Family (CYF) data is used to inform the 30 June 2015 valuation, 6.19
increasing understanding of the drivers of long-term benefit dependency (2014 BSPR).
Management comment
CYF data was used for the 30 June 2015 valuation. 6.20
Results relating to CYF data can be found in the ‘Valuation of the Benefit System for 6.21
Working-age Adults as at 30 June 2015’ report on the MSD website.
This recommendation has been actioned and is closed.
Recommendation 7
Department of Corrections data is used to inform the 30 June 2015 valuation, 6.22
increasing understanding of the drivers of long-term benefit dependency (2014 BSPR).
Management comment
Corrections data was used for the 30 June 2015 valuation. 6.23
Results relating to Corrections data can be found in the ‘Valuation of the Benefit 6.24
System for Working-age Adults as at 30 June 2015’ report on the MSD website.
This recommendation has been actioned and is closed.
Recommendation 8
Analysis is performed using Accident Compensation Corporation (ACC) data to 6.25
understand the experience of former ACC clients that transition to the benefit system
(2014 BSPR).
Management comment
Analysis has been completed and will be reported to management in Q4 2015/16. By 6.26
the end of Q1 2016/17, management will consider whether any operational responses
are necessary.
This recommendation is still in progress and has been held open for the following year.
Recommendation 9
A link to education data from the Ministry of Education is needed to inform the 6.27
valuation and better understand the correlations between education and benefit
dependency (2013 BSPR).
Management comment
Management agree that improved education data is useful for the valuation. We also 6.28
understand that Statistics NZ’s Integrated Data Infrastructure (IDI) contains
education-related data including:
School attendance including expulsion and suspension records
NCEA qualifications

Benefit System Performance Report for the year ended 30 June 2015 Page 59
Tertiary institution enrolments and completions information
Industry training information (where training is part/whole government funded)
The data only goes far back enough to cover a small portion of our client population. 6.29
Nevertheless, this is likely to be useful for valuation purposes. As the data builds up
over time it will cover an increasing portion of the population.
MSD is investigating whether an IDI equivalent education dataset can be obtained for 6.30
use in the 2017 valuation. We will have a firm understanding of whether this can be
achieved by the end of Q1 2016/17. If so, this will be added to the work-plan to
ensure the data is available for the 2017 valuation.
This recommendation is still in progress and has been held open for the following year.
Recommendation 10
Data collection for youth clients is improved to provide a separate benefit code for YP 6.31
and YPP benefits (or YPP flag) and improve education and child information data
collection for these clients (2013 BSPR).
Management comment
A split of youth clients into YP and YPP had been achieved and used in the 2014 and 6.32
2015 valuations.
The MSD actuarial team has performed an initial review of data held by Youth Service 6.33
providers to ascertain whether it is useful for valuation purposes. Further analysis is
required and will be performed by the end of Q4 2015/16 at which point a decision will
be made whether to incorporate the data in the 2016 valuation.
This recommendation is still in progress and has been held over for the following year.
Segmentation
Recommendation 11
Further investigation into segmentation and whether segmenting the client base using 6.34
the current continuous duration approach gives the best separation for understanding
the drivers of liability. Possible alternatives include age at entry into the benefit
system or proportion of time spent on benefit since first benefit receipt (2013 BSPR).
Management comment
Management agree that a review of segmentation is worthwhile. 6.35
New data sources were added to the 30 June 2015 valuation (see recommendations 6 6.36
and 7). These datasets will help inform segmentation approaches.
Furthermore, social housing segmentation work has been contracted to occur in Q1 6.37
2016/17. This will help inform benefit system segmentation, given the integration
between the social housing and benefit system valuations.
Consequently, decisions on benefit system segmentation are deferred to Q2 2016/17, 6.38
with a view to any potential changes being reflected in the 2017 valuation.
This recommendation is still in progress and has been held over for the following year.

Page 60 Benefit System Performance Report for the year ended 30 June 2015
Cross-Government Investment Approach
Recommendation 12
Management and the Board discuss with other social sector Chief Executives and 6.39
Ministers the potential application of a broader cross-government investment approach
(2014 BSPR). Management comment
The Social Sector Board with the support of the Ministers of Finance and State 6.40
Services have established the Social Investment Unit (SIU) to progress how the
investment approach may be applied across the wider social sector. The Ministry is
supporting the SIU in this work.
The Expert Advisory Panel on vulnerable children has submitted its report to cabinet. 6.41
Cabinet’s response to this report may also influence any potential cross-government
investment approach.
This recommendation has been actioned and is closed.

Benefit System Performance Report for the year ended 30 June 2015 Page 61
Appendix A: Background
Review of the Benefit System
A.1 Cabinet established the Welfare Working Group (WWG) in April 2010 to conduct a
review of the benefit system. Its findings were reported in February 2011 in a report
titled Reducing Long-Term Benefit Dependency.
A.2 A key theme of the report was to take a long-term view of the social, economic and
fiscal costs of benefit dependency. The report recommended adopting an actuarial
approach to measuring the forward liability associated with the benefit system and
using this as a tool to inform management.
A.3 In November 2011, the Government announced it would move forward with an
Investment Approach to managing the benefit system. The Investment Approach is
the framework underpinning its programme of Welfare Reform. This has included:
merging benefit categories
extending work obligations to more clients
introducing new work preparation and other obligations
funding a more active approach to work with clients who need more assistance to
find work.
The changes to benefit categories and obligations were designed to embed a work
focus throughout the benefit system and to support the Investment Approach to
welfare. These changes have increased the number of people with active work
expectations and given Work and Income more flexibility to provide services to
people, appropriate to their circumstances.
A.4 A key tool in the Investment Approach to managing the benefit system is the
development of an actuarial valuation and reporting framework. Its primary aims are
to provide:
an insight into what is driving people’s risk of long-term benefit dependency
a financial assessment of the total cost of the benefit system
an understanding of what is driving the change in cost of the benefit system
a means of measuring performance in managing the benefit system over time
a means of analysing the financial impact of policy and operational changes.
A.5 This detailed understanding can be used to help Management better target services to
help those most in need of support.
Purpose of this Report
A.6 This report is addressed to the Chief Executive of the Ministry of Social Development
with the understanding that it will also be provided to the Minister of Finance and the
Minister for Social Development.
Page 62 Benefit System Performance Report for the year ended 30 June 2015
A.7 The report has been prepared by Herwig Raubal, FNZSA, FIAA; Eric Judd, FNZSA,
FIAA; and Daniel Stoner, FNZSA (primary regulator), FIA; and is in respect of the year
ending 30 June 2015.
A.8 This is the third internal actuarial report produced in relation to the forward liabilities
of the benefit system. The purpose of the report is for the Chief Actuary to
independently:
review experience over the year in terms of exit rates, numbers of new clients
and clients transitioning between benefits
review overall performance of the benefit system and the effectiveness of
investments made to reduce benefit dependency
review and comment on the valuation of the forward liability and what can be
learned from analysis of the change in liability
identify areas for attention to help manage long-term benefit dependency.
A.9 Some of the analysis in this report relies on the liability calculations performed by
Taylor Fry Consulting Actuaries and detailed in their report titled Valuation of the
Benefit System for Working-age Adults as at 30 June 2015 (the 2015 Valuation
Report) which was publicly released in January 2016. Prior liability calculations were
also performed by Taylor Fry for the years ended 30 June 2011, 30 June 2012, 30
June 2013 and 30 June 2014.
Professional Standards
A.10 There are currently no actuarial professional standards which strictly apply to the
valuation of unfunded social welfare liabilities. Where relevant, this report and the
valuation calculations have been carried out consistent with the professional standards
of the New Zealand Society of Actuaries.
A.11 In particular, the valuation has been carried out consistent with standards that apply
to the valuation of accident compensation liabilities, namely the New Zealand Society
of Actuaries Professional Standard No. 30 entitled Valuation of general insurance
claims and this report complies with relevant sections of Professional Standard No. 31
entitled General Insurers – Financial Condition Reports.
Scope
A.12 This report covers the actuarial valuation, analysis and, where appropriate, the
implementation and management of the Investment Approach within the operation of
Work and Income.
A.13 The forward liability for current clients is defined to be:
The estimated future lifetime costs of all benefit payments and associated expenses
for working-age clients who received a benefit payment in the 12 months up to and
including the effective date of the valuation.
A.14 This means recent exits from the benefit system are included in the scope of the
liability until they have been without benefit assistance for at least 12 months, even

Benefit System Performance Report for the year ended 30 June 2015 Page 63
though they may not currently be receiving any financial assistance from Work and
Income.
A.15 These recent exits have been included in the scope of the liability because there is a
high rate of return to the benefit system for previous benefit recipients. This
continuing vulnerability means that people who have been off benefit for less than 12
months should continue to be viewed as ‘clients’ to help provide a management focus
on sustainable exits from the benefit system.
A.16 The liability and this report cover working age people. Benefits payable to people over
the eligibility age for superannuation are excluded from the scope of this report.
Student Loans and Jobseeker Support Student Hardship have also been excluded from
the liability.
A.17 The scope of this report does not extend to discussions on the appropriateness or
feasibility of pre-funding this valuation liability.

Page 64 Benefit System Performance Report for the year ended 30 June 2015
Appendix B: Nature of the Business
Purpose
B.1 Work and Income is an operational arm of MSD, tasked with administering the benefit
system for working age adults. The role of Work and Income is to help people
throughout New Zealand find work and to provide income support based on
entitlements set out in the Social Security Act 1964 (the Act).
B.2 Some of the key responsibilities outlined in the Act are:
to provide financial support to those not in paid employment and help them find
employment where they are able to work
to provide financial support to those unable to work because of sickness, injury,
disability or caring responsibilities
to provide financial support to help alleviate financial hardship
to provide services to encourage young people to receive education, training or
employment
where appropriate, to impose work requirements on those receiving financial
support or in the case of young people, requirements relating to education,
budget management and parenting.
B.3 In carrying out duties under the Act, the following general principles, outlined in
section 1B, are to apply:
work in paid employment offers the best opportunity for people to achieve social
and economic well-being
the priority for people of working age should be to find and retain work
people for whom work may not currently be an appropriate outcome should be
assisted to prepare for work in the future and develop employment-focused skills
people for whom work is not appropriate should be provided support in
accordance with the Act.
Governance
B.4 The Act confers powers and authorities on the Chief Executive (CE) of MSD to oversee
the administration of the benefit system and requires the CE to follow written
directions from the Minister. Reporting to the CE are several Deputy Chief Executives
(DCE) including a DCE of Service Delivery who oversees the operation of Work and
Income.
B.5 Ministers established Treasury as an external monitoring function, tasked with giving
an independent view of the progress of implementation of the investment approach
and Work and Income’s performance.

Benefit System Performance Report for the year ended 30 June 2015 Page 65
Benefit Structure
B.6 Until July 2013 financial assistance was provided to eligible working age clients
through:
Benefit Type Purpose
Domestic Purposes Benefit
(DPB)
Financial support for:
- Single parents living without a partner,
irrespective of whether the other parent is
contributing to maintenance payments and
irrespective of fault
- People caring for the sick and infirm
- Women living alone who were aged 50 or more and lose financial support of their partner or
spouse, or a dependent child in their care for at least 15 years has left care
Sickness Benefit (SB)
Financial support for people temporarily
incapacitated from working full-time through sickness or accident, who would otherwise be available for full-time work.
Invalid’s Benefit (IB) Financial support for people permanently and
severely restricted in capacity for work due to
sickness, injury or disability or who are totally blind.
Unemployment Benefit (UB) Financial support for people not in full-time work but
available for and looking for full-time work.
Widows Benefit (WB)
Financial support for women with children who have been married or in de-facto relationship for 15 years
or more (or five years if over 50) and whose partner has died.
Emergency Benefit (EB)
Financial support for people who are not eligible for another main benefit and are in hardship and unable to earn a sufficient livelihood due to their health
condition, domestic circumstances, residence or another reason.
Orphans Benefit (OB) Financial support to people (aged 18 or over) caring
for an orphan or unsupported child for a period likely to exceed one year.
Supplementary Benefits
Additional financial assistance depending on
circumstances
- Accommodation Supplement to help with rent, board or home ownership costs
- Childcare Subsidy to help with cost of pre-school care
- Disability Allowances to help with ongoing costs because of a disability
- Unsupported Child’s Benefit to help carers support a child or young person whose parents

Page 66 Benefit System Performance Report for the year ended 30 June 2015
Benefit Type Purpose
are unable to care for them because of a family breakdown
Hardship Payments Financial support for essential one-off needs
B.7 Eligibility criteria for main benefits (DPB, IB, SB, UB, WB) generally required recipients
to have continuously lived in New Zealand for two years since becoming a citizen or
permanent resident.
B.8 From 15 July 2013, the benefit structure was consolidated from the multiple benefit
types listed in paragraph B.6 to three main benefit types plus two youth benefits
(which started from August 2012). These changes, along with the increase in the
number of people with active work expectations, were made to embed a work focus in
the benefit system. The new benefit structure is summarised below:
Benefit Type
(and former type) Purpose
Jobseeker Support
which incorporates the former
- UB, SB
- DPB, WB with youngest child aged 14 or over
To provide financial support to those not in full-time
work but actively seeking and available for work and those who are temporarily exempt due to a health condition or disability but who will soon be able to work
Sole Parent Support
Which incorporates the former
- DPB, WB or Women Living Alone Benefit with youngest child aged 13 or under
To provide financial support for single parents with school age or under school age children
Part-time work obligations start once the youngest child is aged five
Note: If another child is born while on the benefit, once that child turns one, the obligations are dependent on the next youngest child's age
Supported Living Payment
Which incorporates the former
- IB
- DPB – Care of Sick and Infirm
To provide financial support to people unable to work
because they are permanently and severely restricted due to a health condition or disability or are totally blind or caring for a person who requires full-time care and attention at home
Youth Payment
Which incorporates the former
- under 18 receiving UB, SB or EB
- Note that young people formerly receiving IB are included in Supported Living Payment
To provide financial support to people aged 16 to 18 years old (subject to education, training or work obligations)
Young Parent Payment
Which incorporates the former
- under 19 receiving DPB
To provide financial support to people aged 16 to 19
years old with a dependent child (subject to budgeting and early childhood education obligations)
Supplementary Benefits No change
B.9 Benefit payment amounts are income tested. Abatement rates vary by benefit type.
B.10 The new Jobseeker benefit reflects the work focus under the welfare reforms by
including those sole parents having full-time work obligations (children 14 or over). It
also includes people having short-term deferrals of their work obligations.

Benefit System Performance Report for the year ended 30 June 2015 Page 67
B.11 Creating the two new youth benefits highlights the importance of working with
vulnerable young people who, without support, are likely to develop long-term benefit
dependency. The focus for these benefits is training and education as a precursor to
work.
Recent Reforms
Future Focus
B.12 The Social Security (New Work Tests, Incentives and Obligations) Amendment Bill
passed into law on 23 August 2010. This bill supported changes announced under the
Future Focus initiative.
From 27 September 2010:
- UB recipients are required to reapply for their benefit and complete a
Comprehensive Work Assessment interview every 52 weeks.
- DPB Sole Parent clients whose youngest child is six years or older are subject
to part-time work obligations.
- Repeat applicants for hardship assistance are subject to new budgeting
obligations.
- Hardship applicants are able to receive their first and second grants in a year
over the phone.
From 2 May 2011:
- Clients in receipt of SB for 52 weeks are required to attend a reassessment
interview with a case manager.
- New SB clients are required to undergo an additional medical assessment by a
health practitioner eight weeks after their grant date (shifting out the dates of
13 weekly reassessments thereafter).
- Clients issued with a medical certificate indicating they are capable of work for
15–29 hours a week have part-time work obligations.
The Bill also required people on a youth benefit to be in education, work or
training and introduced graduated sanctions when obligations are not met.
Welfare Reforms
B.13 On 30 May 2011, Cabinet agreed to a programme of work to develop the
Government's response to the WWG. Cabinet agreed the reforms should focus on
ensuring sustainable paid work is the goal for as many beneficiaries as possible and
increase investment in people with high long-term social and economic needs.
The package has been phased in over three stages.
Phase One: The YP and YPP benefits and delivery of the new Youth Service began
from 20 August 2012. The Youth Service targets 16-18 year olds at risk of long-
term benefit dependency and aims to help them work towards independence
through education, training or work-based learning with the support of
community based providers.

Page 68 Benefit System Performance Report for the year ended 30 June 2015
Phase Two: Greater work expectations were introduced from 15 October 2012 for
DPB - Sole Parent, Woman Alone and Widows Benefit recipients.
Phase Three: From 15 July 2013 three new benefit categories were introduced -
JS, SPS and SLP. In addition, new policies and processes were introduced such as
social obligations for parents, pre-employment drug testing, work ability
assessments for job seekers with deferred work obligations, and checks for
warrants to arrest.
B.14 In July 2012, Cabinet agreed to provide Work and Income with greater flexibility to
use contracted service providers to support beneficiaries to meet their obligations and
achieve sustainable employment outcomes. The aim is to draw on the expertise in the
Non-Government Organisation and private sectors to achieve employment outcomes
for more people.
B.15 Following these changes, the main purposes of administering benefits in line with the
Act and assisting people to find work are largely unchanged. From a practical
perspective, however, since the welfare reforms, more of the spend on services and
interventions has been directed towards activities such as employment assistance and
providing services to people appropriate to their circumstances, with increased
numbers of case managers working one-to-one with clients.
Future Reform
B.16 As part of Budget 2015 a child hardship package was announced incorporating a
number of changes to benefits and policy settings:
A $25 a week (after tax) increase in benefit rates for families with children
Strengthened work obligations for beneficiary parents, including:
- Introduction of part-time work obligations to SPS clients with youngest child
aged three and four
- An increase in part-time work obligations from 15 to 20 hours a week
An increase in childcare subsidy rate from $4 to $5 for low-income families
B.17 These changes were effective from April 2016. They are not reflected in the liability at
this point, but will be in the 2016 valuation.
Operational Service Model
B.18 Work and Income is the largest service line of MSD, with 11 regional offices, more
than 140 service centres, a contact centre located in five sites, and a centralised
processing unit.
B.19 The service delivery framework incorporates five distinct internal case management
services:
Work Focused Case Management (WFCM - General): provides intensive one-to-
one, face-to-face case management support for clients likely to remain on benefit
for a long time without intervention. The goal of this service is to address a
client's barriers to employment and find them work.
Work Focused Case Management - Health Condition, Injury or Disability (WFCM -
HCD): provides customised case management for Jobseekers with a deferred

Benefit System Performance Report for the year ended 30 June 2015 Page 69
work obligation who display indicators that, with support, they will be able to
return to work.
Work-Focused Case Management - Integrated Service (WFCM - IS): provides
intensive wrap-around case management for clients aged 24 or under and who
began receiving a benefit as a youth, giving them a high risk of long-term benefit
dependence. The service also provides case management for clients who are
identified as having multiple and complex needs and so require additional support
to address barriers to work.
Work Search Support (WSS): is a service for work-ready JS clients that increases
in intensity with time on benefit. It starts with clients doing self-directed job
search and progressing to support from outbound calls to the client then to Work
Search Assessment and various Work Development Workshops to help clients
who have more connections to the labour market stay focused on finding
employment.
General Case Management (GCM): is a one-to-many service to provide income
support and support to prepare for work. This service is for clients for whom
employment is not a short-term goal, who are receiving non-beneficiary
assistance, or who are yet to be assigned to a more intensive service.
B.20 Clients are allocated into services depending on a range of eligibility factors.
Streaming rules are reviewed to ensure appropriate allocation of clients to services.
B.21 A separate case management service is provided for clients receiving a youth benefit,
i.e. those aged under 18 (and parents up to age 19). This service is co-managed by
contracted providers and Work and Income. The service is more focused on
educational and training goals than on immediate work outcomes.
B.22 Work and Income partners with employers, training providers, and social support
providers, to help deliver tailored services, such as ongoing mentoring and wrap-
around support, to clients to help them into training or work.
B.23 Benefit payment administration is a major function of Work and Income, along with
fraud prevention and detection. The business unit also handles Emergency
Management (preparation and response for welfare responsibilities) on behalf of the
Government.
Investment Approach
B.24 To achieve the goal of reducing long-term benefit dependency, Government
implemented an Investment Approach to the benefit system. The aim of the
Investment Approach is to better target appropriations to the needs of the clients. Its
success relies on:
a clear long-term outcome based on the external valuation and the factors over
which MSD has influence
strong accountability mechanisms where performance is measured transparently
against the future liability
flexible funding so MSD can allocate resources to where they are most effective
at improving long-term employment outcomes. Increased flexibility entails the
Page 70 Benefit System Performance Report for the year ended 30 June 2015
ability to stop, trial and expand programmes and services, and the ability to
move funding to those programmes and services that improve client outcomes.
B.25 There are a number of elements in place that are essential to the successful delivery
of the investment approach and to target funding better to reduce long-term
dependency. They are explained in the following sections.
Annual Valuation of the Benefit System
B.26 A key component of the Investment Approach to managing the benefit system is the
annual actuarial valuation of the forward liability for people of working age.
Multi-Category Appropriation (MCA)
B.27 MSD is provided with appropriations to fund the administration of the benefit system
and to meet its duties to help people find work. Crucial to being able to direct
investment funds towards interventions that will most benefit clients is the
introduction of the MCA, providing increased funding flexibility. The first MCA of its
kind was agreed by Cabinet in September 2013 and approved by the Minister of
Finance in October 2013 (for implementation from 1 January 2014). Operational
flexibility is provided by the delegation of decision-making rights from Ministers to the
CE of MSD.
B.28 The use of an MCA places responsibility on Work and Income to use these public funds
prudently and efficiently. The Investment Approach aims to direct the funding where
it will do the most good, and to establish a clearer link between the application of
funds and how they impact on peoples’ risk of long-term benefit receipt.
Controls and Governance of Investments
B.29 Trials and the Return on Investment Framework: To help understand the
impacts that can be attributed to investment initiatives better, a number of trials are
in place. Outcomes for the targeted groups of people in a trial are tracked and
compared to a control group having similar attributes. This forms part of the broader
RoI framework Work and Income has developed (in conjunction with the Treasury).
B.30 Key elements of the framework are:
a consistent approach across all investments and all clients to make strategic
decisions about how intervention funding should be allocated
an approach to attribution of the impacts on the liability of various interventions
a business case discipline to identify expected outcomes at the outset of
significant investments and new initiatives (e.g. trials of new service delivery
approaches, and cases for roll-out of successful trials). This can be used to
monitor actual effectiveness and RoI against these expected outcomes.
B.31 Crucially, the framework incorporates estimated liability impacts of investment
initiatives. This allows for a full understanding of long-term impact. Ultimately this
enables us to form a view as to whether a particular investment initiative is delivering
value for money.
B.32 Chapter six of this report contains ROI analysis of a number of existing employment
assistance programs and trials.

Benefit System Performance Report for the year ended 30 June 2015 Page 71
B.33 Quarterly Actuarial Reporting: A quarterly valuation monitoring report is provided
to the Minister for Social Development, the Minister of Finance and to the Board and
Management of Work and Income. Its purpose is to:
monitor the key drivers of the liability, such as client numbers and benefit
payments
identify variances in trends projected from the valuation and MSD's actual
experience
provide an update of the valuation liability and report on the actuarial release
component of BPS 1
provide a transparent account of the performance of the benefit system and Work
and Income’s management thereof.
B.34 Benefit System Performance Report: This annual report (and the quarterly
monitoring reports) are tools available to provide greater transparency of the
performance of the benefit system. It provides the CE with a review of the
performance and the effectiveness of investments made to reduce benefit
dependency. It also identifies areas for attention to help manage long-term benefit
dependency.

Page 72 Benefit System Performance Report for the year ended 30 June 2015
Appendix C: Return on Investment
Methodology
C.1 In high level terms, the RoI of a programme is calculated as:
RoI = Incremental Benefits
Incremental Costs
C.2 RoI gives a relative assessment of the value of investment in a programme. If the RoI
is greater than 1, benefits are assessed to be greater than costs i.e. the programme
has delivered more value than it has cost.
C.3 RoI has the advantage that it allows direct comparison between different programmes.
This is particularly important where different programmes are competing for the same
pool of funding.
C.4 Not all costs and benefits of a programme can be quantified in monetary terms, and
other potentially material costs/benefits should be considered before conclusions are
drawn. For example, supporting people into sustainable employment is likely to have
an impact on their standard of living and general wellbeing.
C.5 Traditional RoI methodologies incorporate actual costs and benefits up to a date of
measurement. This can be useful in some circumstances, but where the benefits of the
programme are likely to take many years to eventuate, it can be slow to signal the
value of a programme.
C.6 Our methodology includes a traditional measure and a measure incorporating
estimates of future benefits and costs (liability). This gives an understanding of the
likely full lifetime value of a programme as well as the return on investment to date.
The inclusion of liability can introduce some volatility to RoI. It is important to focus
on overall trends rather than month-to-month variation.
C.7 To establish incremental costs and benefits the outcomes of those participating in a
programme are compared to a control group. The control group is intended to be a
proxy for what would have otherwise happened if the participant group had not been
part of the programme.
C.8 There are different ways to establish a control group. A randomised control group is
used where possible, though is not always practical. For the employment assistance
programmes propensity matching is used. Propensity matching involves constructing a
control group with similar characteristics to the participants. The degree to which
characteristics can be assessed is limited by the data available and so there will be
unobservable differences that may influence results.
C.9 All of our calculations have been done on a marginal cost basis i.e. costs that can be
directly attributed to the participant or control group. Therefore, it does not include a
share of indirect costs and overheads. The cost of these programmes is relatively
small in the context of total Ministry costs and is unlikely to materially influence
indirect costs and overheads.
C.10 Our RoI calculations do not incorporate non-participant effects as these are difficult to
reliably estimate:

Benefit System Performance Report for the year ended 30 June 2015 Page 73
Substitution effect – Where helping participants into employment is at the
expense of non-participants’ employment prospects
Displacement effect – Where a programme helps improve a firm’s
competitiveness leading to the loss of employment among competing firms
C.11 Both effects can reduce the value of a programme. Their impact will differ between
programmes and they are difficult to reliably calculate. Where we think these effects
are material we have commented in our conclusions about the programme.
C.12 It should be noted that by comparing a programme participant group and a control
group we are estimating the difference between what happens to the programme
participant group and what was likely to have happened to them had they been not
part of the programme. The control group may receive other services that the
programme participant group does not (and vice versa), and so the evaluation is not
purely of the programme itself. This should also be considered when drawing
conclusions.
C.13 For employment assistance programmes, we have included participants starting in the
programme between 1 July 2010 and 31 December 2014. These participants’
outcomes are tracked through to 30 June 2015.
C.14 For the investment approach trials we have included participants from the start of the
trial (unless otherwise specified in chapter five). Outcomes are tracked through to 31
October 2015.
C.15 In drawing conclusions from the RoI calculations we are reliant on a number of
factors, including:
Data - We are reliant on the quality of the benefit and cost data used. While we
have applied broad reasonableness checks, this does not rule out the possibility
of quality issues.
Cost model – MSD’s cost model for allocating case management and
administration costs has been used. We have relied on this model without
formally reviewing its construct.
Model risk – Future benefits and costs have been estimated using MSD’s liability
estimator tool. As with any model of future outcomes, there is a risk that the
model is not an adequate representation of the complex, real-life system it
models, and/or a risk of future external changes that materially influence actual
experience e.g. legislative, policy or economic changes.
Comparison group selection – Participants in programmes are compared to
people in randomised control or propensity matched groups. We have relied on
these comparison groups without formally reviewing their derivation. With any
comparison between groups there is the risk that unobserved differences in
profile cause differences in observed experience that are mistakenly attributed to
programme performance.

Page 74 Benefit System Performance Report for the year ended 30 June 2015
Appendix D: Glossary
ACC – Accident Compensation Corporation
AS – Accommodation Supplement
BPS – Better Public Services
CE – Chief Executive
CMHP – Child Material Hardship Package
CYF – Child, Youth and Family
CYF-CP – Child, Youth and Family-Care and Protection
CYF-YJ – Child, Youth and Family-Youth Justice
Corrections – Department of Corrections
DA – Disability Allowance
DCE – Deputy Chief Executive
DPB – Domestic Purposes Benefit
EB – Emergency Benefit
FCA – Flexible Childcare Assistance
FIAA – Fellow of the Institute of Actuaries of Australia
FIA – Fellow of the Institute of Actuaries (UK)
FNZSA – Fellow of the New Zealand Society of Actuaries
GCM – General Case Management
GFC – Global Financial Crisis
HCD – Health Conditions and Disabilities
HNZ – Housing New Zealand
HYEFU – Half-year Economic and Fiscal Update
IDI – Integrated Data Infrastructure
IRRS – Income Related Rent Subsidy
JS – Jobseeker Support
JS-WR – Jobseeker Support-Work Ready
JS-HCD – Jobseeker Support-Health Conditions and Disabilities
MCA – Multi-Category Appropriation
MSD – Ministry of Social Development
NCEA – National Certificate of Educational Achievement
NEET – Not in Education, Employment or Training
NOMB – Not on Main Benefit

Benefit System Performance Report for the year ended 30 June 2015 Page 75
OB – Orphans Benefit
ROI – Return on Investment
SB – Sickness Benefit
SIU – Social Investment Unit
SLP – Supported Living Payment
SPB – Special Benefit
SPS – Sole Parent Support
SUP – Supplementary Benefits Only
TAS – Temporary Additional Support
TFW – Training for Work
UB – Unemployment Benefit
WFCM – Work-Focused Case Management
WSS – Work Search Support
YP – Youth Payment
YPP – Young Parent Payment

Page 76 Benefit System Performance Report for the year ended 30 June 2015
R