2015 assessment growth business case overview … › city-hall › budget-business ›...
TRANSCRIPT

Program Operating Capital Total FTE
ECONOMIC PROSPERITY
Business Attraction and Retention
1 2,950,000 - 2,950,000 -
TOTAL ECONOMIC PROSPERITY 2,950,000 - 2,950,000 -
ENVIRONMENTAL SERVICES
Garbage, Recycling and Composting
2 15,000 - 15,000 -
3 58,000 - 58,000 -
4 187,000 70,000 257,000 0.2
2015 ASSESSMENT GROWTH BUSINESS CASE OVERVIEW
Leaf and Yard Composting (Contracted Service) - Fall leaves and yard materials are expected to increase by approximately 300 tonnes (1.5%) from the addition of new homes.
Recycling Collection (Contracted Service) - An increase of 1,400 curbside stops and 600 multi-residential stops are required to service collection for newly constructed homes.
Garbage Collection - An increase of 1,400 curbside stops and 600 multi-residential stops are required to service collection for newly constructed homes. As a result of this growth, an additional garbage truck is required.
Case
# Service Grouping
Community Improvement - Development Charges Incentive Program - In preparation for the new Development Charges (DC) By-law (August 4, 2014), the policy for financing DC exemptions was revised. Going forward, all former DC exemptions will be provided through “grants” under a Community
Improvement Plan (CIP). Under the new financing approach, funding for DC exemptions is required at the time of building permit. Under the old financing method, funding was required at the time of construction for support projects. Because of the shift in timing, additional funding is required to support the DC exemptions. The budget required to support these grants was based on forecasted growth.
Funding Required for Growth ($)
REQUEST BY SERVICE PROGRAM
_____________________________________________________________________________________________________________________ 2015 Draft Budget for the City of London - December 8, 2014
Page 1161

Program Operating Capital Total FTE
2015 ASSESSMENT GROWTH BUSINESS CASE OVERVIEW
Case
# Service Grouping
Funding Required for Growth ($)
REQUEST BY SERVICE PROGRAM
5 21,000 - 21,000 -
TOTAL ENVIRONMENTAL SERVICES 281,000 70,000 351,000 0.2
PARKS, RECREATION & NEIGHBOURHOOD SERVICES
Neighbourhood & Recreation Services
6 89,000 - 89,000 1.0
7 266,344 179,000 445,344 3.0
8 52,000 - 52,000 -
TOTAL PARKS, RECREATION & NEIGHBOURHOOD SERVICES 407,344 179,000 586,344 4.0
Garbage Disposal - An increase of 1,400 tonnes of waste is expected from growth which requires an increase in the contribution to Sanitary Landfill Reserve Fund for capital costs.
Community Centres - A full time position is required to adequately assist in the planning and coordination of the new Southwest Recreation Centre. Funding is to support this position which is an integral part of the start-up development of the new facility and preparation of new agreements with partners in the project. The position will continue when the new centre opens to support operations.
Parks & Urban Forestry
Parks & Horticulture - Additional resources are required to service new parks, the Thames Valley Parkway (TVP) and horticultural features acquired through growth of new parks totalling approximately 41 hectares.
Urban Forestry (Contracted Service) - Increase of approximately 4,000 new trees planted in new parks, recently assumed subdivisions, infill and for community planning. These new plantings are maintained by Forestry operations.
_____________________________________________________________________________________________________________________ 2015 Draft Budget for the City of London - December 8, 2014
Page 1162

Program Operating Capital Total FTE
2015 ASSESSMENT GROWTH BUSINESS CASE OVERVIEW
Case
# Service Grouping
Funding Required for Growth ($)
REQUEST BY SERVICE PROGRAM
PLANNING & DEVELOPMENT
Development Services
9 89,036 - 89,036 1.0
10 88,250 - 88,250 1.0
TOTAL PLANNING & DEVELOPMENT 177,286 - 177,286 2.0
PROTECTIVE SERVICES
11 110,000 - 110,000 1.0
TOTAL PROTECTIVE SERVICES 110,000 - 110,000 1.0
Development Services - The Official Plan residential intensification policies have generated an additional 10 to 15 new site plan applications per year. Beyond 2014, pent up residential and commercial development within the South West Area Plan (SWAP) is projected to generate increased workload to process minor variances, site plans, consents, condominiums, and subdivisions.
Development Services - Development Approvals requires additional resources to address growth related initiatives such as SWAP, intensification, DC Rate Adjustment, and the "London Plan". Overall, the workload resulting from growth related responsibilities and implementation of planning policies is estimated to require an additional 1,322 engineering liaison and coordination working hours & 425 hours in growth related policy initiatives.
Corporate Security - City of London Corporate Security staff respond to approximately 3,500 incidents per year, growing at about 300+ incidents annually. As a result of the growth in insured city owned locations and an increase in property acquisitions, corporate security has seen a corresponding growth incidents requiring their service.
Corporate Security & Emergency Management
_____________________________________________________________________________________________________________________ 2015 Draft Budget for the City of London - December 8, 2014
Page 1163

Program Operating Capital Total FTE
2015 ASSESSMENT GROWTH BUSINESS CASE OVERVIEW
Case
# Service Grouping
Funding Required for Growth ($)
REQUEST BY SERVICE PROGRAM
TRANSPORTATION SERVICES
Public Transit
12 556,500 1,273,300 1,829,800 10.0
Roadways
13 285,187 458,676 743,863 2.6
14 230,675 - 230,675 2.0
Conventional and Specialized (Contracted Service) Transit Services - Funding for conventional transit (FTE impact 10.0) is required to increase service hours to accommodate growth from population and development. Funding for specialized transit is required to accommodate growth in eligible registrants attributable to population growth and demographic changes.
Roadway Maintenance, Road and Sidewalk Snow Control (Both Contracted and City Supplied Service) - Funding is required to service the increase of 31 lane kms of road and 23 km of sidewalk from assumed subdivisions, warranted sidewalk program, walkways, ditches, boulevards, downtown maintenance and roadside maintenance. Additional funding is required to provide winter control services to those areas. Capital funding required for life cycle renewal costs for added kilometers of road and sidewalk.
Roadway Planning & Design (Both Contracted and City Supplied Service) - The Transportation Growth program enables development by providing the municipal transportation infrastructure required for the resulting additional traffic generation. The average Transportation Growth Program capital expenditure is set to almost double from $23.3 million annually (past five years) to $42.1 million annually in the coming five years. It is anticipated that an additional 5,692 program delivery hours will be required necessitating at least an additional 2.0 FTEs.
_____________________________________________________________________________________________________________________ 2015 Draft Budget for the City of London - December 8, 2014
Page 1164

Program Operating Capital Total FTE
2015 ASSESSMENT GROWTH BUSINESS CASE OVERVIEW
Case
# Service Grouping
Funding Required for Growth ($)
REQUEST BY SERVICE PROGRAM
15 76,800 - 76,800 -
16 13,184 - 13,184 -
17 29,310 - 29,310 -
TOTAL TRANSPORTATION SERVICES 1,191,656 1,731,976 2,923,632 14.6
CORPORATE, OPERATIONAL & COUNCIL SERVICES
Corporate Services
18 378,545 - 378,545 -
TOTAL CORPORATE, OPERATIONAL & COUNCIL SERVICES 378,545 - 378,545 -
5,495,831 1,980,976 7,476,807 21.8
Traffic Signal Maintenance (Contracted Service) - Funding is requested for maintenance and energy costs of traffic signals added to accommodate growth as new subdivision streets are assumed, 2 traffic signals.
Growth Flow Through Costs - As a result of the timing of hiring in 2014, full year funding was not required for FTE's attributable to growth for 2014. With staffing now in place, full year funding is required for 2015.
TOTAL
Street Light Maintenance (Contracted Service) - Funding is requested for maintenance and energy costs of street lights added to accommodate growth as new subdivision streets are assumed, 400 street lights.
School Crossing Guards (Contracted Service) - In accordance with Municipal Council's approved warrant system for mid-block cross walks and intersections, it is anticipated that 3 new crossing guard locations will be added.
_____________________________________________________________________________________________________________________ 2015 Draft Budget for the City of London - December 8, 2014
Page 1165

Assessment Growth Business Case #1
Service Grouping Business Attraction and Retention
Service/Program Community Improvement
Background/Description of Change Implementation of Approved Development Charge Incentive Programs: 2014 Development Charge By-law Exemptions and Community Improvement Plan Grants
1. Background (see additional information below) a) Area Currently Served by Unit of Measure - City-wide
b) Current Cost and Labour for Service or Program Provided
Total (Annual) Operating Cost FT# FTE# $9.8 million Not applicable Not applicable
c) Unit of Measure Cost of Service (Current Cost/Labour divided by Current Area) – Not applicable
d) If this is a Contracted Service, what is the Percentage Contracted Out? – Not applicable
e) Assets Currently Used to Provide Service – Not applicable
2. Request
a) Growth Area by Unit of Measure - City-wide
b) Impact of Growth – Staffing – Not applicable
c) Impact of Growth – Costs
d) Impact on Assets Used to Provide Service – Not applicable
Operating $2.95 million Capital Cost of Incremental Assets $0 Total Growth Request $2.95 million
_____________________________________________________________________________________________________________________ 2015 Draft Budget for the City of London - December 8, 2014
Page 1166

Background
In preparation for the new Development Charges (DC) By-law (August 4, 2014), the policy for financing DC exemptions was revised. DC exemption-type programs will continue to be administered by Building Division (upon application for permit for qualifying development) and tracking will be conducted by Development Finance and Financial Planning and Policy. The Planning Division will report on the efficacy of the Downtown Residential and Industrial DC grant programs.
• Same program, changing the tool:
In September 2013, Council approved the change in tools for accounting for development charge incentives from funding Industrial and Institutional DC exemptions through capital budgets, to a more transparent and equitable method. Going forward, all former DC exemptions will be provided through “grants” under a Community Improvement Plan (CIP) (consistent with approval of the recommendations of the “Strategic Change in Delivery of Development Charge Exemptions and Incentive Policies” – SPPC, August 26, 2013) (see figure below). The change will have the following benefits:
• Improved strategic approach to providing incentives;
• Additional flexibility for program management;
• Enhanced monitoring and improved transparency;
• Program evaluation opportunities and improved accountability; and,
• Establishes equity with private sector timing of funding of investments in growth.
_____________________________________________________________________________________________________________________ 2015 Draft Budget for the City of London - December 8, 2014
Page 1167
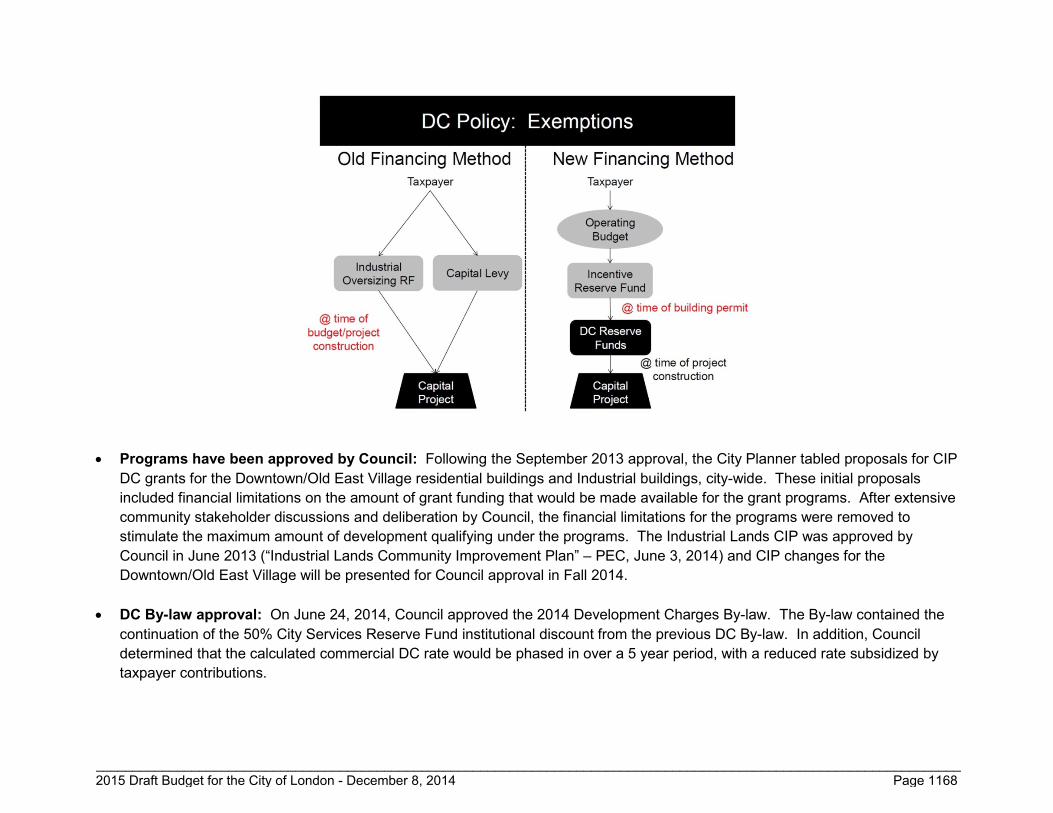
• Programs have been approved by Council: Following the September 2013 approval, the City Planner tabled proposals for CIP DC grants for the Downtown/Old East Village residential buildings and Industrial buildings, city-wide. These initial proposals included financial limitations on the amount of grant funding that would be made available for the grant programs. After extensive community stakeholder discussions and deliberation by Council, the financial limitations for the programs were removed to stimulate the maximum amount of development qualifying under the programs. The Industrial Lands CIP was approved by Council in June 2013 (“Industrial Lands Community Improvement Plan” – PEC, June 3, 2014) and CIP changes for the Downtown/Old East Village will be presented for Council approval in Fall 2014.
• DC By-law approval: On June 24, 2014, Council approved the 2014 Development Charges By-law. The By-law contained the
continuation of the 50% City Services Reserve Fund institutional discount from the previous DC By-law. In addition, Council determined that the calculated commercial DC rate would be phased in over a 5 year period, with a reduced rate subsidized by taxpayer contributions.
_____________________________________________________________________________________________________________________ 2015 Draft Budget for the City of London - December 8, 2014
Page 1168

• DC Act required exemptions: In addition to Council’s development charge incentives, the Development Charges Act requires several exemptions that must be funded by taxpayer-supported contributions. These include the following:
• Buildings owned by a school board; • Municipal buildings; and, • Industrial additions <50% (the City extends this exemption to cover all industrial building additions).
• Budget estimates based on forecasted growth: Staff has based the required funding for this business case on the Council-approved Altus growth forecasts for the industrial and institutional incentives. Funding for the commercial DC rate phase-in is based on space forecasts prepared by the Building Division, which are higher than the Altus commercial space projections (and therefore, reflects a more conservative approach to incentive funding). For the Downtown/Old East Village DC grant, the budget estimates are based on an average annual apartment growth in the Downtown and Old East Village areas over the past 5 years. It should be noted that these budget figures are estimates – the Council-approved direction for the programs requires the City to pay for the DCs for any qualifying development. Therefore, actual cost of the programs will vary, depending on the amount of annual growth in the DC discounted categories – Downtown Residential, Industrial, Institutional, and Commercial. Budget estimates for the programs are as follows:
2015
Growth (Units/sqm)
2015 Budget
2016 Growth
(Units/sqm) 2016
Budget 2017
Growth (Units/sqm)
2017 Budget
2018 Growth
(Units/sqm) 2018
Budget
Industrial DC Incentives 45,855 $7.7 M 45,855 $7.7 M 45,855 $7.7 M 45,855 $7.7 M
Downtown/Old East Village DC Incentives
158 $2.4 M 158 $2.4 M 158 $2.4 M 158 $2.4 M
Institutional DC Incentives 34,977 $3.7 M 34,977 $3.7 M 34,977 $3.7 M 34,977 $3.7 M
Commercial DC Rate Phase-in
18,000 $824 K 18,000 $604 K 18,000 $402 K 18,000 $201 K
Total $14.6 M $14.4 M $14.2 M $14.0 M
These budget figures are not entirely incremental to previous needs. Rather, there is a combination of both:
• A shift in amounts previously funded from taxpayer and water/sewer user rate financing sources that were directed to funding the Industrial, and Institutional exemptions through capital levy and contributions to Industrial Oversizing Reserve Fund;
_____________________________________________________________________________________________________________________ 2015 Draft Budget for the City of London - December 8, 2014
Page 1169

• An increase in the investment in infrastructure to serve Industrial and Institutional development (both in terms of areas being serviced and cost of growth infrastructure);
• An increase in the cost of the program to incent residential development in the Downtown and Old East Village programs.
• If requests for building permits in 2015 exactly match the growth projections included in the DC Background Study, then the Corporation will not be able to transfer the entire required funding to the DC reserve funds in 2015. The shortfall would be $1.85 million. However, given the amount of budgeted capital funding being carried forward, the “lumpy” nature of development and slower than anticipated growth due to challenges in the local economy, Staff are of the opinion that fully funding contributions to the DC incentive reserve funds for 2015 will not be required.
• According to the 2014 DC By-law (section 26.4) and the proposed program guidelines for the Downtown and Old East Community Improvement Plans, the Corporation can delay funding the DC reserve funds for DC exemptions until funding is available. Development Finance and Financial Planning & Policy will monitor the balances and adjust future year contributions to the DC Incentive reserve funds accordingly.
Budget Estimate for DC Incentives: $14.60 M
Capital Funding Through Old Financing Method
(Carry Forward): $9.30 M
Required Contribution to DC Incentive Reserve
Funds: $5.30 M
Assessment Growth Business Case Funding
Request: $2.95 M
Contribution Shortfall (Program Funding Risk):
$2.35 M 2015 Budget Request
_____________________________________________________________________________________________________________________ 2015 Draft Budget for the City of London - December 8, 2014
Page 1170

• There are a number of factors that confound comparison of this budget request to previous budgets:
• Industrial CIP Grants/DC exemption (as outlined in the Industrial Lands CIP PEC Report):
• The previous funding approach paid for the growth share of industrial capital projects at the time of construction. Several of the City’s industrial parks were developed many years before building construction occurred; as such, major investments were made in previous years as “upfront” costs associated with the DC exemption, with fewer major industrial infrastructure projects constructed in recent years. Reductions in contributions to capital levy should be apparent. Going forward, the City’s contributions towards incenting industrial growth will coincide with when industrial building construction occurs.
• Industrial infrastructure projects benefitted from grants/stimulus funding from senior governments over the past five years. The 2014 DC rate calculations did not include any certainty of similar grants for future industrial projects. Costs for growth incentives would be reduced in the long term, should the City receive funding from senior levels of government.
• Estimates of the cost of the previous industrial exemption program costs (provided in the Industrial CIP Report to PEC) do not include all taxpayer-supported debt associated with these projects, some of which is still outstanding. As these debt obligations are extinguished, tax supported debt payments will decline, resulting in favourable impacts on future budgets. In contrast, the CIP grant based on the industrial DC rate already includes costs associated with debt that was incorporated into the industrial DC rate calculations.
• The projected cost of the DC grant program reflects increased construction costs associated with major roads, sanitary sewers, stormwater management facilities, etc. Additionally, future industrial growth is anticipated in areas of the city lacking full municipal services, resulting in high costs of extending these services.
_____________________________________________________________________________________________________________________ 2015 Draft Budget for the City of London - December 8, 2014
Page 1171

• Downtown/Old East Village CIP grants: • This is the only part of the program that can be directly compared to previous contributions, as the basis for
funding the exemptions in this DC exemption area remains unchanged. • The provision for funding for this part of the program will have increased over the previous year for two reasons: • Increased DC rate: Development charge rates for one and two bedroom apartment buildings have increased since
the previous DC Study; as a result, the program costs will increase. • Increased volume: Strong interest is anticipated for residential development in the Downtown and Old East Village
as a result of changing demographics and market interest in this area.
• Institutional DC discount: • Like the funding of the Industrial share of growth works, growth costs associated with the institutional DC discounts
in the previous DC By-law are difficult to determine based on the method of financing the incentive (payment of institutional growth share for capital projects).
• The new basis of accounting for growth costs represents a paradigm shift. There is no “apples to apples” comparison of past Institutional exemption costs and this budget provision for a contribution to a reserve fund.
• Commercial DC rate phase-in: • The commercial rate phase-in is a completely new program that did not exist in the previous DC By-law. It is a
new program that requires new funding.
• In summary: • This initiative is the result of already approved changes to how the City accounts for exemptions and discounts in
the funding of its growth program. • This budget provision is for a contribution to reserve funds. The funds will only be spent if the incentive programs
have their desired effects of incenting development in the various target areas (Downtown Residential, Industrial, Institutional and Commercial development).
• This program represents a paradigm shift in how the City accounts for the cost of growth for types of development that are exempted or discounted from paying development charges. There is no basis for an “apples to apples” comparison of this contribution and the past basis of budgeting for growth costs associated through individual capital budgets, which exempted and discounted growth.
_____________________________________________________________________________________________________________________ 2015 Draft Budget for the City of London - December 8, 2014
Page 1172

• Improved performance measurement: In the past, the City has not had performance measures associated with its DC exemptions. This is one of the principal reasons for moving from DC exemptions to Community Improvement Plan grants. The recently approved Industrial CIP contains a requirement for staff to report annually to Council on the following measures:
• Number of applications; • DC grant amount ($); • Value of construction project ($); • Hectares of land development/redeveloped; • Square footage of industrial space created by type and sector; • Increase in assessed value of participating property; and, • Increase in municipal and education property taxes of participating property.
As the CIPs are completed for the remaining DC exemptions, performance measures and reporting will be similarly introduced to better inform Council and the public of the results of their investment in incenting desired forms of development. Business cases in future years will provide results associated with the performance measures for the CIP DC grant programs. In the absence of performance measures, staff will report on the cost of the program and quantity of development supported (i.e., for Institutional and Commercial development discounts).
• Risk of underfunding the program: The DC incentive programs are open-ended obligations to pay the value of DCs for
qualifying development (e.g., new industrial buildings, residential units in the Downtown, commercial rate phase-in, etc.). Staff have used the best available data to estimate anticipated growth and the resulting program costs. If the DC incentive programs are underfunded, however, there is risk that a post-budget approval financing source will need to be located to pay for subsidized development charges. At the same time however, depletion of the existing reserve fund would be an indication of a vibrant economic response to the incentives.
• Implications of exceeding the growth forecast: Although the growth forecast is an annual straight line forecast, growth
benefiting from these programs tends to be “lumpy” in nature. There are likely to be years with large amounts of development, followed by years that have limited activity. The annual contributions to the reserve funds should result in a build-up of funding in order to cover costs associated with peak program demand years. Should growth continue to exceed the forecast, however, additional post-budget approval financing sources will be required to cover the City’s obligation to pay for DCs for qualifying forms of development.
_____________________________________________________________________________________________________________________ 2015 Draft Budget for the City of London - December 8, 2014
Page 1173

Assessment Growth Business Case #2
Service Grouping Garbage, Composting and Recycling
Service/Program Leaf and Yard Composting
Background/Description of Change The City collects yard materials and fall leaves from homes. These materials can also be dropped off at the EnviroDepots. The amount of these materials is expected to grow by 1% to 2% per year based on both the natural vegetative growth within the city and as new homes are constructed. These materials are composted under contract.
1. Background a) Area Currently Served by Unit of Measure
Composting of yard materials and fall leafs is provided to 119,000 curbside homes. Approximately 18,000 tonnes of material are composted annually.
b) Current Cost and Labour for Service or Program Provided
Total (Annual) Operating Cost FT# FTE#
$1,437,000 (excluding collection) 2 2.0
c) Unit of Measure Cost of Service (Current Cost/Labour divided by Current Area)
Unit of Measure Cost Unit of Measure FTE
$50 per tonne (contracted price) Not applicable
d) If this is a Contracted Service, what is the Percentage Contracted Out? 90% of this service is contracted out.
e) Assets Currently Used to Provide Service None
_____________________________________________________________________________________________________________________ 2015 Draft Budget for the City of London - December 8, 2014
Page 1174

2. Request
a) Growth Area by Unit of Measure Yard materials and fall leaves are expected to increase approximately 300 tonnes (1.5% of 18,000 tonnes) in 2015. Composting of yard materials and fall leaves is a contracted service. Contracted price is approximately $50 per tonne for yard materials and fall leaves.
b) Impact of Growth - Staffing
Staffing FT# Staffing FTE# Staffing FTE $
0 0 $0
c) Impact of Growth – Costs
Operating (Growth area x unit of measure cost of service) $15,000 Capital Cost of Incremental Assets Not applicable Total Growth Request $15,000
d) Impact on Assets Used to Provide Service Not applicable
_____________________________________________________________________________________________________________________ 2015 Draft Budget for the City of London - December 8, 2014
Page 1175

Assessment Growth Business Case #3
Service Grouping Garbage, Composting and Recycling
Service/Program Recycling Collection
Background/Description of Change Every year collection of recyclables must be expanded to include newly constructed homes that receive curbside collection and multi-residential units that receive multi-residential collection. These materials are collected under contract.
1. Background a) Area Currently Served by Unit of Measure
Currently providing recycling collection to 119,000 curbside collection stops and 52,000 multi-residential collection stops.
b) Current Cost and Labour for Service or Program Provided
Total (Annual) Operating Gross Cost FT# FTE# $5,050,000 0 0
c) Unit of Measure Cost of Service (Current Cost/Labour divided by Current Area)
Unit of Measure Cost Unit of Measure FTE
$37 per curbside stop and $10.80 per multi-residential unit Not applicable
d) If this is a Contracted Service, what is the Percentage Contracted Out? 100% of this service is contracted out.
e) Assets Currently Used to Provide Service None
_____________________________________________________________________________________________________________________ 2015 Draft Budget for the City of London - December 8, 2014
Page 1176

2. Request
a) Growth Area by Unit of Measure Expect to add approximately 1,400 curbside stops and 600 multi-residential stops in 2015. Contracted price for collection is $37.00 per curbside stop and $10.80 per multi-residential stop.
b) Impact of Growth - Staffing
Staffing FT# Staffing FTE# Staffing FTE $
0 0 $0
c) Impact of Growth – Costs
Operating (Growth area x unit of measure cost of service) $58,000 Capital Cost of Incremental Assets Not applicable Total Growth Request $58,000
d) Impact on Assets Used to Provide Service Not applicable
_____________________________________________________________________________________________________________________ 2015 Draft Budget for the City of London - December 8, 2014
Page 1177

Assessment Growth Business Case #4
Service Grouping Garbage, Composting and Recycling
Service/Program Garbage Collection
Background/Description of Change Every year collection of garbage, yard materials and fall leaves must be expanded to include newly constructed homes that receive curbside collection and multi-residential units that receive multi-residential collection. These materials are primarily collected by City forces.
1. Background a) Area Currently Served by Unit of Measure
Currently providing garbage collection to 119,000 curbside collection stops and 52,000 multi-residential collection stops.
b) Current Cost and Labour for Service or Program Provided
Total (Annual) Operating Cost FT# FTE#
$7,760,000 62 74.7
c) Unit of Measure Cost of Service (Current Cost/Labour divided by Current Area)
Unit of Measure Cost Unit of Measure FTE
$43 per curbside stop and $33 per multi-residential unit 2,300 housing units per FTE
d) If this is a Contracted Service, what is the Percentage Contracted Out? 3% of this service is contracted out.
e) Assets Currently Used to Provide Service Garbage collection vehicles.
_____________________________________________________________________________________________________________________ 2015 Draft Budget for the City of London - December 8, 2014
Page 1178

2. Request
a) Growth Area by Unit of Measure Expect to add approximately 1,400 curbside stops and 600 multi-residential stops in 2015. The incremental additional cost of adding one curbside stop is estimated to be $43 and adding one multi-residential stop is $33.
An additional garbage truck is added to the fleet on a periodic basis in order to service new stops. It has been over ten years since the garbage truck fleet has been expanded. Funds were initially set aside to purchase a rear load packer in 2008. Purchase of the rear load packer was delayed because of optimization of the curbside collection system. The number of overhead loading packers will need to be increased in 2015 because of growth in multi-residential collection. Additional funds ($70,000) are required because overhead loading packers are more expensive than rear load packers and inflation has increased the costs of all trucks
b) Impact of Growth - Staffing
Staffing FT# Staffing FTE# Staffing FTE $
0 0.2 $20,000
c) Impact of Growth – Costs
Operating (Growth area x unit of measure cost of service) $ 80,000 $107,000 internal rental rate
Capital Cost of Incremental Assets $ 70,000 Total Growth Request $257,000
d) Impact on Assets Used to Provide Service Additional packer added to fleet.
_____________________________________________________________________________________________________________________ 2015 Draft Budget for the City of London - December 8, 2014
Page 1179

Assessment Growth Business Case #5
Service Grouping Garbage, Composting and Recycling
Service/Program Disposal at W12A
Background/Description of Change Every year long term disposal capacity requirements increase because of newly constructed homes that receive curbside collection, multi-residential units that receive multi-residential collection and waste from City operations serving these areas (e.g., more street sweepings). There is a need to increase the contribution to the Sanitary Landfill Reserve Fund to cover capital costs associated with this growth.
1. Background a) Area Currently Served by Unit of Measure
Currently providing garbage disposal services to 119,000 curbside collection stops and 52,000 multi-residential collection stops. Each year approximately 2,000 stops are added which generate about 1,000 tonnes of garbage (0.5 tonnes of garbage per stop). City operations typically bring approximately 35,000 tonnes of waste to the landfill each year and is expected to grow about 400 tonnes per year (1.2% per year).
b) Current Cost and Labour for Service or Program Provided
Total (Annual) Capital Cost FT# FTE#
Varies Not applicable Not applicable
c) Unit of Measure Cost of Service (Current Cost/Labour divided by Current Area)
Unit of Measure Cost Unit of Measure FTE
$15 per tonne Not applicable
d) If this is a Contracted Service, what is the Percentage Contracted Out? 100% of the capital projects at the W12A landfill are contracted out. 65% of the operating budget is expended on contracted or private services at the landfill.
_____________________________________________________________________________________________________________________ 2015 Draft Budget for the City of London - December 8, 2014
Page 1180

e) Assets Currently Used to Provide Service The cost to replace capacity at the W12A landfill and cover long term perpetual care costs is estimated to be $15 per tonne.
2. Request
a) Growth Area by Unit of Measure Growth in the City is expected to add approximately 1,400 tonnes of waste in 2015 and require an increase in contributions to the Sanitary Landfill Reserve Fund of $21,000 (1,400 tonnes X $15/tonne). Operating costs are not impacted by this small amount of waste that arrives (i.e., the amount of 5 or 6 tonnes per day) is absorbed into the existing operations therefore no increase in operating dollars are required, rather a contribution to the reserve fund is required.
b) Impact of Growth - Staffing
Staffing FT# Staffing FTE# Staffing FTE $ 0 0 $0
c) Impact of Growth – Costs
Operating (Growth area x unit of measure cost of service) $21,000 Capital Cost of Incremental Assets $0 Total Growth Request $21,000
d) Impact on Assets Used to Provide Service Growth in City has been taken into account when estimating remaining life of landfill.
_____________________________________________________________________________________________________________________ 2015 Draft Budget for the City of London - December 8, 2014
Page 1181

Assessment Growth Business Case #6
Service Grouping Neighbourhood & Recreation Services
Service/Program Community Centres
Background/Description of Change A full time position is required to adequately assist in the planning and coordination of the new recreation centre planned for southwest London (RC2755). Land has now been acquired and planning work begins in late Fall of 2014. This position will be an integral part of the start-up development of the new facility that is required in preparation of the opening of the facility. Preparations include: design planning; public consultations; programming research and design; negotiated agreements with partners in the project. The position will continue when the new centre opens to support operations – that specific role being shaped by what management/operational model the City chooses to pursue for the Facility.
1. Background a) Area Currently Served by Unit of Measure
One full time position is required to support operations for each Recreation Centre as well as start-up development of the new facility.
b) Current Cost and Labour for Service or Program Provided
Total (Annual) Operating Cost FT# FTE# Not applicable Not applicable Not applicable
c) Unit of Measure Cost of Service (Current Cost/Labour divided by Current Area)
Unit of Measure Cost Unit of Measure FTE $89,000 (including salary/benefits) 1.0 FTE
_____________________________________________________________________________________________________________________ 2015 Draft Budget for the City of London - December 8, 2014
Page 1182

d) If this is a Contracted Service, what is the Percentage Contracted Out? This is not a contracted service.
e) Assets Currently Used to Provide Service Office space, equipment, furniture, computer. This position will support the new Centre when it is fully operational and this specific role will be shaped by what management/operational model the City chooses to pursue for the Facility
2. Request
a) Growth Area by Unit of Measure
i. The need for a multi-functional South West (SW) Recreation Facility was first identified in the 2003 Parks and Recreation Strategic Master Plan as a short-term priority and re-affirmed in the 2009 Master Plan.
ii. Currently there is no indoor swimming pool or larger scale community centre gym and community space complex serving the southwest sector of the City. The Master Plan also calls for the retirement or redevelopment of two current pads of ice in favour of adding a double pad arena as a component of the SW Recreation Centre.
iii. This complex facility as conceived will merge pool, gyms, community space, arena with other co-located services as required to serve as both a district destination facility and a local community gathering place.
iv. This position will support planning for the facility including participation in facility design, functional plan development, partnership building, sponsorship explorations, programming plans and public consultations. In 2015, this position will be significantly involved in the facility design process informed by functional plan work, the researching transportation/accessibility options, and expected programs and services. This position will also be instrumental in discussions/planning with potential partners around operational agreements and will help support any sponsorship opportunities arising from the project. As time moves on in the pre-opening phase of the building (an opening in 2016 is the Master Plan goal), this position will be engaged in: operational budget development; detailed program plans (recreation programs, rental opportunities, community access plans, special events etc.); detailed operational plans including plans for cleaning. Nearer to opening this position will participate in grand opening planning, marketing strategies to promote opportunities at the facility, and participate in the ongoing management of the facility (either directly - if operated by the City; or as a liaison with the managing ‘partner’ – if such an arrangement is negotiated.
v. It should be noted that planning and preparations for the South East Recreation Centre, will be following closely after development of the SW Centre.
_____________________________________________________________________________________________________________________ 2015 Draft Budget for the City of London - December 8, 2014
Page 1183

b) Impact of Growth - Staffing
Staffing FT# Staffing FTE# Staffing FTE $
1.0 1.0 $89,000
c) Impact of Growth – Costs
Operating (Growth area x unit of measure cost of service) $89,000 Capital Cost of Incremental Assets $0 Total Growth Request $89,000
d) Impact on Assets Used to Provide Service
This position requires a workstation, computer/software and associated furniture.
_____________________________________________________________________________________________________________________ 2015 Draft Budget for the City of London - December 8, 2014
Page 1184

Assessment Growth Business Case #7
Service Grouping Parks & Urban Forestry
Service/Program Parks & Horticulture
Background/Description of Change The current budget for parks property management is based upon a service level frequency achieved in the 2014. In order to maintain the 2014 level of service additional resources are required to service new parks, Thames Valley Parkway and horticultural features acquired through growth and council approved capital projects. A total of 41 hectares (Ha) have been added to the system across the city. Any increase to the amount of maintained park property acquired through growth without the respective funding will erode the current service levels throughout the city.
1. Background a) Area Currently Served by Unit of Measure
1015 Ha of Maintained Parkland b) Current Cost and Labour for Service or Program Provided
Total (Annual) Operating Cost FT# FTE#
$5,850,954 Not applicable 55.83
c) Unit of Measure Cost of Service (Current Cost/Labour divided by Current Area)
Unit of Measure Cost Unit of Measure FTE $5,764 18.18
d) If this is a Contracted Service, what is the Percentage Contracted Out?
This is not a contracted service.
_____________________________________________________________________________________________________________________ 2015 Draft Budget for the City of London - December 8, 2014
Page 1185

e) Assets Currently Used to Provide Service Internal fleet resources will be increased to account for the additional property management expenses.
2. Request
a) Growth Area by Unit of Measure 41 Ha, plus operational costs of capital projects (horticultural roadway planters) previously approved by council.
b) Impact of Growth - Staffing
Staffing FT# Staffing FTE# Staffing FTE $
0 3.00 $130,609
c) Impact of Growth – Costs
Operating (Growth area x unit of measure cost of service) $236,344+$30,000=$266,344 Capital Cost of Incremental Assets $179,000 Total Growth Request $445,344
d) Impact on Assets Used to Provide Service
Increase in fleet capacity for park maintenance and horticulture maintenance.
_____________________________________________________________________________________________________________________ 2015 Draft Budget for the City of London - December 8, 2014
Page 1186
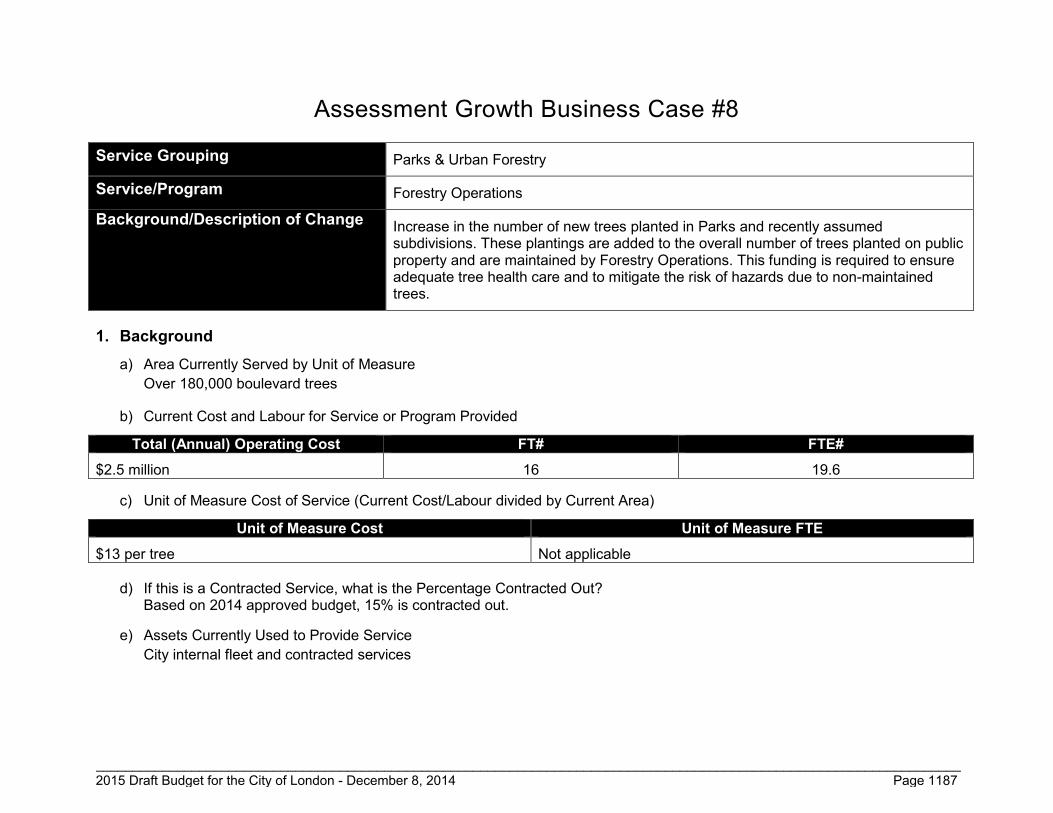
Assessment Growth Business Case #8
Service Grouping Parks & Urban Forestry
Service/Program Forestry Operations
Background/Description of Change Increase in the number of new trees planted in Parks and recently assumed subdivisions. These plantings are added to the overall number of trees planted on public property and are maintained by Forestry Operations. This funding is required to ensure adequate tree health care and to mitigate the risk of hazards due to non-maintained trees.
1. Background a) Area Currently Served by Unit of Measure
Over 180,000 boulevard trees
b) Current Cost and Labour for Service or Program Provided
Total (Annual) Operating Cost FT# FTE#
$2.5 million 16 19.6
c) Unit of Measure Cost of Service (Current Cost/Labour divided by Current Area)
Unit of Measure Cost Unit of Measure FTE
$13 per tree Not applicable
d) If this is a Contracted Service, what is the Percentage Contracted Out? Based on 2014 approved budget, 15% is contracted out.
e) Assets Currently Used to Provide Service City internal fleet and contracted services
_____________________________________________________________________________________________________________________ 2015 Draft Budget for the City of London - December 8, 2014
Page 1187

2. Request
a) Growth Area by Unit of Measure 4,000 trees – 400 for new subdivisions, 2000 infill, 1100 EAB, 300 for new parks and 200 estimated for community planning
b) Impact of Growth - Staffing
Staffing FT# Staffing FTE# Staffing FTE $ Not applicable Not applicable Not applicable
c) Impact of Growth – Costs
Operating (Growth area x unit of measure cost of service) $52,000 Capital Cost of Incremental Assets $0 Total Growth Request $52,000
d) Impact on Assets Used to Provide Service
Contracted services
_____________________________________________________________________________________________________________________ 2015 Draft Budget for the City of London - December 8, 2014
Page 1188

Assessment Growth Business Case #9
Service Grouping Development Services
Service/Program Development Services
Background/Description of Change Hiring of Additional Full Time (FT) Position
1. Background
a) Area Currently Served by Unit of Measure
Development Services processes applications and implements municipal servicing and design standards for Planning Act processes in the City of London including: plans of subdivision and subdivision agreements; site plan applications and development agreements; condominium applications; consent applications; minor variance applications; and boulevard parking applications.
This budget request is for one (1) additional FT position in the Development Services unit of Development & Compliance Services, to meet increased development related activity expected for 2015 and beyond.
Planning initiatives are expected to increase application volumes and Development Planning workload in 2015 and beyond:
• Processing site plan applications and development agreements for residential intensification proposals (including single detached, semi-detached and duplex dwellings), initiated as a result of revised policies in Official Plan Amendment 438. For some applications, this includes public site plan meetings and reports to Planning and Environment Committee. The Official Plan (OP) residential intensification policies have generated an additional 10 to 15 new site plan applications per year. This level of activity is expected to continue since intensification is promoted in the Official Plan as a means of encouraging the efficient use of land and compact urban form.
• Approval of the Southwest Area Plan (SWAP) by the Ontario Municipal Board on April 29, 2014, which establishes land use designations and policies to guide future development applications in the southwest area of the City. The SWAP encompasses approximately 2,700 hectares including a substantial area where development was previously constrained by an “Urban Reserve” designation and zoning. This area is now designated for various forms of development and the volume of Planning applications is expected to increase significantly as a result of SWAP coming into force and effect.
_____________________________________________________________________________________________________________________ 2015 Draft Budget for the City of London - December 8, 2014
Page 1189

The new land use designations will facilitate development on approximately 850 hectares that was previously designated and zoned Urban Reserve.
Currently, all applications for draft plan of subdivision approvals, condominium approvals, consents, minor variances and site plans are administered, under management direction, by a complement of four (4) Senior Planners, two (2) Planner II’s, two (2) Landscape Planners and two (2) Site Plan Officers, each working 1700 hours annually.
Total (Annual) Operating Cost FT# FTE# $3,751,000 48 49.5
b) Unit of Measure Cost of Service (Current Cost/Labour divided by Current Area)
Unit of Measure Cost Unit of Measure FTE
$85,336 (including salary/benefits/overhead) 1700 hours
c) If this is a Contracted Service, what is the Percentage Contracted Out? This is not a contracted service.
d) Assets Currently Used to Provide Service Office space, equipment, furniture, computer, memberships…etc.
2. Request
a) Growth Area by Unit of Measure
The OP residential intensification policies have generated an additional 10 to 15 new site plan applications per year or 120 person hours.
Beyond 2014, pent up residential and commercial development within SWAP is projected to generate an increase over and above current application activity levels. While the level of activity will vary from year to year based on economic conditions and other factors, the projected average annual increase in the number of applications generated each year (above current levels) is identified on the following page:
_____________________________________________________________________________________________________________________ 2015 Draft Budget for the City of London - December 8, 2014
Page 1190

Planning Process Expected Increase Average Time per application:
Increased Workload
Minor Variance 12 new applications 4 hours 48 person hours Site Plan (intensification) 12 new applications 10 hours 540 person hours Site Plan (standard) 45 hours Consents 5 new applications 21 hours 105 person hours Condominiums 3 new applications 35 hours 105 person hours Subdivisions 5 new applications 210 hours 1050 person hours
The volume of additional work that is expected to be generated as a result of SWAP will require a minimum of one additional full time position (1848 hours) to ensure that application processes are maintained in a timely, professional manner, and within the statutory timelines prescribed under the Planning Act.
b) Impact of Growth – Staffing
Staffing FT# Staffing FTE# Staffing FTE $ 1 1.0 $82,536 (including salary of $64,406 and
benefits of $18,130)
c) Impact of Growth – Costs
Operating (Growth area x unit of measure cost of service) $82,536 Work station, computer & associated furniture: PC - $1,100 Phone - $250 Desk, overhead - $4,000 Chair - $600 Software - $550 Total (one-time) cost: $6,500
Capital Cost of Incremental Assets $0 Total Growth Request
$89,036
d) Impact on Assets Used to Provide Service
This position requires a workstation, computer/software and associated furniture.
_____________________________________________________________________________________________________________________ 2015 Draft Budget for the City of London - December 8, 2014
Page 1191

Assessment Growth Business Case #10
Service Grouping Development Services
Service/Program Development Services
Background/Description of Change Create new full time (FT) position in the existing EIT Program in Development Services
1. Background
This budget request is in response to expanding development activity expected for 2015 and beyond combined with a strategic push to provide a high level of service for future growth applications. A FT position will provide cost-effective engineering coordination and liaison support to the existing two Development Engineering Managers to help manage expected increases in workload and achieve expectations for level of service for development approvals.
This Business Case requests the necessary funding to support an additional FT position located in the Development Services Division. The Managing Director of Engineering Services has been consulted on this proposal and there is support to incorporate this new FT position into the existing Engineering-In-Training Program to allow future engineers to rotate through the Development Services Division. The position would be filled on a full-time basis with a new FT rotating into the position every 9 to 12 months.
While an additional FT position is intended to provide additional engineering support to the existing two engineering managers, there are numerous big-picture secondary benefits to Development Services and the corporation. This proposal will provide future engineers with valuable exposure to the pressures and priorities unique to managing development related issues. The benefits of this proposal will be observed across service areas, including:
• improved divisional understanding of Development Services’ role as the face of development; • improved understanding of approval process and the points where divisional comments are critical to establish an
approval framework; • improved divisional trust to support Development Services advancing applications based on established approval
framework;
_____________________________________________________________________________________________________________________ 2015 Draft Budget for the City of London - December 8, 2014
Page 1192

• building better working relationships between Development Services and the engineering divisions; and • supporting corporate succession planning as staffing forecasts indicate the City will experience numerous engineering
retirements starting within the next few years.
The engineering work undertaken in Development Services touches on all of the servicing and planning disciplines with a need to see the bigger picture and ensure development infrastructure in the City is well-integrated and sustainable; excellent experience for any engineer seeking a successful career with the City of London.
a) Area Currently Served by Unit of Measure The files managed in Development Services represent applications under the Planning Act, and while our planning staff act as the custodian for files, there is a significant component of in house engineering support required to successfully advance files to approval. Presently, the engineering coordination and liaison function is managed by two Engineering Managers. Under existing conditions, these two managers maintain a significant workload between leading engineering review teams, dealing with file issues, and managing staffing matters as well as their own portfolios of growth related policy initiatives. Current Measure of Service:
2 full time Engineering Managers = 1,700 hours x 2 = 3,400 hours
75% = Current Engineering Manager hours applied to development applications = 2,550 hours
25% = Approximate time absorbed by growth related policy initiatives = 850 hours
b) Current Cost and Labour for Service or Program Provided
Total (Annual) Operating Cost FT# FTE# $3,751,000 48 49.5
c) Unit of Measure Cost of Service (Current Cost/Labour divided by Current Area)
Unit of Measure Cost Unit of Measure FTE
$84,800 (salary/fringe/overhead) 1700 hours
_____________________________________________________________________________________________________________________ 2015 Draft Budget for the City of London - December 8, 2014
Page 1193

d) If this is a Contracted Service, what is the Percentage Contracted Out? No component of this service is contracted out.
e) Assets Currently Used to Provide Service Office space, equipment, furniture, vehicle, professional memberships…etc. (not included in value noted above)
2. Request
a) Growth Area by Unit of Measure
Growth is not exclusively related to land expansion. Pressures to support growth have continued to increase even though there has been little expansion to Urban Growth Boundary. Contributing factors to increased strain on development approvals include:
• SWAP: The recently OMB approved Southwest Area Plan has now established new land use designations for various forms of development previously constrained by an “Urban Reserve” designation and zoning. This will facilitate a wave of greenfield development applications by developers anxious to take advantage of newly designated land uses. (approximately 850 ha now designated for various forms of development)
• Intensification: A call for infill and intensification within the Built Area through Provincial policy and revised policies associated with OP Amendment 438 have resulted in an increase in the number of site plan applications and development agreements per year. This level of activity is expected to continue as intensification is promoted in the new draft OP Update “The London Plan” as a means of encouraging efficient use of land and compact urban form.
• DC Rate Adjustment: Approval of the 2014 DC Background Study with a 5yr stepped implementation of the increased commercial DC rate anticipated to drive increased pressure for commercial site plans over the next few years as applicants rush to beat rate increases.
• “The London Plan”: This plan represents a major shift in planning policy context and will require changes in the implementation of future processes.
Compiled, these factors create a need for additional staffing just to maintain a consistent level of service expected from Council and the industry. The table on the following page outlines the engineering management hours associated with providing engineering coordination, liaison and support for the increase in development applications associated with the above growth factors.
_____________________________________________________________________________________________________________________ 2015 Draft Budget for the City of London - December 8, 2014
Page 1194

Application Types Expected Increases Avg. Time per Application Increased workload
Subdivisions 5 new applications 185 hours 925 hours Site Plans (standard) 12 new applications 25 hours 300 hours Site Plans (intensification) 10-15 new applications 2 hours 30 hours Consents 5 new applications 2 hours 10 hours Condominiums 3 new applications 15 hours 45 hours Minor Variance 12 new applications 1 hour 12 hours
Overall, the workload resulting from growth related new responsibilities and implementation of planning policy is estimated to require an additional 1,322 engineering liaison and coordination working hours. The FT position will also contribute approximately 25% of their time to working on growth related policy initiatives equating to approximately 425 hours. Therefore, the total hours required to respond to the increase growth related workload (1,747 hours) exceeds that of a full time position.
b) Impact of Growth - Staffing
Staffing FT# Staffing FTE# Staffing FTE $ 1 1.0 $82,000 (Salary + Fringe)
c) Impact of Growth – Costs
Operating (Growth area x unit of measure cost of service)
$82,000 work station, computer & associated furniture: PC - $900 Phone - $225 Desk, overhead - $4,000 Chair - $600 Software - $525 Total one-time cost $6,500
Capital Cost of Incremental Assets $0 Total Growth Request $88,250
d) Impact on Assets Used to Provide Service This new position triggers requirement for additional workstation.
_____________________________________________________________________________________________________________________ 2015 Draft Budget for the City of London - December 8, 2014
Page 1195

Assessment Growth Business Case #11
Service Grouping Corporate Security & Emergency Management
Service/Program Security Management
Background/Description of Change Additional Full Time position required for Corporate Security
1. Background
a) Area Currently Served by Unit of Measure
• City of London Corporate Security staff responds to approximately 3,500 incidents per year. The chart below provides the yearly totals for the last 3 years plus what is projected in 2014. There has been a steady increase in the number of incidents per year and security staff is not able to respond to all incidents due to this growth in volume. Additional analysis and review of incidents has not occurred to determine trends, preventative measures and loss prevention. There has been an increased number of reported incidents as a result of the R Zone policy. This has increased awareness for both staff and the public in relation to appropriate conduct within our facilities which is positive however there is increased work associated to this.
2011 2012 2013 2014 estimate Number of Incidents
2,490 3,010 3,623 4,000
Increase in incidents from previous year
520 613 377
• At the end of November, 2013, the City owned approximately 11,700 acres of land. Since then an additional 219 acres has been added for growth of approximately 1.9%. Staff are currently working on additional acquisitions which would bring the total increase in acreage since 2013 to 2.3%. This increase in property acquisitions relates to increased requests for security.
_____________________________________________________________________________________________________________________ 2015 Draft Budget for the City of London - December 8, 2014
Page 1196

• The table below compares the number of insured locations the City had in the year 2000 compared to what the City has in 2014. Over the 15 year period, the amount of insured locations grows by approximately 5 locations per year.
2000 2014 Number of Insured Locations
261 340
This full time position will be responsible for gathering and researching allegations of unlawful acts or wrongful activities against Corporate assets, property and information and unlawful acts or activities which occur on City property or result in a loss to the Corporation. The position will prepare complete reports on the results of investigations; perform analysis of incidents which occur on City property; assist in the development of strategies, policies and procedures to reduce future occurrences; liaise with and provide assistance to the London Police and other Police agencies as deemed appropriate and necessary; assist in the initiation of crime prevention and awareness programs; conduct security reviews of Corporate facilities on a regular basis; make recommendations for changes to security systems and procedures including the full financial implications of the recommended changes and assist in developing security policies and procedures; review and provide advice on security systems and on building design and construction or modification in order to maximize protection through reducing opportunities for crime; conduct investigations of breaches of security for the purpose of upgrading security systems; assist in conducting of training programs for City staff on crime prevention and awareness; liaise with appropriate Police authority to ensure protection of visiting dignitaries; respond as required to emergencies such as fire, bomb threats and hostile acts which occur on City owned or leased property; maintain comprehensive records on all investigations and other activities related to the performance of duties ensuring confidentiality of all information obtained; submit reports on security and investigative activities for higher authorities as directed; participate on Corporate committees on security matters as required; perform other duties as assigned.
b) Current Cost and Labour for Service or Program Provided
Total (Annual) Operating Cost FT# FTE# $1,340,616 6 6.0
c) Unit of Measure Cost of Service (Current Cost/Labour divided by Current Area)
Unit of Measure Cost Unit of Measure FTE $110,000 396 incidents
_____________________________________________________________________________________________________________________ 2015 Draft Budget for the City of London - December 8, 2014
Page 1197

d) If this is a Contracted Service, what is the Percentage Contracted Out? 45.4% which relates to the Guard Services contract.
e) Assets Currently Used to Provide Service Sharing of City owned vehicle.
2. Request
a) Growth Area by Unit of Measure Based on current trend, number of incidents has been steadily increasing each year. In 2010, 6 staff attended 2,376 incidents which equates to 396 incidents per person. Based on 2014 estimates, one person would be responding to 667 incidents.
b) Impact of Growth - Staffing
Staffing FT# Staffing FTE# Staffing FTE $ 1 1.0 $110,000
c) Impact of Growth – Costs
Operating (Growth area x unit of measure cost of service) $110,000 Capital Cost of Incremental Assets $0 Total Growth Request $110,000
d) Impact on Assets Used to Provide Service
Not applicable.
_____________________________________________________________________________________________________________________ 2015 Draft Budget for the City of London - December 8, 2014
Page 1198

Assessment Growth Business Case #12
Service Grouping Public Transit (London Transit Commission)
Service/Program London Transit Commission – Conventional and Specialized Transit Services
Background/Description of Change Increase in service hours to address the growth in the transit system. Additional funding is required to provide service hours to conventional and specialized services.
1. Background a) Area Currently Served by Unit of Measure
The conventional transit system has an estimated 200,000 service hour deficit. The deficit reflects the impact of the service hour growth not keeping pace with the population growth, development (redevelopment) within the existing service area as well as new growth areas, and the migration to transit, evidenced by transit mode share going from 7% in 2004 to 12.5% in 2010-11 for an increase in 78%.
The annual service hours provided by the system in 2014 are equal to the number of service hours provided in 1990, when London covered an area approximately 62% of the current size, the population was 300,000 versus the current 375,000 and ridership was 18 million vs. the current 24 million. A by-product of the service deficit is the significant decline in service quality dealing with schedule adherence, overcrowding and missed passengers given there is no room on the bus.
The specialized transit service has experienced significant growth in registrants, directly attributable to demographic changes and population growth. The growth in eligible registrants is currently averaging 10% per year. Service growth has not kept pace with registrant growth and related trip demand. This has resulted in non-accommodated trips growing from the standard 2% of total bookings to an average of 5% of total bookings in 2013 (15,900 trips). Progress is being made on bringing non-accommodated down to approximately 3% of total bookings or 8,800 trips not provided for 2015. Adding to the service challenge is the change in origin/destination as registrant’s trip origins and/or destinations have moved to the new growth areas of the City.
The particulars of the growth costs for 2015 to be funded from assessment growth is summarized below. The growth hours are not only critical to grow ridership but to maintain existing ridership levels. Without the service growth hours, current ridership levels would be expected to decline.
_____________________________________________________________________________________________________________________ 2015 Draft Budget for the City of London - December 8, 2014
Page 1199

Conventional Transit Services:
b) Current Cost and Labour for Service or Program Provided
Total (Annual) Operating Cost FT# FTE#
$22.8 M (City of London share only) Not applicable 517.50
Note: LTC does not report full time employees
c) Unit of Measure Cost of Service (Current Cost/Labour divided by Current Area)
Unit of Measure Cost 2014 2015 Service hours per capita Rides per capita Rides per revenue service hour Total cost per ride Municipal investment per ride
1.50 62.7 41.8 $2.55 $0.94
1.54 63.0 41.1 $2.61 $0.95
Note: 1) In 1990 service hours per capita totalled 1.90; rides per capita totalled 60.0 and rides per service hour equalled 31.2 2) Current seated capacity per revenue service equals 38
d) If this is a Contracted Service, what is the Percentage Contracted Out? Not applicable
e) Assets Currently Used to Provide Service LTC bus fleet
Total (Annual) Operating
Cost
Total Revenue
City Investment
Service Hours Ridership FTE# Fleet
2015 only $392,300 $(263,800) $128,500 5,980 98,500 10.0 6 Annualized $1,158,300 $(773,400) $384,900 17,700 294,000 10.0 6
_____________________________________________________________________________________________________________________ 2015 Draft Budget for the City of London - December 8, 2014
Page 1200

2. Request – Conventional Transit Services
a) Growth Area by Unit of Measure 5,980 service hours effective September 2015 (17,700 annually)
b) Impact of Growth – Staffing
Staffing FT# Staffing FTE# Staffing FTE $ Not applicable 10.0 $751,252 (gross)
c) Impact of Growth – Costs
Operating (Growth area x unit of measure cost of service) $384,900 Capital Cost of Incremental Assets $1,273,300 Total Growth Request $1,658,200
d) Impact on Assets Used to Provide Service The funding is required to support fleet expansion of six buses to accommodate growth service hours
i) Five buses for existing service area calling for total capital investment of $2,546,500 - City investment of $1,273,300.
ii) One bus for new development area calling for total capital investment of $509,300 – Development charges of $458,370.
Specialized Transit Services: (Background continued from section 1, part a)
Total (Annual) Operating
Cost
Total Revenue
City Investment
Service Hours
Ridership FTE# Fleet
2015 only $127,700 $(70,500) $57,200 3,000 7,300 Not applicable Not applicable Annualized $383,000 $(211,400) $171,600 9,000 21,900 Not applicable Not applicable
_____________________________________________________________________________________________________________________ 2015 Draft Budget for the City of London - December 8, 2014
Page 1201

b) Current Cost and Labour for Service or Program Provided
Total (Annual) Operating Cost FT# FTE#
$4.1 M (City of London share only) Not applicable 11.0
c) Unit of Measure Cost of Service (Current Cost/Labour divided by Current Area)
Unit of Measure Cost 2014 2015 Service hours per capita Rides per capita Rides per revenue service hour Total cost per ride Municipal investment per ride
0.29 0.71 40.6 $20.27 $14.45
0.30 0.74 40.4 $20.51 $14.66
d) If this is a Contracted Service, what is the Percentage Contracted Out? Yes, 84% of total expenditure contracted out for provision of drivers and vehicles, remaining 13% covers LTC employees providing call taking, scheduling and trip assigning.
e) Assets Currently Used to Provide Service Not applicable
2. Request – Specialized Transit Services
a) Growth Area by Unit of Measure 3,000 service hours effective September 2015 (9,000 annually)
b) Impact of Growth – Staffing
Staffing FT# Staffing FTE# Staffing FTE $
Not applicable Not applicable Not applicable
_____________________________________________________________________________________________________________________ 2015 Draft Budget for the City of London - December 8, 2014
Page 1202

c) Impact of Growth – Costs
Operating (Growth area x unit of measure cost of service) $171,600 Capital Cost of Incremental Assets $0 Total Growth Request $171,600
d) Impact on Assets Used to Provide Service Not applicable
Summary Total Request – Accessible Public Transit Services
2015 Annual Conventional Operating $128,500 $384,900 Capital $1,273,300 $1,273,300 Specialized Operating $57,200 $171,600 Total $1,459,000 $1,829,800 Capital-Development Charges $458,370 $458,370
_____________________________________________________________________________________________________________________ 2015 Draft Budget for the City of London - December 8, 2014
Page 1203

Assessment Growth Business Case #13
Service Grouping Roadways
Service/Program Roadway Maintenance / Snow Control / Roadway Planning & Design
Background/Description of Change Roadway Maintenance:
Increase in the amount of road and sidewalk assets due to newly assumed subdivisions, warranted sidewalk program, walkways, ditches, boulevards, downtown maintenance and roadside maintenance. Additional funding is required to provide services to these areas.
Snow Control:
Increase in amount of the road and sidewalk assets due to newly assumed subdivisions, warranted sidewalk program and road widening. Additional funding is required to provide winter control service to those areas.
Roadway Planning & Design:
On October 7, 2013, the Civic Administration reported to the Civic Works Committee the Transportation Infrastructure deficit that currently exists as a result of capital funding not keeping pace with the growth of the city. As identified in the report, an average of $52,170,000 is needed annually to maintain the existing transportation network. This capital funding need increases with the expansion of the system. This is a request for additional lifecycle capital funding for the 31 lane km that will be added to the network as a result of growth.
1. Background a) Area Currently Served by Unit of Measure
3696 lane kms of road and 1497 km of sidewalk (City of London boundaries) 3526 lane kms of road and 1460 km of sidewalk (maintained)
_____________________________________________________________________________________________________________________ 2015 Draft Budget for the City of London - December 8, 2014
Page 1204

b) Current Cost and Labour for Service or Program Provided
Service/Program Total (Annual) Operating Cost FT# FTE# Roadway Maintenance $9.3 M 85 108.3 Snow Control $12.6M 55 65.4 Roadway Planning & Design $1.8M 32 32.5
c) Unit of Measure Cost of Service (Current Cost/Labour divided by Current Area)
Service/Program Unit of Measure Cost Unit of Measure FTE Roadway Maintenance $4,829 per road lane km
$300 per sidewalk lane km Not applicable
Snow Control $3,379 per lane km $1000 per km of sidewalk
Not applicable
Roadway Planning & Design $52,170,000/3526 lane km =$14,796/lane km
Not applicable
d) If this is a Contracted Service, what is the Percentage Contracted Out? Roadway Maintenance: Not applicable Snow Control: Based on the pieces of equipment, 50% is contracted out Roadway Planning & Design: 100%
e) Assets Currently Used to Provide Service Roadway Maintenance: Numerous vehicles managed through the city’s internal fleet Snow Control: 65 Road Plows, 25 Spreaders, 37 Sidewalk plows plus additional service vehicles both
contracted and city owned Roadway Planning & Design: Contract Services
_____________________________________________________________________________________________________________________ 2015 Draft Budget for the City of London - December 8, 2014
Page 1205

2. Request
a) Growth Area by Unit of Measure Roadway Maintenance: 31 lane kms of road and 23 km of sidewalk Snow Control: 31 lane kms of road and 23 km of sidewalk Roadway Planning & Design: 31 lane kms
b) Impact of Growth - Staffing
Service/Program Staffing FT# Staffing FTE# Staffing FTE $ Roadway Maintenance Not applicable 2.6 $100,000 Snow Control 0 0 $0 Roadway Planning & Design Not applicable Not applicable Not applicable
c) Impact of Growth – Costs
d) Impact on Assets Used to Provide Service Roadway Maintenance: Partial use of the city’s equipment. The funding is required to support additional temporary resources and materials. Snow Control: Partial use of the city’s winter equipment. The funding is required to support additional contracted resources and materials. Roadway Planning & Design: Ongoing renewal of additional infrastructure and associated engineering added as a result of growth will be absorbed by current forces.
CostRoadway
Maintenance Snow Control
Roadway Planning & Design (A) Total
Operating 157,102$ 128,085$ -$ 285,187$ Capital - - 458,676 458,676$ Total Growth Request 157,102$ 128,085$ 458,676$ 743,863$
Note (A) - Growth area x unit of measure cost of service
_____________________________________________________________________________________________________________________ 2015 Draft Budget for the City of London - December 8, 2014
Page 1206

Assessment Growth Business Case #14
Service Grouping Roadways
Service/Program Roadway Planning & Design
Background/Description of Change Capital Program Delivery- request for 2 Full Time Positions
1. Background
a) Area Currently Served by Unit of Measure Roadway Planning & Design currently delivers Capital Programs to support economic growth. The Transportation Growth program enables development by providing the municipal transportation infrastructure required for the additional traffic generation as a result of a growing city. Example projects are the recent road widening of Oxford Street West, Southdale Road and Wonderland Road North, intersection improvements at Fanshawe Park Road / Highbury Avenue and Clarke Road / Killaly Road and numerous traffic signal installations. The Transportation Growth Program capital expenditure in the past five years has averaged $23.3 M annually. This equates to the construction of one to two major projects each year such as a road widening, one to two minor project per year such as an intersection improvement, several development related minor improvements such as turn lanes and sidewalks and pre-engineering for future years programmed projects.
These services are currently delivered by:
Position Allocation Hours
One Transportation Design Engineer Full time 1 x 1,700 hours 1,700 Two Technologists Full Time 2 x 1,700 hours 3,400 Transportation Planning Engineer 1/3 Time 0.3 x 1,700 hours 510 Engineer-In-Training 1/3 Time 0.3 x 1,700 hours 510 Engineering Intern 1/3 Time 0.3 x 1,700 hours 510 Division Manager 1/4 Time 0.25 x 1,700 hours 425 Total Person Hours 4.25 FTE 7,055
_____________________________________________________________________________________________________________________ 2015 Draft Budget for the City of London - December 8, 2014
Page 1207

b) Current Cost and Labour for Service or Program Provided
Total (Annual) Operating Cost FT# FTE# $1.8 million 32 32.5
c) Unit of Measure Cost of Service (Current Cost/Labour divided by Current Area)
Unit of Measure Cost Unit of Measure FTE
$108,600(salary/fringe/overhead) 1700 hours
d) If this is a Contracted Service, what is the Percentage Contracted Out?
The engineering environmental assessment, design and construction administration of Transportation Growth projects is 90% outsourced. This enables a lean staff and maintains flexibility in times of budget fluctuations. It seeks to deliver projects in the most cost-effective manner possible. Smaller scope projects such as a bike lane retrofit are often managed, designed and administered directly by City staff. The design and administration of larger complex projects are usually outsourced to leverage the specialized skills, expertise and capacity available in the consulting industry.
e) Assets Currently Used to Provide Service Office space, equipment, furniture, vehicle, professional memberships, etc. (not included in value noted above).
2. Request
a) Growth Area by Unit of Measure (Same unit of measure used in current case) A significant increase in the Capital Growth and Rapid Transit Programs resulting from a growing City requires an increase in the engineering services capacity of the Division as follows:
1. The Transportation Growth program enables development by providing the municipal transportation infrastructure
required for the resulting additional traffic generation. The transportation infrastructure includes all mobility modes including vehicular, transit and active transportation. The average Transportation Growth Program capital expenditure is set to almost double from $ 23.3 M annually in the past five years to $42.1 M annually in the coming five years. This equates to an average of three major projects, two to three minor projects and numerous localized development-related improvements through the new CSRF-funded process. Example near-term projects are the Fanshawe Park Road East
_____________________________________________________________________________________________________________________ 2015 Draft Budget for the City of London - December 8, 2014
Page 1208

Widening, rail underpass reconstructions on Wharncliffe Road, Highway 401 Interchange Improvements, intersection improvements at Fanshawe / Richmond and Hamilton / Highbury and traffic signals at Riverside / Beaverbrook.
Pressures related to past inadequate funding and new visions for transportation are causing this increase in the Growth Program. Active transportation is now benefiting from development charges funding and the bike lane program will experience large expenditure growth. These are resource-intensive projects that will be carried out in liaison with the newly created Cycling Advisory Committee.
New Development Charge Bylaw policies associated with the reduction of the Urban Works Reserve Fund will also increase the number of minor works projects managed by Civic Administration and funded through the City Services Reserve Fund.
2. The Division has been directed to undertake the environmental assessment for the Rapid Transit system. Rapid Transit is
a new responsibility for the Division and represents an eventual capital investment of approximately $380 M when all diverse sources of funding are included. The early pre-engineering work is essential to the success of the program and related senior government funding applications. The management of the large complex EAs required for the Rapid Transit EA also requires significant staffing resources. The consulting value of the environmental assessments is estimated to be $3.7 M.
The scope and nature of the projects in the future Growth program are similar to previous. Therefore the project management and administration hours can be pro-rated to determine the resources required to deliver the new larger program described in Item 1:
Existing Annual Program
Delivery Hours Previous Annual Program
Expenditure Future Annual Program
Expenditure Future Annual Program
Delivery Hours
7,055 (4.25 FTEs) $23.3 M $42.1 M 12,747 (7.7 FTEs)
The calculation above indicates a need for 3.4 additional FTEs to deliver the larger Transportation Growth Program. It is proposed to find efficiencies in project delivery and management and increase outsourcing to reduce the additional resource requirement to two FTEs.
_____________________________________________________________________________________________________________________ 2015 Draft Budget for the City of London - December 8, 2014
Page 1209

The Rapid Transit system planning and pre-engineering described in Item 2 above is a significant immediate resource draw that is not included in the FTE calculation above. When fully funded by senior levels of government, rapid transit implementation will require dedicated staff in engineering, realty, transit, communications and other areas. Until all sources of funding are confirmed it is proposed to manage the Rapid Transit Environmental Assessment stages utilizing current staff and the two additional FTEs identified for the larger Growth program.
b) Impact of Growth - Staffing
Staffing FT# Staffing FTE# Staffing FTE $
2 2.0 $213,175
c) Impact of Growth – Costs
Operating (Growth area x unit of measure cost of service) $213,175 Work station, computer & associated furniture PC-$900 Software - $525 Phone - $225 Desk, overhead - $4,000 Chair - $600 Space modification - $5,000 Total one-time cost $6,250 x 2 staff = $12,500 + $5,000 space = $17,500
Capital Cost of Incremental Assets $0 Total Growth Request $230,675
d) Impact on Assets Used to Provide Service
These two new positions can be accommodated within the existing space but do require space modifications as noted in the above request.
_____________________________________________________________________________________________________________________ 2015 Draft Budget for the City of London - December 8, 2014
Page 1210

Assessment Growth Business Case #15
Service Grouping Roadways
Service/Program Street Light Maintenance
Background/Description of Change Additional street lights are added to the City’s network as new subdivision streets are assumed. This increases the maintenance and energy costs of providing this service. Additional funding is required.
1. Background a) Area Currently Served by Unit of Measure
35,786 street lights
b) Current Cost and Labour for Service or Program Provided
Total (Annual) Operating Cost FT# FTE# $6.9 million 3 3.1
c) Unit of Measure Cost of Service (Current Cost/Labour divided by Current Area)
Unit of Measure Cost Unit of Measure FTE $192/street light Not applicable
d) If this is a Contracted Service, what is the Percentage Contracted Out?
The maintenance component of this service is contracted out, which is approximately 32% of the operating costs.
e) Assets Currently Used to Provide Service
Purchased Services (Maintenance contract) and Materials & Supplies (Energy)
_____________________________________________________________________________________________________________________ 2015 Draft Budget for the City of London - December 8, 2014
Page 1211

2. Request
a) Growth Area by Unit of Measure
400 street lights
b) Impact of Growth - Staffing
Staffing FT# Staffing FTE# Staffing FTE $ 0 0 $0
c) Impact of Growth – Costs
Operating (Growth area x unit of measure cost of service) $76,800 Capital Cost of Incremental Assets $0 Total Growth Request $76,800
d) Impact on Assets Used to Provide Service Increased Maintenance contract and energy costs.
_____________________________________________________________________________________________________________________ 2015 Draft Budget for the City of London - December 8, 2014
Page 1212

Assessment Growth Business Case #16
Service Grouping Roadways
Service/Program Traffic Signal Maintenance
Background/Description of Change Additional traffic signals are added to the City’s network as traffic volumes grow associated with new residential, commercial and institutional development. This increases the maintenance and energy costs of providing this service. Additional funding is required.
1. Background a) Area Currently Served by Unit of Measure 394 traffic signals
b) Current Cost and Labour for Service or Program Provided
Total (Annual) Operating Cost FT# FTE#
$2,600,000 3 3.0
c) Unit of Measure Cost of Service (Current Cost/Labour divided by Current Area)
Unit of Measure Cost Unit of Measure FTE
$6,592/ traffic signal Not applicable
d) If this is a Contracted Service, what is the Percentage Contracted Out?
The maintenance component of this service is contracted out, which equates to 85% of the operating costs.
e) Assets Currently Used to Provide Service Purchased Services (Maintenance contract) and Materials & Supplies (Energy)
_____________________________________________________________________________________________________________________ 2015 Draft Budget for the City of London - December 8, 2014
Page 1213
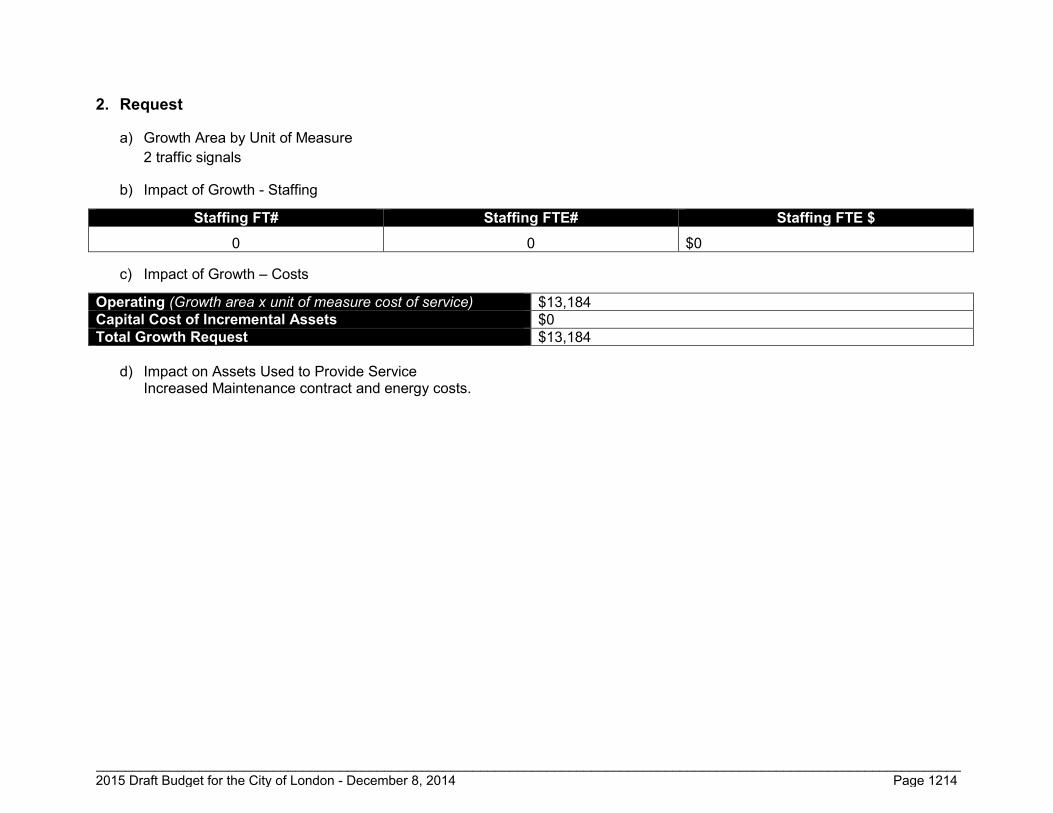
2. Request
a) Growth Area by Unit of Measure 2 traffic signals
b) Impact of Growth - Staffing
Staffing FT# Staffing FTE# Staffing FTE $ 0 0 $0
c) Impact of Growth – Costs
Operating (Growth area x unit of measure cost of service) $13,184 Capital Cost of Incremental Assets $0 Total Growth Request $13,184
d) Impact on Assets Used to Provide Service
Increased Maintenance contract and energy costs.
_____________________________________________________________________________________________________________________ 2015 Draft Budget for the City of London - December 8, 2014
Page 1214
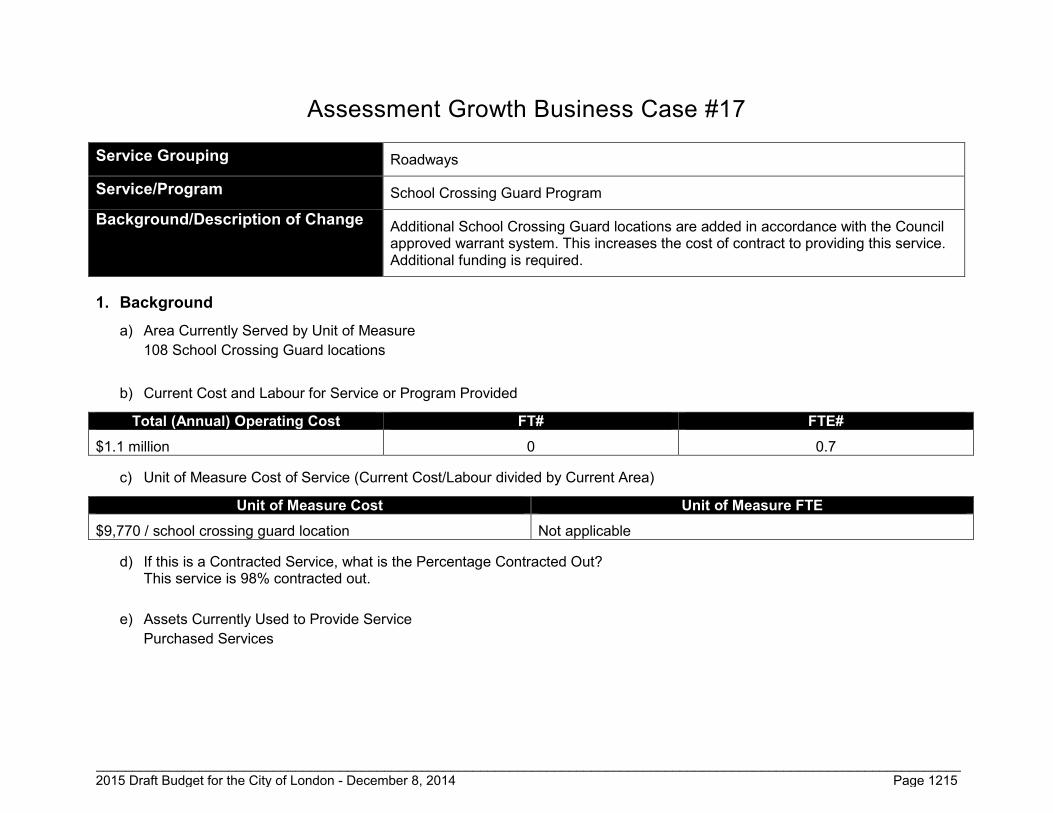
Assessment Growth Business Case #17
Service Grouping Roadways
Service/Program School Crossing Guard Program
Background/Description of Change Additional School Crossing Guard locations are added in accordance with the Council approved warrant system. This increases the cost of contract to providing this service. Additional funding is required.
1. Background a) Area Currently Served by Unit of Measure
108 School Crossing Guard locations
b) Current Cost and Labour for Service or Program Provided
Total (Annual) Operating Cost FT# FTE# $1.1 million 0 0.7
c) Unit of Measure Cost of Service (Current Cost/Labour divided by Current Area)
Unit of Measure Cost Unit of Measure FTE $9,770 / school crossing guard location Not applicable
d) If this is a Contracted Service, what is the Percentage Contracted Out? This service is 98% contracted out.
e) Assets Currently Used to Provide Service Purchased Services
_____________________________________________________________________________________________________________________ 2015 Draft Budget for the City of London - December 8, 2014
Page 1215

2. Request
a) Growth Area by Unit of Measure
As new homes or schools are constructed, the need for additional School Crossing Guards increases. In order to address this need Council approved warrant criteria that considers the number of vehicles and unassisted school age children (JK to Grade 6) that use the crossing in order to determine if a School Crossing Guard is needed. In the past year 5 new locations were studied with two new School Crossing Guards being added. Currently there are 5 requests for School Crossing Guards that will be studied in the fall and it is anticipated that additional requests will be received once the 2014/2015 school year begins. It is estimated that of the new School Crossing Guard requests there will be 3 that satisfy the warrant.
The Council approved warrant criteria for Mid-block Crosswalks and Warrant for Intersections as noted below:
Warrant for Mid-block Crosswalks:
Warrant Description Requirement Compliance Study Result %
1. Pedestrian Volume
Volume of unassisted children attending Junior Kindergarten to Grade 6 during the highest peak hour of the three hour school study periods (am peak, mid-day peak, pm peak)
>50
2. Safe Crossing Gaps
Number of safe crossing gaps in a 5-minute period <4
OR
3. Collision History The average number of reported collisions that are susceptible to correction by a School Crossing Guard over a 3 year period
>3
Notes: 1. Posted speed limit is less than or equal to 60 km/hr.
Safe Gap =
Width of Crossing ⁺ Perception & Reaction Time
Average Walking Speed (1.1m/sec) (4 sec)
2. School Crossing Guard warrant is fulfilled if Warrant #1 and Warrant #2 or Warrant #1 and Warrant #3 are satisfied.
_____________________________________________________________________________________________________________________ 2015 Draft Budget for the City of London - December 8, 2014
Page 1216

Warrant for Intersections:
Warrant Description
Minimum Requirements Compliance Side Street
Stop Control
All-way Stop
Control
Traffic Signal
Study Result %
1.
Minimum Vehicular & Pedestrian Volume
Exposure index of vehicle and pedestrian volume during the highest peak hour of the three hour school study periods (am peak, mid-day peak, pm peak)
10,000 19,000 5,500
2. Collision History
The average number of reported collisions that are susceptible to correction by a School Crossing Guard over a 3 year period
3
3. Combined Warrant Warrant #1 and Warrant #2 ≥ 80%
Notes: 1. Pedestrian Volume is unassisted children attending Jr. Kindergarten to Grade 6.
2. Exposure Index = Vehicle Volume x Pedestrian Volume
3. Posted speed limit is less than or equal to 60 km/hr.
4. For traffic signals the volume of traffic is the number of turning vehicles that conflict with pedestrians in
the crosswalk. b) Impact of Growth - Staffing
Staffing FT# Staffing FTE# Staffing FTE $
0 0 $0
c) Impact of Growth – Costs
Operating (Growth area x unit of measure cost of service) $29,310 Capital Cost of Incremental Assets $0 Total Growth Request $29,310
d) Impact on Assets Used to Provide Service No impact on assets as this is a purchased service.
_____________________________________________________________________________________________________________________ 2015 Draft Budget for the City of London - December 8, 2014
Page 1217

Assessment Growth Business Case #18
Service Grouping Corporate
Service/Program Corporate
Background/Description of Change Of the 27 services that required assessment growth funding in 2014, 10 services had personnel costs associated with them. Given the timing of hiring only a portion, 70% of total funding, was provided necessitating the remaining 30% to be provided in 2015 to account for the full year impact.
1. Background a) Area Currently Served by Unit of Measure
The costs of a growing city in 2014 required $1.3 million in personnel costs. Given the timing of approval and the hiring process, the full year personnel cost would not be realized in 2014 so only partial year funding was allocated. With resources in place in 2015, full year funding is required which works out to approximately $0.4 million.
b) Current Cost and Labour for Service or Program Provided
Total (Annual) Operating Cost FT# FTE#
$1.3 million 16 16.8
c) Unit of Measure Cost of Service (Current Cost/Labour divided by Current Area)
Unit of Measure Cost Unit of Measure FTE
$2.1 million 30%
d) If this is a Contracted Service, what is the Percentage Contracted Out? Not applicable.
e) Assets Currently Used to Provide Service Refer to 2014 assessment growth business cases # 18, 19, 20, 24, 26, 30, 31, 34, 37, 38
_____________________________________________________________________________________________________________________ 2015 Draft Budget for the City of London - December 8, 2014
Page 1218

2. Request
a) Growth Area by Unit of Measure 30% of $1.3 million
b) Impact of Growth - Staffing
Staffing FT# Staffing FTE# Staffing FTE $ 0 0 $378,545*
* Only partial year funding was allocated in 2014, full year funding required in 2015.
c) Impact of Growth – Costs
Operating (Growth area x unit of measure cost of service) $378,545 Capital Cost of Incremental Assets $0 Total Growth Request $378,545
d) Impact on Assets Used to Provide Service
No further impact to assets, as costs were incurred in 2014.
_____________________________________________________________________________________________________________________ 2015 Draft Budget for the City of London - December 8, 2014
Page 1219