2015 annual report 2016 annual meeting
TRANSCRIPT

2016 Annual MeetingThursday & Friday, April 28 & 29
Hosted by the University of Miami | Miami, FL
https://www.apps.grad.uw.edu/nne
1
2015 ANNUAL REPORT

Maintained by the University of Washington
2015-16 Participating Institutions (n=59)
2

ENROLLMENT SUMMARIES3

Maintained by the University of Washington
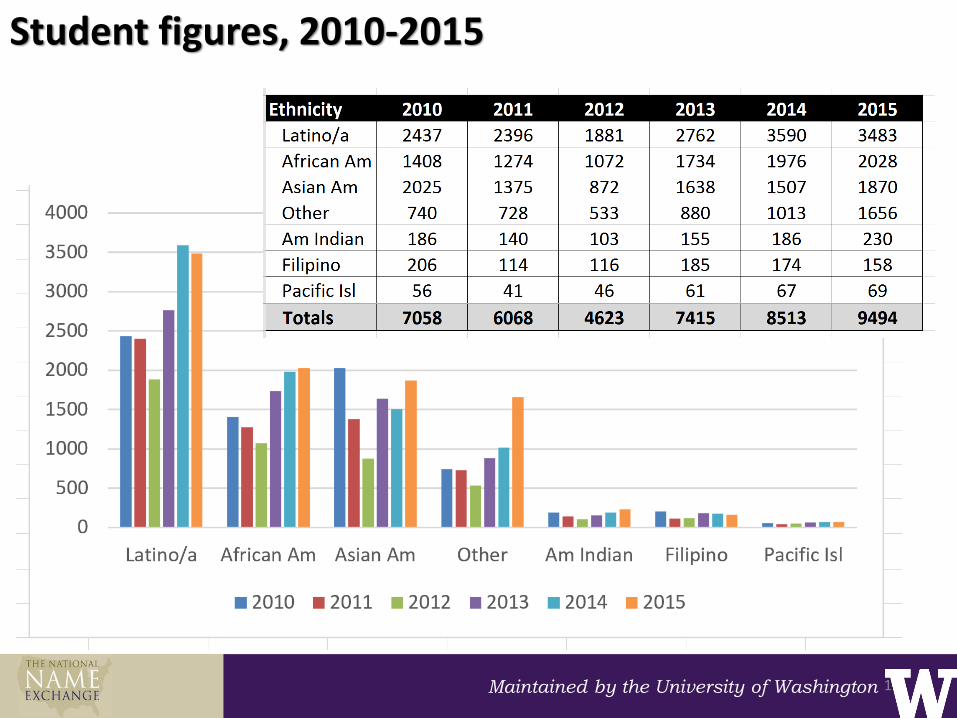
Notes from 2014-15• Participation in the NNE increased by 11% from 8,513 students in
2014, to 9,494 students in 2015!!! A record number! Way to go, NNE!!!
• Female participants made up 63% of the NNE in 2015, which represents an 18% gain since last year.
• Chicano, Puerto Rican and other Latino students numbers total 3,483; representing 37% of the total NNE
• African American participation represented 21% of the pool: 621/males and 1,407/females in 2014, up from 633/males and 1,343/females in 2013
• Asian American student participation increased to 784/males and 1,121/females in 2015 from 613/males and 894/females in 2014
4

Maintained by the University of Washington
Notes from 2014-15 (cont’)
• The largest percentage of students, 21% (1,968), chose professional fields as their area of graduate interest
• Only 4,394 participants (4%) chose mathematics and physical sciences as their area of interest, though 55% identified themselves in STEM fields (n=5,224)
• The overall GPA average was: 3.61 (3.57 in 2014) | overall major GPA average: 3.66 (3.54 in 2014)
• Of the 9,494 students in the NNE, 4,071 have research experience (43%)
• The largest class of students (3,573) will graduate in 2016, followed by 2,698 students who will graduate in 2017.
5

Maintained by the University of Washington
Statistical Summary from 2014-15
6
CATEGORY 2014 2015 PCT CHANGE
Total Participation 8,513 9,494 11 % increase
Males 3,139 3,495 10% increase
Females 5,374 5,999 10% increase
Latino/as* 3,590 3,483 3% decrease
African Americans 1,976 2,028 3% increase
Asian Americans 1,507 1,870 19% increase
Native Americans 186 230 19% increase
Professional fields# 1,934 1,968 2% increase
STEM fields** 4,398 5,224 16% increase
*includes Chicanos, Puerto Ricans and other Latinos**includes Agriculture, Biosciences, Engineering, Health Sciences, Mathematics, Physical Sciences, and Psychology# see next slide for entire list of majors included within Professional fields category

“Professional” Disciplines include:
Maintained by the University of Washington 7
• Accounting• Architecture/Urban Planning• Business Administration• Business Administration, Finance• Business Administration, Human Resource Management• Business Administration, International• Business Administration, Management Info Systems• Business Administration, Marketing/advertising• Communications• Journalism• Library/Archival Sciences• Professional Fields, General• Professional Fields, Other• Public Administration• Real Estate• Social Welfare• Social Work• Theology• Urban Design And Planning

Discipline
Maintained by the University of Washington 8
1%7%
11%
3%
14%
17%1%
3%
21%
8%
14%
NNE student data, by discipline (n=9,494)
Agriculture (72) Arts and Humanities (662) Biological Sciences (1039) Education (332)
Engineering (1318) Health Sciences (1628) Mathematics (86) Physical Sciences (308)
Professional Fields (1968) Psychology (773) Social Sciences (1309)

Discipline, STEM vs non-STEM
Maintained by the University of Washington 9
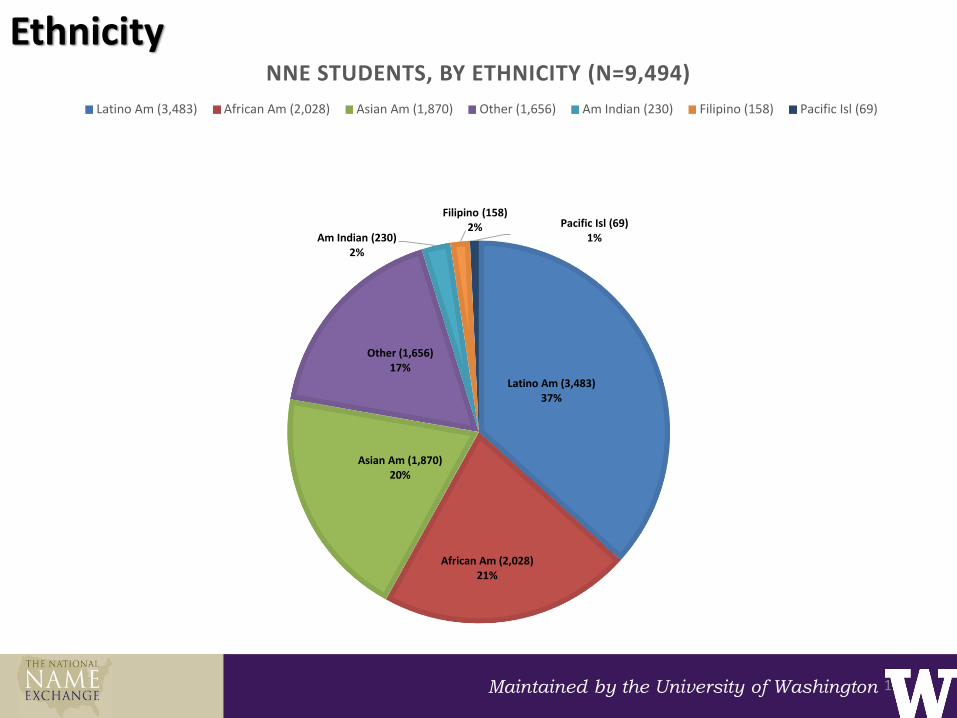
Ethnicity
Maintained by the University of Washington 10
Latino Am (3,483)37%
African Am (2,028)21%
Asian Am (1,870)20%
Other (1,656)17%
Am Indian (230)2%
Filipino (158)2% Pacific Isl (69)
1%
NNE STUDENTS, BY ETHNICITY (N=9,494)
Latino Am (3,483) African Am (2,028) Asian Am (1,870) Other (1,656) Am Indian (230) Filipino (158) Pacific Isl (69)

Gender/Ethnicity
Maintained by the University of Washington 11
Maintained by the University of Washington 12
Student figures, 2010-2015