2015 acs cannabis safety talk final - · pdf filehow,do,we,measure,residual,solvents? &...
TRANSCRIPT

GC Methods for Cannabis Safety and Potency Tes6ng
Amanda Rigdon1 , Jack Cochran1 , Corby Hilliard1 , William Schroeder2 , Chris<
Schroeder2 , Theo Flood2
1 Restek, Bellefonte, PA, USA, 2Cal-‐Green Solu<ons, San Luis Obispo, CA, USA
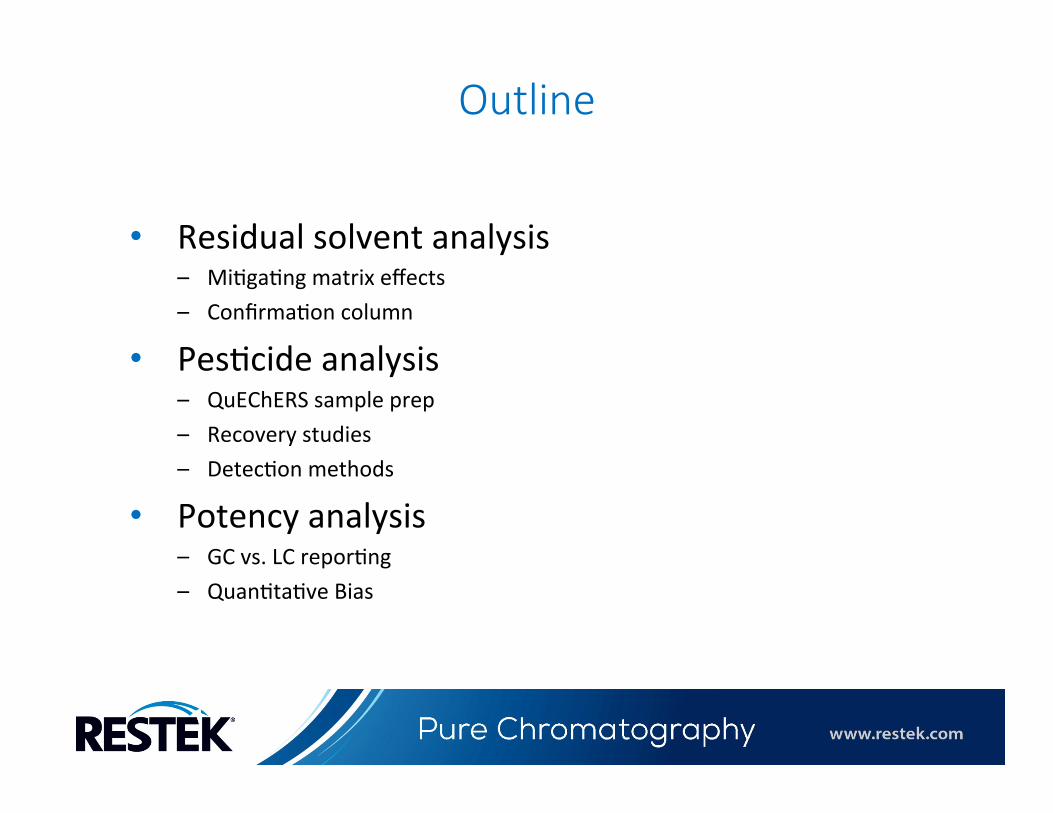
Outline
• Residual solvent analysis – Mi<ga<ng matrix effects – Confirma<on column
• Pes<cide analysis – QuEChERS sample prep – Recovery studies – Detec<on methods
• Potency analysis – GC vs. LC repor<ng – Quan<ta<ve Bias

How do we measure residual solvents?
• Confirma<on and quan<fica<on of residual solvents in pharmaceu<cals
• GC-‐HS-‐FID methodology
• Depends on accurate repor<ng of solvents used during manufacture
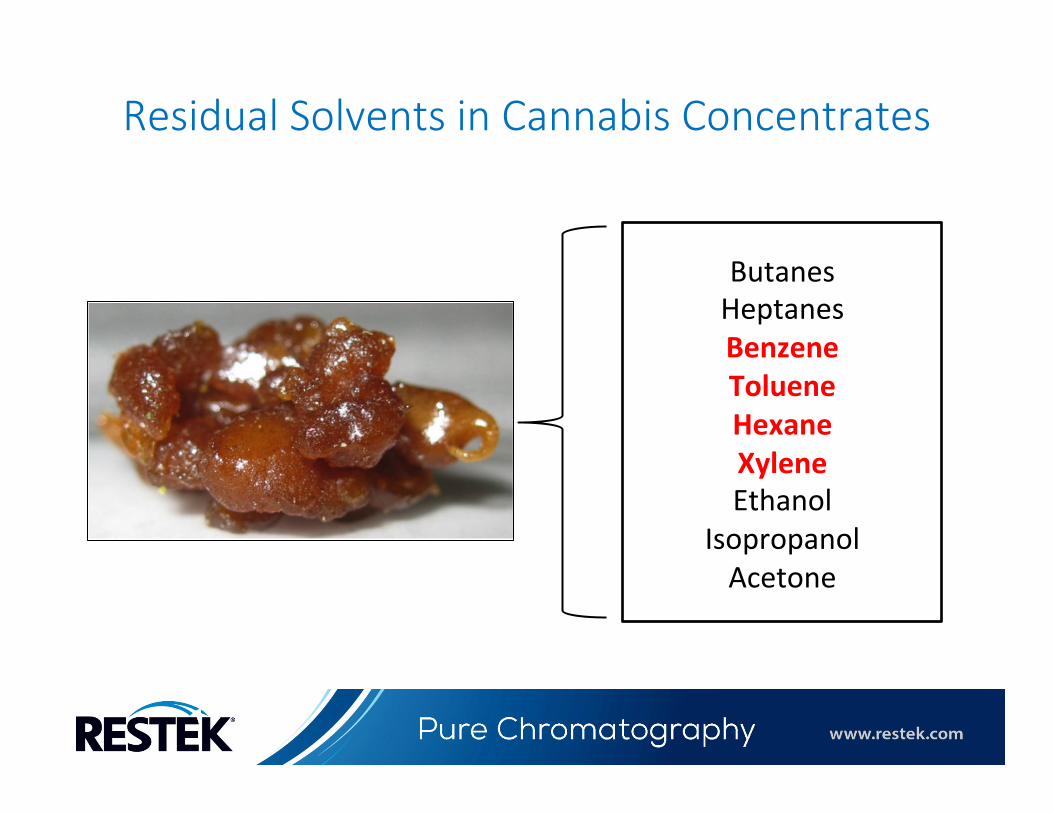
Residual Solvents in Cannabis Concentrates
Butanes Heptanes Benzene Toluene Hexane Xylene Ethanol
Isopropanol Acetone
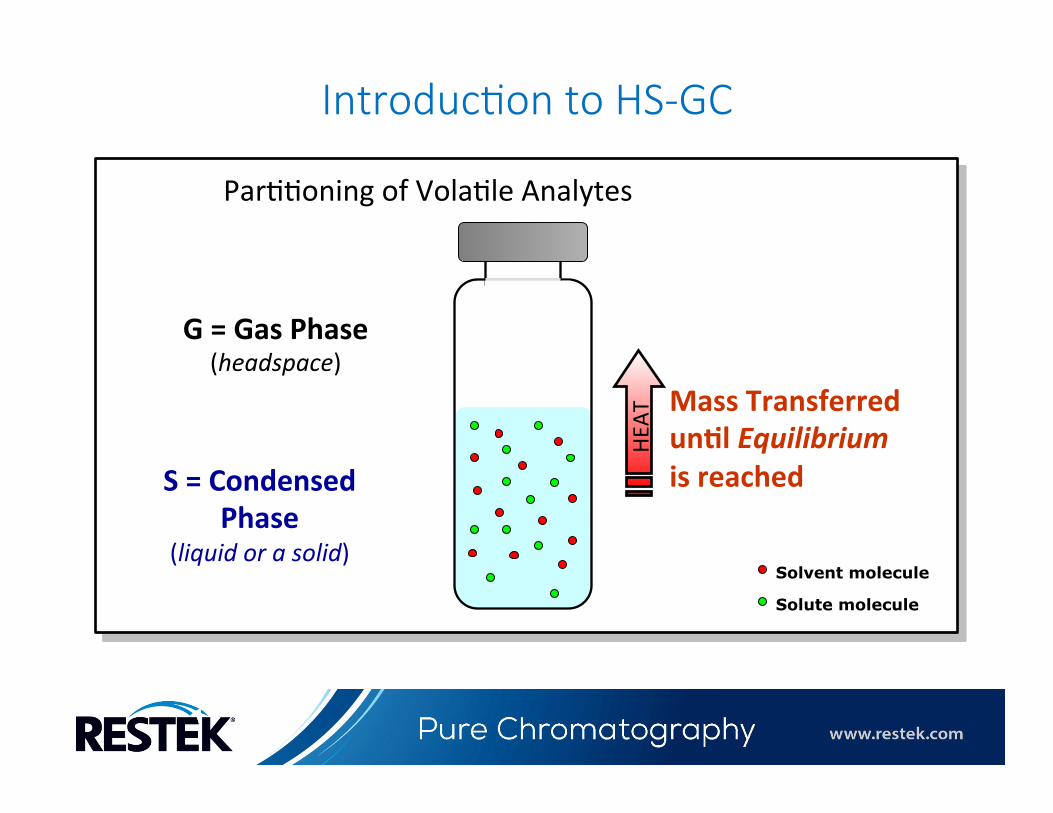
Par<<oning of Vola<le Analytes
G = Gas Phase (headspace)
S = Condensed Phase
(liquid or a solid)
HEA
T Mass Transferred un6l Equilibrium is reached
Solute molecule
Solvent molecule
Introduc:on to HS-‐GC
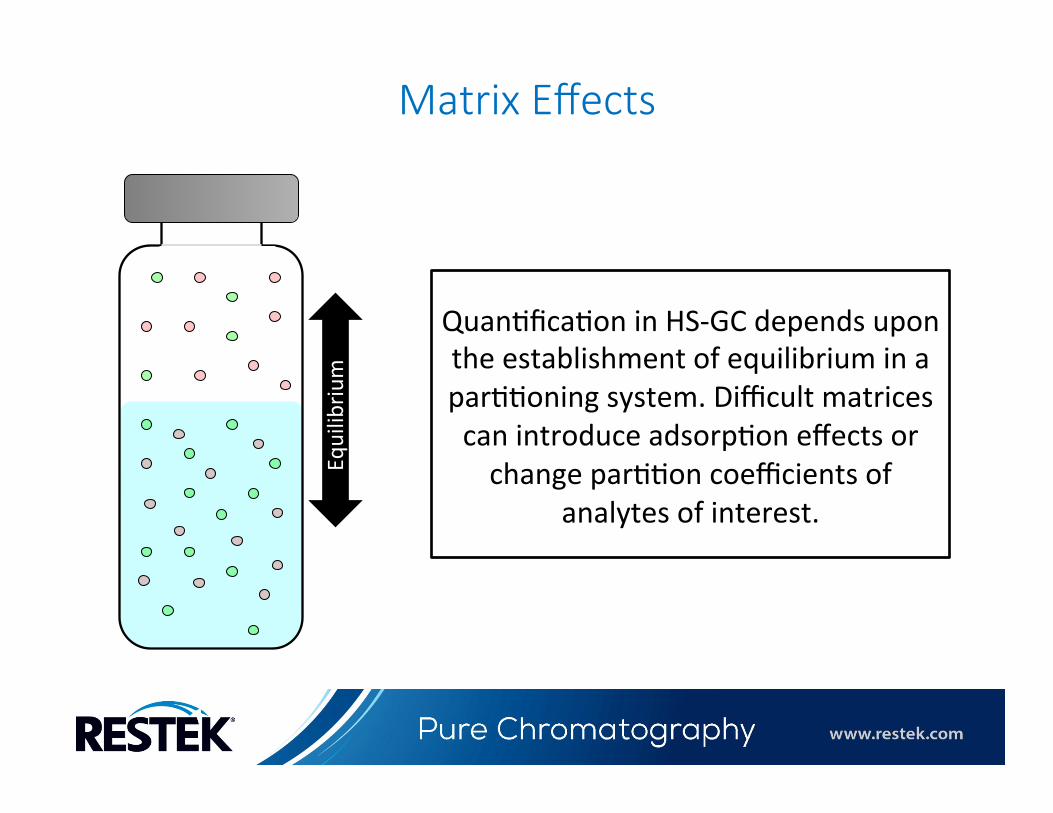
Matrix Effects
Equilibriu
m Quan<fica<on in HS-‐GC depends upon the establishment of equilibrium in a par<<oning system. Difficult matrices can introduce adsorp<on effects or change par<<on coefficients of
analytes of interest.
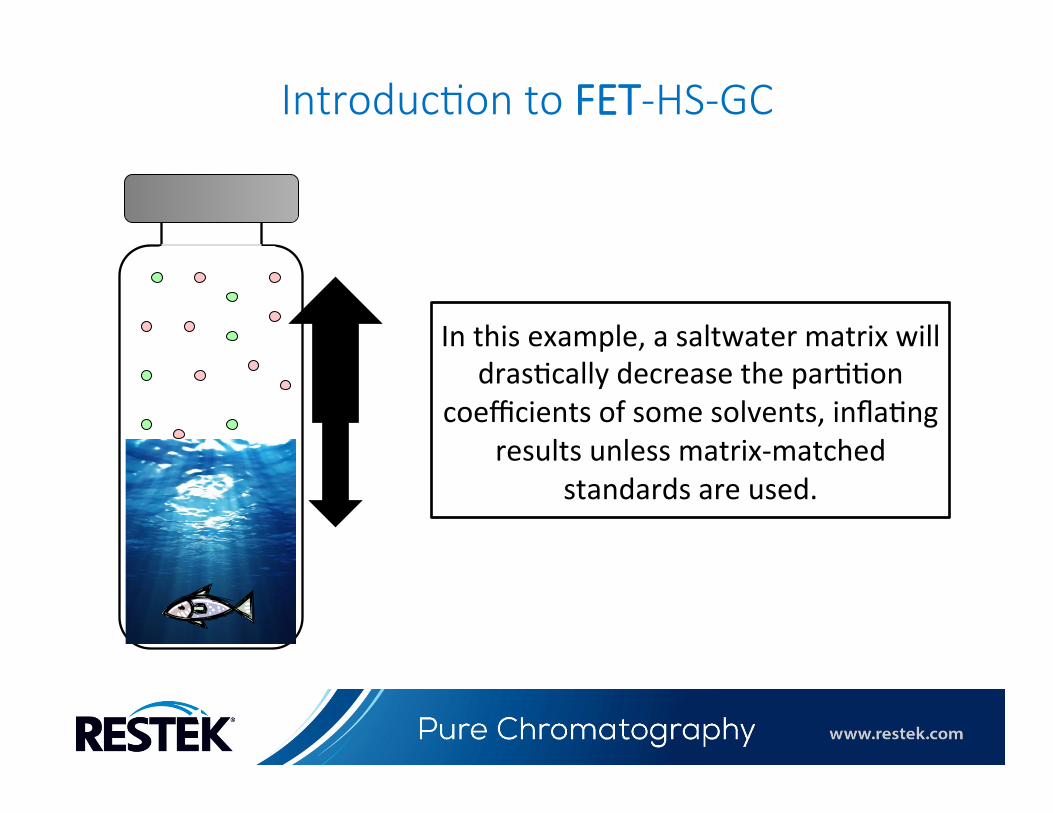
Introduc:on to FET-‐HS-‐GC
In this example, a saltwater matrix will dras<cally decrease the par<<on
coefficients of some solvents, infla<ng results unless matrix-‐matched
standards are used.
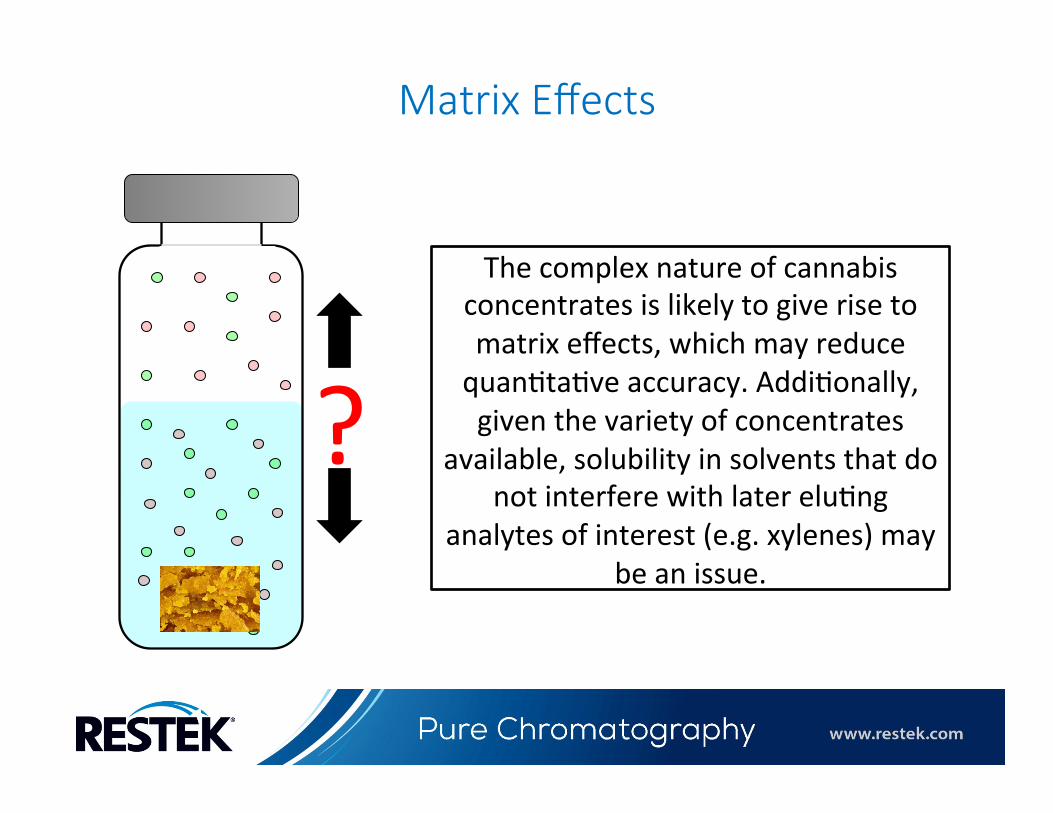
Matrix Effects
The complex nature of cannabis concentrates is likely to give rise to matrix effects, which may reduce quan<ta<ve accuracy. Addi<onally, given the variety of concentrates
available, solubility in solvents that do not interfere with later elu<ng
analytes of interest (e.g. xylenes) may be an issue.
?
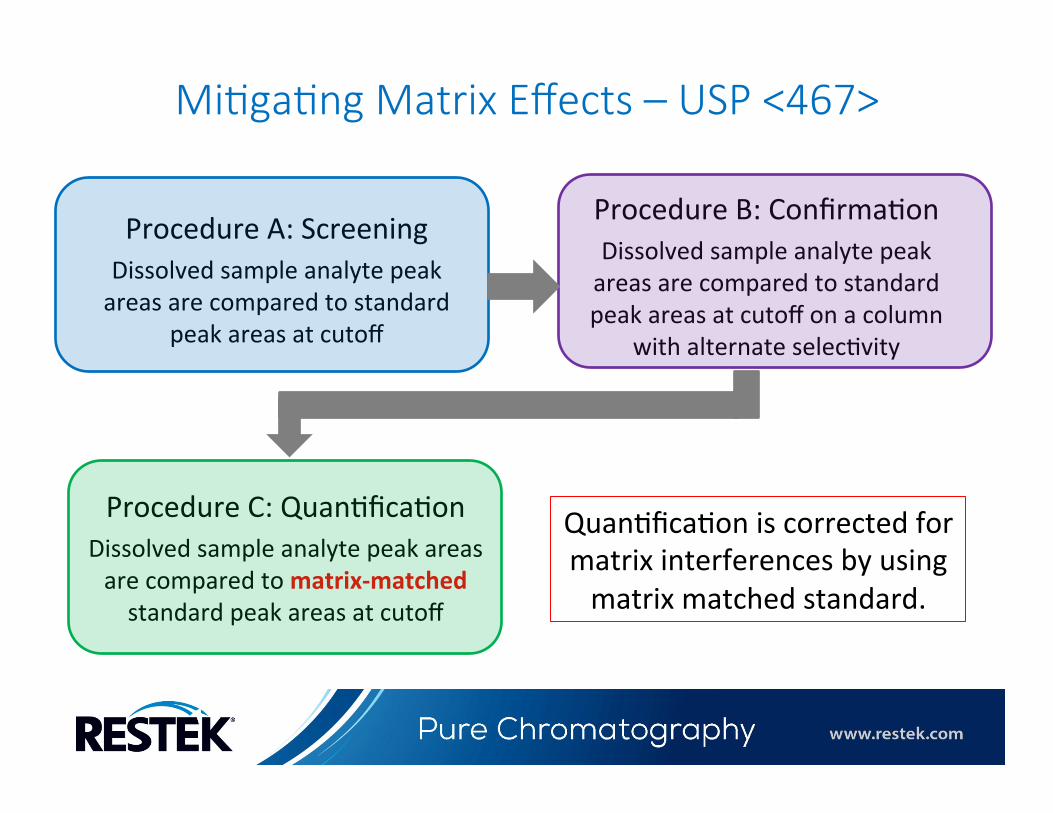
Mi:ga:ng Matrix Effects – USP <467>
Procedure A: Screening Dissolved sample analyte peak areas are compared to standard
peak areas at cutoff
Procedure B: Confirma<on Dissolved sample analyte peak areas are compared to standard peak areas at cutoff on a column
with alternate selec<vity
Procedure C: Quan<fica<on Dissolved sample analyte peak areas are compared to matrix-‐matched standard peak areas at cutoff
Quan<fica<on is corrected for matrix interferences by using matrix matched standard.
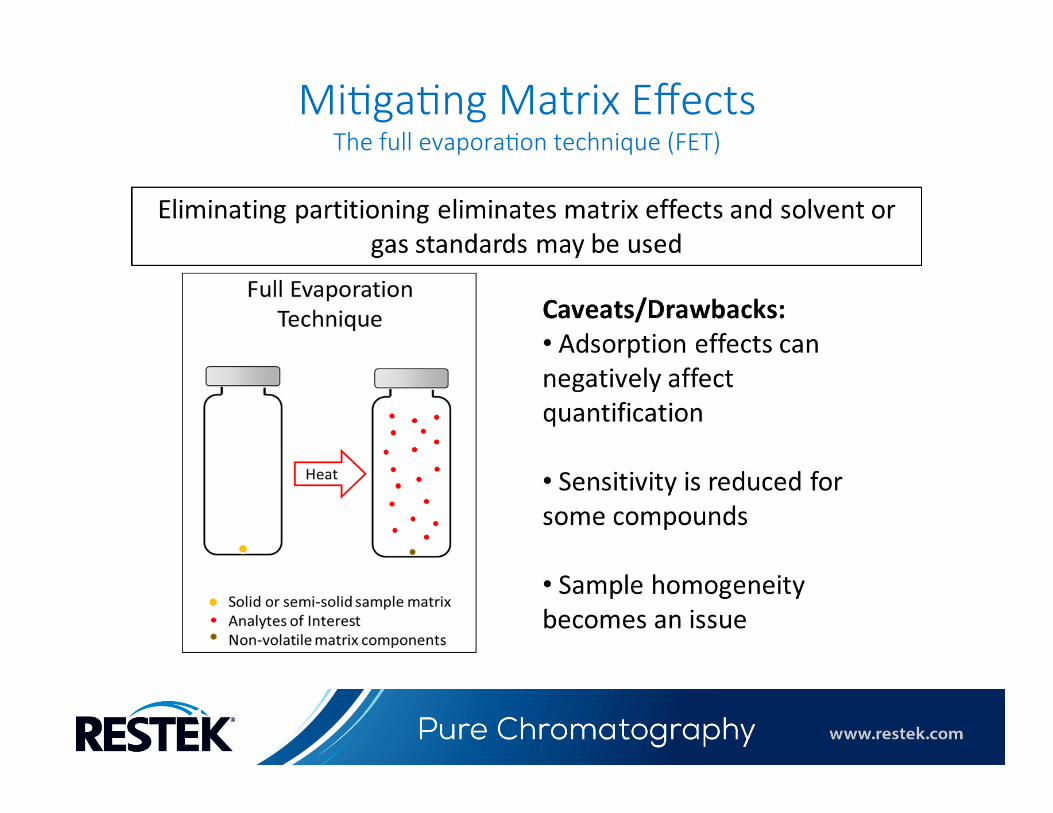
Mi:ga:ng Matrix Effects The full evapora:on technique (FET)
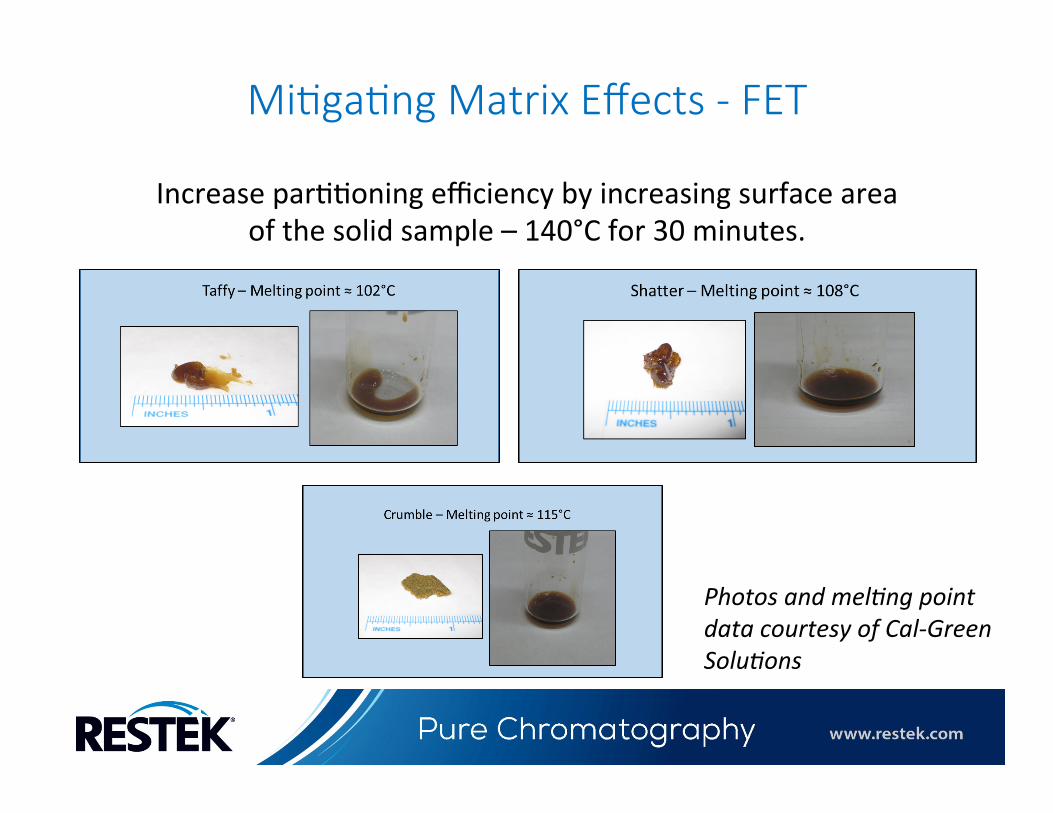
Mi:ga:ng Matrix Effects -‐ FET
Increase par<<oning efficiency by increasing surface area of the solid sample – 140°C for 30 minutes.
Photos and mel3ng point data courtesy of Cal-‐Green Solu3ons
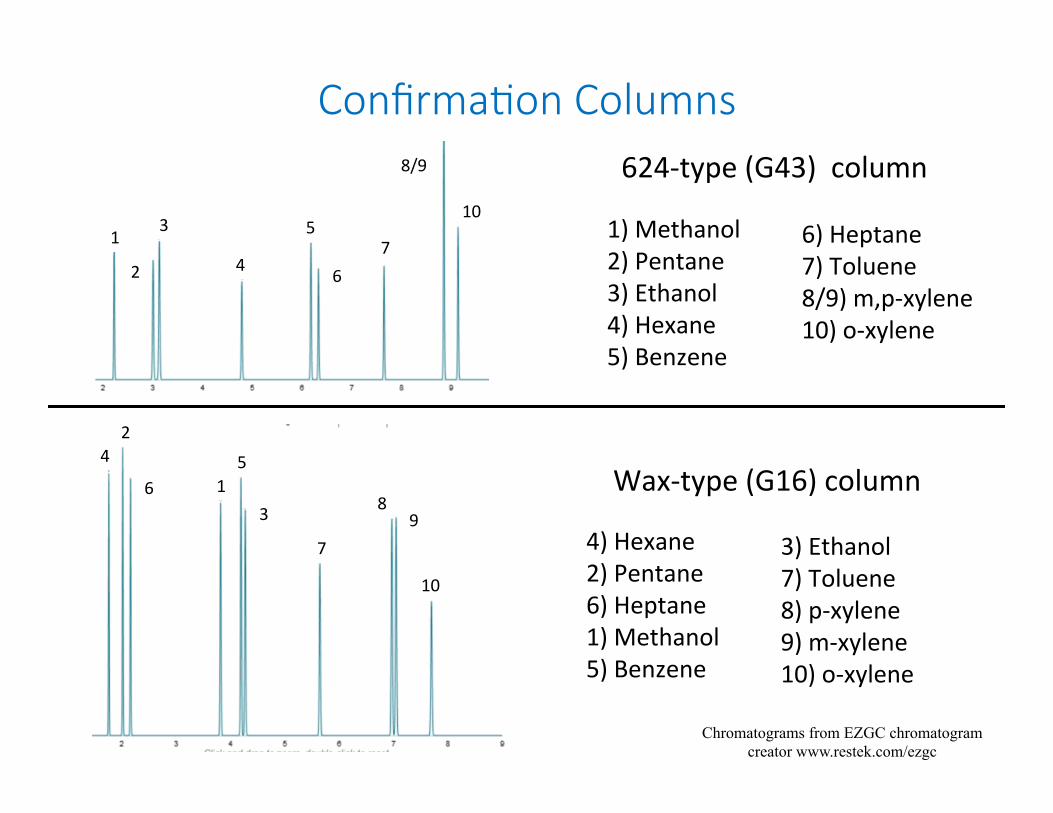
Confirma:on Columns
3
2
1 4
5
67
624-‐type (G43) column
1) Methanol 2) Pentane 3) Ethanol 4) Hexane 5) Benzene
6) Heptane 7) Toluene 8/9) m,p-‐xylene 10) o-‐xylene
8/9
10
Wax-‐type (G16) column
4) Hexane 2) Pentane 6) Heptane 1) Methanol 5) Benzene
3) Ethanol 7) Toluene 8) p-‐xylene 9) m-‐xylene 10) o-‐xylene
42
6 15
3
7
89
10
Chromatograms from EZGC chromatogram creator www.restek.com/ezgc
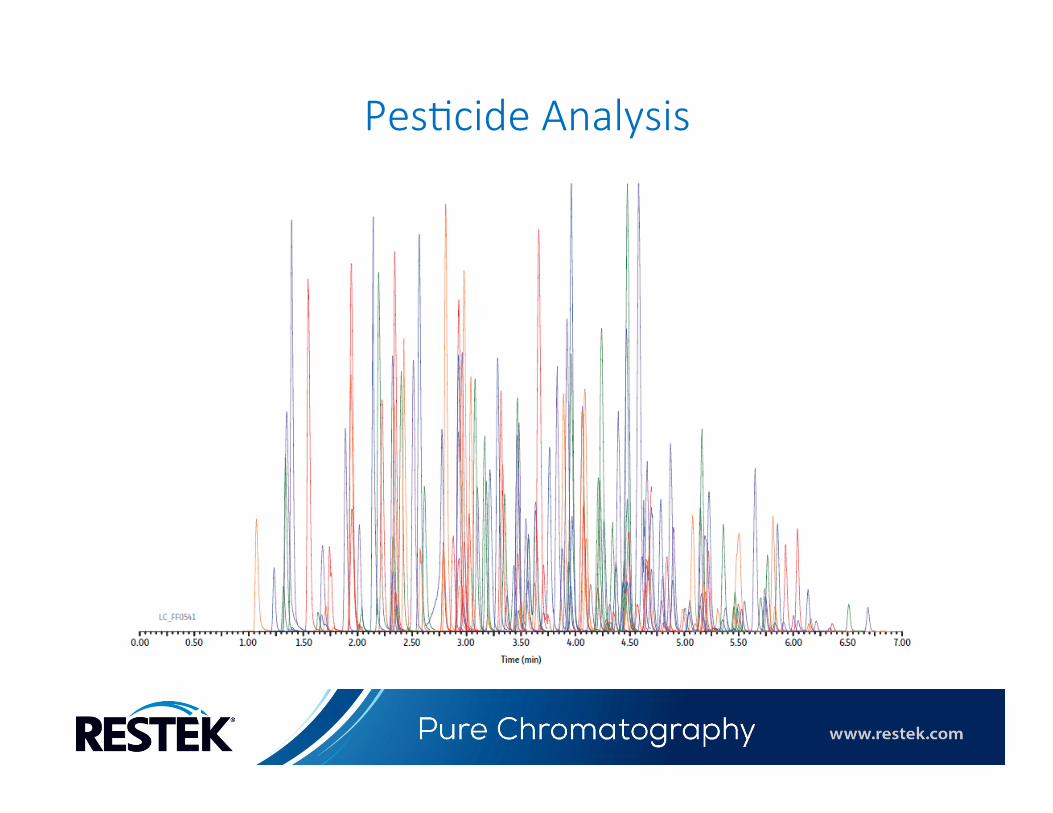
Pes:cide Analysis
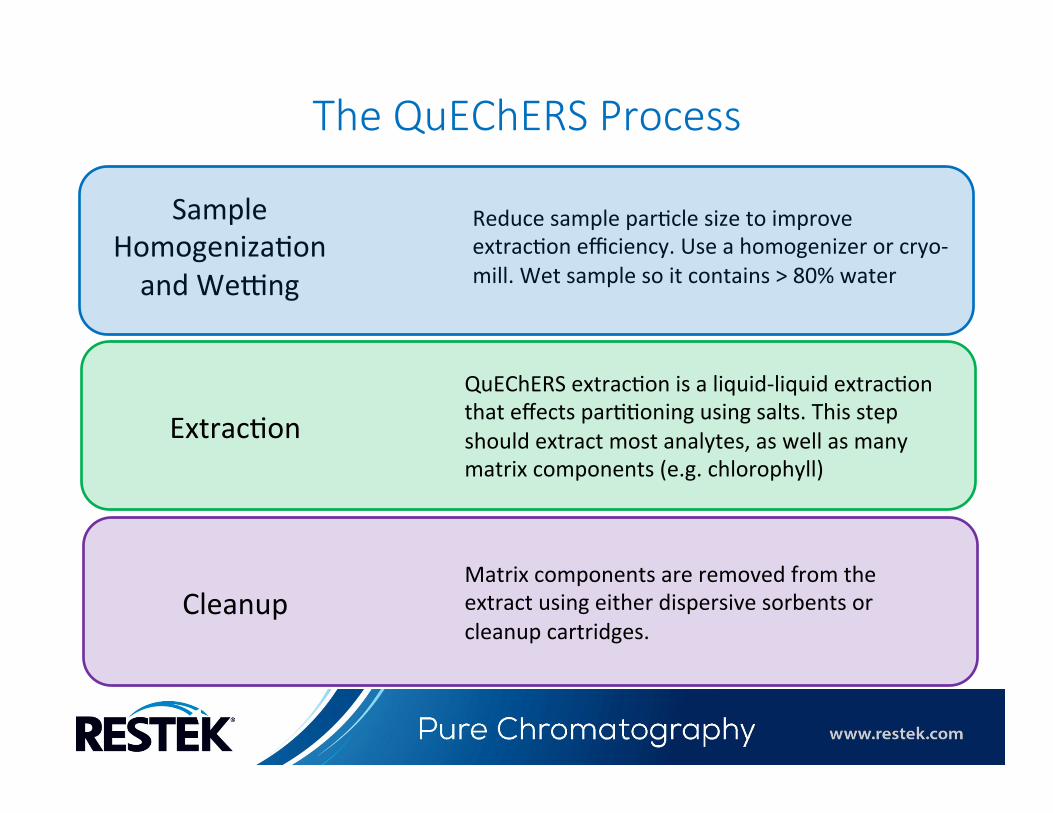
The QuEChERS Process
Sample Homogeniza<on and Weing
Extrac<on
Cleanup
Reduce sample par<cle size to improve extrac<on efficiency. Use a homogenizer or cryo-‐mill. Wet sample so it contains > 80% water
QuEChERS extrac<on is a liquid-‐liquid extrac<on that effects par<<oning using salts. This step should extract most analytes, as well as many matrix components (e.g. chlorophyll)
Matrix components are removed from the extract using either dispersive sorbents or cleanup cartridges.
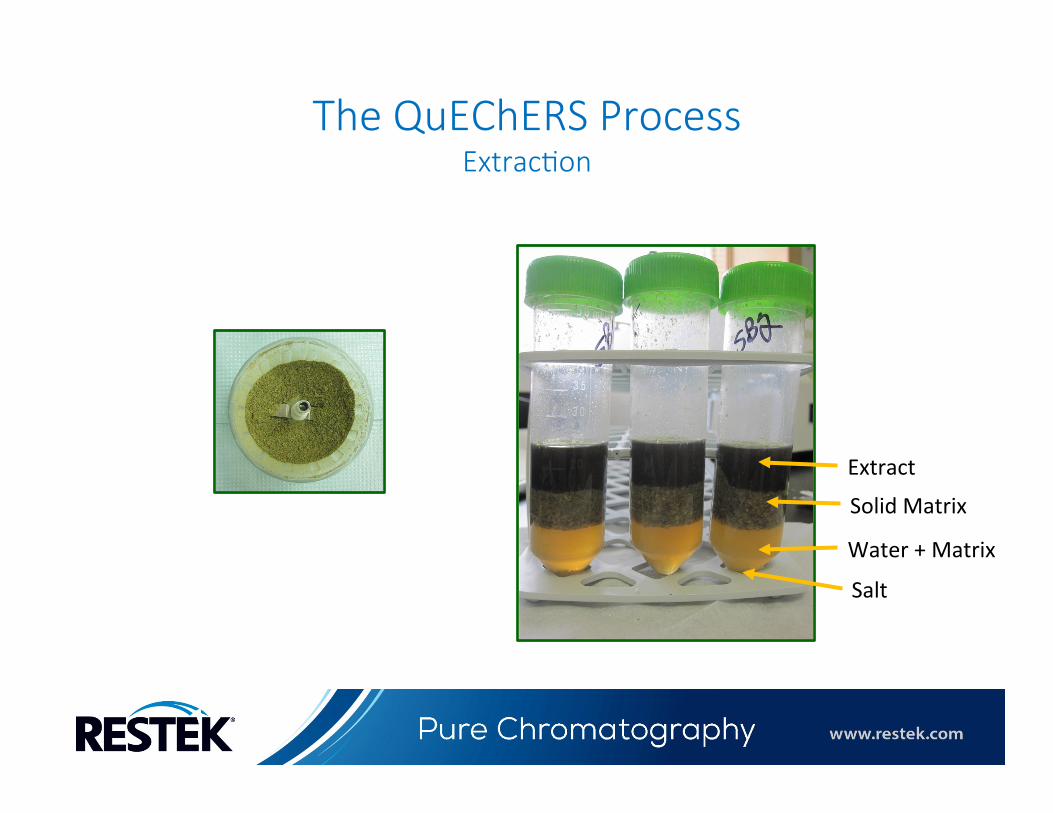
The QuEChERS Process Extrac:on
Extract
Solid Matrix
Water + Matrix
Salt
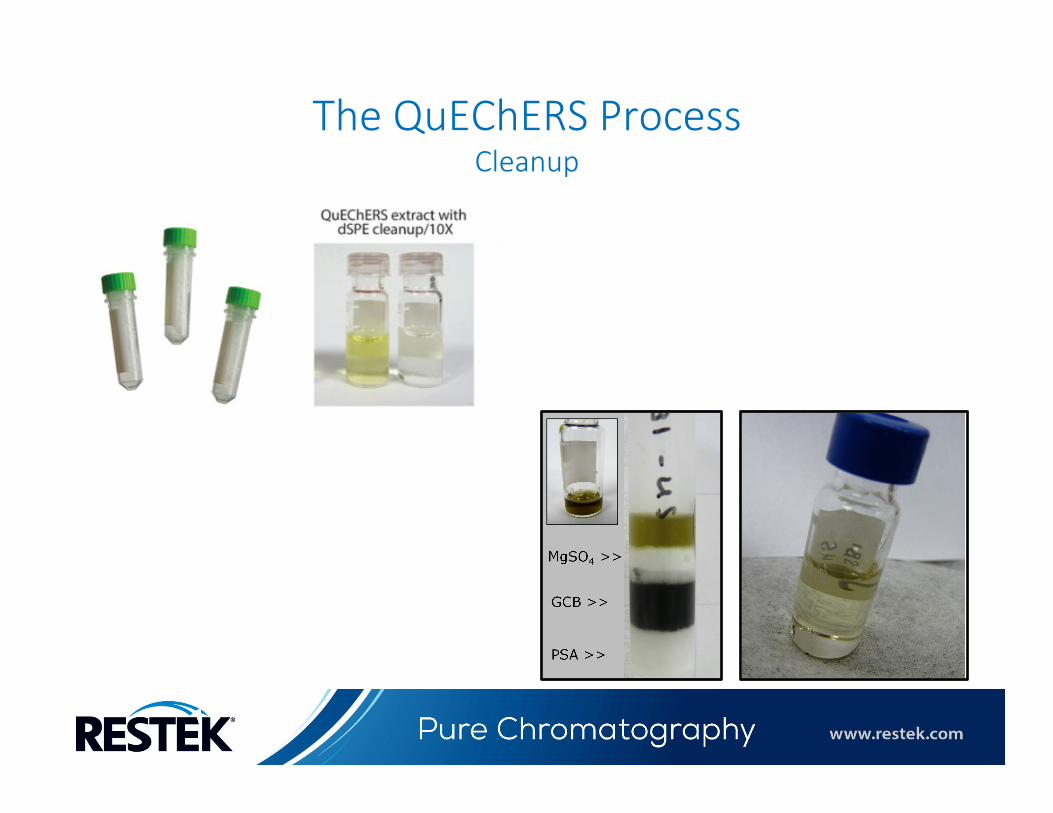
The QuEChERS Process Cleanup
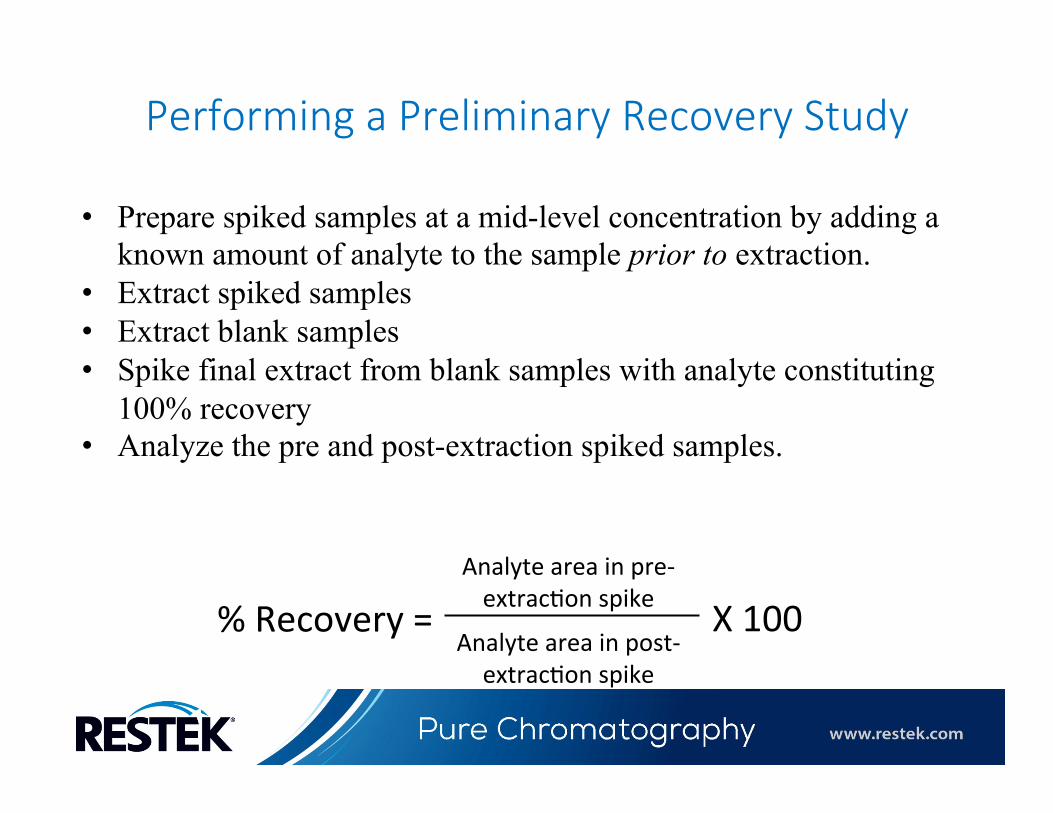
Performing a Preliminary Recovery Study
• Prepare spiked samples at a mid-level concentration by adding a known amount of analyte to the sample prior to extraction.
• Extract spiked samples • Extract blank samples • Spike final extract from blank samples with analyte constituting
100% recovery • Analyze the pre and post-extraction spiked samples.
% Recovery = Analyte area in pre-‐extrac<on spike
Analyte area in post-‐extrac<on spike
X 100
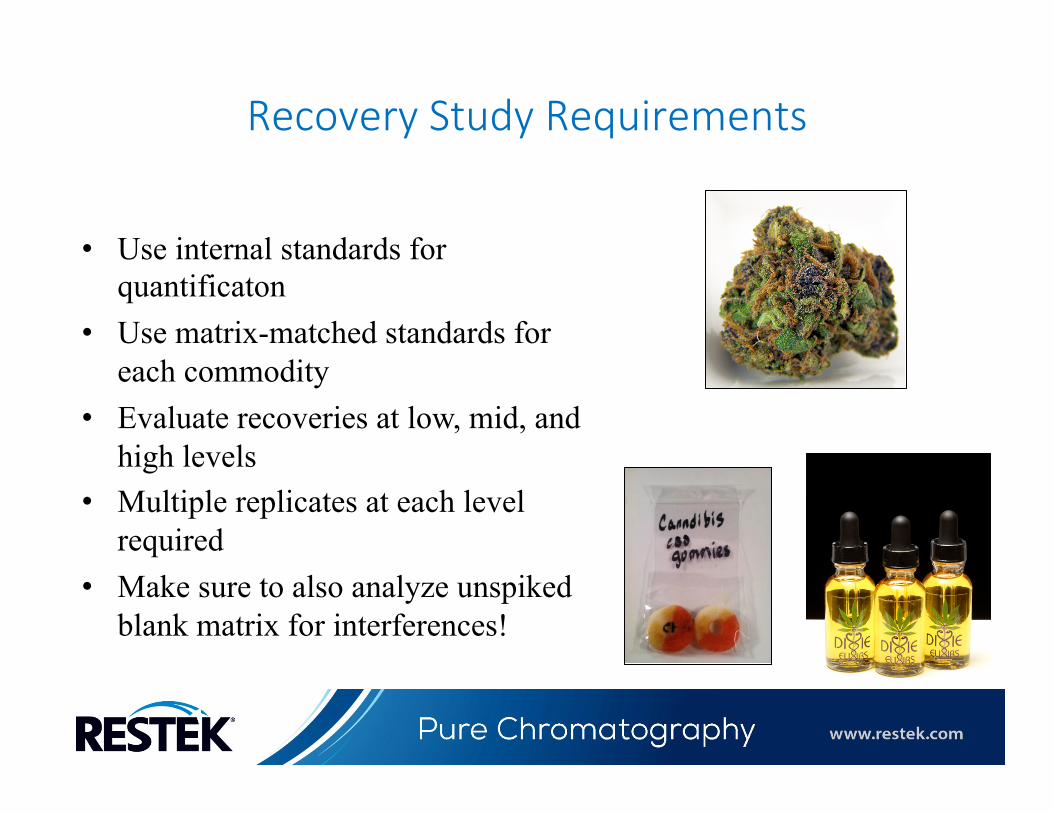
Recovery Study Requirements
• Use internal standards for quantificaton
• Use matrix-matched standards for each commodity
• Evaluate recoveries at low, mid, and high levels
• Multiple replicates at each level required
• Make sure to also analyze unspiked blank matrix for interferences!
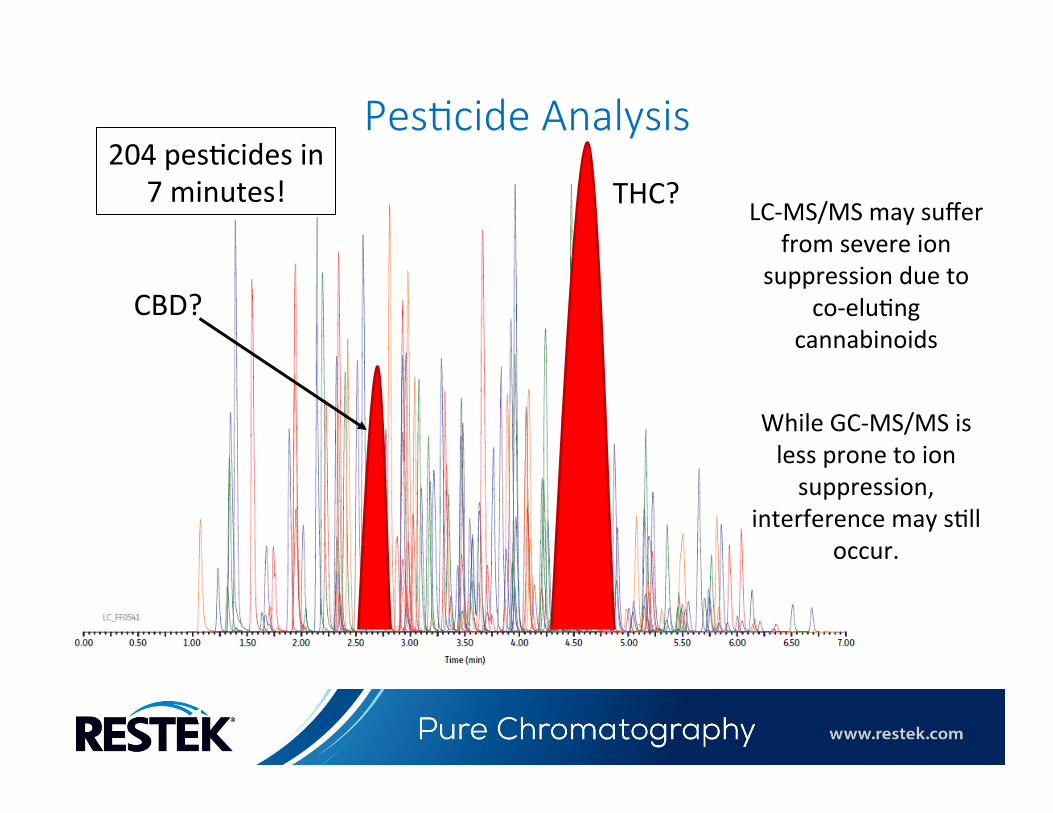
Pes:cide Analysis
THC?
CBD?
LC-‐MS/MS may suffer from severe ion
suppression due to co-‐elu<ng
cannabinoids
While GC-‐MS/MS is less prone to ion suppression,
interference may s<ll occur.
204 pes<cides in 7 minutes!

Why Test Potency by GC?
• GCs are less expensive to purchase, maintain, and operate
• Standards as less expensive • Separa<on is more
straighporward (fewer compounds)
PROCESS MONITORING!
High CBD? High THC?
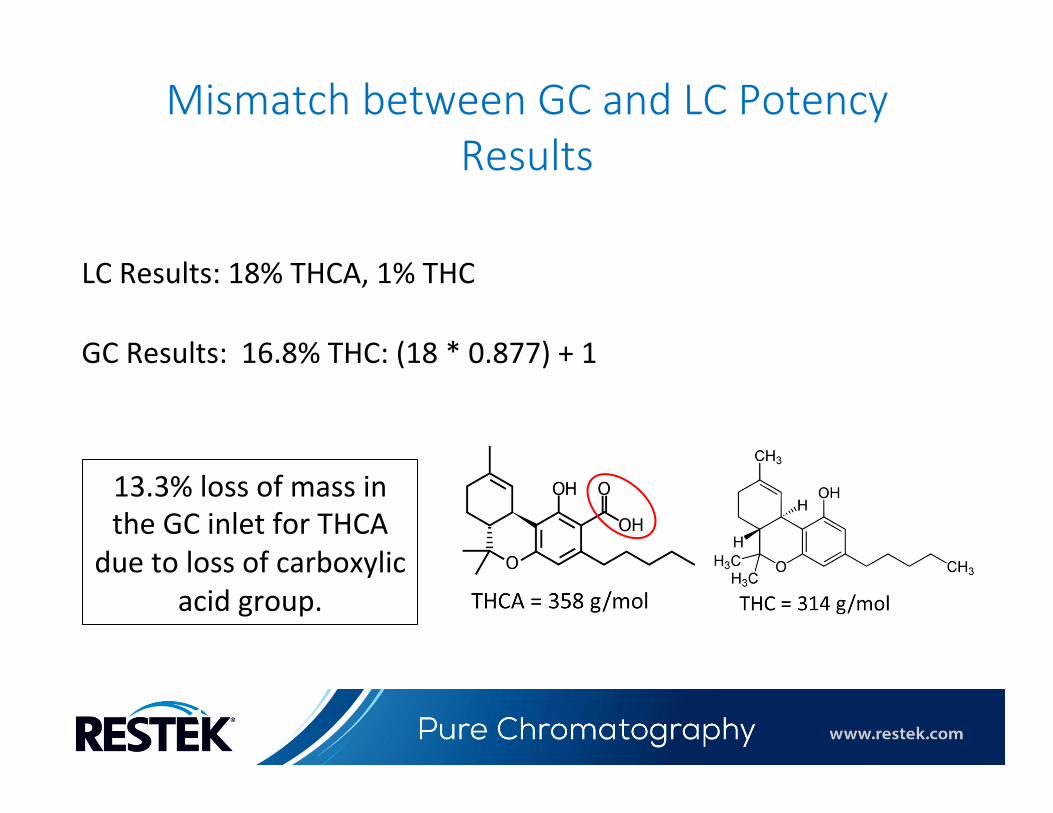
Mismatch between GC and LC Potency Results
LC Results: 18% THCA, 1% THC
GC Results:
13.3% loss of mass in the GC inlet for THCA
due to loss of carboxylic acid group.
16.8% THC: (18 * 0.877) + 1

Calcula:ng Decarboxyla:on Efficiency
min 2.1 2.2 2.3 2.4 2.5 2.6 2.7 2.8 2.9
Inject equal concentra3ons THC and THCA standards (solvent or spiked matrix standards)
THC Standard area = 40.2 pA*s
THCA Standard area = 22.8 pA*s
THCA area Percent (%ATHCA) = (22.8/40.2)*100 = 56.7%
At 100% decarboxyla<on efficiency, %ATHCA should be 87.7%.
Decarboxyla<on efficiency = (ATHCA / 87.7) *100 = 64.7%
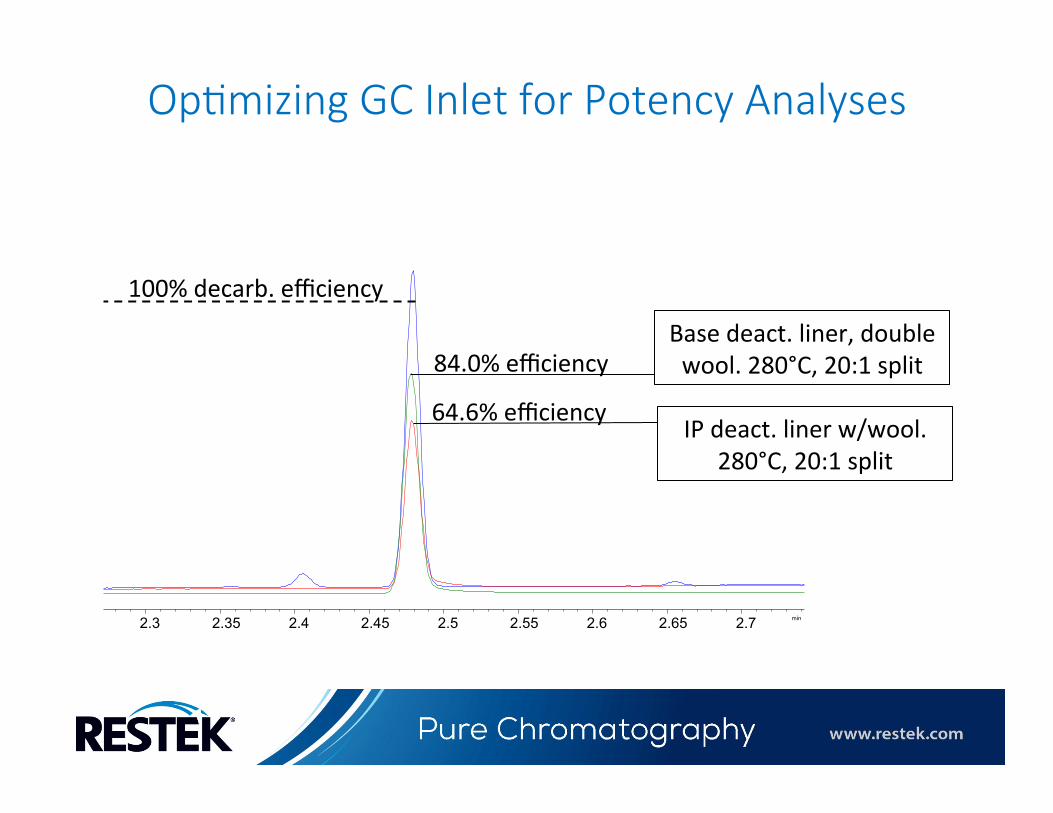
Op:mizing GC Inlet for Potency Analyses
min 2.3 2.35 2.4 2.45 2.5 2.55 2.6 2.65 2.7
100% decarb. efficiency
Base deact. liner, double wool. 280°C, 20:1 split 84.0% efficiency
IP deact. liner w/wool. 280°C, 20:1 split
64.6% efficiency
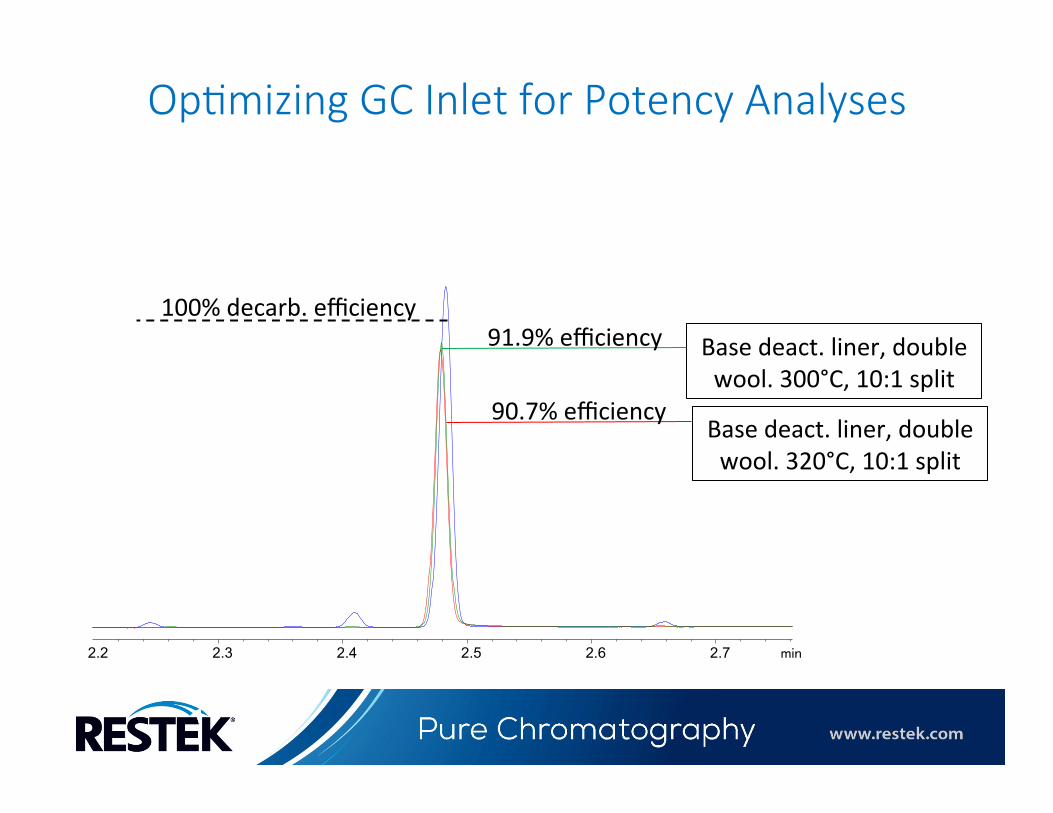
Op:mizing GC Inlet for Potency Analyses
min 2.2 2.3 2.4 2.5 2.6 2.7
100% decarb. efficiency Base deact. liner, double wool. 300°C, 10:1 split
Base deact. liner, double wool. 320°C, 10:1 split
91.9% efficiency
90.7% efficiency
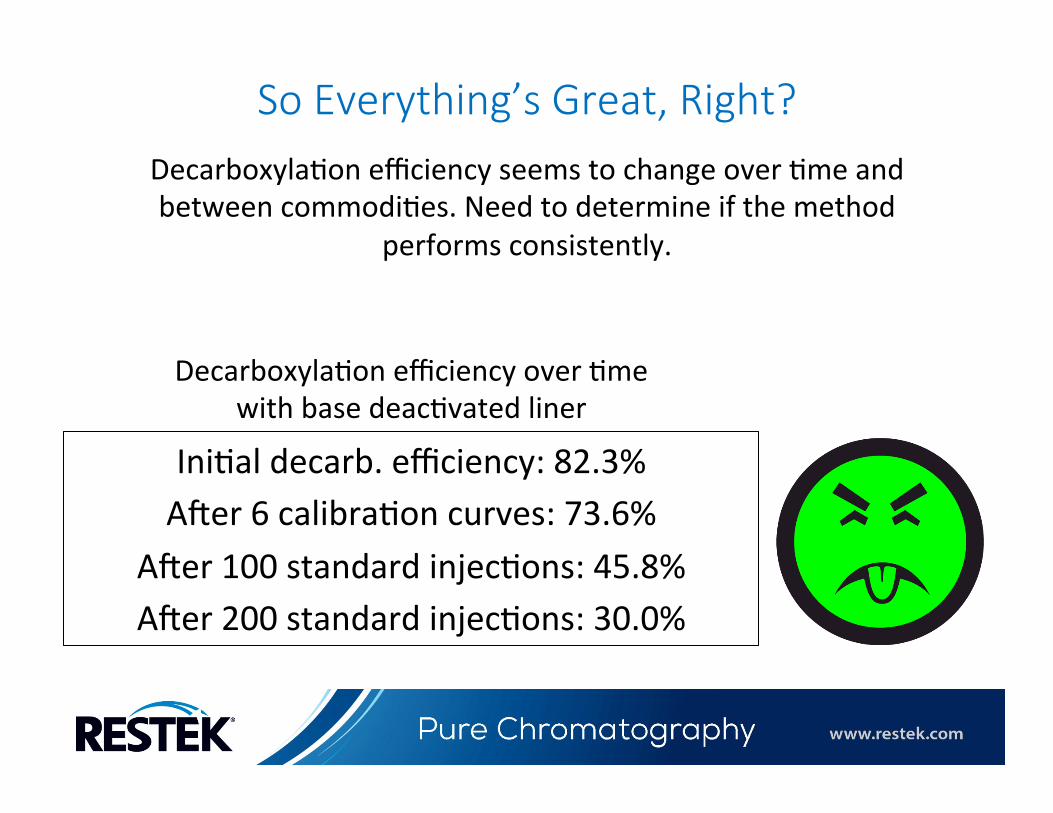
So Everything’s Great, Right? Decarboxyla<on efficiency seems to change over <me and between commodi<es. Need to determine if the method
performs consistently.
Ini<al decarb. efficiency: 82.3% Ater 6 calibra<on curves: 73.6%
Ater 100 standard injec<ons: 45.8% Ater 200 standard injec<ons: 30.0%
Decarboxyla<on efficiency over <me with base deac<vated liner
Summary
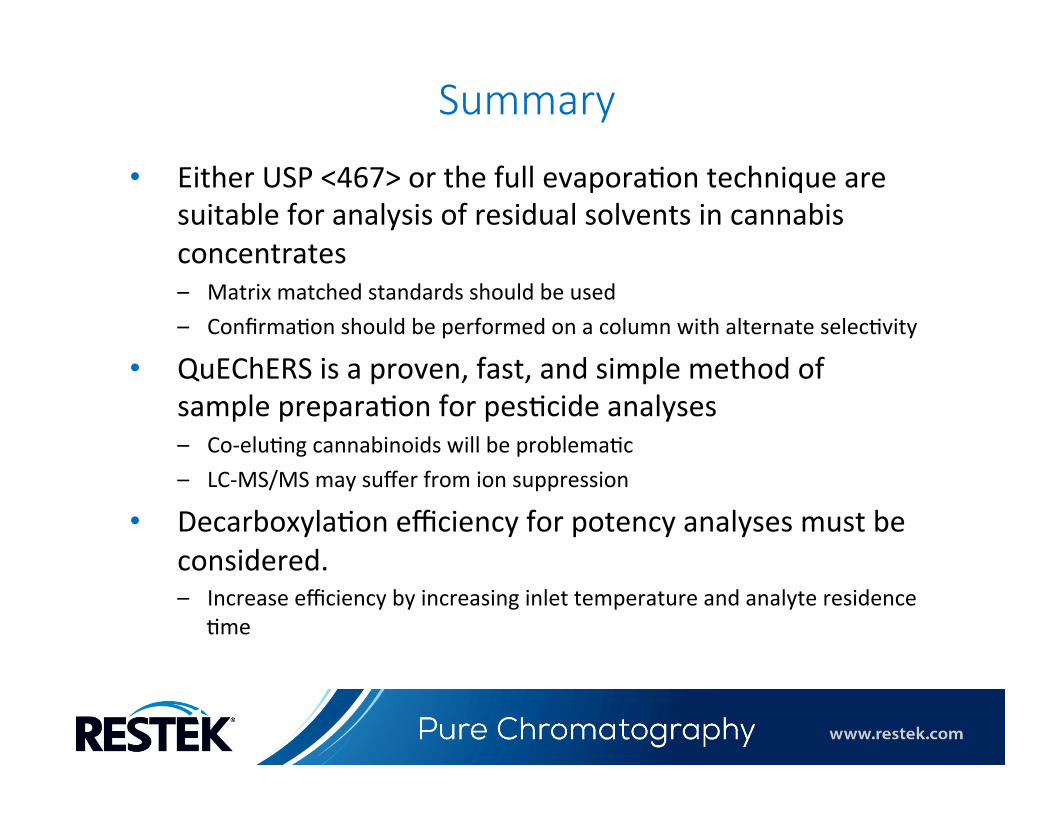
• Either USP <467> or the full evapora<on technique are suitable for analysis of residual solvents in cannabis concentrates – Matrix matched standards should be used – Confirma<on should be performed on a column with alternate selec<vity
• QuEChERS is a proven, fast, and simple method of sample prepara<on for pes<cide analyses – Co-‐elu<ng cannabinoids will be problema<c – LC-‐MS/MS may suffer from ion suppression
• Decarboxyla<on efficiency for potency analyses must be considered. – Increase efficiency by increasing inlet temperature and analyte residence
<me
Ques6ons?