2015 3rd quarter office market report
TRANSCRIPT
MAIN OFFICE ADDRESS: 4198 Cox Road, Suite 200 | Glen Allen, VA 23060 MAILING ADDRESS: P.O. Box 71150 | Richmond, VA 23255
T 804-346-4966 F 804-346-5901 COMMONWEALTHCOMMERCIAL.COM
OFFICE LOCATIONS: Richmond | Hampton Roads | Nashville | Jacksonville | Greensboro | Tampa
3RD QUARTER 2015RICHMOND OFFICE MARKET REPORT
FORECASTThe Richmond, VA Office Market shifted into the fourth quarter experiencing increases in both net absorption and rental rate for Class A inventory during the third quarter. This can be attributed to several large lease transactions by VCU/MCV Health Systems throughout the Central Business District (CBD) along with Retail Data, LLC securing a large block in the Northwest Quadrant (NWQ) near Innsbrook.
We expect to see absorption throughout both the CBD and NWQ to continue to improve during the fourth quarter, but anticipate rental rates to move in opposite directions as inventory shrinks even more throughout the NWQ. The introduction of the Gateway Tower along with recent vacancy in the James Center and others throughout the CBD should only increase the competitive pressure to drive down rates for tenants in that market. The Southwest Quadrant (SWQ) continues to lag behind in lease volume, but improved from a second quarter slump with substantial lease deals done in the Boulders and Fairfax buildings in Midlothian and should see occupancy improve through the fourth quarter.
A few trends to keep an eye on include an increased demand for “new” office product and a recent rise in office condominium
9.6% VACANCY
321,500 SF UNDER CONSTRUCTION
327,022 SF NET ABSORPTION
$17.49 PSF AVERAGE RENTAL RATES
T 804-346-4966 F 804-346-5901 COMMONWEALTHCOMMERCIAL.COM
RICHMOND OFFICE MARKET REPORT
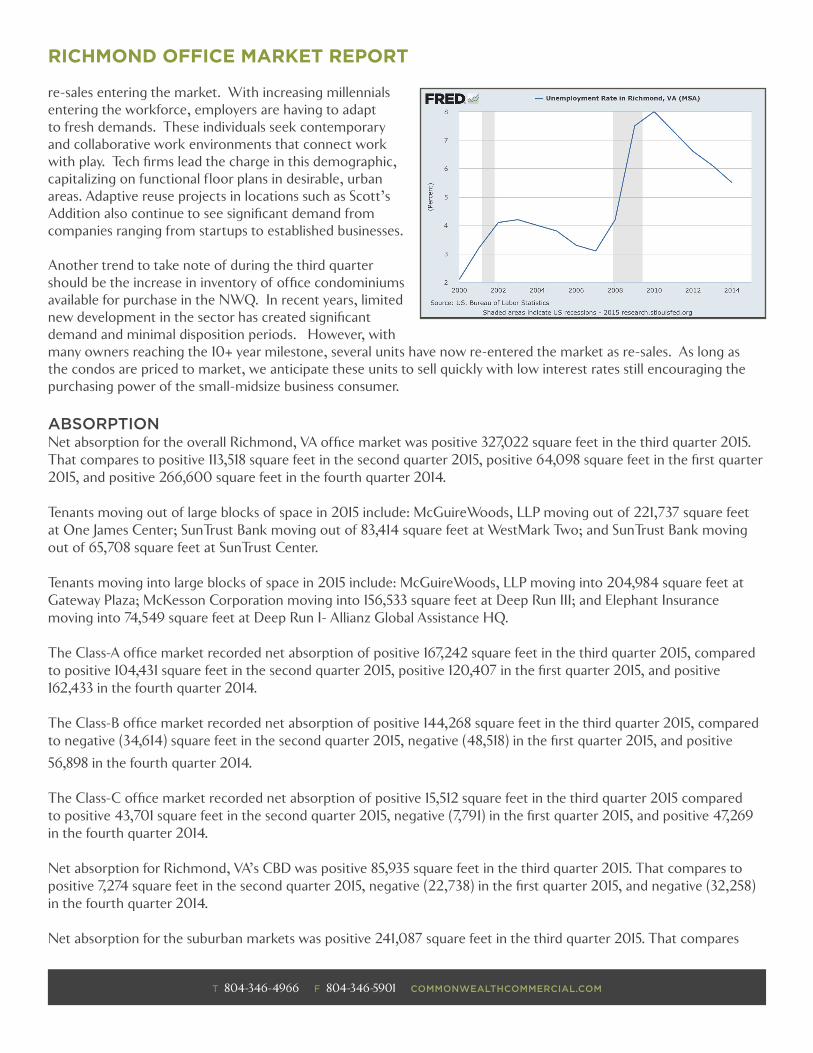
re-sales entering the market. With increasing millennials entering the workforce, employers are having to adapt to fresh demands. These individuals seek contemporary and collaborative work environments that connect work with play. Tech firms lead the charge in this demographic, capitalizing on functional floor plans in desirable, urban areas. Adaptive reuse projects in locations such as Scott’s Addition also continue to see significant demand from companies ranging from startups to established businesses.
Another trend to take note of during the third quarter should be the increase in inventory of office condominiums available for purchase in the NWQ. In recent years, limited new development in the sector has created significant demand and minimal disposition periods. However, with many owners reaching the 10+ year milestone, several units have now re-entered the market as re-sales. As long as the condos are priced to market, we anticipate these units to sell quickly with low interest rates still encouraging the purchasing power of the small-midsize business consumer.
ABSORPTIONNet absorption for the overall Richmond, VA office market was positive 327,022 square feet in the third quarter 2015. That compares to positive 113,518 square feet in the second quarter 2015, positive 64,098 square feet in the first quarter 2015, and positive 266,600 square feet in the fourth quarter 2014.
Tenants moving out of large blocks of space in 2015 include: McGuireWoods, LLP moving out of 221,737 square feetat One James Center; SunTrust Bank moving out of 83,414 square feet at WestMark Two; and SunTrust Bank moving out of 65,708 square feet at SunTrust Center.
Tenants moving into large blocks of space in 2015 include: McGuireWoods, LLP moving into 204,984 square feet atGateway Plaza; McKesson Corporation moving into 156,533 square feet at Deep Run III; and Elephant Insurance moving into 74,549 square feet at Deep Run I- Allianz Global Assistance HQ.
The Class-A office market recorded net absorption of positive 167,242 square feet in the third quarter 2015, comparedto positive 104,431 square feet in the second quarter 2015, positive 120,407 in the first quarter 2015, and positive 162,433 in the fourth quarter 2014.
The Class-B office market recorded net absorption of positive 144,268 square feet in the third quarter 2015, comparedto negative (34,614) square feet in the second quarter 2015, negative (48,518) in the first quarter 2015, and positive
56,898 in the fourth quarter 2014.
The Class-C office market recorded net absorption of positive 15,512 square feet in the third quarter 2015 comparedto positive 43,701 square feet in the second quarter 2015, negative (7,791) in the first quarter 2015, and positive 47,269 in the fourth quarter 2014.
Net absorption for Richmond, VA’s CBD was positive 85,935 square feet in the third quarter 2015. That compares to positive 7,274 square feet in the second quarter 2015, negative (22,738) in the first quarter 2015, and negative (32,258) in the fourth quarter 2014.
Net absorption for the suburban markets was positive 241,087 square feet in the third quarter 2015. That compares

T 804-346-4966 F 804-346-5901 COMMONWEALTHCOMMERCIAL.COM
RICHMOND OFFICE MARKET REPORT
to positive 106,244 square feet in second quarter 2015, positive 86,836 in the first quarter 2015, and positive 298,858 in the fourth quarter 2014.
VACANCYThe office vacancy rate in the Richmond, VA market area decreased to 9.6% at the end of the third quarter 2015. Thevacancy rate was 9.7% at the end of the second quarter 2015, 9.8% at the end of the first quarter 2015, and 9.7% at the end of the fourth quarter 2014.
Class-A projects reported a vacancy rate of 9.4% at the end of the third quarter 2015, 8.8% at the end of the secondquarter 2015, 9.2% at the end of the first quarter 2015, and 9.2% at the end of the fourth quarter 2014.
Class-B projects reported a vacancy rate of 10.8% at the end of the third quarter 2015, 11.3% at the end of the secondquarter 2015, 11.1% at the end of the first quarter 2015, and 11.0% at the end of the fourth quarter 2014.
Class-C projects reported a vacancy rate of 7.3% at the end of the third quarter 2015, 7.5% at the end of second quarter2015, 7.8% at the end of the first quarter 2015, and 7.8% at the end of the fourth quarter 2014.
The overall vacancy rate in Richmond, VA’s CBD at the end of the third quarter 2015 increased to 10.7%. The vacancy rate was 9.5% at the end of the second quarter 2015, 9.5% at the end of the first quarter 2015, and 9.4% at the end of the fourth quarter 2014.
The vacancy rate in the suburban markets decreased to 9.2% in the third quarter 2015. The vacancy rate was 9.7% atthe end of the second quarter 2015, 9.9% at the end of the first quarter 2015, and 9.8% at the end of the fourth quarter 2014.
LARGEST LEASE SIGNINGSThe largest lease signings occurring in 2015 included: the 110,000-square-foot lease signed by VCU Health Systems at11950 W. Broad St. in the NWQ; the 32,679-square-foot deal signed by VCU Health Systems at The Jackson Center in the CBD; and the 29,923-square-foot lease signed by Rutherfoord at Libbie Mill: Phase II in the NWQ.
SUBLEASE VACANCYThe amount of vacant sublease space in the Richmond, VA market decreased to 355,379 square feet by the end of thethird quarter 2015, from 407,443 square feet at the end of the second quarter 2015. There was 406,789 square feet vacant at the end of the first quarter 2015 and 446,676 square feet at the end of the fourth quarter 2014.
Richmond, VA’s Class-A projects reported vacant sublease space of 335,269 square feet at the end of third quarter 2015, down from the 388,533 square feet reported at the end of the second quarter 2015. There were 378,534 square feet of sublease space vacant at the end of the first quarter 2015, and 419,662 square feet at the end of the fourth quarter 2014.
Class-B projects reported vacant sublease space of 14,689 square feet at the end of the third quarter 2015, up from the13,489 square feet reported at the end of the second quarter 2015. At the end of the first quarter 2015 there were 20,451 square feet, and at the end of the fourth quarter 2014 there were 24,631 square feet vacant.
Class-C projects reported no vacant sublease space from the second quarter 2015 to the third quarter 2015. Sublease vacancy went from 5,421 square feet to 5,421 square feet during that time. There was 7,804 square feet at the end of the first quarter 2015, and 2,383 square feet at the end of the fourth quarter 2014.
T 804-346-4966 F 804-346-5901 COMMONWEALTHCOMMERCIAL.COM
RICHMOND OFFICE MARKET REPORT
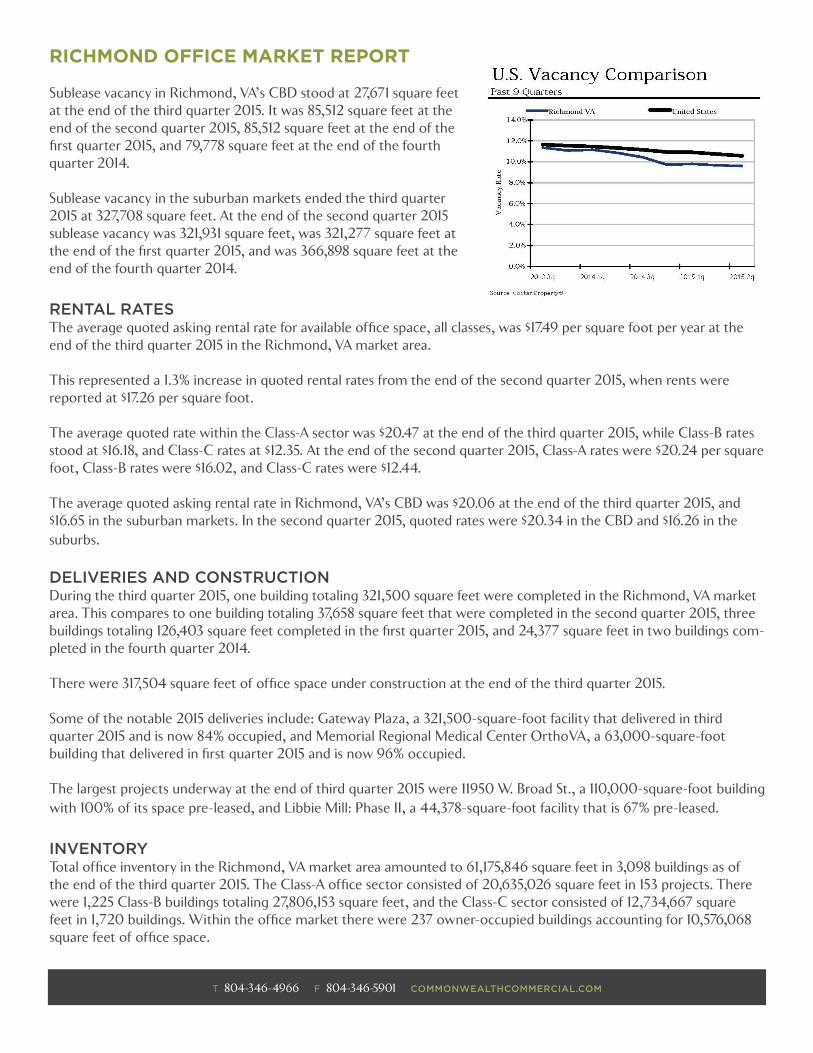
Sublease vacancy in Richmond, VA’s CBD stood at 27,671 square feet at the end of the third quarter 2015. It was 85,512 square feet at the end of the second quarter 2015, 85,512 square feet at the end of the first quarter 2015, and 79,778 square feet at the end of the fourth quarter 2014.
Sublease vacancy in the suburban markets ended the third quarter 2015 at 327,708 square feet. At the end of the second quarter 2015 sublease vacancy was 321,931 square feet, was 321,277 square feet at the end of the first quarter 2015, and was 366,898 square feet at the end of the fourth quarter 2014.
RENTAL RATESThe average quoted asking rental rate for available office space, all classes, was $17.49 per square foot per year at theend of the third quarter 2015 in the Richmond, VA market area.
This represented a 1.3% increase in quoted rental rates from the end of the second quarter 2015, when rents were reported at $17.26 per square foot.
The average quoted rate within the Class-A sector was $20.47 at the end of the third quarter 2015, while Class-B rates stood at $16.18, and Class-C rates at $12.35. At the end of the second quarter 2015, Class-A rates were $20.24 per square foot, Class-B rates were $16.02, and Class-C rates were $12.44.
The average quoted asking rental rate in Richmond, VA’s CBD was $20.06 at the end of the third quarter 2015, and$16.65 in the suburban markets. In the second quarter 2015, quoted rates were $20.34 in the CBD and $16.26 in the suburbs.
DELIVERIES AND CONSTRUCTIONDuring the third quarter 2015, one building totaling 321,500 square feet were completed in the Richmond, VA marketarea. This compares to one building totaling 37,658 square feet that were completed in the second quarter 2015, threebuildings totaling 126,403 square feet completed in the first quarter 2015, and 24,377 square feet in two buildings com-pleted in the fourth quarter 2014.
There were 317,504 square feet of office space under construction at the end of the third quarter 2015.
Some of the notable 2015 deliveries include: Gateway Plaza, a 321,500-square-foot facility that delivered in thirdquarter 2015 and is now 84% occupied, and Memorial Regional Medical Center OrthoVA, a 63,000-square-foot building that delivered in first quarter 2015 and is now 96% occupied.
The largest projects underway at the end of third quarter 2015 were 11950 W. Broad St., a 110,000-square-foot buildingwith 100% of its space pre-leased, and Libbie Mill: Phase II, a 44,378-square-foot facility that is 67% pre-leased.
INVENTORYTotal office inventory in the Richmond, VA market area amounted to 61,175,846 square feet in 3,098 buildings as ofthe end of the third quarter 2015. The Class-A office sector consisted of 20,635,026 square feet in 153 projects. There were 1,225 Class-B buildings totaling 27,806,153 square feet, and the Class-C sector consisted of 12,734,667 square feet in 1,720 buildings. Within the office market there were 237 owner-occupied buildings accounting for 10,576,068 square feet of office space.

T 804-346-4966 F 804-346-5901 COMMONWEALTHCOMMERCIAL.COM
RICHMOND OFFICE MARKET REPORT
SALESTallying office building sales of 15,000 square feet or larger, Richmond, VA office sales figures rose during the second quarter 2015 in terms of dollar volume compared to the first quarter of 2015.
In the second quarter, six office transactions closed with a total volume of $36,853,632. The six buildings totaled 313,390 square feet and the average price per square foot equated to $117.60. That compares to three transactions totaling $3,250,000 in the first quarter 2015.
The total square footage in the first quarter was 77,201 square feet for an average price per square foot of $42.10.
Total office building sales activity in 2015 was down compared to 2014. In the first six months of 2015, the market saw nine office sales transactions with a total volume of $40,103,632. The price per square foot averaged $102.67.
In the same first six months of 2014, the market posted 14 transactions with a total volume of $96,134,883. The price per square foot averaged $97.42.
Cap rates have been lower in 2015, averaging 8.9% compared to the same period in 2014 when they averaged 9.96%.
One of the largest transactions that has occurred within the last four quarters in the Richmond, VA market is the saleof Westerre I & II. This 163,290-square-foot office building sold for $22,000,000, or $134.73 per square foot. The property sold on 11/10/2014, at a 8.12% cap rate.
SELECT TOP UNDER CONSTRUCTION PROPERTIESProperty Name
Sub-Market
RBA # ofFloors
Class Occupied Quoted Rate
Grnd Brk Date
Deliv Date
Leasing Co.
Developer Architect
11950 W.
Broad St.
Northwest 110,000 5 A 100% N/A 1st
Quarter
2015
1st
Quarter
2016
Stanley
Shield LLC
Commonwealth
Construction
Mgmt
Price Studios
Libbie Mill:
Phase II
Northwest 44,378 2 A 67% Negotiable 2nd
Quarter
2015
2nd
Quarter
2016
CBRE |
Richmond
Gumenick
Properties
Commonwealth
Architects
10901 Iron
Bridge Rd
Southwest 43,000
(5,500
Commercial)
1 A 0% Negotiable 4th
Quarter
2014
4th
Quarter
2015
Cambridge
Construction
Cambridge
Construction
N/A
2321 E
Main St
Downtown 33,200 3 B 83% $19.00 3rd
Quarter
2015
1st
Quarter
2016
MacFarlane
Partners,
LLC
MacFarlane
Partners, LLC
N/A

T 804-346-4966 F 804-346-5901 COMMONWEALTHCOMMERCIAL.COM
RICHMOND OFFICE MARKET REPORT
SELECT YEAR-TO-DATE DELIVERIESProperty Name
Sub-Market
RBA # ofFloors
Class Occupied Quoted Rate
Grnd Brk Date
Deliv Date
Leasing Co. Developer Architect
Gateway
Plaza
Downtown 321,500 19 A 84% Negotiable 3rd
Quarter
2013
3rd
Quarter
2015
Colliers
International
Clayco Inc. Forum
Studios,
Inc.
Memorial
Regional
Medical
Center
OrthoVA
East 63,000 3 A 96% $24.50 2nd
Quarter
2014
1st
Quarter
2015
Lingerfelt
Commonwealth
Partners VA
Lingerfelt
Commonwealth
Partners VA
Price Studios
MEDARVA
- Building 1
Northwest 60,000 3 A 32% $24.50 1st
Quarter
2014
1st
Quarter
2015
Cushman &
Wakefield |
Thalhimer
Lingerfelt
Commonwealth
Partners VA
Price Studios
Reynolds
Commons
Northwest 37,658 2 A 69% $23.50 2nd
Quarter
2014
2nd
Quarter
2015
CBRE |
Richmond
Reynolds
Development
N/A
The information and details contained herein have been obtained from third-party sources believed to be reliable; however, Commonwealth Commercial has not independently verified its accuracy. Commonwealth Commercial makes no representations, guarantees, or express or implied warranties of any kind regarding the accuracy or completeness of the information and details provided herein, including but not limited to the implied warranty of suitability and fitness for a particular purpose.
Interested parties should perform their own due diligence regarding the accuracy of the information. The information provided herein, including any sale or lease terms, is being provided subject to errors, omissions, changes of price or conditions, prior sale or lease, and withdrawal without notice. Third-party data sources: CoStar Group, Inc., Moody’s Economy.com, Nielsen/Claritas, Real Capital Analytics, U.S. Bureau of Economic Analysis, U.S. Bureau of Labor Statistics, U.S. Census Bureau, Greater Richmond Partnership, U.S. Department of Commerce.
The Commonwealth Commercial Office Market Report compiles relevant market data by using a third-party database for the proprietary analysis of specific office properties above 10,000 SF in the Richmond Metropolitan Area.
Tucker DowdyT 804-228-4932
E tdowdy@ commonwealthcommercial.com
Fred PlaistedT 804-228-4933
E fplaisted@ commonwealthcommercial.com
Russell WyattT 804-433-1817
Jamie GalantiT 804-433-1825
E jgalanti@ commonwealthcommercial.com
Evan OcheltreeT 804-228-4930
E eocheltree@ commonwealthcommercial.com
Office Team
Mark ClaudT 804-433-1803