2015-16 operating grants manual - british columbia · 2015/16 operating grants manual march 2015...
TRANSCRIPT

Resource Management Division
OPERATING GRANTS MANUAL
2015/16 2016/17 2017/18
March 2015

2015/16 Operating Grants Manual
March 2015
Denotes changes 1
OVERVIEW OF PROVINCIAL FUNDING The Ministry of Education will be providing a total of $4.826 billion in operating grants to boards of education in the 2015/16 school year.
The General Operating Grants have been estimated using the Funding Allocation System formulae contained in this manual. The calculations are detailed in the following sections. Tables showing funding amounts for every district are included in a separate, supplementary document. These tables are updated following each enrolment count that occurs during the school year: September, February and May. The General Operating Grants do not include special purpose or discretionary grants. Details on these grants will be provided when available.
School Year
Operating Grants ($ billions)
2014/15 $4.725
2015/16 $4.827
2016/17 $4.843
2017/18 $4.882
2015/16 Operating Grants Manual
March 2015
Denotes changes 2
ALLOCATION OF FUNDING TO BOARDS OF EDUCATION The Funding Allocation System allocates the General Operating Grants using individual district enrolments and specific factors that apply to each school district. The General Operating Grants are calculated based on estimated enrolment data provided by school districts. The operating grants will be updated based on actual enrolment and other data collected from school districts throughout the school year:
July enrolment count o Summer Learning o Cross‐Enrolled Grade 8 and 9 Students
September enrolment count o Basic Enrolment‐Based Funding
Standard Schools enrolment Continuing Education Distributed Learning Alternate Schools Home Schooling
o Supplement for Enrolment Decline o Supplement for Unique Student Needs
Special Needs English Language Learning Aboriginal Education Adult Education
o Supplement for Salary Differential o Funding Protection
February enrolment count o Basic Enrolment‐Based Funding
Continuing Education Distributed Learning
o Special Needs Enrolment Growth o Newcomer Refugees
May enrolment count o Basic Enrolment‐Based Funding
Continuing Education Distributed Learning
These grants are calculated based on data collected from the previous school year:
Course challenges
Supplement for Significant Cumulative Enrolment Decline
Supplement for Unique Geographic Factors o Small Community Supplement o Low Enrolment Factor o Rural Factor o Climate Factor o Sparseness Factor o Student Location Factor and Supplemental Student Location Factor

2015/16 Operating Grants Manual
March 2015
Denotes changes 3
FUNDING ALLOCATION SYSTEM TABLES Table 1a Provincial Overview of Operating Grant Allocations (Full‐Year) – 2015/16
Table 1b Provincial Overview of Funded FTE Enrolment (Full‐Year) – 2015/16
Table 2a Provincial Overview of 2015/16 Operating Grants (September)
Table 2b Enrolment‐Based Funding (September)
Table 3a Supplement for Enrolment Decline
Table 3b Supplement for Significant Cumulative Enrolment Decline
Table 4a Supplement for Unique Student Needs – Special Needs
Table 4b Supplement for Unique Student Needs – Other
Table 4c Supplement for Unique Student Needs – Vulnerable Students
Table 5 Supplement for Salary Differential
Table 6 Supplement for Unique Geographic Factors – Summary
Table 6a Supplement for Unique Geographic Factors – Small Community Supplement
Table 6b Supplement for Unique Geographic Factors – Low Enrolment Factor
Table 6c Supplement for Unique Geographic Factors – Rural Factor
Table 6d Supplement for Unique Geographic Factors – Climate Factor
Table 6e Supplement for Unique Geographic Factors – Sparseness Factor
Table 6f Supplement for Unique Geographic Factors – Student Location Factor
Table 6g Supplement for Unique Geographic Factors – Supplemental Student Location Factor
Table 7 Funding Protection
Table 8 Supplement for the Education Plan, 2015/16
Table 9a Summer Learning
Table 9b Summer Learning Supplemental Funding
Table 9c Cross‐Enrolled Grade 8 and 9 Students
Table 10 Enrolment‐Based Funding (February)
Table 11 Special Needs Enrolment Growth (February)
Table 12 Newcomer Refugees (February)
Table 13 Enrolment‐Based Funding (May)
Table 14 Administrative Savings, 2015/16 through 2017/18
Table 15 Labour Settlement Funding, 2015/16
Table 16 Holdback Allocation
2015/16 Operating Grants Manual
March 2015
Denotes changes 4
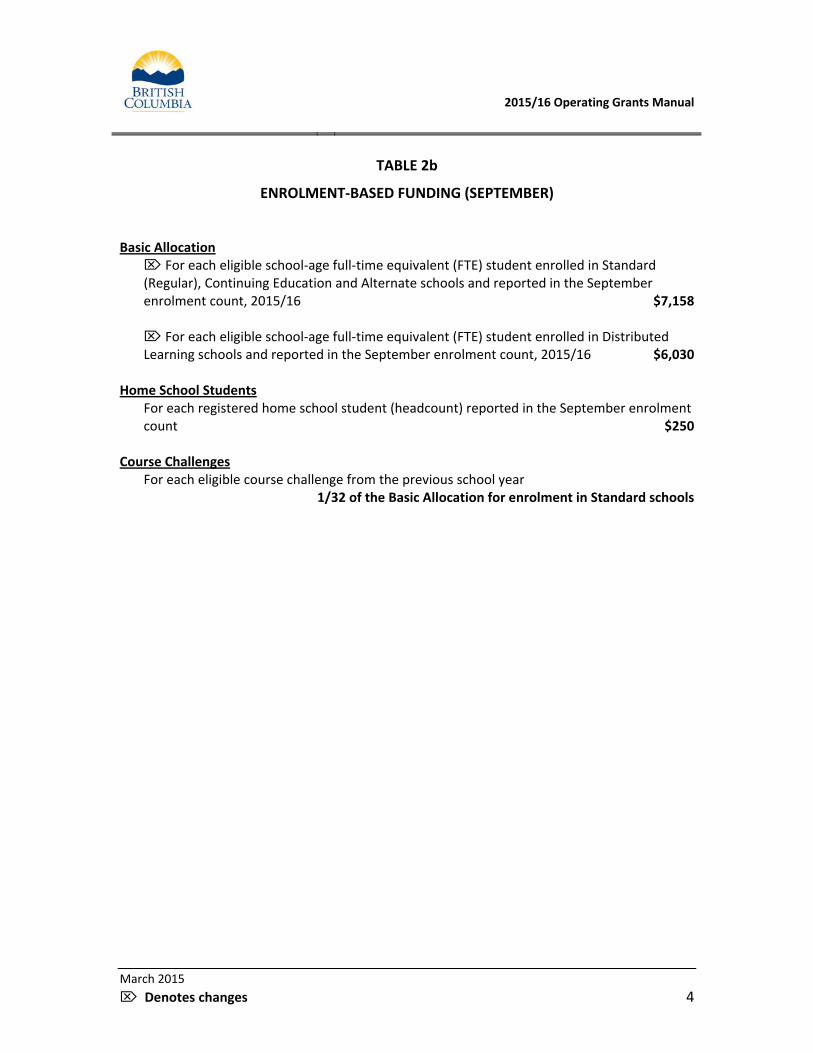
TABLE 2b
ENROLMENT‐BASED FUNDING (SEPTEMBER) Basic Allocation For each eligible school‐age full‐time equivalent (FTE) student enrolled in Standard (Regular), Continuing Education and Alternate schools and reported in the September enrolment count, 2015/16 $7,158
For each eligible school‐age full‐time equivalent (FTE) student enrolled in Distributed Learning schools and reported in the September enrolment count, 2015/16 $6,030
Home School Students
For each registered home school student (headcount) reported in the September enrolment count $250
Course Challenges For each eligible course challenge from the previous school year
1/32 of the Basic Allocation for enrolment in Standard schools

2015/16 Operating Grants Manual
March 2015
Denotes changes 5
TABLE 3a
SUPPLEMENT FOR ENROLMENT DECLINE For each school‐age FTE student greater than a 1% decline, but less than or equal to a 4% decline from the previous September:
50% of the Basic Allocation for enrolment in Standard schools For each school‐age FTE student greater than a 4% decline from the previous September: 75% of the Basic Allocation for enrolment in Standard schools
(Note: Decline is the change in enrolment between September 30 enrolment of the current school year and the September 30 enrolment of the previous school year.)
TABLE 3b
SUPPLEMENT FOR SIGNIFICANT CUMULATIVE ENROLMENT DECLINE
For each school‐age FTE student greater than a 7% decline between the previous September and the September two years prior to that:
50% of the Current Year Basic Allocation for enrolment in Standard schools (Note: For 2015/16, the decline is the change in enrolment between the September 30, 2012 and September 30, 2014 enrolments.)
2015/16 Operating Grants Manual
March 2015
Denotes changes 6
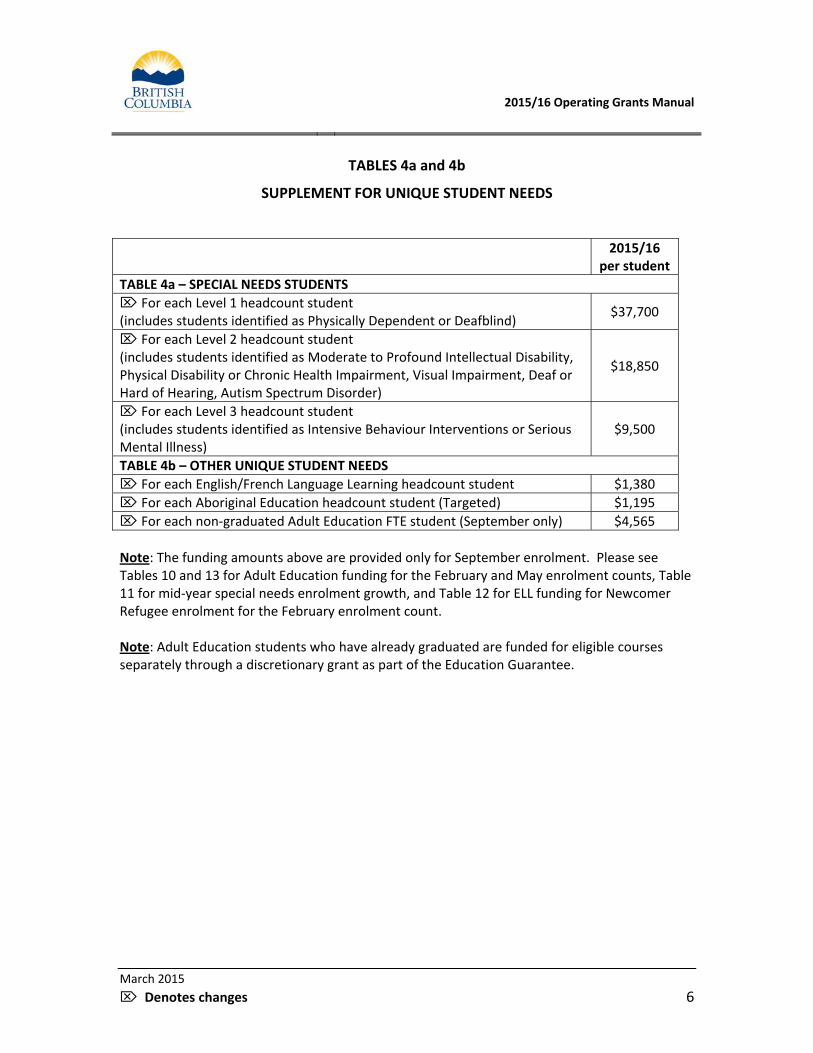
TABLES 4a and 4b
SUPPLEMENT FOR UNIQUE STUDENT NEEDS
2015/16 per student
TABLE 4a – SPECIAL NEEDS STUDENTS
For each Level 1 headcount student (includes students identified as Physically Dependent or Deafblind)
$37,700
For each Level 2 headcount student (includes students identified as Moderate to Profound Intellectual Disability, Physical Disability or Chronic Health Impairment, Visual Impairment, Deaf or Hard of Hearing, Autism Spectrum Disorder)
$18,850
For each Level 3 headcount student (includes students identified as Intensive Behaviour Interventions or Serious Mental Illness)
$9,500
TABLE 4b – OTHER UNIQUE STUDENT NEEDS
For each English/French Language Learning headcount student $1,380
For each Aboriginal Education headcount student (Targeted) $1,195
For each non‐graduated Adult Education FTE student (September only) $4,565
Note: The funding amounts above are provided only for September enrolment. Please see Tables 10 and 13 for Adult Education funding for the February and May enrolment counts, Table 11 for mid‐year special needs enrolment growth, and Table 12 for ELL funding for Newcomer Refugee enrolment for the February enrolment count. Note: Adult Education students who have already graduated are funded for eligible courses separately through a discretionary grant as part of the Education Guarantee.

2015/16 Operating Grants Manual
March 2015
Denotes changes 7
TABLE 4c
SUPPLEMENT FOR UNIQUE STUDENT NEEDS – VULNERABLE STUDENTS The Supplement for Vulnerable Students provides funding to districts to assist with providing services to vulnerable students in addition to the CommunityLINK special purpose grant. This supplement is calculated based on the following factors and sub‐components:
Economic conditions (65%) o Income Assistance (40%) o Deep poverty (30%) o Moderate poverty (30%)
Demographic vulnerability (12.5%) o Aboriginal population (50%) o Single parent (30%) o Recent immigrant (20%)
Social conditions (12.5%) o Children in care (60%) o Serious crime (20%) o Suicide/homicide (20%)
Educational attainment (10%) o Adults without high school graduation (100%)
The above formula was calculated and compared to the 2012/13 CommunityLINK allocation. Districts that generated less funding through this formula than their CommunityLINK allocation will have their CommunityLINK funding maintained at their existing amounts. Districts that generate more funding through this formula will receive the Supplement for Vulnerable Students in addition to their CommunityLINK allocation. This supplement will be provided in the amounts listed on Table 4c for each school year 2015/16, 2016/17 and 2017/18.

2015/16 Operating Grants Manual
March 2015
Denotes changes 8
TABLE 5
SUPPLEMENT FOR SALARY DIFFERENTIAL
The Supplement for Salary Differential provides additional funding to districts with higher average teacher salaries. The estimated Supplement for 2015/16 is based on average educator salaries as at September 30, 2014. This Supplement will be recalculated in the autumn based on actual educator salaries as at September 30, 2015. The calculation for the supplement uses the following data and process: The count for regular teachers includes all those who are classroom teachers, helping teachers, other instructional support, department heads and regular teachers receiving administrative allowances other than department heads. Teachers reported as Distributed Learning Educators, Continuing Education, or Exchange Teachers are included, but teachers reported in Provincial Resource Programs (PRPs), Youth Custody/Residential Attendance Centres, and the Conseil Scolaire Francophone are excluded. Teachers who were reported with no grid category are also excluded, with the exception of Continuing Education teachers reported by SD 39 (Vancouver). Base salary is added to isolation allowance to arrive at total salary. In addition, as most vice‐principals also teach in the classroom, the number of FTE vice‐principals is included at the Category 6 maximum teacher salary. The increments, as reported after September 30, 2015, will be included as part of the average educator salary calculation. Each district’s average teacher salary is compared to the provincial average and the variance is shown in the second column. The variance is then multiplied by an estimated number of educators, which is calculated by taking the total district (school‐age and adult) enrolment divided by 18, the estimated average student/educator ratio for the province. The estimated number of educators is then multiplied by the salary differential for each district to generate the Provincial Average Salary Differential. Following this, a per FTE amount is allocated based on total district enrolment (school‐age and adult). The Provincial Average Salary Differential and the per FTE allocation comprise the Supplement for Salary Differential.

2015/16 Operating Grants Manual
March 2015
Denotes changes 9
TABLE 6a
SUPPLEMENT FOR UNIQUE GEOGRAPHIC FACTORS – SMALL COMMUNITY SUPPLEMENT
The Small Community Supplement is provided when a student population within a defined area does not exceed 250 elementary students and/or 635 secondary students. This defined area is the number of FTE students in a single school, or the combined total of FTE students of all schools located within 5 kilometres by the shortest road distance for elementary schools and 25 kilometres by the shortest road distance for secondary schools. Only standard (regular) schools are eligible for this supplement. The Small Community Supplement is based on the previous year’s enrolment. For 2015/16, the Supplement is determined using funded FTE enrolment as at September 30, 2014. The Supplement is calculated for each “community” by placing the number of FTEs into the applicable formula that appears below for each of the three categories. The totals for each community are then aggregated to provide a total district funding amount for the Small Community Supplement. 1. Elementary Small Community Funding
Eligibility: Communities with 250 or fewer elementary school‐age FTE students and that do not qualify for 1a. below.
For each community with 8 or fewer elementary FTEs: $77,325 For each community with 9 to 110 elementary FTEs: $162,400 For each community with 110 to 250 elementary FTEs:
$162,400 – ($1,160 x (FTE – 110)) 1a. Elementary Small Community Funding – Small Remote Schools
Eligibility: Communities with 75 or fewer elementary school‐age FTE students AND at least one of the following:
The school is located at least 40 kilometres by road from the next nearest elementary school
The school is located at least 5 kilometres from the next nearest elementary school, which can only be accessed by gravel road, logging road or by water
For each community with 15 or fewer elementary FTEs: $164,800 For each community with 16 to 75 elementary FTEs: $185,400 Note: a community can only be eligible for one of 1. or 1a. above.

2015/16 Operating Grants Manual
March 2015
Denotes changes 10
2. Secondary Small Community Funding
Eligibility: Communities with 635 or fewer secondary school‐age FTE students For each community with 100 or fewer secondary FTEs: FTEs x $4,681.25 For each community with 100 to 635 secondary FTEs: $468,125 – ($875 x (FTEs – 100))
3. Grade 11 and 12 Small Community Funding
Eligibility: Communities eligible for the Secondary Small Community Funding, and with school‐age enrolments in Grades 11 and/or 12:
For each community with 15 or fewer Grade 11 & 12 FTEs: $12,600 per FTE For each community with more than 15 and less than 215 Grade 11 & 12 FTEs:
$189,000 – ((FTE – 15) x $945)
TABLE 6b
SUPPLEMENT FOR UNIQUE GEOGRAPHIC FACTORS – LOW ENROLMENT FACTOR
The Low Enrolment Factor is based on the previous year’s enrolment. For 2015/16, the Low Enrolment Factor is determined using enrolment as at September 30, 2014. Eligibility: 2,500 or fewer District school‐age FTEs: $1,378,125
Eligibility: Greater than 2,500, but fewer than 15,000 District school‐age FTE: $1,378,125 – ($110.25 x (FTE – 2,500))
Districts where school‐age enrolment exceeds 15,000 FTE are not eligible for this supplement.
TABLE 6c
SUPPLEMENT FOR UNIQUE GEOGRAPHIC FACTORS – RURAL FACTOR
The Rural Factor is calculated using:
Population of city in which the Board office is located
Distances from Board office to Vancouver and the nearest regional centre*
(5 – Population Scale) x 100 + km to Vancouver + km to Regional Ctr = Rural Index (%) 100 For each school district, the Rural Index is multiplied by the previous September’s Basic Allocation funding. The Rural Factor is weighted at 20%.

2015/16 Operating Grants Manual
March 2015
Denotes changes 11
Regional Centres are defined as population centres with a minimum population base of 70,000, according to Statistics Canada, 2006 Census. *Additional weighting is applied to distances to Vancouver and to the nearest regional centre where there is a water separation that requires ferry travel.
TABLE 6d
SUPPLEMENT FOR UNIQUE GEOGRAPHIC FACTORS – CLIMATE FACTOR Degree Days of Cooling The number of Degree Days of Cooling is taken from Environment Canada’s “Canadian Climate Normals, 1971‐2000”, and represents the number of degrees that the mean temperature for a given day is above 18 degrees Celsius. These Days are averaged by month and year using the 30‐year average. Days of Cooling are used to estimate the additional cooling requirements of buildings as a part of the Climate Factor funding. Degree Days of Heating The number of Degree Days of Heating is also taken from Environment Canada’s “Canadian Climate Normals, 1971‐2000”, and represents the number of degrees that the mean temperature for a given day is below 18 degrees Celsius. These Days are averaged by month and year using the 30‐year average. Days of Heating are used to estimate the additional heating requirements of buildings as a part of the Climate Factor funding. The Degree Days of Cooling and the Degree Days of Heating for each district have been added together to reach the Total Climate Degree Days. Total Climate Degree Days have been indexed to the provincial minimum of 2,836.3 Climate Days (SD 39 – Vancouver). The Climate Index, therefore, represents the additional heating and cooling days above the provincial minimum (Total Climate Days – Provincial Minimum). For each district, the Climate Index is multiplied by their previous year’s Basic Allocation funding. Climate Factor funding is weighted at 5%. The Climate Factor is calculated as follows:
Total Climate Days – provincial minimum x previous year’s Basic Allocation x 5%
10,000 Note: This Factor will be updated with Environment Canada’s “Canadian Climate Normals, 1981‐2010” in 2016/17, which may affect the Climate Index for some districts.

2015/16 Operating Grants Manual
March 2015
Denotes changes 12
TABLE 6e
SUPPLEMENT FOR UNIQUE GEOGRAPHIC FACTORS – SPARSENESS FACTOR The Sparseness Index addresses the fact that certain districts have a greater financial burden than others resulting from the separation of schools from the board office. Additional costs arise from increased travel. Columns 1 to 3 show the total paved, gravel and water distance in kilometres which separate dispersed schools from their board office. A school is eligible for inclusion in the Sparseness Index calculation if that school is more than 40 kilometres from its board office or if it is separated by water. 40 kilometres is known as the “threshold distance”. The Sparseness Index is calculated as follows: 1. Column 5 is the Total Weighted Distance of dispersed schools from their board office. It is
calculated as the sum of paved road distance, gravel road distance weighted by 1.5, and water distance weighted by 7.5. To reflect waiting times for ferries, 150 kilometres is added to the Total Weighted Distance for each dispersed school separated by water (Column 4). An additional $200,000 is provided for each dispersed school separated by water where the distance exceeds 50 kilometres (Column 12).
2. Column 6 indicates the Average Distance of dispersed schools from their board office. It is
arrived at by dividing Total Weighted Distance (Column 5) by the number of dispersed schools (Column 11).
3. Column 7 is the Average Distance to Threshold Ratio. It is arrived at by dividing Column 6
from the board office by the threshold distance (40 km). 4. Column 10 is the Dispersed FTE Enrolment (Column 9) as a percentage of total FTE
Enrolment (Column 8). Enrolment is all funded school‐age FTE as of September 30 of the previous year, excluding Distributed Learning students.
5. The Sparseness Index is derived as follows:
[Average Distance‐to‐Threshold Ratio (Column 7)] X [Sparse Enrolment Percentage (Column 10)] X [Number of Eligible Schools (Column 11) plus Board (taken as 5)]
The product of these factors is then divided by 100 to convert to the percentage known as the Sparseness Index. For each district, the Sparseness Index is multiplied by their previous year’s Basic Allocation funding. Sparseness Factor funding is weighted at 12%.

2015/16 Operating Grants Manual
March 2015
Denotes changes 13
TABLE 6f
SUPPLEMENT FOR UNIQUE GEOGRAPHIC FACTORS – STUDENT LOCATION FACTOR The Student Location Factor provides funding to districts based on standard school enrolment and the school‐age population density of communities within that district. The Student Location Factor is calculated as follows:
1. The community clusters as determined in the Small Community Supplement calculation are used
2. The school‐age population density according to the 2011 Census, Statistics Canada is identified for each community cluster
3. The number of school‐age FTE enrolled in standard schools from the previous school year is weighted according to the cluster’s school‐age population density:
School‐Age Population Density
Regional Centre or a District not eligible for
Rural Index (1)
Eligible for Small
Community Supplement
(2) Neither (1) nor (2)
Both (1) and (2)
Greater or Equal
to Less Than
0 18 1.5 4 4 4
18 50 0.5 1 1 1
50 85 0.25 1 0.5 0.5
85 200 0.05 1 0.1 0.1
200 1,000 0.02 0.5 0.04 0.04
4. Exceptions to the above table are applied:
a. Where elementary enrolment for a community cluster exceeds the elementary‐age population for that community according to the 2011 Census and the community is not a Regional Centre or the district is not eligible for the Rural Factor, the weighting is doubled.
b. For communities where there is no secondary enrolment, the nearest community with secondary enrolment has been identified, along with all other neighbouring communities without secondary enrolment. In such cases, the weighting for the community with secondary enrolment is modified by the proportional weightings of the non‐secondary clusters based on enrolment.
5. For every weighted elementary FTE, $255.50 is provided and for every weighted secondary FTE, $340.67 is provided.
6. A district base amount of $50,000 is provided to every district with less than 500 FTE enrolled in standard schools during the previous school year.

2015/16 Operating Grants Manual
March 2015
Denotes changes 14
TABLE 6g
SUPPLEMENT FOR UNIQUE GEOGRAPHIC FACTORS – SUPPLEMENTAL STUDENT LOCATION FACTOR
As a supplement to the Student Location Factor, this factor provides $5,000 for every eligible Level 1 special needs student and $1,000 for every eligible Level 2 special needs student. Enrolments are as at September of the previous school year.
TABLE 7
FUNDING PROTECTION Funding Protection is an additional amount provided to eligible school districts to ensure that districts are protected against any funding decline larger than 1.5% when compared to the previous autumn. Funding Protection is determined by comparing the total recalculated operating grants from the autumn of the previous school year to total autumn operating grants for the current year. For districts where declines exceed 1.5%, Funding Protection will provide additional funding in an amount that ensures the year‐to‐year decline is no greater than 1.5%. Labour settlement funding allocated through the operating grant formula is excluded from the Funding Protection calculation for 2015/16. Funding Protection does not include any grants provided outside the general operating grants. In the determination of Funding Protection, audit adjustments will be deducted from districts’ previous school year’s operating grants. In addition, audit adjustments will be recovered from districts where applicable, including those eligible for Funding Protection. Funding Protection will only be updated during the recalculation of the operating grants following the September enrolment count and is not recalculated again during the school year. Funding Protection is under review and is confirmed for only the 2015/16 school year.

2015/16 Operating Grants Manual
March 2015
Denotes changes 15
TABLE 8
SUPPLEMENT FOR THE EDUCATION PLAN, 2015/16 The Supplement for the Education Plan is in place for 2015/16 to assist districts with implementing initiatives as part of the Education Plan. This supplement is not confirmed for future years. The supplement is calculated based on September 2014 school‐age FTE enrolment at $20 per FTE with each district receiving a minimum of $10,000. The Supplement for the Education Plan is confirmed for only the 2015/16 school year. Further details regarding this supplement will be provided to boards of education in the near future. The Supplement for the Education Plan is not included in the calculation of Funding Protection for 2015/16.
2015/16 Operating Grants Manual
March 2015
Denotes changes 16
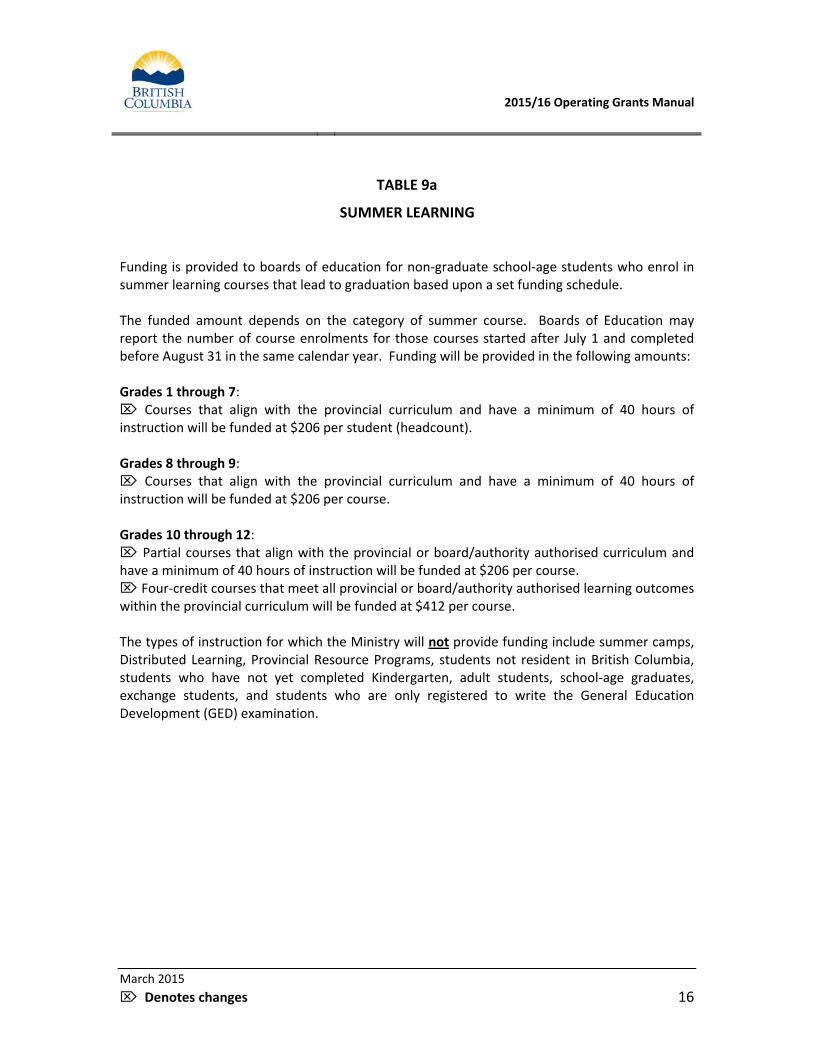
TABLE 9a
SUMMER LEARNING Funding is provided to boards of education for non‐graduate school‐age students who enrol in summer learning courses that lead to graduation based upon a set funding schedule. The funded amount depends on the category of summer course. Boards of Education may report the number of course enrolments for those courses started after July 1 and completed before August 31 in the same calendar year. Funding will be provided in the following amounts: Grades 1 through 7: Courses that align with the provincial curriculum and have a minimum of 40 hours of instruction will be funded at $206 per student (headcount). Grades 8 through 9: Courses that align with the provincial curriculum and have a minimum of 40 hours of instruction will be funded at $206 per course. Grades 10 through 12: Partial courses that align with the provincial or board/authority authorised curriculum and have a minimum of 40 hours of instruction will be funded at $206 per course. Four‐credit courses that meet all provincial or board/authority authorised learning outcomes within the provincial curriculum will be funded at $412 per course. The types of instruction for which the Ministry will not provide funding include summer camps, Distributed Learning, Provincial Resource Programs, students not resident in British Columbia, students who have not yet completed Kindergarten, adult students, school‐age graduates, exchange students, and students who are only registered to write the General Education Development (GED) examination.

2015/16 Operating Grants Manual
March 2015
Denotes changes 17
TABLE 9b
SUMMER LEARNING SUPPLEMENTAL FUNDING Students eligible for summer learning funding who also qualify for English/French Language Learning, Aboriginal Education and/or special needs funding will be funded at 1/16 of the appropriate supplement(s).
2015/16 per student
For each Level 1 headcount student (includes students identified as Physically Dependent or Deafblind)
$2,356
For each Level 2 headcount student (includes students identified as Moderate to Profound Intellectual Disability, Physical Disability or Chronic Health Impairment, Visual Impairment, Deaf or Hard of Hearing, Autism Spectrum Disorder)
$1,178
For each Level 3 headcount student (includes students identified as Intensive Behaviour Interventions or Serious Mental Illness)
$594
For each English/French Language Learning headcount student $86
For each Aboriginal Education headcount student $75
TABLE 9c
CROSS‐ENROLLED GRADE 8 & 9 STUDENTS School‐age students in Grades 8 and 9 can enrol in multiple locations and be funded for eligible courses, as long as at least one of their educational programs is delivered in whole or in part through Distributed Learning. Eligible cross‐enrolment courses are funded at a flat rate of $412 per full credit course. Course enrolment is counted in July for courses in which enrolment occurred during the previous school year. In order to be eligible for cross‐enrolment funding, the student must have been enrolled and funded as a Grade 8 or 9 school‐age student as at September 30 of the previous school year.

2015/16 Operating Grants Manual
March 2015
Denotes changes 18
TABLE 10
ENROLMENT‐BASED FUNDING (FEBRUARY)
CONTINUING EDUCATION Basic Allocation For each eligible school‐age full‐time equivalent (FTE) student enrolled in Continuing Education and reported in the February enrolment count, 2015/16 $7,158
Non‐Graduated Adult Education Students For each eligible non‐graduated adult education full‐time equivalent (FTE) student enrolled in Continuing Education and reported in the February enrolment count, 2015/16 $4,565
DISTRIBUTED LEARNING Basic Allocation For each eligible school‐age full‐time equivalent (FTE) student enrolled in Distributed Learning in Kindergarten to Grade 9 and reported in the February enrolment count, 2015/16 $3,015 For each eligible school‐age full‐time equivalent (FTE) student enrolled in Distributed Learning in Grades 10 to 12 and reported in the February enrolment count, 2015/16 $6,030
Non‐Graduated Adult Education Students For each eligible non‐graduated Adult Education full‐time equivalent (FTE) student enrolled in Distributed Learning and reported in the February enrolment count, 2015/16 $4,565
Note: Adult Education students who have already graduated are funded for eligible courses separately through a discretionary grant as part of the Education Guarantee.

2015/16 Operating Grants Manual
March 2015
Denotes changes 19
TABLE 11
SPECIAL NEEDS ENROLMENT GROWTH (FEBRUARY) The total number of special needs full‐time equivalent (FTE) students enrolled in regular, continuing education, alternate and distributed learning schools reported in the February enrolment count are compared to those reported in the previous September enrolment count. Where, in each of Levels 1, 2 and 3, enrolment is greater in February than it was the previous September, 50% of the supplemental special needs per FTE funding amount is provided. No adjustment is made for any declines in enrolment.
2015/16 per student (enrolment growth only)
For each Level 1 headcount student (includes students identified as Physically Dependent or Deafblind)
$18,850
For each Level 2 headcount student (includes students identified as Moderate to Profound Intellectual Disability, Physical Disability or Chronic Health Impairment, Visual Impairment, Deaf or Hard of Hearing, Autism Spectrum Disorder)
$9,425
For each Level 3 headcount student (includes students identified as Intensive Behaviour Interventions or Serious Mental Illness)
$4,750
TABLE 12
NEWCOMER REFUGEES (FEBRUARY)
To assist districts with the costs associated with enrolling refugees who enrol subsequent to the September enrolment count, additional funding is provided for newcomer refugees enrolled by the time of the February enrolment count. Supplemental funding for English/French Language Learning is also provided at 50% of the full year amount, if the student is eligible. Basic Allocation For each eligible school‐age full‐time equivalent (FTE) student with documentation of refugee status who is enrolled in a standard or alternate school in the February enrolment count and who was not reported in the previous September enrolment count, 2015/16 $3,579 For each school‐age full‐time equivalent (FTE) newcomer refugee student above who also qualifies for English/French Language Learning, 2015/16 $690
2015/16 Operating Grants Manual
March 2015
Denotes changes 20
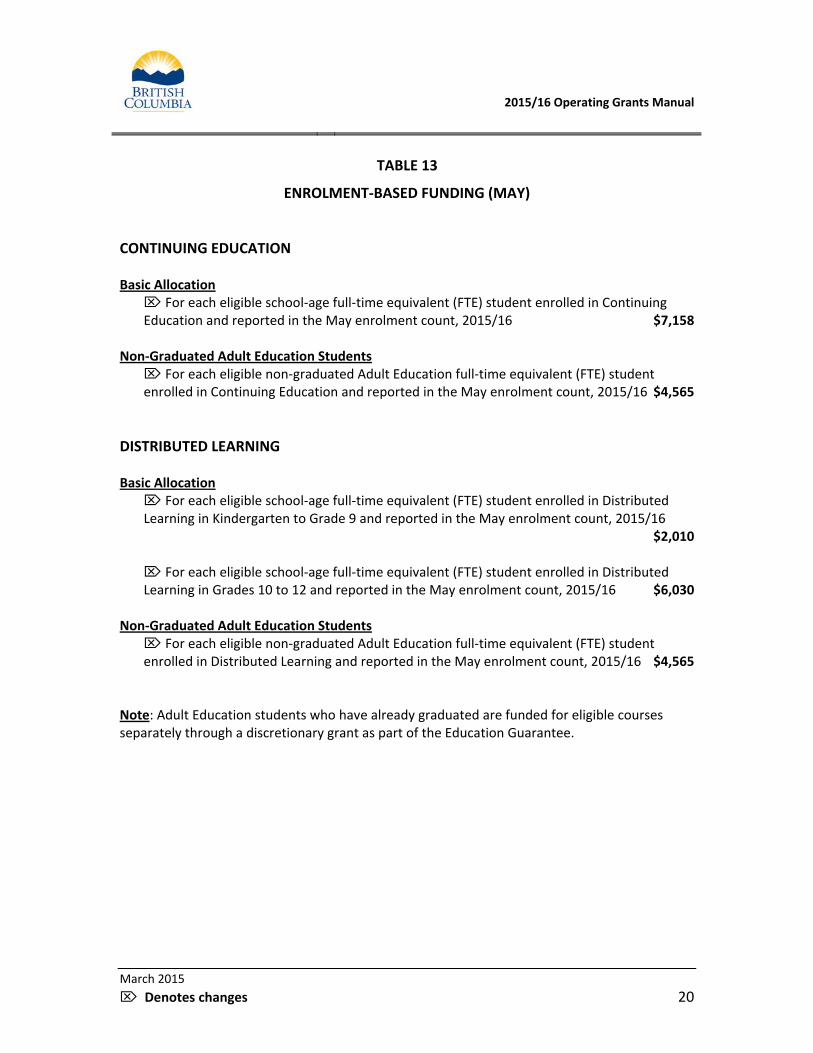
TABLE 13
ENROLMENT‐BASED FUNDING (MAY)
CONTINUING EDUCATION Basic Allocation For each eligible school‐age full‐time equivalent (FTE) student enrolled in Continuing Education and reported in the May enrolment count, 2015/16 $7,158
Non‐Graduated Adult Education Students For each eligible non‐graduated Adult Education full‐time equivalent (FTE) student enrolled in Continuing Education and reported in the May enrolment count, 2015/16 $4,565
DISTRIBUTED LEARNING Basic Allocation For each eligible school‐age full‐time equivalent (FTE) student enrolled in Distributed Learning in Kindergarten to Grade 9 and reported in the May enrolment count, 2015/16 $2,010 For each eligible school‐age full‐time equivalent (FTE) student enrolled in Distributed Learning in Grades 10 to 12 and reported in the May enrolment count, 2015/16 $6,030
Non‐Graduated Adult Education Students For each eligible non‐graduated Adult Education full‐time equivalent (FTE) student enrolled in Distributed Learning and reported in the May enrolment count, 2015/16 $4,565
Note: Adult Education students who have already graduated are funded for eligible courses separately through a discretionary grant as part of the Education Guarantee.

2015/16 Operating Grants Manual
March 2015
Denotes changes 21
TABLE 14
ADMINISTRATIVE SAVINGS Boards of education are expected to meet administrative savings targets. Operating grants to districts are being adjusted by $29 million in 2015/16 and by $54 million in 2016/17 and 2017/18. The administrative savings target for each district was determined based on the proportion of required administrative savings to the entire operating grant block, applied to every district. Districts’ administrative savings targets are established each year at the time the estimated operating grants are determined and are not updated again during the same school year. To assist boards of education with planning, estimates of the administrative savings targets are being made available for 2016/17 and 2017/18. These will be updated in the estimated operating grants for each of these years.

2015/16 Operating Grants Manual
March 2015
Denotes changes 22
TABLE 15
LABOUR SETTLEMENT FUNDING Funding is being provided to school districts to assist with the additional costs resulting from labour settlements that are in effect for teachers and support staff. A total of $130 million has been added to the operating grant block in 2015/16, which was determined based on estimated additional costs for wage and benefit increases, Teachers Teaching on Call and elementary teachers’ preparation time. Funding for the levelling up of teachers’ benefits that was provided outside the block since 2013 is also included. The amounts presented on Table 15 have been incorporated into the other tables in this manual. The following rates have been increased for 2015/16:
Supplement Per FTE Rate Increases, 2015/16
SEPTEMBER Basic Allocation (Standard, Continuing Education, Alternate) $211
Basic Allocation (Distributed Learning) $179
Special Needs – Level 1 $1,100
Special Needs – Level 2 $550
Special Needs – Level 3 $300
English Language Learning $40
Aboriginal Education $35
Adult Education $135
Small Community Supplement 3.1%
Low Enrolment Factor 0.2%
Student Location Factor 0.2%
SUMMER Grade 1 to 7 Headcount and Grade 8 to 9 Course Enrolment $6
Grade 10 to 12 Course Enrolment and Grade 8 to 9 Cross‐Enrolment $12
FEBRUARY Continuing Education – School‐Age $211
Continuing Education – Adult $135
Distributed Learning – School‐Age (Kindergarten to Grade 9) $90
Distributed Learning – School‐Age (Grade 10 to 12) $179
Special Needs Enrolment Growth – Level 1 $550
Special Needs Enrolment Growth – Level 2 $275
Special Needs Enrolment Growth – Level 3 $150
Newcomer Refugees $106
Newcomer Refugees – English Language Learning Supplement $20
MAY Continuing Education – School‐Age $211
Continuing Education – Adult $135
Distributed Learning – School‐Age (Kindergarten to Grade 9) $60
Distributed Learning – School‐Age (Grade 10 to 12) $179
2015/16 Operating Grants Manual
March 2015
Denotes changes 23
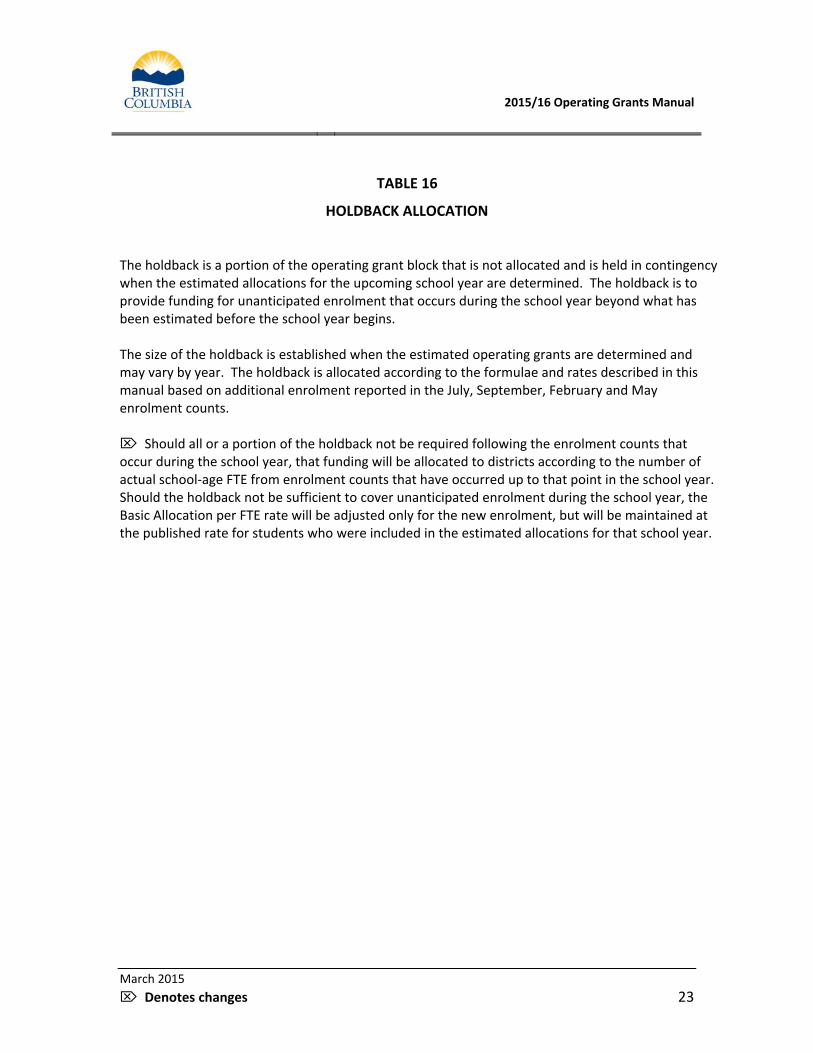
TABLE 16
HOLDBACK ALLOCATION The holdback is a portion of the operating grant block that is not allocated and is held in contingency when the estimated allocations for the upcoming school year are determined. The holdback is to provide funding for unanticipated enrolment that occurs during the school year beyond what has been estimated before the school year begins. The size of the holdback is established when the estimated operating grants are determined and may vary by year. The holdback is allocated according to the formulae and rates described in this manual based on additional enrolment reported in the July, September, February and May enrolment counts. Should all or a portion of the holdback not be required following the enrolment counts that occur during the school year, that funding will be allocated to districts according to the number of actual school‐age FTE from enrolment counts that have occurred up to that point in the school year. Should the holdback not be sufficient to cover unanticipated enrolment during the school year, the Basic Allocation per FTE rate will be adjusted only for the new enrolment, but will be maintained at the published rate for students who were included in the estimated allocations for that school year.