2015-16 - bombay stock exchange · we are consistently ranked among the top-ten pharma companies in...
TRANSCRIPT

Strongin Our Core
MarketExpandingto Newer
Ones
ANNUAL REPORT2015-16
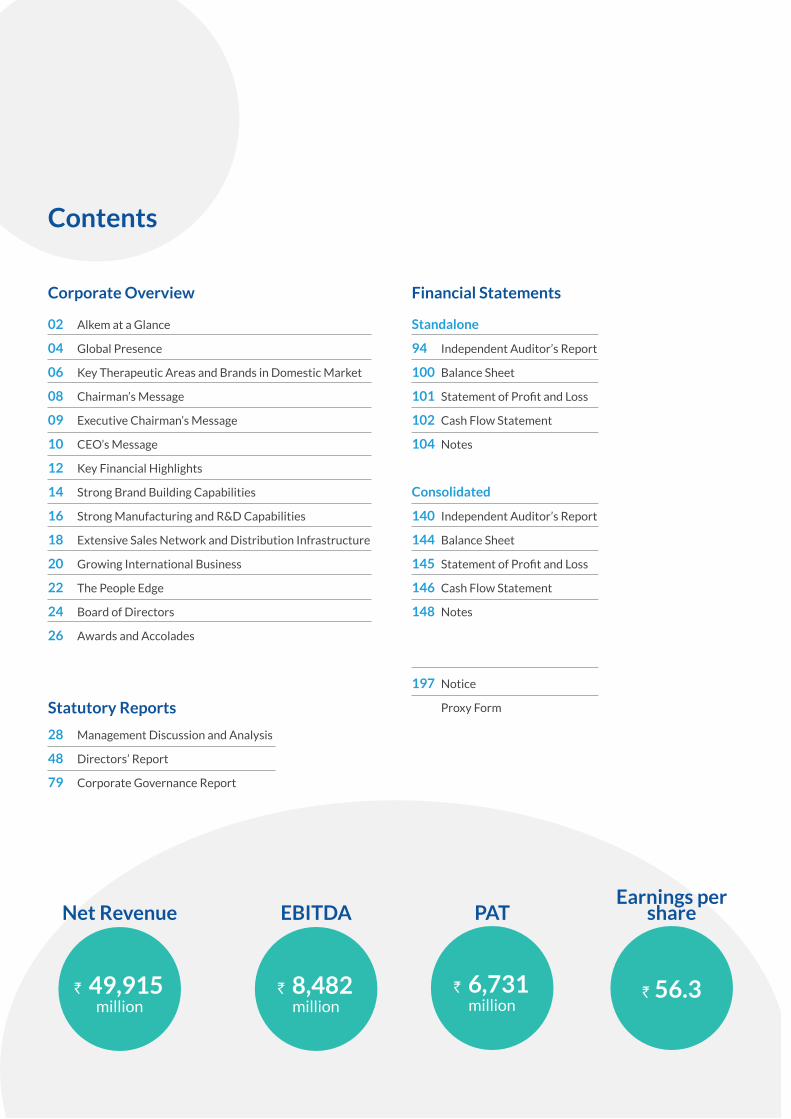
Contents
Corporate Overview Financial Statements
Statutory Reports
Net Revenue EBITDA PATEarnings per
share
` 49,915million
` 8,482 million
` 6,731 million
` 56.3
02 Alkem at a Glance
04 Global Presence
06 Key Therapeutic Areas and Brands in Domestic Market
08 Chairman’s Message
09 Executive Chairman’s Message
10 CEO’s Message
12 Key Financial Highlights
14 Strong Brand Building Capabilities
16 Strong Manufacturing and R&D Capabilities
18 Extensive Sales Network and Distribution Infrastructure
20 Growing International Business
22 The People Edge
24 Board of Directors
26 Awards and Accolades
28 Management Discussion and Analysis
48 Directors’ Report
79 Corporate Governance Report
Standalone
94 Independent Auditor’s Report
100 Balance Sheet
101 StatementofProfitandLoss
102 Cash Flow Statement
104 Notes
Consolidated
140 Independent Auditor’s Report
144 Balance Sheet
145 StatementofProfitandLoss
146 Cash Flow Statement
148 Notes
197 Notice
Proxy Form

Growth and consolidation are business imperatives that are achieved as a result of conscious and persistent strategy. More often than not, companies
that are able to step out of their comfort zone while retaining their hold over captive markets are the ones that succeed in the long-term.
We believe that the path to value-creation is twofold. On the one hand, we continue to focus on consolidating our presence in India and introducing newer products consistently, while improving the breadth and depth of our reach. We are consistently ranked among the top-ten pharma companies in India with a strong portfolio of 700 brands across multiple therapies, in many of which we are leaders. We have an in-depth coverage across the country through a well-built sales & distribution network and a long-standing trust
& relationship with the prescribers.
On the other, we are focusing on growing our presence in the high-value US market with a unique set of products, and also growing our footprint in
emerging markets at the same time. We are doing this through both organic and inorganic routes, and developing a strong local presence in our markets
of choice.
This dual strategy will allow us to leverage our expertise and strength across geographies.
In this, our maiden post-IPO annual report, we present the story of our focus on India and how we are growing from
strength to strength in international markets.
Strong in Our Core Market.
Expanding to Newer Ones.

ALKEM LABORATORIES LTD.2
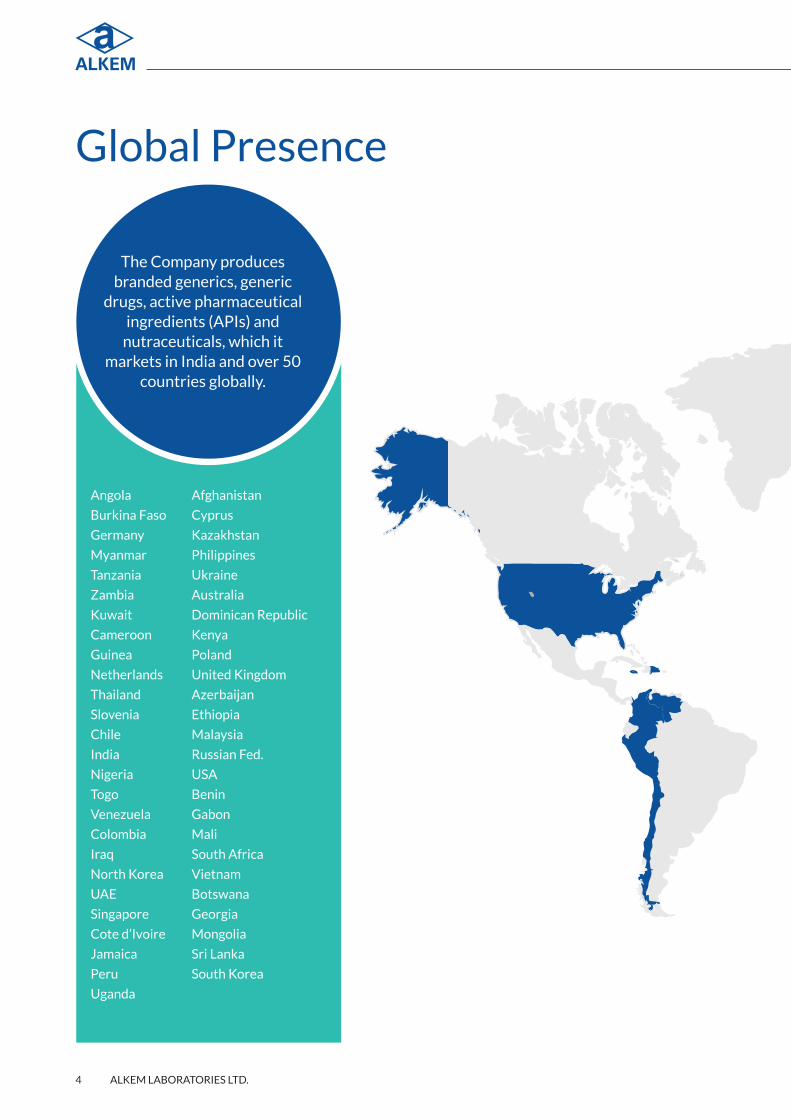
The Company produces branded generics, generic drugs, active pharmaceutical ingredients (APIs) and nutraceuticals, which it markets in India and over 50 countries globally, with the United States being the key focus International market. Company’s pharmaceutical business is organised into domestic (i.e. India) and international operations; the former accounting for 72.5% of net consolidated operating revenues in financial year 2016 and the latter for the remaining 27.5%. With a portfolio of over 700 brands in India, Alkem have been ranked among the top ten pharmaceutical companies in India in terms of domestic sales for the past 13 years (Source: IMS Health). Company’s products are also sold in
international markets either directly through its subsidiaries or indirectly, through supply, distribution and other arrangements with various global companies and local distributors.
The Company has 16 manufacturing facilities at strategic locations - 14 are in India, and the remaining two in the US. Six of its facilities are USFDA approved. The Company also has strong Research and Development (R&D) capabilities with over 500 scientists working across its four globally located R&D facilities.
On December 23, 2015, the Company successfully completed its Initial Public Offering (IPO) and its equity shares were listed on the Bombay Stock Exchange Limited and the National Stock Exchange of India Limited. The issue saw a robust response across investor categories and was overall subscribed to the extent of 44.29 times. This was the largest ever demand generation by a pharmaceutical company in India through IPO/QIP.
Established in 1973 and headquartered in Mumbai, Alkem is a leading Indian pharmaceutical company with global operations.
The Company is engaged in the development, manufacture and sale of pharmaceutical and
nutraceutical products.
Alkem at a Glance

ANNUAL REPORT 2015-16 3
CO
RP
OR
AT
E O
VE
RV
IEW
FIN
AN
CIA
L STAT
EM
EN
TS
STAT
UTO
RY
RE
PO
RT
S
Through:
Quality that is infinite Service that cares Hardwork that endures
Milestones
Stock Details
Vision
To achieve value driven leadership in Indian Health Care Industry and beyond.
*As of 31 March, 2016
Alkem at a Glance
` 1,62,184*mn ` 1,366.50* ` 1,356.45*Market
capitalisation
(Closing market price)Bombay
Stock Exchange
(Closing market price) National Stock Exchange
` 12.7/shareInterim dividend (Face value ` 2)
66.78%*Promoter and
Promoter Group Holding
Year Event
1973 Alkem Laboratories Limited was incorporated.
1978 Established its first plant at Taloja, Mumbai.
1992Established manufacturing facility in Mandva, Gujarat. This facility was converted into an API facility in 2005.
2003 Set up research and development facility for ANDA development at Taloja, Maharashtra.
2006Company’s anti-infective brand, Taxim became the first anti-infective drug in the Indian pharmaceutical industry to cross ` 1,000 mn in terms of domestic sales in India. (Source: IMS Health)
2007 Filed its first ANDA in the US for the drug Amlodipine.
2009Received its first ANDA approval in the US for Amlodipine.
Acquired Pharmacor Pty Ltd., a generic pharma company in Australia.
2010 Acquired Ascend Laboratories, a generic marketing company in the US.
2011 Acquired Enzene, a company engaged in the development of biosimilars in India.
2012 Acquired an API Manufacturing facility in the US.
2014Acquired the “Clindac-A” brand in India from Galderma S.A.
Company’s anti-infective brand, Clavam crossed ` 2,000 million in terms of domestic sales in India. (Source: IMS Health)
2015Acquired a formulation manufacturing facility in the US.
Acquired 51% controlling stake in Indchemie Health Specialities Private Limited and Cachet Pharmaceutical Private Limited.
Successfully completed Initial Public Offering.
ALKEM LABORATORIES LTD.4
Global Presence
Angola
Burkina Faso
Germany
Myanmar
Tanzania
Zambia
Kuwait
Cameroon
Guinea
Netherlands
Thailand
Slovenia
Chile
India
Nigeria
Togo
Venezuela
Colombia
Iraq
North Korea
UAE
Singapore
Cote d’Ivoire
Jamaica
Peru
Uganda
Afghanistan
Cyprus
Kazakhstan
Philippines
Ukraine
Australia
Dominican Republic
Kenya
Poland
United Kingdom
Azerbaijan
Ethiopia
Malaysia
Russian Fed.
USA
Benin
Gabon
Mali
South Africa
Vietnam
Botswana
Georgia
Mongolia
Sri Lanka
South Korea
The Company produces branded generics, generic
drugs, active pharmaceutical ingredients (APIs) and
nutraceuticals, which it markets in India and over 50
countries globally.

ANNUAL REPORT 2015-16 5
CO
RP
OR
AT
E O
VE
RV
IEW
FIN
AN
CIA
L STAT
EM
EN
TS
STAT
UTO
RY
RE
PO
RT
S
Global Presence

ALKEM LABORATORIES LTD.6
Key Therapeutic Areas and Brands in Domestic Market
The Company’s domestic operations are divided into various therapeutic areas. The Established Therapies comprise anti-infectives, gastro-intestinal, pain and analgesics, and vitamins, minerals and nutrients, which together constitutes about 80% of the Company’s total domestic sales. The Emerging Therapies of the Company comprise neuro/CNS, derma, cardiac and anti-diabetes. The Company is also present in respiratory and gynaecology amongst other therapeutic areas.
Gastro-intestinal (` 98 billion* market size in India)Products in the gastro-intestinal category relieve discomfort relating to the stomach and intestines. Company’s gastro-intestinal portfolio consists of leading and fast growing molecules such as pantoprazole, omeprazole, domperidone and ondansetron.
Anti-infectives (` 113 billion* market size in India)Anti-infectives fight against infection caused by micro-organisms such as bacteria, viruses and parasites. They function by inhibiting the growth of the micro-organism or by killing the micro-organisms. The Company’s anti-infectives portfolio includes therapeutic classes such as penicillins, cephalosporins, macrolides and quinolones.
Anti-infectives is the largest therapeutic area in the pharmaceutical industry in India, and the Company has been ranked number one in terms of revenue in this therapeutic area for the past ten years consistently.
Anti-infectives
Gastro-Intestinal
Pain / Analgesics
Vitamins / Minerals /
Nutrients
Cardiac and Diabetology
Gynaec
Neuro / CNS
Derma
Others
42
18
12
8
43
33 6
Key Brands Treatment used for
Clavam Short term treatment of a wide range of bacterial infections.
TaximVariety of infections including pneumonia, urinary tract infections, pelvic inflammatory dis-ease and meningitis.
Taxim-O Bacterial infections such as respiratory infections and gonorrhoea.
XoneBacterial infections such as pneumonia, gonorrhoea, urinary tract infections, pelvic inflam-matory disease, meningitis and typhoid.
Key Brands Treatment used for
Pan Erosive esophagitis and other acid peptic disorders.
Pan-DGastroesophageal reflux disease; decrease excessive stomach acid & prevent nausea and vomiting.
Ondem Prevent nausea and vomiting associated with cytotoxic chemotherapy & radiotherapy.
Satrogyl-O Protozoa infections, liver abscess, giardiasis and trichomoniasis.
(Source: IMS SSA MAT March 2016)
Company’s Therapeutic Breakup in Domestic Market
(%)

ANNUAL REPORT 2015-16 7
CO
RP
OR
AT
E O
VE
RV
IEW
FIN
AN
CIA
L STAT
EM
EN
TS
STAT
UTO
RY
RE
PO
RT
S
Pain/analgesics (` 71 billion* market size in India)Pain and analgesic products help in alleviating pain caused by a variety of ailments. Company’s pain and analgesics portfolio consists of anti-rheumatic, non-steroidal anti-inflammatory, anti-osteoporosis and muscle relaxants.
Vitamins/minerals/nutrients (` 70 billion* market size in India)Vitamins, minerals, and nutrients provide a source of supplement for sustaining good health. Company’s vitamins, minerals, and nutrients portfolio includes multi-vitamins with nutrients, vitamin B12, metabolites, and protein and nutrients supplements.
Other therapeutic areasThe Company also has a fast-growing portfolio in other therapeutic areas such as neuropsychiatry, cardiology, dermatology, diabetology and oncology. Some of the key brands in these product categories include Olkem, Glucoryl-M, Melbild and Donep.
Key Therapeutic Areas and Brands in Domestic Market
Key Brands Treatment used for
Gemcal Prophylaxis and treatment of osteoporosis.
SumoHeadache, muscle pain & aches and musculo-skeletal pain either on its own or combined with other medications.
Enzoflam Pain of musculo-skeletal origin.
Sumo-LBroad range of symptoms, such as headaches, muscle aches, arthritis, backache, toothache, colds and fevers.
Key Brands Treatment used for
Olkem Hypertension
Glucoryl-M/MV Diabetes
Donep Alzheimer’s disease
Melbild Hypo-pigmentation
Key Brands Treatment used for
A to Z NSMulti-vitamin and multi-mineral product that is used as a health supplement by doctors for various ailments or as prophylaxis.
Uprise D3A form of Vitamin D and is prescribed for the treatment of Vitamin D deficiency, which is associated with rickets or used as a nutritional supplement.
A to Z GoldTo improve the general wellbeing of a person suffering from chronic illnesses such as diabetes and cardio-vascular disorders.
* (Source: IMS SSA MAT March 2016)

ALKEM LABORATORIES LTD.8
Dear Shareholders,
It has always been my conviction that great companies are the products of strong values and a determination to translate those values into tangible outcomes. These iconic companies look beyond industry challenges, market cycles and economic volatilities to bring enduring difference to society. With a great team, we are building such an enterprise at Alkem.
From a very modest beginning in 1973, we have emerged as one of the dominant players in the domestic pharmaceutical landscape; and it is heartening to note that we are reinforcing our footprint on international markets. This achievement was largely made possible by the determination and commitment of our employees who are incessantly pushing the levers of Alkem’s progress.
At Alkem, we have created a culture of high performance with a deep commitment, not just to cure, but help people lead a healthy life. This is the quintessential Alkem.
I invite you all to be a part of our journey, as we brace for a lift-off.
Warm regards,
Samprada SinghChairman EmeritusAlkem Laboratories Limited
Samprada SinghChairman EmeritusAlkem Laboratories Limited
Chairman’s Message
It has always been my conviction that great
companies are the products of strong values and a
determination to translate those values into tangible
outcomes.
ANNUAL REPORT 2015-16 9
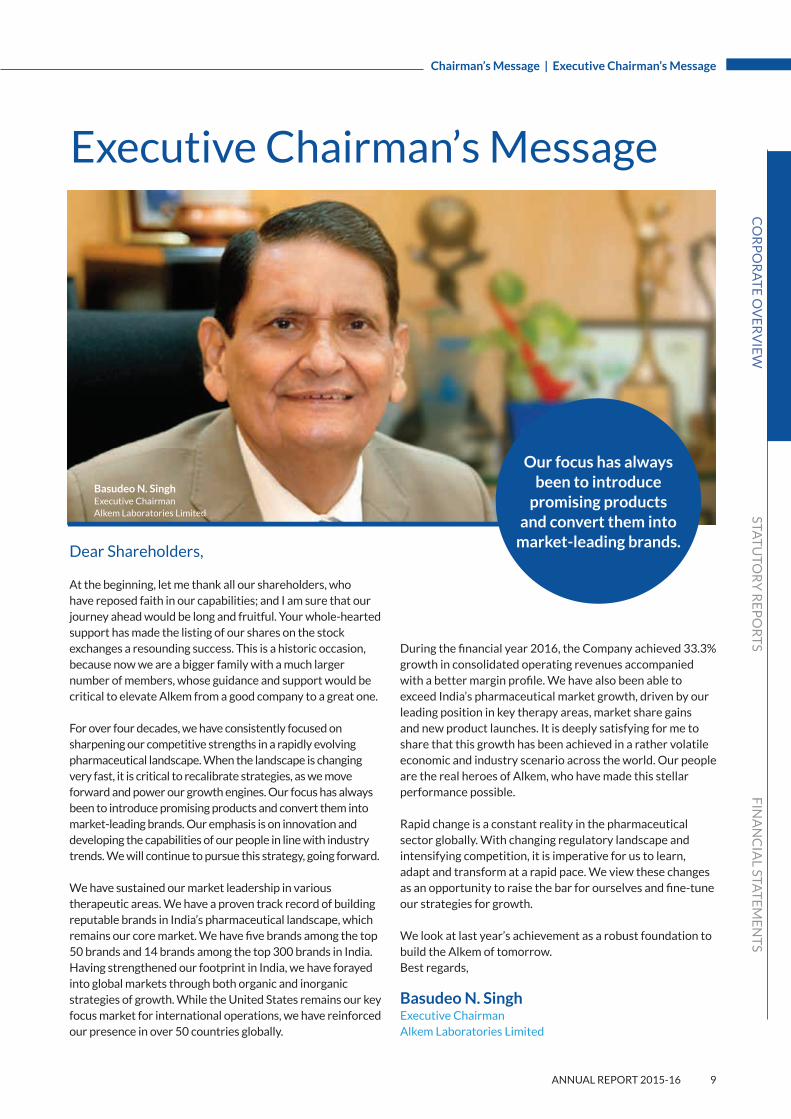
Dear Shareholders,
At the beginning, let me thank all our shareholders, who have reposed faith in our capabilities; and I am sure that our journey ahead would be long and fruitful. Your whole-hearted support has made the listing of our shares on the stock exchanges a resounding success. This is a historic occasion, because now we are a bigger family with a much larger number of members, whose guidance and support would be critical to elevate Alkem from a good company to a great one.
For over four decades, we have consistently focused on sharpening our competitive strengths in a rapidly evolving pharmaceutical landscape. When the landscape is changing very fast, it is critical to recalibrate strategies, as we move forward and power our growth engines. Our focus has always been to introduce promising products and convert them into market-leading brands. Our emphasis is on innovation and developing the capabilities of our people in line with industry trends. We will continue to pursue this strategy, going forward.
We have sustained our market leadership in various therapeutic areas. We have a proven track record of building reputable brands in India’s pharmaceutical landscape, which remains our core market. We have five brands among the top 50 brands and 14 brands among the top 300 brands in India. Having strengthened our footprint in India, we have forayed into global markets through both organic and inorganic strategies of growth. While the United States remains our key focus market for international operations, we have reinforced our presence in over 50 countries globally.
Executive Chairman’s Message
During the financial year 2016, the Company achieved 33.3% growth in consolidated operating revenues accompanied with a better margin profile. We have also been able to exceed India’s pharmaceutical market growth, driven by our leading position in key therapy areas, market share gains and new product launches. It is deeply satisfying for me to share that this growth has been achieved in a rather volatile economic and industry scenario across the world. Our people are the real heroes of Alkem, who have made this stellar performance possible.
Rapid change is a constant reality in the pharmaceutical sector globally. With changing regulatory landscape and intensifying competition, it is imperative for us to learn, adapt and transform at a rapid pace. We view these changes as an opportunity to raise the bar for ourselves and fine-tune our strategies for growth.
We look at last year’s achievement as a robust foundation to build the Alkem of tomorrow. Best regards,
Basudeo N. SinghExecutive Chairman Alkem Laboratories Limited
Chairman’s Message | Executive Chairman’s Message
Basudeo N. SinghExecutive Chairman Alkem Laboratories Limited
Our focus has always been to introduce
promising products and convert them into
market-leading brands.
CO
RP
OR
AT
E O
VE
RV
IEW
FIN
AN
CIA
L STAT
EM
EN
TS
STAT
UTO
RY
RE
PO
RT
S

ALKEM LABORATORIES LTD.10
Dear Shareholders,
Financial Year 2016 was an eventful and satisfying year for all of us at Alkem. We achieved positive outcomes on all fronts. The most important milestone of the year was that our Company got listed on the stock exchanges with the IPO book getting oversubscribed over 40 times. I thank all our shareholders, who have made this possible. The oversubscription reflects the confidence and trust they have over the future potential of our Company. It is both a privilege and a responsibility for us; and we are committed to deliver on their expectations.
We have come a long way, since we began our journey; and I am confident that with a robust business model, globally benchmarked industry practices, lucrative pipeline
CEO’s Message
of products, strategic investments and a dynamic and determined team we are poised to grow significantly in the years ahead.
Promising performanceOperating in a volatile economic scenario, we focused on our key markets and improved our operational performance consistently. This resulted in robust revenues and profits. Our net operating revenues during the year grew by 33.3% with over 500 bps year-on-year improvement in gross margin (improved from 54.8% to 60.7%) and EBITDA margin (improved from 11.3% to 17.0%). I must emphasize in this
Prabhat AgrawalChief Executive OfficerAlkem Laboratories Limited
Financial Year 2016 was an eventful and satisfying year for all of us at Alkem.
We achieved positive outcomes on all fronts.
We are seeking aggressive growth and are investing in our people, processes,
technology and systems.

ANNUAL REPORT 2015-16 11
CO
RP
OR
AT
E O
VE
RV
IEW
FIN
AN
CIA
L STAT
EM
EN
TS
STAT
UTO
RY
RE
PO
RT
S
context that the margin expansion was a key priority for us for the year as we worked upon various levers to optimise our cost, improve product mix and focus on executional excellence.
We also strengthened our balance sheet and improved our return ratios. The Company generated net cash of ` 7,259 million from operating activities during the year. Our RONW increased from 13.1% to 19.2% (21.7% excluding MAT write off) with healthy improvement in our net working capital days. It is pertinent to mention here that we deleveraged our balance sheet; and our gross debt reduced from ` 13,059 million in financial year 2015 to ` 6,554 million in financial year 2016. We remian a net cash Company.
We outperformed the domestic market by gaining market share in established therapies of anti-infectives, gastro- intestinal, pain/analgesics and vitamins, minerals and nutrients. We have also delivered robust growth in emerging therapies of neuro/CNS, cardiac and anti-diabetic and improved our market ranking.
Another important achievement during the year was that our Company received 12 ANDA approvals in financial year 2016, highest so far in a year by us. In addition, our formulation facility at Baddi in India and API facility at California in the US went through successful inspection from the USFDA. Our API facility at Mandva, Gujarat received USFDA approval, making it our sixth USFDA approved facility. As a part of our inorganic growth strategy, we have also acquired a formulation manufacturing facility in the US to build capabilities in the areas of liquids, semi-solids and nasal sprays, at the same time diversify our manufacturing base.
Undaunted by challengesAs we chart an attractive growth trajectory, it is also important to highlight some of the challenges that we need to deal with in a rapidly evolving business landscape. The Health Ministry of the Government of India has revised its National List of Essential Medicines (NLEM) list. Under the NLEM 2015 list, we now have a higher proportion of our domestic business under the ambit of price control. In addition, the regulator has also announced revision of ceiling prices for some of the formulations which were under NLEM 2013 list; and continue to feature under NLEM 2015 list. While this has impacted the prices of some of our key brands, it has also made our products more price competitive which provides us an opportunity to attain more volumes from price-sensitive markets.
The government through a circular has also prohibited the manufacture, sale and distribution of 344 fixed dose
combination (FDC) drugs which has been challenged by various companies including us in the High Court. While a final decision on the matter is awaited, we have put alternate plans in place to mitigate any impact in case the ban is implemented.
R&D initiativesFinanacial Year 2016 also saw us reinforce our research efforts to enrich our differentiated product portfolio across domestic and international markets; and to enhance ANDA filings in the US. We have in-house capabilities to develop a wide range of dosage forms and APIs, which have a key role in growing our business. Besides, we have also invested in biosimilars to further strengthen our product portfolio and therapy coverage in areas such as oncology, autoimmune disorders and osteoporosis.
Strategic prioritiesGoing forward, our key priorities comprise:• Consolidate our leadership position in the India acute segment by driving growth in our mega brands and growing our prescriber base• Increase our market share in the India chronic segment
through expanding our prescriber base and new product introductions
• Improve our field force productivity through Sales Force Effectiveness (SFE) initiatives
• Continued focus on R&D to accelerate ANDA filings for the US markets and develop differentiated portfolio for our key focused markets• Seek strategic partnerships and collaborations to
enhance our capabilities and products portfolio for key focused markets
Way forward We are seeking aggressive growth and are investing in our people, processes, technology and systems. We are focusing on promising markets, complementary products and therapies to leverage on our existing strengths.
At Alkem, we are building a future-ready and an agile company, with a robust risk governance framework. We have the assets, talent and innovations to build a great value-generating enterprise for all those who have a stake in our progress.
Best regards,
Prabhat AgrawalChief Executive OfficerAlkem Laboratories Limited
CEO’s Message
ALKEM LABORATORIES LTD.12
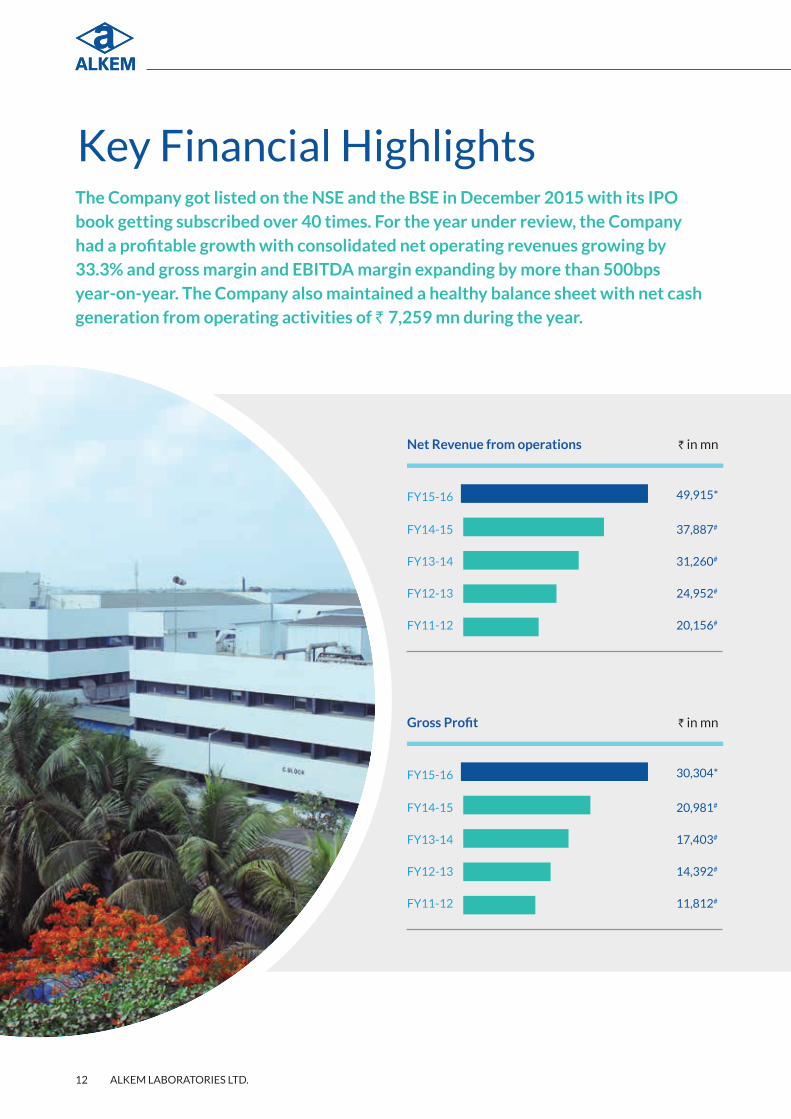
Key Financial Highlights The Company got listed on the NSE and the BSE in December 2015 with its IPO book getting subscribed over 40 times. For the year under review, the Company had a profitable growth with consolidated net operating revenues growing by 33.3% and gross margin and EBITDA margin expanding by more than 500bps year-on-year. The Company also maintained a healthy balance sheet with net cash generation from operating activities of ` 7,259 mn during the year.
Net Revenue from operations ` in mn
FY15-16 49,915*
FY14-15 37,887#
FY13-14 31,260#
FY12-13 24,952#
FY11-12 20,156#
Gross Profit ` in mn
FY15-16 30,304*
FY14-15 20,981#
FY13-14 17,403#
FY12-13 14,392#
FY11-12 11,812#

ANNUAL REPORT 2015-16 13
CO
RP
OR
AT
E O
VE
RV
IEW
FIN
AN
CIA
L STAT
EM
EN
TS
STAT
UTO
RY
RE
PO
RT
S
EBITDA ` in mn
FY15-16 8,482*
FY14-15 4,871#
FY13-14 4,100#
FY12-13 3,625#
FY11-12 3,752#
Reported PAT (After Minority Interest) ` in mn
FY15-16 6,731*
FY14-15 4,626#
FY13-14 4,353#
FY12-13 3,838#
FY11-12 4,065#
Profit before tax (Before Minority Interest) ` in mn
FY15-16 8,451*
FY14-15 5,167#
FY13-14 4,300#
FY12-13 4,016#
FY11-12 4,334#
Key Financial Highlights
*Reported numbers
#Restated numbers as reported in the Prospectus

ALKEM LABORATORIES LTD.14
(Source: IMS Health)
Strong Brand Building Capabilities
Market leadership position in domestic marketIn financial year 2016 the Company ranked as the fifth largest pharmaceutical company in India in terms of domestic sales. The Company was also the third-fastest growing company among the ten largest pharmaceutical companies in the Indian domestic formulations market, in terms of year-on-year sales growth for financial year 2016.
During the year under review, the Company maintained its number one rank in the therapeutic area of anti-infectives with a market share of 11.6%. It was also ranked among the top three companies in the gastro-intestinal and pain/analgesics therapeutic areas with market share in excess of 5%. The Company also features among the top five companies in the therapeutics area of vitamins, minerals, and nutrients in terms of Indian market share for financial year 2016.
Company’s established record of consistent performance and reputation for quality products in various therapeutic areas has helped it build reputable brands in the Indian pharmaceutical market. It has been among the top 10 pharmaceutical companies in India in terms of domestic sales for more than 13 years.
5th largestThe Company’s ranking in terms of domestic sales in financial year
2016.

ANNUAL REPORT 2015-16 15
CO
RP
OR
AT
E O
VE
RV
IEW
FIN
AN
CIA
L STAT
EM
EN
TS
STAT
UTO
RY
RE
PO
RT
S
(Source: IMS SSA MAT March 2016)
Strong Brand Building Capabilities
Company’s rank and market share in key therapies:
Therapeutic Areas Rank Market Share (FY 2016)
Anti-infectives 1st 11.6%
Gastro intestinal 3rd 5.7%
Pain/Analgesics 3rd 5.1%
Vitamins/Minerals/Nutrients 5th 3.7%
Company’s key brands in various sales ranges are as follows:
Name of BrandsAnnual Sales Range
(` mn)
Clavam Above 2,000
Pan, Pan D, Taxim, Taxim-O 1,500 – 1,999
Gemcal, A to Z NS, Sumo, Ondem, Xone, Swich, Zocef 500 – 1,499
Xone-XP, Pipzo, Hemfer, Uprise-D3, Traxol, Cheri, Enzoflam, Taximax, Indclav, Traxol-S
250 – 499
• Pan, Pan D, Taxim, Gemcal, Sumo are ranked No. 1 in their respective molecules• Clavam, Taxim-O, Xone are ranked No. 2 in their respective molecules
Proven ability to build market-leading brandsThe Company has had a proven record to build market-leading brands. During financial year 2016, five of the Company’s brands were among the top 50 brands and 14 brands were among the top 300 brands in the Indian pharmaceutical industry. Also five of the Company’s brands have clocked ` 1,500 million and above in sales for financial year 2016.
Company’s leading brands

ALKEM LABORATORIES LTD.16
Alkem logo - synonymous with global quality standardsThe Company maintains a strong quality conscious culture and incorporates this culture across its operations. Most of its facilities have received global accreditations. Each of the Company’s manufacturing facilities has separate quality control units to monitor the quality, safety and efficacy of its products in the domestic and export markets. The Company performs periodic reviews of systems, practices and documentations across its manufacturing facilities through regular audits.
All products are subjected to extensive stability testing programmes to understand the real product behaviour during shelf life. The Company also monitors in-market product quality through annual product quality review mechanisms.
Strong Manufacturing and R&D Capabilities
Geographically diversified manufacturing facilities accredited by international regulatory agenciesThe Company has 16 manufacturing facilities at strategic locations, 14 in India and 2 in the US. Six of its facilities are USFDA approved. Some of the Company’s manufacturing plants enjoy fiscal benefits that are available for different periods. The Company has capabilities in manufacturing a wide range of dosage forms including tablets, semi-solids, liquids, capsules, dry syrups, injectables, nasal preparations and APIs.
Manufacturing Facilities
Facility No. of Facilities
Manufacturing Capabilities
Major Certifications and approvals
Geographical Focus
Baddi, India 4Capsules, Tablets, Injectables, Dry Syrups
USFDA, UK-MHRA, WHO-GMP
India and global markets
Sikkim, India 3Tablets, Injectables, Dry Syrups
WHO-GMP India
Daman, India 5Capsules, Tablets, Injectables, Dry Syrups
USFDA, UK-MHRA, Indian GMP
India and global markets
Mandva, India 1 APIs Indian GMP, USFDA India, US
Ankaleshwar, India 1 APIsIndian-GMP, USFDA, TGA-Australia
US
California, United States
1 APIs USFDA US
St. Louis (Missouri), United States
1Controled Substances, Liquids, Nasal Sprays, Semi-Solids and Solids
USFDA US
The Company has maintained a clean regulatory compliance history – It successfully completed USFDA inspection in 2015 and 2016 of formulation facility at Baddi and API facilities at Mandva (Gujarat) and California (US).

ANNUAL REPORT 2015-16 17
CO
RP
OR
AT
E O
VE
RV
IEW
FIN
AN
CIA
L STAT
EM
EN
TS
STAT
UTO
RY
RE
PO
RT
S
R&D – A core part of the growth strategyThe Company has four research and development facilities, two in India and two in the United States. The research and development department carries out process development, formulation development and analytical research for its domestic and international markets. The Company also has more than 500 scientists working on various drug products and substances in India and the United States. The Company has a strong pipeline of products under development for its focus markets.
Clinical Research / UnitThe Company has a 100-bed clinical research facility where it conducts bioequivalence and bioavailability studies on healthy volunteers to prove the effectiveness of developed
formulations relative to reference products in accordance with the regulatory guidelines of various regulatory agencies. This facility has been audited by the USFDA, UK-MHRA and other regulatory agencies
Robust pipeline of approvals and fillingsThe Company also has a regulatory affairs team, which is responsible for various filings and approvals related to its products in India and international markets. Further, the company also has an Intellectual property (IP) group that looks after patent filing, patent prosecution, design filing, infringement analysis and patent litigations for the global markets.
Strong Manufacturing and R&D Capabilities
The Company also has filed more than 1,400 dossiers across other international markets with more than 800 approvals* As of March 31, 2016
Filed* Approved*
US (ANDA) 76 30
US (NDA) 1 1
Australia 24 21
Phillippines (Dossiers for each strength) 58 51
Chile (Dossiers for each strength) 144 106
Kazakhstan (Dossiers for each strength) 55 53
The Company have identified biosimilars as a long-term growth opportunity and have made, and expect to continue to make investments in development of products with a focus on high-growth therapeutic areas such as oncology, autoimmune disorders and osteoporosis.
R&D at Taloja facility, Maharashtra

ALKEM LABORATORIES LTD.18
The Company has built a strong prescription base on the back of extensive sales and distribution
network across the country. Company’s marketing strategies, trained medical representatives
and distribution network has enabled it to increase its market
share across key therapeutic areas and build & grow its brands.
Extensive Sales Network and Distribution Infrastructure

ANNUAL REPORT 2015-16 19
CO
RP
OR
AT
E O
VE
RV
IEW
FIN
AN
CIA
L STAT
EM
EN
TS
STAT
UTO
RY
RE
PO
RT
S
The Company has a strong sales, marketing and distribution capabilities in India, comprising about 6,000 medical representatives, 40 sales depots, 49 clearing and forwarding agents, 19 consignees and eight central warehouses covering over 7,000 stockists. Its products are also marketed to various hospitals, government institutions and medical institutions. Company’s domestic business is divided into 19 marketing divisions, which formulate marketing and promotional strategies for their portfolio of products targeted towards specific therapeutic areas.
Company’s medical representatives frequently visit the prescribers to promote its product portfolio and pharmacies and distributors to ensure that brands are adequately stocked.
Well-integrated IT infrastructureThe Company’s information technology systems are integrated with its sales and distribution infrastructure enabling it to standardise its processes, reduce cost, enhance productivity, improve workflow and communications and improve its risk control mechanisms. The Company has implemented:
• SAP, which handles all its sales and distribution transactions, demand planning and sales forecasting process;
• Barcode technology at its warehouses and depots to maximise accuracy and efficiency in stock handling;
• Sales force automation tools to make its sales staff more productive.
Extensive Sales Network and Distribution Infrastructure
08Central
Warehouses
40Sales Depots
49C&F Agents
19Consignees
>7,000Stockists
~6,000Medical
representatives

ALKEM LABORATORIES LTD.20
Growing International Business
United StatesThe United States is the key focus market for the international operations. The Company markets and sells its products in the United States under the brand ‘Ascend’ to major pharmacy chains’ stores, wholesalers, managed care companies, distributors, food and grocery stores and pharmaceutical retailers. As of March 31, 2016, Ascend sold 19 molecules in the market, out of which 14 are its own molecules and five are in-licensed from third parties. The Company also has a portfolio of about 50 ANDAs which are pending for approval with USFDA. Further, the Company owns two manufacturing and two R&D facilities in the US, that it believes provides it with the
Having established itself in the Indian pharmaceuticals market, the Company is also expanding
internationally through both organic growth and strategic acquisitions.
The Company is growing its operations by creating strong local
presence and expertise.

ANNUAL REPORT 2015-16 21
CO
RP
OR
AT
E O
VE
RV
IEW
FIN
AN
CIA
L STAT
EM
EN
TS
STAT
UTO
RY
RE
PO
RT
S
Evolution of the Company’s International business
In addition to strategic acquisition, the Company has also entered into partnership agreements for out-licensing and in-licensing products.
The Company has relationships with various pharmaceutical companies in several countries. In particular,
infrastructure required to support the growth in its operations in the US.
Other International MarketsIn addition to the US, Company’s products are also sold in more than 50 international markets like Australia, Europe, South East Asia, Latin America, Africa and CIS. Company’s key markets include Australia, Chile, Philippines, and Kazakhstan.
Australia: In Australia, Company’s pharmaceutical operations are run through its subsidiary, Pharmacor Pty Ltd (which it acquired in 2009). Pharmacor Pty Ltd has a portfolio of approximately 100 products including
one recently launched exclusive generic product. Pharmacor has a dedicated sales and marketing team that covers customers across the country.
Chile: The Company operates in Chile through Ascend Laboratories SpA, its operating, sales and marketing subsidiary. The Company currently sells 15 molecules and 49 SKUs. It has fully developed regulatory, commercial, sales and marketing infrastructure in Chile and use third parties for warehousing and logistics.
Philippines: The Company operates in Philippines through its subsidiary, Alkem
Laboratories Corporation. It has a countrywide presence in Philippines, and covers doctors, hospitals, pharmacies and institutional accounts. The Company offers branded generics products catering to diverse therapeutic segments.
Kazakhstan: The Company operates in Kazakhstan through its operating subsidiary, The Pharma Network (TPN). It covers most of the high potential areas of Kazakhstan through its own field force. The Company offers branded generics catering to polyclinics as well as hospitals and also has a portfolio of branded generics.
the Company has been growing its operations in Germany, Central and Eastern Europe, Vietnam, Colombia and South Africa through its relationships with established pharmaceutical companies in these countries. In these markets, the Company typically registers a product
under its name and thereafter out-license to one or more of the established companies to leverage their marketing infrastructure and capabilities in these markets. The Company also continues to own the registration and associated intellectual property with the product.
Growing International Business
Year Timeline of international expansion
2007 The Company filed its first ANDA in the US for the drug Amlodipine
2009
Received its first ANDA approval in the US for Amlodipine
Acquired a majority stake in an Australian company, Pharmacor Pty Ltd (Pharmacor) to enable it to enter the Australian Market
2010Acquired ThePharmanetwork LLC in the US, the holding company of Ascend, which provided the Company with the commercial platform through which it is able to market and sell its portfolio of products in the United States
2012Acquired manufacturing assets from NORAC, Inc. in the US, focused primarily on R&D and manufacturing specialty APIs and providing contract research and manufacturing services
2015Acquired a formulation manufacturing facility from Long Pharmaceuticals LLC in the United States that has semi-solids, liquid, nasal formulation and controlled substances manufacturing capabilities

ALKEM LABORATORIES LTD.22
The People Edge
Alkem is committed to provide an enriching career path, collaborative and autonomous work environment to attract, retain, and develop the best-in-class talent. Its people are its strongest assets. The Company is committed to build the best-in-class team led by exceptional individuals to build a globally respected organisation.
The human resource capability of Alkem is the golden eye of the Company, driven by exceptional passion and a deep ingrained commitment to deliver nothing but the best. Towards this goal, is the environment provided by the Company to learn and apply the business concepts in its day-to-day practice. This on-going application is what enriches the Company in being a learning organisation and helps it better delivery quality.
The Company has a well thought out incentive plan, which not only motivates its executives to implement the growth strategies but also increase their overall earning potential leading to greater engagement and employee satisfaction. The Company believes in the following three fundamentals of Self Respect, Dignity and Personal Pride. This brings about an innate motivation to each and every employee to give their best to the organisation.
Learning & Development Initiatives at AlkemProgrammes for MEs (Marketing Executives)Capsule Induction Programme (CIP) – A comprehensive Programme for newly joined Marketing Executive (ME), which happens at Zonal Level with an objective of preparing them for immediate field readiness. This programme covers basic product understanding, product detailing, competitor knowledge, reporting and administrative knowledge.
Basic Training Programme – A 2-3 weeks long programme conducted for MEs completing CIP within months of joining. This programme happens at centralised location with an objective of building knowledge, skills and attitude for on the job performance.
Refresher Programmes – This programme is conducted for MEs who have been there for more than 12 months in the Company with an objective of knowledge updation, skill enhancement, advanced selling skills, behavioural training and performance attitude.
Programmes for Managers Manager Orientation Programme – This programme is conducted for newly promoted/ joined Managers with the following objectives:• Role understanding
• Knowledge of management fundamentals
• People management skills
• Practice and skill development for new role
As of March 31, 2016 the Company had a total employee strength of over 13,000 across its domestic and international operations.

ANNUAL REPORT 2015-16 23
CO
RP
OR
AT
E O
VE
RV
IEW
FIN
AN
CIA
L STAT
EM
EN
TS
STAT
UTO
RY
RE
PO
RT
S
This helps them in keeping abreast of the latest concepts, ideas, tools and techniques in general management as well as in different functional areas ensuring that the right talent pool is created for future leadership positions.
This year many of the senior and high potential executives of the Company participated in the MDP programme, which was conducted by The Indian Institute of Management, Ahmedabad (IIMA).
Star AwardsStar Awards is a platform where the Company recognises its best performers and incentivise them by taking them for a fully paid international recreational trip. The employees are carefully chosen after robust selection process and are awarded at the eagerly awaited Star Awards Night.
Manager Development Programme – A 3 days programme for existing managers designed to cater to their specific divisional needs.
Team Building Workshop – This is a need-based programme undertaken with the objective of encouraging team cohesion and team performance.
Outbound Training – Another need-based programme conducted with the objective of creating behavioural awareness and team development.
Supervisory Skills (Plant) – The programme aims to provide role clarity and enhance skills of Supervisors.
MDP at the Corporate LevelMDP programme has been initiated for high potential executives who have a strong desire to learn so that they can improve and think differently.
Other HR initiatives• Sponsored certification
programs for employees – To enhance competitive edge of the employees.
• Alkem Service Awards – To show gratitude to the committed team members.
• Applaud Awards – Recognising and rewarding the contribution of the Brand Management teams.
• IJP (Internal Job Posting) - An advanced internal job posting portal to give employees opportunities to move between departments, locations and functions taking into account their long term career aspirations and growth.
The People Edge
Star Awards

ALKEM LABORATORIES LTD.24
Board of Directors
Mr. Samprada Singh, Chairman EmeritusMr. Samprada Singh has served on the Board since incorporation. He is a respected professional in the Indian pharmaceutical industry having
an overall experience of 42 years. He is one of the co-founders of the Company. He has received various prestigious awards such as the ‘Life
Time Achievement Award’ by Pharma Business and Technology in 2000, the ‘Lifetime Achievement Award’ at the Pharmaceutical Leadership
Summit 2009, ‘Asian Grid Leadership Lifetime Achievement Award 2006’, the ‘Life Time Contribution Award’ by the Express Pharma
Excellence Awards in 2004 and ‘Lifetime Achievement Award’ at the 2nd Annual AWACS Awards in Marketing Excellence, 2015. He has also
been bestowed with the ‘Pride of Bihar’ award at the Bihar Healthcare Achievers Awards 2014.
Mr. Basudeo N. Singh, Executive ChairmanMr. Basudeo N. Singh is the co-founder of the Company and has served on the Board since its incorporation. He has over 40 years of
experience in the Indian pharmaceutical industry. He was the president of the Indian Drug Manufacturer’s Association for the period 2007 -
2009. He is also the president of a social organisation called the ‘Bihar Association’. He has received Business Leader of the Year 2014 award
in the 7th Annual Pharmaceutical Leadership Summit and Pharmaleaders Business Leadership Awards 2014.
Mr. Dhananjay Kumar Singh, Joint Managing DirectorMr. Dhananjay Kumar Singh joined the Board in the year 1988 and at present he is the Joint Managing Director of the Company. He has over
30 years of experience in the Indian pharmaceutical industry.
Mr. Mangaldas Chhaganlal Shah, Mr. Arun Kumar Purwar, Mr. Samprada Singh, Mr. Basudeo N. Singh, Ms. Sudha Ravi and Ms. Sangeeta Singh
Mr. Akhouri Maheshwar Prasad, Mr. Balmiki Prasad Singh, Mr. Dhananjay Kumar Singh, Mr. Ranjal Laxmana Shenoy,Mr. Mritunjay Kumar Singh and Mr. Sandeep Singh
FROM LEFT TO RIGHT
Sitting:
Standing:

ANNUAL REPORT 2015-16 25
CO
RP
OR
AT
E O
VE
RV
IEW
FIN
AN
CIA
L STAT
EM
EN
TS
STAT
UTO
RY
RE
PO
RT
S
Mr. Balmiki Prasad Singh, Executive DirectorMr. Balmiki Prasad Singh joined the Board in the year 1988. Prior to being appointed to the Board he was employed with the Company in
various capacities. He has over 30 years of experience in the Indian pharmaceutical industry.
Mr. Mritunjay Kumar Singh, Executive DirectorMr. Mritunjay Kumar Singh joined the Board in the year 1988 and he has been associated with the management of the Company for a period
over 24 years. He is also the Managing Director of Indchemie Health Specialities Private Limited, subsidiary of the Company.
Mr. Mangaldas Chhaganlal Shah, Independent DirectorMr. Mangaldas Chhaganlal Shah has over 50 years of experience as a practicing lawyer with the Bombay High Court.
Mr. Sandeep Singh, Joint Managing DirectorMr. Sandeep Singh joined the Board in the year 2013 and at present he is the Joint Managing Director of the Company. He has been
associated with the management of the Company for over 10 years.
Mr. Arun Kumar Purwar, Independent DirectorMr. Arun Kumar Purwar has in the past served as the Chairman of State Bank of India from November 2002 to May 2006. He was the
Chairman of Indian Bank Association during the year 2005-06. He has received various prestigious awards such as the ‘CEO of the year’
Award from the Institute of Technology and Management in 2004, ‘Outstanding Achiever of the year’ Award from the Indian Banks’
Association in 2004 and “Finance Man of the Year” Award from the Bombay Management Association in 2006.
Mr. Akhouri Maheshwar Prasad, Independent DirectorMr. Akhouri Maheshwar Prasad has retired from the Indian Revenue Service after serving the Government of India for a period of 37 years.
He has held several key positions in the Government including Special Secretary to the Government of India and Director General, Central
Economic Intelligence Bureau, Member of the Central Board of Excise and Customs, Chief Commissioner, Central Excise and Customs,
Maharashtra.
Board of Directors
Mr. Ranjal Laxmana Shenoy, Independent DirectorMr. Ranjal Laxmana Shenoy has over 30 years of working experience with companies in different industrial segments, including the position
of Whole Time Director- Finance and Legal and Company Secretary, in Merck Limited, India, (formerly known as E. Merck (India) Limited).
Ms. Sudha Ravi, Independent DirectorMs. Sudha Ravi has over 30 years of experience across banking and financial services and is currently an Executive Director (not on board) of
Piramal Fund Management Private Limited and Piramal Finance Private Limited. Prior to joining Piramal Fund Management Private Limited
she has spent more than 30 years at State Bank of India. She was part of the senior management team at State Bank of India and has held the
posts of General Manager- Enterprise Risk Management at the Corporate Office, as Representative-Regional Office, Washington D.C. U.S.A.
and as Deputy General Manager and Private Secretary at the Chairman’s Secretariat at State Bank of India. She is also the Chairperson of
ASSOCHAM National Council of Non-Banking Financial Companies.
Ms. Sangeeta Singh, Independent DirectorMs. Sangeeta Singh has previously served as an Executive Director in KPMG in the capacity of Head of Human Resource for India from
August 2007 to February 2013.

ALKEM LABORATORIES LTD.26
Awards and Accolades
2002 Awarded the Pharma Business and Technology Excellence Award in 2002 as ‘India’s Most Esteemed Pharmaceutical Company’
2004Product Taxim was awarded the Pharma Business and Technology Excellence Award for successful brand in 2004
2005Awarded the Overall Performance Award for Group B at the 5th Express Pharma Awards in 2005
2013 Awarded the India’s most admired pharma company award for 2013 at the 6th Annual Pharmaceutical Leadership Summit in 2013
2014Product ‘Clavam’ was awarded as the ‘Brand of the Year’ at the AWACS Award, 2014
2015Product ‘Melbild’ was awarded as the ‘Emerging Dermatology brand 2015’ at the CIMS Award, 2015 and ‘Silver Award, New Introduction of the Year, Chronic Category: Top 50 companies’ at the AIOCD AWACS Award, 2015
2009Received a certificate of appreciation for outstanding export performance in the category of formulations by the Pharmaceuticals Export Promotion Council of India, supported by Ministry of Commerce and Industry, Government of India
Received the certificate of appreciation in the category of ‘Formulation Experts’ by the Pharmaceuticals Export Promotion Council of India, supported by Ministry of Commerce and Industry, Government of India

Statutory Reports28 Management Discussion & Analysis
48 Directors’ Report
79 Corporate Governance Report
ALKEM LABORATORIES LTD.28
Management Discussion and Analysis
Global Pharmaceutical Industry
The pharmaceutical industry is one of the largest industries in the world and comprises of companies that are involved in the development, production and marketing of pharmaceutical products. The industry has grown at a CAGR of about 6% through 2010 to 2015, crossing $1 trillion in 2015. Moreover, the industry is estimated to grow at 4-7% CAGR between 2015 to 2020 and reach $1.4 trillion by 2020 (Source: IMS Institute for Healthcare Informatics). The volume of globally used medicines is likely to reach 4.5 mn doses by 2020, registering 25% growth over 2015. Over half of the world’s population is expected to live in countries where medicine use is expected to exceed one dose per person per day by 2020, up from 31% in 2005. This growth would be primarily driven by rising life expectancy, aging population, rising income levels in the developing markets, better access to medical and diagnostic infrastructure and launch of new drugs to target unmet needs.
Growth in the developed markets would be driven by higher spends on the branded drugs as the use of specialty medicines becomes more widespread. Besides, innovation-led new product launches would further accelerate this
growth in the developed markets. In developing markets, also referred to as pharmerging markets, growth would be driven by increasing penetration of medicines on the back of rising income level and improving awareness on healthcare.
2010
$887$182 $1,069
$349 $1,400 -$1,430
Constant US$ CAGR 2011-2015 6.2%
Constant US$ CAGR 2016-2020 4.7%
2011-15 2006-20 20202015
Spending Growth
Source: IMS Health Market Prognosis, September 2015
Note: Growth in 2011-2015 was reduced by $100Bn and in 2016-2020 by $26Bn due to exchange rate effects.
Global Spending and Growth, 2010-2020

ANNUAL REPORT 2015-16 29
CO
RP
OR
AT
E O
VE
RV
IEW
FIN
AN
CIA
L STAT
EM
EN
TS
STAT
UTO
RY
RE
PO
RT
S
Management Discussion and Analysis
KEY MARKETSHistorically, the global pharmaceuticals industry has been dominated by developed markets like the US, Germany, France, Italy, Spain and the UK (collectively known as ‘EU5’) and Japan. These markets constitute about 60% of the overall global pharmaceutical market, with the US being the largest with estimated sales of about $400 billion. Growth in the developed market is primarily driven by higher spends on speciality medicines, aging population and launch of innovation-led new drugs to target unmet needs.
Pharmerging markets comprise China, Brazil, India, Russia, South Africa and markets in Latin America, the Middle East and Asia Pacific. At present, these markets constitute only about one-fourth of the overall global pharmaceutical market. However, they are expected to grow at a significantly faster pace compared to the developed markets driven by growing population, rising income levels, better medical infrastructure and improving awareness to healthcare.
Source: IMS Health, Market Prognosis, September 2015
US
EUS
Japan
Other major developed
China
Other pharmerging
Brazil/Russia/India
Rest of the World
Communicable
Oncology
Diabetes
Cardiovascular
Pain
Autoimmune
Respiratory
Non-communicable
Original brands
Non-original brands
Unbranded
OTC
(%)
15
11
10
777
6
37
52
21
14
13
41
1363
11
8
6
12
Medicine Spending in 2020 US$ by Geography Product Type and Disease Area
Country Product Type Disease Area

ALKEM LABORATORIES LTD.30
DEVELOPED MARKETSUSUS is the largest pharmaceutical market in the world with estimated sales of about $400 billion in 2015. It is expected to grow at a CAGR of 5-8% through 2015 to 2020 and reach $560-590 billion by 2020. The US market can be broadly classified into branded market and generic market with the former constituting sales from patented or branded drugs while the latter comprising sales from off-patent or generic drugs. The US generic market has grown significantly over the past two decades. Generic drugs account for more than 80% of the overall prescriptions in the US by volume and is expected to further
rise to over 90% by 2020. The US generic market has become attractive for generic drug manufacturers with continued government initiatives to cut increasing healthcare spending and a higher rate of generic substitution. Most of the leading Indian generic manufacturers now generate nearly half their sales from overseas markets with the US being a major market. Between 2015 and 2017, drugs with estimated total sales of $43.8 billion are expected to go off-patent in the US, providing sizeable opportunity to the generic pharma companies. (Source: IMS Institute for Healthcare Informatics)
Source: IMS Health, Market Prognosis, IMS Institute for Healthcare Informatics, October 2015
U.S. Spending Growth - 2010-2020
20%
15%
10%
5%
0%
-5%
-10%
-15%
2010 2015 2020
Protected Brands Volume Protected Brands Price New Brands Total Growth
Generics Volume Generics Price Loss of Exclusivity
US$
gr
ow
th
Source: IMS Health, Market Prognosis, September 2015
* Generic in developed markets includes Generics +US$ 24 Bn, Non-original Brands +US$ 23 Bn, OTC +US$ 10Bn.
** Other includes Rest of World +US$ 21Bn and exchange rate effects +US$ 26Bn.
Drivers of spending growth 2015-2020 (US$ Bn)
2015 Brand LOE
Developed
Generic* Pharmerging Other**
$1,069 Bn
298
17857
125
47
2020
$1,400 -1,430
Bn

ANNUAL REPORT 2015-16 31
CO
RP
OR
AT
E O
VE
RV
IEW
FIN
AN
CIA
L STAT
EM
EN
TS
STAT
UTO
RY
RE
PO
RT
S
Management Discussion and Analysis
Source: IMS Health, Market Prognosis, IMS Institute for Healthcare Informatics, October 2015
EU5The top five European markets (Germany, France, Italy, Spain and the U.K.) are expected to spend between $180 and $190 billion in 2020, an increase of $40 billion over 2015. In Europe, the growth would be mixed and inconsistent across markets due to the prevailing economic and geo-political issues in some key European markets. It is putting a pressure on the government to control the overall healthcare budget.
Germany is expected to be the key contributor to growth in Europe with a $16 billion increase, largely a result of wider adoption of innovation, supported by health technology assessments. 81% of the increase in the spending growth in Europe through 2020 is expected to be driven by adoption of specialty medicines.
JapanThe Japanese pharmaceutical industry is estimated to be about $100 billion and is expected to grow at a CAGR of 1-4% through 2015 to 2020. This growth would be driven by aging population and government initiatives to encourage penetration of generic drugs. Japan’s government recently raised the target for generics use from 60% by the end of April 2018 to 80% by April 2021, as generic penetration is improving. This should provide a sizeable opportunity to the generic pharma companies.
PHARMERGING MARKETS According to IMS Health, the pharmerging markets constitute about one-fourth of the global pharmaceutical industry. However, they are expected to contribute more than one-third of the incremental sales through 2015 to 2020. Unprecedented rise in health awareness and disposable income, leading to enhanced spending in medicines is the big picture across pharmerging markets. China is the largest market in the group accounting for about 42% of the total pharmerging market value in 2014, followed by Brazil accounting for about 12% and Russia and India accounting for about 6% each. These four markets are forecasted to grow at a CAGR of 7-13% over 2015 to 2020. The chart below highlights growth in medical spends per capita in key pharmerging markets.
Top 5 European countries spending - 2015 and 2020 (US$ Bn)
33
35
34
57
37.8% 47.2%
81.1%
24
183
28
25
31
19
41
144
2015 2020 2015 2020 Growth 2016-20
0
20
40
60
80
100
120
140
160
180
200
Spain Italy Germany
Spen
din
g U
S $
Bn
Share of Spending and Growth
FranceTraditional Specialty
UK

ALKEM LABORATORIES LTD.32
Source: IMS Health, Market Prognosis, September 2015; IMS Institute for Healthcare Informatics, October 2015
Indian Pharmaceutical Industry
2009-2010 2014-2015
2019-2020
(projected)
Past 5 year
CAGR up to
2014-2015 (%)
Future 5 year
CAGR up to
2019-2020 (%)
Domestic formulation (` billion) 417.1 745.8 1,359-1,484 12.3 13-15
Formulation exports (US$ billion) 5.2 11.7 18.9-20.4 17.7 11-13
Bulk drug exports (US$ billion) 6.3 12.9 20.4-22.3 15.2 10-12
Total market (US$ billion) 20.3 36.8 61.9-67.4 12.6 11-13
Source : CRISIL Research dated June 2015
DOMESTIC FORMULATIONThe domestic formulations industry constitutes the second largest component of the Indian pharmaceuticals market after bulk drug exports and is dominated by local companies with strong formulation development capabilities. The domestic formulations industry was valued at ` 746 billion in financial year 2015 and recorded a CAGR of 12.3% from 2009 to 2015. The industry is further expected to grow at 3-15% CAGR through financial year 2015 to 2020. This growth will be driven by rising income, enhanced medical infrastructure, rise in the prevalence of
chronic illnesses (cancer, diabetes, respiratory and cardiovascular disease, among others), and greater health insurance coverage. (Source: CRISIL Research,
June 2015).
The domestic formulation industry is highly fragmented in nature with the top 10 companies accounting for 42.7% of the market share for the financial year 2016, with the market leader accounting for about 8.0% of the market share in the same period. (Source: IMS SSA MAT March
Indian Pharmaceutical Industry
According to CRISIL Research, the Indian pharmaceuticals industry is estimated to be worth $36.8 billion in revenues for the financial year 2015, with domestic segment constituting about one-third of the total market and the remaining two-thirds coming from the exports segment. Over the past five years (2010-2015), the Indian pharmaceuticals industry has grown at over 12% CAGR – double the pace at which the global pharmaceutical industry has grown over the same
period. The growth has been fairly broad based with domestic segment growing at about 12.3% CAGR and export segment growing little above 16% CAGR. Moreover, while the global pharmaceutical industry is estimated to grow at 4-7% CAGR over the next five years, the Indian pharmaceutical industry is expected to grow at a significantly higher rate at 11-13% CAGR and reach $62-67 billion by financial year 2020. (Source:
CRISIL Research, June 2015)
Medicines Spend and Change per Capita Constant (US$)
Med
icin
e Sp
end
Per
Cap
ita
Gro
wth
20
16
-20
20
2020 US$ Per Capita Per Capita Growth Spending Growth49% Spending46% Per CapitaPharmerging average : 269US$ Person/Year
Ban
glad
esh
Co
lom
bia
Alg
eria
Ch
ina
Ru
ssia
Turk
ey
Arg
enti
na
Kaz
akh
stan
Ch
ile
Bra
zil
Sou
di A
rab
ia
57%
45%
Po
lan
d
29%
29%
58%43%
3%
-1%
73%
81%
0-10%
0%
10%
20%
30%
40%
50%
60%
70%
80%
90%
100%
300
250
200
150
100
50
350
66%
59% 39%
42% 43%39%
50%
29%
Mex
ico
27%
20%
Egy
pt
76%
89%
S. A
fric
a
23%
30%
Ph
ilip
pin
es
35%
25%
Ind
on
esia
51%
59%
Ind
ia
69%
78%
90%
79%
Nig
eria
62%
41%
Pak
ista
n
75%
62%
Vie
tnam
58%
52%
22%
46%
37%
63%
ANNUAL REPORT 2015-16 33
CO
RP
OR
AT
E O
VE
RV
IEW
FIN
AN
CIA
L STAT
EM
EN
TS
STAT
UTO
RY
RE
PO
RT
S
Management Discussion and Analysis
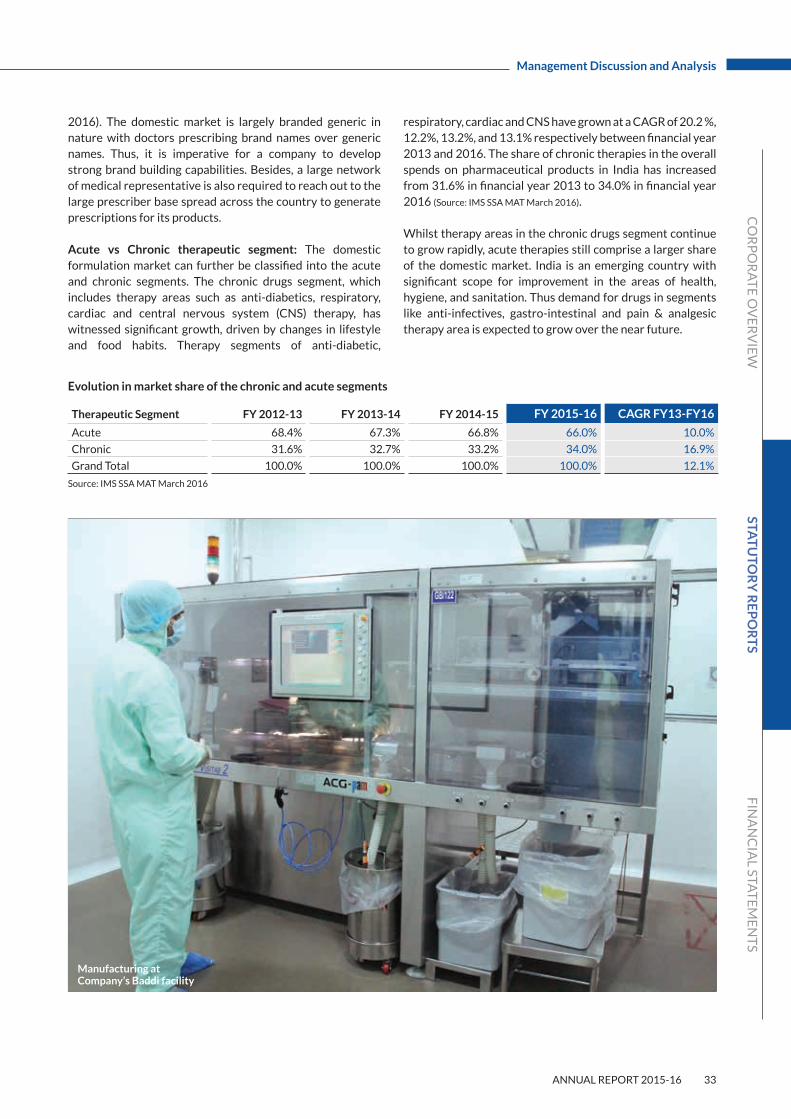
Evolution in market share of the chronic and acute segments
Therapeutic Segment FY 2012-13 FY 2013-14 FY 2014-15 FY 2015-16 CAGR FY13-FY16
Acute 68.4% 67.3% 66.8% 66.0% 10.0%
Chronic 31.6% 32.7% 33.2% 34.0% 16.9%
Grand Total 100.0% 100.0% 100.0% 100.0% 12.1%
Source: IMS SSA MAT March 2016
2016). The domestic market is largely branded generic in nature with doctors prescribing brand names over generic names. Thus, it is imperative for a company to develop strong brand building capabilities. Besides, a large network of medical representative is also required to reach out to the large prescriber base spread across the country to generate prescriptions for its products.
Acute vs Chronic therapeutic segment: The domestic formulation market can further be classified into the acute and chronic segments. The chronic drugs segment, which includes therapy areas such as anti-diabetics, respiratory, cardiac and central nervous system (CNS) therapy, has witnessed significant growth, driven by changes in lifestyle and food habits. Therapy segments of anti-diabetic,
respiratory, cardiac and CNS have grown at a CAGR of 20.2 %, 12.2%, 13.2%, and 13.1% respectively between financial year 2013 and 2016. The share of chronic therapies in the overall spends on pharmaceutical products in India has increased from 31.6% in financial year 2013 to 34.0% in financial year 2016 (Source: IMS SSA MAT March 2016).
Whilst therapy areas in the chronic drugs segment continue to grow rapidly, acute therapies still comprise a larger share of the domestic market. India is an emerging country with significant scope for improvement in the areas of health, hygiene, and sanitation. Thus demand for drugs in segments like anti-infectives, gastro-intestinal and pain & analgesic therapy area is expected to grow over the near future.
Manufacturing at Company’s Baddi facility

ALKEM LABORATORIES LTD.34
The table below illustrates the demand for domestic formulations from key therapy areas:
Therapy Area1Domestic Sales
2009 (` million)
Domestic Sales
2014 (` million)
Domestic Sales
2019 (` million)
CAGR 2009-
2014 (%)
CAGR 2014-
2019 (%)
Alimentary tract and metabolism 98,196 206,096 402,200 16.0 14.3
Blood and blood-forming organs 17,625 32,535 60,125 13.0 13.1
Cardiovascular system 42,893 85,248 154,396 14.7 12.6
Dermatologicals 19,585 44,192 80,736 17.7 12.8
Genito-urinary system and sex
hormones18,239 33,777 55,065 13.1 10.3
Anti-infectives for systemic use 82,222 127,436 209,556 9.2 10.5
Antineoplastic and
immunomodulating agents3,672 9,571 22,462 21.1 18.6
Musculo-skeletal system 23,781 40,127 70,485 11.0 11.9
Nervous system 28,597 56,883 105,627 14.7 13.2
Respiratory system 35,881 61,898 109,776 11.5 12.1
Various 30,382 58,097 96,035 13.8 10.6
Source: IMS Market Prognosis 2015-2019. Asia/Australia – India dated September 2015, published by IMS Health
Note: 1The classification of therapy areas in this table is according to Anatomical Classification System (ATC 1) used by IMS.
Given the backdrop of expected healthy growth in the domestic formulation market, their are also some challenges in the near term. These include:
Drug Price Control: The Drug Price Control Order (DPCO) 2013 capped prices of nearly 348 molecules and mandated sharp price cuts mostly across acute care drugs. Subsequently, further price cuts were announced in 2014 and 2015 with additional formulation packs being brought under the price control, across therapies like cardiac, anti-diabetes, derma and neurology. While the companies try to mitigate the impact of price cuts through volume growth and tighter cost controls, further addition of drugs under the price control could pose challenge to the value growth of the domestic formulation market.
Wholesale Price Index (WPI) adjusted price increase in drugs under price control: Along with volume growth and new product introduction, price increase is also an important lever for growth in the domestic formulation market. For the drugs, which are under price control companies can take price increases only to the extent of WPI. Currently, about 20% of the overall domestic formulation market is under price control and in the years where the WPI is negative, the companies need to take price cuts, impacting the growth to some extent.
Proposed ban on Fixed Dose Combination (FDC) drugs: In March 2016, the Health Ministry banned 344 fixed drug combinations through a gazette notification, based on the recommendation of its expert committee. While the pharmaceutical companies have challenged the order in the High Court and the final verdict on this is awaited, any negative ruling on the matter leading to the implementation of the proposed ban and further addition to this list could impact the growth of the pharmaceutical companies.
Regulatory changes: Regulatory changes in the form of mandatory implementation of Uniform Code of Pharmaceutical Marketing Practices and capping of trade channel margins could change the dynamics in the domestic formulation market. It could also lead to some short-term volatility in the growth of the pharmaceutical companies.
FORMULATION AND BULK DRUGS EXPORTS The export segment of the Indian pharmaceuticals manufacturing can be further divided into two sub-segments: formulations and bulk drugs. These segments combined recorded approximately 16.3% CAGR over the past five years to reach a value of around $24.6 billion. The export segment is expected to grow owing to India’s key strengths of low-cost manufacturing, high process chemistry skills, approved manufacturing facilities and an increasing number of drug master filings (Source: CRISIL Research, June 2015).
Exports of formulations
and bulk drugs recorded
approximately 16.3% CAGR
over the past five years to
reach a value of around
$24.6 billion.

ANNUAL REPORT 2015-16 35
CO
RP
OR
AT
E O
VE
RV
IEW
FIN
AN
CIA
L STAT
EM
EN
TS
STAT
UTO
RY
RE
PO
RT
S
Management Discussion and Analysis
The growth of the global generics market over the past decade has resulted in a significant growth opportunity for exports of formulations manufactured in India. Formulations exports have grown at about 18% CAGR from 2009 to 2015. Going forward, Indian formulations exports are expected to grow at a CAGR of 11-13% between financial years 2015 and 2020, to nearly $20 billion in revenues. Exports to regulated markets are expected to increase at a CAGR of 12-14% for the same period, driven by the expanding penetration of generic products, along with the improving pace of product approvals. Exports to semi-regulated markets are expected to grow at a CAGR of 10-12% (Source: CRISIL Research, June 2015).
India’s bulk drug exports are estimated to grow at a CAGR of 10-12% from financial year 2015 to financial year 2020, exceeding $20 billion in revenues. This growth will be driven by increased demand for both on-patent and off-patent drugs (Source: CRISIL Research, June 2015). However, the market is facing a major challenge from stringent regulations, which require vendors to comply with elaborate procedures prior to product commercialisation.
Key challenges in the International marketRegulatory risk: The pharmaceutical companies have to comply with various Good Manufacturing Practices (GMP) norms in order to manufacture and market their products in international markets. These norms evolve with time and the companies are expected to keep in compliance with latest norms. Non-compliance could lead to adverse outcomes including warning letters, import alerts, monetary
fines, or revocation of manufacturing or marketing licenses, significantly impacting their growth.
Exchange Rate Volatility: Most of the Indian pharmaceutical companies garner over half of their overall revenues from the international market. Therefore, significant volatility in exchange rates could pose a risk for the companies as they translate their revenue and expenditure incurred in foreign currency into Indian Rupee.
Geopolitical Risk: Growth in pharmaceutical spending in a country depends on its underlining economic growth. Geopolitical tension could pose a significant risk to the country’s economic growth, which could in-turn, jeopardise its pharmaceutical spending. This could in-turn impact the growth of pharmaceutical companies operating in that market.
Packaging at Company’s Baddi facility

ALKEM LABORATORIES LTD.36
Overview - Alkem Labs
Established in 1973, Alkem is a leading Indian pharmaceutical company with global operations. The Company is engaged in the development, manufacture and sale of pharmaceutical and nutraceutical products. It produces branded generics, generic drugs, active pharmaceutical ingredients (APIs) and nutraceuticals, which are marketed in Indian and International markets. With a portfolio of more than 700 brands in India, Alkem is ranked the fifth largest pharmaceutical company in India in terms of domestic sales (Source: IMS SSA MAT March 2016). The Company has presence in more than 50 international markets, with the United States being its key focus market.
The Company has a total of 16 manufacturing facilities: 14 manufacturing facilities are at geographically diversified locations in India and two in the United States. Out of the Indian manufacturing facilities, 12 are for the manufacture of formulations and two are for the manufacture of APIs. Six of the facilities are USFDA approved. The Company also has a strong research and development capabilities, which helps in enhancing the Company’s portfolio of products. It has four research and development facilities, two in India and two in the United States.
On December 23, 2015, the Company successfully completed its Initial Public Offering (IPO) and its equity
shares were listed on the Bombay Stock Exchange Limited and the National Stock Exchange of India Limited. .
COMPETITIVE STRENGTHS• Market leadership in various therapeutic areas:
During the year under review, the Company maintained its number one rank in the therapeutic area of anti-infectives with a market share of 11.6%. It is also ranked among the top three companies in the gastro-intestinal and pain/analgesics therapeutic areas with market share in excess of 5%. Moreover, the Company is also among the top five companies in the therapeutics area of vitamins, minerals, and nutrients in terms of Indian market share for financial year 2016. (Source: IMS SSA MAT March 2016)
Company’s manufacturing facility at Baddi
Company’s succesful IPO listing

ANNUAL REPORT 2015-16 37
CO
RP
OR
AT
E O
VE
RV
IEW
FIN
AN
CIA
L STAT
EM
EN
TS
STAT
UTO
RY
RE
PO
RT
S
Management Discussion and Analysis
• Market-leading brands: The Company’s established record of consistent performance and reputation for quality products in various therapeutic areas has helped it in building reputable brands in the pharmaceutical market in India. During financial year 2016, five of the Company’s brands were among the top 50 brands and 14 brands were among the top 300 brands in the Indian pharmaceutical industry. (Source: IMS SSA MAT March 2016)
• Extensive sales, marketing and distribution network in India: The Company has a strong sales, marketing and distribution capabilities in India, comprising about 6,000 medical representatives, 40 sales depots, 49 clearing and forwarding agents, 19 consignees and eight central warehouses covering over 7,000 stockists. The Company’s products are also marketed to various hospitals, government institutions, and medical institutions. The Company believes, its marketing strategies, trained medical representatives (MRs) and distribution network enable them to increase their market share across key therapeutic areas, and build and grow its brands.
• Growing international operations: Having established in the Indian pharmaceuticals market, the Company is expanding internationally through both organic growth and strategic acquisitions. While the US is the key focus market for international operations, its products are
also sold in more than fifty other countries like Australia, Chile, Philippines and Kazakhstan.
• Research and Development capabilities: The Company’s R&D activity is supported by four facilities, two in India and two in the US. The Company also has a team of over 500 scientists in R&D functions. It has a 100-bed clinical research facility to conduct studies on healthy volunteers to prove the effectiveness of developed formulations in accordance with the regulatory guidelines of various regulatory agencies. Additionally, it also has a regulatory affairs team, which is responsible for various filings and approvals related to products in India and international markets. The company also has an Intellectual property (IP) group that looks after patent filing, patent prosecution, design filing, infringement analysis and patent litigations for the global markets.
• Geographically diversified manufacturing facilities: The Company has 16 manufacturing facilities at strategic locations, 14 in India and 2 in the US. Six of these facilities are USFDA approved. Some of the manufacturing plants enjoy fiscal benefits that are available for different periods. The Company manufactures a wide range of dosage forms including tablets, semi-solids, liquids, capsules, dry syrups, injectables, nasal preparations and APIs.
Business Segment Review
DOMESTIC BUSINESSFinancial Highlights
72.5%Contribution to net consolidated
revenue
`36,182 mnNet consolidated revenue from
India Business
OverviewSince its incorporation in 1973, the Company has significantly grown its domestic formulations business and is now ranked as the fifth largest pharmaceutical company in India in terms of domestic sales (Source: IMS SSA MAT March 2016). The Company has a comprehensive portfolio of over 700 brands covering all the major therapeutic segments in India, in some of which it has attend market leading positions. The Company’s domestic business is divided into 19 marketing divisions, which formulate marketing and promotional strategies for their products portfolio targeted towards specific therapeutic areas. The Company also has a dedicated sales and marketing team of about 6,000 MRs in India, allowing them to penetrate the domestic market through frequent visits to medical practitioners across all specialties. This is further complemented by a strong pan-India distribution network.
The Company broadly categorise its domestic business into Established Therapies and Emerging Therapies. The Established Therapies comprise anti-infectives; gastro-intestinal; pain and analgesics; and vitamins, minerals and nutrients, which together constitutes about 80% of the total domestic sales. The Company has outgrown the market consistently in these therapy segments through market share gains and new product introductions. The Emerging Therapies of the Company comprise neuro/CNS, derma, cardiac and anti-diabetes. Given the strong underlying

ALKEM LABORATORIES LTD.38
growth in these segments on account of changing lifestyle and food habits, the Company has made significant investments in these therapies in terms of product development and build its sales and marketing infrastructure. Emerging Therapies are expected to contribute significantly to the Company’s domestic business growth, going forward.
Alkem performance vs Industry performance:
Y-o-Y growth in FY16
Therapy SegmentAlkem’s
Growth
Industry
Growth
Market Share
in segment
MAT March
2016 Rank
YoY Change
in Rank*
Anti-Infectives 10.3% 6.4% 11.6% 1 Unchanged
Gastro-Intestinal 19.0% 15.1% 5.7% 3 Unchanged
Pain / Analgesics 14.2% 11.2% 5.1% 3 Unchanged
Vitamins / Minerals / Nutrients 16.2% 15.0% 3.7% 5 +1
Respiratory 16.5% 10.7% 1.5% 19 -1
Neuro / CNS 23.5% 15.1% 1.9% 14 +2
Gynaec. 12.3% 12.6% 2.6% 9 Unchanged
Derma 18.8% 17.0% 1.5% 15 Unchanged
Cardiac 33.7% 14.2% 0.6% 30 +1
Anti-Diabetic 31.2% 19.8% 0.8% 28 +1
Others 13.9% 13.9% 0.7% NA NA
Grand Total 14.4% 13.5% 3.5% 5 +1
Key Highlights 2015-16• Robust sales growth: The Company’s net consolidated
operating revenues from the domestic business increased by 29.9% to ` 36,182 mn in financial year 2016, compared to ` 27,864 mn in financial year 2015. This was primarily driven by strong performance of the Company’s top brands, market share gains in key therapeutic segments and new product introductions. The reported Y-o-Y growth also includes consolidation of financials of Indchemie Health Specialties Private
Limited (Indchemie) and Cachet Pharmaceutical Private Limited (Cachet) in the financial year 2016.
• New product introductions: The Company launched 53 new products, including line extensions and new stock keeping units, during the financial year 2016. These included in-licensed as well indigenously developed products. Key product launches included:
(Source: IMS SSA MAT March 2016) *+ means improvement in rank.
19.6%
2013-14 23,607#
2014-15 28,318#
2015-16 36,182*
2012-13 20,475#
2011-12 17,536#
2010-11 14,783#
5 YEAR CAGR
` in mn
*Reported numbers
#Restated numbers as reported in the Prospectus
Net operating revenues (Domestic)
R&D at Taloja facility

ANNUAL REPORT 2015-16 39
CO
RP
OR
AT
E O
VE
RV
IEW
FIN
AN
CIA
L STAT
EM
EN
TS
STAT
UTO
RY
RE
PO
RT
S
Management Discussion and Analysis
o Rituximab – Alkem’s first Monoclonal Antibodies (MABs). Launched under Oncology division. Estimated size of Rituximab market in India is about ` 2,000 million.
o Teneligliptin - Alkem’s first DPP IV inhibitor. Launched under Anti-diabetes division. Estimated size of DPP IV inhibitors market in India is about ` 15 billion.
o Faropenem – Oral penem to fill portfolio gap in anti-infective segment.
o Sofosbuvir and combinations – Launched Hepatitis C portfolio to strengthened the product offering in the gastro-intestinal segment.
Some of the Company’s recent product launches (launched over last 24 months) like Merosure (penem, anti-infectives), Gemcal Plus (pain and analgesic), Pan MPS (gastro-intestinal), Olkem Trio (cardiac) and Tacrovera (derma) has met with encouraging response in the market.
• Healthy prescription growth: The Company registered a healthy growth in its prescriber base with 71.9% prescriber coverage in financial year 2016, compared to 70.7% in financial year 2015. Also, its prescriptions market share in India improved from 6.8% in financial year 2015 to 7.9% in financial year 2016. (Source: IMS Health)
(%)Established relationship with prescribers
Source: IMS Health
28.1
71.9
Prescribers of Alkem brands 1
Others
Alkem ranked among the leading companies in terms of prescription generation with 7.9% share of overall prescription in India1
Note: 1For 12 months ended March 2016
• Outperformance in the Company’s Established Therapies: The Company enhanced its leadership position in the Established Therapies with market share gain and improvement in market ranking.
o Anti-infectives: The Company maintained its number one ranking in this segment with market share improving from 11.2% (MAT March 2015) to 11.6% (MAT March 2016).
o Gastro intestinal: The Company’s market share improved from 5.5% (MAT March 2015) to 5.7% (MAT March 2016), as it continues to feature among top three companies in India in gastro intestinal segment.
o Pain / Analgesics: The Company occupies the 3rd position in this segment. Its market share increased from 4.9% (MAT March 2015) to 5.1% (MAT March 2016).
o Vitamins / Minerals / Nutrients: The Company gained one position in financial year 2016 and now rank fifth in this segment with improved market share of 3.7% (MAT March 2016).
• Robust growth in the Company’s Emerging Therapies: The Company delivered healthy growth in the Emerging Therapies with improvement in market rankings.
o Neuro / CNS: The Company’s market ranking improved by two positions during the year and it is now rank fourteenth (MAT March 2016) in this segment. The Company’s secondary sales during the year grew by 23.5% compared to segment growth of 15.1%.
o Cardiac and anti-diabetic: The Company improved its rankings in cardiac and anti-diabetic segments by one position. Its secondary sales growth during the year, in both these therapies was in excess of 30% - better than segment growth of 14-20%.
• Improvement in field force productivity: The Company saw a healthy year-on-year improvement in its field force productivity driven by volume growth, market share gain and its initiatives under the SFE (Sales Force Effectiveness) programme.
• Uprise-D3 among top 300 pharma brands: Uprise-D3, Company’s Vitamin D3 supplement, entered into coveted list of top 300 brands in India. This is Company’s 14th brand in top 300 brands in India. Further, out of its 13 existing brands in the top 300 list, five improved their rankings during the year.
(Source: IMS SSA MAT March 2016)

ALKEM LABORATORIES LTD.40
Growth Strategies• The Company continues to drive its market-leading
growth in the Established Therapies of anti-infective, gastro-intestinal, pain and analgesic and vitamins, minerals and nutrients, through continuous brand building efforts, growing its prescriber base and driving more prescriptions from the existing prescribers.
• The Company is focusing on building its market shares in fast-growing therapeutic areas of cardiology, diabetology, neuro-psychiatry, dermatology and oncology, through market share acquisition and new product introductions.
• The Company is driving its new product launches through indigenous R&D and through collaboration with global pharma companies to widen its product offering and fill-in portfolio gaps.
• The Company continues to invest in training of its field force to further enhance their effectiveness, thereby optimising field force productivity.
• The Company also intends to selectively pursue areas with high growth opportunities, such as development of monoclonal anti-bodies and therapeutic proteins in various therapeutic areas including oncology, osteoporosis, psoriasis and rheumatoid arthritis.
Key challenges in financial year 2017• Expansion of NLEM list – Under the recently announced
NLEM 2015 list, which replaces the NLEM 2013 list, the Company now has a higher proportion of its domestic business under the ambit of price control. Further, the regulator has also announced revision of ceiling prices for some of the formulations, which were under NLEM 2013 list and continue to feature under NLEM 2015 list. This has impacted the prices of some of the Company’s key brands.
• Negative WPI – In accordance to the regulations governing the pricing of the formulations under the NLEM list, the Company needs to revise the prices of its formulations, falling under the NLEM list, in-line with the WPI. As the WPI for the year ending December 2015 was negative, the Company has accordingly taken price-cuts for the drugs that are falling under the NLEM list.
• Proposed ban on FDC drugs – In March 2016, the Health Ministry banned 344 fixed drug combinations through a gazette notification. Some of the Company’s formulations also feature in this list. While the pharma companies, including Alkem, have challenged the order in the High Court and the final verdict on this is awaited, any negative ruling on the matter leading to the implementation of the proposed ban could impact the Company’s growth rate.
OutlookDespite the regulatory headwinds mentioned above, the Company would strive to deliver growths ahead of the market growth rate. This would primarily be done without deviating from its core strategy of consolidating its strength in the established therapies of anti-infectives, gastro-intestinal, pain management and vitamins, minerals & nutrients and building its burgeoning base in the emerging therapy areas of cardiac, anti-diabetes, CNS and derma.
The Company looks to further sharpen its execution capabilities to drive volume growth, gain market share and improve field force productivity. The Company would also expand its product offerings to not only fill portfolio gaps in the existing therapy areas but also enter newer ones. These would be the Company’s key drivers of growth as the Company looks forward to deliver yet another year of out performance.
Company’s manufacturing facility at Mandva, Gujarat

ANNUAL REPORT 2015-16 41
CO
RP
OR
AT
E O
VE
RV
IEW
FIN
AN
CIA
L STAT
EM
EN
TS
STAT
UTO
RY
RE
PO
RT
S
Management Discussion and Analysis
INTERNATIONAL BUSINESSUS BusinessFinancial Highlights
19.8%Contribution to net
consolidated revenue
`9,907 mnNet consolidated revenues from
US business
OverviewThe US is the key focus market for the Company’s international operations. The Company has its own front end that markets and sells its products to major pharmacy chains’ stores, wholesalers, managed care companies, distributors, food and grocery stores and pharmaceutical retailers in the US under its acquired brand ‘Ascend’.
As of 31st March 2016, Ascend sold 19 products in the market, out of which 14 are the Company’s own products and five are in-licensed from third parties. Additionally, the Company has six US FDA accredited manufacturing facilities and four R&D centres, which supports its growth in the US markets.
Key Highlights 2015-16• Strong revenue growth: The Company’s net
consolidated operating revenues from the US business increased by 38.9% to ` 9,907 mn in financial year 2016, compared to ` 7,131 mn in financial year 2015. The growth was driven by market share gains in the existing products, new product launches and full-year sales of Mycophenolate Mofetil suspension, which was launched towards latter half of the financial year 2015.
• Uptick in ANDA filing rate: The Company filed 12 ANDAs during the financial year 2016, taking its cumulative filings to 76 ANDAs and 1 NDA (as on 31st March 2016). 31 of these are Para IV filings including First-to-File (FTF) opportunities.
• Highest ANDA approvals in a year: The Company received 12 ANDA approvals (including 3 tentative approvals) during the year, taking cumulative ANDA approvals to 30 (including 4 tentative approvals) and
1 NDA (as on 31st March 2016). This is the highest number of ANDA approvals that the Company has received in a particular year.
• Acquisition of manufacturing facility: In June 2015, the Company acquired a formulation manufacturing facility along with its R&D capabilities from Long Pharmaceuticals LLC, in the US. This acquisition not only helps the Company in diversifying its manufacturing footprint but also provides it with manufacturing capabilities in dosage forms like semi-solids, liquid and nasal formulations. The Company is further scaling up the manufacturing capacity and R&D capabilities of this facility as it looks to file ANDAs in relatively niche areas from here.
• USFDA accreditation for Mandva API facility: During the financial year 2016, the Company received USFDA approval for its API manufacturing plant at Mandva, Gujarat. This plant was inspected by the USFDA in September 2015, post which the Company received Establishment Inspection Report (EIR) from the USFDA in March 2016, making it the Company’s sixth USFDA approved manufacturing facility.
• Successful USFDA inspections: During the financial year 2016, the Company’s formulation facility at Baddi (India) and its API facility at California underwent successful inspection by the USFDA. This was in addition to its formulation facility at St. Louis (California), which was successfully inspected by the USFDA in February 2015.
With >70 ANDA filings,
6 USFDA approved facilities
and own front end, the
Company believes it has
the required infrastructure
to support its growth in
the US.
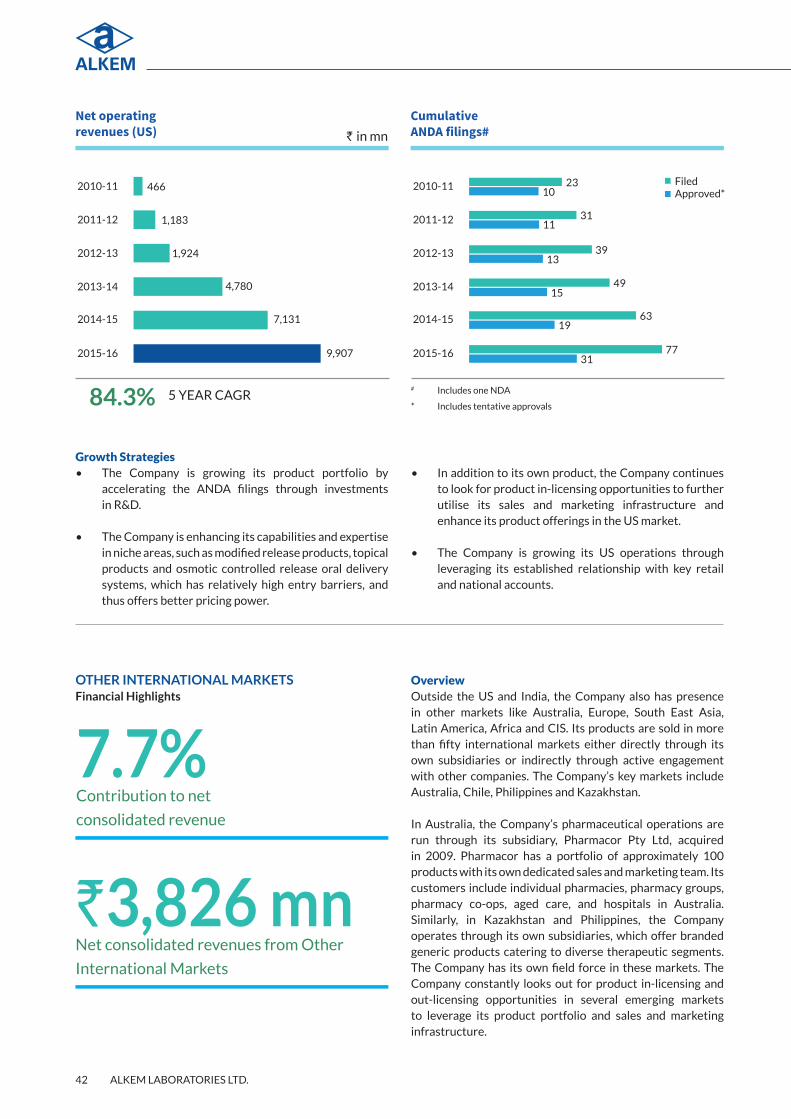
ALKEM LABORATORIES LTD.42
84.3%
2013-14 4,780
2014-15 7,131
2015-16 9,907
2012-13 1,924
2011-12 1,183
2010-11 466
5 YEAR CAGR
` in mn
2013-14
2014-15
772015-16
FiledApproved*
31
1963
1549
1339
1131
1023
2012-13
2011-12
2010-11
Growth Strategies• The Company is growing its product portfolio by
accelerating the ANDA filings through investments in R&D.
• The Company is enhancing its capabilities and expertise in niche areas, such as modified release products, topical products and osmotic controlled release oral delivery systems, which has relatively high entry barriers, and thus offers better pricing power.
• In addition to its own product, the Company continues to look for product in-licensing opportunities to further utilise its sales and marketing infrastructure and enhance its product offerings in the US market.
• The Company is growing its US operations through leveraging its established relationship with key retail and national accounts.
OTHER INTERNATIONAL MARKETSFinancial Highlights
7.7%Contribution to net
consolidated revenue
`3,826 mnNet consolidated revenues from Other
International Markets
OverviewOutside the US and India, the Company also has presence in other markets like Australia, Europe, South East Asia, Latin America, Africa and CIS. Its products are sold in more than fifty international markets either directly through its own subsidiaries or indirectly through active engagement with other companies. The Company’s key markets include Australia, Chile, Philippines and Kazakhstan.
In Australia, the Company’s pharmaceutical operations are run through its subsidiary, Pharmacor Pty Ltd, acquired in 2009. Pharmacor has a portfolio of approximately 100 products with its own dedicated sales and marketing team. Its customers include individual pharmacies, pharmacy groups, pharmacy co-ops, aged care, and hospitals in Australia. Similarly, in Kazakhstan and Philippines, the Company operates through its own subsidiaries, which offer branded generic products catering to diverse therapeutic segments. The Company has its own field force in these markets. The Company constantly looks out for product in-licensing and out-licensing opportunities in several emerging markets to leverage its product portfolio and sales and marketing infrastructure.
# Includes one NDA
* Includes tentative approvals
Net operating revenues (US)
Cumulative ANDA filings#

ANNUAL REPORT 2015-16 43
CO
RP
OR
AT
E O
VE
RV
IEW
FIN
AN
CIA
L STAT
EM
EN
TS
STAT
UTO
RY
RE
PO
RT
S
Management Discussion and Analysis
18.2%
2013-14 2,872
2014-15 2,439
2015-16 3,826
2012-13 2,553
2011-12 1,437
2010-11 1,659
5 YEAR CAGR
` in mn
Key Highlights 2015-16• Robust underlying demand for the Company’s
products: The Company’s net consolidated operating revenues from other international markets increased by 56.9% to 3,826 mn in financial year 2016, compared to ` 2,439 mn in the financial year 2015. Despite the currency headwinds in many of the Company’s emerging markets, the growth was primarily driven by strong underlying demand for its products in key market of Australia, Chile and Kazakhstan.
• Strong traction in Australia sales: The Company’s business in Australia posted strong revenue growth in excess of 90% YoY in local currency driven by healthy offtake of key brand Osteomol – an exclusive generic paracetamol 665 mg product.
• Exponential growth in Chile: The Company’s business in Chile witnessed exponential growth in local currency terms. This was mainly driven by new product introductions. Further, the Company filed 46 products in Chile during the financial year including 16 in-licensed products.
• Impressive growth in Kazakhstan: The Company’s sales in Kazakhstan grew by over 90% Y-o-Y during the financial year in local currency. This was on the back of new product introductions and market share gains in existing products.
Growth Strategies• Market and sell products that the Company develops
for the US market in other international markets, as it expects a good underlying demand for these products in the developed and emerging markets.
• The Company continues to focus and capitalise on the growth opportunities in international markets like Australia, Chile, Kazakhstan and Philippines by building a strong local presence and expertise.
• The Company is constantly looking out for strategic acquisitions and partnership agreements for out-licensing and in-licensing opportunities to enhance its product portfolio.
Outlook for International BusinessUS: The Company has a clear focus on select international markets, with the US being the most important one. With a healthy product pipeline of 77 ANDAs (including one NDA) filed with the USFDA and the benefit of having its own front end and supply chain in the US, the Company is in a good position to capitalise on the market opportunities. Further, as the Company continues to file higher than historical average ANDAs every year and the advantages of GDUFA system in terms of reduce approval timelines beginning to become visible, the Company is positive that it will be able to launch more products in the marketplace than in the past.
Other International Markets: Besides the US, Australia, Chile and Kazakhstan are the other focused markets for the Company. The Company believes it has lot of growth opportunities through market share increases in its existing products, acquisition of new customers and new product introductions. While the Company is clearly focused on long-term growth, it continues to explore various growth opportunities that exist in these markets.
While the market and environment for International Business continues to be challenging and volatile, the Company’s strategy, execution and opportunities present significant upsides.
With approval timelines
reducing by USFDA and
advantages of GDUFA
system beginning to
become visible, the
Company is positive that it
will be able to launch more
products in the marketplace
than in the past.
Net operating revenues (Other International Markets)

ALKEM LABORATORIES LTD.44
Strategic Initiatives
ENZENE BIOSCIENCES LIMTED (ENZENE)As per Industry estimates, the global biosimilars market is expected to touch about $6 billion by 2020, with a CAGR of over 20%. The growth of the global biosimilars market is expected to be driven by factors, such as growing demand for biosimilars in different therapeutic applications including rheumatoid arthritis, oncology, autoimmune diseases and blood disorders, increasing number of biologic drugs going off-patent, and increasing pressure to curtail healthcare expenditure. However, factors such as high manufacturing complexities, stringent regulatory requirements and significant investments serve as significant deterrent for companies to foray into biosimilars market, thereby making it relatively less competitive.
Alkem has made investments to participate in the global biosimilar markets through its subsidiary Enzene Biosciences. Enzene is a biotech focused R&D company located in Pune. It is led by a team of scientists with rich experience in biotechnology field. Enzene has established several technology platforms in the areas of molecular biology, protein expression, fermentation technology (microbial, insect and mammalian cells), bio-analytics, immunology and peptide synthesis. It has biosimilar products in preclinical and clinical development stages. It aims to monetise these products over the medium- to long-term time period, thereby further augmenting the Company’s product portfolio in India and International markets.
COST OPTIMIZATION PROGRAMME - PROJECT UDAANCost optimisation and improving profitability is an ongoing endeavour at Alkem. In this direction, the Company collaborated with a global consultant to start a companywide focused initiative under Project Udaan. The key focus of this programme is to improve procurement spends and strengthen procurement related processes without compromising on quality and compliance.
During the year, the Company worked on strengthening its procurement programmes, which include areas like direct materials (raw and packing materials), finished goods and packing materials. The Company conducted in-depth market studies and worked closely with existing and new partners to find innovative ways to optimise costs in a sustainable manner. This has resulted in significant cost saving during the year, a part of which is reflected in its year-on-year improvement in gross and EBITDA margins. Going forward, the Company is targeting newer avenues of process optimisation and are testing various levers of cost optimisation to further improve profitability.
Manufacturing facilities
The Company owns and operates 16 manufacturing facilities across five locations in India and two locations in the US. Of the 14 facilities in India, the Company facilities at Ankaleshwar and Mandwa are API manufacturing facilities. The remaining Indian facilities, including those at Daman, Baddi and Sikkim, manufacture formulations.
In December 2012, the Company acquired an API research and manufacturing facility in California. This facility is capable of pre-clinical API supplies, as well as process R&D. It is also in the business of contract research and manufacturing services apart from API manufacturing and sales. Further, in June 2015, the Company acquired a formulation facility in St. Louis (Missouri), US. This facility has been successfully manufacturing and developing pharmaceutical products since 1998 and is capable of manufacturing oral liquids, nasal sprays, and semi-solids pharmaceutical formulations. In addition, it offers comprehensive drug product development and manufacturing services to the pharmaceutical industry.
All of the Company’s manufacturing facilities are cGMP compliant and has been approved by several regulatory authorities inter alia the USFDA, the UK-MHRA, Indian GMP and TGA Australia. The Company has six USFDA approved facilities – four in India and two in the US.
The Company also enjoys certain fiscal benefits at some of its manufacturing units for domestic market.
Research and Development
The Company conducts R&D activities at four of its facilities, two in India at Taloja and Pune, and two in the US at California and St. Louis. The Company intends to increase its initiatives in R&D to enhance its differentiated product portfolio in both the domestic market and international markets while strengthening its ANDA filings in the US.
As of 31st March 2016, the Company employed over 500 scientists in R&D functions. Its in-house capabilities provides It with the capacity to develop a wide range of dosage forms and APIs, and has a key role in growing the business. Further, the Company has identified biosimilars as a long-term growth opportunity and has made, and expect to continue to make investments in product development with a focus on high-growth therapeutic areas, such as oncology, autoimmune disorders and osteoporosis.
The Company also has a 100-bed clinical research facility, where it conducts studies on healthy volunteers to prove the effectiveness of developed formulations in accordance with the regulatory guidelines of various regulatory agencies.

ANNUAL REPORT 2015-16 45
CO
RP
OR
AT
E O
VE
RV
IEW
FIN
AN
CIA
L STAT
EM
EN
TS
STAT
UTO
RY
RE
PO
RT
S
Management Discussion and Analysis
Additionally, the Company also has a regulatory affairs team, which is responsible for various filings and approvals related to its products in India and other international markets. The company also has an Intellectual property (IP) group that looks after patent filing, patent prosecution, design filing, infringement analysis and patent litigations for the global markets.
Quality and Assurance
The Company has Quality functions to monitor process operations and assure the quality, safety, and efficacy of its products. This function, which reports to the Chief Executive Officer and Joint Managing Director, is responsible for overseeing all Quality operations of the Company’s manufacturing facilities and imposing stringent controls on facility, equipment, materials, vendors, transportation, warehousing, engineering and utilities. It ensures all practices are in accordance to approved standard operating procedures. The Company complies with various international regulatory and cGMP standards and performs internal periodic reviews of systems, practices, and documentation across its manufacturing facilities through regular audits as per their Quality Management System.
The Company’s formulation manufacturing facilities based at Daman, Baddi and St. Louis (Missouri, the US) have been accredited by the USFDA, UK-MHRA, TGA and other regulatory agencies. In addition, the API manufacturing facilities based at Ankaleshwar, Mandva (Gujarat) and California have also been accredited by USFDA.
The Company recruits qualified staff at all levels and has regular on-the-job good manufacturing practice and safety training. Internal and external trainers are employed for mentoring the staff skills. All product manufacturing stages are closely monitored by the Quality function. Apart from this, all equipment and instruments are checked and calibrated at regular intervals. The Company also monitors and controls the environmental parameters within its manufacturing facility and periodically validate all critical utility systems.
The Company’s products are released for distribution only after they meet all quality specifications, and this is certified through a rigorous internal process. All products undergo extensive stability testing programmes to understand the product behaviour during shelf life. The Company also monitors in-market product quality through annual product quality review mechanism.
Manufacturing at Company’s Daman facility

ALKEM LABORATORIES LTD.46
Update on regulatory inspection at Taloja Bioequivalence Centre• The UK MHRA (United Kingdom – The Medicines and
Healthcare products Regulatory Agency) had conducted an inspection at the Company’s Bioequivalence (BE) centre at Taloja (Maharashtra, India) from 14th March to 18th March 2016. In their inspection report, UK MHRA has listed eight observations that were not conforming to the Good Clinical Practice requirements. The Company has responded to the UK MHRA on 4th May 2016 with an appropriate remedial and preventive plan to assure total compliance to the requirements of Good Clinical Practices.
• The Federal Institute of Drug and Medical Devices (BfArM), Germany, and the Health Care Inspectorate (IGZ), Ministry of Health of The Netherlands performed a joint inspection at the Company’s BE centre at Taloja from 9th March to 12th March 2015. Based on the findings of BfArM, The European Medicines Agency (EMA) decided to review the studies carried out by the Company at Taloja BE centre between March 2013 and March 2015. On 11th May 2016, the Company submitted its response to the EMA with supporting details of the actions taken / plan for the future to take care of the observations.
Human Capital
Alkem is committed to provide an enriching career path, collaborative and autonomous work environment to attract, retain, and develop the best-in-class talent. The Company’s people are its strongest assets. The Company is committed to build the best-in-class team led by exceptional individuals to build a globally respected organisation.
As of March 31, 2016 the Company’s total employee strength was over 13,000 across its domestic and international operations.
People are the biggest strength of the Company. They are driven by passion and a deep commitment to deliver the best results to the Company. The company attempts to provide the most conducive environment for its employees this along with training and career-development in order that people are able to learn and apply best-in-class business concepts and practices in their work. This application of learning to business practice is what enriches the Company in being a learning organisation.
Company’s R&D centre at Taloja, Maharashtra

ANNUAL REPORT 2015-16 47
CO
RP
OR
AT
E O
VE
RV
IEW
FIN
AN
CIA
L STAT
EM
EN
TS
STAT
UTO
RY
RE
PO
RT
S
Management Discussion and Analysis
The Company has a well thought out incentive plan, which not only motivates its executives to implement the growth strategies but also increase their overall earning potential leading to greater engagement and employee satisfaction. The Company believes in the following three fundamentals of Self Respect, Dignity and Personal Pride. This brings about an innate motivation to each and every employee to give their best to the organisation.
Internal Control & System
The Company has a well-established internal control framework, which is designed to continuously assess the adequacy, effectiveness, and efficiency of financial and operational controls. The integrity and reliability of the internal control systems are achieved through clear policies and procedures. To create enduring value for all stakeholders and ensure the highest level of honesty, integrity, and ethical behaviour in all its operations, Alkem Laboratories has implemented a ‘Whistle Blower Policy’ in addition to the existing code of conduct that governs the action of its employees.
Internal audit at Alkem is an independent and assurance function, responsible for evaluating and improving the effectiveness of control and process. The internal audit department prepares annual audit plan based on risk assessment and conduct extensive reviews covering financial, operational and compliance controls. Areas requiring specialised knowledge are reviewed in partnership
with external experts. The Audit Committee of the Board monitors the performance of internal audit department on a periodic basis through reviews of audit plan, audit findings, and implementation status.
Cautionary statements
The ‘Management Discussion and Analysis’ contains statements describing the Company’s objectives, projections, estimates, expectations, plans or predictions or industry conditions or events which are ‘forward-looking statement’ within the meaning of applicable securities laws and regulations. Such forward-looking statements involve known and unknown risks, uncertainties and other factors that may cause actual results to differ materially from those expressed or implied due to important factors that could make a difference to the Company’s operations including but not limited to general economic and business conditions in India and other key global markets in which the Company operates, the ability to successfully implement its strategy, research and development efforts, growth and expansion plans and technological changes, changes in laws and regulations that apply to the Company and increasing competition in and the conditions of its customers, suppliers and the pharmaceutical industry. The Company assumes no responsibility to publicly update, amend, modify or revise any forward-looking statements, on the basis of any subsequent development, new information or future events or otherwise except as required by applicable law.
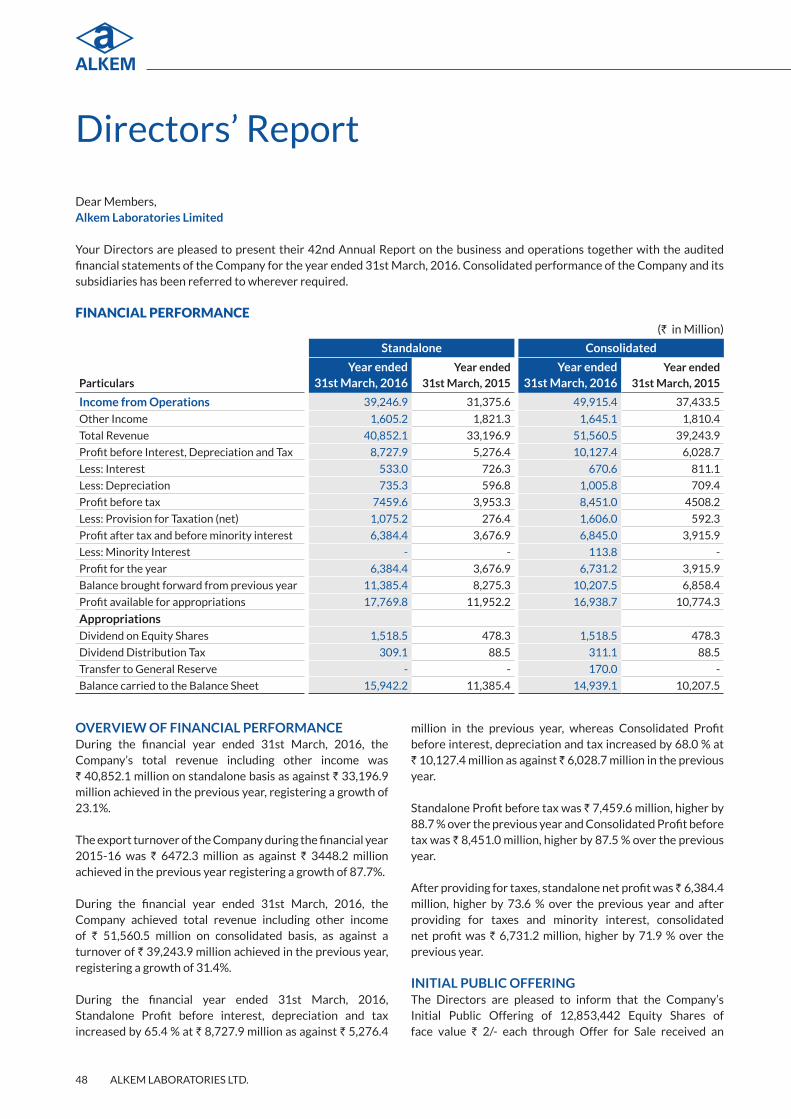
ALKEM LABORATORIES LTD.48
Directors’ Report
Dear Members, Alkem Laboratories Limited
Your Directors are pleased to present their 42nd Annual Report on the business and operations together with the audited financial statements of the Company for the year ended 31st March, 2016. Consolidated performance of the Company and its subsidiaries has been referred to wherever required.
FINANCIAL PERFORMANCE(` in Million)
Particulars
Standalone Consolidated
Year ended 31st March, 2016
Year ended
31st March, 2015
Year ended 31st March, 2016
Year ended
31st March, 2015
Income from Operations 39,246.9 31,375.6 49,915.4 37,433.5
Other Income 1,605.2 1,821.3 1,645.1 1,810.4
Total Revenue 40,852.1 33,196.9 51,560.5 39,243.9
Profit before Interest, Depreciation and Tax 8,727.9 5,276.4 10,127.4 6,028.7
Less: Interest 533.0 726.3 670.6 811.1
Less: Depreciation 735.3 596.8 1,005.8 709.4
Profit before tax 7459.6 3,953.3 8,451.0 4508.2
Less: Provision for Taxation (net) 1,075.2 276.4 1,606.0 592.3
Profit after tax and before minority interest 6,384.4 3,676.9 6,845.0 3,915.9
Less: Minority Interest - - 113.8 -
Profit for the year 6,384.4 3,676.9 6,731.2 3,915.9
Balance brought forward from previous year 11,385.4 8,275.3 10,207.5 6,858.4
Profit available for appropriations 17,769.8 11,952.2 16,938.7 10,774.3
AppropriationsDividend on Equity Shares 1,518.5 478.3 1,518.5 478.3
Dividend Distribution Tax 309.1 88.5 311.1 88.5
Transfer to General Reserve - - 170.0 -
Balance carried to the Balance Sheet 15,942.2 11,385.4 14,939.1 10,207.5
OVERVIEW OF FINANCIAL PERFORMANCEDuring the financial year ended 31st March, 2016, the Company’s total revenue including other income was ` 40,852.1 million on standalone basis as against ` 33,196.9 million achieved in the previous year, registering a growth of 23.1%.
The export turnover of the Company during the financial year 2015-16 was ` 6472.3 million as against ` 3448.2 million achieved in the previous year registering a growth of 87.7%.
During the financial year ended 31st March, 2016, the Company achieved total revenue including other income of ` 51,560.5 million on consolidated basis, as against a turnover of ` 39,243.9 million achieved in the previous year, registering a growth of 31.4%.
During the financial year ended 31st March, 2016, Standalone Profit before interest, depreciation and tax increased by 65.4 % at ` 8,727.9 million as against ` 5,276.4
million in the previous year, whereas Consolidated Profit before interest, depreciation and tax increased by 68.0 % at ` 10,127.4 million as against ` 6,028.7 million in the previous year.
Standalone Profit before tax was ` 7,459.6 million, higher by 88.7 % over the previous year and Consolidated Profit before tax was ` 8,451.0 million, higher by 87.5 % over the previous year.
After providing for taxes, standalone net profit was ` 6,384.4 million, higher by 73.6 % over the previous year and after providing for taxes and minority interest, consolidated net profit was ` 6,731.2 million, higher by 71.9 % over the previous year.
INITIAL PUBLIC OFFERINGThe Directors are pleased to inform that the Company’s Initial Public Offering of 12,853,442 Equity Shares of face value ` 2/- each through Offer for Sale received an

ANNUAL REPORT 2015-16 49
CO
RP
OR
AT
E O
VE
RV
IEW
FIN
AN
CIA
L STAT
EM
EN
TS
STAT
UTO
RY
RE
PO
RT
S
Directors’ Report
SUBSIDIARIESAs on 31st March, 2016, the Company had 18 subsidiaries. The Company does not have any joint venture / associate company (ies) within the meaning of Section 2(6) of the Act.
Details of companies which have become or ceased as subsidiary, associates and joint ventures, during the year under review, are as under:
Name Details of Change Date of Change
Alkem Real
Estate LLP
Ceased to be a subsidiary
due to liquidation
(Strike off)
11th September,
2015
Pursuant to the first proviso to Section 129(3) of the Act and Rule 5 and Rule 8(1) of the Companies (Accounts) Rules, 2014, the salient features of financial statements, performance and financial position of each subsidiary is given in Form AOC-1 as Annexure A to this Report. The Audited Financial Statements of the subsidiaries are available on the Company’s website at www.alkemlabs.com and are available for inspection by the Members at the Registered Office of the Company during business hours on all working days as required under Section 136 of the Act. Any Member desirous of obtaining a copy of the said financial statements may write to the Company Secretary at the Registered Office of the Company.
MANAGEMENT DISCUSSION AND ANALYSISA detailed report on the Management Discussion and Analysis is provided as a separate section forming part of this Report.
CORPORATE GOVERNANCEA detailed report on the corporate governance systems and practices of the Company is provided as a separate section along with a certificate from the Statutory Auditors confirming the compliance by the Company with the conditions of Corporate Governance, forming part of this Report.
CORPORATE SOCIAL RESPONSIBILITYThe Company continues to believe in operating and growing its business in a socially responsible way. This belief forms the core of the CSR policy of the Company that drives it to focus on holistic development of its host community and immediate social and environmental surroundings qualitatively. The Company’s CSR Policy framework puts emphasis on social outreach programs in the areas of Education, Vocational Training, Health, Environment and Rural Development.
Details about the Company’s CSR Policy and initiatives undertaken by the Company during financial year 2015-16 are outlined in the Report on CSR Activities annexed to this Report as Annexure B.
overwhelming response from the investors. The Issue opened for subscription on 8th December, 2015 and closed on 10th December, 2015. The Company allotted 12,853,442 equity shares by the way of an offer for sale. The Qualified Institutional Bidder portion (excluding Anchor Investor Portion) was subscribed to the extent of 57.19 times, while the Non-Institutional and Retail portion were subscribed to the extent of 129.96 times and 3.17 times respectively. The Employee portion was subscribed to the extent of 0.67 time. The issue constituted 10.75% of the post-issue capital of the Company and the same was overall subscribed to the extent of 44.29 times. The Equity Shares of the Company are listed on BSE Limited and the National Stock Exchange of India Limited.
UTILISATION OF IPO PROCEEDSAs the Company’s IPO was through an offer for sale, the Company did not receive any proceeds from the offer and the proceeds were paid to the shareholders who offered their shares for sale.
DIVIDENDDuring the financial year 2015-16, your Company declared and paid an Interim dividend at ` 3/- per Equity Share being 150% of paid up share capital on 28th September, 2015 and a Second Interim dividend at ` 9.7/- per Equity Share being 485% of paid up share capital on 9th March, 2016. In view of the payment of interim dividends during the year, the Directors have not recommended any further dividend for the financial year ended 31st March, 2016.
TRANSFER TO RESERVESThe Company has not transferred any amount to the general reserve. An amount of ` 15,942.2 million is proposed to be retained in the Statement of Profit and Loss.
SHARE CAPITALThe paid up Equity Share Capital as on 31st March, 2016 was ` 239.1 million. The Company has neither issued shares with differential rights as to dividend, voting or otherwise nor issued shares to the employees or Directors of the Company, under any Scheme (including sweat equity shares).
DEPOSITSThe Company has not accepted any deposits from the public/members under Section 73 of the Companies Act, 2013 (hereinafter referred to as the Act) read with Companies (Acceptance of Deposits) Rules, 2014 during the year. There are no deposits which are outstanding as on 31st March, 2016. The Company has no deposits which are not in compliance with the requirements of Chapter V of the Companies Act, 2013.

ALKEM LABORATORIES LTD.50
DIRECTORS AND KEY MANAGERIAL PERSONNELAppointmentsAs per the provisions of Section 149 and Section 152 of the Act, the shareholders at the Annual General Meeting (AGM) held on 13th July, 2015, appointed Mr. Arun Kumar Purwar (DIN 00026383), Ms. Sangeeta Singh (DIN 06920906) and Ms. Sudha Ravi (DIN 06764496) as Independent Directors of the Company. The terms and conditions of the appointment of the Independent Directors are posted on Company’s website.
Resignations/RetirementsMr. Ennapadam N. Shankar (DIN 02118438) resigned from the Board with effect from 15th June, 2015. The Board places on record its appreciation for his valuable contribution during his tenure with the Company.
Directors liable to Retirement by RotationMr. Dhananjay Kumar Singh (DIN 00739153) is liable to retire by rotation at the ensuing AGM pursuant to the provisions of Section 152 of the Act read with the Companies (Appointment and Qualification of Directors) Rules, 2014 and the Articles of Association of the Company and being eligible he has offered himself for re appointment. Appropriate resolution for his re-appointment is included in the Notice of AGM for seeking approval of Members. The Directors recommend his re-appointment for your approval.
A brief resume and particulars relating to him is given separately as an annexure to the AGM Notice.
Key Managerial PersonnelMr. Prabhat Agrawal, Chief Executive Officer, Mr. Rajesh Dubey, Chief Financial Officer and Mr. Manish Narang, Senior Vice President Legal, Company Secretary and Compliance Officer are the Key Managerial Personnel of the Company in accordance with the provisions of Sections 2(51) and 203 of the Act read with Companies (Appointment and Remuneration of Managerial Personnel) Rules, 2014.
There has been no change in the Key Managerial Personnel during the financial year 2015-16.
Independent DirectorsThe Independent Directors hold office for a fixed term of 5 (Five) years and are not liable to retire by rotation.
In accordance with the Section 149(7) of the Act, each Independent Director has given a written declaration to the Company confirming that he/she meets the criteria of Independence as mentioned under Section 149(6) of the Act and SEBI (Listing Obligation and Disclosure Requirements) Regulations, 2015 (hereinafter referred to as “SEBI LODR Regulations”).
Familiarization ProgramIn compliance with the requirements of SEBI LODR Regulations, the Company has put in place a familiarization programme for the Independent Directors to familiarize them with their roles, rights and responsibilities as Directors,
the working of the Company, nature of the industry in which the Company operates, business model etc. The details of the familiarization programme are explained in the Corporate Governance Report. The same is also available on the Company website at http://www.alkemlabs.com/admin/Photos/Policies/973052158Directors%20Familiarisation%20Programme.pdf.
Annual Evaluation of Board’s PerformancePursuant to the provisions of the Act and the SEBI LODR Regulations, the Board has carried out the annual performance evaluation of its own performance, the Directors individually as well as the evaluation of the working of its Committees. The criteria applied in the evaluation process is explained in the Corporate Governance Report.
The Independent Directors at a separate meeting, evaluated performance of non-independent directors, performance of the Board as a whole and performance of the Chairpersons of the Company.
Remuneration PolicyThe Company follows a policy for selection and appointment of Directors, Senior Management and their remuneration. The said policy is annexed to this Report as Annexure C.
PARTICULARS OF EMPLOYEESThe disclosure pertaining to remuneration and other details as required under Section 197(12) of the Act read with Rule 5(1) of the Companies (Appointment and Remuneration of Managerial Personnel) Rules, 2014 is annexed to this Report as Annexure D.
Further a statement showing the names and other particulars of employees drawing remuneration in excess of the limits specified in Rule 5(2) and Rule 5(3) of the Companies (Appointment and Remuneration of Managerial Personnel) Rules, 2014 forms part of this report. However, in terms of first proviso to Section 136(1) of the Act, the Annual Report and annual financial statements are being sent to the Members and others entitled thereto, excluding the aforesaid information. The said information is available for inspection for the Members at the Registered Office of the Company during the business hours on working days and shall be provided to any Member on a written request to the Company Secretary.
NUMBER OF MEETINGS OF THE BOARDThe Board of Directors met 5 (Five) times during the financial year 2015-16. The details of the Board meetings and the attendance of Directors thereat are provided in the Corporate Governance Report forming part of the Annual Report.
In terms of requirements of Schedule IV of the Act, a separate meeting of Independent Directors was also held on 9th March, 2016 to review the performance of Non-Independent Directors (including the Chairpersons), the entire Board and quality, quantity and timelines of the flow of information between the Management and the Board.

ANNUAL REPORT 2015-16 51
CO
RP
OR
AT
E O
VE
RV
IEW
FIN
AN
CIA
L STAT
EM
EN
TS
STAT
UTO
RY
RE
PO
RT
S
Directors’ Report
COMMITTEES OF THE BOARDAudit CommitteeThe Audit Committee comprises of Mr. Ranjal Laxmana Shenoy, Chairman and Mr. Mritunjay Kumar Singh, Ms. Sudha Ravi and Ms. Sangeeta Singh as Members. The terms of reference of the Audit Committee and the particulars of meetings held and attendance thereat are mentioned in the Corporate Governance Report forming part of the Annual Report.
Nomination and Remuneration CommitteeThe Nomination and Remuneration Committee comprises of Mr. Arun Kumar Purwar, Chairman and Mr. Basudeo N. Singh, Mr. Akhouri Maheshwar Prasad and Ms. Sangeeta Singh as Members. The terms of reference of the Nomination and Remuneration Committee and the particulars of meetings held and attendance thereat are mentioned in the Corporate Governance Report forming part of the Annual Report.
Corporate Social Responsibility CommitteeThe Corporate Social Responsibility Committee comprises of Mr. Ranjal Laxmana Shenoy, Chairman and Mr. Dhananjay Kumar Singh, Mr. Sandeep Singh and Mr. Balmiki Prasad Singh as Members.
Stakeholders’ Relationship Committee The Stakeholders’ Relationship Committee comprises of Mr. Ranjal Laxmana Shenoy, Chairman and Mr. Dhananjay Kumar Singh, Mr. Sandeep Singh and Mr. Mangaldas Chhaganlal Shah as Members. The terms of reference of the Stakeholders’ Relationship Committee and the particulars of meetings held and attendance thereat are mentioned in the Corporate Governance Report forming part of the Annual Report.
DIRECTORS’ RESPONSIBILITY STATEMENTTo the best of their knowledge and belief, the Directors, pursuant to the requirement of Section 134(3) (c) of the Act, confirm that:(a) in the preparation of the annual accounts, the applicable
accounting standards have been followed along with proper explanation relating to material departures, if any;
(b) they have selected such accounting policies and applied consistently and made judgements and estimates that are reasonable and prudent so as to give a true and fair view of the state of affairs of the Company as at 31st March, 2016 and of the profit of the Company for the year ended on that date;
(c) they have taken proper and sufficient care for the maintenance of adequate accounting records in accordance with the provisions of the Act, for safeguarding the assets of the Company and for preventing and detecting fraud and other irregularities;
(d) they have prepared the annual financial statements on a going concern basis;
(e) they have laid down internal financial controls to be followed by the Company and that such internal financial controls are adequate and operating effectively;
(f) they have devised proper systems to ensure compliance with the provisions of all applicable laws and that such systems were adequate and operating effectively.
AUDITORS AND AUDITORS REPORTPursuant to the provisions of Section 139 of the Act and the Companies (Audit and Auditors) Rules, 2014, M/s BSR & Co. LLP (Firm Registration No: 101248W/W-100022), Chartered Accountants, the Statutory Auditors of the Company, hold office upto the conclusion of the Forty Fifth (45th) Annual General Meeting. However, their appointment as Statutory Auditors of the Company is subject to ratification by the Members at every Annual General Meeting. The Company has received a certificate from the said Auditors that they are eligible to hold office as the Auditors of the Company and are not disqualified from being so appointed.
A resolution for ratification of appointment of the said Auditors is included in the Notice of Annual General Meeting for seeking approval of Members.
Auditors ReportThe Auditors Report for financial year ended 31st March, 2016, does not contain any qualification, reservation or adverse remark.
Cost AuditorPursuant to the provisions of Section 148 of the Act and the Rules made thereunder read with notifications / circulars issued by the Ministry of Corporate Affairs from time to time and as per the recommendation of the Audit Committee, the Board of Directors at its meeting dated 28th September, 2015, appointed Mr. Suresh D Shenoy, Cost Accountant (Membership No. 8318), as the Cost Auditor of the Company for financial year 2015-16 to conduct the audit of the cost records of the Company. The Company had also received certificate from the Cost Auditor certifying his independence and arm’s length relationship with the Company. A resolution for ratification of the remuneration payable to the Cost Auditor is included in the Notice of Annual General Meeting for seeking approval of Members. The Cost Audit Report will be filed within the period stipulated under the Act.
Secretarial AuditPursuant to the provisions of Section 204 of the Act read with the Companies (Appointment and Remuneration of Managerial Personnel) Rules, 2014, the Board of Directors had appointed M/s. Manish Ghia & Associates, Practicing Company Secretaries, (Membership No. F6253, COP No. 3531) to conduct the Secretarial Audit of the Company for the financial year 2015-16. The Secretarial Audit Report is annexed to this Report as Annexure E. The said Report does not contain any qualification, reservation or adverse remark.

ALKEM LABORATORIES LTD.52
EXTRACT OF ANNUAL RETURNAs required under Section 92(3) of the Act and the Rules made thereunder, extract of the Annual Return in Form MGT-9 is annexed to this Report as Annexure F.
RELATED PARTY TRANSACTIONSAll the Related Party Transactions are entered into by the Company, at arm’s length basis, in the ordinary course of business and are in compliance with the applicable provisions of the Act and the SEBI LODR Regulations and the Company’s Policy on Related Party Transactions. During the financial year 2015-16, the Company did not enter into any material related party transactions, i.e. transactions exceeding ten percent of the consolidated turnover as per the last audited financial statements. Accordingly, the disclosure of Related Party Transactions as required under Section 134(3) (h) of the Act in Form AOC 2 is not applicable.
The Related Party Transactions Policy as approved by the Board is uploaded on the Company’s website at http://www.alkemlabs.com/admin/PhotosPolicies/15915 Policy%20on%20Related%20Party%20Transactions.pdf.
PARTICULARS OF LOANS/GUARANTEES AND INVESTMENTSThe particulars of loans, guarantees and investments covered under the provisions of Section 186 of the Act have been disclosed in the Notes to the financial statements forming part of the Annual Report.
VIGIL MECHANISM / WHISTLE BLOWER POLICYPursuant to the provisions of Section 177(9) of the Act, the Board of Directors of the Company has framed the Vigil Mechanism / Whistle Blower Policy for Directors and employees of the Company. Under the said policy, provisions have been made to safeguard persons who use this mechanism from victimization. The policy also provides access to the Chairperson of the Audit Committee under certain circumstances. The Whistle Blower Policy is uploaded on the website of the Company at http://www.alkemlabs.com/admin/Photos/Policies/3592Whistle%20Blower%20Policy.pdf.
PREVENTION OF SEXUAL HARASSMENT AT WORKPLACEThe Company has adopted a policy in line with the provisions of Sexual Harassment of Women at Workplace (Prevention, Prohibition and Redressal) Act, 2013 and the Rules thereunder. An Internal Complaints Committee has also been set up to redress complaints received on sexual harassment. During the financial year 2015-16, the Company had received one complaint with allegations of sexual harassment and the same was investigated and resolved.
BUSINESS RISKS AND OPPORTUNITIESIn line with the new regulatory requirements, the Company has formally framed Risk Management Policy to identify and assess the key risk areas, monitor and report compliance and effectiveness of the policy and procedure. A Risk Management
Committee under the Chairmanship of Mr. Dhananjay Kumar Singh, Joint Managing Director, has also been constituted to oversee the risk management process in the Company.
DISCLOSURES UNDER THE ACTChange in Nature of Business, if AnyDuring the financial year 2015-16, there was no change in the nature of business of the Company.
Material Changes and Commitments affecting the financial position of the CompanyThere are no material changes and commitments which have occurred between the end of the financial year and the date of the Report which have affected the financial position of the Company.
Significant and Material OrdersThere are no significant and material orders passed by the regulators or courts or tribunals during the year impacting the going concern status and company’s operations in future.
Reporting of Frauds by AuditorsThere were no frauds reported by auditors as per Section 134 (3)(ca) and Section 143(12) of the Act.
DETAILS ON INTERNAL FINANCIAL CONTROLS RELATED TO FINANCIAL STATEMENTSDuring the year the internal financial controls were reviewed and tested by an outside consulting firm and no reportable material weaknesses in design or operations were observed.
CONVERSATION OF ENERGY, TECHNOLOGY ABSORPTION AND FOREIGN EXCHANGE DETAILSThe information on conservation of energy, technology absorption and foreign earnings and outgo as stipulated under Section 134(3)(m) of the Act and the Rules framed thereunder is annexed herewith as Annexure G to this report.
ACKNOWLEDGEMENTYour Directors are thankful to the Central and State Government Departments, Organizations and Agencies for their continued guidance and co-operation. The Directors are grateful to all valuable stakeholders of the Company viz. our customers, shareholders, dealers, vendors, banks, medical fraternity, patients and other business associates for their excellent support and help rendered during the year. The Directors also place on record their sincere appreciation for the significant contribution made by our employees through their dedication, hard work and unstinted commitment.
For and on behalf of the BoardAlkem Laboratories Limited
Samprada SinghChairman Emeritus
DIN: 00760279Date: 27th May, 2016Place: Mumbai

ANNUAL REPORT 2015-16 53
CO
RP
OR
AT
E O
VE
RV
IEW
FIN
AN
CIA
L STAT
EM
EN
TS
STAT
UTO
RY
RE
PO
RT
S
Directors’ Report
AN
NE
XU
RE
A
FO
RM
AO
C-1
(Pu
rsu
ant
to fi
rst
pro
viso
to
su
b-s
ecti
on
(3) o
f Sec
tio
n 1
29
rea
d w
ith
Ru
le 5
of C
om
pan
ies
(Acc
ou
nts
) Ru
les,
20
14
)
STA
TE
ME
NT
CO
NTA
ININ
G S
ALI
EN
T F
EA
TU
RE
S O
F T
HE
FIN
AN
CIA
L ST
AT
EM
EN
T O
F S
UB
SID
IAR
IES
PAR
T “A
”: S
UB
SID
IAR
IES
` in
Mill
ion
Sr.
No
Nam
e of
Sub
sida
ry
Repo
rtin
g pe
riod
of th
e su
bsid
iary
(if
diff
eren
t fro
m th
e ho
ldin
g co
mpa
ny’s
repo
rtin
g pe
riod)
Repo
rtin
g Cu
rren
cy
Exch
ange
Rat
e as
on
the
last
da
te o
f rel
evan
t Fi
nanc
ial y
ear
Shar
e Ca
pita
lRe
serv
es
& su
rplu
sTo
tal
asse
tsTo
tal
Liab
ilitie
sIn
vest
men
tsTu
rnov
er
Profi
t be
fore
ta
xatio
nPr
ovis
ion
for t
axat
ion
Profi
t aft
er
taxa
tion
Prop
osed
D
ivid
end
% o
f sh
are-
ho
ldin
g
1Ph
arm
acor
Pty
Lim
ited
NA
AU$
50.6
847
88.
1 (5
4.8)
679
.3 6
46.0
- 8
84.2
78.
0 (2
3.4)
101
.4 -
100%
2Ca
chet
Pha
rmac
eutic
als P
rivat
e Li
mite
dN
AIN
RN
A 1
.5 3
56.4
1,5
36.6
1,1
78.7
0.1
3,1
41.6
47.
1 6
.8 4
0.4
-51
%
3As
cend
Lab
orat
orie
s SpA
NA
CLP
0.09
60 0
.1 3
2.3
718
.1 6
85.7
- 4
39.8
31.
9 -
31.
9 -
100%
4En
zene
Bio
scie
nces
Lim
ited
NA
INR
NA
44.
8 1
10.6
763
.2 6
07.8
- -
(286
.0)
- (2
86.0
) -
100%
5Al
kem
Pha
rma
Gm
bHN
AEU
RO74
.822
7 1
.7 (3
.8)
0.2
2.2
- -
(0.5
) -
(0.5
) -
100%
6In
dche
mie
Hea
lth S
peci
aliti
es P
rivat
e Li
mite
dN
AIN
RN
A 2
.5 1
,654
.5 2
,999
.5 1
,342
.5 1
2.7
2,7
57.3
257
.8 6
5.9
191
.9 -
51%
7Th
e Ph
arm
aNet
wor
k LL
PN
ATE
NG
E0.
1911
100
.5 (4
3.6)
112
.9 5
6.0
- 2
01.8
(12.
3) 1
.0 (1
3.3)
-10
0%
8Al
kem
Lab
orat
orie
s Kor
ea In
cN
AW
ON
0.05
75 0
.1 0
.0 0
.1 -
- -
0.0
- 0
.0 -
100%
9As
cend
s Lab
orat
orie
s Sdn
Bhd
NA
RM16
.767
5 0
.0 0
.0 0
.0 (0
.0)
- -
- -
- -
100%
10S
& B
Hol
ding
s B.V
.N
AEU
RO74
.822
7 2
,897
.2 (1
,304
.6)
2,8
73.3
1,2
80.7
2,0
54.3
- 2
0.6
489
.2 (4
68.6
) -
100%
11Al
kem
Lab
orat
orie
s (N
IG) L
imite
dN
AN
AIRA
0.33
02 9
.4 (1
54.5
) 2
4.0
169
.2 -
27.
6 (3
9.9)
- (3
9.9)
-10
0%
12Ph
arm
acor
Lim
ited
NA
KES
0.64
12 0
.1 (0
.0)
0.1
0.0
- -
(0.0
) -
(0.0
) -
100%
13Al
kem
Lab
orat
orie
s Cor
pora
tion
NA
PESO
1.43
34 6
9.3
(156
.1)
131
.6 2
18.3
- 7
9.3
(91.
0) (1
0.6)
(80.
4) -
100%
14S
& B
Pha
rma
Inc.
NA
USD
66.0
989
0.0
153
.8 2
,154
.2 2
,000
.4 -
908
.8 (1
52.5
) -
(152
.5)
-10
0%
15Al
kem
Lab
orat
orie
s (Pt
y) L
imite
dN
ARA
ND
4.39
15 0
.9 (9
.4)
16.
5 2
5.0
- 8
2.3
(4.0
) -
(4.0
) -
100%
16Th
ePha
rmaN
etw
ork
LLC
NA
USD
66.0
989
578
.9 (1
,188
.8)
1,2
76.4
1,8
86.3
703
.1 8
9.9
(445
.1)
- (4
45.1
) -
100%
17As
cend
Lab
orat
orie
s LLC
NA
USD
66.0
989
703
.1 2
,976
.2 4
,545
.3 8
66.1
- 9
,004
.4 1
,798
.9 -
1,7
98.9
-10
0%
18As
cend
Lab
orat
orie
s (U
K) L
imite
dN
AG
BP95
.197
3 9
.9 3
.8 5
0.1
36.
3 -
48.
6 9
.1 1
.9 7
.3 -
100%
Fo
r an
d o
n b
ehal
f of t
he
Bo
ard
of D
irec
tors
of A
lkem
Lab
ora
tori
es L
imit
ed
Sam
pra
da
Sin
ghB
asu
deo
N. S
ingh
Dh
anan
jay
Ku
mar
Sin
ghSa
nd
eep
Sin
ghB
alm
iki P
rasa
d S
ingh
Ch
airm
an E
mer
itu
sE
xecu
tive
Ch
airm
anJo
int
Man
agin
g D
irec
tor
Join
t M
anag
ing
Dir
ecto
rD
irec
tor
DIN
00
76
02
79
DIN
00
76
03
10
DIN
00
73
91
53
DIN
01
27
79
84
DIN
00
73
98
56
Mri
tun
jay
Ku
mar
Sin
ghP
rab
hat
Agr
awal
Raj
esh
Du
bey
Man
ish
Nar
ang
P. V
. Dam
od
aran
Pla
ce: M
um
bai
Dir
ecto
rC
hie
f Exe
cuti
ve O
ffice
rC
hie
f Fin
anci
al O
ffice
rSr
. VP
- L
egal
& C
om
pan
y Se
cret
ary
VP
- B
usi
nes
s F
inaa
nce
Dat
e : 2
7th
May
, 20
16
DIN
00
88
14
12
FC
S 4
36
5

ALKEM LABORATORIES LTD.54
ANNEXURE B
ANNUAL REPORT ON CORPORATE SOCIAL RESPONSIBILITY (CSR) ACTIVITIES[Pursuant to Section 135 of the Companies Act, 2013]
1. Brief outline of the Company’s CSR Policy
Your Company is a deeply committed corporate citizen with its strategies, policies and actions aligned with wider social concerns, through initiatives in areas like education, health and other socially relevant areas. Your Company believes in making a holistic impact on the communities in which it operates.
With an endeavor to achieve the above and to be a socially responsible corporate citizen, your Company has developed a CSR policy wherein it has identified some areas which are in line with its overall social objectives.
The CSR Policy of your Company outlines the framework guiding your Company’s CSR activities. It sets out the CSR Vision Statement, CSR Program Areas & Objectives, Implementation Process, CSR Governance Structure and Monitoring Mechanism.
The CSR Policy has been put up on your Company’s Website and can be accessed through the following link:http://www.alkemlabs.com/admin/Photos/Policies/138254.%20CSR-Policy.pdf
2. Composition of CSR Committee
Name of Director Designation
Mr. Ranjal Laxmana Shenoy Chairman
Mr. Dhananjay Kumar Singh Member
Mr. Balmiki Prasad Singh Member
Mr. Sandeep Singh Member
3. Average net profit of the company for last three financials years: ` 4546.5 million
4. Prescribed CSR Expenditure (two per cent of the amount as in item 3 above): ` 90.9 million
5. Details of CSR spent during the financial year
(a) Total amount to be spent for the financial year: ` 90.9 million
(b) Amount unspent , if any;: ` 60.9 million
(c) Manner in which the amount spent during the financial year is detailed below.
(` in Million)
Sr No
CSR Project or Activity Identified
Sector in which Project is Covered
Projects or Programs (1) Local area or other (2) Specify the state and district where projects or programs was undertaken
Amount outlay (budget) project
or programs wise
Amount spent on the projects or programs
Cumulative expenditure
upto the reporting
period
Amount Spent: Direct or through implementing agency
Direct Over heads
1 Support to
differently abled
children with
hearing disability
Healthcare Mumbai,
Maharashtra
5.2 5.2 - 5.2 Implementing
Agency - I Hear
Foundation
2 Development of
Ladies Hostel
Empowering
women
Hosur, Karnataka 5.0 5.0 - 5.0 Implementing
Agency -
Vivekananda
Yoga
Anusandhana
Samsthana
3 Development
of women
rehabilitation
centre
Empowering
women
Chunar, Mirzapur,
Uttar Pradesh
2.0 2.0 - 2.0 Implementing
Agency - Deva
Foundation
Mission for
Mankind

ANNUAL REPORT 2015-16 55
CO
RP
OR
AT
E O
VE
RV
IEW
FIN
AN
CIA
L STAT
EM
EN
TS
STAT
UTO
RY
RE
PO
RT
S
Directors’ Report
(` in Million)
Sr No
CSR Project or Activity Identified
Sector in which Project is Covered
Projects or Programs (1) Local area or other (2) Specify the state and district where projects or programs was undertaken
Amount outlay (budget) project
or programs wise
Amount spent on the projects or programs
Cumulative expenditure
upto the reporting
period
Amount Spent: Direct or through implementing agency
Direct Over heads
4 Epilepsy
Awareness
Promoting
healthcare
Mumbai,
Maharashtra
0.5 0.5 - 0.5 Implementing
Agency -
Samman
Association
5 IHC Testing for
poor
Promoting
healthcare
Chennai,
Tamil Nadu
3.5 3.5 - 3.5 Implementing
Agency
- Cancer
Institute
(W.I.A.)
6 PAP Smear
Testing
Promoting
healthcare
Dharavi, Mumbai,
Maharashtra
1.3 1.3 - 1.3 Implementing
Agency - Indian
Cancer Society
7 Contribution
for one class
room for Vedic
Education
Education Kharghar,
Navi Mumbai,
Maharashtra
1.0 1.0 - 1.0 Implementing
Agency -
ISKCON
8 Cancer
detection camp
Promoting
healthcare
Jahanabad, Bihar &
Daman
1.5 1.5 - 1.5 Implementing
Agency -
Krishna Cancer
Aid Association
9 Contribution
for mobile
Ambulance
Promoting
healthcare
Jahanabad, Bihar 0.9 0.9 - 0.9 Direct
10 Drinking Water
Facility And
Toilet
Safe Drinking
Water
Raigad,
Maharashtra
0.9 0.8 - 0.8 Direct
11 Plantation And
Green Area
Development
Environmental
Sustainability
MIDC Taloja,
Panvel, Raigad,
Maharashtra
0.4 0.4 - 0.4 Direct
12 Mobile
Ambulance
Preventive
healthcare
MIDC Taloja,
Panvel, Raigad,
Maharashtra
1.5 1.5 - 1.5 Direct
13 Safe Drinking
Water -
Installation
of RO Water
purifier
Safe Drinking
Water
Gram Panchayat of
Naugama,
Teh. Ankleshwar,
Bharuch, Gujarat.
0.6 0.4 - 0.4 Direct
14 Tree Plantation Environmental
Sustainability
Gram Panchayat
of Naugama, Teh.
Ankleshwar,
Bharuch, Gujarat.
0.1 0.1 - 0.1 Direct
15 Renovation Of
School Building
Education Gram Panchayat
of Naugama, Teh.
Ankleshwar,
Bharuch, Gujarat.
0.1 0.1 - 0.1 Direct

ALKEM LABORATORIES LTD.56
(` in Million)
Sr No
CSR Project or Activity Identified
Sector in which Project is Covered
Projects or Programs (1) Local area or other (2) Specify the state and district where projects or programs was undertaken
Amount outlay (budget) project
or programs wise
Amount spent on the projects or programs
Cumulative expenditure
upto the reporting
period
Amount Spent: Direct or through implementing agency
Direct Over heads
16 Health / Medical
Camps
Promoting
healthcare
Gram Panchayat
of Naugama, Teh.
Ankleshwar,
Bharuch, Gujarat
0.1 0.1 - 0.1 Direct
17 Renovation and
repairs of School
Promoting
Education and
healthcare
G.P.S Vill.
Chalanmajra,
Baddi,
District Solan,
Himachal Pradesh.
1.4 1.3 - 1.3 Direct
18 Renovation and
repair of School
Promoting
Education and
healthcare
G.H.S Village
Thana, Baddi,
District Solan,
Himachal Pradesh.
0.8 0.5 - 0.5 Direct
19 Renovation and
repair of School
Promoting
Education and
healthcare
G.S.S Village SAI,
Baddi, District
Solan, Himachal
Pradesh.
0.9 0.9 - 0.9 Direct
20 Installation of
Water ATM
Machines
Safe Drinking
Water
Baddi Bus-stand,
near PWD office,
Nalagarh, District
Solan, Himachal
Pradesh
0.7 0.7 - 0.7 Direct
21 Support to
Primary Health
Centre
Healthcare Upper Mamring,
South Sikkim
0.2 0.2 - 0.2 Direct
22 Renovation of
Kaizaley school
Promoting
education
Kaizaley, South
Sikkim
0.3 0.3 - 0.3 Direct
23 Water supply
connection at
Rangpo Bazar
Junior High
School
Promoting
Education and
Safe Drinking
Water
Rangpo Bazar,
East Sikkim
0.1 0.1 - 0.1 Direct
24 Renovation of
Rangpo Hospital
Promoting
healthcare
Rangpo, East
Sikkim
1.4 1.0 - 1.0 Direct
25 Construction of
Public Toilets
Sanitation Rangpo Bazar,
East Sikkim
1.8 0.3 - 0.3 Direct
26 Cleanliness
drives
Sanitation Kursa Gram Sudhar
Samiti, Kumrek,
Sikkim
0.1 0.1 - 0.1 Direct
27 Mineral Water
Treatment Plant
Safe Drinking
Water
Brahmin Faliya
and Desai Faliya,
Kachigam, Daman
0.2 0.1 - 0.1 Direct
28 Construction of
public Toilet
Sanitation Kanchal Faliya,
Kachigam, Daman
0.3 0.3 - 0.3 Direct
Total 30.1 - 30.1

ANNUAL REPORT 2015-16 57
CO
RP
OR
AT
E O
VE
RV
IEW
FIN
AN
CIA
L STAT
EM
EN
TS
STAT
UTO
RY
RE
PO
RT
S
Directors’ Report
6. In case the company has failed to spend the two per cent of the average net profit of the last three financial years or any part thereof, the company shall provide the reasons for not spending the amount in its Board report.
During the financial year 2015-16, your Company’s main focus area has been to identify suitable projects which benefit the society at large commensurate with the policy and framework developed during the previous year for CSR interventions. During the year, your company has identified increased number of projects within its CSR policy and framework and accordingly has increased its CSR expenditure from the previous year. The projects identified by your Company have medium and long term impact which will be implemented in a structured and streamlined manner in the years ahead with an emphasis on high quality and excellence
The shortfall in CSR funding for the financial year 2015-16 is on account of a considerable time spent on conceptualization, development and identification of
regulatory compliant and sustainable projects, meeting the internal requirements of the company within the focused/identified areas.
Going forward with the policies and framework in place, your Company’s mission would be to strengthen its initiatives in exploring more appropriate CSR models and will endeavor to increase its CSR activities in the coming years.
7. The CSR Committee hereby confirms that the implementation of CSR activities is in compliance with the CSR Objectives and CSR Policy of your Company.
Samprada Singh Ranjal Laxmana ShenoyChairman Emeritus Chairman, CSR Committee
Date: 27th May, 2016Place: Mumbai

ALKEM LABORATORIES LTD.58
Alkem Laboratories Limited (“Company”) has constituted a Nomination and Remuneration Committee (“Committee”) in its Board meeting held on 30th January, 2015 as per the terms and conditions provided in Section 178 of the Companies Act, 2013 and other applicable provisions. As per the provisions, the Company is required to frame a policy on nomination and remuneration of Directors, Key Managerial Personnel (KMP), Senior Management and other employees of the Company.
1. Objective of the Policy The policy is framed with the objective(s) 1. That based on the Company’s size and financial
position and trends and practices on remuneration prevailing in peer companies in the Industry, the level and composition of remuneration is reasonable and sufficient to attract, retain and motivate directors and talented managerial personnel of the quality required to run the Company successfully and to ensure long term sustainability and create competitive advantage.
2. That the remuneration to Directors, Key Managerial Personnel (KMP) and other employees of the Company involves a balance between fixed and incentive pay reflecting short and long-term performance objectives appropriate to the working of the Company and its goals.
2. Functions of the Nomination and Remuneration Committee
The Nomination and Remuneration Committee shall, inter-alia, perform the following functions:
1. Identify persons who are qualified to become Directors and employees who may be appointed in key managerial position, senior management in accordance with the criteria laid down, recommend to the Board their appointment, remuneration and removal, including succession planning.
2. Ensure that the Board comprises of a balanced combination of Executive Directors and Non-Executive Directors and also the Independent Directors, including Board diversity.
3. Devise framework to ensure that Directors are inducted through suitable familiarization process alongwith criteria for evaluation of Independent Directors and the Board and to provide for reward(s) linked directly to their effort, performance.
ANNEXURE C
POLICY FOR NOMINATION & REMUNERATION COMMITTEE OF ALKEM LABORATORIES LIMITED
4. Decide / approve details of fixed components and performance linked incentives along with the performance criteria.
5. Such other functions as may be decided in accordance with the Companies Act, 2013 and the SEBI (Listing Obligations and Disclosure Requirements) Regulations, 2015 as amended from time to time.
The Chairman of the Nomination and Remuneration committee could be present at the Annual General Meeting, to answer the shareholders’ queries. However, it would be up to the Chairman to decide who should answer the queries.
3. Applicability This Policy is applicable to: 1. Directors viz. Executive, Non-Executive and
Independent 2. Key Managerial Personnel (“KMP”) 3. Senior Management Personnel 4. Other Employees of the Company
4. Matters relating to the remuneration, perquisites for the Whole-time /Executive / Managing Director
1. The remuneration / compensation / profit-linked commission etc. to the Whole-time /Executive/Managing Directors will be recommended by the Committee and approved by the Board. The remuneration / compensation / profit-linked commission etc. shall be in accordance with the percentage / slabs / conditions laid in the Companies Act, 2013 and shall be subject to the prior / post approval of the shareholders of the Company and Central Government, wherever required.
2. If in any financial year, the Company has no profits or its profits are inadequate, the Company shall pay remuneration to its Whole Time Director(s) in accordance with the provisions of Schedule V of the Companies Act, 2013 and if it is not able to comply with such provisions, then with the prior approval of the Central Government.
3. Increments to the Whole Time Director(s) should be within the slabs approved by the shareholders. Increments will be effective 1st April in respect of a Whole Time Director as well as in respect of other employees of the Company, unless otherwise decided.
ANNUAL REPORT 2015-16 59
CO
RP
OR
AT
E O
VE
RV
IEW
FIN
AN
CIA
L STAT
EM
EN
TS
STAT
UTO
RY
RE
PO
RT
S
Directors’ Report
5. Removal The Committee may recommend, to the Board with
reasons recorded in writing, removal of a Director, KMP or one level below KMP subject to the provisions of the Companies Act, 2013, and all other applicable Acts, Rules and Regulations, if any.
6. Retirement The Director, KMP and one level below the KMP
shall retire as per the applicable provisions of the Regulations and the prevailing policy of the Company. Employment of the services of the Director, KMP, Senior Management Personnel as consultants after their retirement would be at the sole discretion of the Board.
7. Remuneration to Non-Executive / Independent Director
7.1. Sitting Fees The Resident Non-Executive Independent Directors
of the Company shall be paid sitting fees as per the applicable Regulations and no sitting fee is to be paid to Non-resident Non-Executive Directors. The quantum of sitting fees will be determined as per the recommendation of the Nomination and Remuneration Committee and approved by the Board of Directors of the Company.
7.2. Profit-linked Commission The profit-linked Commission shall be paid within the
monetary limit approved by the shareholders of the Company subject to the same not exceeding 2% of the net profits of the Company computed as per the applicable provisions of the Regulations.
7.3. Stock Options An Independent Director shall not be entitled to any
stock option of the Company.
8. Remuneration to KMP, Senior Management Personnel and Other Employees
The KMP, Senior Management Personnel and other employees of the Company shall be paid monthly remuneration as per the Company’s HR policies and / or as may approved by the Committee. The break-up of the pay scale and quantum of perquisites including, employer’s contribution to PF, pension scheme, medical expenses, club fees etc. shall be as per the Company’s HR policies.
The Chief Executive Officer of the Company will make organisation-wide annual presentation(s) before the Committee which would have requisite details setting out the proposed performance bonus payouts for the current financial year as well as the proposed increments for the next financial year. The Committee shall peruse and approve the same unless required under relevant regulations, to refer the same to the Board of Directors and / or Shareholders of the Company.
If the remuneration of KMPs or any other officer is to be specifically approved by the Committee and / or the Board of Directors under any Regulations, then such approval will be accordingly sought.
This Remuneration Policy shall apply to all future / continuing employment / engagement(s) with the Company. In other respects, the Remuneration Policy shall be of guidance for the Board. Any departure from the policy shall be recorded and reasoned in the Committee and Board meeting minutes. The Company reserves its right to amend or modify this Policy in whole or in part, at any time without assigning any reason whatsoever.
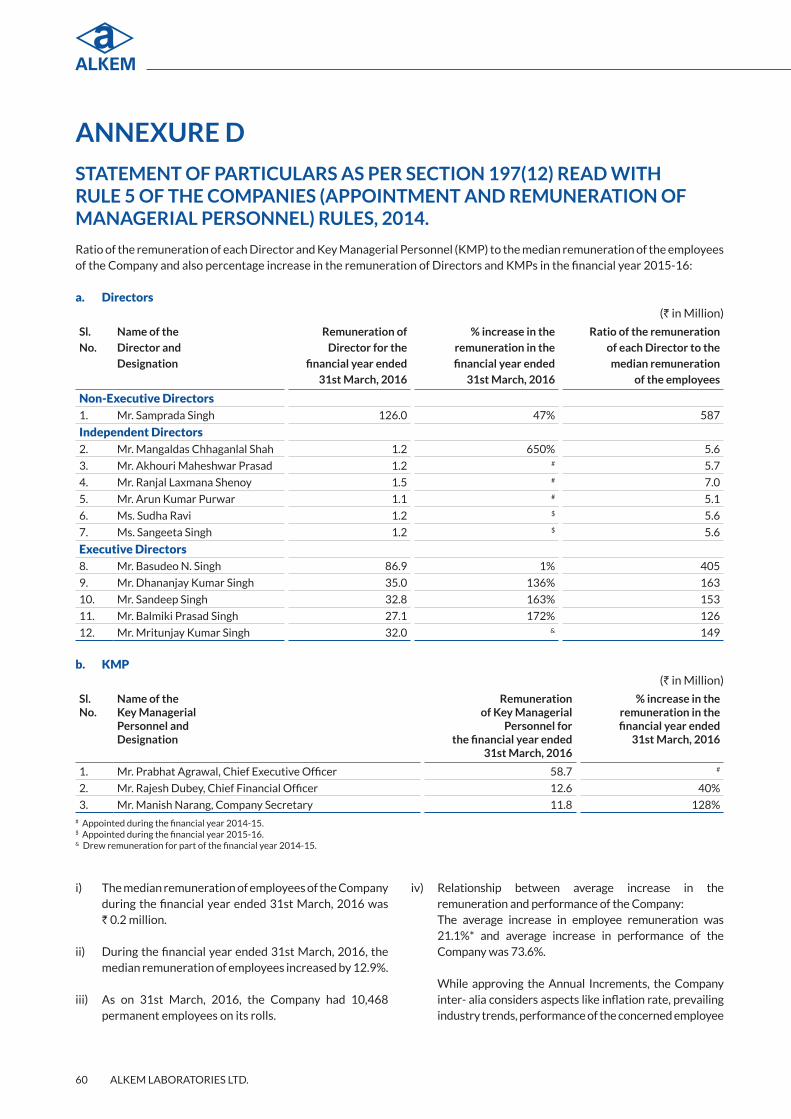
ALKEM LABORATORIES LTD.60
ANNEXURE D
STATEMENT OF PARTICULARS AS PER SECTION 197(12) READ WITH RULE 5 OF THE COMPANIES (APPOINTMENT AND REMUNERATION OF MANAGERIAL PERSONNEL) RULES, 2014.
Ratio of the remuneration of each Director and Key Managerial Personnel (KMP) to the median remuneration of the employees of the Company and also percentage increase in the remuneration of Directors and KMPs in the financial year 2015-16:
a. Directors (` in Million)
Sl.
No.
Name of the
Director and
Designation
Remuneration of
Director for the
financial year ended
31st March, 2016
% increase in the
remuneration in the
financial year ended
31st March, 2016
Ratio of the remuneration
of each Director to the
median remuneration
of the employees
Non-Executive Directors1. Mr. Samprada Singh 126.0 47% 587
Independent Directors2. Mr. Mangaldas Chhaganlal Shah 1.2 650% 5.6
3. Mr. Akhouri Maheshwar Prasad 1.2 # 5.7
4. Mr. Ranjal Laxmana Shenoy 1.5 # 7.0
5. Mr. Arun Kumar Purwar 1.1 # 5.1
6. Ms. Sudha Ravi 1.2 $ 5.6
7. Ms. Sangeeta Singh 1.2 $ 5.6
Executive Directors8. Mr. Basudeo N. Singh 86.9 1% 405
9. Mr. Dhananjay Kumar Singh 35.0 136% 163
10. Mr. Sandeep Singh 32.8 163% 153
11. Mr. Balmiki Prasad Singh 27.1 172% 126
12. Mr. Mritunjay Kumar Singh 32.0 & 149
b. KMP(` in Million)
Sl.No.
Name of theKey ManagerialPersonnel andDesignation
Remunerationof Key Managerial
Personnel for the financial year ended
31st March, 2016
% increase in theremuneration in the financial year ended
31st March, 2016
1. Mr. Prabhat Agrawal, Chief Executive Officer 58.7 #
2. Mr. Rajesh Dubey, Chief Financial Officer 12.6 40%
3. Mr. Manish Narang, Company Secretary 11.8 128%# Appointed during the financial year 2014-15.$ Appointed during the financial year 2015-16.& Drew remuneration for part of the financial year 2014-15.
i) The median remuneration of employees of the Company during the financial year ended 31st March, 2016 was ` 0.2 million.
ii) During the financial year ended 31st March, 2016, the median remuneration of employees increased by 12.9%.
iii) As on 31st March, 2016, the Company had 10,468 permanent employees on its rolls.
iv) Relationship between average increase in the remuneration and performance of the Company:
The average increase in employee remuneration was 21.1%* and average increase in performance of the Company was 73.6%.
While approving the Annual Increments, the Company inter- alia considers aspects like inflation rate, prevailing industry trends, performance of the concerned employee

ANNUAL REPORT 2015-16 61
CO
RP
OR
AT
E O
VE
RV
IEW
FIN
AN
CIA
L STAT
EM
EN
TS
STAT
UTO
RY
RE
PO
RT
S
Directors’ Report
and that of the Company as against the defined targets. Profit After Tax (PAT) for the financial year ended 31st March, 2016 increased by 73.6% and the median remuneration by 12.9%.
*excluding directors remuneration
v) Comparison of remuneration of the KMPs against the performance of the Company:
While PAT rose by 73.6% from ` 3676.9 million in financial year 2014-15 to ` 6384.4 million in financial year 2015-16, the total remuneration of KMPs rose 71.7%@ from Rs. 14.2 million@ in financial year 2014-15 to Rs. 24.4 million@ in financial year 2015-16.
@ - Mr. Prabhat Agrawal, CEO, was appointed during the financial year 2014-15 and hence the total remuneration and percentage increase in the total remuneration of KMPs does not include his remuneration.
vi) Variations in the market capitalisation of the Company, price earnings ratio as at the closing date of the current financial year and previous financial year:
Sr.
No.
Particulars As at 31st March, 2016
As at
31st March,
2015
1
Market
Capitalisation
BSE - 163,385.57
MillionN.A.
NSE - 162,183.94
MillionN.A.
2 Price Earnings
Ratio
BSE – 24.27# N.A.
NSE – 24.09# N.A.
# based on Consolidated Earning per Share
Percentage increase over decrease in the market quotations of the shares of the Company in comparison to the rate at which the Company came out with the last public offer:
Market price as on 31st March, 2016 ` 1366.5 *
Price at which public issue was made in
December 2015
` 1050
% increase of the Market price over the price
at which public issue was made
30.1%
* Closing price of ordinary shares at BSE Ltd. has been used for the above table.
The Company came with an Initial Public Offer in December, 2015 at the price of ` 1,050 per equity share of ` 2/- each. As on 31st March, 2016, the closing price of the Company’s share of ` 2/- each was
` 1366.5 on BSE Limited and ` 1356.5 on The National Stock Exchange of India Limited.
vii) During the financial year 2015-16, there was an average 21.2% increase in the salaries of employees other than the KMP. Remuneration of the KMPs rose by 71.7%@
which was in line with prevailing industry benchmark and trends, the volume of the Company’s business and profits earned by it and the substantial responsibilities that the KMPs shoulder in the Company. During the financial year 2015-16, the KMPs were also paid one time IPO bonus as an incentive to reward the KMPs for the successful IPO of the Company.
@ - Mr. Prabhat Agrawal, CEO, was appointed during the financial year 2014-15 and hence the percentage increase in the total remuneration of KMPs does not include his remuneration.
viii) The key parameters for any variable component of remuneration availed by the Directors:
During the financial year 2015-16, Mr. Samprada Singh, Chairman Emeritus and Non-Executive Director was entitled commission based on the profits of the Company and his performance as per the terms of his appointment and in accordance with the provisions of Section 197 and Section 198 of the Companies Act, 2013. No other Director was entitled to variable pay during the year.
ix) During the financial year ended 31st March, 2016, there was no employee, who is not a director of the Company and received remuneration in excess of the highest paid director of the Company.
x) We affirm that the remuneration paid is as per the Remuneration policy of the Company.
For and on behalf of the BoardAlkem Laboratories Limited
Samprada SinghChairman Emeritus
DIN: 00760279
Date: 27th May, 2016Place: Mumbai

ALKEM LABORATORIES LTD.62
To,
The Members,Alkem Laboratories LimitedMumbai
We have conducted the secretarial audit of the compliance of applicable statutory provisions and the adherence to good corporate practices by Alkem Laboratories Limited (CIN: U00305MH1973PLC174201) and having its registered office at Alkem House, Senapati Bapat Marg, Lower Parel, Mumbai - 400013 (hereinafter called ‘the Company’). Secretarial Audit was conducted in a manner that provided us a reasonable basis for evaluating the corporate conducts/ statutory compliances and expressing our opinion thereon.
Based on our verification of the company’s books, papers, minute books, forms and returns filed and other records maintained by the company and also the information provided by the Company, its officers, agents and authorized representatives during the conduct of secretarial audit, We hereby report that in our opinion, the company has, during the audit period covering the financial year ended on 31st March, 2016 complied with the statutory provisions listed hereunder and also that the Company has proper Board-processes and compliance-mechanism in place to the extent, in the manner and subject to the reporting made hereinafter:
We have examined the books, papers, minute books, forms and returns filed and other records maintained by the Company for the financial year ended on 31st March 2016 according to the provisions of:
(i) The Companies Act, 2013 (the Act) and the rules made thereunder;
(ii) The Securities Contracts (Regulation) Act, 1956 (‘SCRA’) and the rules made thereunder;
(iii) The Depositories Act, 1996 and the Regulations and Bye-laws framed thereunder;
(iv) Foreign Exchange Management Act, 1999 and the rules and regulations made thereunder to the extent of Foreign Direct Investment, Overseas Direct Investment and External Commercial Borrowings;
ANNEXURE E
SECRETARIAL AUDIT REPORT FOR THE FINANCIAL YEAR ENDED 31ST MARCH 2016[Pursuant to Section 204(1) of the Companies Act, 2013 and Rule 9 of the Companies (Appointment and Remuneration of Managerial Personnel) Rules, 2014]
(v) The following Regulations and Guidelines prescribed under the Securities and Exchange Board of India Act, 1992 (‘SEBI Act’):
(a) The Securities and Exchange Board of India (Substantial Acquisition of Shares and Takeovers) Regulations, 2011;
(b) The Securities and Exchange Board of India (Prohibition of Insider Trading) Regulations, 1992 (effective up to 14th May 2015) and The Securities and Exchange Board of India (Prohibition of Insider Trading) Regulations, 2015 (effective from 15th May 2015);
(c) The Securities and Exchange Board of India (Issue of Capital and Disclosure Requirements) Regulations, 2009;
(d) Securities and Exchange Board of India (Share Based Employee Benefits) Regulations, 2014 (Not applicable to the company during the audit period);
(e) The Securities and Exchange Board of India (Issue and Listing of Debt Securities) Regulations, 2008 (Not applicable to the company during the audit period);
(f) The Securities and Exchange Board of India (Registrars to an Issue and Share Transfer Agents) Regulations, 1993 regarding the Companies Act and dealing with client; (applicable to the company from 23rd December 2015 onwards);
(g) The Securities and Exchange Board of India (Delisting of Equity Shares) Regulations, 2009 (Not applicable to the company during the audit period);
(h) The Securities and Exchange Board of India (Buyback of Securities) Regulations, 1998 (Not applicable to the company during the audit period); and
(i) The Securities and Exchange Board of India (Listing Obligations and Disclosure Requirements) Regulations, 2015 effective from 1st December, 2015 (applicable to the company from 23rd December 2015 onwards);
(vi) Drugs & Cosmetics Act, 1940; Food Safety & Standards Act, 2006; Drugs and Magic Remedies (Objectionable Advertisements) Act, 1954 including the rules and regulations made under these Acts; and Drugs
ANNUAL REPORT 2015-16 63
CO
RP
OR
AT
E O
VE
RV
IEW
FIN
AN
CIA
L STAT
EM
EN
TS
STAT
UTO
RY
RE
PO
RT
S
Directors’ Report
(Prices Control) Order, 2013 issued under Essential Commodities Act, 1955 being laws that are specifically applicable to the Company based on their sector/industry.
We have also examined compliance with the applicable clauses of the following:
(i) Secretarial Standards issued by The Institute of Company Secretaries of India (effective from 1st July, 2015);
(ii) The Listing Agreements entered into by the Company. (Not applicable to the company during the audit period).
During the period under review the Company has complied with the provisions of the Act, Rules, Regulations, Standards etc. mentioned above and in respect of laws specifically applicable to the company based on their sector/industry, in so far as requirement relating to licencing, submission of returns etc. based on test checking.
We further report that The Board of Directors of the Company is duly
constituted with proper balance of Executive Directors, Non-Executive Directors and Independent Directors. The changes in the composition of the Board of Directors that took place during the period under review were carried out in compliance with the provisions of the Act.
Adequate notice is given to all directors to schedule the Board Meetings, agenda and detailed notes on agenda were sent at least seven days in advance, and a system exists for seeking and obtaining further information and clarifications on the agenda items before the meeting and for meaningful participation at the meeting.
Majority decision is carried through while the dissenting members’ views are captured and recorded as part of the minutes.
We further report that there are adequate systems and processes in the company commensurate with the size and operations of the company to monitor and ensure compliance with applicable laws, rules, regulations and standards.
We further report that during the audit period: 1. the company adopted a new set of Articles of
Association in line with the provisions of the Companies Act, 2013 with the approval of the Members by way of Special Resolution passed at the 41st Annual General Meeting held on July 13, 2015;
2. the company made an Initial Public Offering (IPO) by way of an Offer for Sale by selling shareholders of 1,28,53,442 (including Anchor Portion of 37,66,358) equity shares of ` 2/- each, vide Prospectus dated 15th December 2015, for cash at a price of ` 1050/- per share;
3. pursuant to the IPO as aforesaid, 11,95,65,000 equity shares of ` 2/- each of the company were listed at BSE Ltd. and National Stock Exchange of India Ltd. on 23rd December 2015;
4. the Board of Directors of the company at their meeting held on 28th September, 2015, declared an interim dividend of ` 3/- per share subject to dividend distribution tax in respect of 11,95,65,000 equity shares of face value of ` 2/- each for the financial year 2015-16; and
5. the Board of Directors of the company at their meeting held on 9th March 2016, declared second interim dividend of ` 9.70 per share subject to dividend distribution tax in respect of 11,95,65,000 equity shares of face value of ` 2/- each for the financial year 2015-16.
This report is to be read with our letter of even date which is annexed as Annexure-A and forms an integral part of this report.
For Manish Ghia & Associates Company Secretaries
Manish L. GhiaPartner
M. No. FCS 6252 C.P. No. 3531
Date: 27th May 2016Place: Mumbai

ALKEM LABORATORIES LTD.64
To,
The Members,Alkem Laboratories LimitedMumbai
Our report of even date is to be read along with this letter.
1. Maintenance of secretarial record is the responsibility of the management of the Company. Our responsibility is to express an opinion on these secretarial records based on our audit.
2. We have followed the audit practices and processes as were appropriate to obtain reasonable assurance about the correctness of the contents of the Secretarial records. The verification was done on test basis to ensure that correct facts are reflected in secretarial records. We believe that the processes and practices, we followed provided a reasonable basis for our opinion.
3. We have not verified the correctness and appropriateness of financial records and Book of Accounts of the Company.
4. Wherever required, we have obtained the Management representation about the compliance of laws, rules and regulations and happening of events etc.
5. The compliance of the provisions of Corporate and other applicable laws, rules, regulation, standards is the responsibility of management. Our examination was limited to the verification of procedures on the test basis.
6. The Secretarial Audit Report is neither an assurance as to the future viability of the Company nor of the efficiency or effectiveness with which the management has conducted the affairs of the Company.
For Manish Ghia & Associates Company Secretaries
Manish L. GhiaPartner
M. No. FCS 6252 C.P. No. 3531
Date: 27th May 2016Place: Mumbai
‘ANNEXURE A’ OF THE SECRETARIAL AUDIT REPORT

ANNUAL REPORT 2015-16 65
CO
RP
OR
AT
E O
VE
RV
IEW
FIN
AN
CIA
L STAT
EM
EN
TS
STAT
UTO
RY
RE
PO
RT
S
Directors’ Report
I REGISTRATION & OTHER DETAILSi CIN U00305MH1973PLC174201
ii Registration Date 8th August, 1973
iii Name of the Company Alkem Laboratories Limited
iv Category/Sub-category of the Company Company Limited by Shares/ Non-Govt Company
v Address of the Registered office
& contact details
Alkem House, Senapati Bapat Marg, Lower Parel,
Mumbai 400 013 Contact Details - 022 3982 9999
vi Whether listed company Yes
vii Name , Address & contact details of the Registrar &
Transfer Agent, if any.
Link Intime India Pvt. Ltd.
Add: C-13, Pannalal Silk Mills Compound, LBS Marg, Bhandup
West, Mumbai 400 078.
Contact Details: 022 2594 6970
II PRINCIPAL BUSINESS ACTIVITIES OF THE COMPANY All the business activities contributing 10% or more of the total turnover of the company shall be stated
Sl.
No.
Name & Description of main products/services NIC Code of the Product /service
% to total turnover
of the company
1 Pharmaceutical 99611730 97.3%
III PARTICULARS OF HOLDING, SUBSIDIARY & ASSOCIATE COMPANIESSl.
No.
Name & Address of the Company CIN/GLN/LLPIN Holding/Subsidiary/Associate
% of
Shares held
Applicable
Section
1 Enzene Biosciences Limited
Add: No.101, III Phase, Peenya Industrial Area,
Bangalore, Karnataka-560058
U24232KA2006PLC040295 Subsidiary 100% 2(87)
2 Cachet Pharmaceuticals Private Limited
Add: Exhibition Road, P.S- Gandhi Maidan ,
Patna, Bihar - 800001
U24230BR1978PTC001328 Subsidiary 51% 2(87)
3 Indchemie Health Specialities Private Limited
Add: 510-517 Shah & Nahar Industrial Estate
Dr. E Moses Road, Worli, Mumbai -400 018
U24230MH1986PTC039692 Subsidiary 51% 2(87)
4 Alkem Laboratories (NIG) Limited
Add:14A, Tinubu Road, Lagos, Nigeria.
N.A. Subsidiary 100% 2(87)
5 Alkem Laboratories (Pty) Ltd
Add: Route 21, Corporate Park, 33 Sovereign
Drive, Irene Ext.31, Gauteng 0157 South Africa
N.A. Subsidiary 100% 2(87)
ANNEXURE F
FORM NO. MGT 9 EXTRACT OF ANNUAL RETURNas on financial year ended on 31st March, 2016Pursuant to Section 92(3) of the Companies Act, 2013 and Rule 12(1) of the Companies (Management & Administration ) Rules, 2014.

ALKEM LABORATORIES LTD.66
Sl.
No.
Name & Address of the Company CIN/GLN/LLPIN Holding/Subsidiary/Associate
% of
Shares held
Applicable
Section
6 Alkem Laboratories Corporation
Add: 5th Floor, 135 Dela Rosa Street corner
Legaspi Street, Legaspi Village, Makati City,
Phillipines
N.A. Subsidiary 100% 2(87)
7 Alkem Pharma GmbH
Add: Gutenbergstraße 13, 24941 Flensburg,
Germany
N.A. Subsidiary 100% 2(87)
8 S & B Holdings B V
Add: Naritaweg 165, Teletone 8,
1043 BW Amsterdam, Netherlands
N.A. Subsidiary 100% 2(87)
9 Pharmacor Pty Limited
Add: Suite 1, 307-317 Condamine St,
Manly Vale, NSW 2093, Australia
N.A. Subsidiary 100% 2(87)
10 ThePharmaNetwork LLC
Add: 180 Summit Avenue, Suit 200, Montvale,
NJ 07645, USA
N.A. Step down
Subsidiary
100% 2(87)
11 Ascend Laboratories Sdn Bhd
Add: RDL Corporate Services Sdn Bhd,
16th Floor, Wisma Sime Darby, Jalan Raja Laut,
50350 Kuala Lumpur, Malaysia
N.A. Subsidiary 100% 2(87)
12 Ascend Laboratories SpA
Add: avda. Andres Bello, Las Condes,
City of Santiago, Chile
N.A. Subsidiary 100% 2(87)
13 Pharmacor Limited
Add: Twiga Towers, Third Fl,
P O Box 27859 00100,
Nairobi, Republic of Kenya
N.A. Subsidiary 100% 2(87)
14 The PharmaNetwork LLP
Add: 404/67/9 House, Seyfullin ave.,
Corner of Mametova str., Almalinskiy district,
Almaty, 050004, Republic of Kazakhstan
N.A. Subsidiary 100% 2(87)
15 Alkem Laboratories Korea ,Inc
Add: 6, Gaepo-ro 26-gil, Gangnam-gu, Seoul,
South Korea
N.A. Subsidiary 100% 2(87)
16 S&B Pharma Inc, Delaware US
Add: 405 South Motor Avenue, Azusa,
California 91702, U.S.A.
N.A. Subsidiary 100% 2(87)
17 Ascend Laboratories (UK) Ltd
Add: 5th Floor, 89 New Bond Street,
London WS1 1DA, United Kingdom
N.A. Subsidiary 100% 2(87)
18 Ascend Laboratories LLC 180 Summit Avenue,
Suite 200, Montvale, New Jersey 07645, USA
N.A. Step down
Subsidiary
100% 2(87)

ANNUAL REPORT 2015-16 67
CO
RP
OR
AT
E O
VE
RV
IEW
FIN
AN
CIA
L STAT
EM
EN
TS
STAT
UTO
RY
RE
PO
RT
S
Directors’ Report
IV (I) SHAREHOLDING PATTERN (EQUITY SHARE CAPITAL BREAK UP AS % TO TOTAL EQUITY)
Category of Shareholders
No. of Shares held at the beginning of the year
No. of Shares held at the end of the year % change
during the year
Demat Physical Total % of Total
Shares
Demat Physical Total % of Total
Shares
A. Promoters*
(1) Indian
a) Individual/HUF 0 84730100 84730100 70.87 79845665 0 79845665 66.78 -4.09
b) Central Govt. or State Govt.
0 0 0 0 0 0 0 0 0.00
c) Bodies Corporates 0 0 0 0 0 0 0 0 0.00
d) Bank/FI 0 0 0 0 0 0 0 0 0.00
e) Any other 0 0 0 0 0 0 0 0 0.00
Sub Total:(A) (1) 0 84730100 84730100 70.87 79845665 0 79845665 66.78 -4.09
(2) Foreign
a) NRI- Individuals 0 0 0 0 0 0 0 0 0.00
b) Other Individuals 0 0 0 0 0 0 0 0 0.00
c) Bodies Corporates 0 0 0 0 0 0 0 0 0.00
d) Banks/FI 0 0 0 0 0 0 0 0 0.00
e) Any other 0 0 0 0 0 0 0 0 0.00
Sub Total (A) (2) 0 0 0 0 0 0 0 0 0.00
Total Shareholding of Promoter (A)= (A)(1)+(A)(2)
0 84730100 84730100 70.87 79845665 0 79845665 66.78 -4.09
B. Public Shareholding
(1) Institutions
a) Mutual Funds 0 0 0 0 3827398 0 3827398 3.20 3.20
b) Banks/FI 0 0 0 0 21446 0 21446 0.02 0.02
c) Central Government 0 0 0 0 0 0 0 0 0.00
d) State Government 0 0 0 0 0 0 0 0 0.00
e) Venture Capital Fund 0 0 0 0 0 0 0 0 0.00
f) Insurance Companies 0 0 0 0 0 0 0 0 0.00
g) FIIs 0 0 0 0 0 0 0 0 0.00
h) Foreign Venture Capital Funds
0 0 0 0 0 0 0 0 0.00
i) Others (specify)
Foreign Portfolio Investor 0 0 0 0 4294415 0 4294415 3.59 3.59
Sub Total (B)(1): 0 0 0 0 8143259 0 8143259 6.81 6.81
(2) Non Institutions
a) Bodies corporates
i) Indian 0 0 0 0 1564841 0 1564841 1.31 1.31
ii) Overseas 0 0 0 0 0 0 0 0 0.00
b) Individuals
i) Individual shareholders holding nominal share capital upto Rs.1 lakh
0 0 0 0 27452468 0 27452468 22.96 22.96
ii) Individuals shareholders holding nominal share capital in excess of ` 1 lakh
0 34834900 34834900 29.13 2260786 6 2260792 1.89 -27.24
c) Others (specify)
Trusts 0 0 0 0 5137 0 5137 0.00 0.00
Foreign Nationals 0 0 0 0 144 0 144 0.00 0.00
Hindu Undivided Family 0 0 0 0 183346 0 183346 0.15 0.15
Non Resident Indians (Non Repat)
0 0 0 0 18479 0 18479 0.02 0.02

ALKEM LABORATORIES LTD.68
Category of Shareholders
No. of Shares held at the beginning of the year
No. of Shares held at the end of the year % change
during the year
Demat Physical Total % of Total
Shares
Demat Physical Total % of Total
Shares
Non Resident Indians (Repat) 0 0 0 0 29035 0 29035 0.02 0.02
Clearing Members 0 0 0 0 61834 0 61834 0.05 0.05
Sub Total (B)(2): 0 34834900 34834900 29.13 31576070 6 31576076 26.41 -2.72
Total Public Shareholding (B)= (B)(1)+(B)(2)
0 34834900 34834900 29.13 39719329 6 39719335 33.22 4.09
C. Shares held by Custodian for GDRs & ADRs
0 0 0 0 0 0 0 0 0.00
Grand Total (A+B+C) 0 119565000 119565000 100.00 119564994 6 119565000 100.00 0.00
* Promoter includes promoter group
(ii) Shareholding of Promoters
Sl No.
Shareholders Name
Shareholding at thebegginning of the year
Shareholding at theend of the year % change
in share holding
during the year
No. of shares % of total shares of the
company
% of shares pledged
encumbered to total shares
No. of shares % of total shares of the
company
% of shares pledged
encumbered to total shares
1 Samprada Singh 4992520 4.18 - 4992520 4.18 - 0.00
2 Samprada Singh HUF 150800 0.13 - 150800 0.13 - 0.00
3 Balmiki Prasad Singh 6215760 5.20 - 6257355 5.23 - 0.03
4 Manju Singh 1324600 1.11 - 1324600 1.11 - 0.00
5 Sarandhar Singh 1744000 1.46 - 1812000 1.52 - 0.06
6 Srinivas Singh 1744000 1.46 - 1812000 1.52 - 0.06
7 Satish Kumar Singh 3382760 2.83 - 3395704 2.84 - 0.01
8 Prem Lata Singh 1012200 0.85 - 1012200 0.85 - 0.00
9 Sarvesh Singh 1591600 1.33 - 1659600 1.39 - 0.06
10 Annapurna Singh 1591600 1.33 - 1591600 1.33 - 0.00
11 Sandeep Singh 1591600 1.33 - 1652867 1.38 - 0.05
12 Inderjit Arora 1591600 1.33 - 1599400 1.34 - 0.01
13 Basudeo N Singh 9528600 7.97 - 8405950 7.03 - -0.94
14 Rekha Singh 4654800 3.89 - 3459150 2.89 - -1.00
15 Dhananjay Kumar Singh 5698260 4.77 - 5766260 4.82 - 0.06
16 Madhurima Singh 2904240 2.43 - 2974159 2.49 - 0.06
17 Divya Singh 1195650 1.00 - 1195650 1.00 - 0.00
18 Aniruddha Singh 1195650 1.00 - 1195650 1.00 - 0.00
19 Mritunjay Kumar Singh 5698260 4.77 - 5776760 4.83 - 0.07
20 Seema Singh 2904240 2.43 - 2937740 2.46 - 0.03
21 Meghna Singh 1195650 1.00 - 1197650 1.00 - 0.00
22 Shrey Shreeanant Singh 1195650 1.00 - 1195650 1.00 - 0.00
23 Archana Singh 1198400 1.00 - 2394050 2.00 - 1.00
Total 64302440 53.78 - 63759315 53.33 - -0.45

ANNUAL REPORT 2015-16 69
CO
RP
OR
AT
E O
VE
RV
IEW
FIN
AN
CIA
L STAT
EM
EN
TS
STAT
UTO
RY
RE
PO
RT
S
Directors’ Report
(iii) Change In Promoters’ ShareholdingSr. No.
Shareholders Name Shareholding Date Increase/ (Decrease) in Shareholding
Reason Cumulative Shareholding during the year
For Each of the Shareholders
No. of Shares at the beginning
of the year (01.04.2015)
% of total Shares of the
Company
No. of Shares % of Shares of the
Company
1 Samprada Singh 4992520 4.18 01.04.2015
- - -
31.03.2016 - - 4992520 4.18
2 Basudeo N. Singh 9528600 7.97 01.04.2015
24.07.2015 -1195650 Transfer to Ms. Archana Singh
8332950 6.97
28.03.2016 29000 Market Purchase 8361950 6.99
29.03.2016 44000 Market Purchase 8405950 7.03
31.03.2016 - - 8405950 7.03
3 Balmiki Prasad Singh 6215760 5.20 01.04.2015
18.03.2016 41595 Market Purchase 6257355 5.23
31.03.2016 - - 6257355 5.23
4 Dhananjay Kumar Singh
5698260 4.77 01.04.2015
24.12.2015 68000 Market Purchase 5766260 4.82
31.03.2016 - - 5766260 4.82
5 Mritunjay Kumar Singh
5698260 4.77 01.04.2015
24.12.2015 1550 Market Purchase 5699810 4.77
28.12.2015 73450 Market Purchase 5773260 4.83
29.12.2015 1000 Market Purchase 5774260 4.83
22.02.2016 1500 Market Purchase 5775760 4.83
24.02.2016 498 Market Purchase 5776258 4.83
25.02.2016 2 Market Purchase 5776260 4.83
26.02.2016 500 Market Purchase 5776760 4.83
31.03.2016 - - 5776760 4.83
6 Sandeep Singh 1591600 1.33 01.04.2015
24.12.2015 61267 Market Purchase 1652867 1.38
31.03.2016 - - 1652867 1.38
7 Samprada Singh HUF 150800 0.13 01.04.2015
- - -
31.03.2016 - - 150800 0.13
8 Manju Singh 1324600 1.11 01.04.2015
- - -
31.03.2016 - - 1324600 1.11
9 Sarandhar Singh 1744000 1.46 01.04.2015
24.12.2015 68000 Market Purchase 1812000 1.52
31.03.2016 - - 1812000 1.52
10 Srinivas Singh 1744000 1.46 01.04.2015
24.12.2015 68000 Market Purchase 1812000 1.52
31.03.2016 - - 1812000 1.52
11 Satish Kumar Singh 3382760 2.83 01.04.2015
28.12.2015 12944 Market Purchase 3395704 2.84
31.03.2016 - - 3395704 2.84
12 Premlata Singh 1012200 0.85 01.04.2015
- - -
31.03.2016 - - 1012200 0.85
13 Sarvesh Singh 1591600 1.33 01.04.2015
24.12.2015 68000 Market Purchase 1659600 1.39
31.03.2016 - - 1659600 1.39

ALKEM LABORATORIES LTD.70
Sr. No.
Shareholders Name Shareholding Date Increase/ (Decrease) in Shareholding
Reason Cumulative Shareholding during the year
For Each of the Shareholders
No. of Shares at the beginning
of the year (01.04.2015)
% of total Shares of the
Company
No. of Shares % of Shares of the
Company
14 Annapurna Singh 1591600 1.33 01.04.2015
- - -
31.03.2016 - - 1591600 1.33
15 Inderjit Arora 1591600 1.33 01.04.2015
24.12.2015 7000 Market Purchase 1598600 1.34
22.02.2016 800 Market Purchase 1599400 1.34
31.03.2016 - - 1599400 1.34
16 Rekha Singh 4654800 3.89 01.04.2015
21.12.2015 -1195650 Offer for sale 3459150 2.89
31.03.2016 - - 3459150 2.89
17 Madhurima Singh 2904240 2.43 01.04.2015
24.12.2015 35000 Market Purchase 2939240 2.46
29.03.2016 34919 Market Purchase 2974159 2.49
31.03.2016 - - 2974159 2.49
18 Divya Singh 1195650 1.00 01.04.2015
- - -
31.03.2016 - - 1195650 1.00
19 Annirudha Singh 1195650 1.00 01.04.2015
- - -
31.03.2016 - - 1195650 1.00
20 Seema Singh 2904240 2.43 01.04.2015
28.12.2015 20000 Market Purchase 2924240 2.45
29.12.2015 13500 Market Purchase 2937740 2.46
31.03.2016 - - 2937740 2.46
21 Meghna Singh 1195650 1.00 01.04.2015
28.12.2015 2000 Market Purchase 1197650 1.00
31.03.2016 - - 1197650 1.00
22 Shrey Shreeanant Singh
1195650 1.00 01.04.2015
- - -
31.03.2016 - - 1195650 1.00
23 Archana Singh 1198400 1.00 01.04.2015
24.07.2015 1195650 Transfer from Mr. Basudeo N Singh
2394050 2.00
31.03.2016 - - 2394050 2.00

ANNUAL REPORT 2015-16 71
CO
RP
OR
AT
E O
VE
RV
IEW
FIN
AN
CIA
L STAT
EM
EN
TS
STAT
UTO
RY
RE
PO
RT
S
Directors’ Report
(iv) Shareholding Pattern of top ten Shareholders (other than Directors, Promoters & Holders of GDRs & ADRs)Sr. No.
Shareholders Name Shareholding Date Increase/ (Decrease) in Shareholding
Reason Cumulative Shareholding during the year
For Each of the Shareholders
No. of Shares at the beginning
of the year (01.04.2015)
% of total Shares of the
Company
No. of Shares % of Shares of the
Company
1 Jayanti Sinha 8573000 7.17 01.04.2015
21.12.2015 -1434780 Offer for sale 7138220 5.97
31.03.2016 - - 7138220 5.97
2 Nawal Kishore Singh 6702360 5.61 01.04.2015
21.12.2015 -2391300 Offer for sale 4311060 3.61
31.03.2016 - - 4311060 3.61
3 Prabhat N Singh 4144400 3.47 01.04.2015
21.12.2015 -414440 Offer for sale 3729960 3.12
31.03.2016 - - 3729960 3.12
4 Rajesh Kumar 4502400 3.77 01.04.2015
21.12.2015 -1196865 Offer for sale 3305535 2.76
31.03.2016 - - 3305535 2.76
5 Rajeev Ranjan 4038000 3.38 01.04.2015
21.12.2015 -997658 Offer for sale 3040342 2.54
31.03.2016 - - 3040342 2.54
6 Deepak Kumar Singh 3038450 2.54 01.04.2015
21.12.2015 -303845 Offer for sale 2734605 2.29
31.03.2016 - - 2734605 2.29
7 Kishore Kumar Singh 3032850 2.54 01.04.2015
21.12.2015 -303285 Offer for sale 2729565 2.28
31.03.2016 - - 2729565 2.28
8 Lalan Kumar Singh 3012820 2.52 01.04.2015
21.12.2015 -301282 Offer for sale 2711538 2.27
31.03.2016 - - 2711538 2.27
9 Tushar Kumar 2475200 2.07 01.04.2015
21.12.2015 -247520 Offer for sale 2227680 1.86
31.03.2016 - - 2227680 1.86
10 Anju Singh 2962200 2.48 01.04.2015
21.12.2015 -1195650 Offer for sale 1766550 1.48
31.03.2016 - - 1766550 1.48
(v) Shareholding of Directors & KMPSr. No.
Name of Director / KMP
Shareholding Date Increase/ (Decrease) in Shareholding
Reason Cumulative Shareholding during the year
No. of Shares at the beginning
of the year (01.04.2015)
% of total Shares of the
Company
No. of Shares % of Shares of the
Company
1 Samprada Singh 4992520 4.18 01.04.2015
- - -
31.03.2016 - - 4992520 4.18
2 Basudeo N. Singh 9528600 7.97 01.04.2015
24.07.2015 -1195650 Transfer to Ms. Archana Singh
8332950 6.97
28.03.2016 29000 Market Purchase 8361950 6.99
29.03.2016 44000 Market Purchase 8405950 7.03
31.03.2016 - - 8405950 7.03
3 Balmiki Prasad Singh 6215760 5.20 01.04.2015
18.03.2016 41595 Market Purchase 6257355 5.23
31.03.2016 - - 6257355 5.23

ALKEM LABORATORIES LTD.72
Sr. No.
Name of Director / KMP
Shareholding Date Increase/ (Decrease) in Shareholding
Reason Cumulative Shareholding during the year
No. of Shares at the beginning
of the year (01.04.2015)
% of total Shares of the
Company
No. of Shares % of Shares of the
Company
4 Dhananjay Kumar Singh 5698260 4.77 01.04.2015
24.12.2015 68000 Market Purchase 5766260 4.82
31.03.2016 - - 5766260 4.82
5 Mritunjay Kumar Singh 5698260 4.77 01.04.2015
24.12.2015 1550 Market Purchase 5699810 4.77
28.12.2015 73450 Market Purchase 5773260 4.83
29.12.2015 1000 Market Purchase 5774260 4.83
22.02.2016 1500 Market Purchase 5775760 4.83
24.02.2016 498 Market Purchase 5776258 4.83
25.02.2016 2 Market Purchase 5776260 4.83
26.02.2016 500 Market Purchase 5776760 4.83
31.03.2016 - - 5776760 4.83
6 Sandeep Singh 1591600 1.33 01.04.2015
24.12.2015 61267 Market Purchase 1652867 1.38
31.03.2016 - - 1652867 1.38
7 Mangaldas Chhaganlal Shah
0 0.00 01.04.2015
31.03.2016 - - 0 0.00
8 Ennapadam N. Shankar (ceased to be a director w.e.f. 15.06.2015)
0 0.00 01.04.2015
31.03.2016 - - 0 0.00
9 Akhouri Maheshwar Prasad
0 0.00 01.04.2015
31.03.2016 - - 0 0.00
10 Ranjal Laxmana Shenoy 0 0.00 01.04.2015
31.03.2016 - - 0 0.00
11 Arun Kumar Purwar 0 0.00 01.04.2015
31.03.2016 - - 0 0.00
12 Sangeeta Singh 0 0.00 01.04.2015
31.03.2016 - - 0 0.00
13 Sudha Ravi 0 0.00 01.04.2015
31.03.2016 - - 0 0.00
14 Prabhat Agrawal (CEO) 0 0.00 01.04.2015
21.12.2015 210 Subscription in IPO
210 0.00*
31.03.2016 - - 210 0.00*
15 Rajesh Dubey (CFO) 0 0.00 01.04.2015
21.12.2015 210 Subscription in IPO 210 0.00*
31.03.2016 - - 210 0.00*
16 Manish Narang (Company Secretary and Compliance Officer)
0 0.00 01.04.2015
21.12.2015 210 Subscription in IPO
210 0.00*
29.12.2015 76 Market Purchase 286 0.00*
22.02.2016 106 Market Purchase 392 0.00*
31.03.2016 - - 392 0.00*
* negligible
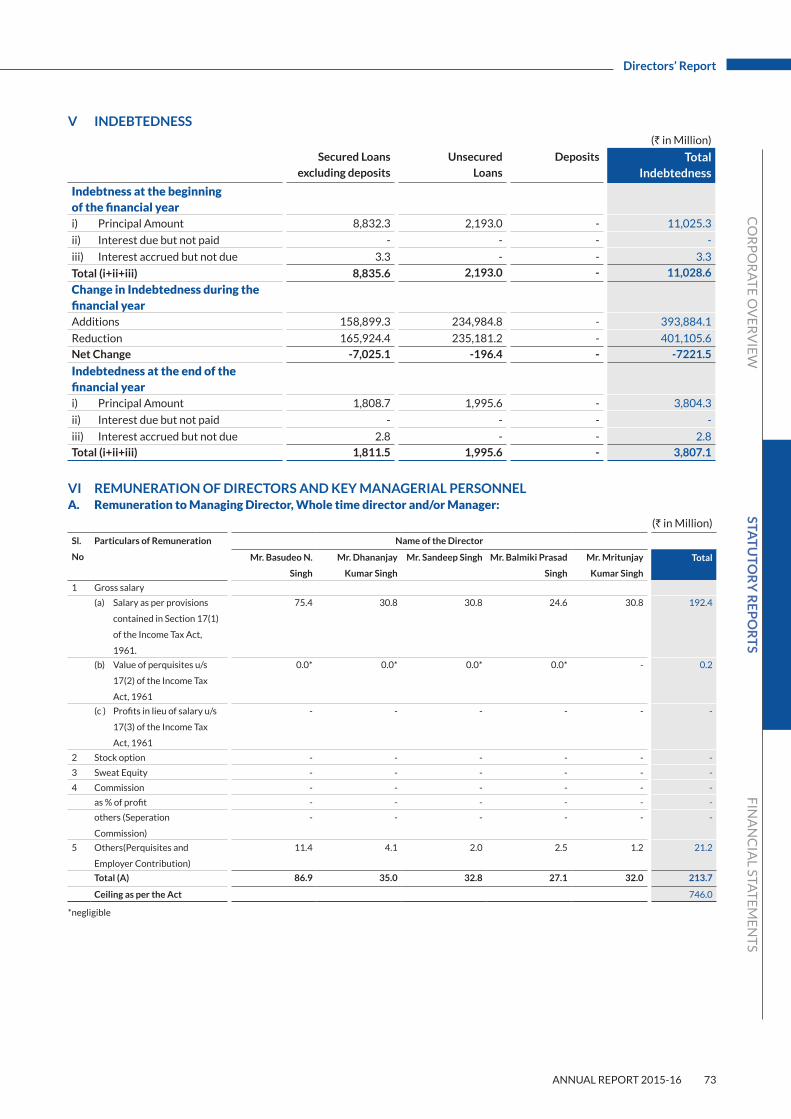
ANNUAL REPORT 2015-16 73
CO
RP
OR
AT
E O
VE
RV
IEW
FIN
AN
CIA
L STAT
EM
EN
TS
STAT
UTO
RY
RE
PO
RT
S
Directors’ Report
V INDEBTEDNESS(` in Million)
Secured Loans
excluding deposits
Unsecured
Loans
Deposits Total Indebtedness
Indebtness at the beginning of the financial yeari) Principal Amount 8,832.3 2,193.0 - 11,025.3
ii) Interest due but not paid - - - -
iii) Interest accrued but not due 3.3 - - 3.3
Total (i+ii+iii) 8,835.6 2,193.0 - 11,028.6
Change in Indebtedness during the financial yearAdditions 158,899.3 234,984.8 - 393,884.1
Reduction 165,924.4 235,181.2 - 401,105.6
Net Change -7,025.1 -196.4 - -7221.5
Indebtedness at the end of the financial yeari) Principal Amount 1,808.7 1,995.6 - 3,804.3
ii) Interest due but not paid - - - -
iii) Interest accrued but not due 2.8 - - 2.8
Total (i+ii+iii) 1,811.5 1,995.6 - 3,807.1
VI REMUNERATION OF DIRECTORS AND KEY MANAGERIAL PERSONNELA. Remuneration to Managing Director, Whole time director and/or Manager:
(` in Million)
Sl.
No
Particulars of Remuneration Name of the Director
Mr. Basudeo N.
Singh
Mr. Dhananjay
Kumar Singh
Mr. Sandeep Singh Mr. Balmiki Prasad
Singh
Mr. Mritunjay
Kumar Singh
Total
1 Gross salary
(a) Salary as per provisions
contained in Section 17(1)
of the Income Tax Act,
1961.
75.4 30.8 30.8 24.6 30.8 192.4
(b) Value of perquisites u/s
17(2) of the Income Tax
Act, 1961
0.0* 0.0* 0.0* 0.0* - 0.2
(c ) Profits in lieu of salary u/s
17(3) of the Income Tax
Act, 1961
- - - - - -
2 Stock option - - - - - -
3 Sweat Equity - - - - - -
4 Commission - - - - - -
as % of profit - - - - - -
others (Seperation
Commission)
- - - - - -
5 Others(Perquisites and
Employer Contribution)
11.4 4.1 2.0 2.5 1.2 21.2
Total (A) 86.9 35.0 32.8 27.1 32.0 213.7
Ceiling as per the Act 746.0
*negligible

ALKEM LABORATORIES LTD.74
B. Remuneration to other directors:(` in Million)
Sl. No
Particulars of Remuneration
Name of Independent Directors
1 Independent Directors Mangaldas Chaganlal
Shah
Akhouri Maheshwar
Prasad
Ranjal Laxmana
Shenoy
Arun Kumar
Purwar
Sudha Ravi Sangeeta Singh
Total
(a) Fee for attending Board and Committee meetings
0.20 0.14 0.44 0.12 0.14 0.14 1.18
(b) Commission 1.00 1.00 1.00 1.00 1.00 1.00 6.00
(c ) Others, please specify
Fees for attending General meetings
0.02 0.02 0.02 0.02 0.02 0.02 0.12
Total (1) 1.22 1.16 1.46 1.14 1.16 1.16 7.30
2 Other Non Executive Directors
Mr. Samprada Singh
(a) Fee for attending Board and Committee meetings
-
(b) Commission 126.0
(c) Others, please specify.
-
Total (2) 126.0
Total (B)=(1+2) 133.3
Total Managerial Remuneration (A+B)
347.0
Overall Ceiling as per the Act.
Sitting fees paid to the Independent Directors was within the ceiling limit as prescribed under the Companies Act, 2013.
Commission paid to Non-Executive Directors (including Independent Directors) was within the ceiling limit approved by the Shareholders of the Company i.e. ` 149.19 Million (2% of the Net Profits of the Company)
C. Remuneration to Key Managerial Personnel other than MD/Manager/WTD(` in Million)
Sl.
No.
Particulars of Remuneration Key Managerial Personnel
CEO:
Mr. Prabhat Agrawal
Company Secretary:
Mr Manish Narang
CFO:
Mr. Rajesh DubeyTotal
1 Gross Salary
(a) Salary as per provisions contained
in Section 17(1) of the Income Tax
Act, 1961.
47.4 9.2 9.3 65.9
(b) Value of perquisites u/s 17(2) of
the Income Tax Act, 1961
- 0.0* 0.1 0.1
(c) Profits in lieu of salary u/s 17(3) of
the Income Tax Act, 1961
- - - -
2 Stock Option - - - -
3 Sweat Equity - - - -
4 Commission - - - -
as % of profit - - - -
others, specify - - - -
5 Others, please specify - - - -
Perquisites and Employer Contribution
to PF) 2.1 1.0 0.8 3.9
Performance-linked Incentive Pay 9.2 1.6 2.4 13.2
Total 58.7 11.8 12.6 83.1*negligible

ANNUAL REPORT 2015-16 75
CO
RP
OR
AT
E O
VE
RV
IEW
FIN
AN
CIA
L STAT
EM
EN
TS
STAT
UTO
RY
RE
PO
RT
S
Directors’ Report
VII PENALTIES/PUNISHMENT/COMPOUNDING OF OFFENCESType Section of the Companies
Act
Brief Description Details of
Penalty/
Punishment/
Compounding
fees imposed
Authority
(RD/NCLT/
Court)
Appeall
made if
any (give
details)
A. CompanyPenalty - - - - -
Punishment - - - - -
Compounding Section 297 of Companies
Act, 1956
The Company had failed to obtain
prior approval of the Central
Government before entering
into transactions with associate
companies in which Directors of
the Company were interested as
members / directors of the contractee
parties during the period from
2005-2006 to 2013-2014.
` 2,00,000 Company
Law Board
N.A.
Section 58A of the
Companies Act, 1956 read
with Rule 10 of Companies
(Acceptance of Deposits)
Rules, 1975
The Company had accepted deposits
from its members but had failed to
file Return of Deposit with Registrar
of Companies for the period from
01.04.2005 to 31.03.2015.
` 50,000 Company
Law Board
N.A.
Section 58A of the
Companies Act, 1956 read
with Rule 4/4A of Companies
(Acceptance of Deposits)
Rules, 1975
The Company had accepted deposits
from its members during the period
from 2005-2006 to 2014-2015
without filing Statement in Lieu of
Advertisement.
` 50,000 Company
Law Board
N.A.
B. DirectorsPenalty - - - - -
Punishment - - - - -
Compounding
(Managing
Director)
Section 297 of Companies
Act, 1956
The Company had failed to obtain
prior approval of the Central
Government before entering
into transactions with associate
companies in which Directors of
the Company were interested as
members / directors of the contractee
parties during the period from
2005-2006 to 2013-2014.
` 1,00,000 Company
Law Board
N.A.
Section 58A of the
Companies Act, 1956 read
with Rule 10 of Companies
(Acceptance of Deposits)
Rules, 1975
The Company had accepted deposits
from its members but had failed to
file Return of Deposit with Registrar
of Companies for the period from
01.04.2005 to 31.03.2015.
` 25,000 Company
Law Board
N.A.
Section 58A of the
Companies Act, 1956 read
with Rule 4/4A of Companies
(Acceptance of Deposits)
Rules, 1975
The Company had accepted deposits
from its members during the period
from 2005-2006 to 2014-2015
without filing Statement in Lieu of
Advertisement.
` 25,000 Company
Law Board
N.A.

ALKEM LABORATORIES LTD.76
Type Section of the Companies
Act
Brief Description Details of
Penalty/
Punishment/
Compounding
fees imposed
Authority
(RD/NCLT/
Court)
Appeall
made if
any (give
details)
C. Other Officers In DefaultPenalty - - - - -
Punishment - - - - -
Compounding
(Company
Secretary)
Section 297 of Companies
Act, 1956
The Company had failed to obtain
prior approval of the Central
Government before entering
into transactions with associate
companies in which Directors of
the Company were interested as
members / directors of the contractee
parties during the period from
2005-2006 to 2013-2014.
` 50,000 Company
Law Board
N.A.
Section 58A of the
Companies Act, 1956 read
with Rule 10 of Companies
(Acceptance of Deposits)
Rules, 1975
The Company had accepted deposits
from its members but had failed to
file Return of Deposit with Registrar
of Companies for the period from
01.04.2005 to 31.03.2015.
` 10,000 Company
Law Board
N.A.
Section 58A of the
Companies Act, 1956 read
with Rule 4/4A of Companies
(Acceptance of Deposits)
Rules, 1975
The Company had accepted deposits
from its members during the period
from 2005-2006 to 2014-2015
without filing Statement in Lieu of
Advertisement.
` 10,000 Company
Law Board
N.A.

ANNUAL REPORT 2015-16 77
CO
RP
OR
AT
E O
VE
RV
IEW
FIN
AN
CIA
L STAT
EM
EN
TS
STAT
UTO
RY
RE
PO
RT
S
Directors’ Report
(A) CONVERSATION OF ENERGY1. Energy Conservation Measures taken Energy Conservation continues to receive top priority in
the Company. The energy consumptions are monitored, maintenance systems have improved and distribution losses are reduced.
Specific Energy Conservation measures taken during financial year 2015-16 are as follows:
i. All CFL & sodium lights are replaced with LED lights in the Manufacturing Plant located at Baddi .
ii. Motion sensors have been installed at all low movement areas in the Manufacturing Plant located at Kumrek, Sikkim.
iii. Improved the capacity of capacitor panel, resulting in 0.99 power factor.
iv. Improved the efficiency of Boilers due to usage of more efficient fuel.
v. Installed boiler feed water as a condensate recovery of plant, resulting in boiler feed water temperature more than 85 degree Celsius and the efficiency has been improved up to 85 %.
vi. Variable Frequency Drive (VFD) Installation:- On all motors above 5 Horsepower, VFD has been installed. After the VFD installation, motor runs on variable Revolution per minute (RPM) according to the environmental condition.
vii. Auto Tube Brushing (ATB):- ATB is installed on four Chillers. This results in saving the power consumed by the chillers.
viii. Auto Blow Down (ABD):- ABD has been installed on all boilers which results in increase in efficiency of the boilers.
2. Steps taken by the Company for utilizing the alternate sources of energy:
All CFL street lights in the Manufacturing Plant located at Baddi have been replaced with Solar Based lights.
3. The capital investment on Energy Conservation equipment:
(` In Million)Sr. No.
Particulars Amount
1) Smart Solar LED Lights 0.6
2) LED Lights 1.93) VFD 3.14) ATB 3.55) ABD 0.3Total 9.4
ANNEXURE G
INFORMATION ON CONSERVATION OF ENERGY, TECHNOLOGY ABSORPTION AND FOREIGN EXCHANGE DETAILS[Pursuant to the Companies (Accounts) Rules, 2014]
(B) TECHNOLOGY ABSORPTION1. Efforts, in brief, made towards technology absorption i. Development and patenting of new molecular
forms and methods of synthesis. ii. Development of new drug delivery systems.
2. Benefits derived as a result of the above efforts: i. Improvement in operational efficiency through
reduction in batch hours, increase in batch sizes, better solvent recovery and simplification of processes.
ii. Meeting norms of external regulatory agencies to facilitate more exports.
iii. Improvements in effluent treatment, pollution control and all-round safety standards.
iv. Maximum utilization of indigenous raw materials. v. Development of products for import substitution.
3. In case of imported technology (imported during the last 3 years reckoned from the beginning of the financial year):
(i) Granurex GXR-95 (the conical rotor insert): (a) The details of technology imported: The Company imported this technology from
USA. This equipment is manufactured by Freund Vector and is used for the powder layering on pellets. This technology is useful in achieving drug layering at much faster rate as compared to conventional techniques, which in turn increases production efficiency;
(b) The year of import: 2015-16; (c) Whether the technology has been fully
absorbed: No; (d) If not, areas where absorption has not
taken place and the reasons thereof: Implementation is in process.
(ii) High Speed Rotary Tablet Press Courtoy Performa™ P with MUPS feeding system:
(a) The details of technology imported: The Company imported this press to increase
process yield and enhance the tablet quality, an innovative new MUPS production method which works on a continuous dosing, blending and compression system. This technology increases the production efficiency and reduces the product quality risks;

ALKEM LABORATORIES LTD.78
(b) The year of import: 2015-16; (c) Whether the technology has been fully
absorbed: No; (d) If not, areas where absorption has not
taken place and the reasons thereof: Implementation is in process.
(iii) Korsch Compression Machine: (a) The details of technology imported: Compression Machine which is monolayer as
well as bilayer; (b) The year of import: 2015-16; (c) Whether the technology has been fully
absorbed: No; (d) If not, areas where absorption has not
taken place and the reasons thereof: Under installation.
(iv) Gea Compression Machine: (a) The details of technology imported: Gea Compression Machine for infusion of
micro tablet into capsule for min tablet of 2.2 mm diameter;
(b) The year of import: 2015-16; (c) Whether the technology has been fully
absorbed: No; (d) If not, areas where absorption has not taken
place and the reasons thereof: Machine is yet to be received.
4. Expenditure on R & D
(` in Million)
Sr.
No.
Particulars 2015-16 2014-15
(i) Capital 207.6 196.6
(ii) Recurring 1,917.4
(excluding
depreciation of
` 102.7 Million)
1,423.8
(excluding
depreciation of
` 89.3 Million)
Total 2,124.9 1,620.3
Total R & D expenditure
as percentage to total
turnover
5.38 % 5.10%
(C) FOREIGN EXCHANGE EARNING AND OUTGO(` In Million)
2015-16 2014-15
Foreign Exchange earned 6,563.3 3,516.1
Foreign Exchange used 1,471.4 1,134.4
For and on behalf of the BoardAlkem Laboratories Limited
Samprada SinghChairman Emeritus
DIN: 00760279
Date: 27th May, 2016Place: Mumbai

ANNUAL REPORT 2015-16 79
CO
RP
OR
AT
E O
VE
RV
IEW
FIN
AN
CIA
L STAT
EM
EN
TS
STAT
UTO
RY
RE
PO
RT
S
Corporate Governance Report
(1) COMPANY’S PHILOSOPHY ON CORPORATE GOVERNANCE
The Company is committed to good corporate governance. The Company respects the rights of its shareholders to obtain information on the performance of the Company. Its endeavour has always been to maximize the long term value to the shareholders of the Company. The Company places great emphasis on principles such as empowerment and integrity of its employees, safety of the employees & communities surrounding our plants, transparency in decision making
Corporate Governance Report
process, fair & ethical dealings with all stakeholders and society in general. The Compliance Report on Corporate Governance herein signifies compliance of all mandatory requirements of Regulation 34(3) and Schedule V of Securities Exchange Board of India (Listing Obligations and Disclosure Requirements) Regulations, 2015. (“SEBI LODR Regulations”)
(2) BOARD OF DIRECTORS The present strength of the Board of Directors of your
company is twelve (12) directors.
Composition of the Board is in conformity with Regulation 17 of SEBI LODR Regulations read with Section 149 of the Companies Act, 2013 (“Act”). The names and categories of Directors are as follows:
Category Name of Directors Inter-se relationship between Directors
Promoter, Non-Executive and
Non-Independent Director
Mr. Samprada Singh
(Chairman Emeritus)
Father of Mr. Balmiki Prasad Singh,
Grandfather of Mr. Sandeep Singh
Promoter Executive Directors Mr. Basudeo N. Singh
(Executive Chairman)
Father of Mr. Dhananjay Kumar Singh and
Mr. Mritunjay Kumar Singh
Mr. Dhananjay Kumar Singh
(Joint Managing Director)
Son of Mr. Basudeo N. Singh and Brother of
Mr. Mritunjay Kumar Singh
Mr. Sandeep Singh
(Joint Managing Director)
Grandson of Mr. Samprada Singh
Mr. Mritunjay Kumar Singh
(Executive Director)
Son of Mr. Basudeo N. Singh and Brother of
Mr. Dhananjay Kumar Singh
Mr. Balmiki Prasad Singh
(Executive Director)
Son of Mr. Samprada Singh
Non-Executive Independent Directors Mr. Arun Kumar Purwar N.A.
Mr. Ranjal Laxmana Shenoy N.A.
Mr. Akhouri Maheshwar Prasad N.A.
Mr. Mangaldas Chhaganlal Shah N.A.
Ms. Sangeeta Singh* N.A.
Ms. Sudha Ravi* N.A.
Mr. Ennapadam N. Shankar# N.A.
* Appointed w.e.f. 29th June, 2015 # Resigned w.e.f. 15th June, 2015
Shareholding of Non-Executive Directors As on 31st March, 2016, Mr. Samprada Singh, Chairman
Emeritus and Non-Executive Director held 4,992,520 Equity Shares in the share capital of the Company. None of the other Non-Executive Directors held any Equity Shares of the Company.
As required under Schedule IV of the Act, the Company has issued formal letters of appointment to the Independent Directors. The terms & conditions of their appointment are posted pursuant to Regulation 46(2)(b) of the SEBI LODR Regulations, on the Company’s website and can be accessed at http://www.alkemlabs.
com/admin/Photos/Policies/29729Terms%20of%20Appointment%20-%20Independent%20Directors%20(1).pdf
Board Meetings Five Board meetings were held during the year. The
dates on which the meetings were held during the year ended 31st March, 2016 are as follows:
29th June, 2015, 28th September, 2015, 20th November, 2015, 12th February, 2016 and 9th March, 2016.

ALKEM LABORATORIES LTD.80
The Board also passed resolutions by circulation dated 12th January, 2016.
In accordance with the provisions of Schedule IV of Companies Act, 2013 (“the Act”) and SEBI LODR Regulations, a separate meeting of the Independent Directors of the Company was held on 9th March, 2016 to review the performance of Non-Independent Directors (including the Chairpersons) and the entire
Board. The Independent Directors also reviewed the quality, quantity and timelines of the flow of information between the Management and the Board.
Attendance of each Director at the Board meetings, last Annual General Meeting (AGM), and number of other Directorships and Chairmanships/Memberships of Committee of each Director, are given below:
Name of Director Attendance Particulars for the year ended 31st March, 2016
*No. of other Directorships and Committee Memberships / Chairmanships
as of 31st March, 2016
Board Meetings
held during the director’s
tenure
Board Meetings attended
Last AGM held on
13th July, 2015
Other Directorships
Committee Memberships
#
Committee Chairmanships
#
Mr. Samprada Singh 5 5 Yes 0 0 0
Mr. Basudeo N. Singh 5 5 Yes 1 0 0
Mr. Dhananjay Kumar Singh 5 5 Yes 0 0 0
Mr. Sandeep Singh 5 3 No 1 0 0
Mr. Mritunjay Kumar Singh 5 4 Yes 1 1 0
Mr. Balmiki Prasad Singh 5 3 Yes 0 0 0
Mr. Arun Kumar Purwar 5 5 Yes 9 6 3
Mr. Ranjal Laxmana Shenoy 5 5 Yes 2 3 1
Mr. Akhouri Maheshwar Prasad 5 5 Yes 1 1 0
Mr. Mangaldas Chhaganlal Shah 5 5 Yes 0 0 0
Ms. Sangeeta Singh 5 5 Yes 4 3 0
Ms. Sudha Ravi 5 4 Yes 1 2 0
Mr. Ennapadam N. Shankar$ 0 0 No N.A. N.A. N.A.
* The above list of other directorships does not include Directorships, Committee Memberships and Committee Chairmanships in Private Limited, Foreign and Section 8 Companies.
# The Committee Memberships and Chairmanships in other Companies include Memberships and Chairmanships of Audit and Stakeholders’ Relationship Committee of public companies only.
$ Mr. Ennapadam N. Shankar resigned as a Director of the Company w.e.f. 15th June, 2015.
Familiarization Programme At the time of appointment, Independent Directors are
made aware of their roles, rights and responsibilities through a formal letter of appointment which also stipulates the various terms and conditions of their engagement. At Board and Committee Meetings, the Independent Directors are on regular basis familiarized with the business model, regulatory environment in which it operates, strategy, operations, functions, policies and procedures of the Company and its subsidiaries. Independent Directors were invited to attend conferences held with objectives to guide corporate directors in carrying governance and compliance responsibilities amidst complex demands placed upon by the Act and SEBI LODR Regulations. The Familiarization Programme formulated by the Company for Independent Directors has been
uploaded on the Company’s website, the web link for which is http://www.alkemlabs.com/admin/Photos/Policies/973052158Directors%20Familiarisation%20Programme.pdf
(3) CODE OF CONDUCT All the Directors and senior management have
affirmed compliance with the Code of Conduct as approved and adopted by the Board of Directors and a declaration to the effect signed by the Chief Executive Officer has been annexed to the Corporate Governance Report. The Code of Conduct has been posted on the website of the Company, the web link for which is http://www.alkemlabs.com/admin/Photos/Policies/993521810CODE%20OF%20BUSINESS%20CONDUCT%20AND%20ETHICS%20FOR%20SENIOR%20MANAGEMENT.pdf

ANNUAL REPORT 2015-16 81
CO
RP
OR
AT
E O
VE
RV
IEW
FIN
AN
CIA
L STAT
EM
EN
TS
STAT
UTO
RY
RE
PO
RT
S
Corporate Governance Report
(4) PREVENTION OF INSIDER TRADING CODE As per SEBI (Prohibition of Insider Trading) Regulations,
2015, the Company has adopted Code of Conduct for Fair disclosure of unpublished price sensitive information and Regulating, Monitoring and Reporting of Trading by Insiders. All the Directors, employees and third parties such as auditors, consultants etc. who could have access to the unpublished price sensitive information of the Company are governed by this code. The trading window is closed during the time of declaration of results and occurrence of any material events as per the code. The Board of Directors has appointed Mr. Manish Narang, Senior Vice President – Legal, Company Secretary as Compliance Officer, who is responsible for setting forth procedures and implementation of the code for trading in Company’s securities. During the year under review there has been due compliance with the Securities and Exchange Board of India (Prohibition of Insider Trading) Regulations, 2015.
(5) AUDIT COMMITTEE The present constitution of the audit committee of the
Company is as follows:
Name of the director
Designation in the committee
Mr. Ranjal Laxmana Shenoy Chairman
Ms. Sudha Ravi Member
Mr. Mritunjay Kumar Singh Member
Ms. Sangeeta Singh Member
Mr. Manish Narang, Senior Vice President - Legal, Company Secretary and Compliance Officer is the secretary of the audit committee.
Brief Terms of reference of the audit committee: 1. Oversight of the company’s financial reporting
process, examination of the financial statement and the auditors’ report thereon and the disclosure of its financial information to ensure that the financial statement is correct, sufficient and credible;
2. Recommendation for appointment, re-appointment and replacement, remuneration and terms of appointment of auditors of the company and the fixation of audit fee;
3. Review and monitor the statutory auditor’s independence and performance and effectiveness of audit process;
4. Approval of payment to statutory auditors for any other services rendered by them;
5. Reviewing, with the management, the annual financial statements before submission to the Board for approval, with particular reference to:
i. Matters required to be included in the ‘Director’s Responsibility Statement’ to be included in the Board’s report in terms of clause (c) of sub-section 3 of Section 134 of the Companies Act, 2013;
ii. Changes, if any, in accounting policies and practices and reasons for the same;
iii. Major accounting entries involving estimates based on exercise of judgment by the management;
iv. Significant adjustments made in the financial statements arising out of audit findings;
v. Compliance with listing and other legal requirements relating to financial statements;
vi. Disclosure of any related party transactions; and
vii. Modified opinion(s) in the draft audit report.
6. Reviewing, with the management, the quarterly and half-yearly financial statements before submission to the Board for approval;
7. Reviewing, with the management, the statement of uses / application of funds raised through an issue (public issue, rights issue, preferential issue, etc.), the statement of funds utilized for purposes other than those stated in the offer document/prospectus/notice and the report submitted by the monitoring agency monitoring the utilisation of proceeds of a public or rights issue, and making appropriate recommendations to the Board to take up steps in this matter;
8. Reviewing, with the management, performance of statutory and internal auditors, and adequacy of the internal control systems;
9. Reviewing the adequacy of internal audit function, if any, including the structure of the internal audit department, staffing and seniority of the official heading the department, reporting structure coverage and frequency of internal audit;
10. Discussion with internal auditors of any significant findings and follow up there on;
11. Reviewing the findings of any internal investigations by the internal auditors into matters where there is suspected fraud or irregularity or a failure of internal control systems of a material nature and reporting the matter to the Board;

ALKEM LABORATORIES LTD.82
12. Discussion with statutory auditors before the audit commences, about the nature and scope of audit as well as post-audit discussion to ascertain any area of concern;
13. To review the functioning of the whistle blower mechanism;
14. Approval of appointment of the chief financial officer (i.e., the whole time finance Director or any other person heading the finance function or discharging that function) after assessing the qualifications, experience and background etc. of the candidate;
15. To investigate any activity within its terms of reference;
16. Approval or any subsequent modification of transactions of the company with related parties and omnibus approval for related party transactions proposed to be entered into by the Company subject to such conditions as may be prescribed;
17. Scrutiny of inter-corporate loans and investments;
18. Valuation of undertakings or assets of the company, wherever it is necessary;
19. Evaluation of internal financial controls and risk management systems; and
The Audit Committee also reviews the following information:
1. Management’s discussion and analysis of financial condition and results of operations;
2. Statement of significant related party transactions (as defined by the Audit Committee), submitted by the management;
3. Management letters / letters of internal control weaknesses issued by the statutory auditors;
4. Internal audit reports relating to internal control weaknesses;
5. The appointment, removal and terms of remuneration of the chief internal auditor;
6. Statement of deviations: (a) quarterly statement of deviation(s)
including report of monitoring agency, if applicable, submitted to stock exchange(s) in terms of Regulation 32(1) of SEBI LODR Regulations.
(b) annual statement of funds utilized for purposes other than those stated in the offer document/prospectus/notice in terms of Regulation 32(7) of SEBI LODR Regulations.
Audit Committee Meetings Audit Committee meetings are held at least four times
a year and the time-gap between two meetings is not more than 120 days, which is in compliance with Regulation 18(2) of the SEBI LODR Regulations. During the year, four Audit Committee meetings were held, viz. on 29th June, 2015, 28th September, 2015, 20th November, 2015 and 11th February, 2016 and the attendance of Members at which, was as follows:
Sr. No.
Name of the Member No. of Meetings
held during the director’s
tenure
No. of Meetings Attended
a. Mr. Ranjal Laxmana Shenoy 4 4
b. Ms. Sudha Ravi$ 3 2
c. Mr. Mritunjay Kumar Singh 4 3
d. Ms. Sangeeta Singh* 1 1
e. Mr. Mangaldas Chhaganlal
Shah#
1 1
$Appointed as a Member w.e.f. 29th June, 2015. *Appointed as a Member w.e.f. 20th November, 2015. #Member upto 29th June, 2015.
(6) NOMINATION AND REMUNERATION COMMITTEE
The Board of Directors has constituted the Nomination and Remuneration Committee in its meeting held on 30th January, 2015 in line with the provisions of Regulation 19 of SEBI LODR Regulations read with Section 178 of the Act. The present constitution of the Nomination and Remuneration Committee is as follows:
Name of the director Designation in the committee
Mr. Arun Kumar Purwar Chairman
Mr. Akhouri Maheshwar Prasad Member
Mr. Basudeo N. Singh Member
Ms. Sangeeta Singh Member
Brief Terms of reference of the Nomination and Remuneration Committee:
(a) Formulation of the criteria for determining qualifications, positive attributes and independence of a director and recommend to the Board a policy, relating to the remuneration of the directors, key managerial personnel and other employees;
(b) Recommend to the Board the appointment and reappointment of directors;
(c) Formulation of criteria for evaluation of independent directors and the Board;
(d) Devising a policy on Board diversity;

ANNUAL REPORT 2015-16 83
CO
RP
OR
AT
E O
VE
RV
IEW
FIN
AN
CIA
L STAT
EM
EN
TS
STAT
UTO
RY
RE
PO
RT
S
Corporate Governance Report
(e) Identifying persons who are qualified to become directors and who may be appointed in senior management in accordance with the criteria laid down, and recommend to the Board their appointment and removal. The remuneration policy is disclosed in the Board’s Report.;
(f) Determining whether to extend or continue the term of appointment of the independent director, on the basis of the report of performance evaluation of independent directors;
(g) Performing such functions as are required to be performed by the compensation committee under the Securities and Exchange Board of India (Share Based Employee Benefits) Regulations, 2014;
(h) Performing such other activities as may be delegated by the Board of Directors and/or are statutorily prescribed under any law to be attended to by the Nomination and Remuneration Committee.
Nomination and Remuneration Committee Meetings During the year, Nomination and Remuneration
Committee met once on 29th June, 2015, and the attendance was as under:
Sr. No.
Name of the Member No. of Meetings
held during the director’s
tenure
No. of Meetings Attended
a. Mr. Arun Kumar Purwar* 0 0
b. Mr. Akhouri Maheshwar
Prasad
1 1
c. Mr. Basudeo N. Singh* 0 0
d. Ms. Sangeeta Singh* 0 0
e. Mr. Samprada Singh# 1 0
f. Mr. Mangaldas
Chhaganlal Shah#
1 1
* Appointed w.e.f. 29th June, 2015 # Member upto 29th June, 2015
Evaluation of Performance Pursuant to the provisions of Section 134(3)(p), Schedule
IV of the Act read with Regulations 17 of the SEBI LODR Regulations, the Board adopted a formal evaluation process of its performance during the year as well as that of its committees, the individual Directors, Chairman and the Independent Directors. The Independent Directors assessed the executive directors on the basis of the contributions made by such Directors in the achievement of business targets, development and successful execution of the business plans, their management of relationship with the Members of the Board of Directors (the “Board”) and management personnel as well as creating a performance culture to drive value creation.
The Executive Chairman of the Company was assessed on the basis of his contribution in the growth of the Company by his strategic directions on the expansion, diversification and business plans as well as successful execution of business plans and managing the relationship with the members of the Board and management.
The Independent Directors were assessed by taking into account their objective independent judgement on the Board deliberations, overall contribution and engagement in the growth of the Company, their active role in monitoring the effectiveness of Company’s Corporate Governance practices and adherence to the code of conduct.
Based on the conclusions drawn on the evaluation of the Board and the Directors, it is expected that Board and the Directors will continue to play an even more meaningful role in the enhancement of shareholder value in the ensuing years.
(7) REMUNERATION OF DIRECTORS (a) Details of the Pecuniary relationship or
transactions of the Non-Executive Directors of the Company:
The Non-Executive Directors are paid remuneration by way of Commission and Sitting Fees. The details of remuneration paid to Non-Executive Directors for the financial year 2015-16 are as under:
(` In Million)
Name Sitting Fees* Commission Other Perquisites Total
Mr. Samprada Singh - 126.0 - 126.0
Mr. Ranjal Laxmana Shenoy 0.5 1.0 - 1.5
Mr. Arun Kumar Purwar 0.1 1.0 - 1.1
Mr. Akhouri Maheshwar Prasad 0.2 1.0 - 1.2
Mr. Mangaldas Chhaganlal Shah 0.2 1.0 - 1.2
Ms. Sudha Ravi 0.2 1.0 - 1.2
Ms. Sangeeta Singh 0.2 1.0 - 1.2
* excluding Service Tax and includes sitting fees paid for attending Annual General Meeting of the Company held on 13th July, 2015.

ALKEM LABORATORIES LTD.84
• The Commission payable to the Non-Executive Directors is decided by the Board of Directors of the Company within the limits stipulated by the Special Resolution passed at the Extra Ordinary General Meeting of the Members held on 16th March, 2015. The amount of Commission payable to Mr. Samprada Singh was decided by the Board on the basis of the role and responsibility as Chairman Emeritus of the Board and overall financial performance of the Company.
• Except reimbursement of expenses, dividend on Equity Shares held, if any, by the Non-Executive Directors, and the amount of sitting fees and commission as stated above no other payments have been made or transactions of a pecuniary nature entered into by the Company with the Non-Executive Directors.
(b) Criteria of making payments to Non- Executive Directors (NEDs)
The NEDs play a crucial role to the independent functioning of the Board. NEDs bring in external and wider perspective to the decision-making by the Board. They provide leadership and strategic guidance, while maintaining objective judgment. The NEDs also help the Company in ensuring that all legal requirements and corporate governance are complied with and well taken care of.
The responsibilities and obligations imposed on the NEDs have increased manifold in the recent years on account of a number of factors, including the growth in the activities of the Company and the rapid evolution arising out of legal and regulatory provisions and requirements.
Remuneration to the NEDs: Sitting fees Non-executive directors are paid a sitting fee of
` 20,000/- for every meeting of the Board and/or committee thereof attended by them.
Commission Pursuant to the resolution passed by the
shareholders of the Company on 16th March, 2015, the Board of Directors is authorised to pay commission to the NEDs and Independent Directors subject to a maximum limit of 2% of the net profits of the Company for each financial year. The said commission is decided each year by the Board of Directors and distributed amongst the Non-Executive/ Independent Directors based on their attendance and contribution to the Board and Committee meetings as well as time spent on operational matters other than at meetings.
Apart from sitting fees and commission referred to above and reimbursement of travelling and stay expenses for their attending the Board and committee meetings, no payment by way of bonus, pension, incentives etc. is made to any of the NEDs.
(c) Details of Remuneration to Executive Directors: The Executive Directors are paid remuneration in
accordance with the limits prescribed under the Companies Act, 2013 and Remuneration Policy of the Company. The approvals of the Board of Directors, Shareholders and Central Government are obtained, as and when necessary. Details of remuneration paid to the Executive Directors during the financial year 2015-16 are as follows:
(` In Million)
Terms of Remuneration Name of Directors
Mr. Basudeo
N. Singh
Mr. Dhananjay.
Kumar Singh
Mr. Sandeep
Singh
Mr. Balmiki
Prasad Singh
Mr. Mritunjay
Kumar Singh
Salary & Other Allowances 75.4 30.8 30.8 24.6 30.8
Contribution to Provident Fund 8.4 1.2 1.2 0.9 1.2
Perquisites 3.1 3.0 0.9 1.6 -
Performance Linked Incentive - - - - -
Total 86.9 35.0 32.8 27.1 32.0
Service Contracts, Severance Fees and Notice Period The appointment of the Executive Chairman, Joint
Managing Directors and other Executive Directors is subject to the provisions of the Act and is governed by the Articles of Association of the Company and the Resolution passed by the Board of Directors and Members of the Company which cover the terms and conditions of such appointment.
In terms of the Articles of Association, Managing Director(s) / Executive Director(s) shall be subject to the provisions of any contract between him and the Company and also subject to the same provisions as to resignation and removal as the other Directors of the Company. If he ceases to hold the office of a Director he shall ipso facto and immediately cease to be a Managing Director(s) / Executive Director(s), and vice versa. There is no separate provision for payment of severance

ANNUAL REPORT 2015-16 85
CO
RP
OR
AT
E O
VE
RV
IEW
FIN
AN
CIA
L STAT
EM
EN
TS
STAT
UTO
RY
RE
PO
RT
S
Corporate Governance Report
fee under the resolutions governing the appointment of Executive Chairman, Joint Managing Directors and other Executive Directors.
Employee Stock Option Scheme The Company does not have any Employee Stock
Option Scheme for its Directors and Employees.
(8) STAKEHOLDERS’ RELATIONSHIP COMMITTEE The Board of Directors of the Company has constituted
a Stakeholders’ Relationship Committee in line with the provisions of Regulation 20 of SEBI LODR Regulations read with Section 178 of the Act at its meeting held on 29th June, 2015. The present constitution of the Stakeholders’ Relationship Committee is as follows:
Name of the director Designation in the committee
Mr. Ranjal Laxmana Shenoy Chairman
Mr. Dhananjay Kumar Singh Member
Mr. Sandeep Singh Member
Mr. Mangaldas Chhaganlal Shah Member
Mr. Manish Narang, Senior Vice President - Legal and Company Secretary was appointed as a Compliance Officer of the Company under Regulation 6 of SEBI LODR Regulations, in the meeting of the Board of Directors held on 12th February, 2016.
Terms of reference of Stakeholders’ Relationship Committee
(a) Considering and resolving the grievances of security holders of the Company, including complaints related to transfer of shares, non-receipt of Annual Reports, non-receipt of declared dividends, Annual Reports of the Company or any other documents or information to be sent by the Company to its shareholders etc.
(b) Investigating complaints relating to allotment of shares, approval of transfer or transmission of shares, debentures or any other securities;
(c) Giving effect to all transfer/transmission of shares and debentures, dematerialization of shares and rematerialization of shares, split and issue of duplicate/consolidated share certificates, allotment and listing of shares, buy back of shares, compliance with all the requirements related to shares, debentures and other securities from time to time;
(d) Oversee the performance of the registrars and transfer agents of the Company and to recommend measures for overall improvement in the quality of investor services and also to monitor the implementation and compliance of the code of conduct for prohibition of insider trading pursuant to the SEBI (Prohibition of Insider Trading) Regulations, 2015, and other related matters as may be assigned by the board of directors; and
(e) Carrying out any other function as prescribed under the SEBI LODR Regulations.
Stakeholders’ Relationship Committee Meetings During the year, Stakeholders’ Relationship Committee
met twice on 12th January, 2016 and 11th February, 2016 and the attendance was as under:
Sr No.
Name of the Member No. of meetings
held during
director’s tenure
No. of Meetings Attended
a. Mr. Ranjal Laxmana Shenoy 2 2
b. Mr. Dhananjay Kumar Singh 2 2
c. Mr. Sandeep Singh 2 2
d. Mr. Mangaldas Chhaganlal
Shah
2 2
Investor Complaints During the financial year ended 31st March, 2016, 834
complaints were received from shareholders, out of which 830 complaints were attended/resolved.
(9) GENERAL BODY MEETINGS(i) Location and time of the last three Annual General Meetings (AGM) held are as follows:
Year Meeting Location Date Time Special Resolutions passed
2012-13 39th AGM Alkem House, Senapati Bapat Marg, Lower Parel (W), Mumbai-400013.
30th September, 2013
11.00 A.M. 1. Re-appointment of Mr. Samprada Singh as Whole Time Director designated as Chairman.
2. Re-appointment of Mr. Basudeo N. Singh as Whole Time Director designated as Managing Director.
3. Appointment of Mr. Sarandhar Singh as Director-Marketing & Sales.
4. Appointment of Mr. Srinivas Singh as Director-Marketing & Sales.

ALKEM LABORATORIES LTD.86
Year Meeting Location Date Time Special Resolutions passed
2013-14 40th AGM Alkem House, Senapati Bapat Marg, Lower Parel (W), Mumbai-400013.
18th August, 2014
11.00 A.M. 1. Re-appointment of Mr. Samprada Singh as Whole Time Director designated as Chairman
2. Re-appointment of Mr. Basudeo N. Singh as Whole Time Director designated as Managing Director
2014-15 41st AGM Mayfair Banquets, 254-C, Dr. Annie Besant Road, Worli, Mumbai – 400 030
13th July, 2015 12.00 noon 1. Adoption of new set of Articles of Association of the Company
(ii) Extraordinary General Meeting (EGM) No Extraordinary General Meeting was held during the
financial year.
(iii) Details of Special Resolution passed through postal ballot, the persons who conducted the postal ballot exercise and details of the voting pattern
During the financial year 2015-16, no special resolution has been passed through the exercise of postal ballot, nor is any special resolution proposed to be passed through postal ballot till the date of ensuing AGM to be held on 2nd September, 2016.
(10) MEANS OF COMMUNICATION The Company, from time to time and as may be required,
communicates with its shareholders and investors through multiple channels of communications such as dissemination of information on the on-line portal of the Stock Exchanges, press releases, the Annual Reports and uploading relevant information on its website. The unaudited quarterly results are announced within forty-five days from the end of the quarter. The audited annual results are announced within sixty days from the closure of financial year as required under SEBI LODR Regulations. The aforesaid financial results are communicated to the Stock Exchanges within thirty minutes from the close of Board Meeting at which these were considered and approved. The results are generally published in Business Standard. The Marathi translation of the same is published in Mumbai Lakshadweep, which is a regional daily newspaper.
The audited financial statements form part of the Annual Report which is sent to the Members within the statutory period and well in advance of the Annual General Meeting.
The Annual Report of the Company, the quarterly / half yearly and the yearly financial statements and the press releases of the Company are also disseminated on the Company’s website www.alkemlabs.com and can be downloaded.
The presentations on the performance of the Company are placed on the Company’s website immediately after
these are communicated to the Stock Exchanges for the benefit of the Institutional Investors and analysts and other shareholders. The Company discloses to the Stock Exchanges, all information required to be disclosed under Regulation 30 read with Part A of Schedule III of the SEBI LODR Regulations including material information having a bearing on the performance / operations of the listed entity or other price sensitive information. All information is filed electronically on BSE’s online Portal – BSE Corporate Compliance & Listing Centre (Listing Centre) and on NSE Electronic Application Processing System (NEAPS), on-line portal of The National Stock Exchange of India Limited.
All disclosures made to the stock exchanges are also available on the Company’s website.
Facility has been provided by SEBI for investors to place their complaints / grievances on a centralized web-based complaints redressal system viz. SEBI Complaints Redress System (SCORES). The salient features of this system are: Centralized database of all complaints, online upload of Action Taken Reports (ATRs) by the concerned companies and online viewing by investors of actions taken on the complaint and its current status.
(11) GENERAL SHAREHOLDER INFORMATION (a) The 42nd Annual General Meeting of the
Members of the Company will be held on Friday, 2nd September, 2016 at 10.30 A.M. at Nehru Centre Auditorium, Dr. Annie Besant Road, Worli, Mumbai 400 018.
(b) Financial year: 1st April, 2015 to 31st March, 2016
(c) Dividend payment date First Interim dividend for the financial year 2015-
16 was paid on 28th September, 2015 and the second interim dividend was paid on 23rd March, 2016.
(d) Listing on Stock Exchanges The Company’s shares are listed on the following
Stock Exchanges and the annual listing fees has been paid to each of such Stock Exchanges:

ANNUAL REPORT 2015-16 87
CO
RP
OR
AT
E O
VE
RV
IEW
FIN
AN
CIA
L STAT
EM
EN
TS
STAT
UTO
RY
RE
PO
RT
S
Corporate Governance Report
Name and Address of the
Stock Exchanges
Stock Code/
Scrip
Code
ISIN
for NSDL /
CDSL
(Dematerialized shares)
BSE Limited, Phiroze Jeejeebhoy Towers, Dalal Street, Mumbai 400 001 539523
INE540L01014The National Stock Exchange of India Limited, Exchange Plaza, Bandra-Kurla
Complex, Bandra (East), Mumbai 400 051ALKEM
(e) Market Price data
Month BSE NSE
High Price (`) Low Price (`) Number of
Shares Traded
High Price (`) Low Price (`) Number of
Shares Traded
December 2015 1,544.00 1,355.40 48,28,323 1,543.95 1,356.20 2,12,12,511
January 2016 1,589.00 1,281.25 17,89,640 1,588.90 1,281.00 72,51,470
February 2016 1,429.00 1,232.00 5,40,592 1,430.90 1,227.00 21,16,106
March 2016 1,421.00 1,262.00 2,86,379 1,421.00 1,261.15 14,26,294
(f) Performance in comparison to broad based indices
Month BSE NSE
Alkem share price
(`)
S&P BSE Sensex Alkem share price
(`)
Nifty 50
December 2015 1483.65 26,117.54 1,485.25 7946.35
January 2016 1355.25 24,870.69 1,358.80 7563.55
February 2016 1262.5 23,002.00 1,264.65 6987.05
March 2016 1366.5 25,341.86 1,356.45 7738.4
BSE
Alk
em s
har
e p
rice
(`)
S&P
BSE
Sen
sex
30,000
29,000
28,000
27,000
26,000
25,000
24,000
23,000
22,000
21,000
20,000
1500
1400
1300
1200
1100
1600
1000Dec-15 Jan-16 Feb-16
S&P BSE Sensex Alkem share price
Mar-16
NSE
Alk
em s
har
e p
rice
(`)
Nif
ty 5
0
8,500
8,300
8,100
7,900
7,500
7,300
7,100
7,100
6,900
6,700
6.500
1,500
1,400
1,300
1,200
1,100
1,600
1,000Dec-15 Jan-16 Feb-16
Nifty 50 Alkem share price
Mar-16
(g) Registrar to an issue and share transfer agents: Link Intime India Private Limited, C-13, Pannalal
Silk Mills Compound, L.B.S. Marg, Bhandup (West), Mumbai – 400 078 are Company’s Registrar and Share Transfer Agent and their registration number is INR000004058
(h) Share Transfer System Shares in physical form sent for transfer are
registered and returned by our Registrars and Share Transfer Agents within 15 days of receipt of the documents, provided the documents are found to be in order.
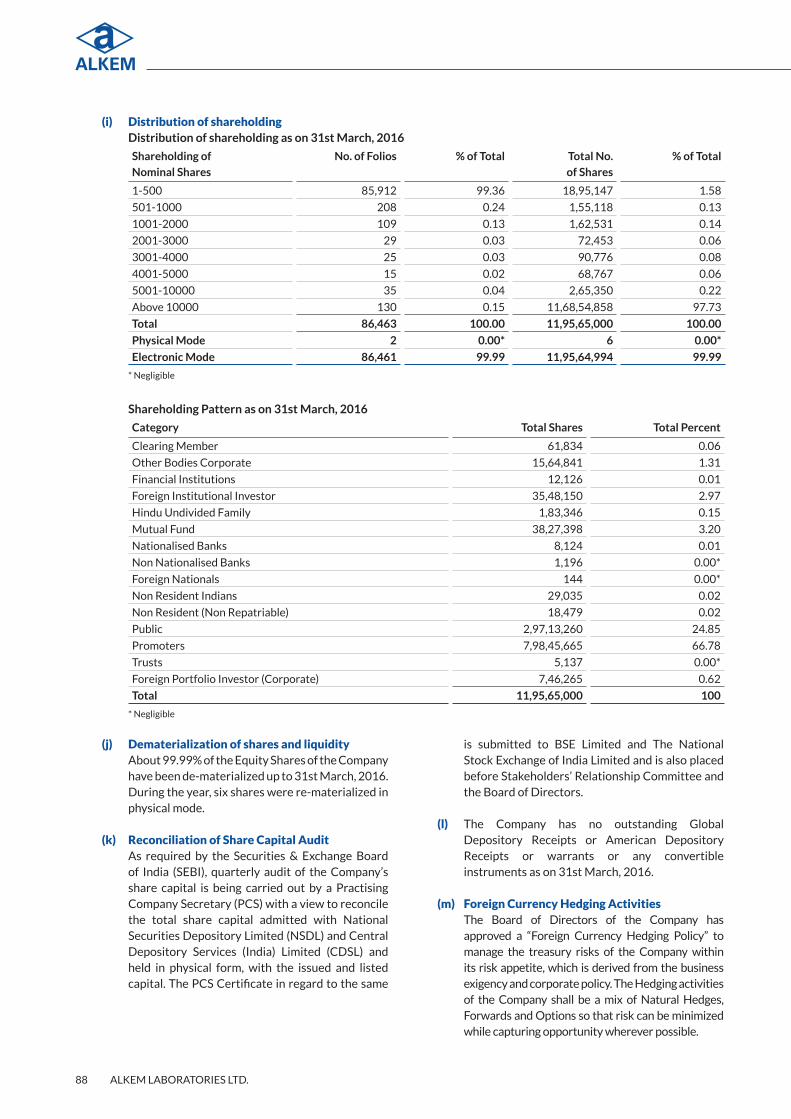
ALKEM LABORATORIES LTD.88
(i) Distribution of shareholding Distribution of shareholding as on 31st March, 2016
Shareholding of
Nominal Shares
No. of Folios % of Total Total No.
of Shares
% of Total
1-500 85,912 99.36 18,95,147 1.58
501-1000 208 0.24 1,55,118 0.13
1001-2000 109 0.13 1,62,531 0.14
2001-3000 29 0.03 72,453 0.06
3001-4000 25 0.03 90,776 0.08
4001-5000 15 0.02 68,767 0.06
5001-10000 35 0.04 2,65,350 0.22
Above 10000 130 0.15 11,68,54,858 97.73
Total 86,463 100.00 11,95,65,000 100.00
Physical Mode 2 0.00* 6 0.00*
Electronic Mode 86,461 99.99 11,95,64,994 99.99
* Negligible
Shareholding Pattern as on 31st March, 2016
Category Total Shares Total Percent
Clearing Member 61,834 0.06
Other Bodies Corporate 15,64,841 1.31
Financial Institutions 12,126 0.01
Foreign Institutional Investor 35,48,150 2.97
Hindu Undivided Family 1,83,346 0.15
Mutual Fund 38,27,398 3.20
Nationalised Banks 8,124 0.01
Non Nationalised Banks 1,196 0.00*
Foreign Nationals 144 0.00*
Non Resident Indians 29,035 0.02
Non Resident (Non Repatriable) 18,479 0.02
Public 2,97,13,260 24.85
Promoters 7,98,45,665 66.78
Trusts 5,137 0.00*
Foreign Portfolio Investor (Corporate) 7,46,265 0.62
Total 11,95,65,000 100
* Negligible
(j) Dematerialization of shares and liquidity About 99.99% of the Equity Shares of the Company
have been de-materialized up to 31st March, 2016. During the year, six shares were re-materialized in physical mode.
(k) Reconciliation of Share Capital Audit As required by the Securities & Exchange Board
of India (SEBI), quarterly audit of the Company’s share capital is being carried out by a Practising Company Secretary (PCS) with a view to reconcile the total share capital admitted with National Securities Depository Limited (NSDL) and Central Depository Services (India) Limited (CDSL) and held in physical form, with the issued and listed capital. The PCS Certificate in regard to the same
is submitted to BSE Limited and The National Stock Exchange of India Limited and is also placed before Stakeholders’ Relationship Committee and the Board of Directors.
(l) The Company has no outstanding Global Depository Receipts or American Depository Receipts or warrants or any convertible instruments as on 31st March, 2016.
(m) Foreign Currency Hedging Activities The Board of Directors of the Company has
approved a “Foreign Currency Hedging Policy” to manage the treasury risks of the Company within its risk appetite, which is derived from the business exigency and corporate policy. The Hedging activities of the Company shall be a mix of Natural Hedges, Forwards and Options so that risk can be minimized while capturing opportunity wherever possible.

ANNUAL REPORT 2015-16 89
CO
RP
OR
AT
E O
VE
RV
IEW
FIN
AN
CIA
L STAT
EM
EN
TS
STAT
UTO
RY
RE
PO
RT
S
Corporate Governance Report
(n) Plant Locations 1. Kachigam, Daman, India. 2. Dabhel, Daman, India. 3. Mandva, Gujarat, India. 4. Ankleshwar, Gujarat, India. 5. Baddi, Himachal Pradesh, India. 6. Kumrek, East Sikkim, India. 7. Samardung, South Sikkim, India. 8. California, U.S.A. 9. Missouri, U.S.A. 10. Indchemie Health Specialities Private Limited,
Somnath, Daman, India. 11. Indchemie Health Specialities Private Limited,
Amaliya, Daman, India. 12. Indchemie Health Specialities Private Limited,
Baddi, Himachal Pradesh, India. 13. Indchemie Health Specialities Private Limited,
Kumrek, East Sikkim, India. 14. Cachet Pharmaceuticals Private Limited, Baddi,
Himachal Pradesh, India.
(o) Address for correspondence Alkem Laboratories Limited, Alkem House,
Senapati Bapat Marg, Lower Parel, Mumbai – 400 013. Tel No: +91 22 3982 9999; Fax No: +91 22 2492 7190
Communication by E-mail: For transfer / transmission / subdivision / demat /
loss of shares / dividend / general inquiries and investor grievance: [email protected]
(12) DISCLOSURES (a) Related Party Transactions The Company has adequate procedures for
purpose of identification and monitoring of related party transactions. All transactions entered into with related parties during the financial year were in the ordinary course of business and on arm’s length pricing basis. There were no transactions with related parties during the financial year which were in conflict with the interest of the Company. All related party transactions are periodically placed before the Audit Committee and the Board for review and approval, as appropriate. The details of related party transactions are discussed in notes to financial statements of this annual report. The policy on related party transaction has been placed on the Company’s website and can be accessed through http://www.alkemlabs.com/admin/Photos/Policies/15915Policy%20on%20Related%20Party%20Transactions.pdf
(b) Strictures and Penalties No strictures or penalties have been imposed on
the Company by the Stock Exchanges or by the
Securities and Exchange Board of India (SEBI) or by any statutory authority on any matters related to capital markets during the last three years.
(c) Whistle Blower Policy The Company requires its Officers and Employees
to observe high standards of business and personal ethics in the conduct of their duties and responsibilities. For this purpose the Board of Directors of the Company has adopted “Whistle Blower Policy” to encourage and enable employees and volunteers of the Company to report any action or suspected action taken within the Company that is illegal, fraudulent or in violation of any adopted policy and to build and strengthen a culture of transparency and trust within the organization. The person making a report of the violation can keep his/her identity anonymous and choose to submit the violation report on a confidential basis. If an individual reasonably believes that a violation has occurred, the individual is encouraged to share his or her questions, concerns, suggestion or complaints to person designated by the Company. Specific telephone number and email ID is mentioned in the Whistle Blower policy. In addition to the above, under exceptional circumstances a complainant can complain directly to the Chairman of the Audit Committee. No personnel of the Company has been denied access to either the Designated Person or to the Audit Committee.
(d) No person in the Senior Management of the Company has reported any material, financial and commercial transaction, where they have any personal interest which may have any potential conflict with the interest of the Company.
(e) The Company has formulated Risk Management Plan and all the directors are informed about risk assessment and minimization procedures.
(f) Subsidiary Companies The Company’s policy on “material subsidiary”
is placed on the Company’s website and can be accessed through weblink http://www.alkemlabs.com/admin/Photos/Policies/1706572046Policy-on-Material-Subsidiary.pdf
(g) The Company does not undertake any Commodity hedging activities.
(13) COMPLIANCE WITH DISCRETIONARY REQUIREMENTS
i. Chairman Emeritus maintains chairperson’s office at the Company’s expense.
ii. Position of Chairman and Managing Director and Chief Executive Officer are separate.

ALKEM LABORATORIES LTD.90
iii. Internal Auditor directly reports to the Audit Committee.
iv. The Company’s financial statement for the financial year ended 31st March, 2016 does not contain any modified audit opinion.
v. Half yearly and quarterly financial statements are published in the newspapers and are also posted on the company’s website.
(14) There are no Equity Shares of the Company in the demat suspense or unclaimed suspense account.
(15) The Company has complied with the requirements specified in Regulations 17 to 27 and clauses B to I of Regulation 46 (2) of the SEBI LODR Regulations.
For and on behalf of the BoardAlkem Laboratories Limited
Samprada SinghChairman Emeritus
DIN: 00760279
Date: 27th May, 2016Place: Mumbai
COMPLIANCE WITH CODE OF BUSINESS CONDUCT AND ETHICS
In accordance with Regulation 26(3) and Schedule V (D) of the SEBI (Listing Obligations and Disclosure Requirements) Regulations, 2015, I hereby declare that the Directors and the Senior Management Personnel of the Company have confirmed compliance with the Code of Business Conduct and Ethics as on 31st March, 2016.
For Alkem Laboratories Limited
Prabhat AgrawalChief Executive Officer
Date: 27th May, 2016Place: Mumbai
CHIEF EXECUTIVE OFFICER (CEO) AND CHIEF FINANCIAL OFFICER (CFO) CERTIFICATION
A. We have reviewed financial statements and the cash flow statement of the Company for the financial year ended 31st March, 2016 and that to the best of our knowledge and belief:
(1) these statements do not contain any materially untrue statement or omit any material fact or contain statements that might be misleading;
(2) these statements together present a true and fair view of the Company’s affairs and are in compliance with existing accounting standards, applicable laws and regulations.
B. There are, to the best of our knowledge and belief, no transactions entered into by Company during the financial year ended 31st March, 2016 which are fraudulent, illegal or violative of the Company’s code of conduct.
C. We accept responsibility for establishing and maintaining internal controls for financial reporting and that we have evaluated the effectiveness of internal control systems of the Company pertaining to financial reporting and we have disclosed to the auditors and the audit committee, deficiencies in the design or operation of such internal controls, if any, of which we are aware and the steps we have taken or propose to take to rectify these deficiencies.
D. We have indicated to the Statutory Auditors and the Audit committee (1) significant changes in internal control over financial reporting during the financial year ended 31st March, 2016; (2) significant changes in accounting policies during the financial year ended 31st March, 2016 and that the same have
been disclosed in the notes to the financial statements; and (3) instances of significant fraud of which we have become aware and the involvement therein, if any, of the management
or an employee having a significant role in the Company’s internal control system over financial reporting.
Date: 27th May, 2016 Prabhat Agrawal Rajesh Dubey
Place: Mumbai Chief Executive Officer Chief Financial Officer

ANNUAL REPORT 2015-16 91
CO
RP
OR
AT
E O
VE
RV
IEW
FIN
AN
CIA
L STAT
EM
EN
TS
STAT
UTO
RY
RE
PO
RT
S
Corporate Governance Report
CERTIFICATE OF COMPLIANCE WITH THE CORPORATE GOVERNANCE REQUIREMENTS UNDER THE SEBI (LISTING OBLIGATIONS AND DISCLOSURE REQUIREMENTS) REGULATIONS, 2015.
To the Members of Alkem Laboratories Limited
We have examined the compliance of conditions of corporate governance by Alkem Laboratories Limited (‘the Company’) for the year ended 31 March, 2016, as stipulated in regulations 17 to 27, clauses (b) to (i) of sub-regulation (2) of regulation 46 and paragraph C, D and E of Schedule V of the SEBI (Listing Obligations and Disclosure Requirements) Regulations, 2015 (“Listing Regulations”) with Stock Exchanges in India.
The compliance of conditions of Corporate Governance is the responsibility of the Company’s management. Our examination was limited to procedures and implementation thereof, adopted by the Company for ensuring the compliance of the conditions of the Corporate Governance. It is neither an audit nor an expression of opinion on the financial statements of the Company.
In our opinion and to the best of our information and according to the explanations given to us, we certify that the Company has complied with the conditions of Corporate Governance as stipulated in the above mentioned Listing regulations.
We further state that such compliance is neither an assurance as to the future viability of the Company nor the efficiency or effectiveness with which the management has conducted the affairs of the Company.
For B S R & Co. LLP Chartered Accountants
Firm’s Registration No: 101248W/ W – 100022
Sadashiv ShettyDate: 27th May, 2016 PartnerPlace: Mumbai Membership No: 048648

Financial Statements 94 Standalone
140 Consolidated
Standalone
94 Independent Auditor’s Report
100 Balance Sheet
101 Statement of Profit and Loss
102 Cash Flow Statement
104 Notes
Consolidated
140 Independent Auditor’s Report
144 Balance Sheet
145 Statement of Profit and Loss
146 Cash Flow Statement
148 Notes

ALKEM LABORATORIES LTD.94
Independent Auditor’s Report
The Members ofAlkem Laboratories LimitedREPORT ON THE STANDALONE FINANCIAL STATEMENTSWe have audited the accompanying standalone financial statements of Alkem Laboratories Limited (“the Company”), which comprise the Balance Sheet as at 31 March 2016, the Statement of Profit and Loss, the Cash Flow Statement for the year then ended, and a summary of the significant accounting policies and other explanatory information.
MANAGEMENT’S RESPONSIBILITY FOR THE STANDALONE FINANCIAL STATEMENTSThe Company’s Board of Directors is responsible for the matters stated in Section 134(5) of the Companies Act, 2013 (“the Act”) with respect to the preparation of these standalone financial statements that give a true and fair view of the financial position, financial performance and cash flows of the Company in accordance with the accounting principles generally accepted in India, including the Accounting Standards specified under Section 133 of the Act, read with Rule 7 of the Companies (Accounts) Rules, 2014. This responsibility also includes maintenance of adequate accounting records in accordance with the provisions of the Act for safeguarding the assets of the Company and for preventing and detecting frauds and other irregularities; selection and application of appropriate accounting policies; making judgments and estimates that are reasonable and prudent; and design, implementation and maintenance of adequate internal financial controls, that were operating effectively for ensuring the accuracy and completeness of the accounting records, relevant to the preparation and presentation of the financial statements that give a true and fair view and are free from material misstatement, whether due to fraud or error.
AUDITOR’S RESPONSIBILITYOur responsibility is to express an opinion on these standalone financial statements based on our audit.
We have taken into account the provisions of the Act, the accounting and auditing standards and matters which are required to be included in the audit report under the provisions of the Act and the Rules made thereunder.
We conducted our audit in accordance with the Standards on Auditing specified under Section 143(10) of the Act. Those Standards require that we comply with ethical requirements and plan and perform the audit to obtain reasonable assurance about whether the financial statements are free from material misstatement.
An audit involves performing procedures to obtain audit evidence about the amounts and the disclosures in the financial statements. The procedures selected depend on the auditor’s judgment, including the assessment of the risks of material misstatement of the financial statements, whether due to fraud or error. In making those risk assessments, the auditor considers internal financial control relevant to the Company’s preparation of the financial statements that give a true and fair view in order to design audit procedures that are appropriate in the circumstances. An audit also includes evaluating the appropriateness of the accounting policies used and the reasonableness of the accounting estimates made by the Company’s Directors, as well as evaluating the overall presentation of the financial statements.
We believe that the audit evidence we have obtained is sufficient and appropriate to provide a basis for our audit opinion on the standalone financial statements.
OPINIONIn our opinion and to the best of our information and according to the explanations given to us, the aforesaid standalone financial statements give the information required by the Act in the manner so required and give a true and fair view in conformity with the accounting principles generally accepted in India, of the state of affairs of the Company as at 31 March, 2016, and its profit and cash flows for the year ended on that date.
REPORT ON OTHER LEGAL AND REGULATORY REQUIREMENTS1. As required by the Companies (Auditor’s Report) Order,
2016 (“the Order”), issued by the Central Government of India in terms of sub-section (11) of Section 143 of the Act, we give in the “Annexure A” a statement on the matters specified in paragraphs 3 and 4 of the Order, to the extent applicable.
2. As required by Section 143 (3) of the Act, we report that:
(a) We have sought and obtained all the information and explanations which to the best of our knowledge and belief were necessary for the purposes of our audit.
(b) In our opinion, proper books of account as required by law have been kept by the Company so far as it appears from our examination of those books.
(c) The Balance Sheet, the Statement of Profit and Loss, and the Cash Flow Statement dealt with by this Report are in agreement with the books of account.

ANNUAL REPORT 2015-16 95
Standalone Financial Statements
CO
RP
OR
AT
E O
VE
RV
IEW
FIN
AN
CIA
L STAT
EM
EN
TS
STAT
UTO
RY
RE
PO
RT
S
(d) In our opinion, the aforesaid standalone financial statements comply with the Accounting Standards specified under Section 133 of the Act, read with Rule 7 of the Companies (Accounts) Rules, 2014.
(e) On the basis of the written representations received from the directors as on 31 March, 2016 taken on record by the Board of Directors, none of the directors is disqualified as on 31 March, 2016 from being appointed as a director in terms of Section 164 (2) of the Act.
(f) With respect to the adequacy of the internal financial controls over financial reporting of the Company and the operating effectiveness of such controls, refer to our separate Report in “Annexure B”.
(g) With respect to the other matters to be included in the Auditor’s Report in accordance with Rule 11 of the Companies (Audit and Auditors) Rules, 2014, in our opinion and to the best of our information and according to the explanations given to us:
i. The Company has disclosed the impact of pending litigations on its financial position in its financial statements – Refer Note 2.27(a)(1) to the standalone financial statements;
ii. The Company did not have any long-term contracts including derivative contracts for which there were any material foreseeable losses.
iii. There were no amounts which were required to be transferred to the Investor Education and Protection Fund by the Company during the year ended 31 March 2016.
For B S R & Co. LLP
Chartered Accountants
Firm’s Registration No: 101248W/W-100022
Sadashiv Shetty
Mumbai Partner
27 May 2016 Membership No: 048648

ALKEM LABORATORIES LTD.96
(i) (a) The Company has maintained proper records showing full particulars, including quantitative details and situation of fixed assets.
(b) The Company has a regular programme of physical verification of its fixed assets by which fixed assets are verified in a phased manner over a period of three years. In accordance with this programme, certain fixed assets were verified during the year and no material discrepancies were noticed on such verification. In our opinion, this periodicity of physical verification is reasonable having regard to the size of the Company and the nature of its assets.
(c) According to the information and explanations given to us and on the basis of our examination of the records of the Company, the title deeds of immovable properties, as disclosed in Note 2.10 to the financial statements, are held in the name of the Company, except for the following:
Particulars Freehold Land
Building
Number of cases 2 5
Gross block
as at 31 March 2016
(` In million)
22.2 705.9
Net block
as at 31 March 2016
(` In million)
22.2 604.7
(ii) The inventory, except goods-in-transit, has been physically verified by the management during the year. For inventory lying with third parties at the year-end, written confirmations have been obtained. In our opinion, the frequency of such verification is reasonable. The discrepancies noticed on verification between the physical stocks and the book records were not material.
(iii) According to the information and explanations given to us, the Company has not granted any loans, secured or unsecured, to companies, firms, limited liability partnerships or other parties covered in the register maintained under Section 189 of the Act. Accordingly, paragraphs 3 (iii) (a), (b) and (c) of the Order are not applicable to the Company.
(iv) In our opinion and according to the information and explanations given to us, the Company has not granted
Annexure - A
any loans, or provided any guarantees or security to the parties covered under Section 185 of the Act during the year. The Company has complied with the provisions of Section 186 of the Act, with respect to the investments made and securities given in respect of loan taken by the subsidiaries.
(v) According to the information and explanations given to us, the Company has not accepted any deposits from the public. Accordingly, paragraph 3(v) of the Order is not applicable to the Company.
(vi) We have broadly reviewed the records maintained by the Company pursuant to the rules prescribed by the Central Government for maintenance of cost records under sub-section 1 of section 148 of the Act and are of the opinion that prima facie, the prescribed accounts and records have been made and maintained. However, we have not made a detailed examination of the records.
(vii) (a) According to the information and explanations given to us and on the basis of our examination of the records of the Company, amounts deducted/accrued in the books of account in respect of undisputed statutory dues including provident fund, employees’ state insurance, income-tax, sales-tax, service tax, duty of customs, duty of excise, value added tax, cess and other material statutory dues have been generally regularly deposited during the year by the Company with the appropriate authorities.
According to the information and explanations given to us, no undisputed amounts payable in respect of provident fund, employees’ state insurance, income- tax, sales-tax, service tax, duty of customs, duty of excise, value added tax, cess and other material statutory dues were in arrears as at 31 March 2016 for a period of more than six months from the date they became payable.
(b) According to the information and explanations given to us, there are no dues of income-tax, sales tax, service tax, duty of customs, duty of excise and value added tax as at 31 March 2016 which have not been deposited with the appropriate authorities on account of any dispute other than those mentioned in Enclosure I to this report.
(viii) In our opinion and according to the information and explanations given to us, the Company has not
to the Independent Auditors’ Report – 31 March 2016(Referred to in our report of even date)

ANNUAL REPORT 2015-16 97
Standalone Financial Statements
CO
RP
OR
AT
E O
VE
RV
IEW
FIN
AN
CIA
L STAT
EM
EN
TS
STAT
UTO
RY
RE
PO
RT
S
defaulted in repayment of dues to its bankers. The Company does not have any loans or borrowings from financial institutions or Government, nor has it issued any debentures during the year.
(ix) The Company has completed the Initial Public Offering (IPO) through an offer for sale of equity share by the existing shareholders during the year. Accordingly the Company has not raised any money by way of initial public offer or further public offer (including debt instruments) and term loans during the year. And therefore paragraph 3(ix) of the Order is not applicable to the Company.
(x) According to the information and explanations given to us, no material fraud by the Company or on the Company by its officers or employees has been noticed or reported during the course of our audit.
(xi) According to the information and explanations given to us and based on our examination of the records of the Company, the Company has paid/provided for managerial remuneration in accordance with the requisite approvals mandated by the provisions of Section 197 read with Schedule V to the Act.
(xii) In our opinion and according to the information and explanations given to us, the Company is not a Nidhi company. Accordingly, paragraph 3(xii) of the Order is not applicable to the Company.
(xiii) According to the information and explanations given to us and based on our examination of the records of the Company, transactions with the related parties are in compliance with the provisions of Sections 177 and 188 of the Act where applicable. The details of such
related party transactions have been disclosed in the financial statements as required under Accounting Standard (AS) 18, Related Party Disclosures specified under Section 133 of the Act, read with Rule 7 of the Companies (Accounts) Rules, 2014.
(xiv) According to the information and explanations given to us and based on our examination of the records of the Company, the Company has not made any preferential allotment or private placement of shares or fully or partly convertible debentures during the year. Accordingly, paragraph 3(xiv) of the Order is not applicable to the Company.
(xv) According to the information and explanations given to us and based on our examination of the records of the Company, the Company has not entered into any non-cash transactions with directors or persons connected with them. Accordingly, paragraph 3(xv) of the Order is not applicable to the Company.
(xvi) In our opinion and according to the information and explanations given to us, the Company is not required to be registered under Section 45-IA of the Reserve Bank of India Act, 1934. Accordingly, paragraph 3(xvi) of the Order is not applicable to the Company.
For B S R & Co. LLP
Chartered Accountants
Firm’s Registration No: 101248W/W-100022
Sadashiv Shetty
Mumbai Partner
27 May 2016 Membership No: 048648

ALKEM LABORATORIES LTD.98
Enclosure I to Annexure A to the Independent Auditors’ Report – 31 March 2016
Name of the Statute Nature of dues Amount under
dispute (` in millions)
Amount paid under
protest (` in millions)
Financial year / year (s)
Forum where dispute is
pending
Central Excise Act, 1944 Excise Duty
and Penalty
60.2 14.5 2003-2014 CESTAT
Central Excise Act, 1944 Excise Duty
and Penalty
2.2 0.2 2010-2016 Commissioner of Central
Excise (Appeals)Maharashtra VAT Act, 2002 Value Added
Tax
6.4 3.5 2003-2005 Appellate Tribunal
Maharashtra VAT Act, 2002 Value Added
Tax
283.2 4.1 2005-2011 Joint Commissioner of
Sales Tax (Appeals)West Bengal VAT Act, 2003 Value Added
Tax
9.0 1.3 2010-2013 Senior Joint Commissioner
of Commercial TaxBihar VAT Act, 2005 Value Added
Tax
71.0 14.8 2010-2012 Joint commissioner
Commercial Taxes (Appeals)Uttar Pradesh VAT Act, 2008 Value Added
Tax
1.7 0.4 2012-2013 Commercial Tax Tribunal,
LucknowOdisha VAT Act, 2004 Value Added
Tax
0.5 0.0 * 2012-2014 Commissioner of
Commercial TaxesGujarat VAT Act, 2003 Value Added
Tax
0.1 - 2006-2007 Deputy Commissioner of
Commercial Tax (Appeal)Odisha Entry Tax Act, 1999 Entry Tax 0.2 0.0 ** 2012-2014 Commissioner of
Commercial TaxesCentral Sales Tax Act, 1956 Central Sales
Tax
349.7 0.1 2009-2011 Joint Commissioner of
Sales Tax (Appeals)Central Sales Tax Act, 1956 Central Sales
Tax
372.5 55.9 2012-2013 Senior Joint Commissioner
of Commercial TaxCentral Sales Tax Act, 1956 Central Sales
Tax
0.4 0.0 *** 2012-2014 Commissioner of
Commercial TaxesIncome Tax Act, 1961 Income Tax 6.1 - 2001-2012 Commissioner of Income
Tax (Appeal)
* ` 34,961
** ` 10,130
*** ` 25,254
Annexure - BTo the Independent Auditor’s Report – 31 March 2016 on Standalone Financial Statements
REPORT ON THE INTERNAL FINANCIAL CONTROLS UNDER CLAUSE (i) OF SUB-SECTION 3 OF SECTION 143 OF THE COMPANIES ACT, 2013 (“THE ACT”)We have audited the internal financial controls over financial reporting of Alkem Laboratories Limited (“the Company”) as of March 31, 2016 in conjunction with our audit of the standalone financial statements of the Company for the year ended on that date.
MANAGEMENT’S RESPONSIBILITY FOR INTERNAL FINANCIAL CONTROLSThe Company’s management is responsible for establishing and maintaining internal financial controls based on the internal control over financial reporting criteria established by the Company considering the essential components of internal control stated in the “Guidance Note on Audit
of Internal Financial Controls Over Financial Reporting issued by the Institute of Chartered Accountants of India”. These responsibilities include the design, implementation and maintenance of adequate internal financial controls that were operating effectively for ensuring the orderly and efficient conduct of its business, including adherence to company’s policies, the safeguarding of its assets, the prevention and detection of frauds and errors, the accuracy and completeness of the accounting records, and the timely preparation of reliable financial information, as required under the Companies Act, 2013.
AUDITORS’ RESPONSIBILITYOur responsibility is to express an opinion on the Company’s internal financial controls over financial reporting based on our audit. We conducted our audit in accordance with the

ANNUAL REPORT 2015-16 99
Standalone Financial Statements
CO
RP
OR
AT
E O
VE
RV
IEW
FIN
AN
CIA
L STAT
EM
EN
TS
STAT
UTO
RY
RE
PO
RT
S
assets of the company; (2) provide reasonable assurance that transactions are recorded as necessary to permit preparation of financial statements in accordance with generally accepted accounting principles, and that receipts and expenditures of the company are being made only in accordance with authorisations of management and directors of the company; and (3) provide reasonable assurance regarding prevention or timely detection of unauthorised acquisition, use, or disposition of the company’s assets that could have a material effect on the financial statements.
INHERENT LIMITATIONS OF INTERNAL FINANCIAL CONTROLS OVER FINANCIAL REPORTINGBecause of the inherent limitations of internal financial controls over financial reporting, including the possibility of collusion or improper management override of controls, material misstatements due to error or fraud may occur and not be detected. Also, projections of any evaluation of the internal financial controls over financial reporting to future periods are subject to the risk that the internal financial control over financial reporting may become inadequate because of changes in conditions, or that the degree of compliance with the policies or procedures may deteriorate.
OPINIONIn our opinion, the Company has, in all material respects, an adequate internal financial controls system over financial reporting and such internal financial controls over financial reporting were operating effectively as at 31 March 2016, based on the internal control over financial reporting criteria established by the Company considering the essential components of internal control stated in the Guidance Note on Audit of Internal Financial Controls Over Financial Reporting issued by the Institute of Chartered Accountants of India.
For B S R & Co. LLP
Chartered Accountants
Firm’s Registration No: 101248W/W-100022
Sadashiv Shetty
Mumbai Partner
27 May 2016 Membership No: 048648
Guidance Note on Audit of Internal Financial Controls Over Financial Reporting (the “Guidance Note”) and the Standards on Auditing, issued by ICAI and deemed to be prescribed under Section 143(10) of the Companies Act, 2013, to the extent applicable to an audit of internal financial controls, both applicable to an audit of Internal Financial Controls and, both issued by the Institute of Chartered Accountants of India. Those Standards and the Guidance Note require that we comply with ethical requirements and plan and perform the audit to obtain reasonable assurance about whether adequate internal financial controls over financial reporting was established and maintained and if such controls operated effectively in all material respects.
Our audit involves performing procedures to obtain audit evidence about the adequacy of the internal financial controls system over financial reporting and their operating effectiveness. Our audit of internal financial controls over financial reporting included obtaining an understanding of internal financial controls over financial reporting, assessing the risk that a material weakness exists, and testing and evaluating the design and operating effectiveness of internal control based on the assessed risk. The procedures selected depend on the auditor’s judgement, including the assessment of the risks of material misstatement of the financial statements, whether due to fraud or error.
We believe that the audit evidence we have obtained is sufficient and appropriate to provide a basis for our audit opinion on the Company’s internal financial controls system over financial reporting.
MEANING OF INTERNAL FINANCIAL CONTROLS OVER FINANCIAL REPORTINGA company’s internal financial control over financial reporting is a process designed to provide reasonable assurance regarding the reliability of financial reporting and the preparation of financial statements for external purposes in accordance with generally accepted accounting principles. A company’s internal financial control over financial reporting includes those policies and procedures that (1) pertain to the maintenance of records that, in reasonable detail, accurately and fairly reflect the transactions and dispositions of the

ALKEM LABORATORIES LTD.100
(` in million)
Particulars Note No. As At 31 March 2016
As At 31 March 2015
EQUITY AND LIABILITIESShareholders' Funds Share Capital 2.1 239.1 239.1 Reserves and surplus 2.2 35,327.9 30,771.1
35,567.0 31,010.2Deferred Government Grant 31.0 35.8Non-Current Liabilities Long-term borrowings 2.3 - 281.3 Deferred tax liabilities (net) 2.4 759.2 685.1 Long-term provisions 2.5 659.7 565.1
1,418.9 1,531.5Current Liabilities Short-term borrowings 2.6 3,506.2 10,462.8 Trade payables 2.7 Dues to Micro and Small Enterprises 240.2 27.6 Dues to Others 4,424.8 3,437.7 Other current liabilities 2.8 2,448.9 1,435.9 Short-term provisions 2.9 896.3 666.5
11,516.4 16,030.5Total 48,533.3 48,608.0
ASSETSNon-Current Assets Fixed assets 2.10 Tangible assets 8,470.8 8,382.1 Intangible assets 276.1 322.5 Capital work-in-progress 1,465.5 958.9 Non-current investments 2.11 8,767.1 10,106.5 Long-term loans and advances 2.13 7,637.7 6,463.9 Other non-current assets 2.14 1,859.7 4,601.2
28,476.9 30,835.1Current Assets Current investments 2.12 1,944.2 599.1 Inventories 2.15 5,900.3 5,482.4 Trade receivables 2.16 4,804.4 3,750.1 Cash and bank balances 2.17 5,240.3 6,333.2 Short-term loans and advances 2.18 1,368.9 1,194.7 Other current assets 2.19 798.3 413.4
20,056.4 17,772.9Total 48,533.3 48,608.0Significant Accounting Policies 1Notes to The Financial Statements 2
The accompanying notes are an integral part of these financial statements
Balance Sheetas at 31st March, 2016
As per our report of even date attached, For and on behalf of the Board of Directors of Alkem Laboratories Limited CIN: U00305MH1973PLC174201
For B S R & Co. LLP Samprada Singh B.N. Singh D.K.SinghChartered Accountants Chairman Emeritus Executive Chairman Joint Managing DirectorFirm’s Registration No. 101248W/W-100022 DIN No.00760279 DIN No.00760310 DIN No.00739153
Sandeep Singh B.P. Singh M.K. SinghSadashiv Shetty Joint Managing Director Director DirectorPartner DIN No.01277984 DIN No.00739856 DIN No.00881412
Membership No. 048648 Prabhat Agrawal Rajesh Dubey Manish NarangChief Executive Officer Chief Financial Officer Sr.VP - Legal & Company Secretary
Mumbai P.V.Damodaran Mumbai
Date : 27 May, 2016 VP - Business Finance Date : 27 May, 2016

ANNUAL REPORT 2015-16 101
Standalone Financial Statements
CO
RP
OR
AT
E O
VE
RV
IEW
FIN
AN
CIA
L STAT
EM
EN
TS
STAT
UTO
RY
RE
PO
RT
S
Statement of Profit and Lossfor the year ended 31st March, 2016
(` in million)
Particulars Note No. For the year ended 31 March 2016
For the year ended 31 March 2015
INCOME:Revenue from operations (Gross) 2.20 40,633.0 32,540.7
Less: Excise Duty 1,386.1 1,165.1
Revenue from operations (Net) 39,246.9 31,375.6
Other income 2.21 1,605.2 1,821.3
Total revenue 40,852.1 33,196.9
EXPENSES:Cost of materials consumed 2.22 9,705.3 8,541.1
Purchases of stock-in-trade (Refer Note 2.40(a)) 6,119.4 5,563.5
Changes in inventories of finished goods, work-in-progress and stock-
in-trade2.23 (340.6) (116.2)
Employee benefits expense 2.24 6,816.2 5,605.8
Finance costs 2.25 533.0 726.3
Depreciation and amortisation 2.10 735.3 596.8
Other expenses 2.26 9,823.9 8,326.3
Total expenses 33,392.5 29,243.6
Profit before tax 7,459.6 3,953.3
TAX EXPENSE:Current tax 1,610.0 790.0
Minimum Alternate Tax (MAT) credit entitlement (1,443.0) (790.0)
MAT entitlement credit of earlier years written off (Refer Note 2.44) 834.1 175.1
Tax for the earlier years - 25.3
Deferred tax charge 74.1 76.0
Total tax expense 1,075.2 276.4
Profit after tax for the year 6,384.4 3,676.9
Earnings per equity share (in `): Face Value of ` 2 each (Refer Note 2.34)
Basic 53.40 30.75
Diluted 53.40 30.75
Significant Accounting Policies 1
Notes to The Financial Statements 2
The accompanying notes are an integral part of these financial statements
As per our report of even date attached, For and on behalf of the Board of Directors of Alkem Laboratories Limited CIN: U00305MH1973PLC174201
For B S R & Co. LLP Samprada Singh B.N. Singh D.K.SinghChartered Accountants Chairman Emeritus Executive Chairman Joint Managing DirectorFirm’s Registration No. 101248W/W-100022 DIN No.00760279 DIN No.00760310 DIN No.00739153
Sandeep Singh B.P. Singh M.K. SinghSadashiv Shetty Joint Managing Director Director DirectorPartner DIN No.01277984 DIN No.00739856 DIN No.00881412
Membership No. 048648 Prabhat Agrawal Rajesh Dubey Manish NarangChief Executive Officer Chief Financial Officer Sr.VP - Legal & Company Secretary
Mumbai P.V.Damodaran Mumbai
Date : 27 May, 2016 VP - Business Finance Date : 27 May, 2016

ALKEM LABORATORIES LTD.102 ALKEM LABORATORIES LTD.102
Cash Flow Statementfor the year ended 31st March, 2016
(` in million)
Particulars For the year ended 31 March 2016
For the year ended 31 March 2015
A. CASH FLOW FROM OPERATING ACTIVITIES:Profit before tax 7,459.6 3,953.3
Adjustment for:Depreciation and amortisation 735.3 596.8
Provision for diminution in value of investments (7.5) (16.4)
Profit on sale of investments (net) (18.2) (152.2)
Loss on sale of fixed assets (net) 113.3 49.3
Dividend income (8.3) (3.1)
Income from investment in funds (102.0) (283.2)
Interest income (1,236.8) (1,332.2)
Interest expenses 533.0 726.3
Bad Debts/Advances written off 119.2 84.3
Provision for doubtful debts 147.4 4.3
Government grant (amortised)/received (4.8) 35.8
Unrealised foreign currency (gain)/loss on revaluation (net) (0.3) 0.1
Rent and compensation received (27.4) (34.2)
Subtotal of Adjustments 242.9 (324.4)
Operating profit before working capital changes 7,702.5 3,628.9
Changes in working capital:
Increase in trade receivables (1,291.6) (870.0)
Increase in loans and advances and other current assets (745.1) (362.9)
Increase in inventories (417.9) (436.8)
Increase in trade payable and other liabilities 2,195.8 806.4
Increase in provisions 325.2 706.2
Subtotal of Adjustments 66.4 (157.0)
Cash generated from operations 7,768.9 3,471.9
Less: Direct taxes paid (net of refund) 1,470.8 1,056.4
Net cash generated from operating activities 6,298.1 2,415.5
B CASH FLOW FROM INVESTING ACTIVITIES:Purchases of fixed assets (1,706.3) (1,330.3)
Sale of fixed assets 33.4 27.9
Proceeds from investments (net) 327.0 1,017.9
Proceeds from real estate fund 389.2 510.5
Investments in subsidiaries (net of refund of share application money
received)
(594.2) (2,382.5)
Redemption/(investments) of bank deposits having maturity of more than 3
months
3,142.5 (1,405.9)
Dividend received 8.3 3.1
Interest received 1,481.1 926.4
Rent received 27.4 34.1
Net Cash generated from/(used in) investing activities 3,108.4 (2,598.7)

ANNUAL REPORT 2015-16 103
Standalone Financial Statements
CO
RP
OR
AT
E O
VE
RV
IEW
FIN
AN
CIA
L STAT
EM
EN
TS
STAT
UTO
RY
RE
PO
RT
SC
OR
PO
RA
TE
OV
ER
VIE
WF
INA
NC
IAL STA
TE
ME
NT
SSTA
TU
TOR
Y R
EP
OR
TS
ANNUAL REPORT 2015-16 103
(` in million)
Particulars For the year ended 31 March 2016
For the year ended 31 March 2015
C CASH FLOW FROM FINANCING ACTIVITIES:Repayment towards long-term borrowings (net) (264.5) (456.1)
(Repayment)/proceeds from short-term borrowings (net) (6,956.6) 2,010.6
Dividends and corporate dividend tax paid (1,827.0) (566.8)
Interest paid (533.5) (728.2)
Net cash (used in)/generated from financing activities (9,581.6) 259.5
D NET (DECREASE)/INCREASE IN CASH AND CASH EQUIVALENTS (A+B+C)
(175.1) 76.3
E CASH AND CASH EQUIVALENTS AS AT BEGINNING OF THE YEAR 249.5 173.0
Add: Effect of exchange differences on cash and cash equivalents held in
foreign currency
0.3 0.2
F CASH AND CASH EQUIVALENTS AS AT END OF THE YEAR (D+E) 74.7 249.5
Notes:1. Cash and cash equivalents include:
Cash on hand 3.9 6.9
Cheques on hand 57.1 58.6
Balance with banks 13.7 184.0
Total cash and cash equivalents 74.7 249.5
Notes: The above Cash Flow Statement has been prepared under the “Indirect Method” as set out in the Accounting Standard (AS-3) on Cash Flow Statement.
Cash Flow Statementfor the year ended 31st March, 2016
As per our report of even date attached, For and on behalf of the Board of Directors of Alkem Laboratories Limited CIN: U00305MH1973PLC174201
For B S R & Co. LLP Samprada Singh B.N. Singh D.K.SinghChartered Accountants Chairman Emeritus Executive Chairman Joint Managing DirectorFirm’s Registration No. 101248W/W-100022 DIN No.00760279 DIN No.00760310 DIN No.00739153
Sandeep Singh B.P. Singh M.K. SinghSadashiv Shetty Joint Managing Director Director DirectorPartner DIN No.01277984 DIN No.00739856 DIN No.00881412
Membership No. 048648 Prabhat Agrawal Rajesh Dubey Manish NarangChief Executive Officer Chief Financial Officer Sr.VP - Legal & Company Secretary
Mumbai P.V.Damodaran Mumbai
Date : 27 May, 2016 VP - Business Finance Date : 27 May, 2016

ALKEM LABORATORIES LTD.104
Notesto the Standalone Financial Statements
NOTE-1: SIGNIFICANT ACCOUNTING POLICIES: 1.1 Basis of preparation of Financial Statements:” The accompanying financial statements have been
prepared in compliance with the requirements of section 133 of the Companies Act, 2013 (to the extent notified), read with Rule 7 of the Companies (Accounts) Rules, 2014, and other generally accepted accounting principles (GAAP) in India, to the extent applicable, under the historical cost convention, on the accrual basis of accounting. GAAP comprises mandatory accounting standards as specified in the Companies (Accounting Standards) Rules, 2006. The accounting policies adopted in preparation of the financial statement are consistent with those followed in the previous year unless otherwise stated.The Financial statement are prepared in Indian rupees rounded off to the nearest million. Operating Cycle:
Operating cycle is the time between the acquisition of assets for processing and their realisation in cash or cash equivalence.”
1.2 Use of Estimates: The preparation of financial statements in
conformity with Generally Accepted Accounting Principles (GAAP) requires management to make judgments, estimates and assumptions that affects the application of accounting policies and reported amounts of assets, liabilities, income and expenses and the disclosure of contingent liabilities on the date of the financial statements. Actual results could differ from those estimates. Estimates and underlying assumptions are reviewed on an on going basis. Any revision to accounting estimates is recognised prospectively in current and future periods.
1.3 Tangible Fixed Assets a) Tangible Fixed Assets are carried at cost less
accumulated depreciation and impairment losses, if any. The cost of an item of tangible fixed assets comprises its purchase price, including import duties and other non refundable taxes or levies and any directly attributable cost of bringing the assets to its working condition for its intended use and any trade discount and rebates are deducted in arriving at purchase price. Cost of the assets also includes interest on borrowings attributable to acquisition of qualifying fixed assets up to the date the asset is ready for its intended use and other incidental expenses
incurred up to that date. Exchange differences arising on restatement / settlement of long-term foreign currency borrowings relating to acquisition of depreciable fixed assets are adjusted to the cost of the respective assets and depreciated over the remaining useful life of such assets. Subsequent expenditure relating to fixed assets is capitalised only if such expenditure results in an increase in the future benefits from such asset beyond its previously assessed standard of performance.
b) Cost of tangible fixed assets not ready for intended use as on the balance sheet date, is disclosed as capital work in progress. Advances given towards acquisition of fixed assets outstanding at each balance sheet date are disclosed as Capital Advance under Long Term Loans and Advances.”
1.4 Intangible Assets: Intangible assets are recognised only if it is
probable that the future economic benefits that are attributable to the assets will flow to the enterprise and the cost of the assets can be measured reliably. The intangible assets are recorded at cost and are carried at cost less accumulated amortisation and accumulated impairment losses, if any.
1.5 Depreciation and Amortisation: Depreciation is provided on a straight line basis
for all assets. Depreciation is provided based on the useful life of assets. Pursuant to Schedule II of Companies Act, 2013, the remaining useful life has been revised wherever appropriate based on an evaluation by an independent valuer. The carrying amount as on April 01, 2014 is depreciated over the revised remaining useful life. Wherever the remaining useful life of the asset is NIL as per Schedule II, the carrying amount as on 1st April, 2014 is recognised in the Statement of Profit and Loss during the previous year ended 31 March 2015
Tangible Assets Useful Life
Leasehold Land Amortized over the period
of Lease
Buildings 5 Years to 59 Years
Plant and Machinery 1 Years to 20 Years
Furniture and Fixtures 10 Years
Vehicles 8 Years
Office Equipments 3 Years to 6 Years

CO
RP
OR
AT
E O
VE
RV
IEW
FIN
AN
CIA
L STAT
EM
EN
TS
STAT
UTO
RY
RE
PO
RT
S
ANNUAL REPORT 2015-16 105
Notesto the Standalone Financial Statements
Standalone Financial Statements
Intangible Assets Useful Life
Computer Software 3 Year to 6 Years
Trade Marks & Patents 5 Years
1.6 Impairment of Assets: In accordance with AS 28 on ‘Impairment of assets’,
the Company assesses at each balance sheet date, whether there is any indication that an asset may be impaired. If any such indication exists, the Company estimates the recoverable amount of the asset. The recoverable amount of the assets (or where applicable that of the cash generating unit to which the asset belongs) is estimated as the higher of its net selling price and its value in use. Value in use is the present value of estimated future cash flows expected to arise from the continuing use of the assets and from its disposal at the end of its useful life. An impairment loss is recognised whenever the carrying amount of an asset or the cash-generating unit to which it belongs, exceeds it recoverable amount. Impairment loss is recognised in the Statement of profit and loss or against revaluation surplus, where applicable. If at the balance sheet date, there is an indication that a previously assessed impairment loss no longer exists, the recoverable amount is re-assessed and the asset is reflected at the recoverable amount subject to a maximum of the depreciated historical cost.
1.7 Operating Leases Assets taken/given on lease under which all risks
and rewards of ownership are effectively retained by the lessor are classified as operating lease. Lease payments/receipts under operating leases are recognised as expenses/income on straight line basis over the primary period of lease in accordance with the respective lease agreements.
1.8 Investments: Long-Term investments are stated at cost which
includes cost of acquisition and related expenses. Investments in equity/ordinary shares in foreign currency are stated at cost by converting at exchange rate prevailing at the time of acquisition. Provision for diminution in the value of long-term investments is made only if such decline is other than temporary. Current Investments are carried at lower of cost and fair value. Investments are classified into current and non-current investments. Investments that are readily realisable and are intended to be held for not more than one year from the date on which such
investments are made, are classified as “Current investments”. All other investments are classified as “Non-current investments”. Investment in land and buildings that are not intended to be occupied substantially for use by, or in the operations of the Company, have been classified as investment property. Investment properties are carried at cost less accumulated depreciation and accumulated impairment losses, if any. Depreciation on the building component of the investment property is provided in line with the policy on tangible assets.
1.9 Inventories: a) Raw Materials and Packing Materials are
valued at lower of cost and net realisable value; cost is calculated on moving weighted average basis.
b) Finished Goods and Work–in–Progress are valued at lower of cost and net realisable value. In respect of finished goods, cost includes materials, appropriate share of utilities, other overheads and applicable excise duty. Trading Goods are valued at lower of cost (on Moving weighted average basis) and net realisable value. Cost of inventories comprises all costs of purchase, costs of conversion and other costs incurred in bringing the inventories to their present location and condition.
c) Net realisable value is the estimated selling price in the ordinary course of business, less the estimated costs of completion and the estimated costs necessary to make the sale. “
1.10 Revenue Recognition: a) Revenue from sale of goods is recognised
when the significant risks and rewards in respect of ownership of products are transferred by the Company and no significant uncertainty exist regarding the amount of consideration that will be derived from the sale of goods as well as regarding its ultimate collection. Revenue from product sales is stated net of returns, sales tax and applicable trade discounts and allowances. Revenue from product sales includes excise duty, wherever applicable. Sales are also netted off for probable saleable and non-saleable return of goods from the customers, estimated on the basis of historical data of such returns.

ALKEM LABORATORIES LTD.106
Notesto the Standalone Financial Statements
b) Revenue (including in respect of insurance or other claims, interest etc.) is recognised when it is reasonable to expect that the ultimate collection will be made
c) Income from research and product registration (dossiers) services and technology income is recognised as revenue when earned in accordance with the terms of the relevant agreements.
d) Dividend from investment is recognised as revenue when right to receive the payments is established.
e) Interest income is recognised on time proportionate basis.
f) Profit on disposal/ sale of Investments is recognised as income in the period in which the investment is sold/disposed off “
1.11 Export Incentives: Export benefits available under prevalent schemes
are accrued in the year in which the goods are exported and no significant uncertainty exist regarding its ultimate collectiion.
1.12 Excise Duty and CENVAT: In accordance with the method of accounting
regularly employed by the Company, Cenvat has been accounted on the basis of “exclusive method” as recommended by the Institute of Chartered Accountants of India wherever applicable. Provision for excise duty has been made on goods lying in bonded warehouses.
1.13 Research and Development: Revenue expenditure incurred on research and
development is charged to the respective heads in the Statement of Profit and Loss, in the year it is incurred and capital expenditure there on is included in the respective heads under fixed assets.
1.14 Foreign Exchange Transactions: a) Transactions in foreign currency are
recorded at the rate of exchange in force at the time transactions are effected. Exchange differences arising on settlement of all transactions are recognized in the Statement of profit and loss.
b) Exchange Differences arising on translation of short-term monetary items denominated in foreign currency are restated using the exchange rate prevailing as at the date of the Balance sheet and the resulting exchange difference is recognised in Statement of profit and loss.
c) The exchange differences arising on restatement / settlement of long-term foreign currency monetary items are capitalised as part of the depreciable fixed assets to which the monetary item relates and depreciated over the remaining useful life of such assets.
d) In case of forward exchange contracts entered into to hedge the foreign currency exposure in respect of Short-term monetary items, the difference between the exchange rate on the date of such contracts and the year end rate is recognized in the Statement of profit and loss. Any profit/loss arising on cancellation of forward exchange contract is recognized as income or expense of the year. Premium/discount arising on such forward exchange contracts is amortised as income/expense over the life of contract.
e) Foreign offices/branches: In respect of the foreign offices/branches, which are integral foreign operations, all revenues and expenses (except depreciation) during the year are reported at average rate. Monetary assets and liabilities are restated at the year-end exchange rate. Non-monetary assets and liabilities are stated at the rate prevailing on the date of the transaction. Net gain/loss on foreign currency translation is recognised in the Statement of profit and loss.”
1.15 Employee Benefits: a) Post Employment Benefits and Other Long
Term Benefits:
i) Defined Contribution Plan:Company’s contribution for the year paid/payable to defined contribution retirement benefit schemes are charged to Statement of Profit and Loss The Company’s contribution towards provident fund and superannuation fund for certain eligible employees are considered to be defined contribution plan for which
CO
RP
OR
AT
E O
VE
RV
IEW
FIN
AN
CIA
L STAT
EM
EN
TS
STAT
UTO
RY
RE
PO
RT
S
ANNUAL REPORT 2015-16 107
Notesto the Standalone Financial Statements
Standalone Financial Statements
the Company made contribution on monthly basis.
ii) Defined Benefit and Other Long Term Benefit Plans: Company’s liabilities towards defined benefit plans and other long term benefits viz. gratuity and compensated absences expected to occur after twelve months, are determined using the Projected Unit Credit Method. Actuarial valuations under the Projected Unit Credit Method are carried out at the balance sheet date. Actuarial gains and losses are recognised in the Statement of Profit and Loss in the period of occurrence of such gains and losses. The retirement benefit obligation recognised in the balance sheet represents the present value of the defined benefit obligation as adjusted for unrecognised past service cost, and as reduced by the fair value of scheme assets, if any.
b) Short term Employee Benefits: Short term employee benefits are benefits payable and recognised in 12 months. Short-term employee benefits expected to be paid in exchange for the services rendered by employees are recognised undiscounted during the year as the related service are rendered by the employee. These benefits include performance incentives.”
1.16 Taxes on Income: Income Tax is accounted for in accordance
with Accounting Standard 22 (AS 22) “Accounting for Taxes on Income”. Tax expense comprises both current tax and deferred tax. Current tax is measured at the amount expected to be paid or recovered from the tax authorities using the applicable tax rates. Minimum Alternate Tax (MAT) under the provision of Income Tax Act, 1961 is recognized as current tax in the Statement of Profit and Loss. The credit available under the Act in respect of MAT paid is recognised as an asset only when and to the extent there is convincing evidence that the company will pay normal income tax during the period for which the MAT credit can be carried forward for set off against the normal tax liability. MAT credit recognised as an asset is reviewed at each balance sheet date and written down to the extent the
aforesaid convincing evidence no longer exists. Deferred tax assets and liabilities are recognised for future tax consequence attributable to timing differences between taxable income and accounting income that are measured at relevant substantially enacted tax rates. At each balance sheet date the Company reassesses unrecognised deferred tax assets, to the extent they become reasonably certain or virtually certain as the case may be supported by convincing evidence that they can be realised against future taxable profits .
1.17 Borrowing Costs: Borrowing costs are interest and other costs
incurred by the Company in connection with the borrowing of funds. Borrowing costs directly attributable to acquisition or construction of those tangible fixed assets which necessarily take a substantial period of time to get ready for their intended use are capitalised. Other borrowing costs are recognised as an expense in the Statement of Profit and Loss of the period in which they are incurred
1.18 Provision, Contingent Liabilities and Contingent Assets:
A provision is recognised if as a result of a past event, the Company has a present obligation that can be estimated reliably and it is probable that an outflow of economic benefits will be required to settle the obligation. Provisions are recognised at the best estimate of the expenditure required to settle the present obligation at the balance sheet date. The provisions are measured on an undiscounted basis. A contingent liability exists when there is a possible but not probable obligation, or a present obligation that may, but probably will not, require an outflow of resources, or a present obligation whose amount can not be estimated reliably. Contingent liabilities do not warrant provisions but are disclosed unless the possibility of outflow of resources is remote. Contingent assets are neither recognised nor disclosed in the financial statements. However, contingent assets are assessed continually and if it is virtually certain that an inflow of economic benefits will arise, the asset and related income are recognised in the period in which the change occurs.”
1.19 Earnings per share (‘EPS’) Basic EPS is computed using the weighted average
number of equity shares outstanding during the period. Diluted EPS is computed using the weighted average number of equity and dilutive

ALKEM LABORATORIES LTD.108
Notesto the Standalone Financial Statements
equity equivalent shares outstanding during the period except where the results would be anti-dilutive.
1.20 Government Grants: Government Grants of Capital nature received as
cash subsidy is accounted as Capital Reserve in the year of its receipt or when there is a reasonable certainty of its being received. Grants related to depreciable assets are treated as deferred income which is recognised in the Statement of profit and loss on a systematic and rational basis over the useful life of the asset. Such allocation to income is usually made over the periods and in the proportions in which depreciation on related assets is charged. Government Grants of revenue nature is reduced from related expenses in the
statement of Profit and Loss in the year of its receipt or when there is a reasonable certainty of its being received.
1.21 Cash and Cash Equivalents Cash and Cash Equivalents for the purpose of cash
flow statement comprise cash at bank including fixed deposits (having original maturity of less than 3 months), cheques in hand and cash in hand.
1.22 Derivative Instruments Any Loss arising out of marking of a class of
derivative contracts to market price is recognised in the Statement of Profit and Loss. Income, if any, arising out of marking of a class of derivative contracts to market price is not recognised in the Statement of Profit and Loss.
NOTE-2: NOTES TO THE FINANCIAL STATEMENTS
NOTE-2.1 SHARE CAPITAL (` in million)
Particulars As at 31 March 2016
As at 31 March 2015
Authorised:250,000,000 equity shares of ` 2/- each (Previous Year 250,000,000 equity shares
of ` 2/- each)
500.0 500.0
500.0 500.0
Issued, Subscribed and Paid up:119,565,000 equity shares of ` 2/- each fully paid up (Previous Year 119,565,000
equity shares of ` 2 each fully paid up)
239.1 239.1
Total 239.1 239.1
(a) Reconciliation of the number of equity shares outstanding at the beginning and at the end of the year:
Particulars As at 31 March 2016 As at 31 March 2015
Number ` in million Number ` in million
At the commencement of the year 119,565,000 239.1 11,956,500 119.6
Add: Increase in the number of shares after sub division in
face value from ` 10 to ` 2 (Refer Note 2.1(d))
- - 47,826,000 -
Add: Bonus Shares issued during the year (Refer Note 2.1(e)) - - 59,782,500 119.5
At the end of the year 119,565,000 239.1 119,565,000 239.1
(b) Rights, preferences and restrictions attached to Equity Shares:
The Company has issued one class of equity shares with voting rights having a par value of 2/- per share. Each shareholder is eligible for one vote per share held.
On winding up of the Company, the holders of equity shares will be entitled to receive residual assets of the Company remaining after distribution of all preferential amounts in proportion to the number of equity shares held by the shareholders.

CO
RP
OR
AT
E O
VE
RV
IEW
FIN
AN
CIA
L STAT
EM
EN
TS
STAT
UTO
RY
RE
PO
RT
S
ANNUAL REPORT 2015-16 109
Notesto the Standalone Financial Statements
Standalone Financial Statements
(c) Details of shareholders holding more than 5% equity shares in the Company:
Name of the shareholders: As at 31 March 2016 As at 31 March 2015
Number of Shares
Percentage of Holding
Number of Shares
Percentage of Holding
Equity Shares of ` 2 Each (Previous Year ` 2 Each) held by:
Mr. Basudeo Narain Singh 8,405,950 7.03% 9,528,600 7.97%
Mrs. Jayanti Sinha 7,138,220 5.97% 8,573,000 7.17%
Mr. Nawal Kishore Singh 4,311,060 3.61% 6,702,360 5.61%
Mr. Balmiki Prasad Singh 6,257,355 5.23% 6,215,760 5.20%
(d) Change in face value of equity shares: During the previous year ended 31 March, 2015, pursuant to the approval of the members at the Extra ordinary general
meeting of the Company held on 16 March 2015 to the sub-division of the Equity Shares of the Company, each Equity Share of face value of 10 each was sub-divided into 5 (five) Equity Share of 2 each. The effective date for the said sub-division was 16 March 2015.
(e) Aggregate Number of Bonus Shares Issued during the year and five preceding years: During the year Nil (Previous Year 59,782,500) Equity Shares of ` 2 Each fully paid up have been allotted as Bonus Shares
by capitalization of General Reserves.
NOTE-2.2 RESERVES AND SURPLUS (` in million)
Particulars As at 31 March 2016
As at 31 March 2015
Capital Reserve:Investment Subsidies from State GovernmentsAt the commencement and at end of the year 5.2 5.2
General Reserve:At the commencement of the year 19,380.5 19,500.0Less:Bonus Shares Issued during the year (Refer Note No. 2.1 (e)) - 119.5At the end of the year 19,380.5 19,380.5Surplus in the Statement of Profit and Loss:At the commencement of the year 11,385.4 8,275.3Add: Profit for the year 6,384.4 3,676.9
Total 17,769.8 11,952.2Less: Appropriations:Interim Dividend on Equity Shares ((amount per share of (Face Value of ` 2 Each)
` 12.70 (previous year amount per share of (Face Value of ` 10 Each) ` 40)) - Refer
Note 2.1(d)
1,518.50 478.3
Dividend Distribution Tax 309.1 88.5At the end of the year 15,942.2 11,385.4Total 35,327.9 30,771.1
NOTE - 2.3 LONG-TERM BORROWINGS: (` in million)
Particulars As at 31 March 2016
As at 31 March 2015
Secured:Foreign Currency Term Loans from Bank - 281.3
Total - 281.3Notes: Foreign Currency Term Loan from Bank is a loan of US $ 4.5 million (` 298.1 million) (Previous Year $ 9 million (` 562.6 million)) which carries an interest
at applicable LIBOR plus margin (150 basis points). The Company has entered into an Interest rate swap derivative of fixed rate @ 3.57% p.a. The balance loan
is repayable on 28 October 2016. Amount falling due for payment on 28 October 2016 is disclosed under other current liabilities amounting to ` 298.1 million
(Previous year ` 281.3 million).
The Foreign Currency Term Loan from bank of US $ 4.5 million is secured by a first pari passu charge on the movable fixed assets of the company (plant and machinery)

ALKEM LABORATORIES LTD.110
Notesto the Standalone Financial Statements
NOTE-2.4 DEFERRED TAX LIABILITIES (NET): (` in million)
Particulars As at 31 March 2016
As at 31 March 2015
Tax effect of items constituting Deferred Tax LiabilitiesOn differences between book and tax depreciation 1,165.4 977.1
Tax effect of items constituting Deferred Tax AssetsProvision for employee benefits 300.0 239.0
Others (includes provision for doubtful debts and advances, deferred government
grant etc.)
106.2 53.0
Total 759.2 685.1
NOTE-2.5 LONG-TERM PROVISIONS (` in million)
Particulars As at 31 March 2016
As at 31 March 2015
Provisions for employee benefits
Gratuity (Refer Note 2.29) 314.2 258.6
Compensated absences 154.7 138.5
Provision for anticipated sales returns (Refer Note.2.35) 190.8 168.0
Total 659.7 565.1
NOTE-2.6 SHORT-TERM BORROWINGS (` in million)
Particulars As at 31 March 2016
As at 31 March 2015
SecuredLoans repayable on demand from banks 1,510.6 8,269.8
1,510.6 8,269.8
UnsecuredWorking Capital Loan from banks 1,995.6 2,193.0
1,995.6 2,193.0
Total 3,506.2 10,462.8Notes:
Secured:
1. Cash Credit from bank for ` 0.0 million (Previous Year ` 620.9 million) and Packing Credit Foreign Currency Loan for ` 331.3 million (Previous Year
` 312.5 million) are secured by hypothecation of inventories and trade receivables.
2. Overdrafts from Banks ` 1,179.3 million (Previous Year ` 7,336.4 million) are secured against pledge of Fixed Deposits with the banks.
3. Cash Credit and Overdraft Facilities carry a rate of Interest ranging between 8.50% to 10.50% p.a. (previous year 9.60% to 10.75% p.a.), computed on
a monthly basis on the actual amount utilized, and are repayable on demand. Packing Credit Foreign Currency Loan carries Interest rate in the range of
1.15% to 1.45% (Previous Year 1.15% to 1.45%)
Unsecured:
4. Working Capital Loan from banks comprises of Overdrafts in INR of ` 173.6 million (Previous Year ` 1,099.4 million) and Packing Credit in Foreign
Currencies of ` 1,822.0 million (Previous Year ` 1,093.6 million)and are repayable on demand.
5. Packing Credit Foreign Currency loan carries Interest rate in the range of 1.10% to 2.00% and working Capital Loan from banks in Indian Rupees carries
Interest rate in the range of 8.5% to 10% p.a.

CO
RP
OR
AT
E O
VE
RV
IEW
FIN
AN
CIA
L STAT
EM
EN
TS
STAT
UTO
RY
RE
PO
RT
S
ANNUAL REPORT 2015-16 111
Notesto the Standalone Financial Statements
Standalone Financial Statements
NOTE-2.7 TRADE PAYABLES: (` in million)
Particulars As at 31 March 2016
As at 31 March 2015
Dues to Micro and Small Enterprises (Refer Note 2.28) 240.2 27.6
Dues to Others 4,424.8 3,437.7
Total 4,665.0 3,465.3Due to related parties ` 349.8 million (Previous Year ` 308.4 million) (Refer Note 2.36)
NOTE-2.8 OTHER CURRENT LIABILITIES: (` in million)
Particulars As at 31 March 2016
As at 31 March 2015
Current maturities of long-term debt (Refer Note 2.3) 298.1 281.3
Interest accrued but not due on borrowings 2.8 3.3
Due to statutory authorities* 256.1 194.6
Advances from customers 136.6 79.8
Employee payables 909.3 378.5
Security Deposits 98.8 90.4
Accrual for Expenses 716.0 408.0
Others payables** 30.6 -
Unpaid dividend*** 0.6 -
Total 2,448.9 1,435.9*Due to statutory authorities includes sales tax payable, excise duty payable, tax deducted at source payable, service tax payable, provident fund and other funds
payable.
** includes amount set aside for IPO related expenses as recovered from shareholders whose shares were offered for sale in the intial public offering, net of
expenses incurred and approved as at 31 March 2016.
*** There are no amounts due for payment to the Investor education and protection fund (“IEPF”) under Section 125 of the Companies Act, 2013.
NOTE-2.9 SHORT-TERM PROVISIONS: (` in million)
Particulars As at 31 March 2016
As at 31 March 2015
Provision for wealth tax - 0.8
Provision for taxation (net of advance tax) 68.2 -
Provision for employee benefits:
Gratuity (Refer Note 2.29) 221.8 328.0
Compensated absences 176.3 48.2
Provision for anticipated sales returns (Refer Note.2.35) 430.0 289.5
Total 896.3 666.5

ALKEM LABORATORIES LTD.112
Notesto the Standalone Financial Statements
NO
TE
-2.1
0 F
IXE
D A
SSE
TS
(` in
mill
ion
)
Part
icul
ars
GR
OSS
BLO
CK
DEP
REC
IATI
ON
AN
D A
MO
RTI
SATI
ON
NET
BLO
CK
As
at
1 A
pril
2015
Add
itio
nsA
djus
tmen
tsD
elet
ions
As
at
31 M
arch
20
16
Up
to
31 M
arch
20
15
For t
he
year
Adj
ustm
ents
Ded
ucti
ons
Up
to
31 M
arch
20
16
As
at
31 M
arch
20
16
As
at
31 M
arch
20
15
TAN
GIB
LE A
SSET
SFr
eeho
ld L
and
1,1
72.4
47.
1 (1
4.8)
18.
5 1
,186
.2 -
- -
- -
1,1
86.2
1,1
72.4
(348
.7)
(194
.0)
(629
.7)
- (1
,172
.4)
- -
- -
- (1
,172
.4)
(348
.7)
Leas
ehol
d La
nd 1
28.9
- 1
4.8
- 1
43.7
6.4
4.1
- -
10.
5 1
33.2
122
.5
(128
.5)
(0.4
) -
- (1
28.9
) (5
.1)
(1.3
) -
- (6
.4)
(122
.5)
(123
.6)
Bui
ldin
gs 2
,516
.7 2
45.0
- 4
.3 2
,757
.4 4
58.9
54.
3 -
1.2
512
.0 2
,245
.4 2
,057
.8
(3,1
23.5
) (3
0.0)
629
.7 (7
.1)
(2,5
16.7
) (4
63.5
) (5
2.7)
55.
2 (2
.1)
(458
.9)
(2,0
57.8
) (2
,660
.0)
Plan
t and
Mac
hine
ry 6
,344
.9 4
56.6
(7.0
) 2
93.1
6,5
01.4
1,7
25.6
483
.4 (0
.3)
182
.3 2
,026
.4 4
,475
.0 4
,619
.3
(6,1
22.9
) (3
03.4
) -
(81.
4) (6
,344
.9)
(1,3
22.8
) (4
36.2
) -
(33.
4) (1
,725
.6)
(4,6
19.3
) (4
,800
.1)
Furn
itur
e an
d Fi
xtur
es 3
07.9
36.
7 (0
.4)
4.0
340
.2 1
60.9
32.
6 0
.3 2
.7 1
91.1
149
.1 1
47.0
(296
.8)
(11.
8) -
(0.7
) (3
07.9
) (1
22.1
) (3
9.0)
- (0
.2)
(160
.9)
(147
.0)
(174
.8)
Veh
icle
s 2
06.7
28.
1 -
35.
9 1
98.9
82.
9 2
2.7
- 2
5.1
80.
5 1
18.4
123
.8
(191
.3)
(48.
3) -
(32.
9) (2
06.7
) (6
9.1)
(24.
6) -
(10.
8) (8
2.9)
(123
.8)
(122
.3)
Offi
ce E
quip
men
ts 2
68.7
68.
8 7
.4 1
7.3
327
.6 1
29.4
49.
8 -
15.
1 1
64.1
163
.5 1
39.3
(211
.6)
(60.
0) -
(2.9
) (2
68.7
) (9
1.8)
(38.
8) -
(1.2
) (1
29.4
) (1
39.3
) (1
19.8
)
10,
946.
2 8
82.3
- 3
73.1
11,
455.
4 2
,564
.1 6
46.9
- 2
26.4
2,9
84.6
8,4
70.8
8,3
82.1
(10,
423.
3) (6
47.9
) -
(125
.0)
(10,
946.
2) (2
,074
.4)
(592
.6)
55.
2 (4
7.7)
(2,5
64.1
) (8
,382
.1)
(8,3
49.3
)
INTA
NG
IBLE
ASS
ETS
Com
pute
r Sof
twar
e 3
08.4
42.
0 -
1.3
349
.1 2
52.0
30.
2 -
1.3
280
.9 6
8.2
56.
4
(271
.0)
(37.
4) -
- (3
08.4
) (2
32.8
) (1
9.2)
- -
(252
.0)
(56.
4) (3
8.2)
Trad
e M
ark
& P
aten
ts 3
07.1
- -
- 3
07.1
41.
0 5
8.2
- -
99.
2 2
07.9
266
.1
(0.8
) (3
06.3
) -
- (3
07.1
) (0
.8)
(40.
2) -
- (4
1.0)
(266
.1)
-
615
.5 4
2.0
- 1
.3 6
56.2
293
.0 8
8.4
- 1
.3 3
80.1
276
.1 3
22.5
(271
.8)
(343
.7)
- -
(615
.5)
(233
.6)
(59.
4) -
- (2
93.0
) (3
22.5
) (3
8.2)
Cap
ital
Wor
k-in
-Pro
gres
s 1
,465
.5 9
58.9
(958
.9)
(706
.8)
1,4
65.5
958
.9
Tota
l 1
1,56
1.7
924
.3 -
374
.4 1
2,11
1.6
2,8
57.1
735
.3 -
227
.7 3
,364
.7 1
0,21
2.4
9,6
63.5
Prev
ious
yea
r 1
0,69
5.1
991
.6 -
125
.0 1
1,56
1.7
2,3
08.0
652
.0 (5
5.2)
47.
7 2
,857
.1 9
,663
.5 9
,093
.9N
ote
s :
1.
Ad
dit
ion
to
fixe
d a
sset
s in
clu
de
item
s o
f fixe
d a
sset
s ag
greg
atin
g `
33
3.3
mill
ion
(Pre
vio
us
Year
` 6
8.8
mill
ion
) lo
cate
d a
t R
esea
rch
an
d D
evel
op
men
t C
entr
es o
f th
e C
om
pan
y2
. A
dd
itio
n t
o fi
xed
ass
ets
incl
ud
es e
xch
ange
loss
on
fore
ign
cu
rren
cy lo
an c
apit
alis
ed `
30
.8 m
illio
n (P
revi
ou
s Ye
ar `
23
.3 m
illio
n)
3.
Dur
ing
the
prev
ious
yea
r en
ded
31
Mar
ch, 2
01
5, p
ursu
ant t
o th
e re
quir
emen
t of C
ompa
nies
Act
, 20
13
the
Com
pany
has
det
erm
ined
the
rem
aini
ng u
sefu
l lif
e of
bui
ldin
g, p
lant
& m
achi
nery
bas
ed o
n th
e re
port
of a
n
inde
pend
ent v
alue
r. In
res
pect
of o
ther
fixe
d as
sets
, the
Com
pany
has
adh
ered
to th
e us
eful
live
s as
rec
omm
ende
d in
Sch
edul
e II
to th
e A
ct. C
onse
quen
t to
the
chan
ges
in th
e us
eful
live
s of
the
asse
ts it
s de
prec
iati
on
duri
ng th
e pr
evio
us y
ear
was
hig
her
by `
12
6.7
mill
ions
. The
Ass
ets
wit
hout
any
rem
aini
ng u
sefu
l lif
e at
the
begi
nnin
g of
the
prev
ious
yea
r ha
ve b
een
char
ged
to th
e St
atem
ent o
f Pro
fit &
Los
s ag
greg
atin
g to
` 4
.3
mill
ion.
Cos
t of L
and
form
ing
part
of b
uild
ing
has
been
iden
tifie
d an
d ac
cord
ingl
y re
clas
sifie
d an
d de
prec
iati
on c
harg
ed o
n th
e la
nd h
as b
een
reve
rsed
am
ount
ing
to `
55
.2 m
illio
n.4
. F
igu
res
in t
he
bra
cket
s ar
e th
e co
rres
po
nd
ing
figu
res
of t
he
pre
vio
us
year
.

CO
RP
OR
AT
E O
VE
RV
IEW
FIN
AN
CIA
L STAT
EM
EN
TS
STAT
UTO
RY
RE
PO
RT
S
ANNUAL REPORT 2015-16 113
Notesto the Standalone Financial Statements
Standalone Financial Statements
NOTE-2.11: NON-CURRENT INVESTMENTS:Particulars Number Face Value As at 31 March 2016 As at 31 March 2015
` in million
` in million
` in million
` in million
[At Cost unless otherwise stated]
1) In Equity Shares of Subsidiary Companies Unquoted (Trade):
a) In Subsidiaries:
Alkem Laboratories (NIG) Limited, Nigeria
(Including 1 share held by the nominee)
27156388 Naira 9.4 9.4
(27156388) 1
Alkem Laboratories (Pty.) Limited,
South Africa
15890 Rand 0.9 0.9
(15890) 10
Alkem Laboratories Corporation,
Philippines (Including 5 shares held by
the nominees)
518000 Peso 72.2 9.6
(94000) 100
Alkem Laboratories Corporation,
Philippines (Share Application Money)
- 62.6
Alkem Pharma GmbH, Germany
(One Share of Euro 24,750 and Second
share of Euro 250)
2 Euro 1.7 1.7
(2)
Ascend Laboratories Sdn. Bhd., Malaysia
(` 91)
2 Ringgit
(2) 1
S & B Holdings B.V., Netherlands 35590552 Euro 2,897.2 2,897.2
(35590552) 1
Alkem Laboratories Korea INC 15000 Korean
Won
0.1 0.1
(15000) 100
Ascend Laboratories SpA, Chile
(1000 Nominative Shares, without par value)
1000 0.1 0.1
(1000)
Pharmacor Ltd., Kenya 1000 Shillings 0.1 0.1
(1000) 100
Pharmacor Pty Ltd., Australia 68313954 224.7 224.7
(68313954)
Ascend Laboratories (UK) Limited
[Refer Note 6 (a)]
(issued capital 250000 shares of 1 GBP of
which 40 Pence is called up & paid)
250000 GBP 9.9 4.9
(250000) 1
S&B Pharma, Inc, USA 50100 USD 301.0 301.0
(50100) 0.01
Cachet Pharmaceuticals Pvt Ltd 7650 INR 638.9 638.9
(7650) 100
Indchemie Health Specialities Pvt Ltd 127500 INR 1,640.7 1,640.7
(127500) 10
Enzene Biosciences Limited, India
[Refer Note 6 (b)]
4481000 INR 607.4 110.0
(1120250) 10
Enzene Biosciences Limited, India
(Share Application Money)
- 8.6
6,404.3 5,910.5

ALKEM LABORATORIES LTD.114
Notesto the Standalone Financial Statements
Particulars Number Face Value As at 31 March 2016 As at 31 March 2015
` in million
` in million
` in million
` in million
2) In Equity Shares of Other Companies:
a) Unquoted (Trade):
Bharuch Eco-Aqua Infrastructure Limited 510000 INR 5.1 5.1
(510000) 10
Shivalik Solid Waste Management Limited 18000 INR 0.2 0.2
(18000) 10
b) Unquoted (Non Trade):
Propstack Services Private Limited
(` 20,000 Previous Year ` 20,000)
2000 INR
(2000) 10
The Saraswat Co-operative Bank Limited
(` 20,000 Previous Year ` 20,000)
2000 INR
(2000) 10
5.3 5.3
3) Investment in Limited Liability Partnership Firm: Unquoted (Trade):-
The PharmaNetwork LLP, Kazakhstan
[Refer Note 6 (c)]
100.5 0.1
4) Investment In Fund
a) Unquoted(Non Trade) :
Asia Healthcare Fund Investment Trust
(Units of ` 100 each, Paid up value per unit
of ` 75 each, Previous year ` 70 each)
183566 100 13.8 12.8
(183566)
Tata Capital Healthcare Fund (Units of Re.1
each, Paid up value per unit of ` 0.9 each,
Previous year ` 0.5 each)
100000000 1 88.8 49.3
(100000000)
Avenue Venture Real Estate Fund (Units of
` 100,000 each, fully paid-up) - "The same
is disclosed under "Current Investments"
as at 31 March 2016". Refer sub note 4 of
Note 2.12
Nil 100000 - 2,221.2
(22780)
India Business Excellence Fund (Units of
` 1,000,000 each, Paid up value per unit of
` 975,000 each, Previous year ` 975,000
each)
25 1000000 16.7 22.1
(25)
India Business Excellence Fund-II (Units of
` 1,000 each, Paid up value per unit of
` 625 each, Previous year ` 400 each)
100000 1000 62.5 40.0
(100000)
Yournest Angel Fund-Scheme 1 (Units of
` 10,000 each, Paid up value per unit of
` 7,573 each, Previous year ` 7,573 each)
2000 10000 15.1 15.1
(2000)
Indusage Technology Venture Fund I (Units
of ` 1,000 each, Paid up value per unit of
` 250 each, Previous year ` 250 each)
20000 10000 5.0 5.0
(20000)
Motilal Oswal Most Focused Multicap 35
Fund - Regular - Growth
2923388 INR 40.0 25.0
(2039518) 10
Motilal Oswal Most Focused Multicap 25
Fund - Regular - Growth
675648 INR 10.0 -
(NIL) 10
251.9 2,390.5

CO
RP
OR
AT
E O
VE
RV
IEW
FIN
AN
CIA
L STAT
EM
EN
TS
STAT
UTO
RY
RE
PO
RT
S
ANNUAL REPORT 2015-16 115
Notesto the Standalone Financial Statements
Standalone Financial Statements
Particulars Number Face Value As at 31 March 2016 As at 31 March 2015
` in million
` in million
` in million
` in million
5) Debentures :
Non Convertible Non Trade
Unquoted
12.50% Cholamandalam Investment &
Finance Limited
40 500000 20.0 20.0
(40)
10.17% HDB financial Service Limited
(Refer Note 5)
200 1000000 200.5 202.5
(200)
Quoted
8% Indian Railway Finance Corporation
Limited (Refer Note 5)
108754 1000 108.8 108.8
(108754)
12.00% ECL Finance Limited 10000 1000 10.0 10.0
(10000)
8.63% NHB Limited
(Refer Note 5)
7220 5000 36.1 36.1
(7220)
9.01% NHB Limited
(Refer Note 5)
4000 5000 20.1 20.1
(4000)
395.5 397.5
6) Bonds : Non Trade
Quoted
11% Bank of India
(Refer Note 5)
250 1000000 250.0 250.0
(250)
11% Bank of India
(Refer Note 5)
20 1000000 20.0 20.0
(20)
11% Bank of India
(Refer Note 5)
200 1000000 212.4 -
(NIL)
10.25% Tata Capital Limited. 40 500000 21.0 22.2
(40)
11.50% Tata Steel Limited 100 1000000 102.7 105.5
(100)
11.25% Tata Motors Finance Limited 100 500000 50.0 50.0
(100)
11.03% Tata Motors Finance Limited 100 1000000 100.0 100.0
(100)
11.80 % Tata Steel Limited 50 1000000 52.9 54.3
(50)
11.40% Tata Power Limited 50 1000000 50.6 50.6
(50)
9.55% Kotak Mahindra Prime
(Refer Note 5)
750 1000000 750.0 750.0
(750) 1,609.6 1,402.6
Total 8,767.1 10,106.5
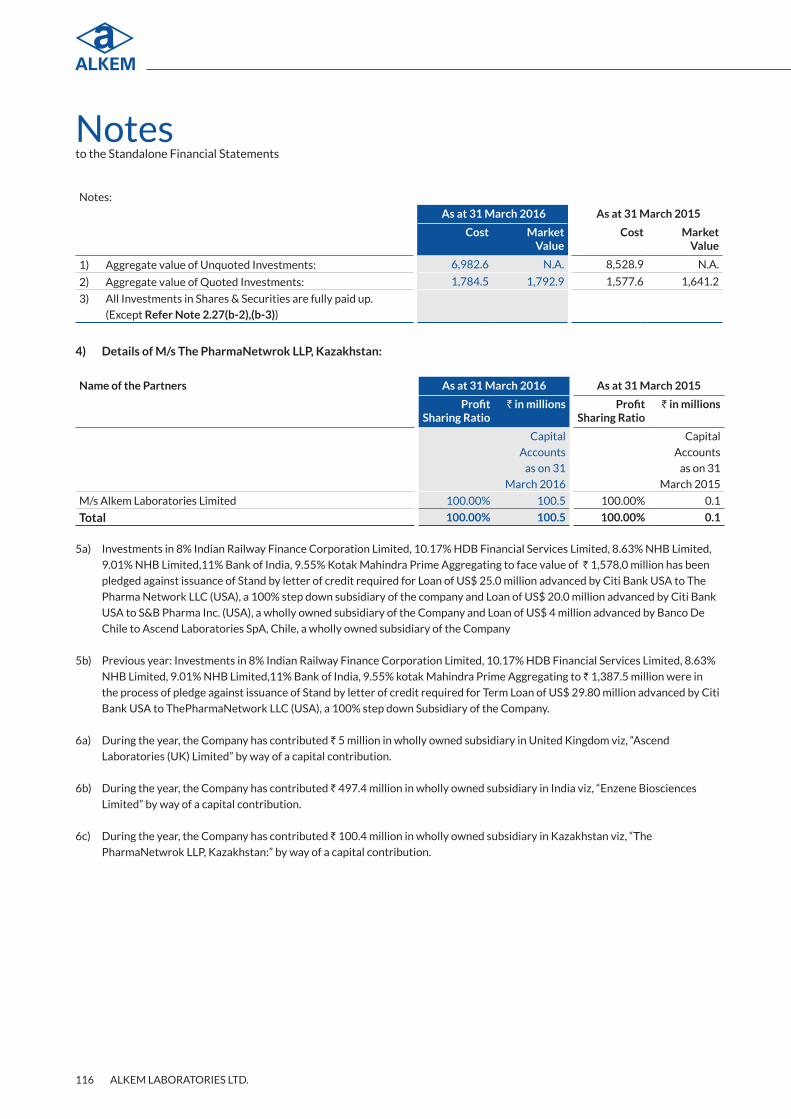
ALKEM LABORATORIES LTD.116
Notesto the Standalone Financial Statements
Notes:
As at 31 March 2016 As at 31 March 2015
Cost Market Value
Cost Market Value
1) Aggregate value of Unquoted Investments: 6,982.6 N.A. 8,528.9 N.A.
2) Aggregate value of Quoted Investments: 1,784.5 1,792.9 1,577.6 1,641.2
3) All Investments in Shares & Securities are fully paid up.
(Except Refer Note 2.27(b-2),(b-3))
4) Details of M/s The PharmaNetwrok LLP, Kazakhstan:
Name of the Partners As at 31 March 2016 As at 31 March 2015
Profit Sharing Ratio
` in millions Profit Sharing Ratio
` in millions
Capital
Accounts
as on 31
March 2016
Capital
Accounts
as on 31
March 2015
M/s Alkem Laboratories Limited 100.00% 100.5 100.00% 0.1
Total 100.00% 100.5 100.00% 0.1
5a) Investments in 8% Indian Railway Finance Corporation Limited, 10.17% HDB Financial Services Limited, 8.63% NHB Limited,
9.01% NHB Limited,11% Bank of India, 9.55% Kotak Mahindra Prime Aggregating to face value of ` 1,578.0 million has been
pledged against issuance of Stand by letter of credit required for Loan of US$ 25.0 million advanced by Citi Bank USA to The
Pharma Network LLC (USA), a 100% step down subsidiary of the company and Loan of US$ 20.0 million advanced by Citi Bank
USA to S&B Pharma Inc. (USA), a wholly owned subsidiary of the Company and Loan of US$ 4 million advanced by Banco De
Chile to Ascend Laboratories SpA, Chile, a wholly owned subsidiary of the Company
5b) Previous year: Investments in 8% Indian Railway Finance Corporation Limited, 10.17% HDB Financial Services Limited, 8.63%
NHB Limited, 9.01% NHB Limited,11% Bank of India, 9.55% kotak Mahindra Prime Aggregating to ` 1,387.5 million were in
the process of pledge against issuance of Stand by letter of credit required for Term Loan of US$ 29.80 million advanced by Citi
Bank USA to ThePharmaNetwork LLC (USA), a 100% step down Subsidiary of the Company.
6a) During the year, the Company has contributed ` 5 million in wholly owned subsidiary in United Kingdom viz, “Ascend
Laboratories (UK) Limited” by way of a capital contribution.
6b) During the year, the Company has contributed ` 497.4 million in wholly owned subsidiary in India viz, “Enzene Biosciences
Limited” by way of a capital contribution.
6c) During the year, the Company has contributed ` 100.4 million in wholly owned subsidiary in Kazakhstan viz, “The
PharmaNetwrok LLP, Kazakhstan:” by way of a capital contribution.

CO
RP
OR
AT
E O
VE
RV
IEW
FIN
AN
CIA
L STAT
EM
EN
TS
STAT
UTO
RY
RE
PO
RT
S
ANNUAL REPORT 2015-16 117
Notesto the Standalone Financial Statements
Standalone Financial Statements
NOTE-2.12. CURRENT INVESTMENTS: (cost or fair value whichever is lower)
Particulars Number Face Value As at 31 March 2016 As at 31 March 2015
` in million
` In million
` in million
` In million
a) (Non Trade):
1) Mutual Funds: (Quoted):
Benchmark Liquid Bees 0.8350 1,000
835.01 (Previous Year ` 784.10) (0.7840)
IDFC Money Manager Fund-DIR-DLY 8684.5970 10 0.1 0.1
(13950.8150)
0.1 0.1
2) Debentures :
Current Portion of Long Term Investments
Non Convertible
Quoted
12.25% Religare Finvest Limited Nil 1,000 - 50.0
(50000)
- 50.0
3) Commercial Paper: (Unquoted)
9.50% Barclays Investments Limited - 502.5
- 502.5
4) Investment in funds : (Unquoted)
Current Portion of Long Term Investments
Avenue Venture Real Estate Fund (Units
of ` 100,000 each, fully paid-up) -
Refer sub note 4 of Note 2.12
19966 100,000 1,934.00 -
(Nil) -
1,934.00 -
5) Equity Shares: (Quoted)
Adani Ports & Special Economic Zone
Limited
Nil 10 - 0.9
(6297)
Asian Paints Limited Nil 1 - 0.5
(882)
Bajaj Finance Limited Nil 10 - 0.9
(391)
Bharat Forge Limited Nil 2 - 0.7
(526)
Bosch Limited Nil 10 - 1.9
(117)
Colgate-Palmolive (India) Limited Nil 1 - 0.4
(228)
Container Corporation of India Limited Nil 10 - 0.5
(341)
City Union Bank Limited Nil 1 - 0.5
(6953)
Cummins India Limited Nil 2 - 0.7
(942)
DCB Bank Limited Nil 10 - 0.5
(5969)
D Q Entertainment Limited Nil 10 - 0.9
(12958)

ALKEM LABORATORIES LTD.118
Notesto the Standalone Financial Statements
Particulars Number Face Value As at 31 March 2016 As at 31 March 2015
` in million
` In million
` in million
` In million
Deccan Chronicle Holdings Limited Nil 2 - 0.0
(256)
Eicher Motors Limited Nil 10 - 3.2
(322)
Engineers India Limited Nil 5 - 0.2
(900)
Emami Limited Nil 1 - 0.4
(648)
Gateway Distriparks Limited Nil 10 - 0.5
(3587)
GlaxoSmithKline Consumer Healthcare
Limited
Nil 10 - 0.5
(104)
HDFC Bank Limited Nil 10 - 0.9
(1101)
HDFC Limited Nil 10 - 0.7
(745)
Hero Motocorp Limited Nil 2 - 0.5
(197)
Hindustan Petroleum Corp. Limited Nil 10 - 1.2
(2218)
ING Vyasya Bank Limited Nil 10 - 0.4
(667)
IRB Infrastructure Developers Limited Nil 10 - 1.2
(7904)
IPCA Lab Limited Nil 2 - 0.7
(971)
Jammu and Kashmir Bank Limited Nil 10 - 0.7
(4478)
Larsen & Toubro Limited Nil 2 - 1.6
(1879)
Max India Limited Nil 2 - 0.5
(1285)
Nava Bharat Ventures Limited Nil 2 - 0.8
(3966)
Page Industries Limited Nil 10 - 1.4
(182)
Sanghvi Movers Limited Nil 2 - 0.4
(4122)
State Bank of India Limited Nil 10 - 0.8
(2980)
Speciality Restaurants Limited Nil 10 - 0.1
(736)
Sun Pharmaceuticals Limited Nil 2 - 1.4
(1662)
Tata Consultancy Services Limited Nil 1 - 0.7
(299)

CO
RP
OR
AT
E O
VE
RV
IEW
FIN
AN
CIA
L STAT
EM
EN
TS
STAT
UTO
RY
RE
PO
RT
S
ANNUAL REPORT 2015-16 119
Notesto the Standalone Financial Statements
Standalone Financial Statements
Particulars Number Face Value As at 31 March 2016 As at 31 March 2015
` in million
` In million
` in million
` In million
Tech Mahindra Limited Nil 10 - 0.9
(1572)
Tara Jewels Limited Nil 10 - 6.6
(28535)
Torrent Power Limited Nil 10 - 0.5
(2490)
United Spirits Limited Nil 10 - 0.5
(188)
VA Tech Wabag Limited Nil 2 - 2.3
(9274)
Voltas Limited Nil 1 - 0.9
(4167)
- 38.9
b) Unquoted (Non Trade):
1) In Equity Funds:
HDFC CMF Treasury Advantage
Retail -WD
Nil 10 - 2.6
(256042.2)
- 2.6
2) Equity Shares:
G R Infraprojects Limited Nil 2 - 1.3
(6626)
Intarvo Technologies Limited Nil 10 - 0.9
(4299)
GMR Energy Limited 16531 10 0.2 0.2
(16531)
0.2 2.4
3) Preference Shares:
Intarvo Technologies Limited -CCPS Nil 10 - 0.1
(1616)
Regen Powertech Private Limited -CCPS 4328 3.1 3.1
(4328)
GMR Energy Limited-CCPS 1799 10 1.8 1.8
(1799)
0.1% Cumulative Non Convertible
Preference Shares
Saraswat Bank-NCPS 500000 10 5.0 5.0
(500000)
9.9 10.0
1,944.2 606.5
Less: Provision for diminution in the value
of Investments
0.0 7.4
Total 1944.2 599.1
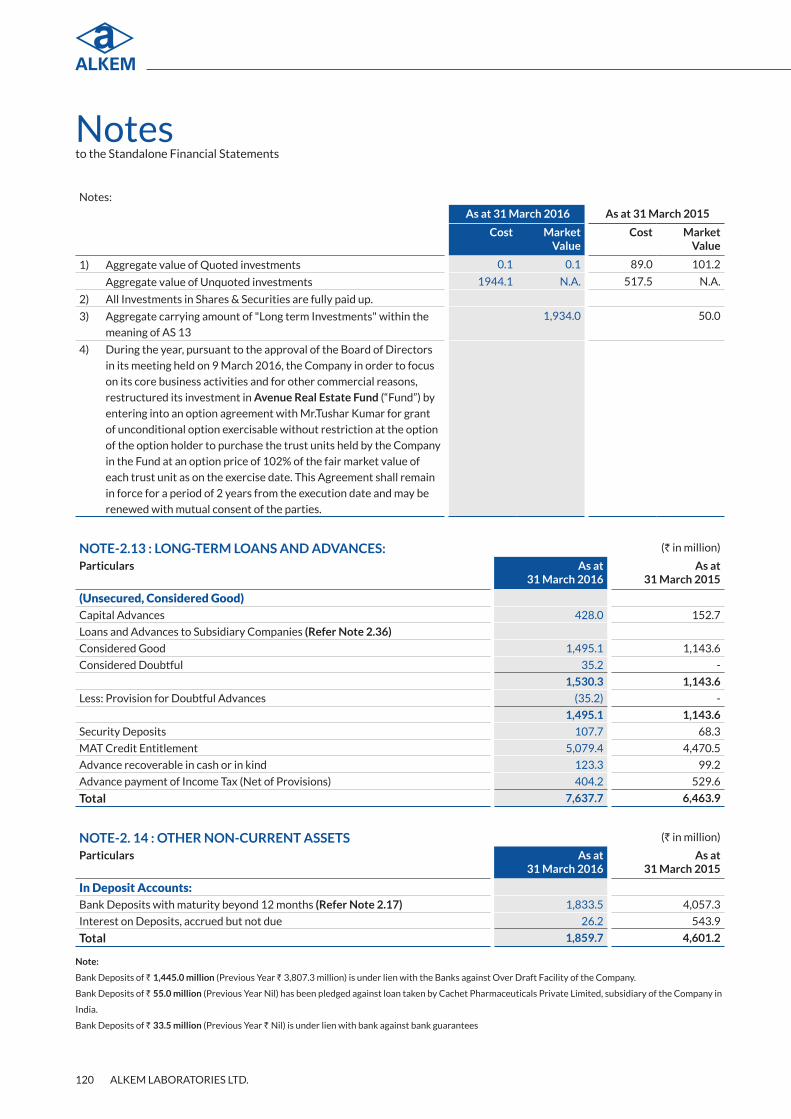
ALKEM LABORATORIES LTD.120
Notesto the Standalone Financial Statements
Notes:
As at 31 March 2016 As at 31 March 2015
Cost Market Value
Cost Market Value
1) Aggregate value of Quoted investments 0.1 0.1 89.0 101.2
Aggregate value of Unquoted investments 1944.1 N.A. 517.5 N.A.
2) All Investments in Shares & Securities are fully paid up.
3) Aggregate carrying amount of "Long term Investments" within the
meaning of AS 13
1,934.0 50.0
4) During the year, pursuant to the approval of the Board of Directors
in its meeting held on 9 March 2016, the Company in order to focus
on its core business activities and for other commercial reasons,
restructured its investment in Avenue Real Estate Fund (“Fund”) by
entering into an option agreement with Mr.Tushar Kumar for grant
of unconditional option exercisable without restriction at the option
of the option holder to purchase the trust units held by the Company
in the Fund at an option price of 102% of the fair market value of
each trust unit as on the exercise date. This Agreement shall remain
in force for a period of 2 years from the execution date and may be
renewed with mutual consent of the parties.
NOTE-2.13 : LONG-TERM LOANS AND ADVANCES: (` in million)
Particulars As at 31 March 2016
As at 31 March 2015
(Unsecured, Considered Good)Capital Advances 428.0 152.7
Loans and Advances to Subsidiary Companies (Refer Note 2.36)
Considered Good 1,495.1 1,143.6
Considered Doubtful 35.2 -
1,530.3 1,143.6
Less: Provision for Doubtful Advances (35.2) -
1,495.1 1,143.6
Security Deposits 107.7 68.3
MAT Credit Entitlement 5,079.4 4,470.5
Advance recoverable in cash or in kind 123.3 99.2
Advance payment of Income Tax (Net of Provisions) 404.2 529.6
Total 7,637.7 6,463.9
NOTE-2. 14 : OTHER NON-CURRENT ASSETS (` in million)
Particulars As at 31 March 2016
As at 31 March 2015
In Deposit Accounts:Bank Deposits with maturity beyond 12 months (Refer Note 2.17) 1,833.5 4,057.3
Interest on Deposits, accrued but not due 26.2 543.9
Total 1,859.7 4,601.2
Note:
Bank Deposits of ` 1,445.0 million (Previous Year ` 3,807.3 million) is under lien with the Banks against Over Draft Facility of the Company.
Bank Deposits of ` 55.0 million (Previous Year Nil) has been pledged against loan taken by Cachet Pharmaceuticals Private Limited, subsidiary of the Company in
India.
Bank Deposits of ` 33.5 million (Previous Year ` Nil) is under lien with bank against bank guarantees

CO
RP
OR
AT
E O
VE
RV
IEW
FIN
AN
CIA
L STAT
EM
EN
TS
STAT
UTO
RY
RE
PO
RT
S
ANNUAL REPORT 2015-16 121
Notesto the Standalone Financial Statements
Standalone Financial Statements
NOTE-2.15. : INVENTORIES: (` in million)
Particulars As at 31 March 2016
As at 31 March 2015
(Valued at lower of cost and net realisable value)Raw and packing materials 1,738.4 1,665.8Goods-in-transit 6.4 1.7
1,744.8 1,667.5Work-in-progress (Refer Note 2.40(d)) 244.7 241.9Finished goods (Refer Note 2.40(c)) 1,723.7 2,181.1Goods-in-transit 657.1 57.1
2,380.8 2,238.2Stock-in-trade (Refer Note 2.40(c)) 1,340.4 1,041.9Goods-in-transit 189.6 292.9
1,530.0 1,334.8Total 5,900.3 5,482.4
NOTE-2.16. : TRADE RECEIVABLES: (` in million)
Particulars As at 31 March 2016
As at 31 March 2015
(Unsecured)Outstanding for a period exceeding six months from the date they become due for
paymentConsidered good 285.4 323.8
Considered doubtful 230.0 85.9
Less: Provision for doubtful trade receivables (230.0) (85.9)
285.4 323.8
Other Trade Receivables:
Considered good 4,519.0 3,426.3
Considered doubtful - -
Less: Provision for doubtful trade receivables - -
4,519.0 3,426.3
Total 4,804.4 3,750.1Note :
Above Trade Receivables include amount due from related parties ` 2,515.1 million (Previous Year ` 1,589.7 million) - Refer Note 2.36
NOTE-2.17. : CASH AND BANK BALANCES: (` in million)
Particulars As at 31 March 2016
As at 31 March 2015
Cash and Cash Equivalents:Cash on hand 3.9 6.9Cheques and Drafts on hand 57.1 58.6Balance with Banks: In Current Accounts 13.4 184.0 In Exchange Earners' Foreign Currency Account 0.3 -
74.7 249.6Other Bank Balances: In Deposit Accounts: Bank Deposits with maturity within 12 months 5,165.0 6,083.7 In unpaid dividend account 0.6 -Total 5,240.3 6,333.3
Note:
Bank Deposits of ` 3,857.2 million (Previous Year ` 5,023.7 million) is under lien with banks against Overdraft facilities availed.
Bank Deposits of ` 1,000.0 million (Previous Year ` Nil) is under lien with banks against line of credit. This line of credit has not been utilised by the Company as
on 31 March 2016.

ALKEM LABORATORIES LTD.122
Notesto the Standalone Financial Statements
Bank Deposits of ` 110.0 million (Previous Year ` Nil) is under lien towards bank guarantee given to the Bombay Stock Exchange (“BSE”).
Bank Deposits of ` 74.6 million (Previous Year ` Nil) is placed as security with the Competition Commission of India (“CCI”) against pending litigation.
Subsequent to the balance sheet date the Competition Appellate Tribunal has set aside the CCI ruling.
Bank Deposits of ` 3.4 million (Previous Year ` Nil) is under lien with bank against bank guarantees.
(` in million)
Particulars As at 31 March 2016
As at 31 March 2015
Details of Bank Balances/DepositsBank Deposits with original maturity of 3 months or less - -
Bank Deposits with maturity within 12 months 5,165.0 6,083.7
Bank Deposits with maturity beyond 12 months (Refer Note No.2.14) Disclosed as
Other Non-Current Assets
1,833.5 4,057.3
6,998.5 10,141.0
NOTE-2.18. : SHORT-TERM LOANS AND ADVANCES: (` in million)
Particulars As at 31 March 2016
As at 31 March 2015
(Unsecured, Considered Good, unless Otherwise stated)Balances with Government Authorities 927.9 689.6
Loans and Advances to Employees 82.0 82.8
Advance to Suppliers:
Considered Good 240.5 311.6
Considered Doubtful 42.8 38.8
283.3 350.4
Less: Provision for Doubtful Advances (42.8) (38.8)
240.5 311.6
Prepaid Expenses 118.5 110.7
Total 1,368.9 1,194.7
NOTE-2.19. : OTHER CURRENT ASSETS: (` in million)
Particulars As at 31 March 2016
As at 31 March 2015
Interest on Deposits, accrued but not due 406.8 133.3
Export Incentives Receivable 204.0 110.6
Other Receivables* 187.5 169.5
*Includes insurance claim receivable ` 10.4 million (Previous year ` 81.7 million)
Total 798.3 413.4

CO
RP
OR
AT
E O
VE
RV
IEW
FIN
AN
CIA
L STAT
EM
EN
TS
STAT
UTO
RY
RE
PO
RT
S
ANNUAL REPORT 2015-16 123
Notesto the Standalone Financial Statements
Standalone Financial Statements
NOTE-2.20. : REVENUE FROM OPERATIONS: (` in million)
Particulars For the year ended 31 March 2016
For the year ended 31 March 2015
Sale of products (gross) (Refer Note 2.40(b)) 39,529.9 31,742.9
Other operating revenues:
Manufacturing charges 11.4 23.1
Excise refunds 530.1 450.2
Export incentives 257.1 104.9
Scrap sales 24.8 23.8
Foreign currency transactions and translation gain (net) 156.1 22.2
Government subsidy income (Refer Note 1.20) 4.8 36.6
Royalty income 44.5 41.5
Miscellaneous receipts 74.3 95.5
1,103.1 797.8
Total 40,633.0 32,540.7
NOTE-2.21. : OTHER INCOME: (` in million)
Particulars For the year ended 31 March 2016
For the year ended 31 March 2015
Interest on bank deposits 892.9 914.4
Other interest (includes interest on long-term investments ` 237.0 million
(Previous year ` 357.7 million)
343.9 417.8
Dividend income (includes dividend from long-term investments ` 7.7 million
(Previous year ` Nil)
8.3 3.1
Income from real estate investment in funds (long term investments) 102.0 283.2
Provision no longer required, written back 7.5 16.4
Rental income 27.4 34.2
Net profit on sale of investments (from current investments) 18.2 152.2
Sale of brands (Refer Note 2.37) 205.0 -
Total 1,605.2 1,821.3(Other Interest includes interest on Loan to subsidiaries ` 82.7 million (Previous year ` 41.9 million), Dividend Income includes ` 7.7 millon (previous year ` Nil)
received from subsidiary.
NOTE-2.22. : COST OF MATERIALS CONSUMED (` in million)
Particulars For the year ended 31 March 2016
For the year ended 31 March 2015
Raw material consumed (Refer Note 2.39) 7,035.5 6,166.3
Packing material consumed 2,669.8 2,374.8
Total 9,705.3 8,541.1

ALKEM LABORATORIES LTD.124
Notesto the Standalone Financial Statements
NOTE-2.23. : CHANGES IN INVENTORIES OF FINISHED GOODS, WORK-IN-PROGRESS AND STOCK-IN-TRADE:
(` in million)
Particulars For the year ended 31 March 2016
For the year ended 31 March 2015
Opening Stock: (Refer Note 2.40 (c) & (d))
Finished goods 2,238.2 2,498.6
Stock-in-trade 1,334.8 985.3
Work-in-progress 241.9 214.8
3,814.9 3,698.7
Less: Closing stock: (Refer Note 2.40 (c) & (d))
Finished goods 2,380.8 2,238.2
Stock-in-trade 1,530.0 1,334.8
Work-in-progress 244.7 241.9
4,155.5 3,814.9
Total (340.6) (116.2)
NOTE-2.24. : EMPLOYEE BENEFITS EXPENSE: (` in million)
Particulars For the year ended 31 March 2016
For the year ended 31 March 2015
Salaries, wages and bonus 6,241.7 4,957.1
Contribution to provident and other funds (Refer Note 2.29) 335.6 433.1
Employees’ welfare expenses 238.9 215.6
Total 6,816.2 5,605.8
NOTE-2.25. : FINANCE COST: (` in million)
Particulars For the year ended 31 March 2016
For the year ended 31 March 2015
Interest on borrowings 516.7 714.8
Other borrowing cost 16.3 11.5
Total 533.0 726.3
NOTE-2.26. OTHER EXPENSES:(` in million)
Particulars For the year ended 31 March 2016
For the year ended 31 March 2015
Consumption of stores and spare parts (Refer Note 2.39(b-ii)) 398.3 418.7
Power and fuel 519.6 530.8
Excise duty (net) 68.1 2.9
Processing charges 187.8 123.9
Rent 129.1 147.6
Rates and taxes 15.2 24.0
Insurance 93.1 74.2
Marketing and promotions 2,468.6 2,244.6
Selling and distribution expenses 943.4 910.6
Legal and professional Fees 931.9 494.2
Sales-tax and octroi duty 174.1 137.9
Commission and cash discount 704.5 514.1
Travelling and conveyance 1,165.3 1,221.0

CO
RP
OR
AT
E O
VE
RV
IEW
FIN
AN
CIA
L STAT
EM
EN
TS
STAT
UTO
RY
RE
PO
RT
S
ANNUAL REPORT 2015-16 125
Notesto the Standalone Financial Statements
Standalone Financial Statements
(` in million)
Particulars For the year ended 31 March 2016
For the year ended 31 March 2015
Repairs:
- Buildings 42.0 23.8
- Plant and machineries 110.5 99.7
- Others 90.7 55.4
Loss on sale of fixed assets (net) 113.3 49.3
Commission to Directors 130.0 -
Donation 3.9 2.8
Communication and printing expenses 156.2 132.1
Vehicle expenses 69.8 68.4
Clinical and analytical charges 451.8 252.3
Bad Debts/Advances written off 119.2 84.3
Provision for doubtful debts 147.4 4.3
Corporate Social Responsibility (CSR) expenditure 30.1 12.0
Royalty Expenses 46.4 -
Miscellaneous expenses (Refer Note 2.38, 2.41, 2.43) 513.6 697.4
Total 9,823.9 8,326.3
NOTE-2.27 CONTINGENT LIABILITIES AND COMMITMENTS
a) Contingent Liabilities not provided for (` in million)
Sr.
No.
Particulars As at 31 March 2016
As at 31 March 2015
1 Claims against the Company not acknowledged as debt:
(i) Central Excise demand disputed in appeal {advances paid in dispute
` 13.7 millions (P. Y. ` 30.8 millions)}
37.7 55.3
(ii) Sales Tax demand disputed in appeal {advances paid in dispute ` 78.7
millions (P. Y. ` 3.5 millions)}
482.1 7.9
(iii) Income Tax demand disputed in appeal {advances paid dispute in ` Nil (P.
Y. ` Nil)}
445.0 426.0
(iv) a. In relation to purchase commitments- ` 968.1 million* (Previous
year ` 968.1 million)
b. Supply of Goods: ` 461.2 million** (Previous year
` 717.4 millions)
c. In relation to property- ` Nil (Previous year ` 13.8 millions)
1,429.3 1,699.2
2 Bonds/Debentures/Fixed Deposits pledged against loan taken by
subsidiaries (Refer Note 2.12-5a, 2.14). The loan amount outstanding as on
the balance sheet date is
2,183.4 1,100.0
Total 4,577.5 3,288.4
Management considers that the excise duty, custom duty, sales tax and income tax demands received from the authorities are not tenable against the Company,
and therefore no provision for these tax contingencies have been made.
* Claim from vendor in relation to compliance with contractual purchase commitment and alleged infringement of intellectual property
** Claim from customer in relation to product quality issues and packing norms in recipient country.
The Company has reviewed all its pending litigations and proceedings and has adequately provided for, where provisions are required and disclosed as
contingent liabilities wherever applicable, in its financial statement. The Company does not expect the outcome of these proceedings to have materially adverse
effect on its financial statements.

ALKEM LABORATORIES LTD.126
Notesto the Standalone Financial Statements
b) Commitments (` in million)
Sr.
No.
Particulars As at 31 March 2016
As at 31 March 2015
1 Estimated amount of contracts remaining to be executed on Capital Accounts
{advances paid ` 241.9 millions (Previous Year ` 58.8 millions)
1,697.3 142.4
2 Calls in respect of partly paid up shares issued by a subsidiary company 148.1 18.5
3 Uncalled/ Unpaid contribution towards investment in funds (Refer
Note.2.12(2)(a))
75.1 136.6
4 Other Commitments: Commitment towards research and development - USD
5.2 millions (previous year USD 2.5 million)
345.5 156.3
5 Letter of Credit opened by the Banks 532.1 202.2
6 Outstanding Bank Guarantees 184.8 51.0
7 Pending Export Obligation under advance licence/ EPCG Scheme 49.9 7.8
8 Other Commitments - Non Cancellable Operating Lease (Refer Note. 2.31)
NOTE-2.28 DUES TO MICRO AND SMALL ENTERPRISESUnder the Micro, Small and Medium Enterprises Development Act, 2006, (MSMED) which came into force from 2 October 2006, certain disclosures are required to be made relating to Micro and Small Enterprises. On the basis of the information and records available with the Management, the outstanding dues to the Micro & Small enterprises as defined in MSMED are set out in following disclosure.
(` in million)
Sr.
No.
Particulars As at 31 March 2016
As at 31 March 2015
1 Principal amount remaining unpaid to any supplier as at the year end 240.2 27.6
2 Interest due thereon 3.5 1.0
3 The amount of interest paid by the buyer as per the Micro Small and Medium
Enterprises Development Act, 2006 (MSMED Act, 2006)
- -
4 The amounts of the payments made to micro and small suppliers beyond the
appointed day during each accounting year
- -
5 The amount of interest due and payable for the period of delay in making
payment (which have been paid but beyond the appointed day during the
year) but without adding the interest specified under MSMED Act, 2006.
- -
6 The amount of interest accrued and remaining unpaid at the end of each
accounting year.
3.5 1.0
7 The amount of further interest remaining due and payable even in the
succeeding years, until such date when the interest dues as above are actually
paid to the small enterprise for the purpose of disallowance as a deductible
expenditure under the MSMED Act, 2006.
- -
NOTE-2.29 DISCLOSURE OF EMPLOYEE BENEFITS AS PER ACCOUNTING STANDARD 15 IS AS UNDER:i) Defined contribution plans:The Company makes contributions towards provident fund and superannuation fund to a defined contribution retirement benefit plan for qualifying employees. Under the plan, the Company is required to contribute a specified percentage of payroll cost to the retirement benefit plan to fund the benefits. The provident fund plan is operated by the Government administered employee provident fund. Eligible employees receive the benefits from the said Provident Fund. Both the employees and the Company make monthly contribution to the Provident Fund plan equal to a specific percentage of the covered employee’s salary. The Company has no obligations other than to make the specified contributions.
The Superannuation fund is administered by the Life Insurance Corporation of India (LIC). Under the plan, the Company is required to contribute pre determined percentage of payroll cost of the eligible employee to the superannuation plan to fund the benefit.

CO
RP
OR
AT
E O
VE
RV
IEW
FIN
AN
CIA
L STAT
EM
EN
TS
STAT
UTO
RY
RE
PO
RT
S
ANNUAL REPORT 2015-16 127
Notesto the Standalone Financial Statements
Standalone Financial Statements
The Company has recognised the following amounts in the Statement of Profit and Loss
(` in million)
Particulars Year ended 31 March 2016
Year ended 31 March 2015
- Contribution to Provident Fund 109.7 117.2
- Contribution to Superannuation fund 2.7 2.8
Total 112.4 120.0
ii) Defined benefit plan: The Company earmarks liability towards unfunded Group Gratuity and Compensated absences and provides for payment
to vested employees as under: a) On Normal retirement/ early retirement/ withdrawal/resignation: As per the provisions of Payment of Gratuity Act, 1972 with vesting period of 5 years of service. b) On death in service: As per the provisions of Payment of Gratuity Act, 1972 without any vesting period. The most recent actuarial valuation of the present value of the defined benefit obligation for gratuity was carried out
as at 31 March 2016 by an independent actuary. The present value of the defined benefit obligations and the related current service cost and past service cost, were measured using the Projected Unit Credit Method.
The following table sets out the status of the gratuity plan and the amounts recognised in the Company’s financial statements as at 31 March 2016
(` in million)
Sr.
No.
Particulars As at 31 March 2016
As at 31 March 2015
I) Reconciliation in present value of obligations (PVO) – defined benefit obligation :Current Service Cost 65.7 94.0
Interest Cost 40.2 42.9
Actuarial (gain) / losses (0.6) 76.3
Benefits paid (156.0) (35.9)
PVO at the beginning of the year 586.7 409.4
PVO at end of the year 536.0 586.7
II) Reconciliation of PVO and fair value of plan assets:PVO at end of year 536.0 586.7
Actuarial gain/(losses) - -
Funded status (536.0) (586.7)
Unrecognised actuarial gain/ (loss) - -
Net asset/ (liability) recognised in the balance sheet (536.0) (586.7)
(` in million)
Sr.
No.
Particulars For the year ended 31 March 2016
For the year ended 31 March 2015
III) Net cost for the yearCurrent Service cost 65.7 94.0
Interest cost 40.2 42.9
Expected return on plan assets - -
Actuarial (gain) / losses (0.6) 76.3
Net cost 105.3 213.2
IV) Assumption used in accounting for the gratuity plan:Discount rate (%) 7.46 8.00
Salary escalation rate (%) 6.25 6.25

ALKEM LABORATORIES LTD.128
Notesto the Standalone Financial Statements
Discount rate: The discount rate is based on the prevailing market yields of Indian government securities as at the balance sheet date for the estimated term of the obligations.
Salary Escalation Rate: The estimates of future salary increases, considered in actuarial valuation, takes into account the inflation, seniority, promotion and other relevant factors such as supply and demand in the employment market.
The amounts of the present value of the obligation and experience adjustment arising on plan liabilities are as below :
(` in million)
Particulars As at year ended 31
March 2016
As at year ended 31
March 2015
As at year ended 31
March 2014
As at year ended 31
March 2013
As at year ended 31
March 2012
Defined Benefit Obligation at end of the period 536.0 586.7 409.4 366.1 348.6
Experience gain/loss adjustment on plan liabilities (11.2) (16.4) (48.9) 12.5 82.8
Actuarial gain/(loss) due to change in assumption 10.6 92.7 31.3 (60.5) (75.8)
NOTE-2.30 DETAILS OF UNHEDGED FOREIGN CURRENCY EXPOSUREThe year-end foreign currency exposures that have not been hedged by a derivative instrument are as below:a. Amount receivable in foreign currency on account of the following
Particulars As at 31 March 2016 As at 31 March 2015
` In million Amount in foreign currency
` In million Amount in foreign currency
Export of goodsEUR 106.4 1,411,611 26.7 397,229
GBP 32.5 340,400 17.0 183,810
USD 2,555.3 38,567,356 1,819.6 29,103,996
AUD 208.5 4,090,310 52.2 1,098,902
Loans & advancesAUD 55.7 1,092,322 51.9 1,092,322
EUR 17.0 225,108 1.4 20,500
USD 1,138.3 17,180,486 830.6 13,289,114
CHF 14.1 205,125 - -
JPY 4.7 7,999,983 - -
b. Amount payable in foreign currency on account of the following
Particulars As at 31 March 2016 As at 31 March 2015
` In million Amount in foreign currency
` In million Amount in foreign currency
Import of goods and servicesUSD 668.0 10,081,812 166.9 2,670,727
EUR 3.2 42,925 70.8 1,053,039
AUD 11.0 215,333 6.5 137,689
GBP 13.7 143,332 0.4 3,803
CHF 0.0 306 - -
JPY 0.1 152,855 - -
Unsecured loansUSD 1,822.0 27,500,000 1,093.8 17,500,000
Secured loansUSD 629.4 9,500,000 875.0 14,000,000

CO
RP
OR
AT
E O
VE
RV
IEW
FIN
AN
CIA
L STAT
EM
EN
TS
STAT
UTO
RY
RE
PO
RT
S
ANNUAL REPORT 2015-16 129
Notesto the Standalone Financial Statements
Standalone Financial Statements
NOTE-2.31 The Company has entered into non - cancellable operating lease agreements for premises/car/Computers. Rent expenses debited to the Statement of Profit and Loss is as below:
(` in million)
Particulars Year ended 31 March 2016
Year ended 31 March 2015
Rent expense 129.1 147.6
Total 129.1 147.6
The future minimum lease payments in respect of the non cancellable lease agreements as on the year end is as below:
(` in million)
Particulars Year ended 31 March 2016
Year ended 31 March 2015
Not later than one year 25.4 37.5
Later than one year but not later than five years 42.9 47.5
Later than five years 1.0 1.9
Total 69.3 86.9
NOTE-2.32 Segmental Reporting as required by Accounting Standard – 17 (AS-17)
The Company has presented data relating to its segments based on its consolidated financial statements, Accordingly, in terms of paragraph 4 of the Accounting Standard 17 (AS-17) “Segment Reporting”, no disclosures related to segments are presented in this standalone financial statement.
NOTE-2.33 The aggregate amount of revenue expenditure incurred during the period on Research and Development and shown in the respective heads of account is ` 2,020.1 million (Previous year ` 1,513.1 million).
NOTE-2.34 Earnings per share (EPS) (` in million)
Particulars Year ended 31 March 2016
Year ended 31 March 2015
Profit /(loss) after tax attributable to equity shareholders ` in millions A 6,384.4 3,676.9
Weighted average number of equity shares outstanding
during the year
Nos. B 119,565,000 119,565,000
Basic and diluted earnings per equity share (`) - Face value
of ` 2 per share
In ` (A / B) 53.40 30.75
Since the split in face value of equity shares from ` 10 each to ` 2 each fully paid up and the issue of bonus shares in the ratio of 1 fully paid up equity shares of face value of ` 2 each for each existing equity shares of face value of ` 2 each is an issue without consideration, the issue is treated as if it had occurred prior to the beginning of the year 2014-15, the earliest period reported.
NOTE-2.35 DISCLOSURE AS PER ACCOUNTING STANDARD (AS 29) FOR PROVISIONS IS AS UNDER:Provision for anticipated sales return:
(` in million)
Particulars As at 31 March 2016
As at 31 March 2015
Carrying amount at the beginning of the year 457.5 -
Add: Provision made during the year * 454.4 457.5
Less: Amount used/utilized during the year 291.1 -
Carrying amount at the end of the year 620.8 457.5
Until 31 March 2014, the Company accounted for sales returns on actual returns. With effect from 1 April, 2014, in line with an opinion of Expert Advisory
Committee of the Institute of Chartered Accountants of India on accounting for sales returns, the Company has revised its approach by accounting for
anticipated sales returns and has recorded a cumulative provision for anticipated sales returns during the year ended 31 March, 2015, by charging it to
Statement of profit and loss.

ALKEM LABORATORIES LTD.130
Notesto the Standalone Financial Statements
NOTE-2.36 Information on related party transactions as required by Accounting Standard 18 (AS 18) on related party disclosures for the year ended 31 March 2016.
A. List of related parties and their relationship
A Subsidiaries and Step down SubsidiariesAlkem Laboratories (NIG) Limited Nigeria
Alkem Laboratories (PTY) Limited South Africa
Alkem Pharma GmbH Germany
Alkem Laboratories Corporation Philippines
S & B Holdings B.V. Netherlands
Pharmacor Pty Limited Australia
ThePharmaNetwork, LLC ( Wholly owned Subsidiary of S&B Holdings B.V) United States of America
Ascend Laboratories SDN BHD. Malaysia
Ascend Laboratories SpA Chile
Enzene Biosciences Ltd. India
Alkem Laboratories Korea Inc Korea
Pharmacor Ltd. Kenya
S & B Pharma Inc. United States of America
The PharmaNetwork, LLP Kazakhstan
Ascend Laboratories, LLC ( Wholly owned by ThePharmanetwork, LLC) United States of America
Alkem Real Estate LLP (up to 11 September 2015) India
Ascend Laboratories (UK) Ltd. United Kingdom
Cachet Pharmaceuticals Pvt. Ltd (w.e.f 27 March 2015) India
Indchemie Health Specialities Pvt. Ltd.(w.e.f 30 March 2015) India
B Key Managerial Personnel ("KMP")Mr. Samprada Singh Chairman Emeritus
Mr. Basudeo Narain Singh Executive Chairman
Mr. Balmiki Prasad Singh Director
Mr. Dhananjay Kumar Singh Joint Managing Director
Mr. Mrityunjay Kumar Singh Director
Mr. Sandeep Singh Joint Managing Director
Mr. Nawal Kishore Singh (up to 2 January 2015) Director
Mr. Prabhat Narain Singh (up to 20 February 2015) Director
Mr. Prabhat Agrawal (w.e.f. 21 October 2014) Chief Executive Officer
C. Relatives of Key Management Personnel ("KMP") with whom transactions have taken place during the year.Mr. Satish Kumar Singh Son of Samprada Singh
Mrs. Jayanti Sinha Sister of Samprada Singh
Mrs. Archana Singh Daughter of Basudev Narain Singh
Mr. Sarandhar Singh Son of Balmiki Prasad Singh
Mr. Srinivas Singh Son of Balmiki Prasad Singh
Mr. Sarvesh Singh Brother of Sandeep Singh
Mrs. Manju Singh Wife of Balmiki Prasad Singh
Mrs. Premlata Singh Mother of Sandeep Singh
Mrs. Madhurima Singh Wife of Dhananjay Kumar Singh
Mrs. Seema Singh Wife of Mritunjay Kumar Singh
Ms. Divya Singh Daughter of Dhananjay kumar Singh
Mst. Aniruddha Singh Son of Dhananjay Kumar Singh
Ms. Meghna Singh Daughter of Mritunjay Kumar Singh
Shrey Shree Anant Singh Son of Mritunjay Kumar Singh
Ms. Inderjit Arora Wife of Sandeep singh
Mrs. Rekha Singh Wife of Basudev Narain Singh

CO
RP
OR
AT
E O
VE
RV
IEW
FIN
AN
CIA
L STAT
EM
EN
TS
STAT
UTO
RY
RE
PO
RT
S
ANNUAL REPORT 2015-16 131
Notesto the Standalone Financial Statements
Standalone Financial Statements
Mr. Nawal Kishore Singh Son of Samprada Singh
Shalini Singh (up to 2 January 2015) Daughter of Nawal Kishore Singh
Neha Singh (up to 2 January 2015) Daughter of Nawal Kishore Singh
Khushboo Singh (up to 2 January 2015) Daughter of Nawal Kishore Singh
Anju Singh (up to 2 January 2015) Wife of Nawal Kishore Singh
D Entities in which Key Management Personnel’s and their relatives have significant influence and with whom transactions have taken place during the year (“Entities”):
M/s Galpha Laboratories Ltd., M/s. Samprada Singh (HUF),Cachet Pharmaceuticals Pvt. Ltd (up to 27 March, 2015) ,Indchemie Health Specialities Pvt. Ltd.(up to 30 March, 2015)
Details of Transactions with Related Parties
(` in million)
Sr.
No.
Particulars Year ended 31 March 2016
Subsidiaries/Step down
subsidiaries
Key Management
Personnel
Relatives of Key
Management Personnel
Entities Total
a b c d
1 Remuneration* - 398.4 82.0 - 480.4
- (307.7) (22.9) - (330.6)
2 Loans Taken - - - - -
- (319.2) - - (319.2)
3 Loans Repaid - - - - -
- (679.9) (283.8) (2.6) (966.3)
4 Interest expense on loans taken - - - - -
- (37.7) (24.1) (0.3) (62.1)
5 Purchase of stock in trade 1,694.9 - - 383.0 2,077.9
- - - (2,003.1) (2,003.1)
6 Sale of Finished Goods 4,944.1 28.3 4,972.4
(2,061.1) - - (59.4) (2,120.5)
7 Sale of Raw and Packing Materials 20.9 - - 7.7 28.6
- - - (15.8) (15.8)
8 Purchase of Raw and Packing Materials 2.4 - - 49.5 51.9
- - - (90.8) (90.8)
9 Services received 338.7 - - 15.8 354.5
- - - (117.1) (117.1)
10 Services rendered 0.3 - - 11.1 11.4
- - - (23.1) (23.1)
11 Rental Income 13.9 - - 3.3 17.2
- - - (16.5) (16.5)
12 Rent Expenses - 0.6 3.2 - 3.8
- (0.6) (3.4) - (4.0)
13 Investments made 602.9 - - - 602.9
(2,382.5) - - - (2,382.5)
14 Final/Interim Dividend paid - 416.3 580.3 1.9 998.5
- (147.1) (185.1) (0.6) (332.8)
15 Loans Given (net) 252.5 (3.0) - - 249.5
(221.1) (3.0) - - (224.1)
16 Sale of Assets/Assets under
construction
3.6 - - - 3.6
- (34.7) - (0.5) (35.2)

ALKEM LABORATORIES LTD.132
Notesto the Standalone Financial Statements
(` in million)
Sr.
No.
Particulars Year ended 31 March 2016
Subsidiaries/Step down
subsidiaries
Key Management
Personnel
Relatives of Key
Management Personnel
Entities Total
a b c d
17 Refund of share application money 8.6 - - - 8.6
- - - -
18 Reimbursement of expenses to 146.3 - - - 146.3
(79.6) - - - (79.6)
19 Reimbursement of expenses from 20.0 - - 0.3 20.3
(13.8) - - (2.3) (16.1)
20 Interest Income on loans given 82.7 0.2 - - 82.9
(41.9) (0.1) - - (42.0)
21 Bonds/Debentures/Fixed Deposits
pledged against loan taken
1,633.0 - - - 1,633.0
(1,387.5) - - - (1,387.5)
22 Dividend received 7.7 - - - 7.7
- - - - -
*Remuneration does not include charge for gratuity and leave encashment as employee-wise break-up is not available.
Figures in the brackets are the corresponding figures of the previous year.
Out of the above items transactions in excess of 10% of the total related party transactions
(` in million)
Sr.
No.
Transactions Related Party relation Year ended 31 March 2016
Year ended 31 March 2015
1 Remuneration
Mr. Samprada Singh Key Management Personnel 126.0 85.5
Mr. Basudeo Narain Singh Key Management Personnel 86.9 86.4
Mr. Nawal Kishore Singh Key Management Personnel - 68.6
Mr. Prabhat Agrawal Chief Executive Officer 58.7 -
2 Loans Taken
Mr. Basudeo Narain Singh Key Management Personnel - 122.5
Mr. Dhananjay Kumar Singh Key Management Personnel - 35.3
Mr. Samprada Singh Key Management Personnel - 55.0
Mr. Balmiki Prasad Singh Key Management Personnel - 105.2
3 Loans Repaid
Mr. Basudeo Narain Singh Key Management Personnel - 238.9
Mr. Samprada Singh Key Management Personnel - 124.6
Mr. Balmiki Prasad Singh Key Management Personnel - 200.1
Mrs. Rekha Singh Relative of KMP - 126.6
4 Interest Expenses on Loans Taken
Mr. Balmiki Prasad Singh Key Management Personnel - 12.8
Mr. Basudeo Narain Singh Key Management Personnel - 13.6
Mrs. Rekha Singh Relative of KMP - 8.7

CO
RP
OR
AT
E O
VE
RV
IEW
FIN
AN
CIA
L STAT
EM
EN
TS
STAT
UTO
RY
RE
PO
RT
S
ANNUAL REPORT 2015-16 133
Notesto the Standalone Financial Statements
Standalone Financial Statements
(` in million)
Sr.
No.
Transactions Related Party relation Year ended 31 March 2016
Year ended 31 March 2015
5 Purchase of stock in trade
Cachet Pharmaceuticals Pvt. Ltd. Subsidiary 735.8 722.0
Indchemie Health Specialties Pvt. Ltd. Subsidiary 958.6 866.3
Galpha Laboratories Limited Entities 383.0 414.7
6 Sale of Finished Goods
Ascend Laboratories, LLC Step Down Subsidiary 4,075.8 1,588.4
7 Sale of raw and packing materials
Indchemie Health Specialties Pvt. Ltd. Subsidiary 20.8 11.4
Galpha Laboratories Limited Entities 7.7 2.9
8 Purchase of raw and packing materials
Galpha Laboratories Limited Entities 49.5 87.9
9 Services received
Indchemie Health Specialties Pvt. Ltd. Subsidiary 64.7 79.8
Cachet Pharmaceuticals Pvt. Ltd. Subsidiary 51.9 20.9
Galpha Laboratories Limited Entities - 16.4
S&B Pharma Inc., USA Subsidiary 219.8 62.1
10 Services rendered
Galpha Laboratories Limited Entities 11.1 22.8
11 Rental Income
Indchemie Health Specialties Pvt. Ltd. Subsidiary 10.7 10.2
Galpha Laboratories Limited Entities 3.3 3.3
Cachet Pharmaceuticals Pvt. Ltd. Subsidiary 3.2 3.0
12 Rent Expenses
Mr. Dhananjay Kumar Singh Key Management Personnel 0.6 0.6
Mrs. Divya Singh Relative of KMP 1.1 1.1
Mrs. Madhurima Singh Relative of KMP 1.1 1.3
Mr. Sarvesh Singh Relative of KMP 1.0 1.0
13 Investments made
Cachet Pharmaceuticals Pvt. Ltd. Subsidiary - 638.9
Indchemie Health Specialties Pvt. Ltd. Subsidiary - 1,640.7
Enzene Biosciences Ltd. India Subsidiary 497.4 -
The PharmaNetwork, LLP Subsidiary 100.5 -
14 Final/Interim Dividend paid
Mr. Basudeo Narain Singh Key Management Personnel 106.5 38.1
Mr. Jayanti Sinha Relatives of KMP - 34.3
15 a) Loans Given
Ascend Laboratories SpA, Chile Subsidiary - 92.2
Alkem Laboratories Corporation, Philippines Subsidiary - 57.6
Enzene Biosciences Ltd. India Subsidiary 229.4 67.3
S&B Pharma Inc. USA Subsidiary - 56.8

ALKEM LABORATORIES LTD.134
Notesto the Standalone Financial Statements
(` in million)
Sr.
No.
Transactions Related Party relation Year ended 31 March 2016
Year ended 31 March 2015
b) Loans Repayment
S&B Holdings B.V. Netherland Subsidiary - 65.0
Pharmacor Pty Limited Subsidiary 2.5 -
Mr. Prabhat Agrawal Key Management Personnel 3.0
16 Sale of Assets/Assets under construction
Mr. Basudeo Narayan Singh Key Management Personnel - 34.7
Enzene Biosciences Ltd. India Subsidiary 3.6 -
17 Refund of share application money
Enzene Biosciences Ltd. India Subsidiary 8.6 -
18 Reimbursement of expenses to
Ascend Laboratories, LLC USA Step Down Subsidiary 116.9 -
Pharmacor Pty Limited Subsidiary - 13.3
S&B Pharma Inc., USA Subsidiary 20.9 62.1
19 Reimbursement of expenses from
The PharmaNetwork LLC Step Down Subsidiary 11.8 13.8
S & B Pharma Inc, USA Subsidiary 6.5 -
20 Interest Income on loans given
Enzene Biosciences Ltd. India Subsidiary 36.3 19.0
S & B Pharma Inc, USA Subsidiary 26.4 20.2
Ascend Laboratories Spa (Chille) Subsidiary 9.5 -
21 Bonds pledged against loan taken by
The PharmaNetwork LLC Step Down Subsidiary 805.1 1,387.5
S & B Pharma Inc, USA Subsidiary 644.1 -
Ascend Laboratories Spa (Chille) Subsidiary 128.8 -
22 Dividend received
Indchemie Health Specialties Pvt. Ltd. Subsidiary 7.7 -
Balance due from / to the related Parties
(` in million)
Sr.
No.
Particulars As at 31 March 2016
Subsidiaries/Step down
subsidiaries
Key Management
Personnel
Relatives of Key
Management Personnel
Entities Total
1 Outstanding Receivables (net of provision for
doubtful debts of ` 108.0 million)
2,515.1 - - - 2,515.1
2 Outstanding Payables 306.1 - - 43.7 349.8
3 Investments 6,504.9 - - - 6,504.9
4 Loans Receivable (net of provision for doubtful
advances of ` 35.2 million)
1,495.1 - - - 1,495.1
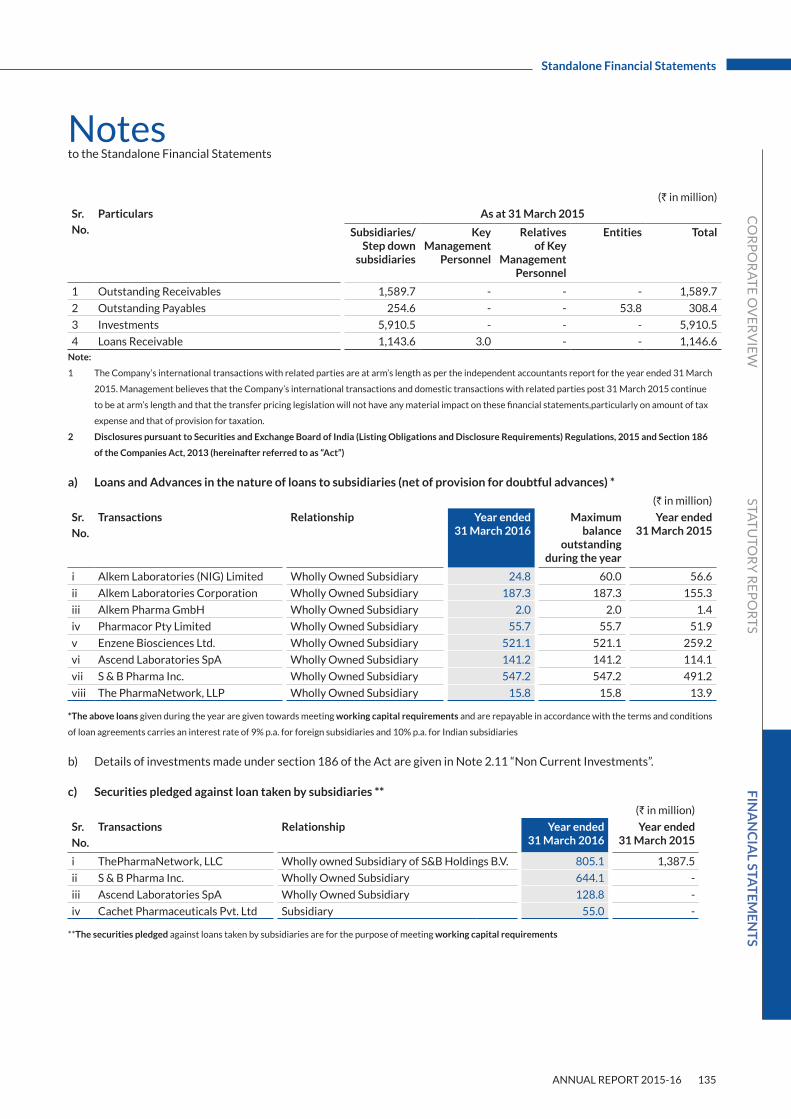
CO
RP
OR
AT
E O
VE
RV
IEW
FIN
AN
CIA
L STAT
EM
EN
TS
STAT
UTO
RY
RE
PO
RT
S
ANNUAL REPORT 2015-16 135
Notesto the Standalone Financial Statements
Standalone Financial Statements
(` in million)
Sr.
No.
Particulars As at 31 March 2015
Subsidiaries/Step down
subsidiaries
Key Management
Personnel
Relatives of Key
Management Personnel
Entities Total
1 Outstanding Receivables 1,589.7 - - - 1,589.7
2 Outstanding Payables 254.6 - - 53.8 308.4
3 Investments 5,910.5 - - - 5,910.5
4 Loans Receivable 1,143.6 3.0 - - 1,146.6Note:
1 The Company’s international transactions with related parties are at arm’s length as per the independent accountants report for the year ended 31 March
2015. Management believes that the Company’s international transactions and domestic transactions with related parties post 31 March 2015 continue
to be at arm’s length and that the transfer pricing legislation will not have any material impact on these financial statements,particularly on amount of tax
expense and that of provision for taxation.
2 Disclosures pursuant to Securities and Exchange Board of India (Listing Obligations and Disclosure Requirements) Regulations, 2015 and Section 186
of the Companies Act, 2013 (hereinafter referred to as “Act”)
a) Loans and Advances in the nature of loans to subsidiaries (net of provision for doubtful advances) *
(` in million)
Sr.
No.
Transactions Relationship Year ended 31 March 2016
Maximum balance
outstanding during the year
Year ended 31 March 2015
i Alkem Laboratories (NIG) Limited Wholly Owned Subsidiary 24.8 60.0 56.6
ii Alkem Laboratories Corporation Wholly Owned Subsidiary 187.3 187.3 155.3
iii Alkem Pharma GmbH Wholly Owned Subsidiary 2.0 2.0 1.4
iv Pharmacor Pty Limited Wholly Owned Subsidiary 55.7 55.7 51.9
v Enzene Biosciences Ltd. Wholly Owned Subsidiary 521.1 521.1 259.2
vi Ascend Laboratories SpA Wholly Owned Subsidiary 141.2 141.2 114.1
vii S & B Pharma Inc. Wholly Owned Subsidiary 547.2 547.2 491.2
viii The PharmaNetwork, LLP Wholly Owned Subsidiary 15.8 15.8 13.9
*The above loans given during the year are given towards meeting working capital requirements and are repayable in accordance with the terms and conditions
of loan agreements carries an interest rate of 9% p.a. for foreign subsidiaries and 10% p.a. for Indian subsidiaries
b) Details of investments made under section 186 of the Act are given in Note 2.11 “Non Current Investments”.
c) Securities pledged against loan taken by subsidiaries **
(` in million)
Sr.
No.
Transactions Relationship Year ended 31 March 2016
Year ended 31 March 2015
i ThePharmaNetwork, LLC Wholly owned Subsidiary of S&B Holdings B.V. 805.1 1,387.5
ii S & B Pharma Inc. Wholly Owned Subsidiary 644.1 -
iii Ascend Laboratories SpA Wholly Owned Subsidiary 128.8 -
iv Cachet Pharmaceuticals Pvt. Ltd Subsidiary 55.0 -
**The securities pledged against loans taken by subsidiaries are for the purpose of meeting working capital requirements

ALKEM LABORATORIES LTD.136
Notesto the Standalone Financial Statements
NOTE-2.37 During the year ended 31 March 2016, the Company has sold brands and trademarks relating to its In Vitro Fertilisation (IVF) formulations to Ordain Health Care Global Private Limited for a total consideration of ` 205.0 million.
NOTE-2.38 PAYMENT TO AUDITORS (EXCLUDING SERVICE TAX) (` in million)
Particulars Year ended 31 March 2016
Year ended 31 March 2015
As Auditor
Audit fees 7.7 4.5
In other capacity
Taxation matters 0.6 -
In any other services such as certification, etc. 4.9 0.0
Reimbursement of out of pocket expenses 0.5 0.2
Other Services (In connection with intial public offering)* 16.4 -
Total 30.1 4.7
*The amount is recovered from shareholders whose shares were offered for sale in the intial public offering.
NOTE-2.39 ADDITIONAL INFORMATION PURSUANT TO THE PROVISIONS OF PARAGRAPH 5(VIII) OF SCHEDULE III
a) Consumption of Raw materials (` in million)
Items Year ended 31 March 2016
Year ended 31 March 2015
Antibiotics 4,172.0 4,013.1
Analgesics 135.7 58.8
Others 2,727.8 2,094.4
Total 7,035.5 6,166.3
b) Value and % of Imported & Indigenous Raw Materials, Spare parts & Components consumed:
(` in million)
Particulars Year ended 31 March 2016
Year ended 31 March 2015
(i) Raw Materials:
Imported
Value 987.1 1395.5
% of total consumption 14.03% 22.63%
Indigenous
Value 6,048.4 4,770.8
% of total consumption 85.97% 77.37%
Total
Value 7,035.5 6,166.3
% of total consumption 100.00% 100.00%
(ii) Stores & Spares:
Imported
Value 102.9 107.3
% of total consumption 25.84% 25.63%
Indigenous
Value 295.4 311.4
% of total consumption 74.16% 74.37%

CO
RP
OR
AT
E O
VE
RV
IEW
FIN
AN
CIA
L STAT
EM
EN
TS
STAT
UTO
RY
RE
PO
RT
S
ANNUAL REPORT 2015-16 137
Notesto the Standalone Financial Statements
Standalone Financial Statements
(` in million)
Particulars Year ended 31 March 2016
Year ended 31 March 2015
Total
Value 398.3 418.7
% of total consumption 100.00% 100.00%
c) Value of Imports (on CIF basis) (` in million)
Particulars Year ended 31 March 2016
Year ended 31 March 2015
Raw Materials 1,138.3 1,207.2
Components, Stores and Spare Parts 102.9 107.3
Capital Goods 299.1 141.2
Total 1,540.3 1,455.7
d) Earnings in Foreign currrency (accrual basis) (` in million)
Particulars Year ended 31 March 2016
Year ended 31 March 2015
Export of goods (at F.O.B.) 6,461.1 3,443.8
Freight 11.2 4.3
Royalty income 44.5 41.5
Interest income 46.5 22.6
Others - 3.9
Total 6,563.3 3,516.1
e) Expenditure in Foreign currency (accrual basis) (` in million)
Particulars Year ended 31 March 2016
Year ended 31 March 2015
Travelling Expenses 31.0 79.7
Salaries 112.6 113.7
Legal and Professional Fees 552.8 291.3
License Fees and Product Registrations 172.7 211.5
Clinical and analytical charges 165.9 37.2
Miscellaneous Expenses 436.4 401.0
Total 1,471.4 1,134.4
NOTE-2.40 DETAILS OF PURCHASES, TURNOVER AND INVENTORY
a) Purchases of stock in trade: (` in million)
Classification Year ended 31 March 2016
Year ended 31 March 2015
Tablets 1,443.8 1,415.9
Capsules 1,158.6 1,039.9
Dry Syrups 38.5 94.2
Liquids 1,411.2 1,254.1
Injections 883.9 739.2
Others 1,183.4 1,020.2
Total 6,119.4 5,563.5

ALKEM LABORATORIES LTD.138
Notesto the Standalone Financial Statements
b) Turnover: (` in million)
Classification Finished Goods Stock in Trade
Year ended 31 March 2016
Year ended 31 March 2015
Year ended 31 March 2016
Year ended 31 March 2015
Tablets 12,873.9 10,374.5 3,031.9 2,804.2
Capsules 5,415.7 4,068.5 3,094.8 2,672.3
Dry Syrup 2,873.1 1,757.8 127.1 177.9
Liquids 802.4 780.5 2,310.3 2,003.1
Injections 4,659.7 4,662.2 1,227.9 1,149.3
Bulk Drugs 1.1 1.3 - -
Others 1,061.6 917.8 2,050.3 373.4
Total 27,687.6 22,562.7 11,842.3 9,180.2
c) Inventories (finished goods including stock-in-trade) (` in million)
Classification As at 31 March 2016
As at 31 March 2015
Tablets 1,185.0 1,068.6
Capsules 799.5 763.9
Dry Syrup 159.6 155.5
Liquids 431.9 355.0
Injections 909.9 838.5
Bulk Drugs 30.1 15.4
Others 394.8 376.1
Total 3,910.8 3,573.0
d) Inventories (work-in-progress) (` in million)
Classification As at 31 March 2016
As at 31 March 2015
Formulations 233.4 232.2
Bulk Drugs 11.3 9.7
Total 244.7 241.9
NOTE-2.41 DERIVATIVE CONTRACTSCompany has entered into an interest rate swap contract to hedge the interest rate risk with respect to the foreign currency borrowing with a variable interest rates based on LIBOR. The Company has fair valued the financial instruments and the reversal of mark to market losses on the instrument has been recognised to the Statement of Profit and Loss during the year amounting to ` 3.1 million ( Previous year ` 10.9 million - Charged to the statement of profit & loss)
NOTE-2.42 The gross amount required to be spent on Corporate Social Responsibilities (“CSR”) by the Company during the year is ` 90.9 million (Previous year : ` 94.6 million) The Company has spent ` 30.1 million (Previous Year : 12.0 million) towards CSR as per the approved CSR policy of the Company on healthcare, women empowerment, education, sanitation, conservation of environment, rural development.

CO
RP
OR
AT
E O
VE
RV
IEW
FIN
AN
CIA
L STAT
EM
EN
TS
STAT
UTO
RY
RE
PO
RT
S
ANNUAL REPORT 2015-16 139
Notesto the Standalone Financial Statements
Standalone Financial Statements
Amount spent during the year on:
In Cash Yet to be paid in cash
Total
i) Construction/acquisition of any asset - - -
- - -
ii) On purposes other than (i) above 30.1 - 30.1
(12.0) - (12.0)
Figures in the brackets are the corresponding figures of the previous year.
NOTE-2.43 During the previous year, the Company has settled some pending legal matters. As a part of such settlements, the Company has paid ` 262.5 million which is shown under Miscellaneous expenses in Other Expenses in previous year under note 2.26.
NOTE-2.44 During the year ended 31 March 2016, considering future growth requirement of domestic business, the Company has commenced construction of new units at Sikkim which will be entitled for fiscal incentives including benefit under income tax. Further, Finance Act 2016 has partially extended income tax benefit on Research and Development expenditure up to fiscal year 2019-20. These factors may result into lower utilisation of accumulated MAT credit entitlement. Consequently, MAT credit entitlement of ` 834.1 million has been written off during the year, which is shown under “MAT entitlement credit of earlier years written off” in Tax Expenses.
NOTE-2.45 Previous year’s figures have been regrouped wherever necessary to conform to this year’s classification.
As per our report of even date attached, For and on behalf of the Board of Directors of Alkem Laboratories Limited CIN: U00305MH1973PLC174201
For B S R & Co. LLP Samprada Singh B.N. Singh D.K.SinghChartered Accountants Chairman Emeritus Executive Chairman Joint Managing DirectorFirm’s Registration No. 101248W/W-100022 DIN No.00760279 DIN No.00760310 DIN No.00739153
Sandeep Singh B.P. Singh M.K. SinghSadashiv Shetty Joint Managing Director Director DirectorPartner DIN No.01277984 DIN No.00739856 DIN No.00881412
Membership No. 048648 Prabhat Agrawal Rajesh Dubey Manish NarangChief Executive Officer Chief Financial Officer Sr.VP - Legal & Company Secretary
Mumbai P.V.Damodaran Mumbai
Date : 27 May, 2016 VP - Business Finance Date : 27 May, 2016

ALKEM LABORATORIES LTD.140
Independent Auditor’s Report
The Members ofAlkem Laboratories Limited
REPORT ON THE CONSOLIDATED FINANCIAL STATEMENTSWe have audited the accompanying consolidated financial statements of Alkem Laboratories Limited (hereinafter referred to as “the Holding Company”) and its subsidiaries (the Holding Company and its subsidiaries together referred to as “the Group”), comprising of the Consolidated Balance Sheet as at 31 March 2016, the Consolidated Statement of Profit and Loss, the Consolidated Cash Flows Statement for the year then ended, and a summary of significant accounting policies and other explanatory information (hereinafter referred to as “the consolidated financial statements”).
MANAGEMENT’S RESPONSIBILITY FOR THE CONSOLIDATED FINANCIAL STATEMENTSThe Holding Company’s Board of Directors is responsible for the preparation of these consolidated financial statements in terms of the requirements of the Companies Act, 2013 (hereinafter referred to as “the Act”) that give a true and fair view of the consolidated financial position, consolidated financial performance and consolidated cash flows of the Group in accordance with the accounting principles generally accepted in India, including the Accounting Standards specified under Section 133 of the Act, read with Rule 7 of the Companies (Accounts) Rules, 2014 (particularly Accounting Standard 21, Consolidated Financial Statements). The respective Board of Directors of the companies included in the Group are responsible for maintenance of adequate accounting records in accordance with the provisions of the Act, for safeguarding the assets of the Group and for preventing and detecting frauds and other irregularities; the selection and application of appropriate accounting policies; making judgments and estimates that are reasonable and prudent; and the design, implementation and maintenance of adequate internal financial controls, that were operating effectively for ensuring the accuracy and completeness of the accounting records, relevant to the preparation and presentation of the financial statements that give a true and fair view and are free from material misstatement, whether due to fraud or error, which have been used for the purpose of preparation of the consolidated financial statements by the Directors of the Holding Company, as aforesaid.
AUDITOR’S RESPONSIBILITYOur responsibility is to express an opinion on these consolidated financial statements based on our audit. While conducting the audit, we have taken into account the provisions of the Act, the accounting and auditing standards and matters which are required to be included in the audit report under the provisions of the Act and the Rules made there under.
We conducted our audit in accordance with the Standards on Auditing specified under Section 143(10) of the Act. Those Standards require that we comply with ethical requirements and plan and perform the audit to obtain reasonable assurance about whether the consolidated financial statements are free from material misstatement.
An audit involves performing procedures to obtain audit evidence about the amounts and the disclosures in the consolidated financial statements. The procedures selected depend on the auditor’s judgment, including the assessment of the risks of material misstatement of the consolidated financial statements, whether due to fraud or error. In making those risk assessments, the auditor considers internal financial control relevant to the Holding Company’s preparation of the consolidated financial statements that give a true and fair view in order to design audit procedures that are appropriate in the circumstances. An audit also includes evaluating the appropriateness of the accounting policies used and the reasonableness of the accounting estimates made by the Holding Company’s Board of Directors, as well as evaluating the overall presentation of the consolidated financial statements.
We believe that the audit evidence obtained by us and the audit evidence obtained by the other auditors in terms of their reports referred to in the Other Matters paragraph below, is sufficient and appropriate to provide a basis for our audit opinion on the consolidated financial statements.
OPINIONIn our opinion and to the best of our information and according to the explanations given to us and based on the consideration of reports of other auditors on separate financial statements of the subsidiaries, the aforesaid consolidated financial statements give the information required by the Act in the manner so required and give a true and fair view in conformity with the accounting principles generally accepted in India:
i) in the case of Consolidated Balance Sheet, of the consolidated state of affairs of the Group as at 31 March 2016;
ii) in the case of the Consolidated Statement of Profit and Loss, of the consolidated profits for the year ended on that date; and
iii) in the case of the Consolidated Cash Flow Statement, of the consolidated cash flows for the year ended on that date.

ANNUAL REPORT 2015-16 141
CO
RP
OR
AT
E O
VE
RV
IEW
FIN
AN
CIA
L STAT
EM
EN
TS
STAT
UTO
RY
RE
PO
RT
S
Consolidated Financial Statements
OTHER MATTERSWe did not audit the financial statements and other financial information of seventeen subsidiaries. These subsidiaries reflect total assets of ` 17,178.2 million as at 31 March 2016, total revenues of ` 17,818.1 million and net cash inflows amounting to ` 995.6 million for the year then ended, as considered in the consolidated financial statements. Of the above:
(a) The financial statements and other financial information of nine subsidiaries incorporated outside India, as drawn up in accordance with the generally accepted accounting principles of those respective countries (‘the local GAAP’), have been audited by other auditors duly qualified to act as auditors in those countries and whose reports have been furnished to us. For the purpose of preparation of the consolidated financial statements, the aforesaid local GAAP financial statements have been restated by the management, so that they conform to the generally accepted accounting principles in India. These subsidiaries, reflect total assets of ` 9005.3 million as at 31 March 2016, total revenues of ` 11,781.8 million and net cash inflows amounting to ` 163.3 million for the year then ended, as considered in the consolidated financial statements. Our opinion on the consolidated financial statements, insofar as it relates to these subsidiaries, is based solely on the aforesaid audit reports of those other auditors.
(b) The financial statements and other financial information of the remaining eight subsidiaries, whose financial statements reflect total assets of ` 8172.9 million as at 31 March 2016, total revenues of ` 6,036.3 million and net cash inflows amounting to ` 832.3 million for the year then ended, as considered in the consolidated financial statements, have been audited by other auditors whose reports have been furnished to us by the management and our opinion on the consolidated financial statements, in so far as it relates to the amounts and disclosures included in respect of these subsidiaries, is based solely on the reports of the other auditors.
Our opinion on the consolidated financial statements, and our report on Other Legal and Regulatory Requirements below, is not modified in respect of above matters with respect to our reliance on the work done and the reports of the other auditors
REPORT ON OTHER LEGAL AND REGULATORY REQUIREMENTSAs required by sub-section 3 of Section 143 of the Act, based on our audit and on the consideration of reports of the other auditors on the separate financial statements of subsidiaries, as noted in the ‘Other Matter’ paragraph, we report, to the extent applicable, that:
(a) We have sought and obtained all the information and explanations which to the best of our knowledge and belief were necessary for the purposes of our audit of aforesaid consolidated financial statements.
(b) In our opinion, proper books of account as required by law relating to preparation of the aforesaid consolidated financial statements have been kept so far as it appears from our examination of those books and the reports of the other auditors.
(c) The Consolidated Balance Sheet, the Consolidated Statement of Profit and Loss, and the Consolidated Cash Flow Statement dealt with by this Report are in agreement with the relevant books of account maintained for the purpose of preparation of the consolidated financial statements.
(d) In our opinion, the aforesaid consolidated financial statements comply with the Accounting Standards specified under Section 133 of the Act, read with Rule 7 of the Companies (Accounts) Rules, 2014.
(e) On the basis of the written representation received from the directors of the Holding Company as on 31 March 2016 taken on record by the Board of Directors of the Holding Company and the reports of the statutory auditors of its subsidiary companies incorporated in India, none of the Directors of the Group companies is disqualified as on 31 March 2016 from being appointed as a Director in terms of sub-section 2 of Section 164 of the Act.
(f) With respect to the adequacy of the internal financial controls over financial reporting of the Holding Company and Subsidiaries incorporated in India and the operating effectiveness of such controls, refer to our separate Report in Annexure I; and
(g) With respect to the other matters to be included in the Auditors’ Report in accordance with Rule 11 of the Companies (Audit and Auditors) Rules, 2014, in our opinion and to the best of our information and according to the explanations given to us and based on

ALKEM LABORATORIES LTD.142
the consideration of the reports of the other auditors on separate financial statements as also the other financial information of subsidiaries, as noted in the ‘Other Matter’ paragraph:
i. The consolidated financial statements disclose the impact of pending litigations on the consolidated financial position of the Holding Company and its subsidiary companies – Refer note 2.29 (a) to the consolidated financial statements.
ii. The Holding Company and its subsidiary companies did not have any long-term contracts including derivative contracts for which there were any material foreseeable losses; and
iii. There were no amounts which were required to be transferred to the Investor Education and Protection Fund by the Holding Company and its subsidiary companies incorporated in India during the year ended 31 March 2016.
For B S R & Co. LLP
Chartered Accountants
Firm’s Registration No: 101248W/W-100022
Sadashiv Shetty
Mumbai Partner
27 May 2016 Membership No: 048648
Annexure Ito the Independent Auditor’s Report – 31 March 2016 on the Consolidated Financial Statements
REPORT ON THE INTERNAL FINANCIAL CONTROLS UNDER CLAUSE (i) OF SUB-SECTION 3 OF SECTION 143 OF THE COMPANIES ACT, 2013 (“THE ACT”)In conjunction with our audit of the consolidated financial statements of the Company as of and for the year ended 31 March 2016, we have audited the internal financial controls over financial reporting of Alkem Laboratories Limited (hereinafter referred to as “the Holding Company”) and its subsidiary companies, which are companies incorporated in India, as of that date.
MANAGEMENT’S RESPONSIBILITY FOR INTERNAL FINANCIAL CONTROLSThe respective Board of Directors of the Holding company and its subsidiary companies, which are companies incorporated in India, are responsible for establishing and maintaining internal financial controls based on the internal control over financial reporting criteria established by the Company considering the essential components of internal control stated in the Guidance Note on Audit of Internal Financial Controls Over Financial Reporting issued by the Institute of Chartered Accountants of India (ICAI). These responsibilities include the design, implementation and maintenance of adequate internal financial controls that were operating effectively for ensuring the orderly and efficient conduct of its business, including adherence to the respective company’s policies, the safeguarding of its
assets, the prevention and detection of frauds and errors, the accuracy and completeness of the accounting records, and the timely preparation of reliable financial information, as required under the Companies Act, 2013 (“the Act”).
AUDITORS’ RESPONSIBILITYOur responsibility is to express an opinion on the Company’s internal financial controls over financial reporting based on our audit. We conducted our audit in accordance with the Guidance Note on Audit of Internal Financial Controls Over Financial Reporting (the “Guidance Note”) issued by the ICAI and the Standards on Auditing, issued by ICAI and deemed to be prescribed under section 143(10) of the Act, to the extent applicable to an audit of internal financial controls, both issued by the ICAI. Those Standards and the Guidance Note require that we comply with ethical requirements and plan and perform the audit to obtain reasonable assurance about whether adequate internal financial controls over financial reporting was established and maintained and if such controls operated effectively in all material respects.
Our audit involves performing procedures to obtain audit evidence about the adequacy of the internal financial controls system over financial reporting and their operating effectiveness. Our audit of internal financial controls over financial reporting included obtaining an understanding of internal financial controls over financial reporting, assessing
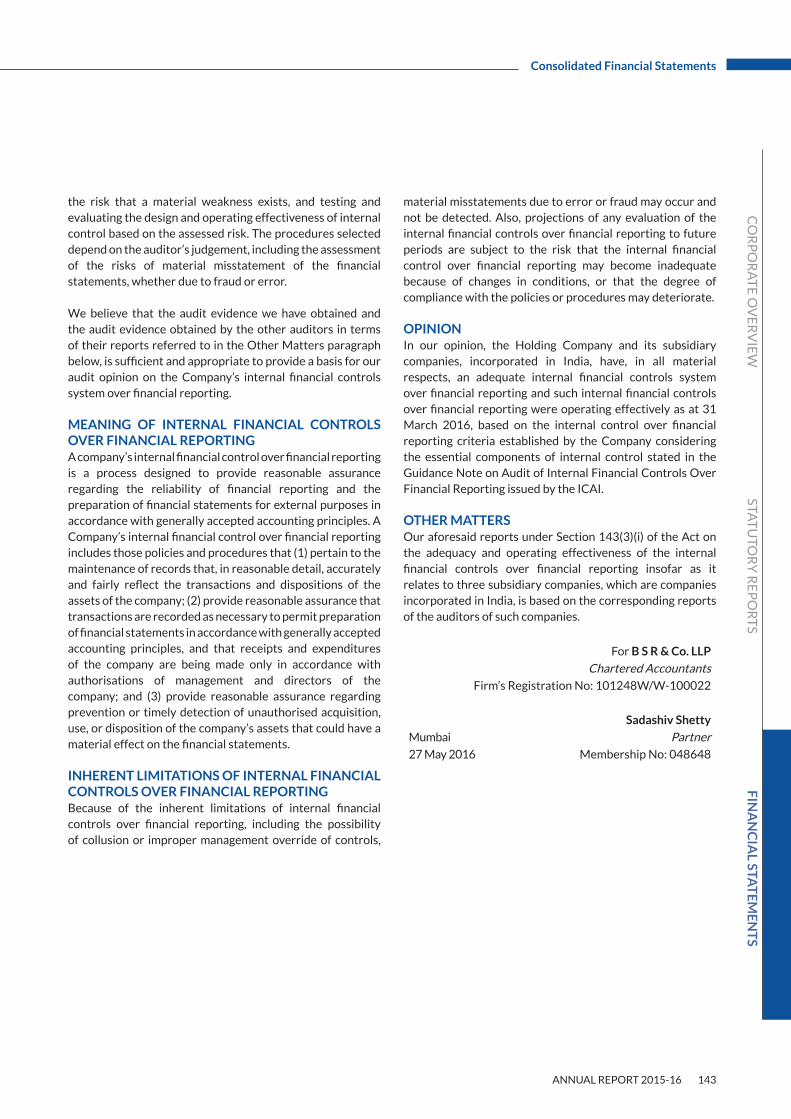
ANNUAL REPORT 2015-16 143
CO
RP
OR
AT
E O
VE
RV
IEW
FIN
AN
CIA
L STAT
EM
EN
TS
STAT
UTO
RY
RE
PO
RT
S
Consolidated Financial Statements
material misstatements due to error or fraud may occur and not be detected. Also, projections of any evaluation of the internal financial controls over financial reporting to future periods are subject to the risk that the internal financial control over financial reporting may become inadequate because of changes in conditions, or that the degree of compliance with the policies or procedures may deteriorate.
OPINIONIn our opinion, the Holding Company and its subsidiary companies, incorporated in India, have, in all material respects, an adequate internal financial controls system over financial reporting and such internal financial controls over financial reporting were operating effectively as at 31 March 2016, based on the internal control over financial reporting criteria established by the Company considering the essential components of internal control stated in the Guidance Note on Audit of Internal Financial Controls Over Financial Reporting issued by the ICAI.
OTHER MATTERSOur aforesaid reports under Section 143(3)(i) of the Act on the adequacy and operating effectiveness of the internal financial controls over financial reporting insofar as it relates to three subsidiary companies, which are companies incorporated in India, is based on the corresponding reports of the auditors of such companies.
For B S R & Co. LLP
Chartered Accountants
Firm’s Registration No: 101248W/W-100022
Sadashiv Shetty
Mumbai Partner
27 May 2016 Membership No: 048648
the risk that a material weakness exists, and testing and evaluating the design and operating effectiveness of internal control based on the assessed risk. The procedures selected depend on the auditor’s judgement, including the assessment of the risks of material misstatement of the financial statements, whether due to fraud or error.
We believe that the audit evidence we have obtained and the audit evidence obtained by the other auditors in terms of their reports referred to in the Other Matters paragraph below, is sufficient and appropriate to provide a basis for our audit opinion on the Company’s internal financial controls system over financial reporting.
MEANING OF INTERNAL FINANCIAL CONTROLS OVER FINANCIAL REPORTINGA company’s internal financial control over financial reporting is a process designed to provide reasonable assurance regarding the reliability of financial reporting and the preparation of financial statements for external purposes in accordance with generally accepted accounting principles. A Company’s internal financial control over financial reporting includes those policies and procedures that (1) pertain to the maintenance of records that, in reasonable detail, accurately and fairly reflect the transactions and dispositions of the assets of the company; (2) provide reasonable assurance that transactions are recorded as necessary to permit preparation of financial statements in accordance with generally accepted accounting principles, and that receipts and expenditures of the company are being made only in accordance with authorisations of management and directors of the company; and (3) provide reasonable assurance regarding prevention or timely detection of unauthorised acquisition, use, or disposition of the company’s assets that could have a material effect on the financial statements.
INHERENT LIMITATIONS OF INTERNAL FINANCIAL CONTROLS OVER FINANCIAL REPORTINGBecause of the inherent limitations of internal financial controls over financial reporting, including the possibility of collusion or improper management override of controls,

ALKEM LABORATORIES LTD.144
(` In million)
Particulars Note No. As At 31 March 2016
As At 31 March 2015
EQUITY AND LIABILITIESShareholders' Funds Share capital 2.1 239.1 239.1 Reserves and surplus 2.2 34,787.4 29,751.4
35,026.5 29,990.5Deferred Government Grant 31.0 35.8Minority Interest 2.42 965.4 856.5Non-Current Liabilities Long-term borrowings 2.3 1,211.6 334.3 Deferred tax liabilities (Net) 2.4 1,027.3 963.5 Other long-term liabilities 2.5 23.0 51.4 Long-term provisions 2.6 778.4 665.8
3,040.3 2,015.0Current Liabilities Short-term borrowings 2.7 4,642.5 11,285.7 Trade payables 2.8 Dues to Micro and Small Enterprises 653.9 467.2 Dues to Others 5,138.9 4,192.1 Other current liabilities 2.9 3,671.3 3,270.6 Short-term provisions 2.10 1,216.9 844.2
15,323.5 20,059.8Total 54,386.7 52,957.6ASSETSNon-Current Assets Fixed assets 2.11 Tangible assets 10,319.2 9,726.5 Intangible assets 565.8 595.9 Capital work-in-progress 1,724.5 1,106.9 Goodwill on consolidation 2.41 3,530.6 3,421.0 Non-current investments 2.12 2,263.4 4,197.3 Deferred tax assets (net) 2.14 82.3 44.8 Long-term loans and advances 2.15 6,440.0 5,421.7 Other non-current assets 2.16 2,399.3 5,063.0
27,325.1 29,577.1Current Assets Current investments 2.13 1,956.7 610.5 Inventories 2.17 9,094.3 7,842.3 Trade receivables 2.18 5,645.1 5,270.8 Cash and bank balances 2.19 7,964.3 7,907.6 Short-term loans and advances 2.20 1,563.9 1,296.3 Other current assets 2.21 837.3 453.0
27,061.6 23,380.5Total 54,386.7 52,957.6Significant Accounting Policies 1Notes to the consolidated financial Statements 2
The accompanying notes are an integral part of these financial statements
Consolidated Balance Sheetas at 31st March, 2016
As per our report of even date attached, For and on behalf of the Board of Directors of Alkem Laboratories Limited CIN: U00305MH1973PLC174201
For B S R & Co. LLP Samprada Singh B.N. Singh D.K.SinghChartered Accountants Chairman Emeritus Executive Chairman Joint Managing DirectorFirm’s Registration No. 101248W/W-100022 DIN No.00760279 DIN No.00760310 DIN No.00739153
Sandeep Singh B.P. Singh M.K. SinghSadashiv Shetty Joint Managing Director Director DirectorPartner DIN No.01277984 DIN No.00739856 DIN No.00881412
Membership No. 048648 Prabhat Agrawal Rajesh Dubey Manish NarangChief Executive Officer Chief Financial Officer Sr.VP - Legal & Company Secretary
Mumbai P.V.Damodaran Mumbai
Date : 27 May, 2016 VP - Business Finance Date : 27 May, 2016
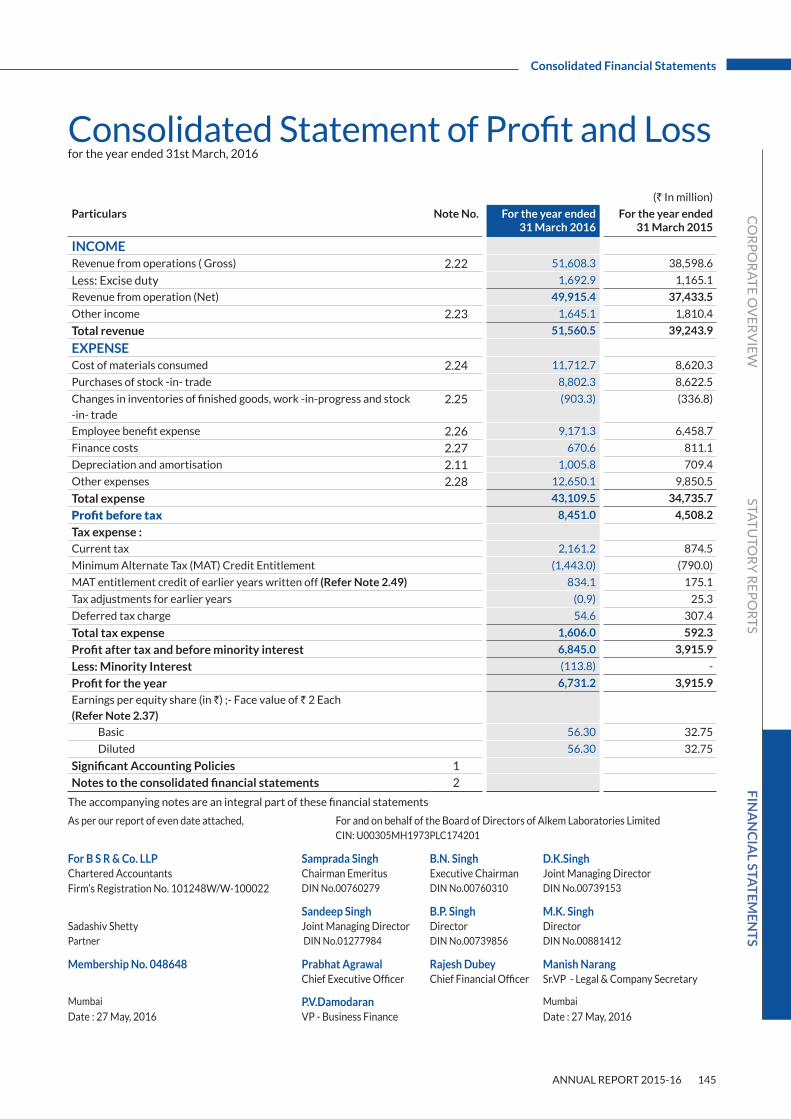
ANNUAL REPORT 2015-16 145
CO
RP
OR
AT
E O
VE
RV
IEW
FIN
AN
CIA
L STAT
EM
EN
TS
STAT
UTO
RY
RE
PO
RT
S
Consolidated Financial Statements
Consolidated Statement of Profit and Lossfor the year ended 31st March, 2016
(` In million)
Particulars Note No. For the year ended 31 March 2016
For the year ended 31 March 2015
INCOMERevenue from operations ( Gross) 2.22 51,608.3 38,598.6
Less: Excise duty 1,692.9 1,165.1
Revenue from operation (Net) 49,915.4 37,433.5
Other income 2.23 1,645.1 1,810.4
Total revenue 51,560.5 39,243.9
EXPENSECost of materials consumed 2.24 11,712.7 8,620.3
Purchases of stock -in- trade 8,802.3 8,622.5
Changes in inventories of finished goods, work -in-progress and stock
-in- trade2.25 (903.3) (336.8)
Employee benefit expense 2.26 9,171.3 6,458.7
Finance costs 2.27 670.6 811.1
Depreciation and amortisation 2.11 1,005.8 709.4
Other expenses 2.28 12,650.1 9,850.5
Total expense 43,109.5 34,735.7
Profit before tax 8,451.0 4,508.2
Tax expense :Current tax 2,161.2 874.5
Minimum Alternate Tax (MAT) Credit Entitlement (1,443.0) (790.0)
MAT entitlement credit of earlier years written off (Refer Note 2.49) 834.1 175.1
Tax adjustments for earlier years (0.9) 25.3
Deferred tax charge 54.6 307.4
Total tax expense 1,606.0 592.3
Profit after tax and before minority interest 6,845.0 3,915.9
Less: Minority Interest (113.8) -
Profit for the year 6,731.2 3,915.9
Earnings per equity share (in `) ;- Face value of ` 2 Each
(Refer Note 2.37)
Basic 56.30 32.75
Diluted 56.30 32.75
Significant Accounting Policies 1
Notes to the consolidated financial statements 2
The accompanying notes are an integral part of these financial statements
As per our report of even date attached, For and on behalf of the Board of Directors of Alkem Laboratories Limited CIN: U00305MH1973PLC174201
For B S R & Co. LLP Samprada Singh B.N. Singh D.K.SinghChartered Accountants Chairman Emeritus Executive Chairman Joint Managing DirectorFirm’s Registration No. 101248W/W-100022 DIN No.00760279 DIN No.00760310 DIN No.00739153
Sandeep Singh B.P. Singh M.K. SinghSadashiv Shetty Joint Managing Director Director DirectorPartner DIN No.01277984 DIN No.00739856 DIN No.00881412
Membership No. 048648 Prabhat Agrawal Rajesh Dubey Manish NarangChief Executive Officer Chief Financial Officer Sr.VP - Legal & Company Secretary
Mumbai P.V.Damodaran Mumbai
Date : 27 May, 2016 VP - Business Finance Date : 27 May, 2016

ALKEM LABORATORIES LTD.146
Consolidated Cash Flow Statementfor the year ended 31st March, 2016
(` In million)
Particulars For the year ended 31 March 2016
For the year ended 31 March 2015
A CASH FLOW FROM OPERATING ACTIVITY:Profit before Tax 8,451.0 4,508.2
Adjustment for:Depreciation and amortisation expense 1,005.8 709.4
Provision for diminution in value of investments 1.6 (16.4)
Provision no longer required , written back (7.5) -
Profit on sale of investments (18.8) (156.1)
Loss on sale of assets 127.5 49.3
Employee stock compensation expenses 0.2 -
Unrealised foreign currency gain / loss on revaluation (net) 75.1 41.1
Dividend Income (1.0) (3.1)
Income from investment in funds (102.0) (283.2)
Interest Income (1,263.2) (1,292.5)
Interest expenses 670.6 769.7
Bad Debts/Advances written off 146.0 97.9
Provision of doubtful debts 50.6 4.3
Government grant received/ (amortised) (4.8) 35.8
Rent and compensation Income (27.4) (34.4)
Subtotal of Adjustments 652.7 (78.2)
Operating profit before working capital changes 9,103.7 4,430.0
Changes in working capital:
Increase in trade receivables (438.7) (459.8)
Increase in loans and advances and other current assets (846.9) (136.2)
Increase in inventories (1,181.2) (909.4)
Increase in trade payable and other liabilities 2,166.1 679.3
Increase in provisions 437.5 707.0
Subtotal of adjustments 136.8 (119.1)
Cash generated from operations 9,240.5 4,311.0
Less: Direct taxes paid ( net of refund) (1,982.0) (1,056.4)
Net Cash generated from operating activities 7,258.5 3,254.6
B CASH FLOW FROM INVESTING ACTIVITIES:Purchases of fixed assets (2,572.0) (1,381.5)
Sales of fixed assets 37.4 28.0
Sale of investments (Net) 324.7 1,028.3
Proceeds from real estate fund 389.2 510.5
Investments in Subsidiaries (Net) - (2,074.0)
Redemption /(investments) in bank deposits having maturity of more than
3 months
2,067.8 (1,405.8)
Dividend received 1.0 3.1
Interest received 1,588.7 887.3
Rent received 27.4 34.4
Net cash generated from / (used in) investing activities 1,864.2 (2,369.6)

ANNUAL REPORT 2015-16 147
CO
RP
OR
AT
E O
VE
RV
IEW
FIN
AN
CIA
L STAT
EM
EN
TS
STAT
UTO
RY
RE
PO
RT
S
Consolidated Financial Statements
(` In million)
Particulars For the year ended 31 March 2016
For the year ended 31 March 2015
C CASH FLOW FROM FINANCING ACTIVITIES:Proceeds / (Repayment) of long term borrowings 130.4 (1,082.2)
(Repayment) / Proceeds of Short term borrowings (6,840.1) 1,953.6
Dividends and corporate dividend tax paid (1,845.0) (566.7)
Decrease in capital leases (4.7) (29.3)
Interest and bank charges paid (713.3) (793.2)
Net cash (used) in financing activities (9,272.7) (517.8)
D NET INCREASE/ (DECREASE) IN CASH AND CASH EQUIVALENTS (A+B+C)
(150.0) 367.2
E CASH & CASH EQUIVALENTS AS AT THE BEGINNING OF THE YEAR
1,396.0 1,008.2
Add/Less: Exchange difference on cash and cash equivalents 24.4 20.6
F CASH & CASH EQUIVALENTS AS AT THE END OF THE YEAR (D+E)
1,270.4 1,396.0
Notes:1. Cash and cash equivalents include:
Cash on hand 6.5 9.5
Cheque on hand 75.7 58.6
Balance with banks 1,149.8 1,327.9
Deposit 38.4 -
Total cash and cash equivalents 1,270.4 1,396.0
Notes:The above Cash Flow Statement has been prepared under the “Indirect Method” as set out in the Accounting Standard (AS-3) on
Cash Flow Statement.
As per our report of even date attached, For and on behalf of the Board of Directors of Alkem Laboratories Limited CIN: U00305MH1973PLC174201
For B S R & Co. LLP Samprada Singh B.N. Singh D.K.SinghChartered Accountants Chairman Emeritus Executive Chairman Joint Managing DirectorFirm’s Registration No. 101248W/W-100022 DIN No.00760279 DIN No.00760310 DIN No.00739153
Sandeep Singh B.P. Singh M.K. SinghSadashiv Shetty Joint Managing Director Director DirectorPartner DIN No.01277984 DIN No.00739856 DIN No.00881412
Membership No. 048648 Prabhat Agrawal Rajesh Dubey Manish NarangChief Executive Officer Chief Financial Officer Sr.VP - Legal & Company Secretary
Mumbai P.V.Damodaran Mumbai
Date : 27 May, 2016 VP - Business Finance Date : 27 May, 2016
Consolidated Cash Flow Statementfor the year ended 31st March, 2016

ALKEM LABORATORIES LTD.148
Notesto the Consolidated Financial Statements
NOTE-1: SIGNIFICANT ACCOUNTING POLICIES: 1.1 Basis of preparation of Financial Statements: These consolidated financial statements have
been prepared and presented under the historical cost convention, on the accrual basis of accounting in accordance with the accounting principles generally accepted in India (‘Indian GAAP’) and comply with the Accounting standards prescribed in the Companies (Accounting Standards) Rules, 2006 which continue to apply under Section 133 of the Companies Act, 2013 read with rule 7 of the Companies (Account) Rules, 2014 and other relevant provisions of the Companies Act, 2013 (‘the Act’), to the extent applicable .The accounting policies adopted in preparation of the consolidated financial statement are consistent with those followed in the previous year unless otherwise stated.The Financial statement are prepared in Indian rupees rounded off to the nearest million.
The financial statements of the subsidiaries used in the consolidation are drawn up to the same reporting date as that of Alkem Laboratories Limited (“the Company”), namely March 31, 2016.
Operating Cycle: Operating cycle is the time between the acquisition
of assets for processing and their realisation in cash or cash equivalent.
1.2 Principles of consolidation: The consolidated financial statements include
the financial statements of the Company and its subsidiaries (“the Group”) and have been consolidated in accordance with the Accounting Standard (AS) 21 “Consolidated Financial Statements”, on a line-by-line basis by adding the book values of like items of assets, liabilities, income and expenses, after eliminating intra-group balances/ transactions and unrealised profits / losses in full.
The financial statements of the Company and its subsidiaries have been consolidated using uniform accounting policies for like transactions and other events in similar circumstances as mentioned in those policies. The excess/ deficit of cost to the Parent Company of its investment over its portion of equity in the subsidiaries at the respective dates on which investment in the subsidiaries was made is recognised in the Consolidated Financial Statements as “Goodwill on Consolidation” or “Capital Reserve” as the case may be. The said goodwill is not amortised, however, it is tested for impairment at each balance sheet date and the impairment loss, if any, is provided for.
Minority interest in the net assets of the consolidated subsidiaries consist of:
a) The amount of equity attributable to minorities as at the date on which the investment in a subsidiary is made and,
b) The minorities share of movements in equity since the date the parent-subsidiary relationship came into existence.
Minority interest is presented separately from the liabilities or assets and the equity of the shareholders in the consolidated Balance Sheet. Minority interest in the income or loss of the company is separately presented.
Subsidiaries acquired/ sold during the year have been consolidated from/ up to the respective date of their acquisition/ disposal. The difference between the proceeds from sale/ disposal of investment in a subsidiary and the carrying amount of assets less liabilities as of the date of sale/ disposal is recognised in the Consolidated Statement of Profit and Loss as the profit or loss on sale/ disposal of investment in subsidiary.

CO
RP
OR
AT
E O
VE
RV
IEW
FIN
AN
CIA
L STAT
EM
EN
TS
STAT
UTO
RY
RE
PO
RT
S
ANNUAL REPORT 2015-16 149
Notesto the Consolidated Financial Statements
Consolidated Financial Statements
The details of the subsidiaries consolidated are as follows:
Name of Subsidiaries Country of
Incorporation
% of Interest
As at March 31 2016
As at March 31 2015
Alkem Laboratories ( Nigeria) Limited Nigeria 100% 100%
Alkem Laboratories Corporation Philippines 100% 100%
Alkem Laboratories Pty Ltd South Africa 100% 100%
S & B Holdings B.V Netherlands 100% 100%
Alkem Pharma Gmbh Germany 100% 100%
Pharmacor Ltd Australia 100% 100%
The PharmaNetwork LLC* United States Of
America (“U.S.”)
100% 100%
Ascend Laboratories SpA Chile 100% 100%
Ascend Laboratories SDN BHD. Malaysia 100% 100%
S & B Pharma Inc.*** United States Of
America (“U.S.”)
100% 100%
Enzene Biosciences Limited India 100% 100%
Ascend Laboratories, LLC** United States Of
America (“U.S.”)
100% 100%
Alkem Laboratories, Korea Inc Korea 100% 100%
Pharmacor Ltd. Kenya 100% 100%
The PharmaNetwork, LLP Kazakhstan 100% 100%
Alkem Real Estate LLP# India - 99%
Ascend Laboratories (UK) Limited (w.e.f August 6, 2014) United Kingdom 100% 100%
Cachet Pharmaceuticals Private Limited (w.e.f. March 27,2015) India 51% 51%
Indchemie Health Specialities Private Limited (w.e.f. March 30, 2015) India 51% 51%
*Ownership interest held through S & B Holding B.V., Netherland** Ownership interest held through The Pharmanetwork LLC*** During the previous year the Company has acquired 51% share holding from S&B Holding B.V Netherland, consequently making it a wholly owned direct subsidiary.#Alkem Real Estate LLP has been wound up on September 11, 2015
1.3 Use of Estimates: The preparation of financial statements in
conformity with Generally Accepted Accounting Principles (GAAP) requires management to make judgments, estimates and assumptions that affects the application of accounting policies and reported amounts of assets, liabilities, income and expenses and the disclosure of contingent liabilities on the date of the financial statements. Actual results could differ from those estimates. Estimates and underlying assumptions are reviewed on an on going basis. Any revision to accounting estimates is recognised prospectively in current and future periods.
1.4 Tangible Fixed Assets a) Tangible Fixed Assets are carried at cost less
accumulated depreciation and impairment losses, if any. The cost of an item of tangible
fixed assets comprises its purchase price, including import duties and other non refundable taxes or levies and any directly attributable cost of bringing the assets to its working condition for its intended use and any trade discount and rebates are deducted in arriving at purchase price. Cost of the assets also includes interest on borrowings attributable to acquisition of qualifying fixed assets up to the date the asset is ready for its intended use and other incidental expenses incurred up to that date. Exchange differences arising on restatement / settlement of long-term foreign currency borrowings relating to acquisition of depreciable fixed assets are adjusted to the cost of the respective assets and depreciated over the remaining useful life of such assets. Subsequent expenditure relating to fixed assets is capitalised only if

ALKEM LABORATORIES LTD.150
Notesto the Consolidated Financial Statements
such expenditure results in an increase in the future benefits from such asset beyond its previously assessed standard of performance. b) Cost of tangible fixed assets not ready for intended use as on the balance sheet date, is disclosed as capital work in progress. Advances given towards acquisition of fixed assets outstanding at each balance sheet date are disclosed as Long Term Loans & Advances.
1.5 Intangible Assets: Intangible assets are recognised only if it is
probable that the future economic benefits that are attributable to the assets will flow to the enterprise and the cost of the assets can be measured reliably. The intangible assets are recorded at cost and are carried at cost less accumulated amortisation and accumulated impairment losses, if any.
Goodwill that arises on an amalgamation or on the acquisition of a business is presented as an intangible asset.
Goodwill arising from amalgamation or on the acquisition of a business is measured at cost less accumulated amortisation and any accumulated
impairment loss. Such goodwill is amortised over its estimated useful life or five years whichever is shorter. Goodwill is tested for impairment annually.
1.6 Depreciation and Amortisation: Depreciation is provided on a straight line basis for
all assets. Depreciation is provided based on the useful life of an assets. Pursuant to Schedule II of Companies Act, 2013, the remaining useful life has been revised wherever appropriate based on an evaluation by an independent valuer. The carrying amount as on April 01, 2014 is depreciated over the revised remaining useful life. The subsidiaries in India use the rates as prescribed in the Schedule II to the Companies Act, 2013. Depreciation on amounts of additions to fixed assets during the year or on its disposal/ demolition/ destruction of fixed assets during the year is provided on pro-rata basis as per Schedule II. Wherever the remaining useful life of the asset is NIL as per Schedule II, the carrying amount as on 1st April, 2014 is recognised in the Statement of Profit and Loss.

CO
RP
OR
AT
E O
VE
RV
IEW
FIN
AN
CIA
L STAT
EM
EN
TS
STAT
UTO
RY
RE
PO
RT
S
ANNUAL REPORT 2015-16 151
Notesto the Consolidated Financial Statements
Consolidated Financial StatementsIn
cas
e o
f fo
llow
ing
asse
ts, t
he
asse
ssed
use
ful l
ife
is a
s u
nd
er:-
Fix
ed a
sset
Co
mp
any
and
Sub
sid
iary
in In
dia
Step
do
wn
Su
bsi
dia
ry
TP
N L
LC,
USA
an
d S
&B
P
har
ma
Inc.
, U
SA
Sub
sid
iary
in
Au
stra
lia
– P
har
mac
or
Ltd
Sub
sid
iary
in
Nig
eria
Sub
sid
iary
in
Ph
ilip
pin
esSu
bsi
dia
ry in
So
uth
Afr
ica
Sub
sid
iary
in
Ch
ileSu
bsi
dia
ry in
K
azak
hst
an
Bu
ildin
gs5
-59
yea
rs-
--
--
--
Leas
eho
ld la
nd
Ove
r th
e p
erio
d o
f lea
se-
--
--
--
Pla
nt
and
mac
hin
ery
1 -
20
yea
rs5
- 7
yea
rs-
--
--
-
Furn
itu
re a
nd
fixt
ure
s1
0 y
ears
7 y
ears
5 y
ears
5 y
ears
3 Y
ears
6 Y
ears
10
Yea
rs5
- 6
Yea
rs
Offi
ce e
qu
ipm
ent
3 -
6 y
ears
5 y
ears
2.5
yea
rs5
yea
rs3
Yea
rs3
Yea
rs3
.5 -
4.8
3
year
s
4 Y
ears
Veh
icle
8 y
ears
5 y
ears
-4
yea
rs-
-8
yea
rs3
-6 Y
ears
Leas
eho
ld im
pro
vem
ents
7 -
39
yea
rs5
yea
rs-
3 Y
ears
--
-
Trad
emar
k an
d p
aten
ts5
yea
rs-
--
--
--
Co
mp
ute
r So
ftw
are
3 -
6 y
ears
3 y
ears
3 y
ears
-3
Yea
rs-
-2
.5 Y
ears
Inta
ngi
ble
ass
ets
– T
ech
no
logy
-1
0 y
ears
--
--
--
Go
od
will
on
ass
et a
cqu
isit
ion
-5
yea
rs-
--
--
-

ALKEM LABORATORIES LTD.152
Notesto the Consolidated Financial Statements
1.7 Operating Leases/ Finance lease: Assets taken/given on lease under which all risks
and rewards of ownership are effectively retained by the lessor are classified as operating lease. Lease payments/receipts under operating leases are recognised as expenses/income on straight line basis over the primary period of lease in accordance with the respective lease agreements. Lease under which the company assumes substantially all the risk and rewards of ownership are classified as finance leases. Assets taken on finance lease are initially capitalised at fair value of the asset or present value of the minimum lease payments at the inception of the lease, whichever is lower. Lease payments are apportioned between the finance charge and the reduction of the outstanding liability. The finance charge is allocated to periods during the lease terms so as to produce a constant periodic rate of interest on the remaining balance of the liability for each period.
1.8 Investments: Long-term investments are stated at cost which
includes cost of acquisition and related expenses. Investments in equity/ordinary shares in foreign currency are stated at cost by converting at exchange rate prevailing at the time of acquisition. Provision for diminution in the value of long-term investments is made only if such decline is other than temporary. Current Investments are carried at lower of cost and fair value. Investments are classified into current and non-current investments. Investments that are readily realisable and are intended to be held for not more than one year from the date on which such investments are made, are classified as “Current investments”. All other investments are classified as “Non-current investments”. Investment in land and buildings that are not intended to be occupied substantially for use by, or in the operations of the Company, have been classified as investment property. Investment properties are carried at cost less accumulated depreciation and accumulated impairment losses, if any. Depreciation on the building component of the investment property is provided in line with the policy on tangible assets.
1.9 Inventories: a) Raw Materials & Packing Materials are valued
at lower of cost or net realisable value; cost is calculated on moving weighted average basis.
b) Finished Goods and Work–in–Progress are
valued at lower of cost and net realisable value. In respect of finished goods, cost includes materials, appropriate share of utilities, other overheads and applicable excise duty. Trading Goods are valued at lower of cost (on Moving weighted average basis) or net realisable value. Cost of inventories comprises all costs of purchase, costs of conversion and other costs incurred in bringing the inventories to their present location and condition.
c) Net realisable value is the estimated selling price in the ordinary course of business, less the estimated costs of completion and the estimated costs necessary to make the sale.
1.10 Revenue Recognition: a) Revenue from sale of goods is recognised
when the significant risks and rewards in respect of ownership of products are transferred by the Group and no significant uncertainty exist regarding the amount of consideration that will be derived from the sale of goods as well as regarding its ultimate collection. Revenue from product sales is stated net of returns, sales tax and applicable trade discounts and allowances. Revenue from product sales includes excise duty, wherever applicable. Sales are also netted off for probable non-saleable return of goods from the customers, estimated on the basis of historical data and trends of such returns. Additionally in case of Subsidiaries in the U.S. customer rebates are estimated at the end of every reporting period, based on direct or indirect purchases. If the purchases are direct (purchases made by end use customers directly from the Company), the rebates are recognised when products are purchased and a periodic credit is given. For indirect purchases (purchases by end use customers through wholesale customers), the rebates are recognised based on the terms with such customer and validated against available chargeback data. Medicaid rebates are estimated based on the historical data the Company receives from the public sector benefit providers, which is based on the final dispensing of the products by a pharmacy to a benefit plan participant.
b) Revenue (including in respect of insurance or

CO
RP
OR
AT
E O
VE
RV
IEW
FIN
AN
CIA
L STAT
EM
EN
TS
STAT
UTO
RY
RE
PO
RT
S
ANNUAL REPORT 2015-16 153
Notesto the Consolidated Financial Statements
Consolidated Financial Statements
other claims, interest etc.) is recognised when it is reasonable to expect that the ultimate collection will be made.
c) Income from research and product registration (dossiers) services and technology income is recognised as revenue when earned in accordance with the terms of the relevant agreements.
d) Revenue from service contracts are recognised on the percentage-of-completion method, measured by the proportion of costs incurred to date to estimated costs for each service contracts. The differences between the timings of billings and the recognition of revenue on uncompleted contracts are recognised as either unbilled accounts receivable or billings in excess of costs and earnings.
The provisions for losses on incomplete contracts are made in the period in which the revisions are determined.
e) Dividend from investment is recognised as revenue when right to receive the payments is established.
f) Interest income is recognised on time proportionate basis.
g) Profit on disposal/ sale of Investments is recognised as income in the period in which the investment is sold/disposed off.
1.11 Export Incentives: Export benefits available under relevant schemes
are accrued in the year in which the goods are exported and no significant uncertainty exist regarding its ultimate collection.
1.12 Excise Duty and CENVAT: In accordance with the method of accounting
regularly employed by the group, Cenvat has been accounted on the basis of “exclusive method” as recommended by the Institute of Chartered Accountants of India wherever applicable. Provision for excise duty has been made on goods lying in bonded warehouses.
1.13 Research and Development: Revenue expenditure incurred on research and
development is charged to the respective heads
in the consolidated statement of Profit and Loss, in the year it is incurred and Capital expenditure thereon is included in the respective heads under fixed assets.
1.14 Foreign Exchange Transactions/Translation: a) Transactions in foreign currency are
recorded at the rate of exchange in force at the time transactions are effected. Exchange differences arising on settlement of all transactions are recognised in the Consolidated Statement of Profit and Loss.
b) Exchange Differences arising on translation of short term monetary items denominated in foreign currency are restated using the exchange rate prevailing as at the date of the Balance Sheet and the resulting exchange difference is recognised in consolidated statement of Profit and Loss.
c) The exchange differences arising on restatement / settlement of long-term foreign currency monetary items are capitalised as part of the depreciable fixed assets to which the monetary item relates and depreciated over the remaining useful life of such assets or amortised on settlement over the maturity period of such items. If such items do not relate to acquisition of depreciable fixed assets.
d) In case of forward exchange contracts entered into to hedge the foreign currency exposure in respect of short term monetary items, the difference between the exchange rate on the date of such contracts and the year end rate is recognised in the consolidated statement of Profit and Loss. Any profit/loss arising on cancellation of forward exchange contract is recognised as income or expense of the year. Premium/discount arising on such forward exchange contracts is amortised as income/expense over the life of contract.
e) Foreign offices/branches: In respect of the foreign offices/branches, which are integral foreign operations, all revenues and expenses (except depreciation) during the year are reported at average rate. Monetary assets and liabilities are restated at the year-end exchange rate. Non-monetary assets and liabilities are stated at the rate prevailing on

ALKEM LABORATORIES LTD.154
Notesto the Consolidated Financial Statements
the date of the transaction Foreign Currency Loss/Gain on transaction/translation is recognised in consolidated statement of Profit and Loss.
f) Foreign Subsidiaries: In case of foreign subsidiaries, the local accounts are maintained in their local currency.
A) The financial statements of the subsidiaries, whose operations are integral foreign operations for the Company, have been translated to Indian Rupees on the following basis:
i) All income and expenses are translated at the average rate of exchange prevailing during the year.
ii) Monetary assets and liabilities are translated at the closing rate on the Balance Sheet date.
iii) Non monetary assets and liabilities are translated at historical rates.
iv) The resulting exchange difference is accounted in ‘Exchange Rate Difference on Translation Account’ and is charged / credited to the Consolidated Statement of Profit and Loss.
B) The financial statements of subsidiaries, whose operations are non-integral foreign operations for the Company, have been translated to Indian Rupees on the following basis:
i) All income and expenses are translated at the average rate of exchange prevailing during the year.
ii) Monetary and non monetary assets and liabilities are translated at the closing rate as on the Balance Sheet date.
iii) The resulting exchange difference is accounted in ‘Foreign Currency Translation Reserve’ and carried in the Balance Sheet.
1.15 Employee Benefits: a) Post Employment Benefits and Other Benefits: i) Defined Contribution Plan:
The Group’s contribution for the year paid/payable to defined contribution retirement benefit schemes are charged to Consolidated Statement of Profit and Loss.
The Group’s contribution towards provident fund and superannuation fund for certain eligible employees are considered to be defined contribution plan for which the Group made contribution on monthly basis.
ii) Defined Benefit and Other Long Term Benefit Plans:
Group’s liabilities towards defined benefit plans and other long term benefits viz. gratuity and compensated absences expected to occur after twelve months, are determined using the Projected Unit Credit Method. Actuarial valuations under the Projected Unit Credit Method are carried out at the balance sheet date. Actuarial gains and losses are recognised in the consolidated statement of Profit and Loss account in the year of occurrence of such gains and losses. The retirement benefit obligation recognised in the balance sheet represents the present value of the defined benefit obligation as adjusted for unrecognised past service cost, and as reduced by the fair value of scheme assets.
b) Short term employee Benefits:
Short term employee benefits are benefits payable and recognised in 12 months. Short-term employee benefits expected to be paid in exchange for the services rendered by employees are recognised undiscounted during the year as the related service are rendered by the employee. These benefits include performance incentives.

CO
RP
OR
AT
E O
VE
RV
IEW
FIN
AN
CIA
L STAT
EM
EN
TS
STAT
UTO
RY
RE
PO
RT
S
ANNUAL REPORT 2015-16 155
Notesto the Consolidated Financial Statements
Consolidated Financial Statements
1.16 Taxes on Income: Income Tax is accounted for in accordance with
Accounting Standard 22 (AS 22) “Accounting for Taxes on Income”. Tax expense comprises both current tax and deferred tax. Current tax is measured at the amount expected to be paid or recovered from the tax authorities using the applicable tax rates.
Minimum Alternate Tax (MAT) under the provision of Income Tax Act, 1961 is recognised as current tax in the Consolidated Statement of Profit and Loss. The credit available under the Income tax Act, 1961 in respect of MAT paid is recognised as an asset only when and to the extent there is convincing evidence that the Group will pay normal income tax during the period for which the MAT credit can be carried forward for set off against the normal tax liability. MAT credit recognised as an asset is reviewed at each balance sheet date and written down to the extent the aforesaid convincing evidence no longer exists.
Deferred tax assets and liabilities are recognised for future tax consequence attributable to timing differences between taxable income and accounting income that are measured at relevant enacted tax rates. At each balance sheet date the Group reassesses unrecognised deferred tax assets, to the extent they become reasonably certain or virtually certain of realisation, as the case may be.
1.17 Borrowing Costs: Borrowing costs are interest and other costs
incurred by the Group in connection with the borrowing of funds. Borrowing costs directly attributable to acquisition or construction of those tangible fixed assets which necessarily take a substantial period of time to get ready for their intended use are capitalised. Other borrowing costs are recognised as an expense in the Consolidated Statement of Profit and Loss of the year in which they are incurred.
1.18 Provision, Contingent Liabilities and Contingent Assets:
A provision is recognised if as a result of a past event, the Group has a present obligation that can be estimated reliably and it is probable that an outflow of economic benefits will be required to settle the obligation. Provisions are recognised at the best estimate of the expenditure required
to settle the present obligation at the balance sheet date. The provisions are measured on an undiscounted basis.
A contingent liability exists when there is a possible but not probable obligation, or a present obligation that may, but probably will not, require an outflow of resources, or a present obligation whose amount can not be estimated reliably. Contingent liabilities do not warrant provisions but are disclosed unless the possibility of outflow of resources is remote. Contingent assets are neither recognised nor disclosed in the financial statements. However, contingent assets are assessed continually and if it is virtually certain that an inflow of economic benefits will arise, the asset and related income are recognised in the year in which the change occurs.
1.19 Impairment of Assets: In accordance with AS 28 on ‘Impairment of assets’,
the Company assesses at each balance sheet date, whether there is any indication that an asset may be impaired. If any such indication exists, the Company estimates the recoverable amount of the asset. The recoverable amount of the assets (or where applicable that of the cash generating unit to which the asset belongs) is estimated as the higher of its net selling price and its value in use. Value in use is the present value of estimated future cash flows expected to arise from the continuing use of the assets and from its disposal at the end of its useful life. An impairment loss is recognised whenever the carrying amount of an asset or the cash-generating unit to which it belongs, exceeds it recoverable amount. Impairment loss is recognised in the Statement of profit and loss or against revaluation surplus, where applicable. If at the balance sheet date, there is an indication that a previously assessed impairment loss no longer exists, the recoverable amount is re-assessed and the asset is reflected at the recoverable amount subject to a maximum of the depreciated historical cost.
1.20 Government Grants: Government Grants of Capital nature received as
cash subsidy is accounted as Capital Reserve in the year of its receipt or when there is a reasonable certainty of its being received. Grants related to depreciable assets are treated as deferred income which is recognised in the statement of profit and loss on a systematic and rational basis

ALKEM LABORATORIES LTD.156
Notesto the Consolidated Financial Statements
over the useful life of the asset. Such allocation to income is usually made over the periods and in the proportions in which depreciation on related assets is charged. Government Grants of revenue nature is reduced from related expenses in the statement of Profit and Loss in the year of its receipt or when there is a reasonable certainty of its being received.
1.21 Cash and Cash Equivalents Cash and Cash Equivalents for the purpose of cash
flow statement comprise cash at bank including fixed deposits (having original maturity of less than 3 months), cheques in hand and cash in hand.
1.22 Derivative Instruments Any loss arising out of marking of a class of
derivative contracts to market price is recognised in the Consolidated Statement of Profit and Loss. Income, if any, arising out of marking of a class
of derivative contracts to market price is not recognised in the Consolidated Statement of Profit and Loss.
1.23 Earnings per share (‘EPS’) Basic EPS is computed using the weighted average
number of equity shares outstanding during the year. Diluted EPS is computed using the weighted average number of equity and dilutive equity equivalent shares outstanding during the year except where the results would be anti-dilutive.
1.24 Employee Stock option Scheme The excess of fair value of shares, at the date of
grant of options under the Employee Stock Option Schemes of the Company, over the exercise price is regarded as employee compensation, and recognised on a straight-line basis over the period over which the employees would become unconditionally entitled to apply for the shares.
NOTE-2: NOTES TO CONSOLIDATED FINANCIAL STATEMENTS FOR THE YEAR ENDED 31 MARCH 2016
NOTE-2.1 SHARE CAPITAL (` In million)
Particulars As at 31 March 2016
As at 31 March 2015
Authorised Share Capital:250,000,000 equity shares of ` 2/- each (Previous Year 250,000,000 equity shares
of ` 2/- each)
500.0 500.0
500.0 500.0
Issued, Subscribed and Paid up:119,565,000 equity shares of ` 2/- each fully paid up (Previous Year 119,565,000
equity shares of ` 2 each fully paid up)
239.1 239.1
Total 239.1 239.1
(a) Reconciliation of the number of equity shares outstanding at the beginning and at the end of the year:
Particulars As at 31 March 2016 As at 31 March 2015
Number ` in million Number ` in million
At the commencement of the year 119,565,000 239.1 11,956,500 119.6
Add: Increase in the number of shares after sub division in
face value from ` 10 to ` 2 (Refer Note 2.1(d))
- - 47,826,000 -
Add: Bonus Shares issued during the year (Refer Note 2.1(e)) - - 59,782,500 119.5
Less: Shares bought back during the year - - - -
At the end of the year 119,565,000 239.1 119,565,000 239.1
(b) Rights, preferences and restrictions attached to Equity Shares:
The Company has issued one class of equity shares with voting rights having a par value of 2/- per share. Each shareholder is eligible for one vote per share held.
On winding up of the Company, the holders of equity shares will be entitled to receive residual assets of the Company remaining after distribution of all preferential amounts in proportion to the number of equity shares held by the shareholders.

CO
RP
OR
AT
E O
VE
RV
IEW
FIN
AN
CIA
L STAT
EM
EN
TS
STAT
UTO
RY
RE
PO
RT
S
ANNUAL REPORT 2015-16 157
Notesto the Consolidated Financial Statements
Consolidated Financial Statements
(c) Details of shareholders holding more than 5% shares in the Company:
Name of the shareholders: As at 31 March 2016 As at 31 March 2015
Number of Shares
Percentage of Holding
Number of Shares
Percentage of Holding
Equity Shares of ` 2 Each (Previous Year ` 2 Each) held by:
Mr. Basudeo Narain Singh 8,405,950 7.03% 9,528,600 7.97%
Mrs. Jayanti Sinha 7,138,220 5.97% 8,573,000 7.17%
Mr. Nawal Kishore Singh 4,311,060 3.61% 6,702,360 5.61%
Mr. Balmiki Prasad Singh 6,257,355 5.23% 6,215,760 5.20%
(d) Change in face value of equity shares: During the previous year ended 31 March 2015, pursuant to the approval of the members at the Extra ordinary general
meeting of the Company held on 16 March 2015 to the sub-division of the Equity Shares of the Company, each Equity Share of face value of 10 each was sub-divided into 5 (five) Equity Share of 2 each. The effective date for the said sub-division was 16 March 2015.
(e) Aggregate Number of Bonus Shares Issued during the year and five preceding years: During the year Nil (Previous Year 59,782,500) Equity Shares of ` 2 Each fully paid up have been allotted as Bonus Shares
by capitalization of General Reserves.
NOTE-2.2 RESERVES AND SURPLUS (` In million)
Particulars As at 31 March 2016
As at 31 March 2015
Capital Reserve:Investment Subsidies from State Governments
At the commencement and at end of the year 5.2 5.2
Employee stock options outstanding account: At the commencement of the year - -
Add: Employee compensation expenses for the year 0.2 -
Less: Utilisation during the year - -
At the end of the year 0.2 -
General Reserve: At the commencement of the year 19,380.5 19,500.0
Less: Bonus Shares Issued during the year (Refer Note No. 2.1 (e)) - 119.5
Add: Transfer from surplus in the statement of profit and loss during the year 170.0 -
At the end of the year 19,550.5 19,380.5
Foreign Currency Translation Reserve At the commencement of the year 158.2 68.1
Add: Exchange rate difference on translation (Net) 134.2 90.1
At the end of the year 292.4 158.2
Surplus in the Statement of Profit and Loss: At the commencement of the year 10,207.5 6,858.4
Add: Profit for the year 6,731.2 3,915.9
16,938.7 10,774.3
Less: Appropriations:
Transfer to General Reserve 170.0 -
Interim dividend on Equity Shares ( amount per share of ( face value of ` 2 each )
` 12.70 (previous year amount per share of (face value of ` 10 each ) ` 40)) -
Refer Note 2.1(d)
1,518.5 478.3
Dividend Distribution Tax 311.1 88.5
At the end of the year 14,939.1 10,207.5
Total 34,787.4 29,751.4

ALKEM LABORATORIES LTD.158
Notesto the Consolidated Financial Statements
NOTE - 2.3 LONG-TERM BORROWINGS: (` In million)
Particulars As at 31 March 2016
As at 31 March 2015
Secured:Foreign Currency Term Loans from Banks - 281.3
SBIRI - Government of India 1.8 2.1
Term Loan from Bank 1,119.8 43.6
Hire Purchase Loan 3.4 2.8
Other Loan - 4.5
UnsecuredOthers* 86.6 -
Total 1,211.6 334.3
* Other includes loan from related party ` 60.7 million ( Previous year ` Nil) - Refer note 2.35
Notes :
The Company:
Foreign Currency Term Loan from Bank is a loan of US $ 4.5 million (` 298.1 million) (Previous Year $ 9 million (` 562.6 million)) which carries an interest @
applicable LIBOR plus margin (150 basis points). The Company has entered into a Interest rate swap derivative of fixed interest rate @ 3.57% p.a. The balance
loan is repayable on 28 October 2016. Amount falling due for payment on 28 October 2016 is disclosed under other current liabilities amounting to ` 298.1
million (Previous year ` 281.3 million).
The Foreign Currency Term Loan from bank of $ 4.5 million is secured by a first pari passu charge on the movable fixed assets of the company (plant and
machinery)
Enzene Biosciences Limited
Secured Loan consists of loan from Small Business Innovation Research Initiative “ SBIRI” - Government of India, carries 0% Interest and is repayable in remaining
6 Instalments of ` 0.3 million- each commencing from November - 2016 . The Loan is secured by Hypothecation of Machinery There is no default on Balance
Sheet date in repayment of Loan. The Amount falling due for payment in November 2016 is disclosed under Other current liabilities amounting to ` 0.4 million
(Previous year ` 0.4 million)
S&B Pharma Inc
Term loan from Citi bank US $ 5.9 million (` 393.5 million) due and payable on 30th April 2018. Quarterly interest only payments are required at a variable rate
equal to 1.6 percentage points over the LIBOR rate.
The loans taken by S&B Pharma inc and ThePharmaNetwork, LLC are secured by issue of SBLC by Citi bank India which is secured by bonds pledged aggregating
to a face value of ` 1,584.9 million.
The Loan from Citi bank US $ 9.9 million (` 656.1 million) due and payable on 20th September 2018. Quarterly interest only payments are required at a variable
rate equal to 1.6 percentage points over the LIBOR rate.
Cachet Pharmaceuticals Private Limited
Term Loan from The Saraswat Co-op Bank Ltd is ` 70.5 million ( Previous year ` 43.6 million) secured against mortgage of Company’s land and building , plant and
machinery situated at Plot No- 1582 to 1586 Baddi, Himachal Pradesh and at Plot No. C- 582 A, RIICO Industrial Area, Bhiwadi , Rajasthan . The Loan is further
guaranteed by the Directors of the Company. The loan carries interest at the rate of 12.50% p.a payable till 11 November 2020 in unequal instalment.
Hire Purchase loans from finance companies are secured against respective assets financed by them.
The loan carries interest at the range of 9.65% to 11.39 % rate payable till 5 February 2019 in unequal instalment.
Unsecured loan from others taken at the rate of interest of 10% p.a is repayable after two years.
NOTE-2.4 DEFERRED TAX LIABILITIES (NET): (` In million)
Particulars As at 31 March 2016
As at 31 March 2015
Tax effect of items constituting Deferred Tax Liabilities On differences between book and tax depreciation 1,272.9 1,041.7
On amortisation of intangible 252.7 213.8
Tax effect of items constituting Deferred Tax Assets Provision for employee benefits 354.4 239.0
Others (includes provision for doubtful debts and advances, deferred government
grant etc.)
143.9 53.0
Total 1,027.3 963.5

CO
RP
OR
AT
E O
VE
RV
IEW
FIN
AN
CIA
L STAT
EM
EN
TS
STAT
UTO
RY
RE
PO
RT
S
ANNUAL REPORT 2015-16 159
Notesto the Consolidated Financial Statements
Consolidated Financial Statements
NOTE-2.5 OTHER LONG-TERM LIABILITIES (` In million)
Particulars As at 31 March 2016
As at 31 March 2015
Finance Lease payable 23.0 51.4
23.0 51.4
NOTE-2.6 LONG-TERM PROVISIONS (` In million)
Particulars As at 31 March 2016
As at 31 March 2015
Provisions for Employee Benefits
Gratuity (Refer note 2.31) 397.9 329.2
Compensated absences 189.7 168.6
Provision for anticipated sales return (Refer note 2.38) 190.8 168.0
778.4 665.8
NOTE-2.7 SHORT TERM BORROWINGS (` In million)
Particulars As at 31 March 2016
As at 31 March 2015
SecuredLoans repayable on demand from banks 2,641.8 9,089.1
2,641.8 9,089.1
UnsecuredWorking capital loan from banks 1,995.6 2,193.0
Other loans 5.1 3.6
2,000.7 2,196.6
Total 4,642.5 11,285.7Notes:
The Company
Secured:
1. Cash Credit from bank for ` Nil (Previous Year ` 620.9 million) and Packing Credit Foreign Currency Loan for ` 331.3 million (Previous Year
` 312.5 million) are secured by hypothecation of inventories and trade receivables.
2. Overdrafts from Banks ` 1,179.3 million (Previous Year ` 7,336.4 million) are secured against pledge of Fixed Deposits with the banks.
3. Cash Credit and Overdraft Facilities carry a rate of Interest ranging between 8.50% to 10.50% p.a. (previous year 9.60% to 10.75% p.a.), computed on a
monthly basis on the actual amount utilized, and are repayable on demand. Working Capital Loan from banks in Foreign Currency carries Interest rate in
the range of 1.15% to 1.45% (Previous Year 1.15% to 1.45%)
Indchemie Health Specialities Private Limited
1. Overdraft from banks ` 690.0 million ( previous year ` 520.3 million) are secured against fixed deposits placed with respective banks.
2. Working Capital Loan from bank comprises of Cash Credit provided by Saraswat bank and is secured against hypothecation of Co.’s stock, tangible
movable property, book debts, receivable and claims and mortgage of property situated at 659/B, Somnath Indl.Area, Kevdi Road, Dabhel Village, Daman
UT and the same is further secured by personal guarantee of directors of the company, however there is no working capital outstanding.
3. Bill discounting from bank ` Nil ( previous year ` 140.1 million) is secured against trade receivables. The Loan carries interest in the range of 7.85 % to 9.25%.
Cachet Pharmaceuticals Private Limited
1. The Overdraft from bank is ` 50.0 million ( previous year Nil) is against fixed deposit of ` 100 million.
2. The Cash credit from banks ` 134.3 million ( previous year ` 108.8 million ) is secured against company’s entire stocks, book debts and receivables.
3. The Packing Credit (post shipment) from banks ` 49.8 million ( previous year ` 42.3 million) is secured against the export receivables backed by the letter of credit
4. The loan carries interest in the range of 2.5% to 12.5% and are repayable on demand.
Enzene Biosciences Limited
1. Overdraft from banks ` 8.8 million ( previous year ` nil) are secured against pledge of fixed deposit with the banks.
2. Overdraft facilities carry a rate of interest ranging between 8.5% to 10.50% p.a computed on a monthly basis on the actual amount utilised, and are
repayable on demand.
S&B Pharma Inc
1. Demand loan US $ 3.0 million (` 198.3 million) due and payable on 30th April, 2016. Interest are paid at quarterly, at variable rate equal to LIBOR + 1.6 %
p.a. against Stand by letter of credit issued by Citi Bank India.

ALKEM LABORATORIES LTD.160
Notesto the Consolidated Financial Statements
Unsecured:
The Company
1. Working Capital Loan from banks comprises of overdraft in ` 173.6 million (previous year ` 1,099.4 million) and Packing Credit in Foreign Currencies of
` 1,822.0 million (Previous Year ` 1,093.6 million) are repayable on demand.
2. Working Capital Loan from banks in Foreign Currency carries Interest rate in the range of 1.10% to 2.00% and those in Indian Rupees carries Interest rate
in the range of 8.5% to 10% p.a.
NOTE-2.8 TRADE PAYABLES: (` In million)
Particulars As at 31 March 2016
As at 31 March 2015
Dues to Micro and Small Enterprises ( Refer Note 2.30) 653.9 467.2
Dues to Others 5,138.9 4,192.1
Total 5,792.8 4,659.3
Due to related parties ` 46.7 million (Previous Year ` 53.8 million) (Refer Note 2.35)
NOTE-2.9 OTHER CURRENT LIABILITIES: (` In million)
Particulars As at
31 March 2016 As at
31 March 2015
Current maturities of long term borrowings in foreign currencies- (Refer Note- 2.3) 700.3 1,439.2
Interest Accrued but not due on Borrowings 10.5 3.3
Due to Statutory Authorities* 311.8 217.8
Advances from Customers 178.9 82.8
Employee payables 1,085.3 378.5
Accrual for Expenses 1,228.7 1,030.3
Security Deposits 124.6 118.8
Unpaid dividend*** 0.6 -
Other payables** 30.6 -
Total 3,671.3 3,270.6*Due to statutory authorities includes sales tax payable, excise duty payable, tax deducted at source payable, service tax payable, provident fund and other funds
payable.
** includes amount set aside for IPO related expenses as recovered from shareholders whose shares were offered for sale in the intial public offering, net of
expenses incurred and approved as at 31 March 2016.
*** There are no amounts due for payment to the Investor education and protection fund (“IEPF”) under section 125 of the Companies Act, 2013.
NOTE-2.10 SHORT TERM PROVISIONS: (` In million)
Particulars As at 31 March 2016
As at 31 March 2015
For Income Tax (Net of advance tax) 214.0 94.4
For wealth tax - 0.8
For proposed dividend on equity shares - 5.0
For corporate dividend distribution tax - 1.0
For employee benefits:
Gratuity (Refer Note 2.31) 242.0 344.8
Compensated absences 200.5 61.8
Other Benefits - 0.2
For anticipated sales return (Refer Note 2.38) 560.4 336.2
Total 1,216.9 844.2

CO
RP
OR
AT
E O
VE
RV
IEW
FIN
AN
CIA
L STAT
EM
EN
TS
STAT
UTO
RY
RE
PO
RT
S
ANNUAL REPORT 2015-16 161
Notesto the Consolidated Financial Statements
Consolidated Financial StatementsN
OT
E-2
.11
. - F
IXE
D A
SSE
TS
(` in
mill
ion
)
Parti
cular
s G
ROSS
BLO
CK D
EPRE
CIAT
ION
AND
AMO
RTIS
ATIO
N N
ET B
LOCK
As a
t 1s
t Apr
il 20
15
Addi
tion o
n ac
quisi
tion
of su
bsid
iary
Com
pany
Addi
tions
Adj
ustm
ent
Del
etio
ns Fo
reign
Cu
rren
cy
Tran
slatio
n Di
ffere
nce
As a
t 31
Mar
ch
2016
Up t
o 31
Mar
ch
2015
Add
ition
on
acqu
isitio
n of
subs
idiar
y Co
mpa
ny
For t
he
Year
Adj
ustm
ent
Dedu
ctio
ns Fo
reign
Cu
rren
cy
Tran
slatio
n Di
ffere
nce
Up t
o 31
Mar
ch
2016
As a
t 31
Mar
ch
2016
As a
t 31
Mar
ch
2015
Tang
ible
Ass
ets
Free
hold
Land
1,18
9.8
- 47
.1 -1
4.8
18.5
- 1,
203.
6-
- -
--
- -
1,20
3.6
1,18
9.8
(348
.7)
(17.
4) (1
94.0
) (6
29.7
) -
- (1
,189
.8)
--
--
--
- (1
,189
.8)
(348
.7)
Leas
ehol
d Lan
d 22
7.7
- 68
.2 14
.8 1.
4 3.
9 31
3.2
10.3
- 4.
5-
1.5
0.2
13.5
299.
7 21
7.4
(181
.4)
(43.
0) (1
.2)
- -
(2.1
) (2
27.7
) (6
.2)
(1.8
) (2
.4)
- -
0.1
(10.
3) (2
17.4
) (1
75.2
)
Build
ings
3,13
2.0
- 43
7.4
- 4.
3 11
.8 3,
576.
9 59
2.3
- 76
.8-
1.2
0.8
668.
7 2,
908.
2 2,
539.
7
(3,2
87.1
) (4
43.6
) (3
0.5)
629.
7 (7
.1)
(7.6
) (3
,132
.0)
(469
.7)
(121
.5)
(58.
0) 55
.2 (2
.1)
(0.4
) (5
92.3
) (2
,539
.7)
(2,8
17.4
)
Plan
t and
Mac
hine
ry 7,
373.
0-
802.
4 (7
.0)
309.
2 10
.0 7,
869.
2 2,
118.
4-
600.
8 (0
.3)
186.
3 1.
8 2,
534.
4 5,
334.
8 5,
254.
6
(6,3
29.6
) (7
98.9
) (3
20.1
) -
(81.
4) (5
.8)
(7,3
73.0
) (1
,349
.9)
(339
.8)
(460
.8)
- (3
3.4)
(1.3
) (2
,118
.4)
(5,2
54.6
) (4
,979
.7)
Furn
iture
and F
ixtur
es 39
2.1
- 53
.2 (0
.4)
4.8
2.5
442.
6 20
6.1
- 42
.4 0.
3 12
.2 6.
5 24
3.1
199.
5 18
6.0
(327
.3)
(52.
6) (1
2.3)
- (0
.7)
(0.6
) (3
92.1
) (1
32.4
) (3
1.3)
(42.
4) -
(0.2
) (0
.2)
(206
.1)
(186
.0)
(194
.9)
Vehi
cles
289.
6-
46.9
- 41
.9-
294.
6 11
0.8
- 36
.5-
30.4
- 11
6.9
177.
7 17
8.8
(193
.6)
(66.
0) (6
2.9)
- (3
2.9)
- (2
89.6
) (7
0.7)
(23.
3) (2
7.6)
- (1
0.8)
- (1
10.8
) (1
78.8
) (1
22.9
)
Offi
ce Eq
uipm
ent's
369.
6-
100.
3 7.
4 28
.0 2.
1 45
1.4
209.
4-
62.9
- 17
.1 0.
5 25
5.7
195.
7 16
0.2
(260
.6)
(51.
7) (6
2.0)
- (5
.6)
(0.9
) (3
69.6
) (1
27.5
) (4
2.7)
(41.
9) -
(3.4
) (0
.7)
(209
.4)
(160
.2)
(133
.1)
Tota
l 12
,973
.8 -
1,55
5.5
- 40
8.1
30.3
14,1
51.5
3,24
7.3
- 82
3.9
- 24
8.7
9.8
3,83
2.2
10,3
19.2
9,72
6.5
(10,
928.
3) (1
,473
.2)
(683
.0)
- (1
27.7
) (1
7.0)
(12,
973.
8) (2
,156
.4)
(560
.4)
(633
.1)
55.2
(49.
9) (2
.5)
(3,2
47.3
) (9
,726
.5)
(8,7
71.9
)

ALKEM LABORATORIES LTD.162
Notesto the Consolidated Financial Statements
(` in
mill
ion
)
Parti
cular
s G
ROSS
BLO
CK D
EPRE
CIAT
ION
AND
AMO
RTIS
ATIO
N N
ET B
LOCK
As a
t 1s
t Apr
il 20
15
Addi
tion o
n ac
quisi
tion
of su
bsid
iary
Com
pany
Addi
tions
Adj
ustm
ent
Del
etio
ns Fo
reign
Cu
rren
cy
Tran
slatio
n Di
ffere
nce
As a
t 31
Mar
ch
2016
Up t
o 31
Mar
ch
2015
Add
ition
on
acqu
isitio
n of
subs
idiar
y Co
mpa
ny
For t
he
Year
Adj
ustm
ent
Dedu
ctio
ns Fo
reign
Cu
rren
cy
Tran
slatio
n Di
ffere
nce
Up t
o 31
Mar
ch
2016
As a
t 31
Mar
ch
2016
As a
t 31
Mar
ch
2015
Inta
ngib
le A
sset
sCo
mpu
ter S
oftw
are
348.
1-
44.0
- 1.
3 1.
1 39
1.9
268.
9-
50.8
- 1.
3 -3
.7 31
4.8
77.1
79.2
(288
.4)
(15.
0) (4
3.8)
- -
(0.9
) (3
48.1
) (2
40.1
) (3
.5)
(24.
9) -
- (0
.4)
(268
.9)
(79.
2) (4
8.3)
Trad
e Mar
ks an
d
Pate
nts
307.
1-
--
--
307.
1 41
.0-
58.6
--
- 99
.6 20
7.5
266.
1
(0.8
) -
(306
.3)
- -
- (3
07.1
) (0
.8)
- (4
0.2)
- -
- (4
1.0)
(266
.1)
-
Good
will
215.
9-
88.2
--
13.2
317.
4 10
1.5
- 72
.5-
--
174.
0 14
3.4
114.
4
(181
.6)
- (2
5.3)
- -
(9.0
) (2
15.9
) (5
3.0)
- (4
8.5)
- -
- (1
01.5
) (1
14.4
) (1
28.6
)
Tech
nolo
gy 18
3.0
--
--
3.4
186.
4 46
.8-
--
- 1.
8 48
.7 13
7.8
136.
2
(174
.9)
- -
- -
(8.1
) (1
83.0
) (2
7.9)
- (1
7.9)
- -
(1.0
) (4
6.8)
(136
.2)
(147
.0)
1,05
4.1
- 13
2.2
- 1.
3 17
.8 1,
202.
8 45
8.3
- 18
1.9
- 1.
3 (1
.9)
637.
0 56
5.8
595.
8
(645
.7)
(15.
0) (3
75.4
) -
- (1
8.0)
(1,0
54.1
) (3
21.8
) (3
.5)
(131
.5)
- -
(1.4
) (4
58.2
) (5
95.9
) (3
23.9
)
Capi
tal W
ork I
n pr
ogre
ss 1,
724.
5 1,
106.
9
(1,1
06.9
) (7
06.8
)
Tota
l 14
,027
.9 -
1,68
7.7
- 40
9.4
48.1
15,3
54.3
3,70
5.5
- 1,
005.
8 -
250.
0 7.
9 4,
469.
3 12
,609
.5 11
,429
.3
(11,
574.
0) (1
,488
.2)
(1,0
58.4
) -
(127
.7)
(35.
0) (1
4,02
7.9)
(2,4
78.2
) (5
63.9
) (7
64.6
) 55
.2 (4
9.9)
(3.9
) (3
,705
.5)
(11,
429.
4) (9
,802
.6)
No
te
1.
Ad
dit
ion
to
fixe
d a
sset
s in
clu
de
item
s o
f fixe
d a
sset
s ag
greg
atin
g `
33
3.3
mill
ion
(Pre
vio
us
Year
` 6
8.8
mill
ion
) lo
cate
d a
t R
esea
rch
an
d D
evel
op
men
t C
entr
es o
f th
e C
om
pan
y
2.
Ad
dit
ion
to
fixe
d a
sset
s in
clu
des
exc
han
ge lo
ss o
n fo
reig
n c
urr
ency
loan
cap
ital
ised
` 3
0.8
mill
ion
(Pre
vio
us
Year
` 2
3.3
mill
ion
)
3.
Du
rin
g th
e p
revi
ou
s ye
ar e
nd
ed 3
1 M
arch
, 20
15
, pu
rsu
ant
to t
he
req
uir
emen
t o
f Co
mp
anie
s A
ct, 2
01
3 t
he
Co
mp
any
has
det
erm
ined
th
e re
mai
nin
g u
sefu
l lif
e o
f bu
ildin
g, p
lan
t &
mac
hin
ery
bas
ed o
n t
he
rep
ort
of a
n in
dep
end
ent
valu
er. I
n r
esp
ect
of o
ther
fixe
d a
sset
s, t
he
Co
mp
any
has
ad
her
ed t
o t
he
use
ful l
ives
as
reco
mm
end
ed in
Sch
edu
le II
to
th
e A
ct. C
on
seq
uen
t to
th
e ch
ange
s in
th
e u
sefu
l liv
es o
f th
e
asse
ts it
s d
epre
ciat
ion
du
rin
g th
e p
revi
ou
s ye
ar is
hig
her
by
` 1
26
.7 m
illio
n. T
he
Ass
ets
wit
ho
ut
any
rem
ain
ing
use
ful l
ife
at t
he
beg
inn
ing
of t
he
pre
vio
us
year
hav
e b
een
ch
arge
d t
o t
he
Stat
emen
t o
f Pro
fit
&
Loss
agg
rega
tin
g to
` 4
.3 m
illio
n. C
ost
of L
and
form
ing
par
t o
f bu
ildin
g h
as b
een
iden
tifi
ed a
nd
acc
ord
ingl
y re
clas
sifi
ed a
nd
dep
reci
atio
n c
har
ged
on
th
e la
nd
has
bee
n r
ever
sed
am
ou
nti
ng
to `
55
.2 m
illio
n.
4.
Fig
ure
s in
th
e b
rack
ets
are
the
corr
esp
on
din
g fi
gure
s o
f th
e p
revi
ou
s ye
ar.

CO
RP
OR
AT
E O
VE
RV
IEW
FIN
AN
CIA
L STAT
EM
EN
TS
STAT
UTO
RY
RE
PO
RT
S
ANNUAL REPORT 2015-16 163
Notesto the Consolidated Financial Statements
Consolidated Financial Statements
NOTE-2.12: NON CURRENT INVESTMENTS:
Particulars Number Face Value
As at 31 March 2016 As at 31 March 2015
` in million
` in million
` in million
` in million
[At cost / carrying amount unless otherwise stated]
1) In Equity Shares of Other Companies:
a) Unquoted (Trade): Bharuch Eco-Aqua Infrastructure Limited 510000 INR 5.1 5.1
(510000) 10
Shivalik Solid Waste Management Limited 36000 INR 0.4 0.4
(36000) 10
b) Unquoted (Non Trade): Propstack Services Private Limited (` 20,000
Previous Year ` 20000)
2000 INR - -
(2000) 10
The Saraswat Co-operative Bank Limited 107000 INR 1.1 1.1
(107000) 10
6.6 6.6
2) Investment In Fund
Unquoted Non Trade : Asia Healthcare Fund Investment Trust (Units
of ` 100 each, Paid up value per unit of ` 75
each, Previous year ` 70 each)
183566 100 13.7 12.8
(183566)
Tata Capital Healthcare Fund (Units of Re.1
each, Paid up value per unit of ` 0.9 each,
Previous year ` 0.5 each)
100000000 1 88.8 49.3
(100000000)
Avenue Venture Real Estate Fund (Units of
` 100,000 each, fully paid-up) "The same is
disclosed under "Current Investments" as at
31 March 2016" (Refer sub note 4 of Note
2.13)
Nil 100000 - 2,221.4
(22780)
India Business Excellence Fund (Units of `
1,000,000 each, Paid up value per unit of `
975,000 each, Previous year ` 975,000 each)
25 1000000 16.7 22.1
(25)
India Business Excellence Fund-II (Units of
` 1,000 each, Paid up value per unit of ` 625
each, Previous year ` 400 each)
100000 1000 62.5 40.0
(100000)
Yournest Angel Fund-Scheme 1 (Units of
`10,000 each, Paid up value per unit of ` 7,573
each, Previous year ` 7,573 each)
2000 10000 15.1 15.1
(2000)
Indusage Technology Venture Fund I (Units of
` 1,000 each, Paid up value per unit of ` 250
each, Previous year ` 250 each)
20000 10000 5.0 5.0
(20000)
Motilal Oswal Most Focused Multicap 35 Fund
- Regular - Growth
2923388 INR 40.0 25.0
(2039518) 10
Motilal Oswal Most Focused Multicap 25 Fund
- Regular - Growth
675648 INR 10.0 -
(NIL) 10
251.8 2,390.7

ALKEM LABORATORIES LTD.164
Notesto the Consolidated Financial Statements
Particulars Number Face Value
As at 31 March 2016 As at 31 March 2015
` in million
` in million
` in million
` in million
3) Debentures :
Non Convertible Non Trade
Unquoted 12.50% Cholamandalam Investment & Finance
Limited
40 500000 20.0 20.0
(40)
10.17% HDB financial Service Limited
(Refer Note 4)
200 1000000 200.5 202.5
(200)
Quoted 8% Indian Railway Finance Corporation
Limited (Refer Note 4)
108754 1000 108.8 108.6
(108754)
12.00% ECL Finance Limited 10000 1000 10.0 10.0
(10000)
8.63% NHB Limited
(Refer Note 4)
7220 5000 36.1 36.1
(7220)
9.01% NHB Limited
(Refer Note 4)
4000 5000 20.1 20.2
(4000)
395.5 397.4
4) Bonds : Non Trade
Quoted 11% Bank of India
(Refer Note 4)
250 1000000 250.0 250.0
(250)
11% Bank of India
(Refer Note 4)
20 1000000 20.0 20.0
(20)
9.11% Bank of India
(Refer Note 4)
200 1000000 212.4 -
( Nil)
10.25% Tata Capital Limited. 40 500000 21.0 22.2
(40)
11.50% Tata Steel Limited 100 1000000 102.6 105.5
(100)
11.25% Tata Motors Finance Limited 100 500000 50.0 50.0
(100)
11.03% Tata Motors Finance Limited 100 1000000 100.0 100.0
(100)
11.80 % Tata Steel Limited 50 1000000 52.9 54.3
(50)
11.40% Tata Power Limited 50 1000000 50.6 50.6
(50)
9.55% Kotak Mahindra Prime
(Refer Note 4)
750 1000000 750.0 750.0
(750) 1,609.5 1,402.6
2,263.4 4,197.3
Less: Provision for diminution in the value of
Investments
- -
Total 2,263.4 4,197.3

CO
RP
OR
AT
E O
VE
RV
IEW
FIN
AN
CIA
L STAT
EM
EN
TS
STAT
UTO
RY
RE
PO
RT
S
ANNUAL REPORT 2015-16 165
Notesto the Consolidated Financial Statements
Consolidated Financial Statements
(` in million)
Notes: As at 31 March 2016 As at 31 March 2015
Cost Market Value
Cost Market Value
1) Aggregate value of Unquoted Investments: 479.0 N.A. 2,619.7 N.A.
2) Aggregate value of Quoted Investments: 1,784.4 1,792.9 1,577.6 1,641.2
3) All Investments in Shares & Securities are fully paid up except for investment in fund.(Refer Note 2.29(b-2))
4 a) Investments in 8% Indian Railway Finance Corporation Limited, 10.17% HDB Financial Services Limited, 8.63% NHB
Limited, 9.01% NHB Limited,11% Bank of India, 9.55% Kotak Mahindra Prime Aggregating to face value of ` 1,584.9
million has been pledged against issuance of Stand by letter of credit required for Loan of US$ 25.0 million advanced
by Citi Bank USA to ThePharmaNetwork LLC (USA), a 100% step down subsidiary of the company and Loan of US$
20.0 million advanced by Citi Bank USA to S&B Pharma Inc. (USA), a wholly owned subsidiary of the Company and
Loan of US$ 4 million advanced by Banco De Chile to Ascend Laboratories SpA, Chile, a wholly owned subsidiary of the
Company.
4 b) Previous year: Investments in 8% Indian Railway Finance Corporation Limited, 10.17% HDB Financial Services Limited,
8.63% NHB Limited, 9.01% NHB Limited,11% Bank of India, 9.55% kotak Mahindra Prime Aggregating to ` 1,387.5
million are in the process of pledge against issuance of Stand by letter of credit required for Term Loan of US$ 29.80
million advanced by Citi Bank USA to The Pharma Network LLC (USA), a 100% step down Subsidiary of the Company.
2.13. : CURRENT INVESTMENTS:Particulars Number Face Value As at 31 March 2016 As at 31 March 2015
` in million ` In million ` in million ` In million
(Non Trade):
1) Mutual Funds: (Quoted):
Benchmark Liquid Bees
835.01 (Previous Year
` 784.10)
0.8350 1000
(0.7840)
IDFC Money Manager Fund-
DIR-DLY
8684.5970 10 0.1 0.1
(13950.8150)
0.1 0.1
2) Debentures:
Current Portion of Non Current Investments
Non Convertible
Quoted
12.25% Religare Finvest
Limited
Nil 1000 - 50.0
(50000)
- 50.0
3) Commercial Paper: (Unquoted)
9.50% Barclays Investments
Limited
- 502.5
- 502.5

ALKEM LABORATORIES LTD.166
Notesto the Consolidated Financial Statements
Particulars Number Face Value As at 31 March 2016 As at 31 March 2015
` in million ` In million ` in million ` In million
4) Investment in funds : (Unquoted)
Current Portion of Non Current Investments
Avenue Venture Real Estate
Fund (Units of ` 100,000
each, fully paid-up) (Refer
sub note 4 of Note 2.13)
19966 100,000 1,934.0 -
(Nil)
1,934.0 -
5) Equity Shares: (Quoted)
Adani Ports & Special
Economic Zone Limited
Nil 10 - 0.9
(6297)
Asian Paints Limited Nil 1 - 0.5
(882)
Bajaj Finance Limited Nil 10 - 0.9
(391)
Bharat Forge Limited Nil 2 - 0.7
(526)
Bosch Limited Nil 10 - 1.9
(117)
Cairn India Limited 1000 10 0.3 0.3
(1000)
Colgate-Palmolive (India)
Limited
100 1 0.1 0.4
(228)
Container Corporation of
India Limited
Nil 10 - 0.5
(341)
City Union Bank Limited Nil 1 - 0.5
(6953)
Cummins India Limited Nil 2 - 0.7
(942)
DCB Bank Limited Nil 10 - 0.5
(5969)
D Q Entertainment Limited Nil 10 - 0.9
(12958)
Deccan Chronical Holdings
Limited
Nil 2 - 0.0
(256)
Eicher Motors Limited Nil 10 - 3.2
(322)
Engineers India Limited Nil 5 - 0.2
(900)
Emami Limited Nil 1 - 0.4
(648)
Gateway Distriparks Limited Nil 10 - 0.5
(3587)
GlaxoSmithKline Consumer
Healthcare Limited
Nil 10 - 0.5
(104)
HDFC Bank Limited Nil 10 - 0.9
(1101)

CO
RP
OR
AT
E O
VE
RV
IEW
FIN
AN
CIA
L STAT
EM
EN
TS
STAT
UTO
RY
RE
PO
RT
S
ANNUAL REPORT 2015-16 167
Notesto the Consolidated Financial Statements
Consolidated Financial Statements
Particulars Number Face Value As at 31 March 2016 As at 31 March 2015
` in million ` In million ` in million ` In million
HDFC Limited Nil 10 - 0.7
(745)
Hero Motocorp Limited Nil 2 - 0.5
(197)
Hindustan Petroleum Corp.
Limited
Nil 10 - 1.2
(2218)
ING Vyasya Bank Limited Nil 10 - 0.4
(667)
IRB Infrastructure
Developers Limited
Nil 10 - 1.2
(7904)
IPCA Lab Limited Nil 2 - 0.7
(971)
Jammu and Kashmir Bank
Limited
Nil 10 - 0.7
(4478)
Larsen & Toubro Limited Nil 2 - 1.6
(1879)
Max India Limited Nil 2 - 0.5
(1285)
Nava Bharat Ventures
Limited
Nil 2 - 0.8
(3966)
Page Industries Limited Nil 10 - 1.4
(182)
Sanghvi Movers Limited Nil 2 - 0.4
(4122)
State Bank of India Limited 6500 1 1.2 1.9
(35800)
Speciality Restaurant
Limited
Nil 10 - 0.1
(736)
Sun Pharmaceutical Limited 600 2 0.6 1.4
(8310)
Tata Consultancy Services
Limited
100 1 0.2 1.0
(399)
Tech Mahindra Limited 500 5 0.3 0.9
(3144)
Tara Jewels Limited Nil 10 - 6.6
(28535)
Torrent Power Limited Nil 10 - 0.5
(2490)
United Spirits Limited Nil 10 - 0.5
(188)
VA Tech Wabag Limited Nil 2 - 2.3
(9274)
Voltas Limited Nil 1 - 0.9
(4167)
Bhushan Steel Limited. 2000 2 0.6 0.6
(2000)
Chambal Fertilisers &
Chemical Limited.
3000 10 0.2 0.2
(3000)
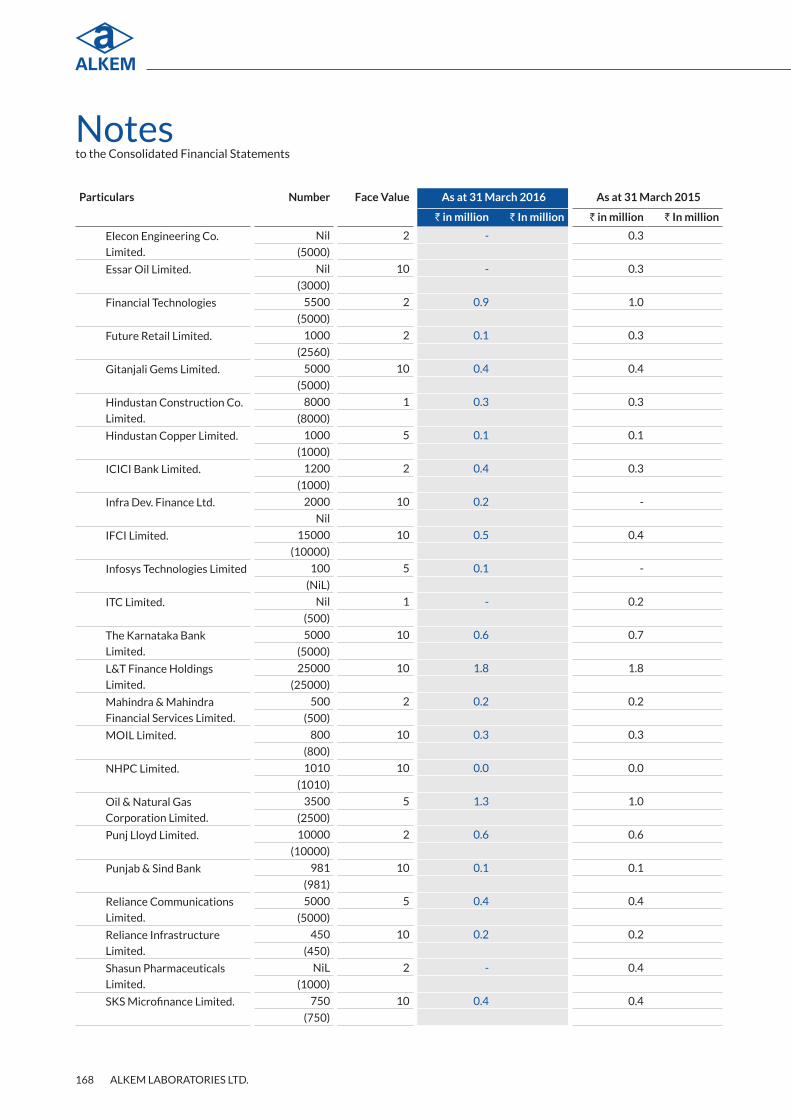
ALKEM LABORATORIES LTD.168
Notesto the Consolidated Financial Statements
Particulars Number Face Value As at 31 March 2016 As at 31 March 2015
` in million ` In million ` in million ` In million
Elecon Engineering Co.
Limited.
Nil 2 - 0.3
(5000)
Essar Oil Limited. Nil 10 - 0.3
(3000)
Financial Technologies 5500 2 0.9 1.0
(5000)
Future Retail Limited. 1000 2 0.1 0.3
(2560)
Gitanjali Gems Limited. 5000 10 0.4 0.4
(5000)
Hindustan Construction Co.
Limited.
8000 1 0.3 0.3
(8000)
Hindustan Copper Limited. 1000 5 0.1 0.1
(1000)
ICICI Bank Limited. 1200 2 0.4 0.3
(1000)
Infra Dev. Finance Ltd. 2000 10 0.2 -
Nil
IFCI Limited. 15000 10 0.5 0.4
(10000)
Infosys Technologies Limited 100 5 0.1 -
(NiL)
ITC Limited. Nil 1 - 0.2
(500)
The Karnataka Bank
Limited.
5000 10 0.6 0.7
(5000)
L&T Finance Holdings
Limited.
25000 10 1.8 1.8
(25000)
Mahindra & Mahindra
Financial Services Limited.
500 2 0.2 0.2
(500)
MOIL Limited. 800 10 0.3 0.3
(800)
NHPC Limited. 1010 10 0.0 0.0
(1010)
Oil & Natural Gas
Corporation Limited.
3500 5 1.3 1.0
(2500)
Punj Lloyd Limited. 10000 2 0.6 0.6
(10000)
Punjab & Sind Bank 981 10 0.1 0.1
(981)
Reliance Communications
Limited.
5000 5 0.4 0.4
(5000)
Reliance Infrastructure
Limited.
450 10 0.2 0.2
(450)
Shasun Pharmaceuticals
Limited.
NiL 2 - 0.4
(1000)
SKS Microfinance Limited. 750 10 0.4 0.4
(750)
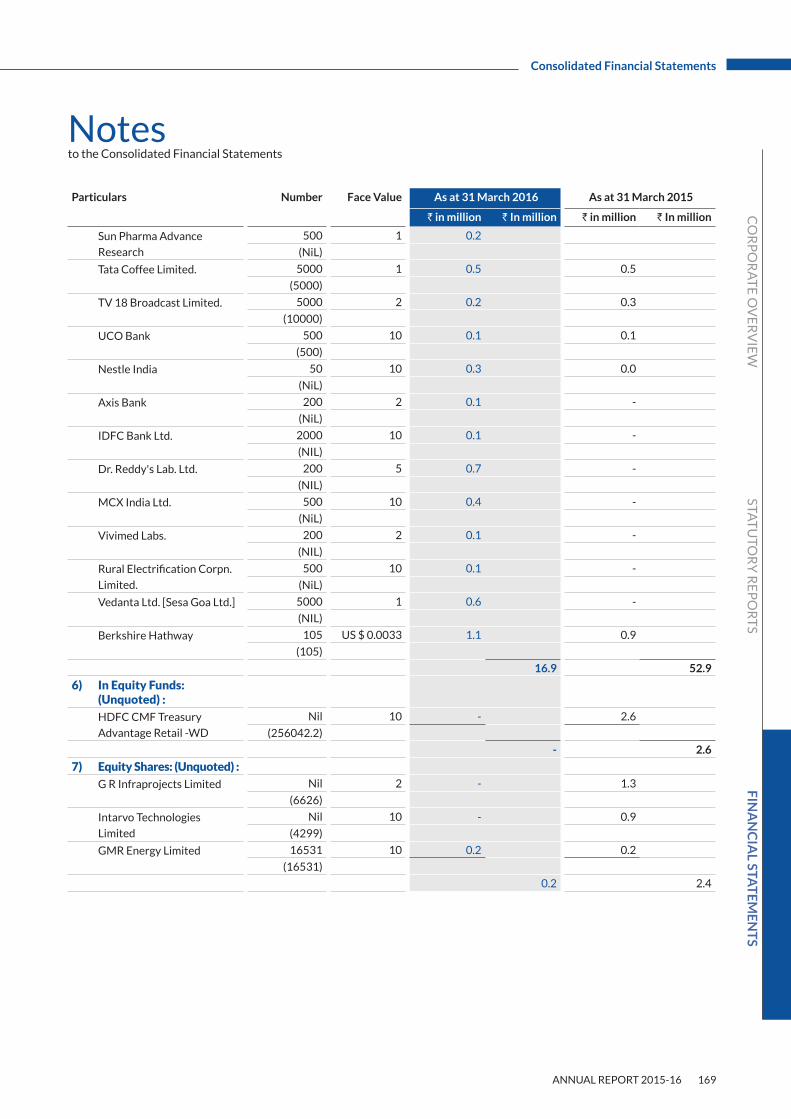
CO
RP
OR
AT
E O
VE
RV
IEW
FIN
AN
CIA
L STAT
EM
EN
TS
STAT
UTO
RY
RE
PO
RT
S
ANNUAL REPORT 2015-16 169
Notesto the Consolidated Financial Statements
Consolidated Financial Statements
Particulars Number Face Value As at 31 March 2016 As at 31 March 2015
` in million ` In million ` in million ` In million
Sun Pharma Advance
Research
500 1 0.2
(NiL)
Tata Coffee Limited. 5000 1 0.5 0.5
(5000)
TV 18 Broadcast Limited. 5000 2 0.2 0.3
(10000)
UCO Bank 500 10 0.1 0.1
(500)
Nestle India 50 10 0.3 0.0
(NiL)
Axis Bank 200 2 0.1 -
(NiL)
IDFC Bank Ltd. 2000 10 0.1 -
(NIL)
Dr. Reddy's Lab. Ltd. 200 5 0.7 -
(NIL)
MCX India Ltd. 500 10 0.4 -
(NiL)
Vivimed Labs. 200 2 0.1 -
(NIL)
Rural Electrification Corpn.
Limited.
500 10 0.1 -
(NiL)
Vedanta Ltd. [Sesa Goa Ltd.] 5000 1 0.6 -
(NIL)
Berkshire Hathway 105 US $ 0.0033 1.1 0.9
(105)
16.9 52.9
6) In Equity Funds: (Unquoted) :
HDFC CMF Treasury
Advantage Retail -WD
Nil 10 - 2.6
(256042.2)
- 2.6
7) Equity Shares: (Unquoted) :
G R Infraprojects Limited Nil 2 - 1.3
(6626)
Intarvo Technologies
Limited
Nil 10 - 0.9
(4299)
GMR Energy Limited 16531 10 0.2 0.2
(16531)
0.2 2.4

ALKEM LABORATORIES LTD.170
Notesto the Consolidated Financial Statements
Particulars Number Face Value As at 31 March 2016 As at 31 March 2015
` in million ` In million ` in million ` In million
8) Preference Shares: (Unquoted) :
Intarvo Technologies
Limited -CCPS
Nil 10 - 0.1
(1616)
Regen Powertech Private-
CCPS
4328 3.1 3.1
(4328)
GMR Energy Limited-CCPS 1799 10 1.8 1.8
(1799)
0.1% Cumulative Non
Convertible Preference
Shares
Saraswat Bank-NCPS 500000 10 5.0 5.0
(500000)
9.9 10.0
1961.1 620.5
Less: Provision for
diminution in the value of
Investments
4.4 10.0
Total 1956.7 610.5
Notes:
(` in million)
CostMarket
Value CostMarket
Value
1) Aggregate value of Quoted investments 17.0 12 102.9 102
Aggregate value of Unquoted investments 1944.1 N.A. 517.6 N.A.
2) All Investments in Shares & Securities are fully paid up.
(` in million)
As at 31 March 2016
As at 31 March 2015
3) Aggregate carrying amount of "Long term Investment"
within the meaning of AS 13
1934 50
4) During the year, pursuant to the approval of the Board of Directors in its meeting held on 9 March 2016, the Company
in order to focus on its core business activities and for other commercial reasons, restructured its investment in Avenue
Real Estate Fund ("Fund") by entering into an option agreement with Mr.Tushar Kumar for grant of unconditional option
exercisable without restriction at the option of the option holder to purchase the trust units held by the Company in the Fund
at an option price of 102% of the fair market value of each trust unit as on the exercise date. This Agreement shall remain in
force for a period of 2 years from the execution date and may be renewed with mutual consent of the parties.
NOTE-2.14 : DEFERRED TAX ASSETS (NET): (` in million)
Particulars As at 31 March 2016
As at 31 March 2015
Other Timing Differences ( Carried Forward business losses) 82.3 44.8
82.3 44.8

CO
RP
OR
AT
E O
VE
RV
IEW
FIN
AN
CIA
L STAT
EM
EN
TS
STAT
UTO
RY
RE
PO
RT
S
ANNUAL REPORT 2015-16 171
Notesto the Consolidated Financial Statements
Consolidated Financial Statements
NOTE-2.15 : LONG-TERM LOANS AND ADVANCES: (` in million)
Particulars As at 31 March 2016
As at 31 March 2015
(Unsecured, Considered Good)Capital advances 646.5 152.7
Security deposits 129.9 91.1
MAT credit entitlement (Refer Note 2.49) 5,099.6 4,499.6
Loans and advances to employees 20.5 22.9
Advance recoverable in cash or kind 129.3 108.9
Advance payment of Income tax (net of provisions) 414.2 546.5
Total 6,440.0 5,421.7
NOTE-2.16 : OTHER NON-CURRENT ASSETS (` in million)
Particulars As at 31 March 2016
As at 31 March 2015
In Deposit Accounts:Bank Deposits with maturity beyond 12 months (Refer Note 2.19) 2,351.4 4,515.9
Interest on deposits, accrued but not due 47.9 547.1
2,399.3 5,063.0
Note
The Company
Bank Deposits of ` 1,445.0 million (Previous Year ` 3,807.3 million) is under lien with the Banks against Over Draft Facility of the Company.
Bank Deposits of ` 55.0 million (Previous Year Nil) has been pledged against loan taken by Cachet Pharmaceuticals Private Limited, subsidiary of the Company in
India.
Bank Deposits of ` 33.5 million (Previous Year ` Nil) is under lien with bank against bank guarantees Indchemie Health Specialities Private Limited
Bank Deposits of ` 432.9 million (Previous Year ` 317.9 million) is under lien with the Banks against Over Draft Facility
NOTE-2.17. : INVENTORIES: (` in million)
Particulars As at 31 March 2016
As at 31 March 2015
Valued at Lower of Cost or Net realisable value
Raw and Packing Materials 2,641.6 2,347.2
Goods-in-Transit 6.4 1.7
2,648.0 2,348.9
Work-in-Progress 385.1 361.1
Finished Goods 3,643.7 2,393.6
Goods-in-Transit 708.3 276.8
4,352.0 2,670.4
Stock-in-Trade 1,519.6 2,116.3
Goods-in-Transit 189.6 345.6
1,709.2 2,461.9
Total 9,094.3 7,842.3
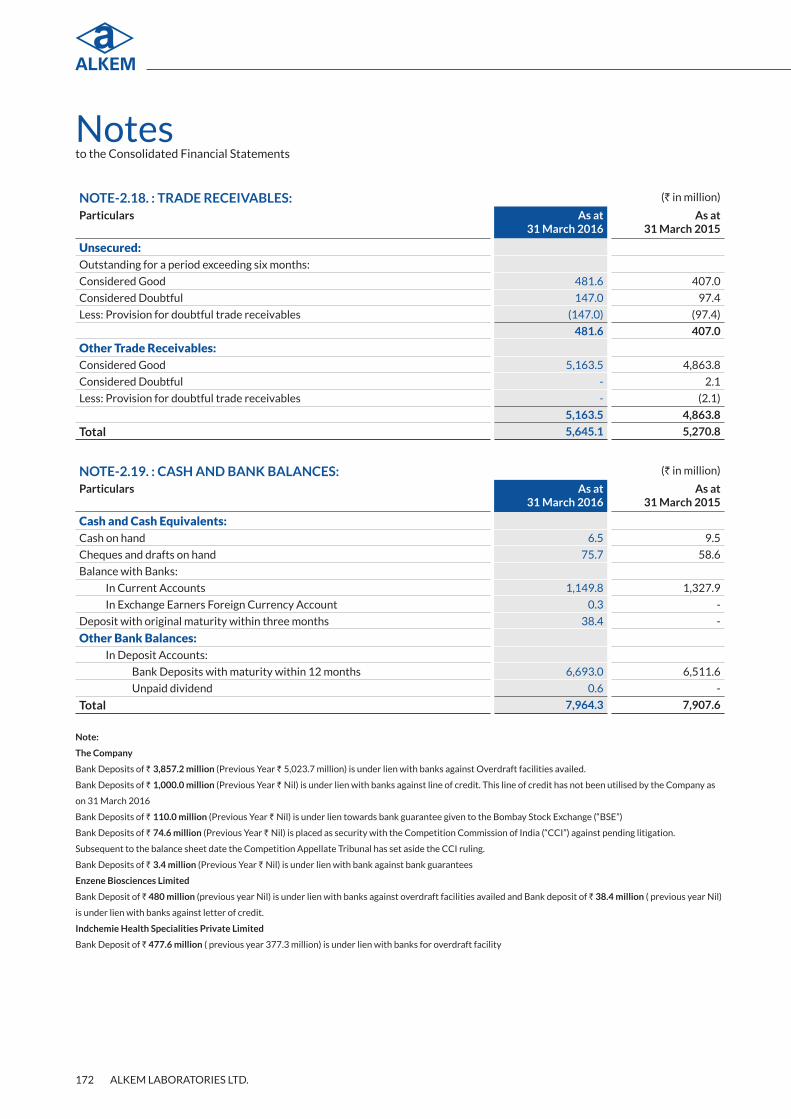
ALKEM LABORATORIES LTD.172
Notesto the Consolidated Financial Statements
NOTE-2.18. : TRADE RECEIVABLES: (` in million)
Particulars As at 31 March 2016
As at 31 March 2015
Unsecured:Outstanding for a period exceeding six months:
Considered Good 481.6 407.0
Considered Doubtful 147.0 97.4
Less: Provision for doubtful trade receivables (147.0) (97.4)
481.6 407.0
Other Trade Receivables:Considered Good 5,163.5 4,863.8
Considered Doubtful - 2.1
Less: Provision for doubtful trade receivables - (2.1)
5,163.5 4,863.8
Total 5,645.1 5,270.8
NOTE-2.19. : CASH AND BANK BALANCES: (` in million)
Particulars As at 31 March 2016
As at 31 March 2015
Cash and Cash Equivalents:Cash on hand 6.5 9.5
Cheques and drafts on hand 75.7 58.6
Balance with Banks:
In Current Accounts 1,149.8 1,327.9
In Exchange Earners Foreign Currency Account 0.3 -
Deposit with original maturity within three months 38.4 -
Other Bank Balances: In Deposit Accounts:
Bank Deposits with maturity within 12 months 6,693.0 6,511.6
Unpaid dividend 0.6 -
Total 7,964.3 7,907.6
Note:
The Company
Bank Deposits of ` 3,857.2 million (Previous Year ` 5,023.7 million) is under lien with banks against Overdraft facilities availed.
Bank Deposits of ` 1,000.0 million (Previous Year ` Nil) is under lien with banks against line of credit. This line of credit has not been utilised by the Company as
on 31 March 2016
Bank Deposits of ` 110.0 million (Previous Year ` Nil) is under lien towards bank guarantee given to the Bombay Stock Exchange (“BSE”)
Bank Deposits of ` 74.6 million (Previous Year ` Nil) is placed as security with the Competition Commission of India (“CCI”) against pending litigation.
Subsequent to the balance sheet date the Competition Appellate Tribunal has set aside the CCI ruling.
Bank Deposits of ` 3.4 million (Previous Year ` Nil) is under lien with bank against bank guarantees
Enzene Biosciences Limited
Bank Deposit of ` 480 million (previous year Nil) is under lien with banks against overdraft facilities availed and Bank deposit of ` 38.4 million ( previous year Nil)
is under lien with banks against letter of credit.
Indchemie Health Specialities Private Limited
Bank Deposit of ` 477.6 million ( previous year 377.3 million) is under lien with banks for overdraft facility

CO
RP
OR
AT
E O
VE
RV
IEW
FIN
AN
CIA
L STAT
EM
EN
TS
STAT
UTO
RY
RE
PO
RT
S
ANNUAL REPORT 2015-16 173
Notesto the Consolidated Financial Statements
Consolidated Financial Statements
(` in million)
As at 31 March 2016
As at 31 March 2015
Details of Bank Balances/DepositsBank Deposits with original maturity of 3 months or less 38.4 -
Bank Deposits with maturity within 12 months 6,693.0 6,511.6
Bank Deposits with maturity beyond 12 months (Refer Note No.2.16) Disclosed as
Other Non-Current Assets
2,351.4 4,515.9
9,082.8 11,027.5
NOTE-2.20. : SHORT TERM LOANS AND ADVANCES: (` in million)
Particulars As at 31 March 2016
As at 31 March 2015
(Unsecured, Considered Good, unless Otherwise stated)Balances with Government Authorities 999.7 731.7Advance to Suppliers:Considered Good 309.9 326.3Considered Doubtful 42.8 38.8
352.7 365.1Less: Provision for Doubtful Advances (42.8) (38.8)
309.9 326.3Prepaid Expenses 153.8 147.8Security Deposits 3.0 2.9Loans and Advances to Others 7.1 3.4Loans and Advances to Employees 90.4 84.2
Total 1,563.9 1,296.3
NOTE-2.21. : OTHER CURRENT ASSETS: (` in million)
Particulars As at 31 March 2016
As at 31 March 2015
Interest on Deposits, accrued but not due 424.6 153.3
Export Incentives Receivable 210.7 116.0
Other Receivables* 202.0 183.7
Total 837.3 453.0
*Includes insurance claim receivable ` 10.4 million (Previous year ` 81.7 million)
NOTE-2.22. : REVENUE FROM OPERATIONS: (` in million)
Particulars For Year ended 31 March 2016
For Year ended 31 March 2015
Sale of products (Gross) 50,461.4 37,781.0
Other Operating Revenue:
Manufacturing charges 20.8 23.1
Export Incentives 281.0 104.9
Scrap sales 35.1 23.8
Foreign Currency transactions and translation gain (Net) 156.1 22.2
Excise refunds 530.1 450.2
Government subsidy income (Refer Note 1.20) 4.8 36.6
Royalty income 44.5 41.5
Miscellaneous receipts 74.5 115.3
1,146.9 817.6
Total 51,608.3 38,598.6

ALKEM LABORATORIES LTD.174
Notesto the Consolidated Financial Statements
NOTE-2.23. : OTHER INCOME: (` in million)
Particulars For Year ended 31 March 2016
For Year ended 31 March 2015
Interest on bank deposits 998.6 915.0
Other Interest (includes interest on long-term investments ` 154.3 million
(Previous year ` 357.7 million)
264.6 378.1
Dividend Income (from current investment ) 1.0 3.1
Income from real estate fund ( from long term investment) 102.0 283.2
Sale of brands (Refer Note- 2.43) 205.0 -
Provision no longer required, written back 7.5 17.8
Rental income 13.5 34.2
Net profit on sale of investments (from current investments) 18.8 156.1
Miscellaneous income 34.1 22.9
Total 1,645.1 1,810.4
NOTE-2.24. : COST OF MATERIAL CONSUMED (` in million)
Particulars For Year ended 31 March 2016
For Year ended 31 March 2015
Raw Material consumed 8,370.4 6,245.5
Packing Material consumed 3,342.3 2,374.8
11,712.7 8,620.3
NOTE-2.25. : CHANGES IN INVENTORIES OF FINISHED GOODS, WORK-IN-PROGRESS AND STOCK-IN-TRADE:
(` in million)
Particulars For Year ended 31 March 2016
For Year ended 31 March 2015
Opening Stock:
Finished Goods 2,670.4 2,543.7
Stock-in-Trade 2,461.9 1,836.1
Work-in-Progress 361.1 387.4
5,493.4 4,767.2
Less: Closing stock:
Finished goods 4,352.0 2,325.0
Stock-in-trade 1,709.2 2,455.6
Work-in-progress 385.1 324.2
6,446.3 5,104.8
Effect of foreign exchange translation reserve 49.6 0.8
Total (903.3) (336.8)
NOTE-2.26. : EMPLOYEE BENEFITS EXPENSE: (` in million)
Particulars For Year ended 31 March 2016
For Year ended 31 March 2015
Salaries, wages and bonus 8,353.9 5,755.8
Contribution to provident and other fund (Refer Note - 2.31) 415.8 442.3
Employees’ welfare expenses 401.4 260.6
Employee stock compensation expenses (Refer Note -2.48) 0.2 -
Total 9,171.3 6,458.7

CO
RP
OR
AT
E O
VE
RV
IEW
FIN
AN
CIA
L STAT
EM
EN
TS
STAT
UTO
RY
RE
PO
RT
S
ANNUAL REPORT 2015-16 175
Notesto the Consolidated Financial Statements
Consolidated Financial Statements
NOTE-2.27. : FINANCE COST: (` in million)
Particulars For Year ended 31 March 2016
For Year ended 31 March 2015
Interest on borrowings 643.9 784.6
Other borrowing cost 26.7 26.5
Total 670.6 811.1
NOTE-2.28. : OTHER EXPENSES: (` in million)
Particulars For Year ended 31 March 2016
For Year ended 31 March 2015
Consumption of stores and spare parts 462.2 419.0
Power and fuel 663.0 533.1
Excise duty (net) 68.1 2.9
Processing charges 73.5 123.9
Rent 193.0 178.0
Rates and taxes 57.0 31.4
Insurance 163.1 112.4
Marketing and promotions 2,992.7 2,395.4
Selling and distribution expenses 1,511.8 1,190.5
Legal and professional fees- (Refer Note 2.46) 970.4 662.0
Sales-Tax , Octroi Duty, Custom Duty etc. 187.2 138.3
Commission and Discount 830.0 551.6
Travelling and conveyance 1,555.7 1,257.2
Repairs:
- Buildings 45.2 23.9
- Plant and machineries 135.0 102.7
- Others 175.7 79.2
Loss on sale of fixed assets (net) 127.5 49.3
Commission to director 130.0 -
Provision for diminution in value of investments 1.6 -
Donation 3.9 2.8
Communication and printing expenses 173.4 143.5
Vehicle expenses 82.7 69.8
Clinical and analytical charges 463.4 257.7
Bad Debts/Advances written off 146.0 97.9
Provision of doubtful debts 50.6 4.3
Corporate Social Responsibility (CSR) expenditure - (Refer Note 2.40) 43.1 12.0
Foreign currency loss/ (Gain) on transaction / translation 106.2 94.3
Royalty Expenses 402.9 294.6
Miscellaneous expenses (Refer Note 2.46) 835.2 1,022.8
Total 12,650.1 9,850.5

ALKEM LABORATORIES LTD.176
Notesto the Consolidated Financial Statements
NOTE-2.29 CONTINGENT LIABILITIES AND COMMITMENTS (` in million)
a) Contingent Liabilities not provided forSr
No.
Particulars As at 31 March 2016 As at 31 March 2015
1 Claims against the Company not acknowledged as debt:i Central Excise demand disputed in appeal {advances paid in dispute ` 13.7
million (Previous Year ` 30.8 million)}
37.7 56.8
ii Sales Tax demand disputed in appeal {advances paid in dispute
` 79.2 million (Previous Year ` 3.5 million)}
497.0 122.5
iii Service Tax demand disputed in appeal 1.1 37.5
iv Income Tax ( advance paid ` Nil ( previous year ( ` Nil)) 450.8 426.0
v a. In relation to purchase commitments- ` 968.1 million* (Previous year `
968.1 million) b.Supply of Goods: ` 461.2 million** (Previous year ` 717.4
million) c. in relation to property- ` Nil (Previous year ` 13.8 million)
1,429.3 1,699.2
Total 2415.9 2342.1
Management considers that service tax, excise duty, custom duty, sales tax and income tax demands received from the authorities are not tenable against the
Company, and therefore no provision for these tax contingencies have been made.
* Claim from vendor in relation to compliance with contractual purchase commitment and alleged infringement of intellectual property
** Claim from customer in relation to product quality issues and packing norms in recipient country.
The Company has reviewed all its pending litigations and proceedings and has adequately provided for, where provisions are required and disclosed as
contingent liabilities wherever applicable, in its financial statement. The Company does not expect the outcome of these proceedings to have materially adverse
effect on its financial statements.
b) Commitments (` in million)
Sr
No.
Particulars As at 31 March 2016
As at 31 March 2015
1 Estimated amount of contracts remaining to be executed on Capital Accounts
{advances paid ` 501.5 million (Previous Year ` 58.8 million)}
2303.9 142.4
2 Uncalled/ Unpaid contribution towards investment in funds (Refer
Note.2.12(2))
75.1 136.6
3 Other Commitments: Commitment towards research and development -
USD 5.2 million ( previous year USD 2.5 million)
345.5 187.5
4 Letter of Credit opened by the Banks 601.0 225.8
5 Outstanding Bank Guarantees 187.5 52.8
6 Pending Export Obligation under advance licence/ EPCG Scheme 51.8 10.0
7 Other Commitments - Non Cancellable Operating Lease - Refer Note 2.33
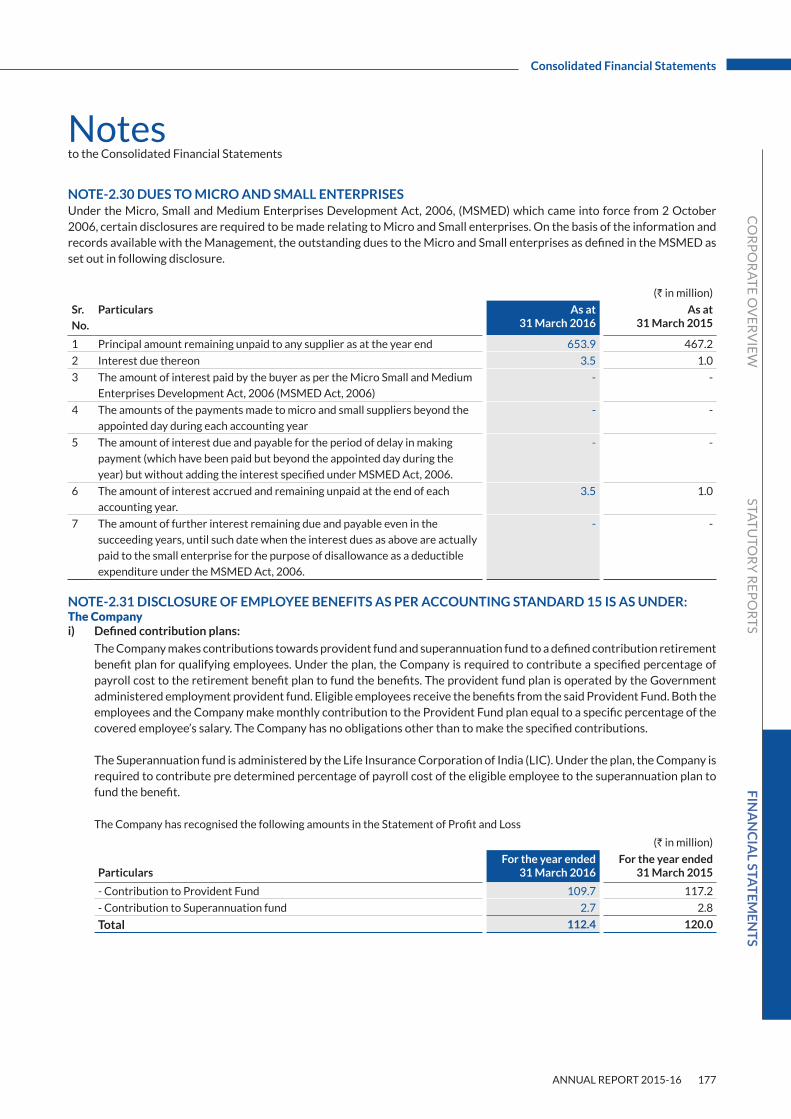
CO
RP
OR
AT
E O
VE
RV
IEW
FIN
AN
CIA
L STAT
EM
EN
TS
STAT
UTO
RY
RE
PO
RT
S
ANNUAL REPORT 2015-16 177
Notesto the Consolidated Financial Statements
Consolidated Financial Statements
NOTE-2.30 DUES TO MICRO AND SMALL ENTERPRISESUnder the Micro, Small and Medium Enterprises Development Act, 2006, (MSMED) which came into force from 2 October 2006, certain disclosures are required to be made relating to Micro and Small enterprises. On the basis of the information and records available with the Management, the outstanding dues to the Micro and Small enterprises as defined in the MSMED as set out in following disclosure.
(` in million)
Sr.
No.
Particulars As at 31 March 2016
As at 31 March 2015
1 Principal amount remaining unpaid to any supplier as at the year end 653.9 467.2
2 Interest due thereon 3.5 1.0
3 The amount of interest paid by the buyer as per the Micro Small and Medium
Enterprises Development Act, 2006 (MSMED Act, 2006)
- -
4 The amounts of the payments made to micro and small suppliers beyond the
appointed day during each accounting year
- -
5 The amount of interest due and payable for the period of delay in making
payment (which have been paid but beyond the appointed day during the
year) but without adding the interest specified under MSMED Act, 2006.
- -
6 The amount of interest accrued and remaining unpaid at the end of each
accounting year.
3.5 1.0
7 The amount of further interest remaining due and payable even in the
succeeding years, until such date when the interest dues as above are actually
paid to the small enterprise for the purpose of disallowance as a deductible
expenditure under the MSMED Act, 2006.
- -
NOTE-2.31 DISCLOSURE OF EMPLOYEE BENEFITS AS PER ACCOUNTING STANDARD 15 IS AS UNDER:The Companyi) Defined contribution plans:
The Company makes contributions towards provident fund and superannuation fund to a defined contribution retirement benefit plan for qualifying employees. Under the plan, the Company is required to contribute a specified percentage of payroll cost to the retirement benefit plan to fund the benefits. The provident fund plan is operated by the Government administered employment provident fund. Eligible employees receive the benefits from the said Provident Fund. Both the employees and the Company make monthly contribution to the Provident Fund plan equal to a specific percentage of the covered employee’s salary. The Company has no obligations other than to make the specified contributions.
The Superannuation fund is administered by the Life Insurance Corporation of India (LIC). Under the plan, the Company is required to contribute pre determined percentage of payroll cost of the eligible employee to the superannuation plan to fund the benefit.
The Company has recognised the following amounts in the Statement of Profit and Loss
(` in million)
ParticularsFor the year ended
31 March 2016 For the year ended
31 March 2015
- Contribution to Provident Fund 109.7 117.2
- Contribution to Superannuation fund 2.7 2.8
Total 112.4 120.0
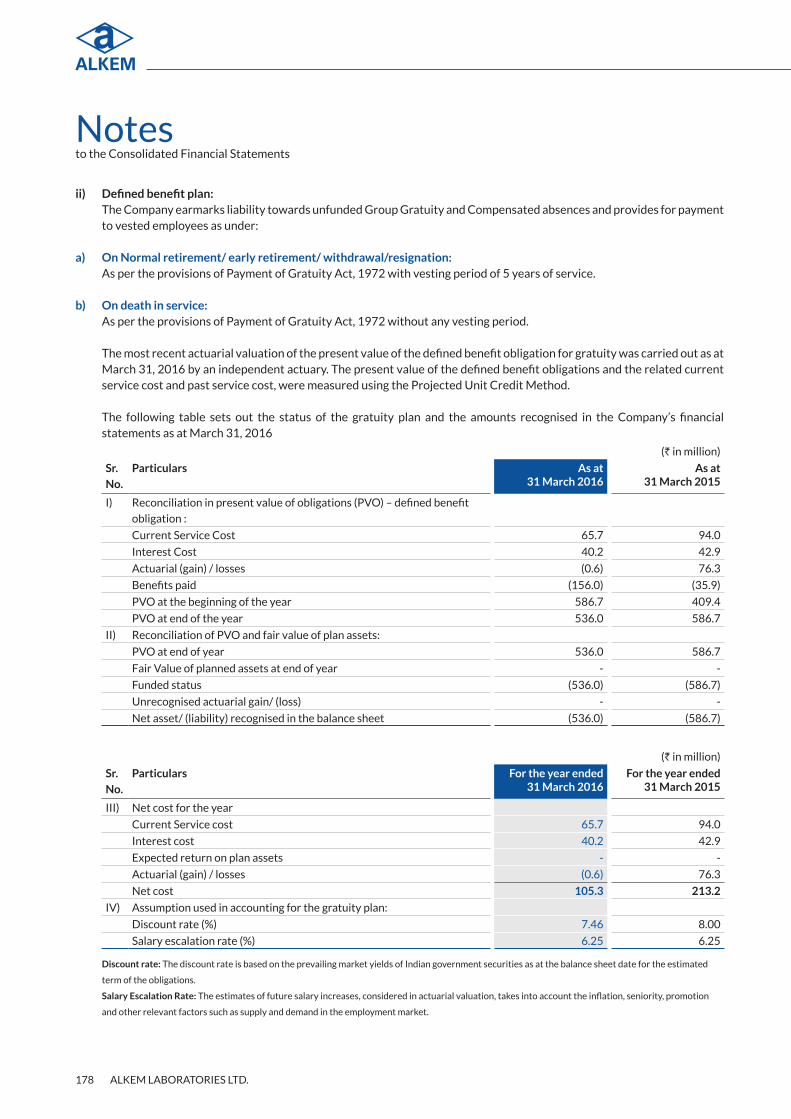
ALKEM LABORATORIES LTD.178
Notesto the Consolidated Financial Statements
ii) Defined benefit plan: The Company earmarks liability towards unfunded Group Gratuity and Compensated absences and provides for payment
to vested employees as under:
a) On Normal retirement/ early retirement/ withdrawal/resignation: As per the provisions of Payment of Gratuity Act, 1972 with vesting period of 5 years of service.
b) On death in service: As per the provisions of Payment of Gratuity Act, 1972 without any vesting period.
The most recent actuarial valuation of the present value of the defined benefit obligation for gratuity was carried out as at March 31, 2016 by an independent actuary. The present value of the defined benefit obligations and the related current service cost and past service cost, were measured using the Projected Unit Credit Method.
The following table sets out the status of the gratuity plan and the amounts recognised in the Company’s financial statements as at March 31, 2016
(` in million)
Sr.
No.
Particulars As at 31 March 2016
As at 31 March 2015
I) Reconciliation in present value of obligations (PVO) – defined benefit
obligation :
Current Service Cost 65.7 94.0
Interest Cost 40.2 42.9
Actuarial (gain) / losses (0.6) 76.3
Benefits paid (156.0) (35.9)
PVO at the beginning of the year 586.7 409.4
PVO at end of the year 536.0 586.7
II) Reconciliation of PVO and fair value of plan assets:
PVO at end of year 536.0 586.7
Fair Value of planned assets at end of year - -
Funded status (536.0) (586.7)
Unrecognised actuarial gain/ (loss) - -
Net asset/ (liability) recognised in the balance sheet (536.0) (586.7)
(` in million)
Sr.
No.
Particulars For the year ended 31 March 2016
For the year ended 31 March 2015
III) Net cost for the year
Current Service cost 65.7 94.0
Interest cost 40.2 42.9
Expected return on plan assets - -
Actuarial (gain) / losses (0.6) 76.3
Net cost 105.3 213.2
IV) Assumption used in accounting for the gratuity plan:
Discount rate (%) 7.46 8.00
Salary escalation rate (%) 6.25 6.25
Discount rate: The discount rate is based on the prevailing market yields of Indian government securities as at the balance sheet date for the estimated
term of the obligations.
Salary Escalation Rate: The estimates of future salary increases, considered in actuarial valuation, takes into account the inflation, seniority, promotion
and other relevant factors such as supply and demand in the employment market.

CO
RP
OR
AT
E O
VE
RV
IEW
FIN
AN
CIA
L STAT
EM
EN
TS
STAT
UTO
RY
RE
PO
RT
S
ANNUAL REPORT 2015-16 179
Notesto the Consolidated Financial Statements
Consolidated Financial Statements
The amounts of the present value of the obligation and experience adjustment arising on plan liabilities are as below :
(` In million)
Particulars As at 31 March 2016
As at 31 March 2015
As at 31 March 2014
As at 31 March 2013
As at 31 March 2012
Defined Benefit Obligation at end of
the year
536.0 586.7 409.4 366.1 348.6
Experience Gain/(Loss) Adjustment
on plan Liabilities
(11.2) (16.4) (48.9) 12.5 82.8
Actuarial Gain/(Loss) due to change
on assumption
10.6 92.7 31.3 (60.5) (75.8)
INDCHEMIE HEALTH SPECIALITIES PRIVATE LIMITED (“SUBSIDIARY”)(i) Defined contribution plans: The Company makes contributions towards provident fund to a defined contribution retirement benefit plan for
qualifying employees. Under the plan, the Company is required to contribute a specified percentage of payroll cost to the retirement benefit plan to fund the benefits. The provident fund plan is operated by the government administrated employment provident fund. Eligible employees receive the benefits from the said Provident Fund. Both the employees and the Company make monthly contribution to the Provident Fund plan equal to a specific percentage of the covered employee’s salary. The minimum interest rate payable to the beneficiaries every year is being notified to the government.
The Company has recognised the following amount in the Statement of Profit and Loss
(` In million)
Particulars For the year ended 31 March 2016
For the year ended 31 March 2015
- Contribution to Provident Fund 26.9 25.2
(ii) Defined benefit planThe Company earmarks liability towards unfunded Group Gratuity and Compensated absences and provides for payment to vested employees as under:
a) On Normal retirement/ early retirement/ withdrawal/resignation: As per the provisions of Payment of Gratuity Act, 1972 with vesting period of 5 years of service.
b) On death in service As per the provisions of Payment of Gratuity Act, 1972 without any vesting period. The most recent actuarial
valuation of plan assets and the present value of the defined benefit obligation for gratuity were carried out as at March 31, 2016 by the actuary.

ALKEM LABORATORIES LTD.180
Notesto the Consolidated Financial Statements
The following table sets out the status of the gratuity plan and the amounts recognised in the Company’s financial statements as at March 31, 2016.
(` in million)
Sr.
No.
Particulars As at 31 March2016
As at 31 March 2015
I) Reconciliation in present value of obligations (PVO) – defined
benefit obligation :
Current Service Cost 5.7 7.4
Interest Cost 3.2 2.6
Actuarial (gain) / losses 2.1 (7.7)
Benefits paid (1.7) (1.9)
PVO at the beginning of the year 41.0 33.5
PVO at end of the year 50.3 41.0
II) Change in fair value of plan assets
Expected return on plan assets - -
Actuarial gain/(losses) - -
Contributions by the employer 1.7 1.9
Benefits paid (1.7) (1.9)
Fair value of plan assets at beginning of the year - -
Fair value of plan assets at end of the year - -
III) Reconciliation of PVO and fair value of plan assets:
PVO at end of year 50.3 41.0
Fair Value of planned assets at end of year - -
Funded status (50.3) (41.0)
Unrecognised actuarial gain/ (loss) - -
Net asset/ (liability) recognised in the balance sheet (50.3) (41.0)
(` in million)
Sr.
No.
Particulars For the year ended 31 March 2016
For the year ended 31 March 2015
IV) Net cost for the year
Current Service cost 5.7 7.4
Interest cost 3.2 2.6
Expected return on plan assets - -
Actuarial (gain) / losses 2.1 7.7
Net cost 11.0 9.3
V) Assumption used in accounting for the gratuity plan:
Discount rate (%) 7.46 8.00
Salary escalation rate (%) 7.00 7.00

CO
RP
OR
AT
E O
VE
RV
IEW
FIN
AN
CIA
L STAT
EM
EN
TS
STAT
UTO
RY
RE
PO
RT
S
ANNUAL REPORT 2015-16 181
Notesto the Consolidated Financial Statements
Consolidated Financial Statements
The amounts of the present value of the obligation and experience adjustment arising on plan liabilities are as below :
( ` in million)
Particulars As at 31 March 2016
As at 31 March 2015
As at 31 March 2014
As at 31 March 2013
As at 31 March 2012
Defined Benefit Obligation at end of
the year
50.3 41.0 33.5 28.3 23.1
Experience Gain/(Loss) Adjustment on
plan Liabilities
0.1 (7.4) (1.2) (0.7) (3.0)
Actuarial Gain/(Loss) due to change
on assumption
2.0 (0.3) (0.2) (0.5) 3.3
CACHET PHARMACEUTICALS PRIVATE LIMITED (“SUBSIDIARY”)Defined contribution plans:The Company makes contributions towards provident fund and superannuation fund to a defined contribution retirement benefit plan for qualifying employees. Under the plan, the Company is required to contribute a specified percentage of payroll cost to the retirement benefit plan to fund the benefits. The provident fund plan is operated by the government administrated employment provident fund. Eligible employees receive the benefits from the said Provident Fund. Both the employees and the Company make monthly contribution to the Provident Fund plan equal to a specific percentage of the covered employee’s salary. The minimum interest rate payable to the beneficiaries every year is being notified to the Government.
The Company has recognised the following amounts in the Statement of Profit and Loss
(` in million)
ParticularsFor the year ended
31 March 2016For the year ended
31 March 2015
- Contribution to Provident Fund 22.9 20.5
(ii) Defined benefit plan: The Company earmarks liability towards unfunded Group Gratuity and Compensated absences and provides for payment
to vested employees as under:
a) On Normal retirement/ early retirement/ withdrawal/resignation: As per the provisions of Payment of Gratuity Act, 1972 with vesting period of 5 years of service.
b) On death in service: As per the provisions of Payment of Gratuity Act, 1972 without any vesting period.
The most recent actuarial valuation of plan assets and the present value of the defined benefit obligation for gratuity were carried out as at March 31, 2016 by the Actuary.

ALKEM LABORATORIES LTD.182
Notesto the Consolidated Financial Statements
The following table sets out the status of the gratuity plan and the amounts recognised in the Company’s financial statements as at March 31, 2016
(` in million)
Sr.
No.
Particulars As at 31 March 2016
As at 31 March 2015
I) Reconciliation in present value of obligations (PVO) – defined benefit obligation :Current Service Cost 6.9 5.6
Interest Cost 3.3 3.8
Actuarial (gain) / losses 2.6 3.6
Benefits paid (2.7) (5.0)
PVO at the beginning of the year 42.7 34.7
PVO at end of the year 52.9 42.7
II) Change in fair value of plan assetsExpected return on plan assets - -
Actuarial gain/(losses) - -
Contributions by the employer 2.7 5.0
Benefits paid (2.7) (5.0)
Fair value of plan assets at beginning of the year
Fair value of plan assets at end of the year
III) Reconciliation of PVO and fair value of plan assets:PVO at end of year 52.9 42.7
Fair Value of planned assets at end of year - -
Funded status (52.9) (42.7)
Unrecognised actuarial gain/ (loss) - -
Net asset/ (liability) recognised in the balance sheet (52.9) (42.7)
(` in million)
Sr.
No.
Particulars For the year ended 31 March 2016
For the year ended 31 March 2015
IV) Net cost for the year: -
Current Service cost 6.9 5.5
Interest cost 3.3 3.8
Expected return on plan assets - -
Actuarial (gain) / losses 2.6 3.6
Net cost 12.8 12.9
V) Assumption used in accounting for the gratuity plan:Discount rate (%) 7.46 7.96
Salary escalation rate (%) 5.00 5.00
ENZENE BIOSCIENCES LIMITED (SUBSIDIARY)i) Defined contribution plans: The Company makes contributions towards provident fund to a defined contribution retirement benefit plan for
qualifying employees. Under the plan, the Company is required to contribute a specified percentage of payroll cost to the retirement benefit plan to fund the benefits. The provident fund plan is operated by the government administrated employment provident fund. Eligible employees receive the benefits from the said Provident Fund. Both the employees and the Company make monthly contribution to the Provident Fund plan equal to a specific percentage of the covered employee’s salary. The minimum interest rate payable to the beneficiaries every year is being notified by the Government.

CO
RP
OR
AT
E O
VE
RV
IEW
FIN
AN
CIA
L STAT
EM
EN
TS
STAT
UTO
RY
RE
PO
RT
S
ANNUAL REPORT 2015-16 183
Notesto the Consolidated Financial Statements
Consolidated Financial Statements
The Company has recognised the following amount in the Statement of Profit and Loss
(` in million)
Particulars For the year ended 31 March 2016
For the year ended 31 March 2015
- Contribution to Provident Fund 0.8 0.6
Defined benefit plan:The Company earmarks liability towards unfunded Group Gratuity and Compensated absences and provides for payment to vested
employees as under:
a) On Normal retirement/ early retirement/ withdrawal/resignation:
As per the provisions of the Payment of Gratuity Act, 1972 with vesting period of 5 years of service.
b) On death in service:
As per the provisions of the Payment of Gratuity Act, 1972 without any vesting period.
The most recent actuarial valuation of plan assets and the present value of the defined benefit obligation for gratuity were
carried out as at March 31, 2016 by the Actuary. The present value of the defined benefit obligations and the related current
service cost and past service cost, were measured using the Projected Unit Credit Method.
The following table sets out the status of the gratuity plan and the amounts recognised in the Company’s financial statements as at
March 31, 2016.
(` in million)
Sr.
No.
Particulars As at 31 March 2016
As at 31 March 2015
I) Reconciliation in present value of obligationsObligations at period beginning – Current 0.1 0.0Obligations at period beginning - Non-current 1.3 0.7Current Service Cost 0.5 0.4Interest Cost 0.1 0.1Benefits paid (0.3) (0.1)Actuarial (gain) / losses (0.9) 0.2PVO at end of the year 0.7 1.4Current Liability (within 12 months) 0.1 0.1Non Current Liability 0.7 1.3
II) Change in fair value of plan assetsExpected return on plan assets - -Actuarial gain/(losses) - -Contributions by the employer 0.3 0.1Benefits paid (0.3) (0.1)Fair value of plan assets at beginning of the year - -Fair value of plan assets at end of the year - -

ALKEM LABORATORIES LTD.184
Notesto the Consolidated Financial Statements
(` in million)
Sr.
No.
Particulars For the year ended 31 March 2016
For the year ended 31 March 2015
III) Reconciliation of PVO and fair value of plan assets:PVO at end of year 0.8 1.4Fair Value of planned assets at end of year - -Funded status 0.8 1.4Unrecognised actuarial gain/ (loss) - -Net asset/ (liability) recognised in the balance sheet 0.8 1.4
IV) Net cost for the yearCurrent Service cost 0.5 0.4Interest cost 0.1 0.1Expected return on plan assets - -Actuarial (gain) / losses (0.9) 0.2Net cost (0.3) 0.6
V) Assumption used in accounting for the gratuity plan:Discount rate (%) 7.46% 8.00%Salary escalation rate (%) 6.25% 7.00%
THE PHARMANETWORK LLC, (SUBSIDIARY)The Company has maintained a 401(k) Safe Harbor Profit Sharing Plan (“Plan”) to provide retirement and incidental benefits for its eligible employees. Employees may contribute from 1% to 15% of their annual compensation to the Plan, limited to a maximum annual amount as set periodically by the Internal Revenue Service. The Company contributes 100% of each dollar of elective contributions each eligible participant makes each plan year, up to the limit of 4% of gross pay. All safe harbor contributions vest immediately. In addition, the Plan provides for discretionary contributions as determined by the board of directors. Such contributions to the Plan are allocated among eligible participants in the proportion of their salaries to the total salaries of all participants. Discretionary contributions are fully vested after six years of employment. The Plan requires that the contribution be placed in a trust fund in accordance with the Group Annuity Contract between the trustee, Chase Manhattan Bank, N.A. and the Equitable Life Assurance.
Company matching contributions to the Plan totalled $121,963 (` 7.9 million) for year ended 31 March 2016 , $79,066 (` 4.8 million) for the years ended March 31, 2015 . No discretionery contribution were made in either year.
S&B PHARMA INC. (SUBSIDIARY)The Company sponsors a 401(k) profit sharing plan that covers eligible employees. The profit sharing portion of the plan provides for contributions to eligible employees based on 6% of total compensation. For the year ended March 31, 2016 and 2015, the Company’s contributions to the plan were $ 292,623(` 19.1 million) and $ 305,528 (` 18.7 million) respectively.
The 401(k) portion of the plan provides for voluntary salary deferrals for eligible employees. Matching Company contributions are at the discretion of management; during the year ended 31 March, 2016 Matching contribution accrued and paid $ 19,600 (`1.3 Miilion) and no descretionery conrtibution made during the year 2015.
SUBSIDIARY IN NIGERIAAlkem Laboratories (Nigeria) Limited, the Group’s subsidiary in Nigeria, operates a contributory Pension Scheme, which employees join upon employment. Employees and employer contribution are 8% and 10% of defined total package respectively, in accordance with the requirements of the Pension Reform Act, 2012. Contributions are made to a Trust Fund that manages the scheme.The subsidiary’s liability in respect of the Scheme is charged to the Consolidated Statement of Profit and Loss of the year in which the contribution becomes payable.
During the year , the subsidiary ‘s accrued contribution to the plan was ` 0.8 millions and ` 0.5 millions for the year ended March 31,2016 and 2015 respectively.

CO
RP
OR
AT
E O
VE
RV
IEW
FIN
AN
CIA
L STAT
EM
EN
TS
STAT
UTO
RY
RE
PO
RT
S
ANNUAL REPORT 2015-16 185
Notesto the Consolidated Financial Statements
Consolidated Financial Statements
NOTE-2.32 DETAILS OF UNHEDGED FOREIGN CURRENCY EXPOSURE AND DERIVATIVE CONTRACTSThe year-end foreign currency exposures that have not been hedged by a derivative instrument or otherwise are as below:a. Amount receivable in foreign currency on account of the following
Particulars 31 March 2016 31 March 2015
` In million Amount in foreign currency
` In million Amount in foreign currency
Export of goodsEUR 105.2 1,414,013 28.4 422,911
GBP 0.3 3,361 17.0 183,810
USD 233.6 3,525,252 473.5 7,576,695
Loans & advancesEUR 15.0 198,884 - -
USD 187.1 2,824,353 - -
CHF 14.1 205,125 - -
JPY 4.7 7,999,983 - -
b. Amount payable in foreign currency on account of the following
Particulars 31 March 2016 31 March 2015
` In million Amount in foreign currency
` In million Amount in foreign currency
Import of goods and servicesUSD 465.8 7,030,357 186.8 2,989,218
EUR 3.2 42,925 70.8 1,053,039
CHF - 306 0.0 -
GBP 14.5 151,432 0.4 3,803
JPY 0.1 152,855 - -
Unsecured loansUSD 1,822.0 27,500,000 1,093.8 17,500,000
Secured loansUSD 629.4 9,500,000 875.0 14,000,000
NOTE-2.33 a) The Company has entered into non - cancellable operating lease agreements for premises/car/Computers. Rent expenses
debited to the Statement of Profit and Loss is as below:
(` in million)
Particulars 31 March 2016 31 March 2015
Rent expense 193.0 178.0
Total 193.0 178.0
The future minimum lease payments in respect of the non cancellable lease agreements as on the year end is as below:
(` in million)
Particulars 31 March 2016 31 March 2015
Not later than one year 54.3 66.7
Later than one year but not later than five years 85.1 90.9
Later than five years 6.2 1.9
Total 145.6 159.5

ALKEM LABORATORIES LTD.186
Notesto the Consolidated Financial Statements
b) Subsidiary companies in the U.S. have future obligations under finance lease for procurement of Plant & Equipment’s which are payable as follows:
(` in million)
Particulars 31 March 2016 31 March 2015
Not later than one year 31.3 28.7
Later than one year but not later than five years 23.4 50.9
Later than five years - -
Total 54.7 79.6
NOTE-2.34 SEGMENTAL REPORTING AS REQUIRED BY ACCOUNTING STANDARD – 17 (AS-17)Primary SegmentThe Group is currently focussing on two business segments i.e., pharmaceutical and investing. The business of food division is
insignificant and accordingly, has not been considered as a separate business segment. The research & development activity of the
Group is part of the pharmaceutical business.
(` in million)
Particulars Pharma Business Investing Unallocable Total
March 16 March 15 March 16 March 15 March 16 March 15 March 16 March 15
RevenueRevenue (net) 49,915.4 37,433.5 - - - - 49,915.4 37,433.5
Other income 249.2 49.2 1,395.9 1,761.2 - - 1,645.1 1,810.4
Total Revenue 50,164.6 37,482.7 1,395.9 1,761.2 - - 51,560.5 39,243.9
ResultSegment Result 8,731.8 4,268.1 1,395.6 1,760.6 - - 10,127.4 6,028.7
Less: Interest# - - 242.6 337.7 428.0 473.4 670.6 811.1
Less: Depreciation 1,005.8 709.4 - - - - 1,005.8 709.4
Profit Before Tax 7,726.0 3,558.7 1,153.0 1,422.9 (428.0) (473.4) 8,451.0 4,508.2
Less: Tax 1,551.4 284.9
Less: Deferred tax
charge / (Credit)
54.6 307.4
Profit after tax 7,726.0 3,558.7 1,153.0 1,422.9 (428.0) (473.4) 6,845.0 3,915.9
Other InformationSegmental assets 34,986.4 31,262.5 13,804.2 16,604.2 5,596.1 5,090.9 54,386.7 52,957.6
Segmental liabilities 10,634.7 7,986.7 - - 8,725.5 14,980.4 19,360.2 22,967.1
Capital expenditure 2,305.2 2,946.6 - - - - 2,305.2 2,946.6
Depreciation 1,005.8 709.4 - - - - 1,005.8 709.4
Non cash expenditure
other than
depreciation
500.3 707.0 - - - - 500.3 707.0
# Interest is allocated to the investing segment on the basis of net asset utilised
Secondary Segment In respect of secondary segment information, the Company has identified its geographical segment as (i) India and (ii) Outside India.
The secondary segment information has been disclosed accordingly.
(` in million)
Particulars Revenue from Sale of Product
Other Operating Revenue
Revenue from Operations
Carrying amount of Segment Assets
Capital Expenditure
March 16 March 15 March 16 March 15 March 16 March 15 March 16 March 15 March 16 March 15
India 35,361.0 27,129.7 821.3 734.2 36,182.3 27,863.8 43,443.1 45,035.6 1,769.7 1,316.1
Outside India 13,407.6 9,486.2 325.5 83.4 13,733.1 9,569.7 10,943.6 7,922.0 535.5 1,630.5
Total 48,768.6 36,615.9 1,146.8 817.6 49,915.4 37,433.5 54,386.7 52,957.6 2,305.2 2,946.6

CO
RP
OR
AT
E O
VE
RV
IEW
FIN
AN
CIA
L STAT
EM
EN
TS
STAT
UTO
RY
RE
PO
RT
S
ANNUAL REPORT 2015-16 187
Notesto the Consolidated Financial Statements
Consolidated Financial Statements
NOTE-2.35 INFORMATION ON RELATED PARTY TRANSACTIONS AS REQUIRED BY ACCOUNTING STANDARD 18 (AS 18) ON RELATED PARTY DISCLOSURES FOR THE YEAR ENDED 31 MARCH 2016
List of Related Parties and their relationshipA. Key Managerial Personnel
Mr. Samprada Singh Chairman Emeritus B. Relatives of Key Management Personnel with whom transaction
have taken place during the year
Mr. Basudeo Narain Singh Executive Chairman Mr. Satish Kumar Singh Son of Samprada Singh
Mr. Balmiki Prasad Singh Director Mrs. Jayanti Sinha Sister of Samprada Singh
Mr. Dhananjay Kumar Singh Joint Managing
Director
Mrs. Archana Singh Daughter of Basudeo Narain Singh
Mr. Mrityunjay Kumar Singh Director Mr. Sarandhar Singh Son of Balmiki Prasad Singh
Mr. Sandeep Singh Joint Managing
Director
Mr. Srinivas Singh Son of Balmiki Prasad Singh
Mr. Nawal Kishore Singh
(up to 2 January, 2015)
Director Mr. Sarvesh Singh Brother of Sandeep Singh
Mr. Prabhat Narain Singh
(up to 20 February, 2015)
Director Mrs. Manju Singh Wife of Balmiki Prasad Singh
Mr. Prabhat Agrawal
(w.e.f. 21st October, 2014)
Chief Executive Officer Mrs. Premlata Singh Mother of Sandeep Singh
Mrs. Madhurima Singh Wife of Dhananjay Kumar Singh
Mrs. Seema Singh Wife of Mritunjay Kumar Singh
Ms. Divya Singh Daughter of Dhananjay Kumar Singh
Mst. Aniruddha Singh Son of Dhananjay Kumar Singh
Ms. Meghna Singh Daughter of Mritunjay Kumar Singh
Shrey Shree Anant Singh Son of Mritunjay Kumar Singh
Ms.Inderjit Arora Wife of Sandeep Singh
Rekha Singh Wife of Basudeo Narain Singh
Mr. Nawal Kishore Singh Son of Samprada Singh
Shalini Singh
(up to 2 January 2015)
Daughter of Nawal Kishore Singh
Neha Singh
(up to 2 January 2015)
Daughter of Nawal Kishore Singh
Khushboo Singh
(up to 2 January 2015)
Daughter of Nawal Kishore Singh
Anju Singh
(up to 2 January 2015)
Wife of Nawal Kishore Singh

ALKEM LABORATORIES LTD.188
Notesto the Consolidated Financial Statements
C. Entities with whom transaction have taken place during the year in which Key Management Personnel’s and their relatives have significant influence:
M/s Galpha Laboratories Ltd., M/s. Samprada Singh (HUF),Cachet Pharmaceuticals Pvt. Ltd (up to 27 March, 2015) , Indchemie
Health Specialities Pvt. Ltd.(up to 30 March, 2015)
(` In million)
Sr.
No.
Particulars Year ended 31 March 2016
Key Management Personnel
Relatives of Key Management
Personnel
Entities Total
1 Remuneration* 398.4 82.0 - 480.4
(307.7) (22.9) - (330.7)
2 Loans Taken - 60.7 - 60.7
(319.2) - - (319.2)
3 Loans Repaid - -
(679.9) (283.8) (2.6) (966.2)
4 Interest expense on loans taken - 0.9 - 0.9
(37.7) (24.1) (0.3) (62.1)
5 Purchase of Goods - - 383.0 383.0
- - (2,003.1) (2,003.1)
6 Sale of Goods - - 42.1 42.1
- - (59.4) (59.4)
7 Sale of Raw and Packing Materials - - 7.7 7.7
- - (15.8) (15.8)
8 Purchase of Raw and Packing
Materials
- - 49.5 49.5
- - (90.8) (90.8)
9 Services received - - 15.8 15.8
- - (117.1) (117.1)
10 Services rendered - - 15.3 15.3
- - (23.1) (23.1)
11 Rental Income - - 3.3 3.3
- - (16.5) (16.5)
12 Rent Expenses 0.6 3.4 - 4.0
(0.6) (3.4) - (4.0)
13 Final/Interim Dividend paid 419.5 582.0 1.9 1,003.4
(147.1) (185.1) (0.6) (332.8)
14 Repayment of loan given 3.0 - - 3.0
(3.0) - - (3.0)
15 Sale of Assets/Assets under
construction
- - - -
(34.7) - (0.5) (35.2)
16 Reimbursement of expenses from - - 0.3 0.3
- - (2.3) (2.3)
17 Interest income on loan Given 0.2 - - 0.2
(0.1) - - (0.1)
*Remuneration does not include charge for gratuity and leave encashment as employee-wise break-up is not available.
Figures in the brackets are the corresponding figures of the previous period.

CO
RP
OR
AT
E O
VE
RV
IEW
FIN
AN
CIA
L STAT
EM
EN
TS
STAT
UTO
RY
RE
PO
RT
S
ANNUAL REPORT 2015-16 189
Notesto the Consolidated Financial Statements
Consolidated Financial Statements
NOTE-2.35 INFORMATION ON RELATED PARTY TRANSACTIONS AS REQUIRED BY ACCOUNTING STANDARD 18 (AS 18) ON RELATED PARTY DISCLOSURES FOR THE YEAR ENDED 31 MARCH 2016.Out of the above items transactions in excess of 10% of the total related party transactions
(` In million)
Sr.
No.
Transactions Related Party relation Year ended 31 March 2016
Year ended 31 March 2015
1 RemunerationMr. Samprada Singh Key Management Personnel 126.0 85.5
Mr. Basudeo Narain Singh Key Management Personnel 86.9 86.4
Mr. Naval Kishore Singh Key Management Personnel - 68.6
Mr. Prabhat Agrawal Key Management Personnel 58.7 -
2 Loans takenMr. Basudeo Narain Singh Key Management Personnel - 122.5
Mr. Dhananjay Kumar Singh Key Management Personnel - 35.3
Mr. Samprada Singh Key Management Personnel - 55.0
Mr. Balmiki Prasad Singh Key Management Personnel - 105.2
Mr Satish Kumar Singh Relative of Key Management Personnel 60.7 -
3 Loans repaidMr. Basudeo Narain Singh Key Management Personnel - 238.9
Mr. Samprada Singh Key Management Personnel - 124.6
Mr. Balmiki Prasad Singh Key Management Personnel - 200.1
Mrs. Rekha Singh Relative of Key Management Personnel - 126.6
4 Interest expenses on loans takenMr. Balmiki Prasad Singh Key Management Personnel - 12.8
Mr. Basudeo Narain Singh Key Management Personnel - 13.6
Mrs. Rekha Singh Relative of Key Management
Personnel
- 8.7
Mr. Satish kumar Singh Relative of Key Management Personnel 0.9 -
5 Purchase of goodsCachet Pharmaceuticals Pvt. Ltd. Entities - 722.0
Indchemie Health Specialties Pvt. Ltd. Entities - 866.3
Galpha Laboratories Limited Entities 383.0 414.7
6 Sale of raw and packing materialsIndchemie Health Specialties Pvt. Ltd. Entities - 11.4
Galpha Laboratories Limited Entities 7.7 2.9
7 Purchase of raw and packing materialsGalpha Laboratories Limited Entities 49.5 87.9
8 Services receivedIndchemie Health Specialties Pvt. Ltd. Entities - 79.8
Cachet Pharmaceuticals Pvt. Ltd. Entities - 20.9
Galpha Laboratories Limited Entities - 16.4
9 Services renderedGalpha Laboratories Limited Entities 11.1 22.8
10 Rental IncomeIndchemie Health Specialties Pvt. Ltd. Entities - 10.2
Galpha Laboratories Limited Entities 3.3 3.3
Cachet Pharmaceuticals Pvt. Ltd. Entities - 3.0

ALKEM LABORATORIES LTD.190
Notesto the Consolidated Financial Statements
(` In million)
Sr.
No.
Transactions Related Party relation Year ended 31 March 2016
Year ended 31 March 2015
11 Rent ExpensesMr. Dhananjay Kumar Singh Key Management Personnel 0.6 0.6
Mrs. Divya Singh Relative of Key Management Personnel 1.1 1.1
Mrs. Madhurima Singh Relative of Key Management Personnel 1.1 1.3
Mr. Sarvesh Singh Relative of Key Management Personnel 1.0 1.0
12 Sale of Assets/Assets under constructionMr. Basudeo Narain Singh Key Management Personnel - 34.7
13 Reimbursement of expenses fromCachet Pharmaceuticals Pvt. Ltd. Entities - 0.8
Indchemie Health Specialties Pvt. Ltd. Entities - 0.9
Galpha Laboratories Limited Entities 0.3 0.6
14 Loans Given (net)Mr. Prabhat Agrawal Key Management Personnel - 3.7
15 Repayment of loan givenMr. Prabhat Agrawal Key Management Personnel 3.0 0.7
16 Interest Income on loan givenMr. Prabhat Agrawal Key Management Personnel 0.2 0.1
Balance due from / to the related Parties
(` In million)
Sr.
No.
Particulars As at 31 March 2016
Key Management Personnel
Relatives of Key Management
Personnel
Entities Total
a b c
1 Outstanding Payables - - 46.7 46.7
2 Loan payable - 60.7 - 60.7
3 Outstanding Receivable - - 5.7 5.7
(` In million)
Sr.
No.
Particulars As at 31 March 2015
Key Management Personnel
Relatives of Key Management
Personnel
Entities Total
a b c
1 Outstanding Payables - - 53.8 53.8
2 Loan payable 3.0 - - 3.0
NOTE-2.36 The aggregate amount of revenue expenditure incurred during the year on Research and Development and shown in the respective heads of account is ` 2,165.5 million (Previous year ` 1,695.5 million)

CO
RP
OR
AT
E O
VE
RV
IEW
FIN
AN
CIA
L STAT
EM
EN
TS
STAT
UTO
RY
RE
PO
RT
S
ANNUAL REPORT 2015-16 191
Notesto the Consolidated Financial Statements
Consolidated Financial Statements
NOTE-2.37 EARNINGS PER SHARE (EPS)Particulars Year ended 31
March 2016Year ended 31
March 2015
Profit /(loss) after tax attributable to equity shareholders ` in million A 6,731.2 3,915.9
Weighted average number of equity shares outstanding
during the year
Nos. B 119,565,000 119,565,000
Basic and diluted earnings per equity share (`) - Face value of
` 2 per share
In ` (A / B) 56.30 32.75
Since the split in face value of equity shares from ` 10 each to ` 2 each fully paid up and the issue of bonus shares in the ratio of 1 fully paid up equity shares of face value of ` 2 each for each existing equity shares of face value of ` 2 each is an issue without consideration, the issue is treated as if it had occurred prior to the beginning of the year 2013-14, the earliest period reported.
NOTE-2.38 DISCLOSURE AS PER ACCOUNTING STANDARD (AS 29) FOR PROVISIONS IS AS UNDER:Provision for Sales Return:
(` In million)
Particulars As at 31 March 2016
As at 31 March 2015
Carrying amount at the beginning of the year 504.2 -
Add: Provision made during the year * 543.3 504.2
Less: Amount used/utilized during the year 296.3 -
Carrying amount at the end of the year 751.2 504.2
Until 31 March 2014,the Company accounted for sales returns on actual returns. With effect from 1st April, 2014, in line with an opinion of Expert Advisory Committee of the Institute of Chartered Accountants of India on accounting for sales returns, the company has revised its approach by accounting for anticipated sales returns and has recorded a cumulative provision for anticipated sales returns during the year ended 31 march 2015 , by charging it to Statement of Profit and Loss.
NOTE-2.39 DERIVATIVE CONTRACTSCompany has entered into an interest rate swap contract to hedge the interest rate risk with respect to the foreign currency borrowing with a variable interest rates based on LIBOR. The Company has fair valued the financial instruments and the reversal mark to market losses on the instrument has been recognised to the Statement of Profit and Loss during the year amounting to ` 3.1 million ( Previous year ` 10.9 millions - Charged to the Statement of Profit and Loss).
NOTE-2.40 The gross amount required to be spent on Corporate Social Responsibilities (“CSR”) by the Group during the year is ` 97.7 million (Previous year : ` 94.6 million) The Group has spent ` 43.0 million (Previous Year : 12.0 million) towards CSR as per the approved CSR policy of the Company on healthcare, women empowerment, education, sanitation, conservation of environment, rural development.
NOTE-2.41 GOODWILL ON CONSOLIDATION COMPRISES OF(` In million)
Name of the Entities As at 31 March 2016
As at 31 March 2015
The Pharmanetwork LLC, United States of America 1,877.3 1,775.9
Pharmacor Ltd Australia 159.1 151.0
Enzene Biosciences Limited 106.0 106.0
Cachet Pharmaceuticals Pvt. Ltd 487.9 487.9
Indchemie Health Specialities Pvt. Ltd 900.3 900.3
Total 3,530.6 3,421.0

ALKEM LABORATORIES LTD.192
Notesto the Consolidated Financial Statements
NOTE-2.42 MINORITY INTEREST REPRESENTS THE MINORITY’S SHARE IN EQUITY OF THE SUBSIDIARIES AS BELOW:
(` In million)
Name of the Entities As at 31 March 2016
As at 31 March 2015
Cachet Pharmaceuticals Pvt. LtdShare in Equity Capital 0.7 0.7
Share in Reserves and Surplus 164.2 144.4
Sub Total (A) 164.9 145.1
Indchemie Health Specialities Pvt. LtdShare in Equity Capital 1.2 1.2
Share in Reserves and Surplus 799.3 710.2
Sub Total (B) 800.5 711.4
Grand Total (A) + (B) 965.4 856.5
NOTE-2.43 During the year, the Company has sold brands and trademarks relating to its In Vitro Fertilisation (IVF) formulations to Ordain Health Care Global Private Limited for a total consideration of ` 205.0 million.
NOTE-2.44 ADDITIONAL INFORMATION AS REQUIRED UNDER PARA 2 OF GENERAL INSTRUCTION FOR THE PREPARATION OF CONSOLIDATED FINANCIAL STATEMENTS OF SCHEDULE III TO THE COMPANIES ACT, 2013.Name of the enterprises Net assets i.e. total assets
minus total liabilities Share in profit or loss
As (%) of consolidated
net assets
Amount (` In million)
As (%) of consolidated profit or loss
Amount (` In million)
Parent CompanyAlkem Laboratories Limited 98.82% 35,598.0 94.85% 6,384.4
Subsidiaries
IndianEnzene Biosciences Limited 0.43% 155.4 -4.25% (286.0)
Cachet Pharmaceuticals Private Limited 0.99% 357.9 0.60% 40.4
Indchemie Health Specialities Private Limited 4.60% 1,657.0 2.85% 191.8
ForeignAlkem Laboratories ( Nigeria) Limited -0.40% (145.1) -0.59% (39.9)
Alkem Laboratories Pty Ltd -0.02% (8.5) -0.06% (4.0)
Alkem Pharma Gmbh -0.01% (2.1) -0.01% (0.5)
Alkem Laboratories Corporation -0.23% (83.9) -1.19% (80.4)
S & B Holdings B.V 4.42% 1,592.6 -6.96% (468.6)
Pharmacor Ltd ( Australia) 0.09% 33.2 1.51% 101.4
The Pharmanetwork LLC & Subsidiaries 11.36% 4,092.1 20.11% 1,353.8
Ascends Laboratories SDN BHD. 0.00% 0.0 0.00% -
Ascend Laboratories SpA 0.09% 32.4 0.47% 31.9
Alkem Laboratories, Korea Inc 0.00% 0.1 0.00% 0.0
Pharmacor Ltd. 0.00% 0.1 0.00% 0.0
S&B Pharma Inc. 0.43% 153.9 -2.27% (152.5)
The PharmaNetwork, LLP 0.16% 56.9 -0.20% (13.3)
Ascend Laboratories (UK) Limited 0.04% 13.7 0.11% 7.3
Total Eliminations -23.45% (8,446.2) -3.28% (220.8)
Minority Interest 2.68% 965.4 -1.69% (113.8)
100.00% 36,022.9 100.00% 6,731.2

CO
RP
OR
AT
E O
VE
RV
IEW
FIN
AN
CIA
L STAT
EM
EN
TS
STAT
UTO
RY
RE
PO
RT
S
ANNUAL REPORT 2015-16 193
Notesto the Consolidated Financial Statements
Consolidated Financial Statements
NOTE-2.45 ACQUISITION OF MANUFACTURING FACILITY OF LONG PHARMA
On 5 June 2015, the subsidiary of the Company, S&B Pharma Inc., USA consummated the acquisition of substantially, all the assets of Long Pharmaceuticals (“Long”), a Missouri Limited Liability Company. The transaction is financed by the credit facility provided by the bank. The purchased assets of this pharmaceutical product development and manufacturing business include property located at 1733 Gilson lane, Fenton, MO including all improvement fixture and leasehold property, material contracts, all trademark data, dossier and other intellectual property and all other assets used in the operation of the business including lab and manufacturing equipments, office furniture, communication equipment and forklifts. The amount paid for the Long’s operating assets aggregated to $7,017,420 (` 450.2 million) plus the assumption of certain liabilities $240,537 (`15.4 million) associated with assets purchased.
NOTE-2.46 a) During the previous year, the Company had settled some pending legal matters in relation to product infringement claims
on the company. As a part of settlement, the Company had paid ` 262.5 millions which is shown under Miscellaneous expenses in Other Expenses under note 2.28.
b) During the previous year the Subsidiary in USA had initiated, with the help of external consultants and lawyers, to implement system related to Government reporting and arrived at additional amount payable to US Department of Health and Human Services. The total cost of USD 51,02,206 equivalent to ` 311.6 millions considered as expenditure during the year of which ` 188.8 millions is under legal and professional charges and ` 122.8 millions is under Miscellaneous expenses in Other expenses under Note 2.28.
NOTE-2.47 a) During the year ended 31 March 2016, the Company had contributed ` 100.4 million in Wholly Owned Subsidiary The
Pharma Network LLP, in Kazakhstan by way of Capital contribution.
b) During the previous year the company had acquired 51% equity stake in following companies in India: i) Indchemie Health Specialities Pvt. Ltd (“IHSPL”) at a total cost of ` 1,640.7 millions
ii) Cachet Pharmaceuticals Pvt. Ltd (“CPPL”) at a total cost of 638.9 millions pursuant to the acquisition IHSPL & CCPL have become subsidiary of the Company.
c) During the previous year the company purchased additional 20% equity stake in its subsidiary M/s. Enzene Biosciences Limited (“EBL”) at a total cost of ` 35.0 millions. persuant to these acquisition EBL had become a wholly owned subsidiary of the company. During the year company has contributed ` 497.4 million by way of capital contribution.
d) During the previous year company had set up a wholly owned subsidiary in United Kingdom viz, “Ascend Laboratories (UK) Limited” by way of a capital contribution of ` 4.9 millions. During the year company has further contributed ` 5 million towards capital.
e) During the previous year the company had acquired 51% equity stake in M/s. S&B Pharma Inc. from its wholly owned subsidiary viz M/s. S&B Holdings B.V. Netherlands. Pursuant to the acquisition M/s.S&B Pharma Inc. has now become a direct wholly owned subsidiary of the Company.
f) During the previous year the company has contributed ` 0.1 million in Alkem Real Estate LLP as capital contribution and the same has been withdrawn pursuant to the process of winding up of the Alkem Real Estate LLP.

ALKEM LABORATORIES LTD.194
Notesto the Consolidated Financial Statements
NOTE-2.48 EMPLOYEE STOCK OPTION SCHEMEENZENE BIOSCIENCES LIMITED (Subsidiary)As at 31 March 2016, the Company has following share based payment arrangements for employees
ESOS 2016This Scheme shall be called ‘Enzene Employee Stock Option Scheme 2016’ (“ESOS 2016”/“Scheme”).
ESOS 2016 is established with effect from 15th January, 2016 on which the Shareholders have approved the Scheme by way of a special resolution and shall continue to be in force until (i) its termination by the Board, or (ii) the date on which all of the Employee Stock Options available for issuance under the ESOS 2016 have been issued and exercised, whichever is earlier. The plan entitles key management personnel and senior employees to purchase shares in the Company at the stipulated exercise price, subject to compliance with vesting conditions; all exercised options shall be settled by physical delivery of shares.
The terms and conditions related to the grant of the shares options are as follows:
Date of Grant 3-Mar-16
Exercise price per Option ` 125.80
Number of Options granted 145600
Exercise period 2 years from the date of respective vesting
Vesting Period 1 to 5 years from the date of grant as stated below
Vesting Schedule As mentioned below
Vesting Schedule:
Date of Vesting Vesting period after the date of grant (years) Vesting Vesting based on time
3-Mar-17 1 year from the date of grant 5% 5%
3-Mar-18 2 years from the date of grant 15% 15%
3-Mar-19 3 years from the date of grant 20% 20%
3-Mar-20 4 years from the date of grant 30% 30%
3-Mar-21 5 years from the date of grant 30% 30%
Total 100% 100%
Share based payment expenses
(` in million)
Name of Scheme
ESOS 2016 0.2
Total Expenses recognised in "Employee benefit" 0.2
Reconcilition of outstanding share options
Particulars No.of Options
As at 31 March 2016
As at 31 March 2015
Outstanding at 1 April - -
Granted during the year 145,600 -
Forfeited during the year - -
Excercised during the year - -
Expired during the year - -
Outstanding at 31 March 145,600 -

CO
RP
OR
AT
E O
VE
RV
IEW
FIN
AN
CIA
L STAT
EM
EN
TS
STAT
UTO
RY
RE
PO
RT
S
ANNUAL REPORT 2015-16 195
Notesto the Consolidated Financial Statements
Consolidated Financial Statements
The estimated grant-date fair value of Stock options granted under ESOS 2016 plan is ` 69.4
The fair values are measured based on the Black-Scholes-Merton formula. Expected volatility, an input in this formula, is estimated
by considering historical average of share price volatility of peer companies. The Inputs used in the measurement of grant-date fair
values are as follows:
Fair value as on Grant Date of Equity Shares 148
Compounded Risk-Free Interest Rate 7.70%
Expected volatility 31.93%
NOTE-2.49 During the year ended 31 March 2016, considering future growth requirement of domestic business, the Company has commenced construction of new units at Sikkim which will be entitled for fiscal incentives including benefit under income tax. Further, Finance Act 2016 has partially extended income tax benefit on Research and Development expenditure up to fiscal year 2019-20. These factors may result into lower utilisation of accumulated MAT credit entitlement. Consequently, MAT credit entitlement of ` 834.1 million has been written off during the year, which is shown under “MAT entitlement credit of earlier years written off” in Tax Expenses.
NOTE-2.50 Previous year’s figures have been regrouped wherever necessary to conform to this year’s classification.
As per our report of even date attached, For and on behalf of the Board of Directors of Alkem Laboratories Limited CIN: U00305MH1973PLC174201
For B S R & Co. LLP Samprada Singh B.N. Singh D.K.SinghChartered Accountants Chairman Emeritus Executive Chairman Joint Managing DirectorFirm’s Registration No. 101248W/W-100022 DIN No.00760279 DIN No.00760310 DIN No.00739153
Sandeep Singh B.P. Singh M.K. SinghSadashiv Shetty Joint Managing Director Director DirectorPartner DIN No.01277984 DIN No.00739856 DIN No.00881412
Membership No. 048648 Prabhat Agrawal Rajesh Dubey Manish NarangChief Executive Officer Chief Financial Officer Sr.VP - Legal & Company Secretary
Mumbai P.V.Damodaran Mumbai
Date : 27 May, 2016 VP - Business Finance Date : 27 May, 2016

ALKEM LABORATORIES LTD.196
NoticeProxy Form

ANNUAL REPORT 2015-16 197
CO
RP
OR
AT
E O
VE
RV
IEW
FIN
AN
CIA
L STAT
EM
EN
TS
STAT
UTO
RY
RE
PO
RT
S
Notice
NoticeNOTICE is hereby given that the Forty Second Annual General Meeting of the Members of Alkem Laboratories Limited will be held on Friday, 2nd September, 2016, at 10.30 a.m. at Nehru Centre Auditorium, Dr. Annie Besant Road, Worli, Mumbai – 400018 to transact the following businesses:
ORDINARY BUSINESS1. To receive, consider and adopt (a) the Audited Standalone Financial Statements
of the Company for the Financial Year ended 31st March, 2016 and the Reports of the Board of Directors and Auditors thereon.
(b) the Audited Consolidated Financial Statements of the Company for the Financial Year ended 31st March, 2016 and the Reports of the Board of Directors and Auditors thereon.
2. Toconfirmandapprovethepaymentofthefirstinterimdividend of 3/- per Equity share and the second interim dividend of 9.7/- per Equity Share of face Value of 2/- eachpaidduringthefinancialyearended31stMarch,2016.
3. To appoint a Director in place of Mr. Dhananjay Kumar Singh (DIN: 00739153), who retires by rotation and being eligible, offers himself for re-appointment.
4. To ratify the appointment of M/s. B S R & Co. LLP, Chartered Accountants, Mumbai (Firm Registration No. 101248W/ W-100022) pursuant to the resolution passed by the Members at the Fortieth Annual General Meeting held on 18th August, 2014, as Statutory Auditors of the Company, to hold office from theconclusion of this Annual General Meeting, till the conclusion of the Forty Third Annual General Meeting, on such remuneration, as may be agreed upon between the Auditors and the Board of Directors.
SPECIAL BUSINESS5. Toconsiderand,ifthoughtfit,topass,withorwithout
modifications, the following resolutionasanOrdinaryResolution:
“RESOLVED THAT pursuant to Section 148 (3) and other applicable provisions, if any, of the Companies Act, 2013 read with Companies (Audit and Auditors) Rules, 2014 and Companies (Cost Records and Audit)
Rules, 2014 (including any statutory modification(s)or enactments thereof, for the time being in force), the remuneration amounting to ` 7,00,000/- (Rupees Seven Lakhs only) plus Service Tax and re-imbursement towards the out of pocket expenses at actuals upto ` 10,000 incurred in connection with the audit by Mr. Suresh D Shenoy, Cost Accountant (Membership No. 8318), who was appointed by the Board of Directors of the Company as Cost Auditor to conduct audit of cost records maintained by the Company for the financialyearended31stMarch,2016,beandisherebyratified.”
6. Toconsiderand,ifthoughtfit,topass,withorwithoutmodifications, the following resolution as a SpecialResolution:
“RESOLVED THAT pursuant to the provisions of Section 94 and other applicable provisions, if any, of the Companies Act, 2013 and Rules made there under, consent of the Members of the Company be and is hereby accorded to keep, maintain and preserve Register of Members/Debenture holders/other security holders of the Company, indicated under Section 88 of theCompaniesAct, 2013, at theOfficeofCompany’sRegistrar and Share Transfer Agents, “Link Intime India Pvt.Ltd.”atC-13,PannalalSilkMillsCompound,L.B.S.Marg, Bhandup (W), Mumbai 400078 or at any other placeofofficeofthesaidRegistrarandTransferAgents.
RESOLVED FURTHER THAT the Board of Directors of the Company be and is hereby authorised to do all acts and take all such steps as may be necessary, proper or expedienttogiveeffecttothisresolution.”
7. Toconsiderand,ifthoughtfit,topass,withorwithoutmodifications, the following resolution as a Special Resolution:
“RESOLVED THAT pursuant to the provisions of Sections 196, 197, 203 read with Schedule V and other applicable provisions of the Companies Act, 2013, the remuneration of Mr. Basudeo N. Singh (DIN: 00760310), Executive Chairman of the Company be and is hereby increased to ` 63,80,000/- (Rupees Sixty Three Lacs Eighty Thousand Only) per month with effect from 1st April, 2016 upto 31st March, 2019 i.e. uptotheexpiryofhispresenttermofofficeandthathe
ALKEM LABORATORIES LIMITEDRegisteredOffice:“AlkemHouse”,SenapatiBapatMarg,LowerParel,Mumbai–400013
CIN:U00305MH1973PLC174201
Email: [email protected] Website: www.alkemlabs.com

ALKEM LABORATORIES LTD.198
eachfinancialyearasmaybedecidedbytheBoardof Directors of the Company from time-to-time.
RESOLVED FURTHER THAT any one of the Directors/Company Secretary of the Company be and is hereby authorised to take all required steps togiveeffecttothisresolution.”
Notes:
1. The relative Explanatory Statement pursuant to Section 102 of the Companies Act, 2013 relating to the Special Businesses covered under item nos. 5 to 7 to be transacted at the Annual General Meeting is annexed hereto. In respect of Resolutions at item nos. 3 and 7, a statement giving additional information on the Directors seeking re-appointment is annexed hereto as required under SEBI (Listing Obligations and Disclosure Requirements) Regulations, 2015 read with Secretarial Standard-2 on General Meetings.
2. A MEMBER ENTITLED TO ATTEND AND VOTE AT THEMEETING IS ENTITLED TO APPOINT A PROXY TO ATTEND AND VOTE INSTEAD OF HIMSELF /HERSELFANDAPROXYNEEDNOTBEAMEMBEROFTHECOMPANY.
3. PURSUANT TO SECTION 105 OF THE COMPANIESACT, 2013, A PERSON CAN ACT AS A PROXY ON BEHALFOFNOTMORETHANFIFTYMEMBERSANDHOLDING IN AGGREGATE, NOT MORE THAN TENPERCENT OF THE TOTAL SHARE CAPITAL OF THECOMPANY.MEMBERSHOLDINGMORETHANTENPERCENT OF THE TOTAL SHARE CAPITAL OF THECOMPANY MAY APPOINT A SINGLE PERSON AS PROXY,WHOSHALLNOTACTASAPROXYFORANYOTHERMEMBER.
4. The instrument of Proxy, in order to be effective, should bedepositedattheRegisteredOfficeoftheCompany,duly completed and signed, not later than 48 hours before the commencement of the meeting.
5. Corporate Members intending to send their authorized representatives to attend the Annual General Meeting, pursuant to Section 113 of the Companies Act, 2013, are requestedtosendtotheCompany,certifiedcopyoftherelevant Board Resolution together with the respective specimen signatures of those representative(s) authorized under the said resolution to attend and vote on their behalf at the meeting.
6. Members, Proxies and Authorized Representatives are requested to bring to the meeting, the Attendance Slip sent alongwith the Annual Report duly completed and signed mentioning therein details of their DP ID and Client ID / Folio number.
shallalsobeentitledforthefollowingbenefits:
(i) Medical Reimbursement: Medical reimbursement for himself and his family
subject to a ceiling of ` 3,00,000/- per year.
(ii) Leave Travel Allowance: Leave Travel Allowance for himself and his family
onceinayearwhichshallnotexceedonemonth’ssalary.
(iii) Personal Accident Insurance Premium: The company shall also reimburse the Personal
Accident Insurance Premium.
(iv) Provident Fund and Family Pension: BenefitofProvidentFundandFamilyPensionas
pertheCompany’srules.
(v) Gratuity Gratuity payable, shall not exceed half month’s
salary for each completed year of service.
(vi) Encashment of Leave not availed Unavailed leaves shall be encashed at the end of
the tenure.
(vii) Company’sCarandDriver Heshallbeentitledfortwocompanycarswithtwo
drivers.
(viii) Club Fees He shall be entitled for Entrance and Annual
membership fees of any one club.
(xi) Domestic Servant Heshallbeentitledfortwodomesticservants.
Other terms (a) Leave As per rules of the Company.
(b) Sitting fees He shall not be entitled for sitting fees for
attending the Meetings of the Board of Directors or of the Committees constituted by the Board of Directors.
Heshallbeentitledtore-imbursementofexpensesincurred in the course of legitimate business purposes of the Company.
RESOLVED FURTHER THAT in addition to the above salary and perquisites, commission upto 0.50% of the net profits of the Companycalculated in the manner provided in Section 198 of the Companies Act, 2013, shall be payable to Mr. Basudeo N. Singh, subject to such ceiling for

ANNUAL REPORT 2015-16 199
CO
RP
OR
AT
E O
VE
RV
IEW
FIN
AN
CIA
L STAT
EM
EN
TS
STAT
UTO
RY
RE
PO
RT
S
Notice
7. Members are advised to make nomination in respect of their shareholding in the Company. The Nomination FormcanbedownloadedfromtheCompany’swebsitewww.alkemlabs.com. Members holding shares in physical form should file their nomination with M/s Link Intime India Private Limited, Company’sRegistrar and Share Transfer Agents whilst those Members holding shares in dematerialized mode should filetheirnominationwiththeirDepositoryParticipant.
8. Members are requested to contact, Company’sRegistrar and Share Transfer Agents for encashing the unclaimed dividends standing to the credit of their account.
9. Members are requested to update their bank mandate / NECS / Direct credit details / name / address / power of attorney and update their Core Banking Solutions enabled account number:
• For shares held in physical form: with the Registrar and Transfer Agents of the Company.
• For shares held in dematerialized form: with the Depository Participant with whom they maintain their demat account.
10. Non Resident Indian members are requested to immediately inform their Depository Participants (in case of shares held in dematerialized form) or the Registrars and Transfer Agents of the Company (in case of shares held in physical form), as the case may be, about:
• the change in the residential status on return to India for permanent settlement;
• the particulars of the NRE account with a bank in India, if not furnished earlier.
11. The Securities and Exchange Board of India (SEBI) has mandated the submission of the Permanent Account Number (PAN) by every participant in the securities market. Members holding shares in electronic form are, therefore, requested to submit their PAN to their Depository Participant(s). Members holding shares in physical form shall submit their PAN details to, Company’s Registrar and Share Transfer Agents. TheCompany also requests you to update your email address with your Depository Participant to enable us to send you the annual reports and other communications via email.
12. Pursuant to Section 101 and Section 136 of the Companies Act, 2013 read with relevant Rules made thereunder, Companies can send Annual Reports and other communications through electronic mode to those Members who have registered their email address either with the Company or with the Depository Participant(s). Members who have not registered their email address with the Company are
requested to submit their request with their valid email address to, Company’s Registrar and Share TransferAgent or with the Depository Participant. Members holding shares in demat form are requested to register their email address with their Depository Participant(s) only. Members of the Company who have registered their email address are also entitled to receive such communication in physical form, upon request.
13. Members desiring any information relating to the Annual Report of the Company, can write to the Company Secretary at the Registered Office addressor by sending an email to [email protected], atleast seven days before the date of the Annual General Meeting.
14. A Route Map showing directions to the venue of the 42nd Annual General Meeting and nearby prominent landmark is given at the end of this Notice.
15. The Register of Directors and Key Managerial Personnel and their Shareholding maintained under Section 170 of the Companies Act, 2013, the Register of contracts or arrangements in which Directors are interested under Section 189 of Companies Act, 2013 will be kept open for inspection at the Annual General Meeting. All the documents referred to in this Notice as well as in the Annual Report, will be available at the Company’sRegisteredOfficeinMumbaiforinspectionduring normal business hours on working days up to the date of the Annual General Meeting.
16. Pursuant to Section 108 of the Companies Act, 2013 read with Rule 20 of the Companies (Management and Administration) Rules, 2014, as amended and Regulation 44 of the SEBI (Listing Obligations & Disclosure Requirements) Regulations, 2015, the Company is providing facility for voting by electronic means, to all Members as of the cut-off date as per the applicable regulations and all the businesses contained in this Notice may be transacted through such voting. The e-voting facility is being provided through Central Depository Services Limited (CDSL). The instructions for Members for voting by electronic means are given below.
A. The instructions for shareholders voting electronically are as under:
(i) The voting period begins on 30th August, 2016 at 9.00 A.M. and ends on 1st September, 2016 at 5.00P.M.Duringthisperiod,shareholders’oftheCompany, holding shares either in physical form or in dematerialized form, as on the cut-off date 26th August, 2016 may cast their vote electronically. The e-voting module shall be disabled by CDSL for voting thereafter. A person who is not a Member as on the cut off date should treat this Notice for information purpose only.

ALKEM LABORATORIES LTD.200
(ii) The shareholders should log on to the e-voting website www.evotingindia.com.
(iii) Click on Shareholders. (iv) Now Enter your User ID a. ForCDSL:16digitsbeneficiaryID, b. For NSDL: 8 Character DP ID followed by 8
Digits Client ID, c. Members holding shares in Physical Form
should enter Folio Number registered with the Company.
(v) NextentertheImageVerificationasdisplayedandClick on Login.
(vi) If you are holding shares in demat form and had logged on to www.evotingindia.com and voted on an earlier voting of any company, then your existing password is to be used.
(vii) Ifyouareafirst timeuser followthestepsgivenbelow:
For Members holding shares in Demat Form and Physical Form
PAN Enter your 10 digit alpha-numeric PAN issued
by Income Tax Department (Applicable for
both demat shareholders as well as physical
shareholders)
Members who have not updated their PAN
with the Company/Depository Participant
are requested touse thefirst two lettersof
their name and the 8 digits of the sequence
numberinthePANfield.
• In case the sequence number is less
than 8 digits enter the applicable
numberof0’sbeforethenumberafter
the first two characters of the name
in CAPITAL letters. Eg. If your name is
Ramesh Kumar with sequence number
1 then enter RA00000001 in the PAN
field.
Dividend
Bank
Details
OR Date
of Birth
(DOB)
Enter the Dividend Bank Details or Date of
Birth (in dd/mm/yyyy format) as recorded
in your demat account or in the Company
records in order to login.
• If both the details are not recorded
with the depository or company please
enter the Member ID / Folio Number
in the Dividend Bank details field as
mentioned in instruction (iv).
(viii) After entering these details appropriately, click on “SUBMIT”tab.
(ix) Members holding shares in physical form will then directly reach the Company selection screen. However,Membersholdingsharesindematform
willnowreach‘PasswordCreation’menuwhereinthey are required to mandatorily enter their loginpassword in thenewpasswordfield.Kindlynote that this password is to be also used by the demat holders for voting for resolutions of any other company on which they are eligible to vote, provided that company opts for e-voting through CDSL platform. It is strongly recommended not to share your password with any other person and take utmost care to keep your password confidential.
(x) For Members holding shares in physical form, the details can be used only for e-voting on the resolutions contained in this Notice.
(xi) Click on the EVSN “160727012” for Alkem Laboratories Limited on which you choose to vote.
(xii) On the voting page, you will see “RESOLUTION DESCRIPTION” and against the same the option“YES/NO”forvoting.SelecttheoptionYESorNOas desired. The option YES implies that you assent to the Resolution and option NO implies that you dissent to the Resolution.
(xiii) Click on the “RESOLUTIONS FILE LINK” if youwish to view the entire Resolution details.
(xiv) After selecting the resolution you have decided tovoteon,clickon“SUBMIT”.Aconfirmationboxwillbedisplayed.Ifyouwishtoconfirmyourvote,click on “OK”, else to change your vote, click on“CANCEL”andaccordinglymodifyyourvote.
(xv) Onceyou“CONFIRM”yourvoteontheresolution,you will not be allowed to modify your vote.
(xvi) You can also take a print of the votes cast by clicking on“Clickheretoprint”optionontheVotingpage.
(xvii) If a demat account holder has forgotten the login password then Enter the User ID and the image verificationcodeandclickonForgotPassword&enter the details as prompted by the system.
(xviii)ShareholderscanalsocasttheirvoteusingCDSL’smobile app m-Voting available for android based mobiles. The m-Voting app can be downloaded from Google Play Store. Apple and Windows phone users can download the app from the App Store and the Windows Phone Store respectively. Please follow the instructions as prompted by the mobile app while voting on your mobile.
(xix) Note for Non–Individual Shareholders and Custodians

ANNUAL REPORT 2015-16 201
CO
RP
OR
AT
E O
VE
RV
IEW
FIN
AN
CIA
L STAT
EM
EN
TS
STAT
UTO
RY
RE
PO
RT
S
Notice
• Non-Individual shareholders (i.e. other than Individuals, HUF, NRI etc.) and Custodian arerequired to log on to www.evotingindia.com and register themselves as Corporates.
• A scanned copy of the Registration Form bearing the stamp and sign of the entity should be emailed to [email protected].
• After receiving the login details a Compliance User should be created using the admin login and password. The Compliance User would be able to link the account(s) for which they wish to vote on.
• The list of accounts linked in the login should be mailed to [email protected] and on approval of the accounts they would be able to cast their vote.
• A scanned copy of the Board Resolution and Power of Attorney which they have issued in favour of the Custodian, if any, should be uploaded in PDF format in the system for the scrutinizer to verify the same.
• In case you have any queries or issues regarding e-voting, you may refer the Frequently Asked Questions and e-voting manual available at www.evotingindia.com, under help section or write an email to [email protected]. Any person having any grievances in connection with remote e-voting may write to:
Name: Mr. Mehboob Lakhani Designation: Assistant Manager Address: 16th Floor, Phiroze Jeejeebhoy Towers,
Dalal Street, Fort, Mumbai – 400001. Email id: [email protected]
Phone number: 18002005533
B. The e-voting rights of the Members shall be in proportion to their shares in the paid-up equity share capital of the Company as on the cut-off date i.e. 26th August, 2016.
C. A copy of this notice has been placed on the website of the Company and the website of CDSL.
D. The Company has appointed Mr. S. Anantha Rama Subramanian, Practising Company Secretary, Proprietor of M/s S. Anantha & Co., Company Secretaries, Mumbai (Membership Number: 4443, CoP Number: 1925) to act as the Scrutinizer, to scrutinize the entire e-voting / ballot voting process in a fair and transparent manner.
E. The facility for voting through Ballot shall also be made available at the meeting to those Members who have not already cast their vote through remote e-voting.
F. The Members who have casted their votes through remote e-voting prior to the meeting may also attend the meeting but shall not be entitled to cast their vote again.
G. The Scrutinizer shall submit his report to the Chairman of the meeting. The Results declared along with the report of Scrutinizer shall be placed on the website of the Company www.alkemlabs.com and on website of CDSL immediately after declaration of results by the Chairman or person authorized by him in this behalf.
H. Subject to receipt of requisite number of votes, theResolutions shall be deemed to be passed on the date of Annual General Meeting.
Registered Office: By Order of the Board
“ALKEMHOUSE”,
Senapati Bapat Marg, Samprada Singh
Lower Parel, Chairman Emeritus
Mumbai – 400013 DIN: 00760279
MumbaiDate: 27th May, 2016

ALKEM LABORATORIES LTD.202
Item No. 5The Board of Directors at its Meeting held on 28th September, 2015, on recommendation of the Audit Committee, approved the appointment of Mr. Suresh D Shenoy, Cost Accountant (Membership No. 8318) as the Cost Auditor of the Company to conduct audit of cost records maintained by theCompanyforthefinancialyearended31stMarch,2016at a remuneration of ` 7,00,000/- (Rupees Seven Lakhs only) plus Service Tax and re-imbursement at actuals subject to a limit of ` 10,000/- (Ten Thousand only) towards out of pocket expenses incurred for the purpose of the above audit.
In accordance with Section 148 and other applicable provisions, if any, of the Companies Act, 2013 read with Companies (Audit and Auditors) Rules, 2014 and Companies (Cost Records and Audit) Rules, 2014 (including any statutory modification(s) orenactments thereof, for the time being in force), the remuneration payabletoCostAuditorisrequiredtoberatifiedbytheMembersof the Company. Accordingly, your consent is sought to the ResolutionassetoutatItemNo.5forratificationofremunerationpayabletoCostAuditorforfinancialyear2015-2016.
The Board of Directors recommends the Ordinary Resolution set out at Item No. 5 of the Notice for your approval.
None of the Directors / Key Managerial Personnel of the Company / their relatives is, in any way, concerned or interested,financiallyorotherwise,inaforesaidResolution.
Item No. 6Pursuant to the provisions of Section 94 of the Companies Act, 2013 and Rules made thereunder, the Register of Members/Debenture holders/other security holders and Index of Members required to be kept and maintained by theCompanyatitsregisteredoffice.Thesaidsectionfurtherprovides that such registers may also be kept at any other place in India in which more than one-tenth of the total number of members entered in the register of members reside, if approved by a Special Resolution passed at a general meeting of the Company and the Registrar has been given a copy of the proposed Special Resolution in advance.
The Company had come up with the IPO through offer for sale and its Equity Shares got listed on the Stock Exchanges on 23rd December, 2015. Considering the substantial increase in the number of shareholders of the Company, it is proposed to maintain and preserve the Register of Members and Index of Members at the office of Registrar and Share TransferAgents appointed by the Company, situated in Mumbai. Accordingly, your consent is sought to the Resolution as set out at Item No. 6 for maintaining the Register of Members andIndexofMembersattheofficeofCompany’sRegistrarand Share Transfer Agents i.e Link Intime India Pvt. Ltd at C-13, Pannalal Silk Mills Compound, L.B.S. Marg, Bhandup (W),Mumbai400078oratanyotherplaceofofficeof thesaid Registrar and Transfer Agents in Mumbai.
The Board recommends the Special Resolution set out at Item No. 6 of the Notice for approval by the Members.
None of the Directors / Key Managerial Personnel of the Company / their relatives is, in any way, concerned or interested, financially or otherwise, in the aforesaidresolution.
Item No. 7The appointment of Mr. Basudeo N. Singh (DIN: 00760310) as Managing Director of the Company was approved by the Members of theCompany for a period of five yearsw.e.f. 1stApril, 2014 in the Fortieth Annual General Meeting held on 18th August, 2014. Thereafter, at the Extra-ordinary General Meeting held on 16th March, 2015, Mr. Basudeo N. Singh was re-designated as Executive Chairman of the Company. The Nomination and Remuneration Committee at its meeting held on 26th May, 2016 and Board of Directors at its meeting held on 27th May, 2016 have approved increase in remuneration of Mr. Basudeo N. Singh as mentioned in the resolution under item no. 7.
Mr. Basudeo N. Singh is the co-founder of the Company and has served on the Board of the Company since its incorporation. He has over 40 years of experience in theIndian Pharmaceutical Industry. As an Executive Chairman of the Company, he drives the growth of the Company and its strategic operations. With the accelerated growth in the operations of the Company, his responsibilities have increased manifold. Keeping in view the outstanding contribution made by Mr. Basudeo N. Singh in the progress of the Company and his involvement in the day-to-day operations of the Company as an Executive Chairman of the Company, it is proposed to increase his remuneration, as detailed in the Resolution under item no. 7.
Accordingly, pursuant to Section 196, 197 and other applicable provisions, if any, of the Companies Act, 2013 read with Rules and Schedule V to the said Act, your approval is sought for passing the Special Resolution as set out in item number 7 of the Notice.
Mr. Basudeo N. Singh and Mr. Mritunjay Kumar Singh, Executive Director & Mr. Dhananjay Kumar Singh, Joint Managing Director, being sons of Mr. Basudeo N. Singh are deemed to be interested in the resolution. None of the other Directors / Key Managerial Personnel of the Company / their relativesis,inanyway,concernedorinterested,financiallyorotherwise, in the aforesaid resolution.
Registered Office: By Order of the Board
“ALKEMHOUSE”,
Senapati Bapat Marg, Samprada Singh
Lower Parel, Chairman Emeritus
Mumbai – 400013 DIN: 00760279
MumbaiDate: 27th May, 2016
EXPLANATORY STATEMENT PURSUANT TO SECTION 102 OF THE COMPANIES ACT, 2013:

ANNUAL REPORT 2015-16 203
CO
RP
OR
AT
E O
VE
RV
IEW
FIN
AN
CIA
L STAT
EM
EN
TS
STAT
UTO
RY
RE
PO
RT
S
Notice
ANNEXURE TO ITEMS 3 AND 7 OF THE NOTICEProfile of Directors seeking re-appointment at the forthcoming Annual General Meeting(in pursuance of Regulation 36 of the SEBI (Listing Obligations & Disclosure Requirements) Regulations, 2015 read with Secretarial Standard – 2 on General Meetings)
Name of Director Mr. Dhananjay Kumar Singh Mr. Basudeo N. Singh
DIN 00739153 00760310
Date of Birth 29.07.1962 20.11.1940
Age 53 years 75 years
Qualifications BachelorinCommerce BachelorofArtsandMaster’sDegreein
Political Science
Experience Over 30 years Over 40 years
Expertiseinspecificfunctionalareas Marketing (Domestic), Purchase, HRD,
Audit, Administration, Legal, CSR and
branding functions
Pharmaceutical
Date of Appointment on the Board 25.10.1988 08.08.1973
Terms and conditions of appointment On such terms and conditions as
mentioned in the resolution passed in the
Extra Ordinary General Meeting held on
16th March, 2015
AsspecifiedintheproposedResolution
under item No. 8 to this Notice
Remuneration last drawn ` 3,49,56,443/- p.a. received during
FY 2015-2016
` 8,68,87,049/- p.a. received during
FY 2015-2016
Remuneration proposed to be given N.A. As detailed under Resolution No. 7
Number of shares held in the Company
as on 31st March, 2016
5,766,260 Equity Shares of ` 2/- each 84,05,950 Equity Shares of ` 2/- each
List of Directorships held in other
companies (excluding foreign, private and
Section 8 companies)
NIL 1
Chairmanship/Membership of Committees
Audit and Stakeholders’ Relationship
Committees across Public Companies
including Alkem Laboratories Limited
1–MemberofStakeholders’Relationship
Committee of Alkem Laboratories Limited
NIL
Relationship
betweenDirectors interse
Son of Mr. Basudeo N. Singh, Executive
Chairman and Brother of Mr. Mritunjay
Kumar Singh, Executive Director
Father of Mr. Dhananjay Kumar
Singh, Joint Managing Director and
Mr. Mritunjay Kumar Singh, Executive
Director
Number of Board Meetings attended
during the year 2015-2016 (Out of total 5
Board Meetings held)
5 5

ROUTE MAP
Location Map of Nehru Centre

FORM NO. MGT-11
PROXY FORM[Pursuant to Section 105(6) of the Companies Act, 2013 and Rule 19(3) of the Companies
(Management and Administration) Rules, 2014]
Name of the member (s):
Registered address:
E-mail Id:
Folio No/ Client Id:
DP ID:
I/We, being the member (s) of shares of the above named Company, hereby appoint
1. Name:
Address:
E-mail Id:
Signature: ,or failing him/her
2. Name:
Address:
E-mail Id:
Signature: ,or failing him/her
3. Name:
Address:
E-mail Id:
Signature:
as my/our proxy to attend and vote (on a poll) for me/us and on my/our behalf at the 42nd Annual general meeting of the company, to be held on Friday, the 2nd day of September, 2016 at 10.30 a.m. at Nehru Centre Auditorium, Dr. Annie Besant Road, Worli, Mumbai – 400018 and at any adjournment thereof in respect of such resolutions as are indicated below:
Resolution
Number Resolution
Vote (Optional see Note 2)
For Against
ORDINARY BUSINESS1 Receive, consider and adopt:
a) the Audited Standalone Financial Statements of the Company for
the Financial Year ended 31st March, 2016 and the Reports of the
Board of Directors and Auditors thereon;
b) the Audited Consolidated Financial Statements of the Company for
the Financial Year ended 31st March, 2016 and the Reports of the
Board of Directors and Auditors thereon.
ALKEM LABORATORIES LIMITEDRegisteredOffice:“AlkemHouse”,SenapatiBapatMarg,LowerParel,Mumbai–400013
CIN:U00305MH1973PLC174201
Email: [email protected] Website: www.alkemlabs.com
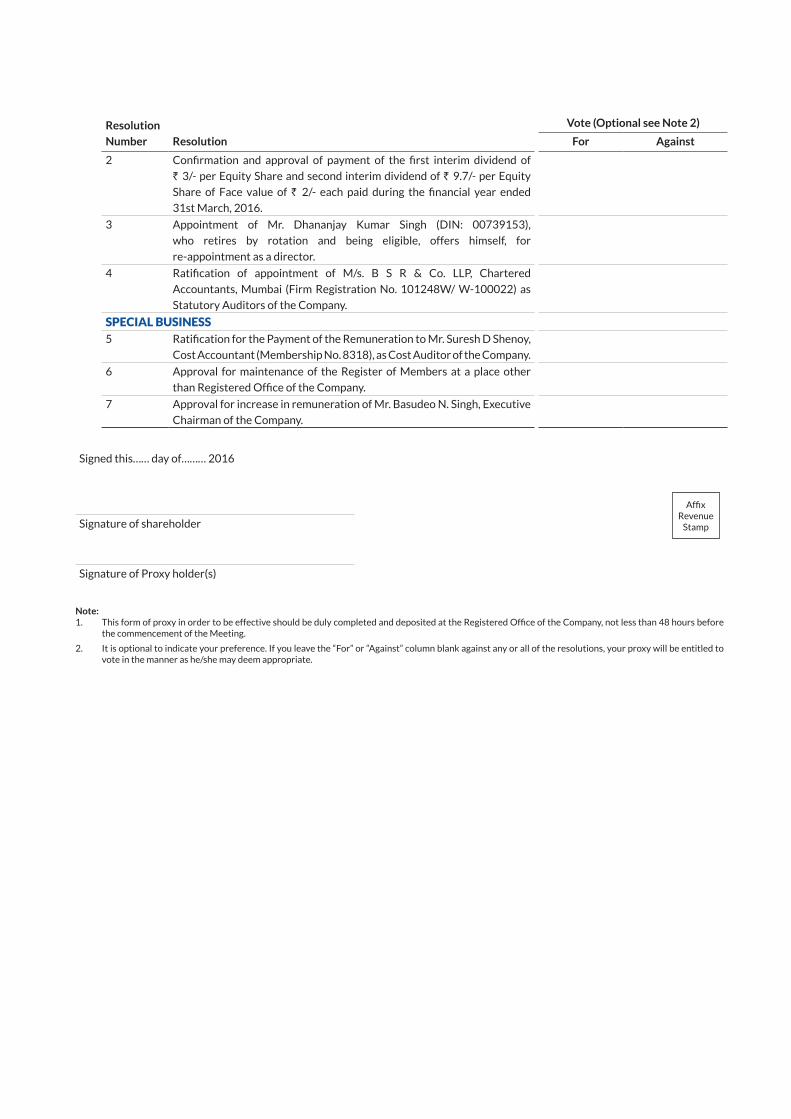
Resolution
Number Resolution
Vote (Optional see Note 2)
For Against
2 Confirmation and approval of payment of the first interim dividend of
` 3/- per Equity Share and second interim dividend of ` 9.7/- per Equity
Share of Face value of ` 2/- each paid during the financial year ended
31st March, 2016.
3 Appointment of Mr. Dhananjay Kumar Singh (DIN: 00739153),
who retires by rotation and being eligible, offers himself, for
re-appointment as a director.
4 Ratification of appointment of M/s. B S R & Co. LLP, Chartered
Accountants, Mumbai (Firm Registration No. 101248W/ W-100022) as
Statutory Auditors of the Company.
SPECIAL BUSINESS5 RatificationforthePaymentoftheRemunerationtoMr.SureshDShenoy,
Cost Accountant (Membership No. 8318), as Cost Auditor of the Company.
6 Approval for maintenance of the Register of Members at a place other
thanRegisteredOfficeoftheCompany.
7 Approval for increase in remuneration of Mr. Basudeo N. Singh, Executive
Chairman of the Company.
Signed this…… day of……… 2016
Affix Revenue
StampSignature of shareholder
Signature of Proxy holder(s)
Note:1. ThisformofproxyinordertobeeffectiveshouldbedulycompletedanddepositedattheRegisteredOfficeoftheCompany,notlessthan48hoursbefore
the commencement of the Meeting.
2. Itisoptionaltoindicateyourpreference.Ifyouleavethe“For”or“Against”columnblankagainstanyoralloftheresolutions,yourproxywillbeentitledtovote in the manner as he/she may deem appropriate.

Notes

Notes

Corporate Information
Board of DirectorsMr. Samprada Singh
Chairman Emeritus
Mr. Basudeo N. Singh
Executive Chairman
Mr. Dhananjay Kumar Singh
Joint Managing Director
Mr. Sandeep Singh
Joint Managing Director
Mr. Balmiki Prasad Singh
Executive Director
Mr. Mritunjay Kumar Singh
Executive Director
Mr. Mangaldas Chhaganlal Shah
Independent Director
Mr. Akhouri Maheshwar Prasad
Independent Director
Mr. Ranjal Laxmana Shenoy
Independent Director
Mr. Arun Kumar Purwar
Independent Director
Ms. Sangeeta Singh
Independent Director
Ms. Sudha Ravi
Independent Director
Chief Executive OfficerMr. Prabhat Agrawal
Chief Financial OfficerMr. Rajesh Dubey
Senior Vice President – Legal, Company Secretary and Compliance OfficerMr. Manish Narang
AuditorsM/sBSR&Co.LLP
BankersCitibank N. A.
HDFCBankLimited
HousingDevelopmentFinanceCorporationLimited
HSBCBankLimited
KotakMahindraBankLimited
TheSaraswatCo-opBankLimited
State Bank of India
The Bank of Nova Scotia
YESBankLimited
DBSBankLimited
Registered OfficeAlkemHouse,SenapatiBapatMarg,LowerParel,
Mumbai 400 013, Maharashtra, India
ClN:U00305MH1973PLC174201
Telephone:022-39829999
Website: www.alkemlabs.com
email: [email protected]
Registrar & Share Transfer AgentsM/sLinkIntimeIndiaPrivateLimited
Unit:AlkemLaboratoriesLimited
C- 13, Pannalal Silk Mills Compound,
LBSMarg,Bhandup(West),
Mumbai-400078
Tel:+912261715400
Fax:+912225960329
E-mail: [email protected]
Website: www.linkintime.co.in
Plants1. Kachigam, Daman, India.
2. Dabhel,Daman,India.
3. Mandva, Gujarat, India.
4. Ankleshwar, Gujarat, India.
5. Baddi, Himachal Pradesh, India.
6. Kumrek,EastSikkim,India.
7. Samardung, South Sikkim, India.
8. California,U.S.A
9. Missouri, U.S.A.
10. IndchemieHealthSpecialitiesPrivateLimited,Somnath
Daman, India.
11. IndchemieHealthSpecialitiesPrivateLimited,Amaliya,
Daman, India.
12. IndchemieHealthSpecialitiesPrivateLimited,Baddi,
Himachal Pradesh, India.
13. IndchemieHealthSpecialitiesPrivateLimited,Kumrek,East
Sikkim, India.
14. CachetPharmaceuticalsPrivateLimited,Baddi,Himachal
Pradesh, India.
Major Research Centres1. R&D Centre, MIDC, Taloja, Maharashtra, India.
2. EnzeneBiosciencesLimited,Pune,MaharashtraIndia.
3. S&B Pharma Inc., California, U.S.A.
4. S&B Pharma Inc., Missouri, U.S.A.

RegisteredOfficeAlkem House, Senapati Bapat Marg, LowerParel,Mumbai400013,Maharashtra,IndiaClN:U00305MH1973PLC174201Telephone:022-39829999Website: www.alkemlabs.com