2015...1 introductory section—with the letter of transmittal, organizational chart, and...
TRANSCRIPT

2015 Comprehensive Annual Financial ReportFor the year ended December 31, 2015
Ohio Public Employees Retirement System
Prepared by OPERS Finance Division staff

This page intentionally left blank
The Comprehensive Annual Financial Report 2015 OPERS 1
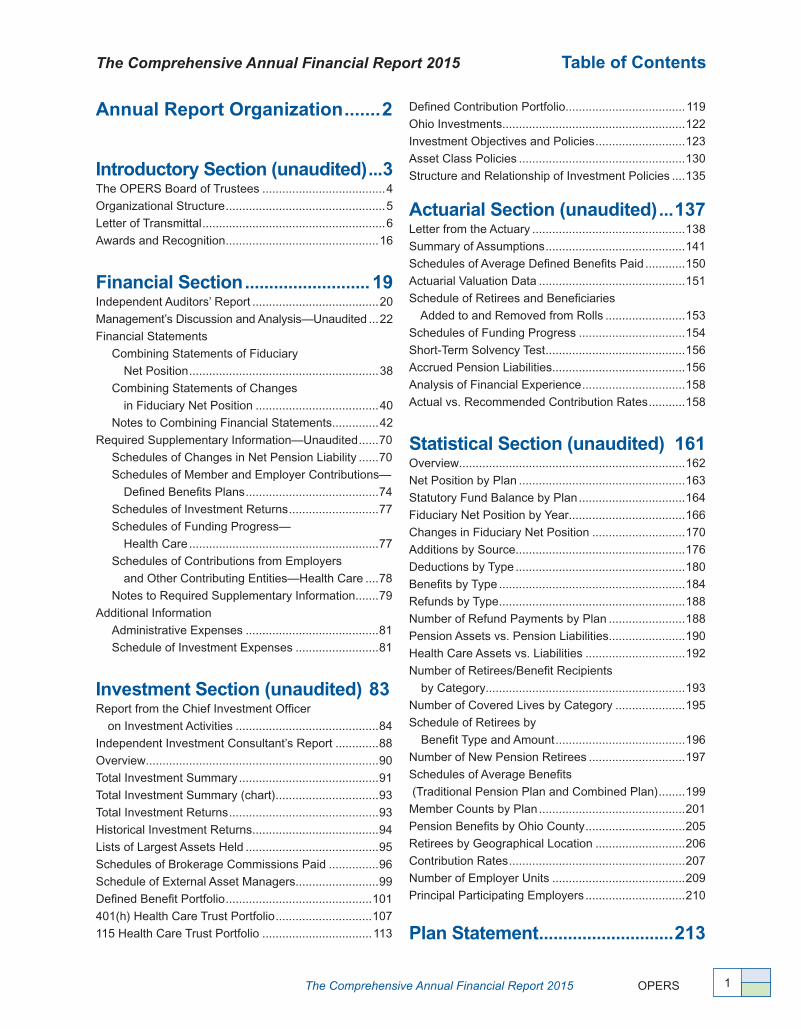
Annual Report Organization .......2
Introductory Section (unaudited) ...3The OPERS Board of Trustees �������������������������������������4
Organizational Structure ������������������������������������������������5
Letter of Transmittal �������������������������������������������������������6
Awards and Recognition ����������������������������������������������16
Financial Section .......................... 19Independent Auditors’ Report ��������������������������������������20
Management’s Discussion and Analysis—Unaudited ���22
Financial Statements
Combining Statements of Fiduciary
Net Position ���������������������������������������������������������38
Combining Statements of Changes
in Fiduciary Net Position �������������������������������������40
Notes to Combining Financial Statements ��������������42
Required Supplementary Information—Unaudited ������70
Schedules of Changes in Net Pension Liability ������70
Schedules of Member and Employer Contributions—
Defined Benefits Plans ����������������������������������������74
Schedules of Investment Returns ���������������������������77
Schedules of Funding Progress—
Health Care ���������������������������������������������������������77
Schedules of Contributions from Employers
and Other Contributing Entities—Health Care ����78
Notes to Required Supplementary Information �������79
Additional Information
Administrative Expenses ����������������������������������������81
Schedule of Investment Expenses �������������������������81
Investment Section (unaudited) 83Report from the Chief Investment Officer
on Investment Activities �������������������������������������������84
Independent Investment Consultant’s Report �������������88
Overview ����������������������������������������������������������������������90
Total Investment Summary ������������������������������������������91
Total Investment Summary (chart) �������������������������������93
Total Investment Returns ���������������������������������������������93
Historical Investment Returns ��������������������������������������94
Lists of Largest Assets Held ����������������������������������������95
Schedules of Brokerage Commissions Paid ���������������96
Schedule of External Asset Managers �������������������������99
Defined Benefit Portfolio ��������������������������������������������101
401(h) Health Care Trust Portfolio �����������������������������107
115 Health Care Trust Portfolio ���������������������������������113
Defined Contribution Portfolio ������������������������������������119
Ohio Investments �������������������������������������������������������122
Investment Objectives and Policies ���������������������������123
Asset Class Policies ��������������������������������������������������130
Structure and Relationship of Investment Policies ����135
Actuarial Section (unaudited) ...137Letter from the Actuary ����������������������������������������������138
Summary of Assumptions ������������������������������������������141
Schedules of Average Defined Benefits Paid ������������150
Actuarial Valuation Data ��������������������������������������������151
Schedule of Retirees and Beneficiaries
Added to and Removed from Rolls ������������������������153
Schedules of Funding Progress ��������������������������������154
Short-Term Solvency Test ������������������������������������������156
Accrued Pension Liabilities ����������������������������������������156
Analysis of Financial Experience �������������������������������158
Actual vs� Recommended Contribution Rates �����������158
Statistical Section (unaudited) 161Overview ��������������������������������������������������������������������162
Net Position by Plan ��������������������������������������������������163
Statutory Fund Balance by Plan ��������������������������������164
Fiduciary Net Position by Year �����������������������������������166
Changes in Fiduciary Net Position ����������������������������170
Additions by Source ���������������������������������������������������176
Deductions by Type ���������������������������������������������������180
Benefits by Type ��������������������������������������������������������184
Refunds by Type ��������������������������������������������������������188
Number of Refund Payments by Plan �����������������������188
Pension Assets vs� Pension Liabilities �����������������������190
Health Care Assets vs� Liabilities ������������������������������192
Number of Retirees/Benefit Recipients
by Category ������������������������������������������������������������193
Number of Covered Lives by Category ���������������������195
Schedule of Retirees by
Benefit Type and Amount ���������������������������������������196
Number of New Pension Retirees �����������������������������197
Schedules of Average Benefits
(Traditional Pension Plan and Combined Plan) ��������199
Member Counts by Plan ��������������������������������������������201
Pension Benefits by Ohio County ������������������������������205
Retirees by Geographical Location ���������������������������206
Contribution Rates �����������������������������������������������������207
Number of Employer Units ����������������������������������������209
Principal Participating Employers ������������������������������210
Plan Statement ............................213
The Comprehensive Annual Financial Report 2015 Table of Contents
The Comprehensive Annual Financial Report 2015
OPERS The Comprehensive Annual Financial Report 20152 OPERS The Comprehensive Annual Financial Report 2015
Employer composition and membership information
For actuarial purposes, participating employers are divided into State, Local, Law Enforcement and Public Safety divisions� A complete description of the OPERS membership is contained in the Plan Statement Section of this document, beginning on page 213�
Annual report organization
This annual report is divided into six sections, listed as each appears in this document:
1 Introductory Section—with the Letter of Transmittal, organizational chart, and recognition awards garnered in 2015
2 Financial Section—with the Independent Auditors’ Report, Management’s Discussion and Analysis, the financial statements of the System, and Required Supplementary and Additional Information
3 Investment Section—with the Chief Investment Officer’s report on investment activity, Independent Investment Consultant’s Report, investment policies, investment results, and various investment schedules
4 Actuarial Section—with the Actuary’s Certification Letter and the most recent results of the annual actuarial valuation
5 Statistical Section—with significant data pertaining to the System
6 Plan Statement—with complete membership information and details about the retirement plans offered through OPERS

For 80 years, OPERS has been delivering on the promise of providing a secure retirement for our members� In that time, OPERS has successfully evolved through cold wars, world war and moon shots; great economies, the Great Depression and the most recent recession� Through every year, every economy, every challenge and every opportunity, OPERS management and the Board of Trustees worked to constantly review and test our assumptions and adjust our activities to ensure we were able to adapt to an ever-changing world� We have been relentless in our pursuit of excellence for one reason—to live up to the trust our members have placed in us�
Note: This section is unaudited in its entirety.
IntroductorySection
“ The best thing you can do is the right thing; the next best thing you can do is the wrong thing; the worst thing you can do is nothing.”
Theodore Roosevelt, president

OPERS The Comprehensive Annual Financial Report 20154
The OPERS Board of Trustees Introductory Section (unaudited)
Board of Trustees members as of January 2016
Front row (left to right): Charles Latsa, Representative for Non-teaching College/University Employees; Robert C� Smith, Treasurer-Appointed Investment Expert; James Tilling, General Assembly Appointed Investment Expert
Standing: Patrick Smith, Designee for Robert Blair, Director of the Ohio Department of Administrative Services (Statutory Member); Cinthia Sledz, Representative for Miscellaneous Employees and Board Chair; Christopher Mabe, Representative for State Employees; Sean Loftus, Representative for County Employees; John W� Maurer, Representative for Retirees; Steve Toth, Representative for Retirees; Ken Thomas, Representative for Municipal Employees
Not Shown in Photo: Governor’s Appointee–Vacant
The 11-member Board of Trustees (Board) is the governing body of the Ohio Public Employees Retirement System (referred to as OPERS, System or Fund)� The Board is ultimately responsible for the administration and management of all OPERS activities including oversight of investment activities�
The Board is comprised of seven individuals who are elected by the specific stakeholder group each represents: college/university employees, state employees, miscellaneous employees, county employees, municipal employees, and two retiree representatives� Three individuals with investment expertise are appointed by Ohio’s Governor, Treasurer, and jointly by the Ohio Legislature� The Board is completed by the Director of the Ohio Department of Administrative Services who serves on the Board by virtue of office�
The Board appoints the Executive Director, an actuary, and other advisors necessary for the transaction of business� By law, the Treasurer of the state of Ohio is custodian of the OPERS funds�
The Board meets monthly and receives no compensation, but is reimbursed for necessary expenses�

The Comprehensive Annual Financial Report 2015 OPERS 5
Front row (left to right): Richard Shafer, Chief Investment Officer; Walter Knox, Chief Enterprise Risk Officer; Carol Nolan Drake, Chief External Affairs Officer; Michael Sponhour, Director—Marketing and Communications; Shelley Wilson, Director—Human Resources
Standing: Allen Foster, Director—Benefits; Marianne Steger, Director—Health Care; Karen Carraher, Executive Director; Chuck Quinlan, Director—Information Technology; Jennifer Starr, Director—Finance; Greg Januszewski, Director—Internal Audit; Blake Sherry, Chief Operating Officer; Julie Becker, General Counsel
Introductory Section Organizational Structure
Leadership Team
AuditorsCliftonLarsonAllen LLP Toledo, Ohio (under contract with the Auditor of State)
AdvisorsActuary—Gabriel, Roeder, Smith & CompanySouthfield, Michigan
Investment Policy Advisors to the Board of Trustees—
AON Hewitt Investment Consulting, Inc.Chicago, Illinois
NEPCCambridge, Massachusetts
See pages 96-99 for a list of investment fees and external asset managers�
T h e O P E R S B o a r d o f Tr u s t e e s
Karen E. CarraherExecutive Director
Greg JanuszewskiDirector—Internal Audit
Carol Nolan DrakeChief External Affairs Officer
Walter KnoxChief Enterprise Risk Officer
Allen FosterDirector—Benefits
Chuck QuinlanDirector—Information Technology
Marianne StegerDirector—Health Care
Shelley WilsonDirector—Human Resources
Richard ShaferChief Investment Officer
Blake W. SherryChief Operating Officer
Jennifer StarrDirector—Finance
Michael SponhourDirector—Marketing and Communications
Julie BeckerGeneral Counsel

OPERS The Comprehensive Annual Financial Report 20156
May 25, 2016
Dear Chair and Members of the Board of Trustees:
It’s a pleasure to present to you the 2015 Comprehensive Annual Financial Report (CAFR or annual report) of the Ohio Public Employees Retirement System (OPERS, System or Fund) for the fiscal year ended December 31, 2015� Our theme, An 80-year Tradition of Balancing Change to Ensure Stability, clearly validates our strong tradition and captures the essence of our activities through our 80 years and especially over the last decade of delivering on our promise of providing our members with financial security in retirement, while addressing the ongoing changes to ensure the longevity of this System� History demonstrates that those organizations that do not have the ability to anticipate and adapt to changes in their environment and marketplace simply do not survive� By adapting to the changes in our environment, OPERS has and will continue to maintain our balance to not just survive, but to flourish� OPERS has maintained its balance and evolved through eight decades of service to our members�
Our members have seen significant changes in both pension and health care; we understand that change can be unsettling� However, it is our responsibility to anticipate and communicate change so that our members are able to understand that only through change can we, as an organization, ensure their financial stability� We must constantly look ahead at the evolving world and adapt accordingly� Our changes over the last decade have focused on providing a balance between pension and health care� Pension, of course, is a guaranteed benefit and health care is not� We understand health care is an important component of a secure retirement; thus, we have taken action to strengthen the funds so that we can provide health care for members and retirees, current and future�
OPERS continues to be a strong System, as we report on our 80th year of business� As responsible stewards of this System, our 2015 activities reflect the results of our efforts to balance the changes deemed necessary to ensure the longevity of this System� Changes are carefully vetted by staff, management, OPERS Board of Trustees (Board) members, stakeholders and many others� As a team, led by our Board, we evaluate risks as to how change will affect stakeholders and then propose structured solutions and alternatives� Only when change is deemed necessary and with a solid analysis in place will this team begin implementation� Whether changes are proposed to ensure the funded status or to balance benefits among plans, we work to ensure any change is responsible, balanced and designed to have the least impact on members� In 2015, we worked to implement changes designed to strengthen OPERS for the future� Implementing the approved changes necessary to maintain the balance of providing pension benefits and health care was our main activity of 2015�
Letter of Transmittal Introductory Section
Ohio Public Employees Retirement System277 East Town Street Columbus, Ohio 43215-4642 1-800-222-7377 www.opers.org

The Comprehensive Annual Financial Report 2015 OPERS 7
Attaining this balance is especially delicate in recent years as investment markets shift and become increasingly volatile between years with good investment returns and years with low investment returns� Because investment returns provide approximately two-thirds of the pension funding, the inconsistent markets mean we must constantly evaluate the balance of funding with both pension and health care�
OPERS’ commitment to balancing change to provide long-term stability was integrated throughout all activities and initiatives in 2015� That commitment was and is a fundamental aspect of our approach to issues, initiatives, projects and activities� The Board and staff remain steadfast in our efforts of planning early to balance the impact of change with the benefits to be reaped by change—especially to those already in or nearing retirement� In this manner, we are able to balance the need for change with the effects of change�
Internally, 2015 was referred to as the year of implementation—after years of planning and outreach, the System was able to deploy significant initiatives aimed at providing stability for the System and our members�
The key activities of 2015 are summarized below:
• ImplementationoftheOPERSMedicareConnector(Connector)occurredthroughwhichMedicare-eligible retirees selected their own plan with the assistance of a licensed expert� This was the first time our Medicare-eligible retirees were able to select a plan, as their previous decisions simply involved determining whether they were enrolling in the OPERS plan� As a result, over 131,000 retirees,spouses and dependents selected a new health care plan�
• Healthcaresolutionsforre-employedretireesweredeveloped.Aswithallchangeswepropose and initiate, those affected received extensive education and outreach�
• TheSystemfocusedonthecontinuedimplementationofongoingandincrementalchangesresulting from the passage of the 2012 pension legislation� Some of these changes included the continued implementation of the defined contribution plan changes, again, with commensurate education and outreach for members and other stakeholders to ensure a full understanding�
• In2015,theGovernmentalAccountingStandardsBoard(GASB)requiredanewpensionstandard be implemented for most OPERS-reporting employers� Recognizing the impact this may have, we worked throughout 2014 and well into 2015, to educate and prepare all affected public employers so that the necessary tools and information required for implementation were available by the GASB-mandated implementation date�
• Additionally,alsoin2015,theGASBannouncedsimilarchangestohealthcare financial reporting� Communication about and education on the new health care reporting standards required by GASB was initiated in 2015, as was planning for implementation�
• SignificantmodulesweredeployedandcontinueddevelopmentmovedtheinternalOurWay Forward initiative forward� Our Way Forward is a technology and business process redesign project that will enable OPERS to continue to deliver superior customer service to the expanding retiree population without adding significantly to staff�
• Afteranextensivesearch,apermanentChiefInvestmentOfficerwasselected.
Introductory Section Letter of Transmittal
OPERS The Comprehensive Annual Financial Report 20158
Report Contents and Structure
This CAFR is designed to comply with the reporting requirements of the GASB and in accordance with Governmental Accounting Standards Best Practices� The responsibility for the accuracy of the data presented here, as well as the completeness and fairness of the presentation, rests with OPERS management�
The management of OPERS is responsible for internal accounting controls designed to provide reasonable assurance for the safeguarding of assets and the reliability of financial records� The concept of reasonable assurance recognizes the relationship between the cost of a control and the benefit likely to be derived, based on the judgment of management� We believe the established internal accounting controls are adequate to meet the purpose for which they were intended�
We also believe the financial statements presented in this report, supporting schedules and statistical tables are presented fairly in all material aspects� These assertions can be made because OPERS has established a comprehensive internal control framework designed to protect the assets from loss and to compile sufficient reliable information for the preparation of OPERS financial statements in conformity with generally accepted accounting principles� Even effective internal controls may not prevent or detect misstatements and can provide only a reasonable assurance with respect to financial statement preparation�
The System’s external auditors, CliftonLarsonAllen LLP, conducted an independent audit of the financial statements in accordance with U�S� generally accepted government auditing standards� This audit and the financial statements are described in the Financial Section, beginning on page 19�
Overview of OPERS
OPERS was established and exists solely for the purpose of providing retirement, disability and survivor benefits to Ohio’s public employees� Created by legislation in 1933, OPERS began operations January 1, 1935, prior to Social Security� Now in our 80th year, OPERS has balanced changes with stability by adapting to and prospering through both robust and turbulent economies and the shifts in member demographics to provide retirement security for our members�
In 1974, OPERS added access to health care—an important element for retirees—yet one that is neither mandated nor guaranteed� In 2003, OPERS increased the pension options offered from one to three� More information on current benefits can be found in the Plan Statement starting on page 213�
As of year-end 2015, OPERS served more than 1,060,000 members, including 205,601 retirees and beneficiaries� In addition, the System works with approximately 3,700 public employers� With an asset base of $87�3 billion, OPERS is the largest public pension system in Ohio and the 11th largest public pension system in the nation�
Investment Results
The investment market in 2015 was somewhat of an anomaly—the global market was a bear market, while the domestic market was propped up by a few individual equities� Broadly interpreted, the 2015 investment market was frustrating for investors with a wide range of asset classes and yielded low returns for all the OPERS pension and health care portfolios�
Letter of Transmittal Introductory Section
The Comprehensive Annual Financial Report 2015 OPERS 9
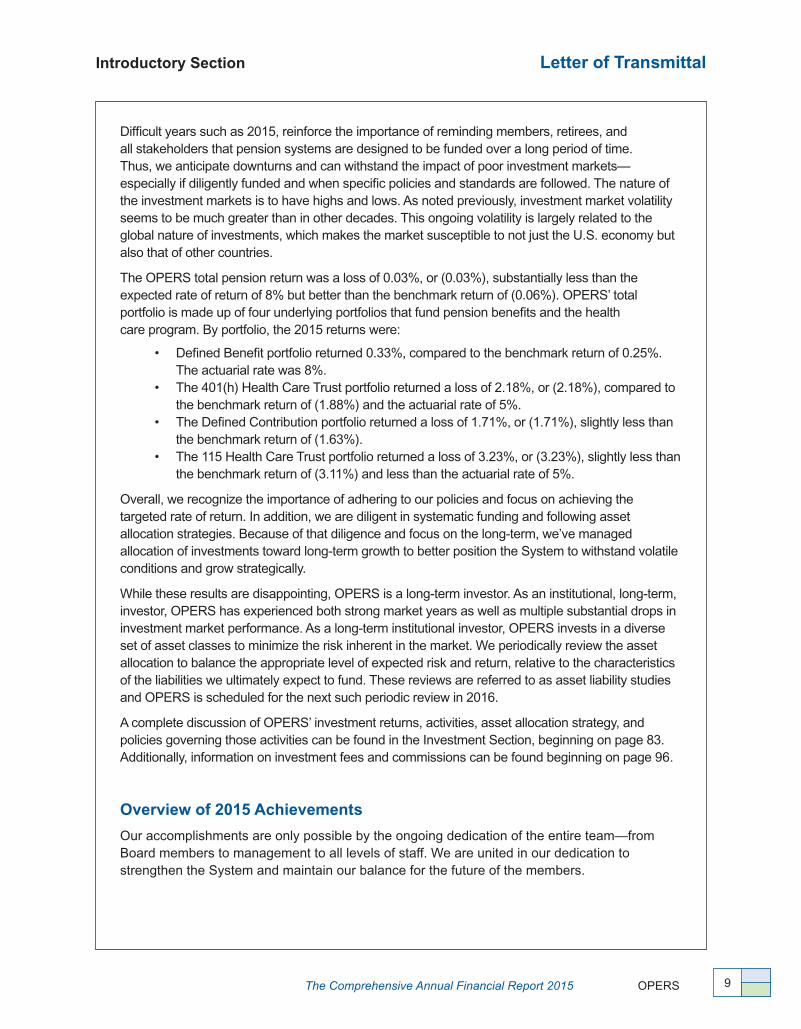
Difficult years such as 2015, reinforce the importance of reminding members, retirees, and all stakeholders that pension systems are designed to be funded over a long period of time� Thus, we anticipate downturns and can withstand the impact of poor investment markets—especially if diligently funded and when specific policies and standards are followed� The nature of the investment markets is to have highs and lows� As noted previously, investment market volatility seems to be much greater than in other decades� This ongoing volatility is largely related to the global nature of investments, which makes the market susceptible to not just the U�S� economy but also that of other countries�
The OPERS total pension return was a loss of 0�03%, or (0�03%), substantially less than the expected rate of return of 8% but better than the benchmark return of (0�06%)� OPERS’ total portfolio is made up of four underlying portfolios that fund pension benefits and the health care program� By portfolio, the 2015 returns were:
• DefinedBenefitportfolioreturned0.33%,comparedtothebenchmarkreturnof0.25%.The actuarial rate was 8%�
• The401(h)HealthCareTrustportfolioreturnedalossof2.18%,or(2.18%),comparedtothe benchmark return of (1�88%) and the actuarial rate of 5%�
• TheDefinedContributionportfolioreturnedalossof1.71%,or(1.71%),slightlylessthanthe benchmark return of (1�63%)�
• The115HealthCareTrustportfolioreturnedalossof3.23%,or(3.23%),slightlylessthanthe benchmark return of (3�11%) and less than the actuarial rate of 5%�
Overall, we recognize the importance of adhering to our policies and focus on achieving the targeted rate of return� In addition, we are diligent in systematic funding and following asset allocation strategies� Because of that diligence and focus on the long-term, we’ve managed allocation of investments toward long-term growth to better position the System to withstand volatile conditions and grow strategically�
While these results are disappointing, OPERS is a long-term investor� As an institutional, long-term, investor, OPERS has experienced both strong market years as well as multiple substantial drops in investment market performance� As a long-term institutional investor, OPERS invests in a diverse set of asset classes to minimize the risk inherent in the market� We periodically review the asset allocation to balance the appropriate level of expected risk and return, relative to the characteristics of the liabilities we ultimately expect to fund� These reviews are referred to as asset liability studies and OPERS is scheduled for the next such periodic review in 2016�
A complete discussion of OPERS’ investment returns, activities, asset allocation strategy, and policies governing those activities can be found in the Investment Section, beginning on page 83� Additionally, information on investment fees and commissions can be found beginning on page 96�
Overview of 2015 Achievements
Our accomplishments are only possible by the ongoing dedication of the entire team—from Board members to management to all levels of staff� We are united in our dedication to strengthen the System and maintain our balance for the future of the members�
Introductory Section Letter of Transmittal

OPERS The Comprehensive Annual Financial Report 201510
Here are some highlights for 2015:
Health Care Preservation Plan 3.0—Connector/Re-employed Retiree Plans
Since OPERS began offering health care in 1974, the System has worked to find a balance between pension and health care funding� This has become increasingly difficult as the number of retirees has increased, combined with the longer life expectancies of these retirees and the costs of health care continuing to increase faster than inflation�
Health care is neither mandated nor guaranteed—yet we know access to health care for our retirees is an important aspect of a secure retirement� OPERS receives no additional funding for health care but may use a portion of the employer contribution to fund health care� However, that portion can only be used after the pension funding needs are met�
To maintain our balance and continue to offer viable health care, OPERS had to make changes� The most extensive changes occurred in 2012� As always, we worked to first communicate these changes to those directly affected and then implemented the changes in a phased-in manner from 2013, and continuing through 2018� Fiscal year 2015 marked a key milestone as Medicare-eligible retirees were able to select a new, individual Medicare Advantage, or Medigap plan, and a prescription drug plan for calendar year 2016� This was the first time our Medicare-eligible retirees were able to select a plan, as previous decisions simply involved choosing to enroll in the OPERS-provided plan� Affected members were provided extensive education in anticipation of the enrollment period, as well as education on the new health reimbursement arrangement that will provide the funding for reimbursement of qualified medical expenses�
One of the more significant aspects of the implementation began in 2015 with the open enrollment process for 2016� The 2015 open enrollment activity related to the Connector, a program whereby Medicare-eligible retirees are provided an allowance that they may use to reimburse the premiums of the health care program of their choice—selected with the assistance of our vendor, a provider with expertise in giving health care plan guidance� Analysis shows the Connector will provide our 145,000 Medicare-eligible retirees with access to better and more affordable health care coverage than any group program OPERS could provide� While the Connector became effective January 1, 2016, OPERS worked throughout 2015 to ensure retirees and potential retirees completely understood the changes, the basic information of Medicare, Medigap and Medicare Advantage plans, as well as the selection process and the health reimbursement arrangement process� These efforts culminated with the actual enrollment process at the end of 2015�
Also in 2015, OPERS developed two health care plans for retirees who became re-employed in the public sector� These two plans, one for those retirees not yet eligible for Medicare and one for those who are Medicare eligible, were developed, communicated and implemented in 2015�
We are proud that OPERS has the largest health care fund in the U�S� with a balance of $11�5 billion as of December 31, 2015� However, we recognize the need to continually monitor the balances of funding for both pension and health care as we continually work to design a health care program available for both current retirees and future retirees—the health care program must balance long-term sustainability with consistent coverage between generations�
Letter of Transmittal Introductory Section

The Comprehensive Annual Financial Report 2015 OPERS 11
Phased-in Implementation of Pension Change Provisions
Efforts continued in 2015 to implement pension changes provided by the 2012 legislation� These changes provided for moderate, incremental changes to strengthen the funded status of the System by acknowledging the changing demographics of our members� This incremental approach gave members time to become knowledgeable and adjust, while still positioning OPERS to remain strong and keep our balance, even through adverse conditions� We strive to adapt our plan to recognize changes in lifestyles, such as members living longer, with ensuring adequate funding to allow our plans to remain relevant, consistent and funded through the years�
The Plan Statement, found on page 213 of this CAFR, includes more information on current benefits and requirements�
Defined Contribution Solutions
In 2014, the Board approved several changes to the defined contribution plans and the Member-Directed Retiree Medical Account (RMA)� Similar to the changes made to the defined benefit plan in 2012, these changes were designed to update the defined contribution program to reflect updates that allow the plan to fund itself� Specifically, these changes address various issues surrounding members with service credit in more than one OPERS retirement plan, modify health care vesting similar to the other health care changes, and identify a funding method for the Member-Directed Plan to complete the payback of its start-up costs and to establish an administrative fee structure for the Member-Directed Plan and Combined Plan that will ensure each retirement plan is funding its own costs�
The first phase of the implementation began in 2015 with the reduction in the number of permitted plan changes and the changes to the RMA vesting schedule becoming effective July 1, 2015� The remaining changes will begin January 2016 and include the RMA employer contribution rate allocation and interest rate changes, the replacement of the current administrative fee structure for active and inactive accounts with a monthly flat fee for all accounts, and an increase in the mitigating rate� The changes ultimately improve our ability to administer the plans and strengthen the financial structure for the future�
Governmental Accounting Standards Board (GASB)
In 2015, OPERS worked with employers to implement the new GASB standards (Statements No� 67 and No� 68)� The new standards require pension systems to allocate the net pension liability, or unfunded liability, to all contributing employers� Recognizing the impact of the new standards, OPERS partnered with all affected public employers throughout 2015 and provided the reporting information required� In addition, we worked with the Auditor of State and the appointed auditors of various employers to coordinate the audit requirements�
In 2015, GASB approved additional reporting standards—this time to change how other post-employment benefits, such as health care, will be reported� These new standards will require the System to allocate the health care unfunded liability to all contributing employers, very similar to the pension standards� OPERS has been preparing to implement these new standards and to assist all employers with the implementation in a manner similar to the pension standards�
Introductory Section Letter of Transmittal

OPERS The Comprehensive Annual Financial Report 201512
Outreach to All Stakeholders
An important aspect of our responsibility is to assist members in maintaining their balance in retirement� We do that by ensuring all retirees understand their retirement options provided by OPERS� As members and employers deposit contributions over the span of an employee’s career, we work to deliver ongoing, accurate communication about the strength of the System and the pension benefits each employee has earned� Thus, our ongoing focus on outreach is both appropriate and of incalculable importance—for us and for our members, retirees and stakeholders�
OPERS has more than one million members; each individual has the right to have ongoing, accurate, specialized outreach communications� To that end, member-specific communication is designed to help each member evaluate the impact of changes, to further understand options, and to provide avenues to seek additional information and support�
We know that only through ongoing transparent, plain-language outreach can our members be confident about their retirement decision� We work to educate our members about modifications to the pension plans as well as health care—and to present information in a manner that allows all individuals a high level of comprehension�
As previously noted, for each initiative, a strong outreach and educational component has been and will continue to be established—targeted outreach is the single most important element we have to assure each stakeholder that we will deliver on our promise of a secure retirement� We’ll continue to use traditional methods, seek to be innovative, and always deliver the personal touch to all—every initiative, every time�
Our Way Forward—Internal Systems Refined
We understand that providing outstanding customer service is an absolute priority� As prudent fiscal stewards, we always seek the most cost-effective manner to provide outstanding services to members� To attain the goal of cost-effective customer service, even as the number of members and retirees is escalating, the Our Way Forward project was designed�
The internal Our Way Forward initiative, our technology and business process redesign project, continued in 2015 with several major deployments designed to improve internal systems and provide for faster, more accurate features for members when interacting with the organization� The Our Way Forward project is targeted for completion in 2018 and the milestones attained toward that goal throughout 2015 were significant� We will continue to invest in and advance our technology to provide the best possible customer service at the lowest possible cost�
2015 Financial Highlights
Funded Status: Funded status measures the progress of accumulating the funds necessary to meet future obligations� Historically, periods of diminished funded status were made up as market conditions improved� Similarly, years of enhanced funded status are eroded when market conditions are poor� OPERS continues to maintain our balance in virtually all market conditions by constantly monitoring the marketplace and changing to adapt� We have remained in compliance with the 30-year funding window required by law for 80 years—and will continue to work toward that mandate for the next 80 years�
Letter of Transmittal Introductory Section

The Comprehensive Annual Financial Report 2015 OPERS 13
The December 31, 2015 valuation shows a funded status of 85�0%, with the unfunded liability expected to be funded within 19 years on a funding basis�
OPERS is not required by statute or GASB to pre-fund health care� However, OPERS has historically pre-funded this expense� The combined actions of our conservative approach to pre-funding and the changes to health care have yielded favorable results� As of the December 31, 2014 valuation, which is the most recent health care actuarial valuation, OPERS was 62�2% funded, with funds expected to be sufficient to fund future health care needs�
Retirement Contributions: Employee contributions, employer contributions, and income from investments provide the funds necessary to finance retirement benefits� Approximately two-thirds of OPERS revenue, from which benefits are paid, is generated from investment returns� The remaining funding comes from employee and employer contributions� The total net position at the end of 2015 was $87�3 billion�
Expenses: Expenses (which include pension benefit payments and health care coverage payments and refunds) for fiscal year 2015 were $7�8 billion� All told, in 2015, OPERS paid $5�4 billion in pension benefits and $1�8 billion in health care to more than 205,000 retired Ohioans and their beneficiaries� As such, OPERS is an important economic driver for Ohio because approximately 90% of OPERS retirees remain in Ohio�
Administrative Costs: Expenses matter; we know that� Even though all administrative costs are paid through investment returns generated, OPERS is a prudent steward of public funds and works diligently to keep administrative costs low� We work to balance administrative costs with organizational needs and results for members, and we have maintained that stable attitude throughout our 80 years of existence� Administrative costs in 2015 were $116�9 million, including investment expenses�
Complete details of all administrative expenses are included in the Financial Section, starting on page 81� In addition, the Management’s Discussion and Analysis, beginning on page 22, has a more in-depth discussion of the OPERS funded status and also provides a complete analysis of the additions and deductions to Plan Net Position�
Professional Services
Professional services are provided to OPERS by consultants appointed by the Board� Actuarial services are provided by Gabriel, Roeder, Smith & Company; Southfield, Michigan� The investment advisors to the Board for all the plans are NEPC, Cambridge, Massachusetts; and AON Hewett Investment Consulting, Inc�, Chicago, Illinois� The financial records of the System are audited by CliftonLarsonAllen LLP, Certified Public Accountants, Toledo, Ohio, under contract with the Ohio Auditor of State�
Acknowledgments
This CAFR is the result of the combined teamwork of the System’s staff under the direction of the Board� Our sincere appreciation is extended to all who assisted in and contributed toward the completion of this document�
As always, the purpose of this report is to provide complete and reliable information so that it serves as a basis for making management decisions, as a method for determining legal compliance, as a resource for establishing our responsible stewardship over the assets held in trust for the members
Introductory Section Letter of Transmittal

OPERS The Comprehensive Annual Financial Report 201514
Letter of Transmittal Introductory Section
Blake Sherry, Karen Carraher and Jennifer Starr
of this System, and as an educational document so that all stakeholders can clearly understand the work of OPERS throughout the past years, our results and the expectations for the future�
80 Years and Still Strong
Our system has developed a tradition of excellence for 80 years by delivering on our promises and providing retirement security for generations of members� Our strength, our balance, our longevity has resulted from our ability to anticipate and adapt to change—while remaining steadfast to our mission and our principles� We will continue to do so�
Overall, 2015 was a good year filled with accomplishments� As always, our results have been made possible by OPERS committed team of outstanding pension professionals� Each staff member is dedicated to ensuring the mission of OPERS is accomplished—not only for the retirees of today but for future generations as well� We are fortunate to report to an equally dedicated Board—these individuals have led us with vision and unwavering standards� We appreciate and acknowledge the efforts of all those involved�
We appreciate all those that have gone before us in the first 80 years and we look forward to all those that follow us in the next 80 years�
Respectfully submitted,
Karen E� Carraher, CPAExecutive Director
Blake W� SherryChief Operating Officer
Jennifer H� Starr, CPAChief Financial Officer
The Comprehensive Annual Financial Report 2015 OPERS 15
Fiduciary Responsibilities
The Board and executive management of OPERS are fiduciaries of the pension trust funds� Fiduciaries are charged with the responsibility of assuring that the assets of OPERS are used exclusively for the benefit of plan participants and their beneficiaries�
Request for Information
This financial report is designed to provide the Board, our membership, taxpayers, investment managers, and creditors with an overview of OPERS finances and accountability for the money received� Questions concerning any of the information provided in this report or requests for additional information should be addressed to:
Ohio Public Employees Retirement SystemDirector—Finance277 East Town StreetColumbus, Ohio 43215-4642
Introductory Section

OPERS The Comprehensive Annual Financial Report 201516
OPERS has been recognized by national financial experts and organizations for commitment to the highest possible fiscal standards� We are honored to have been recognized with the following awards:
• 2014 Certificate of Achievement—For the 32nd consecutive year, the Government Finance Officers Association of the United States and Canada (GFOA) awarded OPERS a Certificate of Achievement for Excellence in Financial Reporting for its Comprehensive Annual Financial Report for the fiscal year ended December 31, 2014� In order to be awarded a certificate of achievement, a government must publish an easily readable and efficiently organized comprehensive annual financial report that satisfies both generally accepted accounting principles and applicable legal requirements�
Awards and Recognition Introductory Section
Certificate of Achievement for Excellence in Financial Reporting
The Comprehensive Annual Financial Report 2015 OPERS 17
Introductory Section Awards and Recognition
• 2014 Award for Outstanding Achievement—For the fifth consecutive year, OPERS has received the GFOA award for Outstanding Achievement in Popular Annual Financial Reporting for the OPERS Popular Annual Financial Report for the fiscal year ended December 31, 2014� This award is a prestigious national award recognizing conformance with the highest standards of creativity, presentation, understandability, and reader appeal for preparation of governmental popular reports�
Award for Outstanding Achievement in Popular Annual Financial Reporting

Awards and Recognition Introductory Section
OPERS The Comprehensive Annual Financial Report 20151818 OPERS The Comprehensive Annual Financial Report 2015
• 2015 Public Pension Standards Award—Issued by the Public Pension Coordinating Council, this award recognizes OPERS for demonstrating a high level of plan design, funding, member communications and administrative practices� The standards serve as a benchmark by which all public defined benefit plans are managed�
2015 Public Pension Standards Award

The Comprehensive Annual Financial Report 2014 xx
We recognize that one of the biggest changes our members will face during their lives is the transition to retirement� We work to ensure each member has the OPERS financial information necessary to make just the right retirement decision for their particular situation� OPERS is dedicated to maintaining accurate service credit and contribution records for each of our more-than-one million members� Each member deserves and needs this degree of accuracy so that, when contemplating retirement, or any decision that may impact retirement during their working careers, clear and accurate retirement benefit data is available�
Note: Portions of this section are unaudited, including the Management’s Discussion and Analysis, the Required Supplementary Information and Notes to Required Supplementary Information.
FinancialSection
“ It is not the strongest of the species that survives, nor the most intelligent that survives. It is the one that is the most adaptable to change.”
Charles Darwin, author, scientist
OPERS The Comprehensive Annual Financial Report 201520
Independent Auditors’ Report Financial Section
The Comprehensive Annual Financial Report 2015 OPERS 21
Financial Section Independent Auditors’ Report

OPERS The Comprehensive Annual Financial Report 201522
Management’s Discussion and Analysis (unaudited) Financial Section
The management of the Ohio Public Employees Retirement System (OPERS or System or Fund) offers readers of the System’s financial statements this narrative overview of the financial activities of OPERS for the year ended December 31, 2015� This narrative is intended to supplement the System’s financial statements� Readers are encouraged to consider the information presented here in conjunction with the financial statements that begin on page 38�
Historically, the OPERS Comprehensive Annual Financial Report (CAFR or annual report) presented combined financial statements for two comparative years� Beginning in 2015, OPERS CAFR presents financial statements for the most recent year end only� Management elected to make the change due to the increased reporting requirements of the Governmental Accounting Standards Board (GASB)� Management’s goal was to streamline the Financial Section of the CAFR to include only the required information� Users of this CAFR can refer to the Statistical Section, beginning on page 161, for historical financial information�
Overview of the Financial Statements
The following discussion and analysis are intended to serve as an introduction to the OPERS financial statements� The basic financial statements include:
1� Combining Statements of Fiduciary Net Position2� Combining Statements of Changes in Fiduciary Net Position3� Notes to Combining Financial Statements
As mandated, this CAFR also contains the following schedules, referred to as Required Supplementary Information:
1� Schedules of Changes in Net Pension Liability—Traditional Pension Plan, Combined Plan and Member-Directed Plan
2� Schedule of Member and Employer Contributions—Traditional Pension Plan 3� Schedules of Employer Contributions—Traditional Pension Plan, Combined Plan and Member-
Directed Plan4� Schedule of Investment Returns—Defined Benefit Portfolio5� Schedule of Funding Progress—Health Care6� Schedule of Contributions from Employers and Other Contributing Entities—Health Care7� Notes to Required Supplementary Information
Expenses associated with administering the System are presented immediately following the Notes to Required Supplementary Information in the following Additional Information schedules:
1� Administrative Expenses2� Schedule of Investment Expenses
The financial statements contained in this annual report disclose financial data for each of the benefit plans and health care trusts described beginning on the next page� Please refer to the Plan Statement Section beginning on page 213 for a comprehensive description of the plan structures and benefits� These plans and trusts are established as separate legal entities in accordance with Internal Revenue Service (IRS) regulations and Ohio law and are summarized beginning on the next page�

The Comprehensive Annual Financial Report 2015 OPERS 23
Financial Section Management’s Discussion and Analysis
The Traditional Pension Plan
The Traditional Pension Plan is a defined benefit plan in which a member’s retirement benefits are calculated on a formula that considers years of service and final average salary (FAS)� The pension benefits are funded by both member and employer contributions, and investment earnings on those contributions�
The Combined Plan
The Combined Plan is a defined benefit plan with elements of a defined contribution plan� Under the Combined Plan, members earn a formula benefit similar to, but at a factor less than, the Traditional Pension Plan benefit� This defined benefit is funded by employer contributions and associated investment earnings� Additionally, member contributions are deposited into a defined contribution account in which the member self-directs the investment� Upon retirement or termination, the member may choose a defined contribution retirement distribution that is equal in amount to the member’s contributions to the plan and investment earnings (or losses) on those contributions� Members may also elect to use their defined contribution account balances to purchase a defined benefit annuity administered by OPERS�
The Member-Directed Plan
The Member-Directed Plan is a defined contribution plan in which members self-direct the investment of both member and employer contributions� The retirement distribution under this plan is equal to the sum of member and vested employer contributions, plus investment earnings (or losses) on those contributions� Employer contributions and associated investment earnings vest over a five-year period at a rate of 20% per year�
Upon retirement or termination, the member may choose a defined contribution retirement distribution, or may elect to use his/her defined contribution account balances to purchase a defined benefit annuity administered by OPERS�
401(h) Health Care Trust
The 401(h) Health Care Trust (401(h) Trust) was established under Section 401(h) of the Internal Revenue Code (IRC)� This trust is pre-funded and holds the portion of employer contributions of the Traditional Pension Plan and Combined Plan that are set aside for funding retiree health care� The health care portion of the employer contribution rate for the Traditional Pension Plan and Combined Plan is comparable, as the same coverage options are provided to participants in both plans� Details of the coverage provided to retirees and their dependents can be found in the Plan Statement beginning on page 224�
Employer contributions to this trust ceased in September 2014 upon the establishment of the 115 Health Care Trust� The funds in the 401(h) Trust will continue to be used to fund health care expenses for retirees and their dependents�
In March 2016, OPERS received two favorable rulings from the IRS allowing OPERS to consolidate all health care assets into the 115 Health Care Trust� Transition to the new health care trust structure will occur during 2016� The Combining Statements of Changes in Fiduciary Net Position for the year ended December 31, 2016 will reflect a partial year of activity in the 401(h) Health Care Trust and Voluntary Employees’ Beneficiary Association Trust (VEBA Trust) prior to the termination of these trusts and the assets and liabilities, or net position, of these trusts being consolidated into the 115 Health Care Trust�

OPERS The Comprehensive Annual Financial Report 201524
115 Health Care Trust
As OPERS prepared to change the manner of funding health care for Medicare-eligible retirees, it needed a trust that could accommodate a health reimbursement arrangement (HRA)� In 2014, OPERS established the 115 Health Care Trust (115 Trust) under Section 115 of the IRC to support an HRA plan� This trust, like the 401(h) Trust, provides reimbursement for eligible health care expenses of retirees in the Traditional Pension Plan and Combined Plan�
Effective October 1, 2015, the HRA was launched in conjunction with the OPERS Medicare Connector (Connector)� The Connector is a program whereby eligible Medicare-enrolled retirees may have an allowance deposited to an HRA to be used toward the health care program of their choice selected with the assistance of an OPERS vendor� Employer contributions to this trust began in September 2014 with the initial health care disbursements from this trust commencing with January 2016 premium reimbursements� As previously mentioned, in 2016, the 401(h) Health Care Trust and VEBA Trust will be consolidated into the 115 Health Care Trust�
Voluntary Employees’ Beneficiary Association Trust
Member-Directed Plan participants are provided with a retiree medical account (RMA)� The funding vehicle of the RMA is a VEBA Trust established under Section 501(c)(9) of the IRC� The VEBA Trust holds the portion of employer contributions of the Member-Directed Plan that are set aside for funding retiree health care�
Upon separation or retirement, the participant may use the vested funds in his/her RMA for qualified health care expenses� Vesting requirements for the RMA have changed over the life of the plan� The RMA originally required 10 years of participation to fully vest in the contributions and interest earned on the account� Effective January 1, 2009, contributions and interest vested with the participant over a five-year period� Effective July 1, 2015, new participants to the RMA are required to participate for 15 years to become fully vested� Additional information on the new vesting schedule can be found in the Plan Statement on page 226� As previously mentioned, in 2016, the 401(h) Health Care Trust and VEBA Trust will be consolidated into the 115 Health Care Trust�
Financial activity for each of the pension plans and health care trusts is reported in the basic combining financial statements described below:
Combining Statements of Fiduciary Net Position
The Combining Statements of Fiduciary Net Position is a point-in-time snapshot of fund balances at fiscal year-end for pension and health care� It reports the assets available to pay future benefits to retirees, and any liabilities that are owed as of the statement date� The resulting Net Position (Assets less Liabilities = Net Position) represents the value of assets held in trust for pension benefits and health care� (See Combining Statements of Fiduciary Net Position as of December 31, 2015 on pages 38-39 of this report�)
Combining Statements of Changes in Fiduciary Net Position
The Combining Statements of Changes in Fiduciary Net Position displays the effect of financial transactions that occurred during the fiscal year, where Additions less Deductions = Net Increase (or Net Decrease) in Net Position� This Net Increase (or Net Decrease) in Net Position reflects the change in the value of Fiduciary Net Position that occurred between the current and prior year� (See Combining Statements of Changes in Fiduciary Net Position for the year ended December 31, 2015 on pages 40-41 of this report�)
Management’s Discussion and Analysis Financial Section

The Comprehensive Annual Financial Report 2015 OPERS 25
Financial Section Management’s Discussion and Analysis
Notes to Combining Financial Statements
The Notes to Combining Financial Statements are an integral part of the financial statements and provide additional information that is essential for a comprehensive understanding of the data provided in the financial statements� These notes describe the accounting and administrative policies under which OPERS operates, and provide additional levels of detail for selected financial statement items� (See Notes to Combining Financial Statements, December 31, 2015 on pages 42-69 of this report�)
The financial statements described on the previous page are prepared in compliance with GASB Pronouncements� Information on the significant accounting policies and recent GASB standards adopted in the preparation of the financial statements can be found in Note 2 in the Notes to Combining Financial Statements beginning on page 49�
Because of the long-term nature of most pension plans, financial statements alone cannot provide sufficient information to properly reflect the ongoing plan perspective� Therefore, in addition to the financial statements explained on the previous page, this report includes six additional Required Supplementary Information (RSI) schedules and required notes� The RSI section includes schedules of changes in net pension liability and investment returns for the defined-benefit portion of the pension plans, schedules of employer contributions for both defined-benefit pension plans and the health care trusts and a schedule of funding progress for all health care plans� The schedules of funding progress for defined-benefit pension plans have been included in the Actuarial Section of this document� Each of the following schedules includes historical trend information where required by standards, except for some of the schedules required to comply with GASB Statement No� 67 (GASB 67), Financial Reporting for Pension Plans, as 2014 was the initial year of implementation of this standard in the OPERS CAFR and historical information is unavailable for some of these schedules:
Schedules of Changes in Net Pension Liability —Traditional Pension Plan, Combined Plan and Member-Directed Plan
The Schedules of Changes in Net Pension Liability (pages 70-73) include actuarial information regarding the increase (or decrease) of each element of the net pension liability between the beginning and ending of the year for OPERS defined benefit pension plans� The values included in these schedules were calculated using the assumptions and requirements defined in GASB 67 (also referred to as the Accounting Basis throughout this document)� The calculation method defined in GASB 67 requires different assumptions than are used to calculate the funded status of a plan (also referred to as the Funding Basis throughout this document)� For example, the Accounting Basis requires the use of fair value of assets versus the smoothed value of assets used for the Funding Basis (refer to page 29 for additional information on actuarial smoothing techniques)� Therefore, the GASB 67 Accounting Basis net pension liability results will differ from the Funding Basis unfunded actuarial accrued liability results provided in the Schedule of Funding Progress included on page 29 of this section and in the Actuarial Section of this document beginning on page 154� GASB 67 breaks the link between accounting and funding� While these changes will affect the accounting information disclosed in the Notes to Combining Financial Statements and RSI, they do not have an effect on the actuarial methods and assumptions used by OPERS to determine the employer contributions needed to fund the plans�
Historical information is not available prior to the GASB 67 implementation in 2014� The schedules will be expanded each subsequent year until they contain the required 10-year presentation�
OPERS The Comprehensive Annual Financial Report 201526
Schedule of Member and Employer Contributions —Traditional Pension Plan
The Schedule of Member and Employer Contributions (page 74) presents historical trend information regarding the value of total annual contributions required to be paid by the members and employers participating in the Traditional Pension Plan, and the actual amounts remitted� The information contained in this schedule reflects the required contributions based on the contribution rates approved by the OPERS Board of Trustees (Board)� This schedule includes both member and employer contributions that are used to calculate the proportionate share by employer for the Traditional Pension Plan�
GASB Statement No� 68 (GASB 68), Accounting and Financial Reporting for Pensions, was issued by GASB in conjunction with GASB 67� GASB 68 applies to employers that participate in OPERS as well as other governmental employers that sponsor or contribute to pension plans� GASB 68 requires employers to recognize a proportionate share of the net pension liability in their financial statements, and includes other reporting changes� GASB 68 specifies that when different contribution rates are assessed for different classes of employees, the determination of the employer’s proportionate share must reflect those relationships� The Traditional Pension Plan proportionate share calculation includes both member and employer contributions to recognize the differing benefits of members in the State, Local, Public Safety and Law divisions� Members in the Public Safety and Law divisions are prohibited from participating in the Combined Plan or Member-Directed Plan� The defined benefit pension portion of the Combined Plan is funded with employer contributions only� Annuitized defined contribution accounts for Member-Directed Plan retirees are funded with member contributions, vested employer contributions (if applicable) and investment gains/(losses) related to those contributions� Separate schedules showing employer-only contributions for the Traditional Pension Plan, Combined Plan and Member-Directed Plan are also included in RSI and described below�
Schedules of Employer Contributions—Traditional Pension Plan, Combined Plan and Member-Directed Plan
The Schedules of Employer Contributions (pages 75-76) present historical trend information regarding the value of total annual contributions required to be paid by employers only for the employees participating in each plan, and the actual amounts remitted� The information contained in these schedules also reflects the required contributions based on the contribution rates approved by the Board� The Member-Directed Plan is a defined contribution plan with the option for retirees to purchase a defined benefit annuity administered through OPERS� Defined benefit annuities purchased by eligible Member-Directed retirees are funded with the accumulated member contributions, vested employer contributions, and gains or losses resulting from the member-selected investment options� All employer contributions deposited to the Member-Directed Plan are included in these schedules�
Schedule of Investment Returns—Defined Benefit Portfolio
The Schedule of Investment Returns (on page 77) provides information regarding the annual money-weighted rates of return on pension plan investments in the Defined Benefit portfolio, calculated and presented as required by GASB 67� Historical information is not available prior to the GASB 67 implementation in 2014� The schedule will be expanded each subsequent year until it contains the required 10-year presentation�
Management’s Discussion and Analysis Financial Section

The Comprehensive Annual Financial Report 2015 OPERS 27
Financial Section Management’s Discussion and Analysis
Schedule of Funding Progress—Health Care
The Schedule of Funding Progress for Health Care (page 77) includes actuarial information about the status of health care from an ongoing, long-term perspective, and the progress made in accumulating sufficient assets to pay future health care coverage costs� The results presented relate to the activities funded through the 401(h) Health Care Trust� The Connector program, funded by the 115 Health Care Trust, participants were eligible for allocations beginning January 1, 2016 and the covered lives were included in the results presented for the 401(h) Health Care Trust for the most recent valuation� Activity funded through the VEBA Trust is defined contribution and excluded from actuarial projections� The Schedule of Funding Progress for health care is reported on the Funding Basis, as the new GASB Accounting Basis for health care will not be effective for OPERS until 2017� Therefore, Accounting Basis information for health care is currently not available� Health care coverage is not statutorily guaranteed and may be changed to ensure the long-term solvency of the plans and OPERS’ ability to provide future coverage for all eligible retirees� Actuarial accrued liabilities are determined based on the current plan design, and do not reflect potential changes until approved by the Board�
Schedule of Contributions from Employers and Other Contributing Entities—Health Care
The Schedule of Contributions from Employers and Other Contributing Entities for health care (page 78) presents historical trend information regarding the value of total annual contributions required to fund health care coverage and the total portion of the employers’ contributions applied toward this funding� The information contained in this schedule reflects the required contributions based on the contribution rates approved by the Board� In addition, OPERS participates in federal programs such as Medicare Part D reimbursements and prescription drug plans that provide direct subsidies of health care expenses� These reimbursement/subsidy programs contribute to the funded status of health care and are included in this schedule�
Notes to Required Supplementary Information
The Notes to Required Supplementary Information (pages 79-80) provides background information, a summary of the actuarial assumptions used for valuation of the pension plans and health care, and explanatory detail to help in understanding the required supplementary schedules�
The following schedules are provided as Additional Information regarding the expenses associated with administering the System:
Administrative Expenses
The Administrative Expenses schedule displays the total operating costs of managing the System, by major categories of expense (page 81)� This schedule also includes payments made to outside professionals by the type of service providers used by the System (such as actuarial or legal)�
Schedule of Investment Expenses
The Schedule of Investment Expenses summarizes the costs incurred in managing the investment assets of the System (page 81)� These costs are reported as Investment Administrative Expenses in the Combining Statements of Changes in Fiduciary Net Position, and are reflected as a reduction in Net Investment Income�
OPERS The Comprehensive Annual Financial Report 201528
Financial Highlights
• The investment portfolio reported total losses of less than 0�1%, for the year ended December 31, 2015, as compared to a return of 6�7% in 2014� The total portfolio is divided into four sub-portfolios: the Defined Benefit portfolio, the 401(h) Health Care Trust portfolio, the 115 Health Care Trust portfolio, and the Defined Contribution portfolio� The Defined Benefit portfolio earned an investment return of 0�3% in 2015 compared to a return of 7�0% in 2014� The 401(h) Health Care Trust portfolio experienced losses of 2�2%, or (2�2%), in 2015 compared to gains of 5�3% in 2014� The 115 Health Care Trust portfolio experienced losses of 3�2%, or (3�2%), in 2015 compared to losses of less than 0�1% in 2014� The Defined Contribution portfolio experienced losses of 1�7%, or (1�7%), in 2015 compared to gains of 4�8% in 2014�
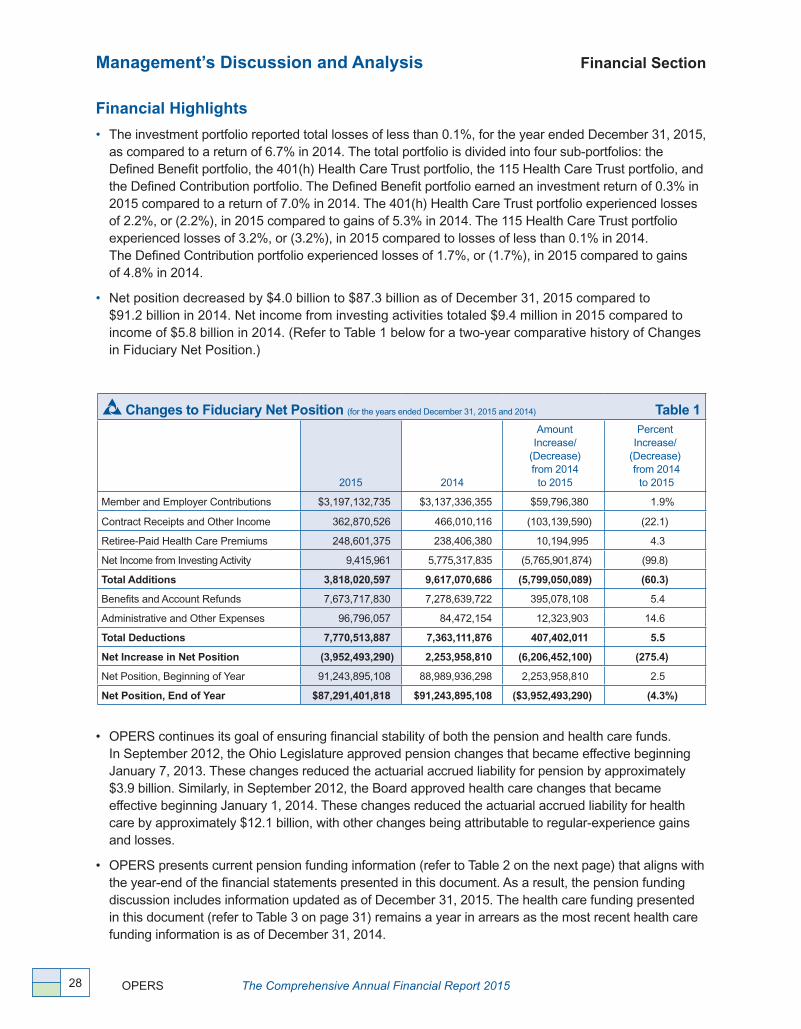
• Net position decreased by $4�0 billion to $87�3 billion as of December 31, 2015 compared to $91�2 billion in 2014� Net income from investing activities totaled $9�4 million in 2015 compared to income of $5�8 billion in 2014� (Refer to Table 1 below for a two-year comparative history of Changes in Fiduciary Net Position�)
Changes to Fiduciary Net Position (for the years ended December 31, 2015 and 2014) Table 1
2015 2014
Amount Increase/
(Decrease) from 2014
to 2015
PercentIncrease/
(Decrease) from 2014
to 2015
Member and Employer Contributions $3,197,132,735 $3,137,336,355 $59,796,380 1�9%
Contract Receipts and Other Income 362,870,526 466,010,116 (103,139,590) (22�1)
Retiree-Paid Health Care Premiums 248,601,375 238,406,380 10,194,995 4�3
Net Income from Investing Activity 9,415,961 5,775,317,835 (5,765,901,874) (99�8)
Total Additions 3,818,020,597 9,617,070,686 (5,799,050,089) (60.3)
Benefits and Account Refunds 7,673,717,830 7,278,639,722 395,078,108 5�4
Administrative and Other Expenses 96,796,057 84,472,154 12,323,903 14�6
Total Deductions 7,770,513,887 7,363,111,876 407,402,011 5.5
Net Increase in Net Position (3,952,493,290) 2,253,958,810 (6,206,452,100) (275.4)
Net Position, Beginning of Year 91,243,895,108 88,989,936,298 2,253,958,810 2�5
Net Position, End of Year $87,291,401,818 $91,243,895,108 ($3,952,493,290) (4.3%)
• OPERScontinuesitsgoalofensuringfinancialstabilityofboththepensionandhealthcarefunds. In September 2012, the Ohio Legislature approved pension changes that became effective beginning January 7, 2013� These changes reduced the actuarial accrued liability for pension by approximately $3�9 billion� Similarly, in September 2012, the Board approved health care changes that became effective beginning January 1, 2014� These changes reduced the actuarial accrued liability for health care by approximately $12�1 billion, with other changes being attributable to regular-experience gains and losses�
• OPERSpresentscurrentpensionfundinginformation(refer to Table 2 on the next page) that aligns with the year-end of the financial statements presented in this document� As a result, the pension funding discussion includes information updated as of December 31, 2015� The health care funding presented in this document (refer to Table 3 on page 31) remains a year in arrears as the most recent health care funding information is as of December 31, 2014�
Management’s Discussion and Analysis Financial Section

The Comprehensive Annual Financial Report 2015 OPERS 29
Schedule of Funding Progress—Funding Basis ($ in millions) Defined Benefit Plans*--Table 2
ValuationYear
Actuarial AccruedLiabilities (AAL) Valuation Assets
Unfunded ActuarialAccrued Liabilities
(UAAL)Ratio of Assets
to AAL Funding Years
2015 $91,832 $78,061 $13,771 85�0% 19
2014 89,285 74,865 14,420 83�8 21
2013 86,645 71,411 15,234 82�4 24
2012***** 83,878 67,855 16,023 80�9 26
2012**** 87,105 67,855 19,250 77�9 30
2011 84,530 65,436 19,094 77�4 30
2010*** 80,485 63,649 16,836 79�1 24
2010** 79,630 60,600 19,030 76�1 29
2009 76,555 57,629 18,926 75�3 30
2008 73,466 55,315 18,151 75�3 30
2007 69,734 67,151 2,583 96�3 14
2006 66,161 61,296 4,865 92�6 26
• Aspreviouslynoted,OPERSnetinvestmentincomefortheyearendedDecember31, 2015 totaled $9�4 million, including losses of less than 0�1% on the total OPERS portfolio� Net investment income for the defined benefit plans comprised $276�9 million of this total, with a return of 0�3%� The 401(h) Health Care Trust, 115 Health Care Trust and Defined Contribution portfolios experienced investment losses of $223�5 million, or ($223�5) million, $23�1 million, or ($23�1) million and $20�9 million, or ($20�9) million, respectively� As with all mature retirement systems, OPERS’ primary means of funding benefit payments in the future will be through investment income� Ultimately, the goal is for investment income to provide more than 60% of the funds necessary to pay retirement benefits� Therefore, the long-term rate of investment return is critical to the funding status of the System�
• Tofullyunderstandthefundingstatusofaretirementsystem,itisoftenadvisabletoviewactuarialdatain conjunction with financial data� Both Tables 2 and 3 are presented on the Funding Basis� Under the Funding Basis, the actuarial value of assets used to calculate funded status is not based on year-end fair value, known as the Accounting Basis (or GASB 67 basis), as of the valuation date� Under the Funding Basis, market gains and losses for actuarial funding purposes are smoothed over a rolling four-year period, subject to a 12% market corridor� This smoothing of actuarial gains and losses mitigates the need to constantly increase or lower contribution rates because volatile market conditions can be recognized (smoothed in) over several years�
• Therealityofactuarialsmoothingtechniquesisthatthefairvalueofassetsmaybesignificantlydifferentfrom the funding value (actuarial value) of assets at a given point in time� This means that in periods of extended market decline the fair value of assets will usually be less than the funding, or actuarial value, of assets� This was the case with OPERS during the extended down market of 2000 to 2002, and in 2008� Conversely, during periods of extended market gains, the fair value of assets will usually be greater than the funding, or actuarial value, of assets�
Financial Section Management’s Discussion and Analysis
* Defined Benefit Plans include the Traditional Pension Plan, the defined benefit portion of the Combined Plan and purchased annuities in the Member-Directed Plan�
** Results from original valuation prior to re-statement after completion of experience study� *** Revised actuarial assumptions based on experience study� **** Results prior to the provisions of Senate Bill 343� ***** Results reflecting the provisions of Senate Bill 343�

OPERS The Comprehensive Annual Financial Report 201530
• Toensurethatthefundingvalueofassetsandthefairvalueofassetsremainwithinlogicalproximityof each other under the Funding Basis, OPERS uses a 12% market corridor in conjunction with its four-year smoothing� This policy, instituted by the Board in 2001, ensures that the funding value of assets is neither lower than 88% nor higher than 112% of the fair value of the assets� At the end of 2014, the fair value of assets was higher than the funding value due to smoothing of gains from continued strong returns in 2013 following a strong year of returns in 2012� At the end of 2015, the fair value of assets was lower than the funding value due to the less than 1% investment losses in 2015 causing a decline in fair value while the funding value continued to recognize smoothed gains from prior years, causing the funding value rate of return to be higher than the fair value rate of return�
• AtDecember31, 2015,thedateofthelatestactuarialevaluation,thefundingvalueofassetssetaside to pay defined benefit pension benefits (non-health care assets) was $78�1 billion� The fair value of these defined benefit assets at December 31, 2015, included in the pension plans on OPERS financial statements, was $74�6 billion� As of December 31, 2015, the fair value of assets was lower than the funding value of assets, indicating that the 2015 actuarial investment losses are offset by the actuarial gains of 2012 and 2013, recognized, or smoothed in, in 2015, reflected in the funding value of assets�
• AsofDecember31, 2015,OPERShadaccumulatedsufficientassetstofund100%ofthebenefitsfor retirees and their beneficiaries, and had also provided nearly 60�6% of the reserves necessary to fund pensions for active and inactive members based on service credit earned through 2015�
• AsofDecember31, 2015,thedateofthemostrecentactuarialvaluation,theunfundedactuarialaccrued liability for the defined benefit pension plans was $13�8 billion� While the defined benefit investment return of 0�3% was less than the 8�0% actuarially assumed rate of return in 2015, the funding return was 8�4%� The higher funding return reflects the realization of a portion of prior year gains smoothed in over a four-year period� As a result, the unfunded actuarial liability decreased from $14�4 billion as of December 31, 2014 to $13�8 billion as of December 31, 2015� Refer to Table 2 on page 29 for a comparative history of actuarial liabilities and funding years for pension benefits�
• AsofDecember31, 2015,thedateofthelatestactuarialvaluation,thefundedratiofordefinedbenefitpensions was 85�0%� In general, this means that for each dollar of future pension liability, OPERS had accumulated approximately $0�85 to meet that obligation� The funded ratio increased in 2015, when compared to 2014, due to the funding value investment rate of return increasing above the actuarially assumed investment rate of return due to smoothed gains from 2013 and 2012 off-setting the losses in 2014 and 2015� The December 31, 2015 actuarial report indicates that if future activity proceeded according to assumptions, OPERS would accumulate sufficient assets to pay all pension liabilities for active members and retirees within 19 years on a Funding Basis� The funding years as of December 31, 2014 were 21 years on a Funding Basis�
Management’s Discussion and Analysis Financial Section
The Comprehensive Annual Financial Report 2015 OPERS 31
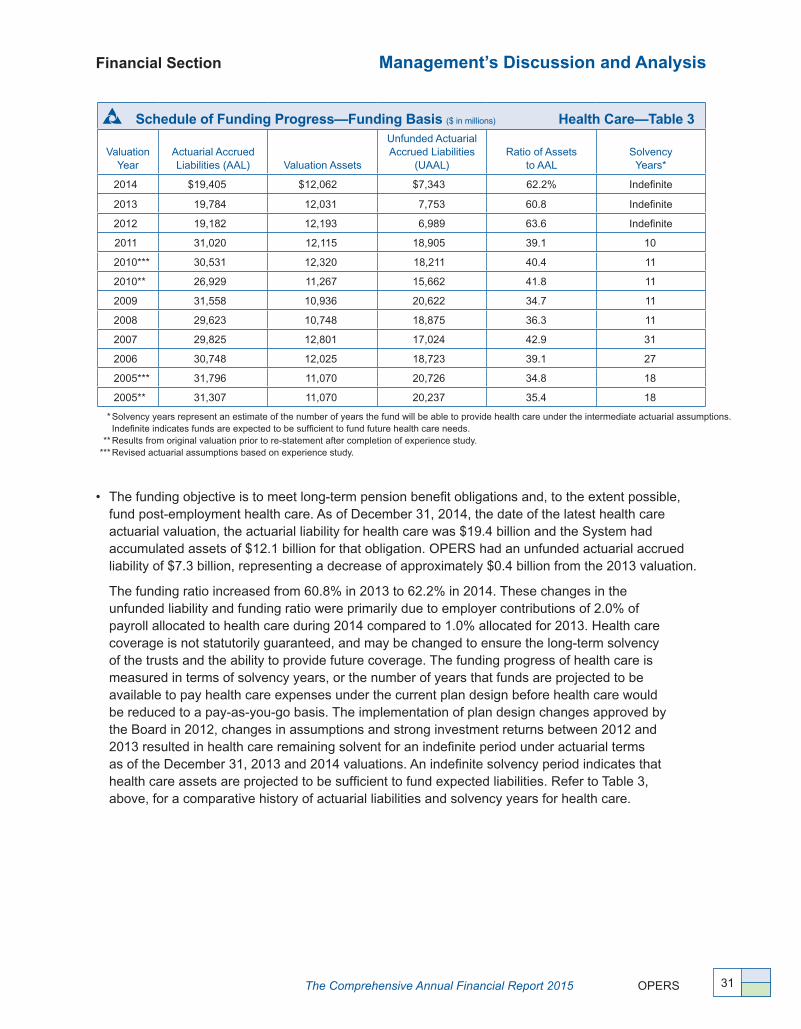
Schedule of Funding Progress—Funding Basis ($ in millions) Health Care—Table 3
ValuationYear
Actuarial AccruedLiabilities (AAL) Valuation Assets
Unfunded ActuarialAccrued Liabilities
(UAAL)Ratio of Assets
to AALSolvency
Years*
2014 $19,405 $12,062 $7,343 62�2% Indefinite
2013 19,784 12,031 7,753 60�8 Indefinite
2012 19,182 12,193 6,989 63�6 Indefinite
2011 31,020 12,115 18,905 39�1 10
2010*** 30,531 12,320 18,211 40�4 11
2010** 26,929 11,267 15,662 41�8 11
2009 31,558 10,936 20,622 34�7 11
2008 29,623 10,748 18,875 36�3 11
2007 29,825 12,801 17,024 42�9 31
2006 30,748 12,025 18,723 39�1 27
2005*** 31,796 11,070 20,726 34�8 18
2005** 31,307 11,070 20,237 35�4 18
• Thefundingobjectiveistomeetlong-termpensionbenefitobligationsand,totheextentpossible,fund post-employment health care� As of December 31, 2014, the date of the latest health care actuarial valuation, the actuarial liability for health care was $19�4 billion and the System had accumulated assets of $12�1 billion for that obligation� OPERS had an unfunded actuarial accrued liability of $7�3 billion, representing a decrease of approximately $0�4 billion from the 2013 valuation�
The funding ratio increased from 60�8% in 2013 to 62�2% in 2014� These changes in the unfunded liability and funding ratio were primarily due to employer contributions of 2�0% of payroll allocated to health care during 2014 compared to 1�0% allocated for 2013� Health care coverage is not statutorily guaranteed, and may be changed to ensure the long-term solvency of the trusts and the ability to provide future coverage� The funding progress of health care is measured in terms of solvency years, or the number of years that funds are projected to be available to pay health care expenses under the current plan design before health care would be reduced to a pay-as-you-go basis� The implementation of plan design changes approved by the Board in 2012, changes in assumptions and strong investment returns between 2012 and 2013 resulted in health care remaining solvent for an indefinite period under actuarial terms as of the December 31, 2013 and 2014 valuations� An indefinite solvency period indicates that health care assets are projected to be sufficient to fund expected liabilities� Refer to Table 3, above, for a comparative history of actuarial liabilities and solvency years for health care�
Financial Section Management’s Discussion and Analysis
* Solvency years represent an estimate of the number of years the fund will be able to provide health care under the intermediate actuarial assumptions� Indefinite indicates funds are expected to be sufficient to fund future health care needs�
** Results from original valuation prior to re-statement after completion of experience study� *** Revised actuarial assumptions based on experience study�

OPERS The Comprehensive Annual Financial Report 201532
Analysis of Financial Activities
OPERS funding objective is to meet long-term benefit obligations with investment income and contributions� Accordingly, the collection of employer and member contributions and the income generated from investment activities provide the reserves needed to finance future pension benefits and health care� The following discussion provides an analysis of the current year’s financial activities� Comparative data is presented, where appropriate�
Additions to Fiduciary Net Position (Revenues)
As previously noted, the reserves needed to finance retirement benefits are accumulated primarily through the collection of member and employer contributions, and through investment income (net of investment expense)� Revenues (Additions to Fiduciary Net Position) for the year 2015 were $3�8 billion, and include member and employer contributions of $3�2 billion, net income from investment activities of $9�4 million, and other income totaling approximately $0�6 billion� Other income line items are comprised of purchased service agreements, Retiree-Paid Health Care Premiums, employer interest and penalty charges, vendor performance guarantees and rebates, federal subsidies, settlements, Interplan Activity, and miscellaneous other income or expense� Interplan Activity in Table 4 represents transactions between plans that are additions to plan assets� Additions to plan net position for the year 2014 were $9�6 billion, comprised of $3�1 billion in contribution revenues, $5�8 billion in net income from investment activities, and other income totaling approximately $0�7 billion� Refer to Table 4, below, for a comparative history of Additions to Fiduciary Net Position�
Additions to Fiduciary Net Position (Revenues) (for the years ended December 31, 2015 and 2014) Table 4
2015 2014
Amount Increase/
(Decrease) from 2014 to 2015
Percent Increase/
(Decrease) from 2014
to 2015
Member Contributions* $1,332,308,994 $1,307,428,830 $24,880,164 1�9%
Employer Contributions 1,864,823,741 1,829,907,525 34,916,216 1�9
Contract and Other Receipts 172,067,637 270,728,202 (98,660,565) (36�4)
Retiree-Paid Health Care Premiums* 248,601,375 238,406,380 10,194,995 4�3
Federal Subsidy 175,930,875 176,619,891 (689,016) (0�4)
Other Income/(Expense),net (4,887,359) 8,304,360 (13,191,719) (158�9)
Interplan Activity 19,759,373 10,357,663 9,401,710 90�8
Net Income from Investing Activity 9,415,961 5,775,317,835 (5,765,901,874) (99�8)
Total Additions $3,818,020,597 $9,617,070,686 ($5,799,050,089) (60.3%)
Management’s Discussion and Analysis Financial Section
* Retiree-Paid Health Care Premiums for 2014 were previously included in Member Contributions� These lines have been restated to appropriately reflect the reclassification�

The Comprehensive Annual Financial Report 2015 OPERS 33
Member and employer contributions for 2015, compared to 2014, increased by $59�8 million, or 1�9%� Member and employer contributions include amounts paid by active members and their employers for future retirement benefits� In general, as wages start to rise, the retirement contributions from active members, and their employers, also increase� These contributions can also be influenced by the number of active members that move to retirement� In 2015, approximately 7,200 active members retired and will generally be replaced with less-tenured or entry-level staff� The national average wage increase given to government employees for 2015 was 2�1%, slightly higher than the actual increase in contributions for 2015�
Contracts and Other Receipts represents funds received for member purchase of service contracts, employer early retirement incentive programs, vendor rebates, and funds received from other Ohio retirement systems for members with service credit under more than one retirement system� These receipts totaled $172�1 million in 2015, or a decrease of 36�4% over the $270�7 million earned in 2014� The decrease in this line item is comprised of the following:
• Rebatesfromhealthcarevendorscomprise$91.4millionofthislineitemin2015,comparedto$150�4 million in 2014, representing a significant portion of the decrease� The majority of this decrease in rebates from health care vendors results from decreases in gain-sharing revenues received in conjunction with the Medicare Advantage program� The Medicare Advantage premiums are estimated at the beginning of the year, and adjusted at year end based on actual claims experience� These gain-sharing revenues represent a premium adjustment based on actual experience that results in receiving a vendor rebate� In 2015, gain-sharing revenues totaled $8�7 million compared to $109�2 million in 2014� The decrease in revenue from 2014 to 2015 is the result of incorporating the OPERS experience into the premium cost, which was a change in the calculation compared to prior years, and the expectation of the plan closing as of December 31, 2015�
• Alsoincluded,intherebatesfromhealthcarevendorsin2015,isanincreaseinformularyrebatesonprescriptions filled for retirees, netting with the gain-sharing revenues mentioned above to comprise the total $91�4 million of this activity in 2015� The increase in formulary rebates received from drug manufacturers is based on frequency and quantity of prescriptions, which can vary from year-to-year� Revenue from formulary rebates increased from $41�0 million in 2014 to $83�3 million in 2015�
• PublicemployeeswithserviceinmorethanoneOhiosystemcancombinetheirservicecreditandretirement savings into one pension benefit administered by the system with the most contributions� Transfers received from other Ohio retirement systems represent receipts for members electing to combine their service for which OPERS will administer the member’s benefit� This activity also decreased by approximately $23�2 million in 2015 compared to 2014, representing another significant decrease in the Contracts and Other Receipts line item� A higher volume of activity was experienced in 2014 as statutory changes in the amount of funds required to be transferred was implemented and a larger number of members retired�
• Employerscanalsoinfluencememberretirementbehaviorbysponsoringanearlyretirementincentiveplan (ERIP)� Revenue related to ERIP contract initiations in 2015 decreased by $12�5 million when compared to 2014� These contracts are initiated at the discretion of the employer and can vary greatly from year-to-year�
• TheremainderofthechangeinthisContractsandOtherReceiptslineitemiscomprisedofaminor decrease in member-elected service purchases, a minor decrease in employer penalties and delinquent contribution payments, and a minor increase in revenue related to the health care waiver program with other Ohio retirement systems�
Financial Section Management’s Discussion and Analysis

OPERS The Comprehensive Annual Financial Report 201534
Additions to Fiduciary Net Position also includes amounts paid by retirees toward the cost of OPERS-provided health care in the Retiree-Paid Health Care Premiums line item� Retirees share in the cost of providing health care coverage for themselves, spouses and dependents� In 2015, these contributions totaled $248�6 million, compared to $238�4 million in 2014� This increase is primarily related to an increase in the retiree population, the rising cost of health care and program design changes�
Federal Subsidy revenue is comprised of reimbursements and direct subsidies OPERS received from the federal government for participation in the Medicare Prescription Drug Program (PDP)� In 2015, the PDP subsidy totaled $175�2 million compared to $176�2 million in 2014� Enrollment in the program increased by 1,364 in 2015 compared to 2014� The direct subsidy received by OPERS, however, varies throughout the year based on the individual risk scores of OPERS retirees enrolled in the plan� Risk scores are assigned by the Centers for Medicare & Medicaid Services for each participant�
Other Income/(Expense), net, is comprised of miscellaneous proceeds, gains or losses on the disposal of fixed assets and litigation settlements activity� Other income/(expense) for 2015 was a net expense of $4�9 million compared to a net income of $8�3 million in 2014� This activity typically fluctuates from year-to-year and, in 2015, the net expense balance in this line item is primarily comprised of an estimated $6�0 million litigation settlement related to an investment holding� Favorable class action settlements, miscellaneous proceeds, and losses on the disposal of fixed assets comprise the remainder of the balance�
Interplan Activity represents transfers between the plans to record activity occurring between the plans� This activity includes members changing from one plan to another, and repayment of initial plan start-up and administrative costs� Interplan Activity in 2015 resulted in a net inflow of $19�8 million, compared to $10�4 million in 2014� Since this activity represents one plan paying another plan, there is a corresponding interplan expense activity of the same amount in each year� (Refer also to the Deductions from Fiduciary Net Position discussion beginning on the next page�) Beginning in October 2014, the Board approved the funding of VEBA Trust participant RMAs using the reserves in the VEBA Trust rather than the allocation of employer contributions� Instead, employer contributions were allocated to the Member-Directed Plan to repay the original plan start-up and administrative costs of the Member-Directed Plan to the Traditional Pension Plan�
Net Income from Investing Activity represents total investment income net of external management fees and administrative expenses� Investment income includes dividends, interest, and gains or losses on the sales of investments� OPERS reflects both income and management fees from external managers in this line item�
In 2015, OPERS continued transparency efforts related to the compilation of private equity-related external management fees incurred during the year� The results of our efforts to obtain additional information from fund managers identified management fees impacting the net asset value that were historically netted against the appreciation/depreciation in fair value� External Asset Management Fees within the Combining Statements of Changes in Fiduciary Net Position were $428�2 million in 2015, or an increase of $78�0 million from 2014� Private equity-related investment manager fees reported to OPERS, whether directly invoiced or subtracted from the fund on a net basis, are reported as External Asset Management Fees� These fees include investment management fees and other expenses such as audit expenses in limited partnership structures, as well as fee offsets that may have the effect of reducing the total amount of fees�
Investment administrative fees include investment-specific expenses such as staff wages, professional services contracted by the Board, legal services and a share of the OPERS facility and operational costs� For a discussion on the current year activity within Net Income from Investing Activity, refer to the Financial Highlights section on page 28�
Management’s Discussion and Analysis Financial Section
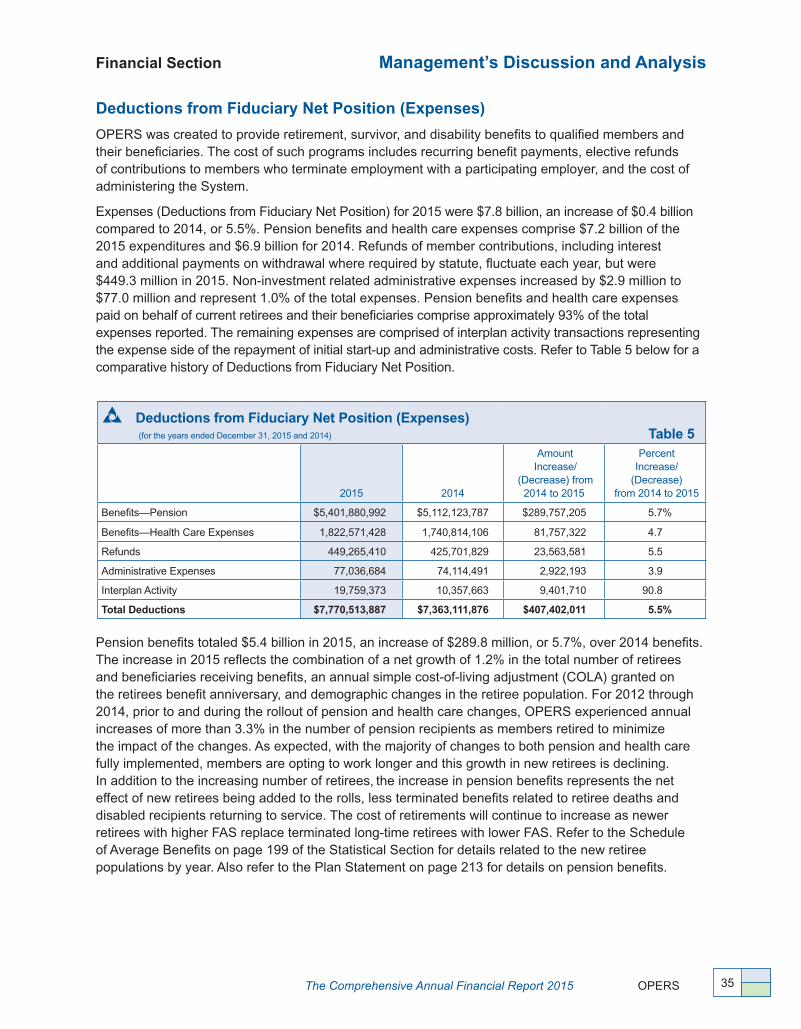
The Comprehensive Annual Financial Report 2015 OPERS 35
Financial Section Management’s Discussion and Analysis
Deductions from Fiduciary Net Position (Expenses)
OPERS was created to provide retirement, survivor, and disability benefits to qualified members and their beneficiaries� The cost of such programs includes recurring benefit payments, elective refunds of contributions to members who terminate employment with a participating employer, and the cost of administering the System�
Expenses (Deductions from Fiduciary Net Position) for 2015 were $7�8 billion, an increase of $0�4 billion compared to 2014, or 5�5%� Pension benefits and health care expenses comprise $7�2 billion of the 2015 expenditures and $6�9 billion for 2014� Refunds of member contributions, including interest and additional payments on withdrawal where required by statute, fluctuate each year, but were $449�3 million in 2015� Non-investment related administrative expenses increased by $2�9 million to $77�0 million and represent 1�0% of the total expenses� Pension benefits and health care expenses paid on behalf of current retirees and their beneficiaries comprise approximately 93% of the total expenses reported� The remaining expenses are comprised of interplan activity transactions representing the expense side of the repayment of initial start-up and administrative costs� Refer to Table 5 below for a comparative history of Deductions from Fiduciary Net Position�
Deductions from Fiduciary Net Position (Expenses)
(for the years ended December 31, 2015 and 2014) Table 5
2015 2014
Amount Increase/
(Decrease) from 2014 to 2015
Percent Increase/
(Decrease) from 2014 to 2015
Benefits—Pension $5,401,880,992 $5,112,123,787 $289,757,205 5�7%
Benefits—Health Care Expenses 1,822,571,428 1,740,814,106 81,757,322 4�7
Refunds 449,265,410 425,701,829 23,563,581 5�5
Administrative Expenses 77,036,684 74,114,491 2,922,193 3�9
Interplan Activity 19,759,373 10,357,663 9,401,710 90�8
Total Deductions $7,770,513,887 $7,363,111,876 $407,402,011 5.5%
Pension benefits totaled $5�4 billion in 2015, an increase of $289�8 million, or 5�7%, over 2014 benefits� The increase in 2015 reflects the combination of a net growth of 1�2% in the total number of retirees and beneficiaries receiving benefits, an annual simple cost-of-living adjustment (COLA) granted on the retirees benefit anniversary, and demographic changes in the retiree population� For 2012 through 2014, prior to and during the rollout of pension and health care changes, OPERS experienced annual increases of more than 3�3% in the number of pension recipients as members retired to minimize the impact of the changes� As expected, with the majority of changes to both pension and health care fully implemented, members are opting to work longer and this growth in new retirees is declining� In addition to the increasing number of retirees, the increase in pension benefits represents the net effect of new retirees being added to the rolls, less terminated benefits related to retiree deaths and disabled recipients returning to service� The cost of retirements will continue to increase as newer retirees with higher FAS replace terminated long-time retirees with lower FAS� Refer to the Schedule of Average Benefits on page 199 of the Statistical Section for details related to the new retiree populations by year� Also refer to the Plan Statement on page 213 for details on pension benefits�

36 OPERS The Comprehensive Annual Financial Report 2015
Management’s Discussion and Analysis Financial Section
Total health care expenses increased to $1�8 billion in 2015, or 4�7%, compared to 2014� The majority of health care expenses are comprised of medical, dental, vision, and prescription drug costs, as well as reimbursements to retirees for Medicare Part B premiums� Medical, dental, vision and disease-management costs represent approximately 55% of the total health care expenses for 2015, a decrease from 2014, which approximated 57% of total health care expenses� Prescription drug costs comprised 37% of total health care expenses in 2015, an increase over the 36% reported for 2014� Medicare Part B premium reimbursements were approximately 4% of the total, a decrease from the 7% reported for 2014� As part of plan changes approved by the Board in 2012, the Medicare Part B reimbursement is being phased-out over a three-year period with the final reduction next year, resulting in no reimbursements beginning January 1, 2017�
The OPERS health care plans for recipients under the age of 65 are self-insured� OPERS also self-insures prescription drug coverage for all retirees and dependents� Medical coverage for recipients over the age of 65 is provided through a premium-based Medicare Advantage Plan� Costs in self-insured plans will fluctuate based on the timing of claims incurrence and the magnitude of catastrophic claims, in addition to overall increases in costs occurring in the market� Medical, dental, vision and disease-management expenses for 2015 rose 2�3% to $1�0 billion, compared to $985�5 million in 2014� Prescription drug costs rose 6�0% to $672�7 million in 2015, compared to $634�5 million in 2014� The OneRx® National Drug Index® cited double-digit price increases for prescription medications in 2015 with branded drugs rising by 14�8%, specialty drugs by 9�2% and generic drugs by 2�9%, for a composite increase of 10�4%�
Refunds of member accounts are at the discretion of the member, and vary from year to year� In 2015, member-elected refunds totaled $449�3 million, compared to $425�7 million in 2014� Members may only refund their account if they have been separated from OPERS-covered employment for at least three months� Accordingly, refunds represent disbursements of inactive member accounts� The number of refunded accounts and refund values increased in 2015 by 1�9% and 5�5%, respectively� This increase is the result of an initiative to contact inactive members with small balances to confirm their intent to maintain an account at OPERS based on their benefit options�
OPERS has consistently managed its administrative expense budget with no material variances experienced between planned and actual expenditures in either 2015 or 2014� Administrative Expenses shown in Table 5 on the previous page do not include investment administrative expenses� Administrative Expenses, not including investment expenses, totaled $77�0 million in 2015 compared to $74�1 million in 2014� The increase in 2015 Administrative Expenses includes an increase in training, education, printing and mailing of various member materials associated with the rollout of the OPERS Medicare Connector in 2015�

37 The Comprehensive Annual Financial Report 2015 OPERS
Financial Section Management’s Discussion and Analysis
Net Position Summary
Net position may serve over time as a useful indicator of OPERS’ financial status (please refer to Table 6 below)� At the close of calendar years 2015 and 2014, the net positions of OPERS totaled $87�3 billion and $91�2 billion, respectively� These plan net positions are available to meet OPERS ongoing obligations to plan participants and their beneficiaries, and to the extent possible, OPERS post-employment health care�
Net Position (as of December 31, 2015 and 2014) Table 6
2015 2014
Amount Increase/
(Decrease) from 2014 to 2015
Percent Increase/
(Decrease) from 2014 to 2015
Current and Other Assets $956,197,651 $1,091,098,502 ($134,900,851) (12�4%)
Cash and Investments at Fair Value 95,154,353,476 98,628,369,208 (3,474,015,732) (3�5)
Capital Assets 132,811,651 133,629,210 (817,559) (0�6)
Total Assets 96,243,362,778 99,853,096,920 (3,609,734,142) (3.6)
Total Liabilities 8,951,960,960 8,609,201,812 342,759,148 4.0
Net Position, End of Year 87,291,401,818 91,243,895,108 (3,952,493,290) (4.3)
Net Position, Beginning of Year 91,243,895,108 88,989,936,298 2,253,958,810 2�5
Net Increase/(Decrease) in Net Position ($3,952,493,290) $2,253,958,810 ($6,206,452,100) (275.4%)
Summary
OPERS remains a strong pension system with sound funding� The 2012 changes to both the pension and health care plans strengthened, and will continue to strengthen, the funding status and established a path for improved funding levels� OPERS continues to proactively manage the Fund in a manner that addresses issues and trends timely contributing to the strength of the Fund� The funding levels and 2015 results of operations are found, in detail, and by category, in this annual report�
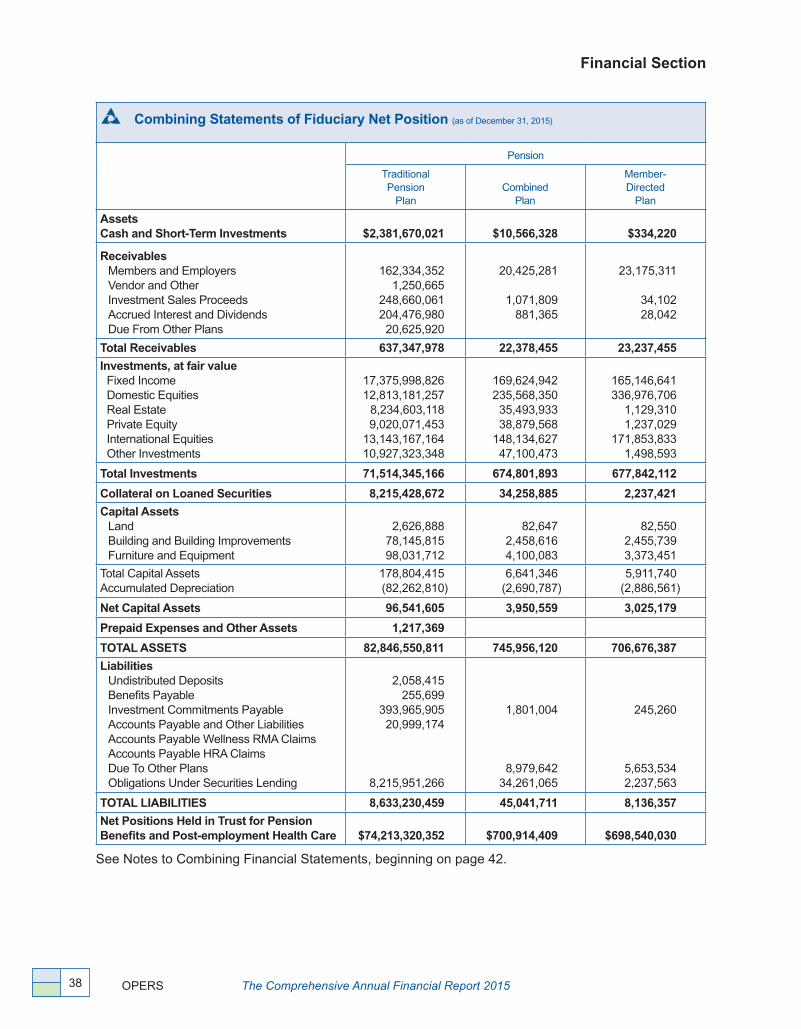
38
Financial Section
OPERS The Comprehensive Annual Financial Report 2015
See Notes to Combining Financial Statements, beginning on page 42�
Combining Statements of Fiduciary Net Position (as of December 31, 2015)
Pension
Traditional Pension
Plan Combined
Plan
Member- Directed
Plan
AssetsCash and Short-Term Investments $2,381,670,021 $10,566,328 $334,220
ReceivablesMembers and EmployersVendor and OtherInvestment Sales ProceedsAccrued Interest and DividendsDue From Other Plans
162,334,352 1,250,665
248,660,061 204,476,980 20,625,920
20,425,281
1,071,809 881,365
23,175,311
34,102 28,042
Total Receivables 637,347,978 22,378,455 23,237,455
Investments, at fair valueFixed IncomeDomestic EquitiesReal EstatePrivate EquityInternational EquitiesOther Investments
17,375,998,826 12,813,181,257
8,234,603,118 9,020,071,453
13,143,167,164 10,927,323,348
169,624,942 235,568,350 35,493,933 38,879,568
148,134,627 47,100,473
165,146,641 336,976,706
1,129,310 1,237,029
171,853,833 1,498,593
Total Investments 71,514,345,166 674,801,893 677,842,112
Collateral on Loaned Securities 8,215,428,672 34,258,885 2,237,421
Capital AssetsLandBuilding and Building ImprovementsFurniture and Equipment
2,626,888 78,145,815 98,031,712
82,647 2,458,616 4,100,083
82,550 2,455,739 3,373,451
Total Capital AssetsAccumulated Depreciation
178,804,415 (82,262,810)
6,641,346 (2,690,787)
5,911,740 (2,886,561)
Net Capital Assets 96,541,605 3,950,559 3,025,179
Prepaid Expenses and Other Assets 1,217,369
TOTAL ASSETS 82,846,550,811 745,956,120 706,676,387
LiabilitiesUndistributed DepositsBenefits PayableInvestment Commitments PayableAccounts Payable and Other LiabilitiesAccounts Payable Wellness RMA ClaimsAccounts Payable HRA ClaimsDue To Other PlansObligations Under Securities Lending
2,058,415 255,699
393,965,905 20,999,174
8,215,951,266
1,801,004
8,979,642 34,261,065
245,260
5,653,534 2,237,563
TOTAL LIABILITIES 8,633,230,459 45,041,711 8,136,357
Net Positions Held in Trust for PensionBenefits and Post-employment Health Care $74,213,320,352 $700,914,409 $698,540,030
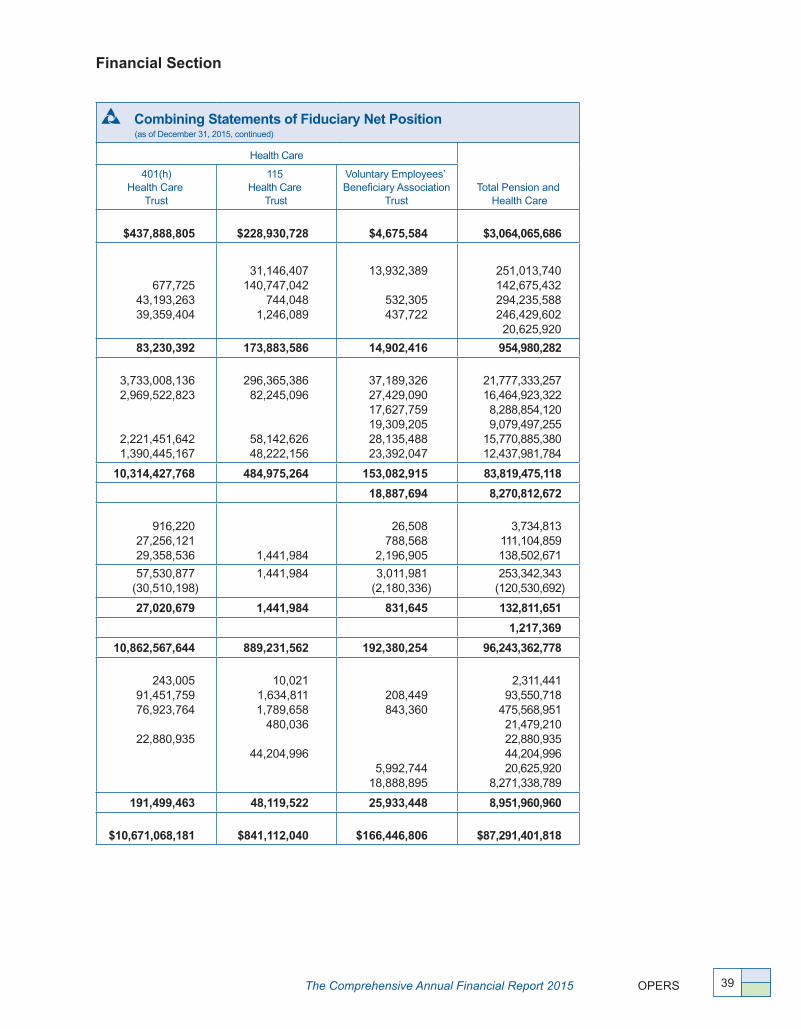
39 The Comprehensive Annual Financial Report 2015 OPERS
Financial Section
Combining Statements of Fiduciary Net Position (as of December 31, 2015, continued)
Health Care
Total Pension and Health Care
401(h) Health Care
Trust
115 Health Care
Trust
Voluntary Employees’ Beneficiary Association
Trust
$437,888,805 $228,930,728 $4,675,584 $3,064,065,686
677,725 43,193,263 39,359,404
31,146,407 140,747,042
744,048 1,246,089
13,932,389
532,305 437,722
251,013,740 142,675,432 294,235,588 246,429,602 20,625,920
83,230,392 173,883,586 14,902,416 954,980,282
3,733,008,136 2,969,522,823
2,221,451,642 1,390,445,167
296,365,386 82,245,096
58,142,626 48,222,156
37,189,326 27,429,090 17,627,759 19,309,205 28,135,488 23,392,047
21,777,333,257 16,464,923,322 8,288,854,120 9,079,497,255
15,770,885,380 12,437,981,784
10,314,427,768 484,975,264 153,082,915 83,819,475,118
18,887,694 8,270,812,672
916,220 27,256,121 29,358,536 1,441,984
26,508 788,568
2,196,905
3,734,813 111,104,859 138,502,671
57,530,877 (30,510,198)
1,441,984 3,011,981 (2,180,336)
253,342,343 (120,530,692)
27,020,679 1,441,984 831,645 132,811,651
1,217,369
10,862,567,644 889,231,562 192,380,254 96,243,362,778
243,005 91,451,759 76,923,764
22,880,935
10,021 1,634,811 1,789,658
480,036
44,204,996
208,449 843,360
5,992,744 18,888,895
2,311,441 93,550,718
475,568,951 21,479,210 22,880,935 44,204,996 20,625,920
8,271,338,789
191,499,463 48,119,522 25,933,448 8,951,960,960
$10,671,068,181 $841,112,040 $166,446,806 $87,291,401,818

40
Financial Section
OPERS The Comprehensive Annual Financial Report 2015
See Notes to Combining Financial Statements, beginning on page 42�
Combining Statements of Changes in Fiduciary Net Position (for the year ended December 31, 2015)
Pension
Traditional Pension
Plan Combined
Plan
Member- Directed
Plan
Additions Member Contributions Employer Contributions Contract and Other Receipts Retiree-Paid Health Care Premiums Federal Subsidy Other Income/(Expense), net Interplan Activity
$1,246,732,014 1,498,679,737
75,209,820
(4,887,369) 19,759,373
$36,685,161 44,022,120
492,260
$48,891,819 68,448,551
495,540
Total Non-investment Income 2,835,493,575 81,199,541 117,835,910
Income From Investing Activities Net Depreciation in Fair Value Bond Interest Dividends Real Estate Operating Income, net International Income/(Loss) Other Investment Income External Asset Management Fees
(2,556,912,148) 827,524,445 359,382,644
1,287,473,691 161,443
750,028,970 (394,701,680)
(18,255,195) 3,885,370 1,498,646 5,368,837
673 3,127,662
(1,901,327)
(13,798,833) 976,123 97,880
350,650 44
204,277 (583,304)
Net Investment Income/(Loss) 272,957,365 (6,275,334) (12,753,163)
From Securities Lending Activity Security Lending IncomeSecurity Lending Expenses
Net Security Lending IncomeUnrealized Losses
46,241,728 (10,356,930)
192,831 (43,189)
12,594 (2,821)
35,884,798 (522,594)
149,642 (2,179)
9,773 (142)
Net Income from Securities Lending 35,362,204 147,463 9,631
Investment Administrative Expenses (33,420,917) (374,048) (327,418)
Net Income/(Loss) from Investing Activity 274,898,652 (6,501,919) (13,070,950)
TOTAL ADDITIONS 3,110,392,227 74,697,622 104,764,960
Deductions Benefits Refunds of Contributions Administrative Expenses Interplan Activity
5,398,844,664 405,320,800 49,137,053
1,791,115 12,577,944 2,522,610 7,141,271
1,245,213 31,366,666 2,260,306 6,625,358
TOTAL DEDUCTIONS 5,853,302,517 24,032,940 41,497,543
Net Increase/(Decrease) Net Positions Held in Trust for Pension Benefits and Post-employment Health Care
Balance, Beginning of Year
(2,742,910,290)
76,956,230,642
50,664,682
650,249,727
63,267,417
635,272,613
Balance, End of Year $74,213,320,352 $700,914,409 $698,540,030

41 The Comprehensive Annual Financial Report 2015 OPERS
Financial Section
Combining Statements of Changes in Fiduciary Net Position (for the year ended December 31, 2015, continued)
Health Care
Total Pension and Health Care
401(h) Health Care
Trust
115 Health Care
Trust
Voluntary Employees’ Beneficiary Association
Trust
$9,435 248,601,375
$253,673,333 95,860,582
175,930,875 10
$1,332,308,994 1,864,823,741
172,067,637 248,601,375 175,930,875
(4,887,359) 19,759,373
248,610,810 525,464,800 3,808,604,636
(453,577,747) 157,207,141 105,609,193
(11,506) 652,343
(27,988,205)
(17,539,101) 6,517,201
(9,556,397)
(1,178) (43,576)
(2,147,433)
($5,883,465) 1,902,518
826,237 2,959,962
371 1,724,353 (907,438)
(3,065,966,489) 998,012,798 457,858,203
1,296,153,140 149,847
755,694,029 (428,229,387)
(218,108,781) (22,770,484) 622,538 13,672,141
106,312(23,811)
46,553,465 (10,426,751)
82,501 (1,202)
36,126,714 (526,117)
81,299 35,600,597
(5,355,603) (302,871) (75,920) (39,856,777)
(223,464,384) (23,073,355) 627,917 9,415,961
25,146,426 502,391,445 627,917 3,818,020,597
1,774,989,836
19,611,199
45,184,620
2,174,957
2,396,972
1,330,5595,992,744
7,224,452,420 449,265,410 77,036,684 19,759,373
1,794,601,035 47,359,577 9,720,275 7,770,513,887
(1,769,454,609)
12,440,522,790
455,031,868
386,080,172
(9,092,358)
175,539,164
(3,952,493,290)
91,243,895,108
$10,671,068,181 $841,112,040 $166,446,806 $87,291,401,818

OPERS The Comprehensive Annual Financial Report 201542
Notes to Combining Financial Statements Financial Section
1. Description of OPERSa. Organization—The Ohio Public Employees Retirement System (OPERS, System or Fund) is a cost-
sharing, multiple-employer public employee retirement system comprised of three separate pension plans: the Traditional Pension Plan, a defined benefit plan; the Combined Plan, a combination defined benefit/defined contribution plan; and the Member-Directed Plan, a defined contribution plan� OPERS is a qualified governmental plan under Section 401(a) of the Internal Revenue Code (IRC)� All state and local governmental employees in Ohio, except those covered by one of the other state or local retirement systems in Ohio, are members of OPERS� New public employees (those who establish membership in OPERS on or after January 1, 2003) have 180 days from the commencement of employment to select membership in one of the three pension plans� Contributions to OPERS are effective with the first day of the member’s employment� Contributions made prior to the member’s plan selection are maintained in the Traditional Pension Plan and later transferred to the plan elected by the member, as appropriate�
OPERS maintains three health care trusts� Two trusts, the 401(h) Health Care Trust (401(h) Trust) and the 115 Health Care Trust (115 Trust) work together to provide funding to eligible members of the Traditional Pension Plan and Combined Plan� The third trust is a Voluntary Employees’ Beneficiary Association Trust (VEBA Trust) that accumulates funding for participants of the Member-Directed Retiree Medical Account Plan (RMA), which functions as a medical spending account� The three trusts are considered to be separate legal entities under Internal Revenue Service (IRS) regulations and are reported separately in the financial statements� Subsequent to year end, OPERS received two favorable rulings from the IRS allowing OPERS to consolidate health care assets into the 115 Trust� For more information, refer to Note 10 on page 69� Effective October 1, 2015, OPERS launched the OPERS Medicare Connector (Connector) along with a health reimbursement arrangement (HRA) for Traditional Pension Plan and Combined Plan retirees enrolled in Medicare Parts A and B� The 115 Trust was established in 2014 to provide a funding mechanism for the HRA� Eligible retirees who purchase Medicare supplemental coverage through the Connector may receive a monthly allowance in their HRA to reimburse eligible health care expenses, beginning with January 2016 premiums� These trusts are reported as other post-employment benefit plans (OPEB) based on the criteria established by the Governmental Accounting Standards Board (GASB)� Periodically, OPERS modifies the health care program design to improve the ongoing solvency of the plans� Prior to January 1, 2015, 10 or more years of service were required to qualify for health care coverage� Beginning January 1, 2015, generally, members must be at least age 60 with 20 years of qualifying service credit to qualify for health care coverage� Please see the Plan Statement beginning on page 213 for additional details� Health care coverage is neither guaranteed nor statutorily required�
OPERS is administered in accordance with Chapter 145 of the Ohio Revised Code (ORC)� The accompanying financial statements comply with the provisions of GASB Statement No�14, The Financial Reporting Entity, and with the provisions of GASB Statement No� 39, Determining Whether Certain Organizations Are Component Units—an amendment of GASB Statement No.14. These statements require that financial statements of the reporting entity include all the organizations, activities, functions and component units for which the reporting entity is financially accountable� Financial accountability is defined as the appointment of a voting majority of the component unit’s board of directors and either (1) the reporting entity’s ability to impose its will over the component unit, or (2) the possibility that the component unit will provide a financial benefit to, or impose a financial burden on, the reporting entity� OPERS does not have financial accountability over any entities�
Individual audited financial statements, as of and for the year ended December 31, 2015, for each of the following plans as presented in the Combining Statements of Fiduciary Net Position and Changes in Fiduciary Net Position, were issued:
• CombinedPlan• Member-DirectedPlan• 401(h)HealthCareTrust

The Comprehensive Annual Financial Report 2015 OPERS 43
Financial Section Notes to Combining Financial Statements
• 115HealthCareTrust• VoluntaryEmployees’BeneficiaryAssociationTrust
OPERS is not part of the state of Ohio financial-reporting entity, nor is OPERS a component unit of the state of Ohio� Responsibility for the organization is vested in the OPERS Board of Trustees (Board); there is no financial interdependency with the state of Ohio� The Board is the governing body of OPERS, with responsibility for administration and management� Of the Board, seven members are elected by the group they represent: the retirees (two representatives), employees of the state, employees of counties, employees of municipalities, non-teaching employees of state colleges and universities and miscellaneous employees� The remaining four members are appointed or designated by position� The Governor, General Assembly and the Treasurer of the state of Ohio each appoint a representative� The Director of the Ohio Department of Administrative Services completes the Board�
The Board appoints the Executive Director, an actuary, and other consultants necessary for the transaction of business� The Board meets monthly and receives no compensation, but is reimbursed for necessary expenses�
Plan membership—All state and local governmental employees, except those covered by another state retirement system in Ohio or the Cincinnati Retirement System, are required to become contributing members of OPERS when they begin public employment unless they are exempted or excluded as defined by the ORC� For actuarial purposes, employees who have earned sufficient service credit (60 contributing months) are entitled to a future retirement benefit from OPERS� Employer, employee and retiree data as of December 31, 2015 follows:
* In 2014, OPERS established the 115 Health Care Trust to support a Health Reimbursement Arrangement (HRA) plan� As of December 31, 2015, the 115 Health Care Trust did not have any obligations except for January 2016 premium reimbursements requested prior to the effective date of January 1, 2016� The covered lives in the HRA are included in the member numbers presented for the 401(h) Health Care Trust�
** Combined Plan members receiving a defined formula benefit may also be receiving a distribution of their defined contribution account, so may be counted more than once in this table�
*** Inactive members with at least five years of service are eligible for a retirement benefit at the age of 60� Inactive members with less than five years of service are eligible for a refund of account� Inactive members with five or more years of service are displayed based on their age eligibility for a retirement benefit as of the end of the year�
Plan Membership*
As of December 31, 2015
TraditionalPension
PlanCombined
Plan**
Member- Directed
Plan
401(h) Health Care Trust
Voluntary Employees’ Beneficiary Association
Trust2015 Total
Employer Units State Division Local Division Law Enforcement and Public Safety Divisions
3,683 260
3,184 239
Retirees and Inactive Members—Defined Benefit Pension Retirees and Primary Beneficiaries currently receiving benefitsDependents and Other Beneficiaries currently receiving benefits Inactive Members eligible for, but not yet receiving benefits *** Inactive Members not yet age eligible for benefits *** Inactive Members eligible for refund value of account only ***
205,211 6,222 7,444
25,391 476,275
196 128 61
655 1,315
185 1
723,084 205,592
6,351 7,505
26,046 477,590
Retirees and Inactive Members—Defined Contribution AccountsRetirees currently receiving benefits Inactive Members
7 9 4,824
4,840 16
4,824
Retirees and Inactive Members—Health Care Retirees and Primary Beneficiaries currently receiving benefitsDependent and Other Beneficiaries currently receiving benefits Inactive Members eligible for, but not yet receiving benefits
170,687 52,110 1,874
4,066 228,737 174,753 52,110 1,874
Active Employees State Division Local Division Law Enforcement Division Public Safety Division
117,277 201,649
7,788 81
2,770 4,817
4,030 7,210
345,622 124,077 213,676
7,788 81

OPERS The Comprehensive Annual Financial Report 201544
Notes to Combining Financial Statements Financial Section
b. Benefits—All benefits of the System, and any benefit increases are established by the legislature pursuant to ORC Chapter 145� The Board, pursuant to ORC Chapter 145, has elected to maintain funds to provide health care coverage to eligible Traditional Pension Plan and Combined Plan retirees and survivors of members� Health care coverage does not vest and is not required under ORC Chapter 145� As a result, coverage may be reduced or eliminated at the discretion of the Board�
• Age-and-Service Defined Benefits—Effective January 7, 2013, Senate Bill (SB) 343 modified components of the Traditional Pension Plan and Combined Plan� Members were impacted (to varying degrees) by the changes based on their transition group� Three transition groups (A, B and C) were designed to ease the transition for key components of the pension plan changes� Members who were eligible to retire under law in effect prior to SB 343 or will be eligible to retire no later than five years after January 7, 2013, comprise transition Group A� Members who have 20 years of service credit prior to January 7, 2013, or will be eligible to retire no later than 10 years after January 7, 2013, are included in transition Group B� Group C included those members who are not in either of the other groups and members who were hired on or after January 7, 2013� Please see the Plan Statement for additional details�
Benefits in the Traditional Pension Plan for State and Local members are calculated on the basis of age, final average salary (FAS), and service credit� State and Local members in transition Groups A and B are eligible for retirement benefits at age 60 with 60 contributing months of service credit or at age 55 with 25 or more years of service credit� Group C for State and Local is eligible for retirement benefits at age 57 with 25 years of service or at age 62 with five years of service� For Groups A and B, the annual benefit is based on 2�2% of FAS multiplied by the actual years of service for the first 30 years of service credit and 2�5% for years of service in excess of 30 years� For Group C, the annual benefit applies a factor of 2�2% for the first 35 years and a factor of 2�5% for the years of service in excess of 35� FAS represents the average of the three highest years of earnings over a member’s career for Groups A and B� Group C is based on the average of the five highest years of earnings over a member’s career� Refer to the age-and-service tables located in the Plan Statement beginning on page 213 for additional information regarding the requirements for reduced and unreduced benefits� Members who retire before meeting the age and years of service credit requirement for unreduced benefit receive a percentage reduction in the benefit amount� The base amount of a member’s pension benefit is locked in upon receipt of the initial benefit payment for calculation of annual cost-of-living adjustment�
Effective January 1, 2001, House Bill 416 divided the OPERS Law Enforcement Program into two separate divisions: Law Enforcement and Public Safety� Both groups of members, as defined in ORC Chapter 145, are eligible for special retirement options under the Traditional Pension Plan and are not eligible to participate in the Member-Directed Plan or Combined Plan� Public Safety members may file an application for full retirement benefits at age 48 or older with 25 or more years of credited service or 52 or older with 15 or more years of credited service for Groups A and B� Public Safety Group C is eligible for benefits at age 52 or older with 25 years or at age 56 or older with 15 years� Those members classified as Law Enforcement officers are eligible for full retirement at age 52 or older with 15 or more years of credited service for Group A� Law Enforcement Group B is eligible at age 48 or older with 25 years or at age 52 or older with 15 years of service� Law Enforcement Group C is eligible at age 48 or older with 25 years of service or at age 56 with 15 years of service� Annual benefits under both divisions are calculated by multiplying 2�5% of FAS by the actual years of service for the first 25 years of service credit, and 2�1% of FAS for each year of service over 25 years� These options also permit early retirement under qualifying circumstances as early as age 48 with a reduced benefit�

The Comprehensive Annual Financial Report 2015 OPERS 45
Financial Section Notes to Combining Financial Statements
Prior to 2000, payments to OPERS benefit recipients were limited under Section 415(b) of the IRC� OPERS entered into a Qualified Excess Benefit Arrangement (QEBA) with the IRS to allow OPERS benefit recipients to receive their full statutory benefit even when the benefit exceeds IRC 415(b) limitations� Monthly QEBA payments start when the total amount of benefits received by the recipients exceeds the IRC limit each year� The portion of the benefit in excess of the IRC 415(b) limit is paid out of the QEBA and taxed as employee payroll in accordance with IRS regulations�
Benefits in the Combined Plan consist of both an age-and-service formula benefit (defined benefit) and a defined contribution element� The defined benefit element is calculated on the basis of age, FAS, and years of service� Eligibility regarding age and years of service in the Combined Plan is the same as the Traditional Pension Plan� The benefit formula for the defined benefit component of the plan for State and Local members in transition Groups A and B applies a factor of 1�0% to the member’s FAS for the first 30 years of service� A factor of 1�25% is applied to years of service in excess of 30� The benefit formula for transition Group C applies a factor of 1�0% to the member’s FAS for the first 35 years of service and a factor of 1�25% is applied to years in excess of 35� Persons retiring before age 65 with less than 30 years of service credit receive a percentage reduction in benefit� The defined contribution portion of the benefit is based on accumulated member contributions plus or minus any investment gains or losses on those contributions�
• Defined Contribution Benefits—Defined contribution plan benefits are established in the plan documents, which may be amended by the Board� Member-Directed Plan and Combined Plan members who have met the retirement eligibility requirements may apply for retirement benefits� The amount available for defined contribution benefits in the Combined Plan consists of the member’s contributions plus or minus the investment gains or losses resulting from the member’s investment selections� Combined Plan members wishing to receive benefits must meet the requirements for both the defined benefit and defined contribution plans� Member-Directed participants must have attained the age of 55, have money on deposit in the defined contribution plan and have terminated public service to apply for retirement benefits� The amount available for defined contribution benefits in the Member-Directed Plan consists of the members’ contributions, vested employer contributions and investment gains or losses resulting from the members’ investment selections� Employer contributions and associated investment earnings vest over a five-year period, at a rate of 20% each year� At retirement, members may select one of several distribution options for payment of the vested balance of their individual OPERS accounts� Options include the purchase of a monthly defined benefit annuity from OPERS (which includes joint and survivor options), partial lump-sum payments (subject to limitations), a rollover of the vested account balance to another financial institution, receipt of entire account balance, net of taxes withheld, or a combination of these options�
• Early Retirement Incentive Plan (ERIP)—Employers under OPERS may establish an early retirement incentive plan by purchasing service credit for eligible employees� To be eligible, employees must be able to retire under existing plan provisions after the purchase of the additional credit� Electing employers must contribute all such additional costs as are actuarially determined to fund the benefit� Such a plan, if adopted by an employer, must be offered to a minimum of 5% of covered employees, and may provide for the purchase of up to five years of service credit, limited to a maximum of 20% of the member’s total service credit� Members electing to participate in the employer’s plan must retire within 90 days of receiving notice of the purchased service or the service is withdrawn and refunded to the employer�
OPERS The Comprehensive Annual Financial Report 201546
Employers offering an ERIP may choose to pay the full cost of the additional benefits at the time the plan is adopted, or elect an installment payment plan� The required contributions are recognized in full by OPERS in the year in which the payment plan becomes effective� In addition, interest is charged annually on the unpaid balance�
• Disability Benefits—OPERS administers two disability plans for participants in either the Traditional Pension Plan or Combined Plan� Members in the plan as of July 29, 1992, could elect, by April 7, 1993, coverage under either the original plan or the revised plan� All members who entered the System after July 29, 1992, are automatically covered under the revised plan� Under the original plan, a member who becomes disabled before age 60 and has completed 60 contributing months is eligible for a disability benefit� Benefits are funded by the employee and employer contributions and terminate if the member is able to return to work� The revised plan differs in that a member who becomes disabled at any age with 60 contributing months will be eligible for disability benefits until a determined age� The benefit is funded by reserves accumulated from employer contributions� After the disability benefit ends, the member may apply for a service retirement benefit or a refund of contributions, which are not reduced by the amount of disability benefits received� Law Enforcement officers are immediately eligible for disability benefits if disabled by an on-duty illness or injury� Members participating in the Member-Directed Plan are not eligible for disability benefits�
• Survivor Benefits —Dependents of deceased members who participated in either the Traditional Pension Plan or the Combined Plan may qualify for survivor benefits if the deceased employee had at least one and a half years of service credit with the plan, and at least one quarter year of credit within the two and one-half years prior to the date of death� ORC Chapter 145 specifies the dependents and the conditions under which they qualify for survivor benefits� Law Enforcement and Public Safety personnel are eligible for survivor benefits immediately upon employment�
• Health Care Coverage—The ORC permits, but does not require, OPERS to offer post-employment health care coverage (OPEB)� The ORC allows a portion of the employers’ contributions to be used to fund health care coverage� OPERS maintains a 401(h) Health Care Trust established under IRC Section 401(h), to fund health care coverage for the retirees and beneficiaries of the Traditional Pension Plan and Combined Plan� In 2014, OPERS established the 115 Health Care Trust under IRC Section 115 to fund an HRA for Medicare-eligible retirees� Eligible retirees can select a Medicare supplement plan through the OPERS Medicare Connector and will have an allowance deposited to an HRA to be used for reimbursement of eligible health care expenses, starting with January 2016 premium reimbursements� Prior to January 1, 2015, the System provided comprehensive health care coverage to retirees with 10 or more years of qualifying service credit and offered coverage to their dependents on a premium deduction or direct bill basis� Beginning January 1, 2015, the service eligibility criteria for health care coverage increased from 10 years to 20 years with a minimum age of 60, or 30 years of qualifying service at any age� Coverage includes hospitalization, medical expenses, prescription drugs, and reimbursement of monthly Medicare premiums� The System determines the amount, if any, of the associated health care costs that will be absorbed by the System and attempts to control costs by using managed care, case management, disease management, and other programs� Additional details on health care coverage can be found in the Plan Statement beginning on page 213�
Participants in the Member-Directed Plan are not eligible for health care coverage under the health care plans funded through the 401(h) or 115 trusts� A portion of employer contributions for these participants is allocated to a RMA funded through the VEBA Trust established under
Notes to Combining Financial Statements Financial Section

The Comprehensive Annual Financial Report 2015 OPERS 47
Financial Section Notes to Combining Financial Statements
IRC 501(c)(9)� Upon separation or retirement, participants may be reimbursed for qualified medical expenses from their RMA funds�
• Other Benefits—Once a benefit recipient retiring under the Traditional Pension Plan has received benefits for 12 months, an annual 3% cost-of-living adjustment is provided on the member’s base benefit� Members retiring under the Combined Plan receive a 3% cost-of-living adjustment on the defined benefit portion of their benefit� A death benefit of $500-$2,500, determined by the number of years of service credit of the retiree, is paid to the beneficiary of a deceased retiree or disability benefit recipient under the Traditional Pension Plan and Combined Plan� Death benefits are not available to beneficiaries of Member-Directed Plan participants�
• Money Purchase Annuity—Age-and-service retirees who become re-employed in an OPERS-covered position must contribute the regular contribution rates, which are applied toward a money purchase annuity� The money purchase annuity calculation is based on the accumulated contributions of the retiree for the period of re-employment, and an amount of the employer contributions determined by the Board� Upon termination of service, members over the age of 65 can elect to receive a lump-sum payout or a monthly annuity� Members under age 65 may leave the funds on deposit with OPERS to receive an annuity benefit at age 65, or may elect to receive a refund of their employee contributions made during the period of re-employment, plus interest�
• Refunds—Members who have terminated service in OPERS-covered employment may file an application for refund of their account� The ORC requires a three-month waiting period after service termination before the refund may be paid� The acceptance of a refund payment cancels the individual’s rights and benefits in OPERS�
Refunds processed for Traditional Pension Plan members include the member’s accumulated contributions, interest and any qualifying employer funds� A Combined Plan member’s refund may consist of member contributions for the purchase of service plus interest, qualifying employer funds, and the value of their account in the defined contribution plan consisting of member contributions adjusted by the gains or losses incurred based on their investment selections� Refunds paid to participants in the Member-Directed Plan include member contributions and vested employer contributions adjusted by the gains or losses incurred based on their investment selections�
c. Contributions—The OPERS funding policy provides for periodic employee and employer contributions to all three plans (Traditional Pension, Combined and Member-Directed) at rates established by the Board, subject to limits set by statute� The rates established for member and employer contributions were approved based upon the recommendations of the System’s actuary� All contribution rates were within the limits authorized by the ORC�
Member and employer contribution rates, as a percent of covered payroll, were the same for each covered group across all three plans for the year ended December 31, 2015� Within the Traditional Pension Plan and Combined Plan, member and employer contributions (employer contributions only for the Combined Plan) and an actuarially determined rate of return are adequate to accumulate sufficient assets to pay defined benefits when due� Employee contributions within the Combined Plan are not used to fund the defined benefit retirement allowance� Employer contribution rates as a level percent of payroll dollars are determined using the entry age actuarial funding method� This formula determines the amount of contributions necessary to fund: (1) the current service cost, representing the estimated amount necessary to pay for defined benefits earned by the employees during the current service year; and (2) the prior service cost for service earned prior to the current year and subsequent benefit increases� These contributions represent

OPERS The Comprehensive Annual Financial Report 201548
the amount necessary to fund accrued liabilities for retirement allowances and survivor benefits over a period of time� The annual employer contributions reported for the Traditional Pension Plan for 2015 were $1,498,679,737� Employer contributions for the Combined Plan for 2015 were $44,022,120� Employers satisfied 100% of the contribution requirements�
The following table displays the employee and employer contribution rates as a percent of covered payroll for each division for 2015� Based upon the recommendation of the System’s actuary, a portion of each employer’s contribution to OPERS is set aside for the funding of post-employment health care coverage� The portion of Traditional Pension Plan and Combined Plan employer contributions allocated to health care was 2�0% for 2015� Beginning in October 2014, the Board approved the funding of VEBA Trust participant RMAs using the reserves in the VEBA Trust rather than the allocation of employer contributions� Instead, employer contributions were allocated to the Member-Directed Plan to repay the original plan start-up and administrative costs� The percent of covered payroll deposited to the RMAs from VEBA Trust reserves for participants in the Member-Directed Plan for 2015 was 4�5%�
Board of Trustees—Approved Contribution Rates—All Plans
2015 Employee Rate 2015 Employer Rate
State Division 10�00% 14�00%
Local Division 10�00 14�00
Law Enforcement Division 13�00 18�10
Public Safety Division 12�00 18�10
The employee and employer contribution rates for the State and Local divisions are currently set at the maximums authorized by the ORC of 10% and 14%, respectively� The Public Safety and Law Enforcement employer rates are also set at the maximum authorized rate of 18�1%� The employee Public Safety rate is determined by the Board and has no maximum rate established by the ORC� The employee rate for Law Enforcement members is also determined by the Board, but is limited by the ORC to not more than 2% greater than the Public Safety rate�
ORC Chapter 145 assigns authority to the Board to amend the funding policy� As of December 31, 2015, the Board adopted the contribution rates that were recommended by the actuary� The contribution rates were included in a funding policy adopted by the Board in October 2013, and are certified periodically by the Board as required by the ORC�
As of December 31, 2015, the date of the last pension actuarial study, the funding period for all defined benefits of the System was 19 years�
d. Federal Subsidies —OPERS participates in several federal programs that subsidize or provide reimbursements to the 401(h) Trust or the 115 Trust� Medicare Part D is a federal program that reimburses 28% of the cost of prescription drugs for Medicare beneficiaries in the United States� During 2011, OPERS implemented a prescription drug plan (PDP) in which the System receives a direct subsidy from the Centers for Medicare & Medicaid Services based on the risk score of each eligible retiree� Depending on circumstances, retirees are placed either with the Medicare Part D program or with the PDP plan�
The table on the next page summarizes the various federal subsidies received by OPERS for the year ended December 31, 2015�
Notes to Combining Financial Statements Financial Section

The Comprehensive Annual Financial Report 2015 OPERS 49
Financial Section Notes to Combining Financial Statements
Federal Subsidy Received (for the year ended December 31, 2015)
115 Health Care Trust
Medicare Part D Retiree Drug Subsidy $743,345
Medicare Prescription Drug Plan 175,187,530
Total Federal Subsidy $175,930,875
e. Commitments and Contingencies—OPERS has committed to fund various private equity and closed-end real estate investments totaling approximately $6�9 billion at December 31, 2015� The expected funding dates for these commitments extend through 2021� OPERS is a party in various lawsuits relating to plan benefits and investments� While the final outcome cannot be determined at this time, management is of the opinion that the liability, if any, for these legal actions will not have a material adverse effect on OPERS financial position�
2. Summary of Significant Accounting Policies
The following are the significant accounting policies followed by OPERS for all pension and health care plans:
a. Basis of Accounting—The financial statements are prepared using the accrual basis of accounting under which deductions are recorded when the liability is incurred and revenues are recognized when earned� Pension benefit payments are due the first day of the month following the retirement of a member, and the first of each month thereafter� Refunds, for any member who makes a written application to withdraw his/her contributions, are payable three months after termination of the member’s OPERS-covered employment� Benefits and refunds are recognized when due and payable in accordance with the terms of the plan� Additions to the plans consist of contributions (member and employer), health care reimbursements, federal health care subsidies, other contracts and receipts, interplan activities, net investment income, and other miscellaneous income� Contributions are recorded in the period the related salaries are earned and become measurable pursuant to formal commitments, statutory or contractual requirements� Accordingly, both member and employer contributions for the year ended December 31, 2015 include year-end accruals based upon estimates derived from subsequent payment activity and historical payment patterns� Member and employer contributions are due 30 days after the month in which salaries are earned based on pay period end date� Health care reimbursements are recognized when they become measurable and due to OPERS based on contractual requirements� Therefore, health care reimbursements contain estimates based on information received from health care vendors and other sources� Plan changes, settlement activity and other interplan activity are recorded as an addition or deduction based on the nature of the transaction, when the transaction occurs� Investment purchases and sales are recorded as of their trade date�
The accounting and reporting policies of OPERS conform to accounting principles generally accepted in the United States of America (referred to as GAAP) as applicable to government organizations� The preparation of financial statements in conformity with GAAP requires management to make estimates and assumptions that affect the reported amounts of assets and liabilities, and to disclose contingent assets and liabilities at the date of the financial statements, and the reported amounts of revenue and expenses during the reporting period� Actual results could differ from those estimates�
GASB Statement No� 63 (GASB 63), Financial Reporting of Deferred Outflows of Resources, Deferred Inflows of Resources, and Net Position, introduces and defines these elements as a consumption or acquisition of net position that is applicable to a future reporting period�

OPERS The Comprehensive Annual Financial Report 201550
These transactions are distinct from assets and liabilities, and result in the redefinition of net assets to the concept of net position� Because the total net position includes both statutory pension benefits and discretionary health care coverage, OPERS discloses the System’s total net position as Net Position Held in Trust for Pension Benefits and Post-employment Health Care� GASB 63 was implemented for the year ended December 31, 2012�
GASB Statement No� 64 (GASB 64), Derivative Instruments: Application of Hedge Accounting Termination Provisions–an amendment of GASB Statement 53, establishes criteria for when an effective hedging relationship continues and hedge accounting should continue to be applied� GASB 64 was implemented for the year ended December 31, 2012�
The GASB issued Statement No� 67 (GASB 67), Financial Reporting for Pension Plans–an amendment of GASB Statement No. 25, establishing additional financial reporting by state and local government pension plans� GASB 67 replaces the requirements of Statements No� 25 (GASB 25), Financial Reporting for Defined Benefit Pension Plans and Note Disclosures for Defined Contribution Plans, and No� 50 (GASB 50), Pension Disclosures—an amendment of GASB Statements No. 25 and No. 27, related to pension plans that are administered through trusts or equivalent arrangements� The requirements of Statements No� 25 and 50 remain applicable to pension plans that are not administered through trusts or equivalent arrangements� GASB 67 was implemented for the year ended December 31, 2014� Note 8, beginning on page 66, and the Required Supplementary Information, beginning on page 70, contain the majority of the changes related to the implementation of GASB 67� These changes eliminate the requirement that defined benefit pension plan funding status tables be included within the Required Supplementary Information section� This information has been moved to the Actuarial Section of this document�
OPERS is a cost-sharing, multiple-employer pension plan as defined by GASB 67� The requirements for GASB 67 include changes in presentation of the financial statements, notes to the financial statements, and required supplementary information of state and local pension plans established as trusts� The new accounting and reporting standards break the link between accounting and funding� While these changes affect the accounting measures, they do not have an effect on the actuarial methods and assumptions used by OPERS to determine the employer contributions needed to fund the plan� The new standard does, however, impact the financial statement presentation for pension accounting and related disclosures for OPERS and participating employers (refer to GASB 68 information below)�
GASB 67 and GASB Statement No� 43 (GASB 43), Financial Reporting for Postemployment Benefit Plans Other than Pension Plans, require that the three pension plans (Traditional Pension Plan, Member-Directed Plan and Combined Plan) and the three health care trusts (401(h) Health Care Trust, 115 Health Care Trust and VEBA Trust) be shown separately in the combining financial statements as they each are legally separate plans and trusts� To meet this requirement, plan assets and liabilities, where possible, were specifically identified to a plan or health care trust� Assets and liabilities that were not specifically identifiable to a plan or health care trust were allocated based on calculations and projection formulas that take into account daily investment returns, daily plan cash inflows and outflows, and analysis and allocation of administrative expenses�
The GASB also issued Statement No� 68 (GASB 68), Accounting and Financial Reporting for Pensions—an amendment of GASB Statement No. 27, and Statement No� 71, Pension Transition for Contributions Made Subsequent to the Measurement Date—an amendment of GASB Statement No. 68� These statements are effective for state and local governmental employers that sponsor or contribute to pension plans for fiscal years beginning after June 15, 2014� Several elements required by GASB 68 are defined in GASB 67 and are calculated by OPERS and the OPERS
Notes to Combining Financial Statements Financial Section

The Comprehensive Annual Financial Report 2015 OPERS 51
external actuaries� Information needed by OPERS participating employers to report under these statements is compiled in separate audited schedules of employer allocations and collective pension totals, including related footnotes to those schedules� The schedule of collective pension totals includes net pension liability, pension expense and deferred inflows/outflows related to pension as defined in GASB 68�
The GASB issued Statement No� 69 (GASB 69), Government Combinations and Disposals of Government Operations, applying to all state and local government entities� GASB 69 establishes accounting and financial reporting standards for mergers, acquisitions and transfers of operations (that is, government combinations)� This statement also provides guidance on how to determine the gain or loss on a disposal of government operations� The requirements of GASB 69 should be applied prospectively and are effective for government combinations and disposals of government operations occurring in financial reporting periods beginning after December 15, 2013� Since OPERS did not incur this type of activity during the year, this statement has no impact on this report�
The GASB also issued Statement No� 70 (GASB 70), Accounting and Financial Reporting for Nonexchange Financial Guarantees. GASB 70 establishes accounting and financial reporting standards for situations where a state or local government, as a guarantor, agrees to indemnify a third-party obligation holder under specified conditions (that is, nonexchange financial guarantees)� The issuer of the guaranteed obligation can be a legally separate entity or individual, including a blended or discretely presented component unit� Guidance is provided for situations where a state or local government extends or receives a nonexchange financial guarantee� The requirements of this statement are effective for financial statements for reporting periods beginning after June 15, 2013� Since OPERS did not incur this type of activity during the year, this statement has no impact on this report�
The GASB issued Statement No� 72 (GASB 72), Fair Value Measurement and Application. GASB 72 addresses accounting and financial reporting related to fair value measurements of assets and liabilities� Guidance is provided around valuation techniques to measure fair value and extensive disclosures will be required around the hierarchy of inputs to valuation techniques used to measure fair value as established by the statement� Since the statement generally requires investments to be measured at fair value, the impact to OPERS financial statements is expected to be minimal� However, the investment-related notes to the combining financial statements will need to be significantly enhanced to comply with this new standard� The requirements of GASB 72 are effective for financial statements for periods beginning after June 15, 2015, resulting in planned initial implementation in the OPERS 2016 CAFR�
The GASB recently issued Statement No� 73 (GASB 73), Accounting and Financial Reporting for Pensions and Related Assets That Are Not within the Scope of GASB Statement 68, and Amendments to Certain Provisions of GASB Statements 67 and 68. Among other requirements not applicable to OPERS, this statement clarifies the application of certain provisions of GASB 67 and 68� GASB 73 clarifies information required to be presented as notes to the 10-year schedules of required supplementary information about investment-related factors that significantly affect trends in the amounts reported over which the pension plan has influence (for example, changes in investment policies)� The provisions of this statement applicable to amendments of GASB 67 and 68 are effective for fiscal years beginning after June 15, 2015, resulting in initial implementation in the OPERS 2016 CAFR�
Financial Section Notes to Combining Financial Statements

OPERS The Comprehensive Annual Financial Report 201552
GASB also recently issued Statement No� 74 (GASB 74), Financial Reporting for Postemployment Benefit Plans Other Than Pension Plans. In conjunction with GASB 74, the GASB issued Statement No� 75 (GASB 75), Accounting and Financial Reporting for Postemployment Benefits Other than Pensions. GASB 74 and 75 result from a comprehensive review of the standards of accounting and financial reporting for all postemployment benefits (pensions and OPEB)� While GASB 67 and 68 address fundamental changes to accounting and financial reporting of pensions by both the pension systems and participating employers, GASB 74 and 75 address very similar changes in requirements for these same parties in regards to OPEB, or health care, provided by OPERS to qualifying retirees and beneficiaries� These requirements involve changes in presentation of the financial statements, notes to the financial statements, and required supplementary information of state and local health care plans established as trusts�
GASB 74 replaces GASB 43 and Statement No� 57, OPEB Measurements by Agent Employees and Agent Multiple-Employer Plans� It also includes requirements for defined contribution OPEB plans that replace the requirements for those OPEB plans in GASB 25, GASB 43, and GASB 50� GASB 75 replaces Statements No� 45, Accounting and Financial Reporting by Employers for Postemployment Benefits Other Than Pensions, as amended, and GASB 57�
GASB 74 is effective for OPEB systems for fiscal years beginning after June 15, 2016, resulting in initial implementation in the OPERS 2017 CAFR� GASB 75 is effective for OPERS participating employers for fiscal years beginning after June 15, 2017, resulting in initial implementation for employers generally in 2018 annual reports� These new accounting and reporting standards also break the link between accounting and funding, similar to GASB 67 and 68� While these changes will affect the accounting measures, they do not have an effect on the actuarial methods and assumptions used by OPERS to determine the employer contributions needed to fund health care� The new standards will, however, impact the financial statement presentation for health care accounting and related disclosures for OPERS and participating employers�
GASB Statement No� 76, The Hierarchy of Generally Accepted Accounting Principles for State and Local Governments, is effective for reporting periods beginning after June 15, 2015� This statement supersedes Statement No� 55, The Hierarchy of Generally Accepted Accounting Principles for State and Local Governments� The requirements in this statement raise the category of GASB Implementation Guides in the GAAP hierarchy, emphasize the use of analogies to authoritative literature when accounting treatment for an event is not specified in GAAP, and require the consideration of consistency with the GASB Concept Statements when evaluating accounting treatments specified in nonauthoritative literature� This statement is not expected to have a material impact on OPERS financial statements as OPERS is consistently using GASB implementation guides and does not frequently encounter events not specified in GAAP or where treatment is specified in nonauthoritative literature�
The GASB issued Statement No� 77, Tax Abatement Disclosures, in 2015� This statement is effective for reporting periods beginning after December 15, 2015, but is not applicable to OPERS as the System does not have any tax abatement activity�
The GASB issued Statement No� 78, Pensions Provided through Certain Multiple-Employer Defined Benefit Plans, in December 2015� This statement amends the scope and applicability of GASB 68 to exclude certain pensions that are not solely associated with state or local government plans and employees of state or local government employers� This statement does not apply to OPERS�
The GASB issued GASB Statement No� 79, Certain External Investment Pools and Pool Participants, in December 2015� This statement addresses accounting and financial reporting for certain external investment pools and pool participants, specifically establishing criteria for these
Notes to Combining Financial Statements Financial Section

The Comprehensive Annual Financial Report 2015 OPERS 53
pools to qualify for measurement at amortized cost� This statement is effective for reporting periods beginning after December 15, 2015� OPERS is currently evaluating this statement with initial implementation planned for the December 31, 2016 annual report�
GASB Statement No� 80, Blending Requirements for Certain Component Units —an amendment of GASB Statement No. 14, was issued in January 2016� This statement is not applicable to OPERS as the System is not a component unit of a state or local government, or part of a primary government that reports component units�
GASB Statement No� 81, Irrevocable Split-Interest Agreements, was issued in March 2016� This statement is not applicable to OPERS as the System does not have these types of agreements�
Finally, GASB Statement No� 82, Pension Issues—an amendment of GASB Statements No. 67, No. 68 and No. 73, was issued in March 2016� This statement addresses issues regarding: 1) the presentation of payroll-related measures in required supplementary information; 2) the selection of assumptions and the treatment of deviations from the guidance in an actuarial standard of practice for financial reporting purposes; and 3) the classification of payments made by employers to satisfy employee (member) contribution requirements� This statement does not have an impact on the OPERS financial statements, notes, or required supplementary information in this document, as OPERS is currently presenting, selecting and classifying this information in accordance with the requirements of the statement�
b. Investments—OPERS is authorized by ORC Section 145�11 to invest under a prudent person standard and does so through an investment policy established by the Board� ORC 145�11 states:
The Board and other fiduciaries shall discharge their duties with respect to the funds solely in the interest of the participants and beneficiaries; for the exclusive purpose of providing benefits to participants and their beneficiaries and defraying reasonable expenses of administering the public employees retirement system; with care, skill, prudence, and diligence under the circumstances then prevailing that a prudent person acting in a like capacity and familiar with these matters would use in the conduct of an enterprise of a like character and with like aims; and by diversifying the investments of the system so as to minimize the risk of large losses, unless under the circumstances it is clearly prudent not to do so�
Member-Directed Plan participants self-direct the investment of both member and employer contributions� Contributions must be invested with an investment manager approved by the Board� Similarly, participants in the Combined Plan self-direct the investment of member contributions� The investment assets for all other plans and trusts are invested under the direction of the OPERS Investment staff in conformance with policies approved by the Board�
All investments are reported at fair value� Fair value is the amount that a plan can reasonably expect to receive for an investment in a current sale between a willing buyer and a willing seller, that is, other than in a forced or liquidation sale� All investments, with the exception of real estate, private equity, and hedge funds are valued based on closing market prices or broker quotes� Securities not having a quoted market price have been valued based on yields currently available on comparable securities of issuers with similar credit ratings� The fair value of real estate investments is based on estimated current values and independent appraisals� The fair value of private equity is based on management’s valuation of estimates and assumptions from information and representations provided by the respective general partners, in the absence of readily ascertainable market values� The fair value of hedge funds is based on a net asset value, which is struck by the fund or by the fund’s third-party administrator�
Financial Section Notes to Combining Financial Statements
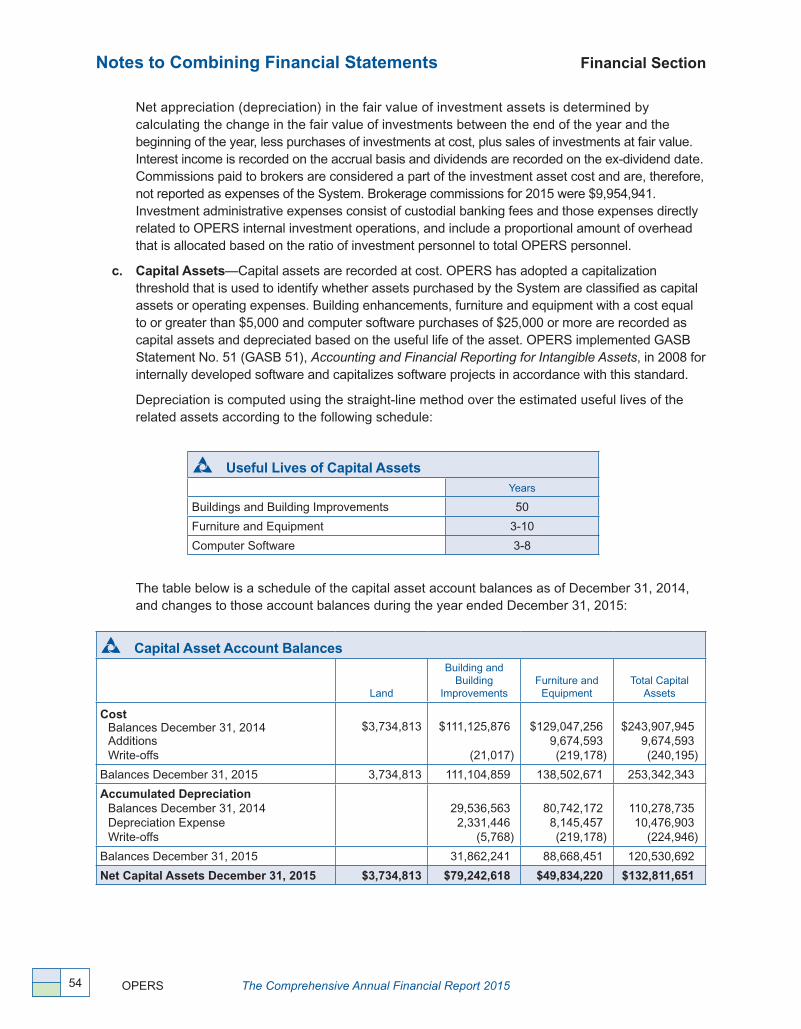
OPERS The Comprehensive Annual Financial Report 201554
Net appreciation (depreciation) in the fair value of investment assets is determined by calculating the change in the fair value of investments between the end of the year and the beginning of the year, less purchases of investments at cost, plus sales of investments at fair value� Interest income is recorded on the accrual basis and dividends are recorded on the ex-dividend date� Commissions paid to brokers are considered a part of the investment asset cost and are, therefore, not reported as expenses of the System� Brokerage commissions for 2015 were $9,954,941� Investment administrative expenses consist of custodial banking fees and those expenses directly related to OPERS internal investment operations, and include a proportional amount of overhead that is allocated based on the ratio of investment personnel to total OPERS personnel�
c. Capital Assets —Capital assets are recorded at cost� OPERS has adopted a capitalization threshold that is used to identify whether assets purchased by the System are classified as capital assets or operating expenses� Building enhancements, furniture and equipment with a cost equal to or greater than $5,000 and computer software purchases of $25,000 or more are recorded as capital assets and depreciated based on the useful life of the asset� OPERS implemented GASB Statement No� 51 (GASB 51), Accounting and Financial Reporting for Intangible Assets, in 2008 for internally developed software and capitalizes software projects in accordance with this standard�
Depreciation is computed using the straight-line method over the estimated useful lives of the related assets according to the following schedule:
Useful Lives of Capital AssetsYears
Buildings and Building Improvements 50
Furniture and Equipment 3-10
Computer Software 3-8
The table below is a schedule of the capital asset account balances as of December 31, 2014, and changes to those account balances during the year ended December 31, 2015:
Capital Asset Account Balances
Land
Building and Building
ImprovementsFurniture and
EquipmentTotal Capital
Assets
CostBalances December 31, 2014AdditionsWrite-offs
$3,734,813 $111,125,876
(21,017)
$129,047,256 9,674,593 (219,178)
$243,907,945 9,674,593 (240,195)
Balances December 31, 2015 3,734,813 111,104,859 138,502,671 253,342,343
Accumulated DepreciationBalances December 31, 2014Depreciation ExpenseWrite-offs
29,536,563 2,331,446
(5,768)
80,742,172 8,145,457 (219,178)
110,278,735 10,476,903
(224,946)
Balances December 31, 2015 31,862,241 88,668,451 120,530,692
Net Capital Assets December 31, 2015 $3,734,813 $79,242,618 $49,834,220 $132,811,651
Notes to Combining Financial Statements Financial Section
The Comprehensive Annual Financial Report 2015 OPERS 55
d. Undistributed Deposits—Cash receipts are recorded as undistributed deposits until they are allocated to employer receivables, member contributions, miscellaneous or investment income�
e. Federal Income Tax Status—OPERS is a qualified plan under Section 401(a) of the IRC and is exempt from federal income taxes under Section 501(a)�
f. Funds—In accordance with the ORC and IRS regulations, various funds have been established to account for the reserves held for future and current payments� Statutory and IRS-mandated funds within each of the three pension plans are described below:
Traditional Pension Plan
• TheEmployees’SavingsFund—represents member contributions held in trust pending their refund or transfer to a benefit disbursement fund� Upon an employee’s refund or retirement, such employee’s account is credited with an amount of interest (statutory interest) on the employee’s contributions based on a Board approved rate, which currently ranges from 1% to 4%� Employees eligible for a refund also receive additional funds from the Employers’ Accumulation Fund, if qualified� The ORC Chapter 145 requires statutory interest to be compounded annually�
• TheEmployers’AccumulationFund—is used to accumulate employer contributions to be used in providing the reserves required for transfer to the Annuity and Pension Reserve Fund as members retire or become eligible for disability benefits, and to the Survivors’ Benefit Fund for benefits due dependents of deceased members�
• TheEmployers’AccumulationHealthCareFund(IRC401h)—is used to accumulate employer contributions to be used in providing the reserves required for transfer to the Annuity and Pension Reserve and Survivors’ Benefit funds for health care coverage paid for retirees and eligible dependents of deceased members�
• TheEmployers’AccumulationHealthCareFund(IRC115)—is used to accumulate employer contributions to be used in providing the reserves required for transfer to the Annuity and Pension Reserve and Survivors’ Benefit funds, similar to the IRC 401(h) fund, for monthly deposits to an HRA for Medicare-eligible retirees and eligible dependents of deceased members, under the new Connector program� For additional information, refer to page 42�
• TheAnnuityandPensionReserveFund—is the fund from which retirement allowances that do not exceed the IRC 415(b) limitations, and health care coverage are paid� This reserve was fully funded for pension benefits according to the latest actuarial study dated December 31, 2015� Accordingly, sufficient assets are available in this fund to pay the vested pension benefits of all retirees and beneficiaries as of the valuation date�
• TheSurvivors’BenefitFund—is the fund from which benefits due dependents of deceased members of the System that do not exceed the IRC 415(b) limitations are paid� This fund also was fully funded in relation to vested pension benefits as of December 31, 2015�
• QualifiedExcessBenefitArrangement(QEBA)Fund—is the fund from which annuity, disability and survivors’ benefits are paid when the recipient exceeds the IRC 415(b) limits� This reserve is funded by employer contributions; therefore, it is fully funded�
• TheIncomeFund—is the fund credited with all investment earnings and miscellaneous income� Annually, the balance in this fund is transferred to other funds to aid in the funding of future benefit payments and administrative expenses�
• TheExpenseFund—provides for the payment of administrative expenses with the necessary monies allocated to it from the Income Fund�
Financial Section Notes to Combining Financial Statements
56 OPERS The Comprehensive Annual Financial Report 2015
Member-Directed Plan
• The Defined Contribution Fund—represents member and employer contributions held in trust pending their refund or commencement of benefit payments� Members self-direct the investment of these funds� Employer funds vest with the member over a five-year period at a rate of 20% per year�
• TheAnnuityandPensionReserveFund—is the fund from which purchased annuity benefits are paid� Upon retirement, Member-Directed participants may elect to liquidate their defined contribution accounts to purchase a defined benefit annuity� The value of the annuity is based on the value of the defined contribution account at the time of liquidation�
• TheIncomeFund—is the fund credited with all investment earnings, account fees, and miscellaneous income� The balance in this fund is used to fund the gains or losses incurred by participants and to fund the administrative expenses of the Member-Directed Plan�
• TheExpenseFund—provides for the payment of administrative expenses with the necessary monies allocated to it from the Income Fund�
• TheVoluntaryEmployees’BeneficiaryAssociationTrust—is the fund used to accumulate employer contributions in participants’ retiree medical accounts� The effective date of the VEBA Trust coincides with the effective date of the Member-Directed Plan� Accordingly, since January 1, 2003, a portion of employer contributions made on behalf of members electing to participate in the Member-Directed Plan has been deposited to the VEBA Trust� Beginning in October 2014, the Board approved the funding of VEBA Trust participant RMAs using the reserves in the VEBA Trust rather than the allocation of employer contributions� Instead, employer contributions were allocated to the Member-Directed Plan to repay the original plan start-up and administrative costs�
Upon termination or retirement, Member-Directed participants can use vested RMA funds for reimbursement of qualified medical expenses� Members who elect the Member-Directed Plan after July 1, 2015 will vest over 15 years at a rate of 10% each year starting with the sixth year of participation� Members who elected the Member-Directed Plan prior to July 1, 2015, vest over a five-year period at a rate of 20% per year� Refer to the Plan Statement on page 226 for details on the vesting schedule�
Combined Plan
• The Defined Contribution Fund—represents member contributions held in trust pending their refund or commencement of benefit payments� Members self-direct the investment of these funds�
• TheEmployees’SavingsFund—represents member deposits for the purchase of service credit held in trust pending their refund or transfer to the plan’s Annuity and Pension Reserve Fund� Upon an employee’s refund or retirement, such employee’s accounts are credited with an amount of interest (statutory interest) on the employee’s deposits based on a Board-approved rate� The interest rate has been 1% since January 1, 2003�
• TheEmployers’AccumulationFund—is used to accumulate employer contributions to be used in providing the reserves required for transfer to the Annuity and Pension Reserve Fund as members retire� Disability and survivor benefits are funded by transfers to Traditional Pension Plan funds, which pay such benefits�
• TheEmployers’AccumulationHealthCareFund(IRC401h)—is used to accumulate employer contributions to be used in providing the reserves required for transfer to the Annuity and Pension Reserve Fund for health care coverage paid for retirees�
Notes to Combining Financial Statements Financial Section
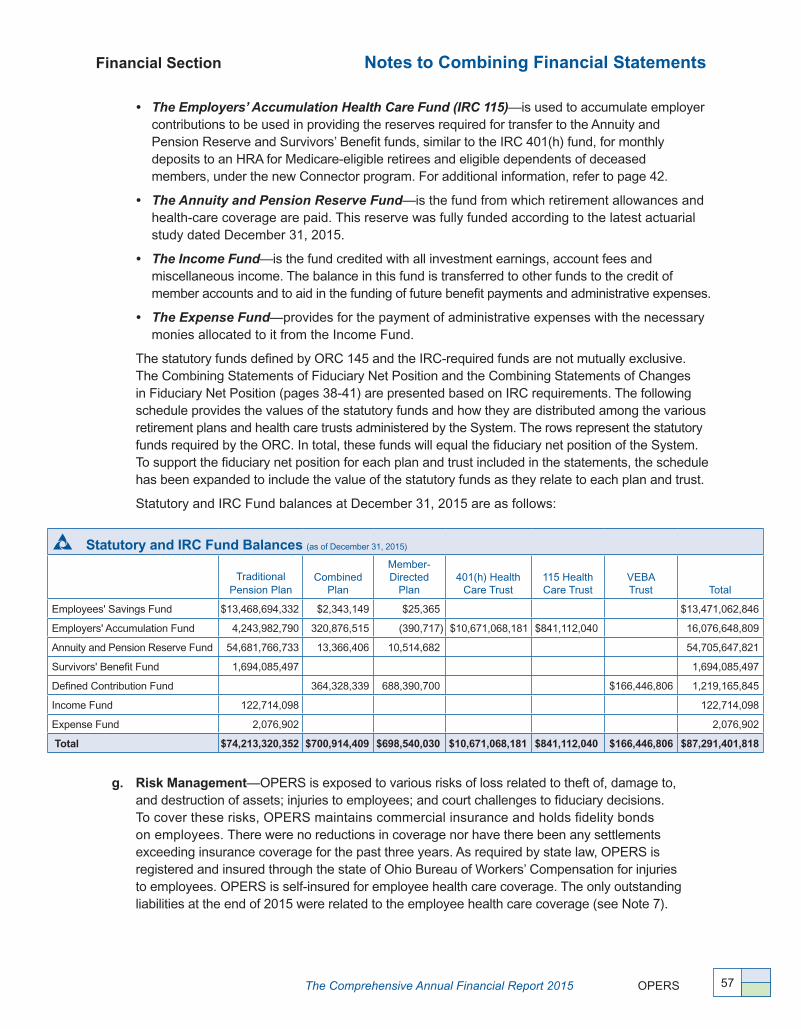
57 The Comprehensive Annual Financial Report 2015 OPERS
Financial Section Notes to Combining Financial Statements
• TheEmployers’AccumulationHealthCareFund(IRC115)—is used to accumulate employer contributions to be used in providing the reserves required for transfer to the Annuity and Pension Reserve and Survivors’ Benefit funds, similar to the IRC 401(h) fund, for monthly deposits to an HRA for Medicare-eligible retirees and eligible dependents of deceased members, under the new Connector program� For additional information, refer to page 42�
• TheAnnuityandPensionReserveFund—is the fund from which retirement allowances and health-care coverage are paid� This reserve was fully funded according to the latest actuarial study dated December 31, 2015�
• TheIncomeFund—is the fund credited with all investment earnings, account fees and miscellaneous income� The balance in this fund is transferred to other funds to the credit of member accounts and to aid in the funding of future benefit payments and administrative expenses�
• TheExpenseFund—provides for the payment of administrative expenses with the necessary monies allocated to it from the Income Fund�
The statutory funds defined by ORC 145 and the IRC-required funds are not mutually exclusive� The Combining Statements of Fiduciary Net Position and the Combining Statements of Changes in Fiduciary Net Position (pages 38-41) are presented based on IRC requirements� The following schedule provides the values of the statutory funds and how they are distributed among the various retirement plans and health care trusts administered by the System� The rows represent the statutory funds required by the ORC� In total, these funds will equal the fiduciary net position of the System� To support the fiduciary net position for each plan and trust included in the statements, the schedule has been expanded to include the value of the statutory funds as they relate to each plan and trust�
Statutory and IRC Fund balances at December 31, 2015 are as follows:
Statutory and IRC Fund Balances (as of December 31, 2015)
TraditionalPension Plan
CombinedPlan
Member-Directed
Plan401(h) Health
Care Trust115 Health Care Trust
VEBATrust Total
Employees' Savings Fund $13,468,694,332 $2,343,149 $25,365 $13,471,062,846
Employers' Accumulation Fund 4,243,982,790 320,876,515 (390,717) $10,671,068,181 $841,112,040 16,076,648,809
Annuity and Pension Reserve Fund 54,681,766,733 13,366,406 10,514,682 54,705,647,821
Survivors' Benefit Fund 1,694,085,497 1,694,085,497
Defined Contribution Fund 364,328,339 688,390,700 $166,446,806 1,219,165,845
Income Fund 122,714,098 122,714,098
Expense Fund 2,076,902 2,076,902
Total $74,213,320,352 $700,914,409 $698,540,030 $10,671,068,181 $841,112,040 $166,446,806 $87,291,401,818
g. Risk Management—OPERS is exposed to various risks of loss related to theft of, damage to, and destruction of assets; injuries to employees; and court challenges to fiduciary decisions� To cover these risks, OPERS maintains commercial insurance and holds fidelity bonds on employees� There were no reductions in coverage nor have there been any settlements exceeding insurance coverage for the past three years� As required by state law, OPERS is registered and insured through the state of Ohio Bureau of Workers’ Compensation for injuries to employees� OPERS is self-insured for employee health care coverage� The only outstanding liabilities at the end of 2015 were related to the employee health care coverage (see Note 7)�
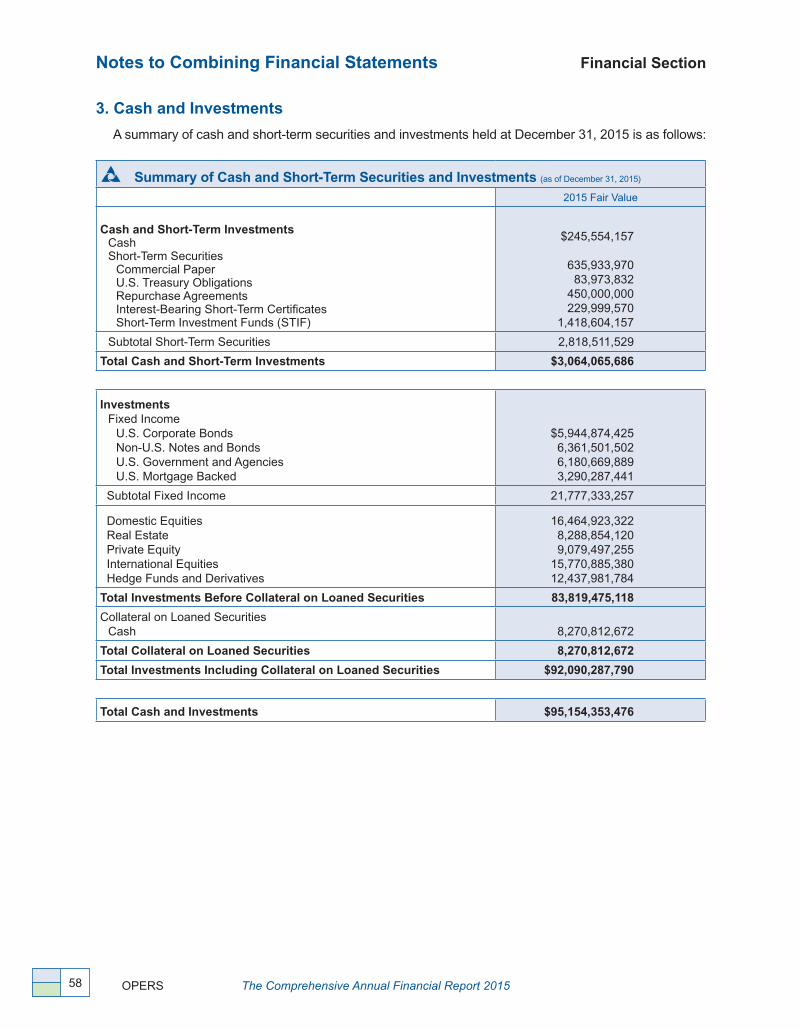
58 OPERS The Comprehensive Annual Financial Report 2015
Notes to Combining Financial Statements Financial Section
3. Cash and Investments
A summary of cash and short-term securities and investments held at December 31, 2015 is as follows:
Summary of Cash and Short-Term Securities and Investments (as of December 31, 2015)
2015 Fair Value
Cash and Short-Term InvestmentsCashShort-Term Securities
Commercial PaperU�S� Treasury ObligationsRepurchase AgreementsInterest-Bearing Short-Term CertificatesShort-Term Investment Funds (STIF)
$245,554,157
635,933,970 83,973,832
450,000,000 229,999,570
1,418,604,157
Subtotal Short-Term Securities 2,818,511,529
Total Cash and Short-Term Investments $3,064,065,686
InvestmentsFixed Income
U�S� Corporate BondsNon-U�S� Notes and BondsU�S� Government and AgenciesU�S� Mortgage Backed
$5,944,874,425 6,361,501,502 6,180,669,889 3,290,287,441
Subtotal Fixed Income 21,777,333,257
Domestic EquitiesReal EstatePrivate EquityInternational EquitiesHedge Funds and Derivatives
16,464,923,322 8,288,854,120 9,079,497,255
15,770,885,380 12,437,981,784
Total Investments Before Collateral on Loaned Securities 83,819,475,118
Collateral on Loaned SecuritiesCash 8,270,812,672
Total Collateral on Loaned Securities 8,270,812,672
Total Investments Including Collateral on Loaned Securities $92,090,287,790
Total Cash and Investments $95,154,353,476
59 The Comprehensive Annual Financial Report 2015 OPERS
Financial Section Notes to Combining Financial Statements
a. Custodial Credit Risk, Deposits—Custodial credit risk for deposits is risk that, in the event of the failure of a depository financial institution, OPERS will not be able to recover its deposits or will not be able to recover collateral securities that are in the possession of an outside party� Balances on deposit are insured by the Federal Deposit Insurance Corporation (FDIC) up to specified limits� Balances in excess of FDIC limits are uninsured� The total amount of cash and cash equivalent balances held by the bank was $189,364,369 at December 31, 2015� OPERS has not experienced any losses in its accounts and believes it is not exposed to a significant credit risk on its cash� OPERS has no formal policy specific to custodial credit risk� These assets are under the custody of the Treasurer of the state of Ohio�
b. Custodial Credit Risk, Investments—Custodial credit risk for investments is the risk that, in the event of the failure of the custodian, OPERS will not be able to recover the value of its investment or collateral securities that are in the possession of the custodian� The Treasurer of the state of Ohio, as custodian, selects the custodian in the name of OPERS or its nominee; thus, OPERS investments are not exposed to custodial credit risk�
c. Credit Risk—Generally, credit risk is the risk that an issuer of an investment will not fulfill its obligation to the holder of the investment� This risk is measured by ratings assigned by a nationally recognized statistical rating organization�
The OPERS Public Fixed Income Policy includes limiting non-investment grade securities to within 15 percentage points of the market value percentage of non-investment grade securities in the Fixed Income Aggregate Benchmark within the Defined Benefit portfolio, 401(h) Health Care Trust portfolio, 115 Health Care Trust portfolio, fixed income components of any target date funds and fixed income funds offered directly to OPERS members� Limitations on holdings of non-investment grade securities are included in portfolio guidelines�
d. Interest Rate Risk—Interest rate risk is the risk that changes in market interest rates will adversely affect the fair value of an investment� Generally, the longer the maturity of an investment, the greater the sensitivity of its fair value to changes in market interest rates� OPERS monitors the interest rate risk inherent in its portfolio by measuring the weighted-average duration of its portfolio� Duration is a measure of a debt investment’s exposure to fair value changes arising from changing interest rates� It uses the present value of cash flows, weighted for those cash flows as a percentage of the investment’s full price� The effective duration measures the sensitivity of the market price to parallel shifts in the yield curve� The OPERS Fixed Income Policy states the average effective duration of all defined benefit, 401(h) Health Care Trust, and 115 Health Care Trust assets must be within 20% of the average effective duration of the benchmark�
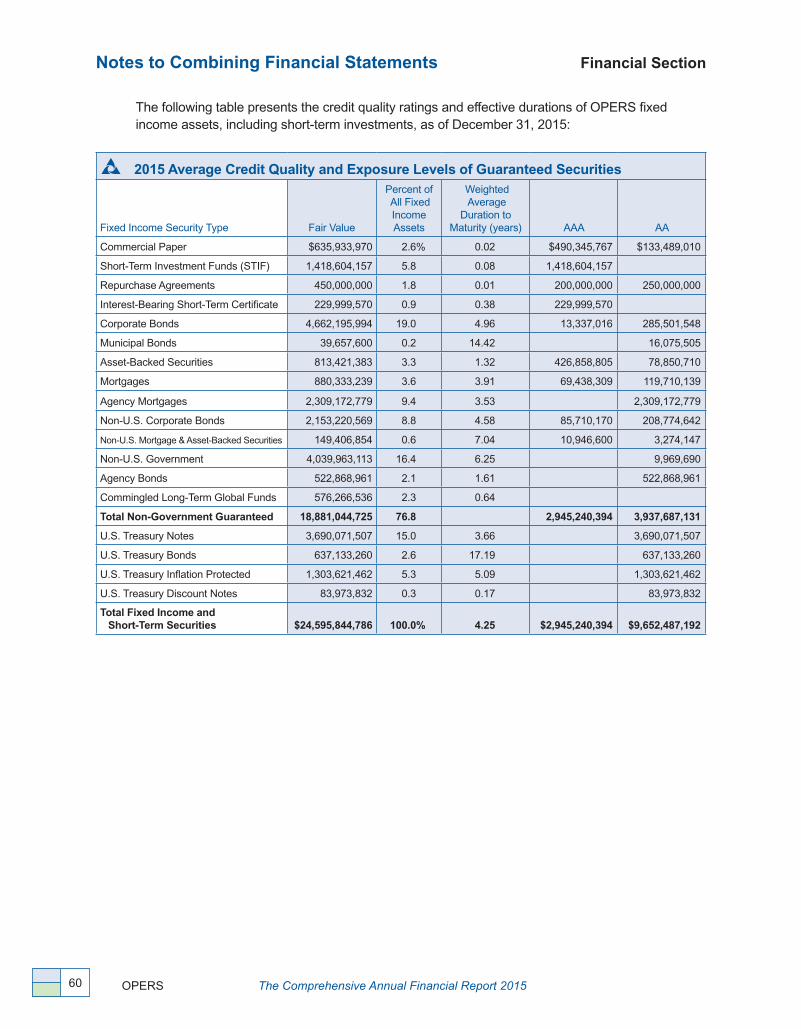
60 OPERS The Comprehensive Annual Financial Report 2015
Notes to Combining Financial Statements Financial Section
2015 Average Credit Quality and Exposure Levels of Guaranteed Securities
Fixed Income Security Type Fair Value
Percent of All Fixed Income Assets
Weighted Average
Duration to Maturity (years) AAA AA
Commercial Paper $635,933,970 2�6% 0�02 $490,345,767 $133,489,010
Short-Term Investment Funds (STIF) 1,418,604,157 5�8 0�08 1,418,604,157
Repurchase Agreements 450,000,000 1�8 0�01 200,000,000 250,000,000
Interest-Bearing Short-Term Certificate 229,999,570 0�9 0�38 229,999,570
Corporate Bonds 4,662,195,994 19�0 4�96 13,337,016 285,501,548
Municipal Bonds 39,657,600 0�2 14�42 16,075,505
Asset-Backed Securities 813,421,383 3�3 1�32 426,858,805 78,850,710
Mortgages 880,333,239 3�6 3�91 69,438,309 119,710,139
Agency Mortgages 2,309,172,779 9�4 3�53 2,309,172,779
Non-U�S� Corporate Bonds 2,153,220,569 8�8 4�58 85,710,170 208,774,642
Non-U�S� Mortgage & Asset-Backed Securities 149,406,854 0�6 7�04 10,946,600 3,274,147
Non-U�S� Government 4,039,963,113 16�4 6�25 9,969,690
Agency Bonds 522,868,961 2�1 1�61 522,868,961
Commingled Long-Term Global Funds 576,266,536 2�3 0�64
Total Non-Government Guaranteed 18,881,044,725 76.8 2,945,240,394 3,937,687,131
U�S� Treasury Notes 3,690,071,507 15�0 3�66 3,690,071,507
U�S� Treasury Bonds 637,133,260 2�6 17�19 637,133,260
U�S� Treasury Inflation Protected 1,303,621,462 5�3 5�09 1,303,621,462
U�S� Treasury Discount Notes 83,973,832 0�3 0�17 83,973,832
Total Fixed Income and Short-Term Securities $24,595,844,786 100.0% 4.25 $2,945,240,394 $9,652,487,192
The following table presents the credit quality ratings and effective durations of OPERS fixed income assets, including short-term investments, as of December 31, 2015:
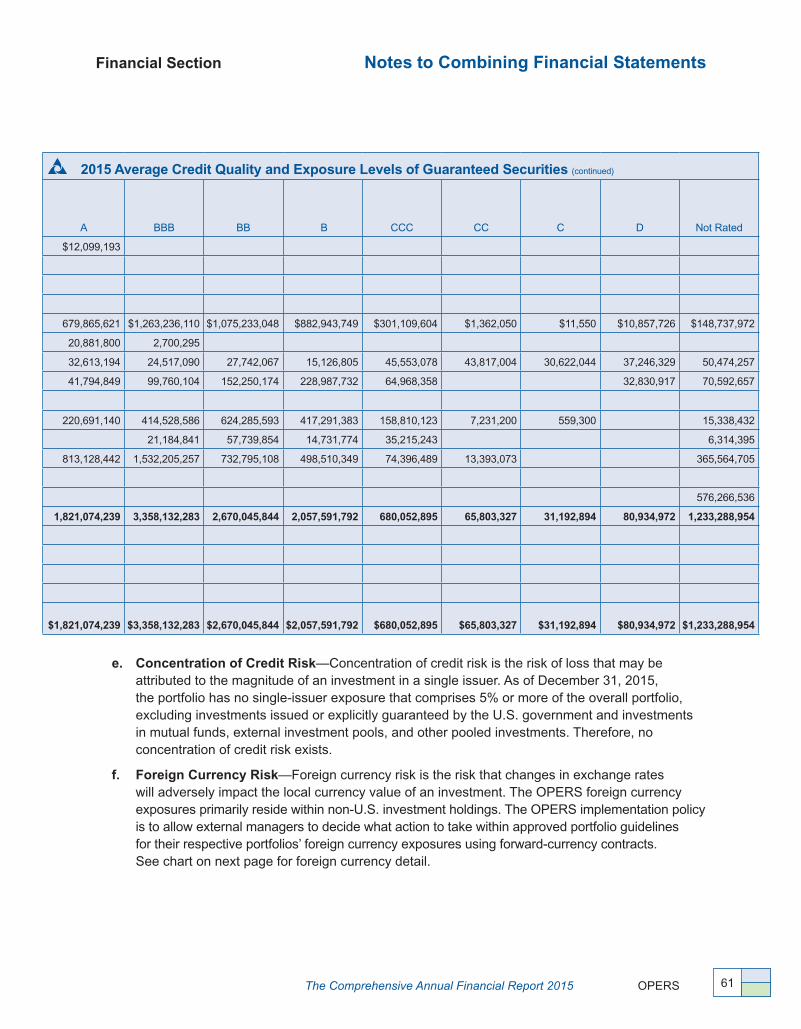
61 The Comprehensive Annual Financial Report 2015 OPERS
Financial Section Notes to Combining Financial Statements
2015 Average Credit Quality and Exposure Levels of Guaranteed Securities (continued)
A BBB BB B CCC CC C D Not Rated
$12,099,193
679,865,621 $1,263,236,110 $1,075,233,048 $882,943,749 $301,109,604 $1,362,050 $11,550 $10,857,726 $148,737,972
20,881,800 2,700,295
32,613,194 24,517,090 27,742,067 15,126,805 45,553,078 43,817,004 30,622,044 37,246,329 50,474,257
41,794,849 99,760,104 152,250,174 228,987,732 64,968,358 32,830,917 70,592,657
220,691,140 414,528,586 624,285,593 417,291,383 158,810,123 7,231,200 559,300 15,338,432
21,184,841 57,739,854 14,731,774 35,215,243 6,314,395
813,128,442 1,532,205,257 732,795,108 498,510,349 74,396,489 13,393,073 365,564,705
576,266,536
1,821,074,239 3,358,132,283 2,670,045,844 2,057,591,792 680,052,895 65,803,327 31,192,894 80,934,972 1,233,288,954
$1,821,074,239 $3,358,132,283 $2,670,045,844 $2,057,591,792 $680,052,895 $65,803,327 $31,192,894 $80,934,972 $1,233,288,954
e. Concentration of Credit Risk—Concentration of credit risk is the risk of loss that may be attributed to the magnitude of an investment in a single issuer� As of December 31, 2015, the portfolio has no single-issuer exposure that comprises 5% or more of the overall portfolio, excluding investments issued or explicitly guaranteed by the U�S� government and investments in mutual funds, external investment pools, and other pooled investments� Therefore, no concentration of credit risk exists�
f. Foreign Currency Risk—Foreign currency risk is the risk that changes in exchange rates will adversely impact the local currency value of an investment� The OPERS foreign currency exposures primarily reside within non-U�S� investment holdings� The OPERS implementation policy is to allow external managers to decide what action to take within approved portfolio guidelines for their respective portfolios’ foreign currency exposures using forward-currency contracts� See chart on next page for foreign currency detail�
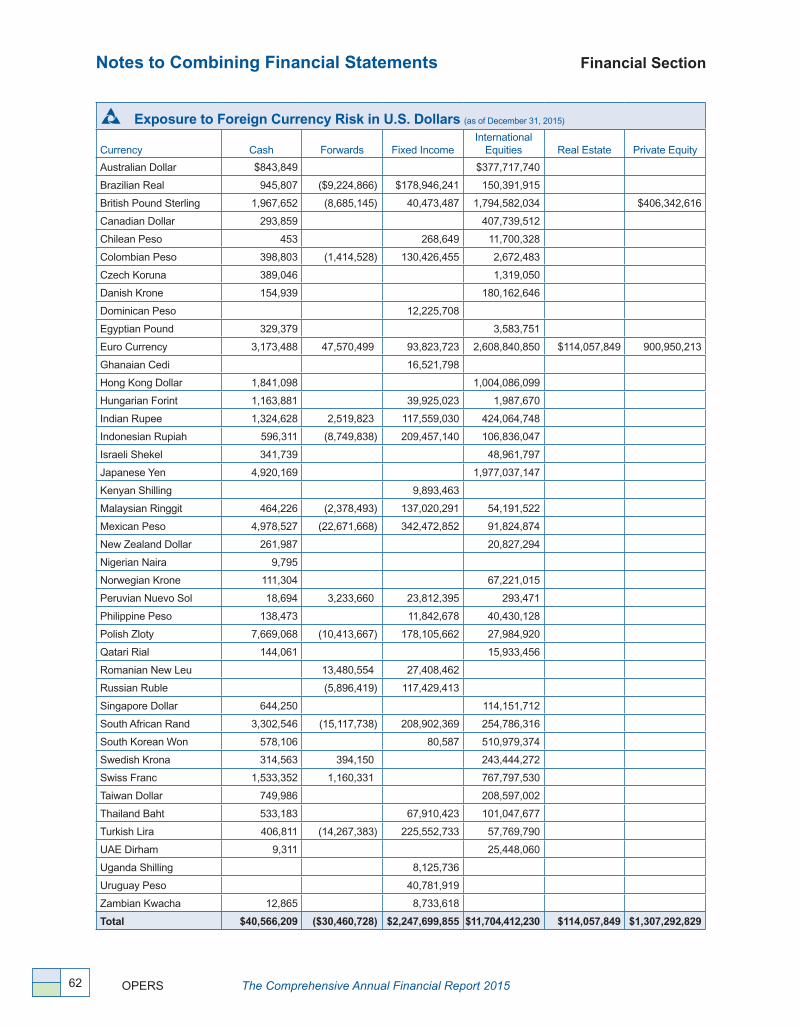
Notes to Combining Financial Statements Financial Section
OPERS The Comprehensive Annual Financial Report 201562
Exposure to Foreign Currency Risk in U.S. Dollars (as of December 31, 2015)
Currency Cash Forwards Fixed IncomeInternational
Equities Real Estate Private Equity
Australian Dollar $843,849 $377,717,740
Brazilian Real 945,807 ($9,224,866) $178,946,241 150,391,915
British Pound Sterling 1,967,652 (8,685,145) 40,473,487 1,794,582,034 $406,342,616
Canadian Dollar 293,859 407,739,512
Chilean Peso 453 268,649 11,700,328
Colombian Peso 398,803 (1,414,528) 130,426,455 2,672,483
Czech Koruna 389,046 1,319,050
Danish Krone 154,939 180,162,646
Dominican Peso 12,225,708
Egyptian Pound 329,379 3,583,751
Euro Currency 3,173,488 47,570,499 93,823,723 2,608,840,850 $114,057,849 900,950,213
Ghanaian Cedi 16,521,798
Hong Kong Dollar 1,841,098 1,004,086,099
Hungarian Forint 1,163,881 39,925,023 1,987,670
Indian Rupee 1,324,628 2,519,823 117,559,030 424,064,748
Indonesian Rupiah 596,311 (8,749,838) 209,457,140 106,836,047
Israeli Shekel 341,739 48,961,797
Japanese Yen 4,920,169 1,977,037,147
Kenyan Shilling 9,893,463
Malaysian Ringgit 464,226 (2,378,493) 137,020,291 54,191,522
Mexican Peso 4,978,527 (22,671,668) 342,472,852 91,824,874
New Zealand Dollar 261,987 20,827,294
Nigerian Naira 9,795
Norwegian Krone 111,304 67,221,015
Peruvian Nuevo Sol 18,694 3,233,660 23,812,395 293,471
Philippine Peso 138,473 11,842,678 40,430,128
Polish Zloty 7,669,068 (10,413,667) 178,105,662 27,984,920
Qatari Rial 144,061 15,933,456
Romanian New Leu 13,480,554 27,408,462
Russian Ruble (5,896,419) 117,429,413
Singapore Dollar 644,250 114,151,712
South African Rand 3,302,546 (15,117,738) 208,902,369 254,786,316
South Korean Won 578,106 80,587 510,979,374
Swedish Krona 314,563 394,150 243,444,272
Swiss Franc 1,533,352 1,160,331 767,797,530
Taiwan Dollar 749,986 208,597,002
Thailand Baht 533,183 67,910,423 101,047,677
Turkish Lira 406,811 (14,267,383) 225,552,733 57,769,790
UAE Dirham 9,311 25,448,060
Uganda Shilling 8,125,736
Uruguay Peso 40,781,919
Zambian Kwacha 12,865 8,733,618
Total $40,566,209 ($30,460,728) $2,247,699,855 $11,704,412,230 $114,057,849 $1,307,292,829
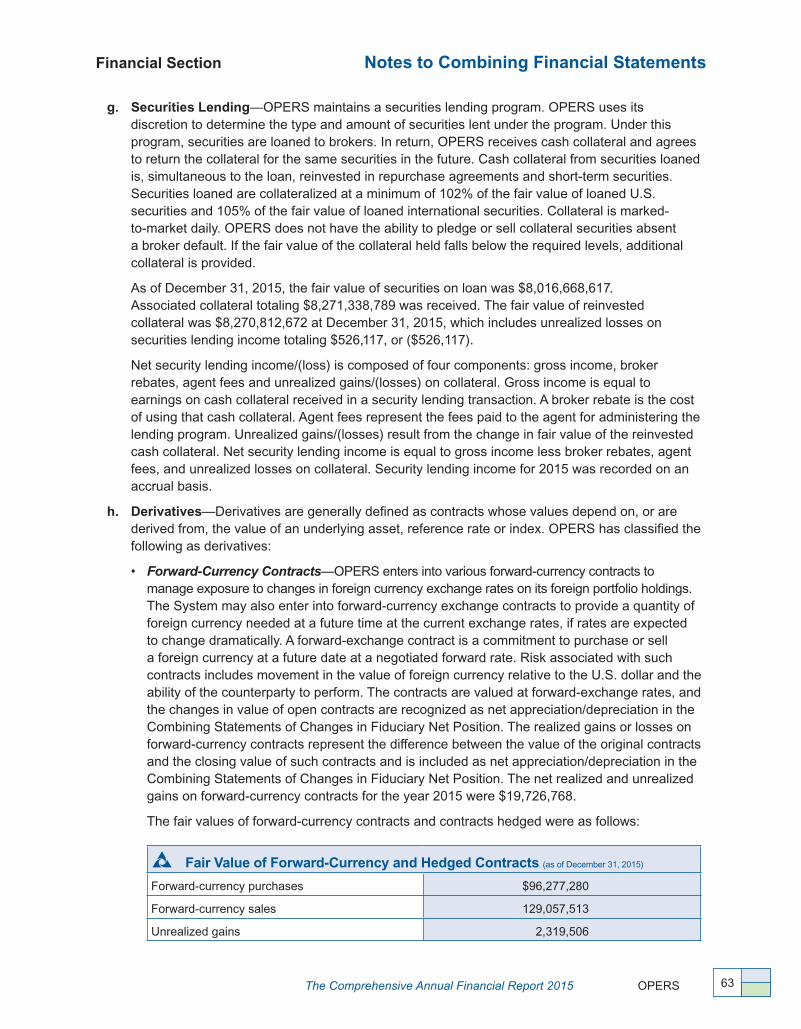
The Comprehensive Annual Financial Report 2015 OPERS
Financial Section Notes to Combining Financial Statements
63
g. Securities Lending—OPERS maintains a securities lending program� OPERS uses its discretion to determine the type and amount of securities lent under the program� Under this program, securities are loaned to brokers� In return, OPERS receives cash collateral and agrees to return the collateral for the same securities in the future� Cash collateral from securities loaned is, simultaneous to the loan, reinvested in repurchase agreements and short-term securities� Securities loaned are collateralized at a minimum of 102% of the fair value of loaned U�S� securities and 105% of the fair value of loaned international securities� Collateral is marked-to-market daily� OPERS does not have the ability to pledge or sell collateral securities absent a broker default� If the fair value of the collateral held falls below the required levels, additional collateral is provided�
As of December 31, 2015, the fair value of securities on loan was $8,016,668,617� Associated collateral totaling $8,271,338,789 was received� The fair value of reinvested collateral was $8,270,812,672 at December 31, 2015, which includes unrealized losses on securities lending income totaling $526,117, or ($526,117)�
Net security lending income/(loss) is composed of four components: gross income, broker rebates, agent fees and unrealized gains/(losses) on collateral� Gross income is equal to earnings on cash collateral received in a security lending transaction� A broker rebate is the cost of using that cash collateral� Agent fees represent the fees paid to the agent for administering the lending program� Unrealized gains/(losses) result from the change in fair value of the reinvested cash collateral� Net security lending income is equal to gross income less broker rebates, agent fees, and unrealized losses on collateral� Security lending income for 2015 was recorded on an accrual basis�
h. Derivatives—Derivatives are generally defined as contracts whose values depend on, or are derived from, the value of an underlying asset, reference rate or index� OPERS has classified the following as derivatives:
• Forward-Currency Contracts—OPERS enters into various forward-currency contracts to manage exposure to changes in foreign currency exchange rates on its foreign portfolio holdings� The System may also enter into forward-currency exchange contracts to provide a quantity of foreign currency needed at a future time at the current exchange rates, if rates are expected to change dramatically� A forward-exchange contract is a commitment to purchase or sell a foreign currency at a future date at a negotiated forward rate� Risk associated with such contracts includes movement in the value of foreign currency relative to the U�S� dollar and the ability of the counterparty to perform� The contracts are valued at forward-exchange rates, and the changes in value of open contracts are recognized as net appreciation/depreciation in the Combining Statements of Changes in Fiduciary Net Position� The realized gains or losses on forward-currency contracts represent the difference between the value of the original contracts and the closing value of such contracts and is included as net appreciation/depreciation in the Combining Statements of Changes in Fiduciary Net Position� The net realized and unrealized gains on forward-currency contracts for the year 2015 were $19,726,768�
The fair values of forward-currency contracts and contracts hedged were as follows:
Fair Value of Forward-Currency and Hedged Contracts (as of December 31, 2015)
Forward-currency purchases $96,277,280
Forward-currency sales 129,057,513
Unrealized gains 2,319,506

Notes to Combining Financial Statements Financial Section
OPERS The Comprehensive Annual Financial Report 201564
• Futures Contracts—OPERS enters into various futures contracts to manage exposure to changes in foreign equity and currency markets and to take advantage of movements on an opportunistic basis� A stock index future is a futures contract that uses a stock index as its base, and which is settled by cash or delivery of the underlying stocks in the index� Financial futures represent an off balance sheet obligation, as there are no balance sheet assets or liabilities associated with those contracts; however, the realized and unrealized gains and losses on futures are recorded in the Combining Statements of Changes in Fiduciary Net Position� Futures contracts differ from forward-currency contracts by their standardization, exchange trading, margin requirements, and daily settlement (marking-to-market)� Risk associated with stock index futures contracts includes adverse movements in the underlying stock index� The following table shows the futures positions held by OPERS as of December 31, 2015� The net realized and unrealized losses on futures contracts for the year 2015 were $77,838,776, or ($77,838,776)�
Futures Positions Held (as of December 31, 2015)
Futures ContractsNumber of Contracts
Contract Principal
U�S� Equity Index Futures purchased long 4,536 $476,962,820
U�S� Treasury Futures purchased long 4,314 633,052,822
Currency Futures purchased long 41 5,579,075
Currency Futures purchased short (23) (2,118,013)
Non-U�S� Equity Index Futures purchased long 10,254 488,987,980
• Total Return Swaps—OPERS may manage market exposure through the use of total return swaps� A total return swap is an agreement in which one party commits to pay a fee in exchange for a return linked to the market performance of an underlying security, group of securities, index or other asset (reference obligation)� Risks may arise if the value of the swap acquired decreases because of an unfavorable change in price of the reference obligation or the counterparty’s ability to meet the terms of the contract� OPERS held total return swaps with a notional value of $1,878,663,393 as of December 31, 2015� The unrealized gains at December 31, 2015 were $1,289,798� The net realized and unrealized losses in total return swaps for the year 2015 were $382,178,627, or ($382,178,627)�
• Options—Options give buyers the right, but not the obligation, to buy or sell an asset at a predetermined strike price over a specified period� The option premium is usually a small percentage of the underlying asset value� When writing an option, OPERS receives a premium initially and bears the risk of an unfavorable change in the price of the underlying asset during the option life� When OPERS purchases an option, it pays a premium to a counterparty that bears the risk of an unfavorable change in the price of the underlying asset during the option life� While OPERS invested in options during 2015, there were no outstanding options at December 31, 2015� Net realized losses in options for 2015 were $53,134, or ($53,134)�

The Comprehensive Annual Financial Report 2015 OPERS
Financial Section Notes to Combining Financial Statements
65
4. Vacation and Sick Leave
As of December 31, 2015, $7,431,129 was accrued for unused vacation and sick leave for employees of OPERS� Employees who resign or retire are entitled to full compensation for all earned but unused vacation leave for balances up to three times their annual accrual rate at the time of separation� Unused sick leave is forfeited upon termination� However, employees who retire with more than 10 years of service with OPERS are entitled to receive payment for 50% of their unused sick leave up to a maximum of 2,000 hours�
5. Deferred Compensation Plan
OPERS does not sponsor a deferred compensation program� OPERS employees are eligible to participate in the deferred compensation plan sponsored by the state of Ohio� The state-sponsored plan was created in accordance with IRC Section 457� The plan is available to all OPERS employees and permits them to defer a portion of their salary until future years� Deferred compensation assets are not available to employees until termination, retirement, death, or unforeseeable emergency�
IRC Section 457 requires that the amount of compensation assets deferred under a plan, all property and rights, and all income attributable to those amounts, property or rights, be held in trust for the benefit of the participants� This insulates IRC Section 457 benefits from the claims of an employer’s general creditors� Accordingly, OPERS does not include the deferred compensation assets or liabilities of the Ohio Deferred Compensation Plan in its financial statements�
6. Schedule of Required Contributions
All employees of OPERS are eligible for membership in the benefit plans of the System� The employer contributions paid on behalf of these employees are funded by revenues in the Income Fund, arising from investment activity and other income� The annual required pension and health care contributions for employees for the year ended December 31, 2015 are as follows:
Annual Required Pension and Health Care Contributions
Year Ended
Pension Health Care
Annual Required Contributions
Percent Contributed
Annual Required Contributions
Percent Contributed
2015 $5,750,556 100% $958,426 100%
Under GASB 51, internal payroll related to the implementation of capital projects is capitalized as part of the fixed asset cost� OPERS implemented GASB 51 at the end of 2008, and began capitalizing internal labor costs effective January 1, 2009� The capitalized cost includes salary and wages as well as the corresponding employer paid Medicare and retirement contribution expenses� The portion of the 2015 annual required contribution included in fixed assets was $354,884 for pension and $59,147 for health care�

Notes to Combining Financial Statements Financial Section
OPERS The Comprehensive Annual Financial Report 201566
7. Self-insured Employee Health Care
OPERS self-insures, under a professionally administered plan, general health, hospitalization, and prescription drug employee benefits� OPERS maintained specific stop-loss coverage per employee for medical benefits in the amount of $250,000 for 2015� Employees share in the cost of their coverage by payroll deductions, which are netted against the claims cost� Employee deductions and vendor rebates totaled $1,056,958 in 2015� The summary of changes in incurred but not reported claims for the year ended December 31, 2015 follows:
Employee Health Insurance2015
Balance January 1 $38,741
Claims Incurred 7,882,620
Claims Paid (7,809,051)
Balance December 31 $112,310
The liability for self-insured employee health care is included in Accounts Payable and Other Liabilities on the Combining Statements of Fiduciary Net Position�
8. Net Pension Liability
The components of the net pension liability of the defined benefit portion of the pension plans as of December 31, 2015 are as follows:
Net Pension Liability/(Asset) ($ in millions)
As of December 31, 2015 All PlansTraditional
Pension Plan Combined Plan*Member-Directed
Plan*
Total Pension LiabilityPlan Fiduciary Net PositionEmployers’ Net Pension Liability/(Asset)
$91,83274,560
$91,53474,213
$288337
$1010
$17,272 $17,321 ($49) $0
Plan Fiduciary Net Position as a Percentage of Total Pension Liability/(Asset) 81�19% 81�08% 116�90% 103�91%
Actuarial valuations of an ongoing plan involve estimates of the value of reported amounts and assumptions about the probability of occurrence of events far into the future� Examples include assumptions about future employment, mortality, and cost trends� Actuarially determined amounts are subject to continual review or modification as actual results are compared with past expectations and new estimates are made about the future�
Projections of benefits for financial reporting purposes are based on the substantive plan (the plan as understood by the employers and plan members) and include the types of benefits provided at the time of each valuation� The total pension liability was determined by an actuarial valuation as of December 31, 2015, using the following actuarial assumptions applied to all prior periods included in the measurement in accordance with the requirements of GASB 67� Key methods and assumptions used in the latest actuarial valuations are presented on the next page�
* The Combined Plan and Member-Directed Plan information in the Net Pension Liability includes only the defined benefit portion of these plans to comply with GASB-reporting standards and does not include the defined contribution portion� The Combining Statements of Fiduciary Net Position and Changes in Fiduciary Net Position present the combined defined benefit and defined contribution portions of the Combined Plan and Member Directed Plan�

The Comprehensive Annual Financial Report 2015 OPERS
Financial Section Notes to Combining Financial Statements
67
Mortality rates are based on the RP-2000 mortality table projected 20 years using Projection Scale AA� For males, 105% of the combined healthy male mortality rates were used� For females, 100% of the combined healthy female mortality rates were used� The mortality rates used in evaluating disability allowances were based upon the RP-2000 mortality table with no projections� For males, 120% of the disabled female mortality rates were used, set forward two years� For females, 100% of the disabled female mortality rates were used�
The discount rate used to measure the total pension liability was 8�0% for the Traditional Pension Plan, Combined Plan and Member-Directed Plan� The projection of cash flows used to determine the discount rate assumed that contributions from plan members and those of the contributing employers are made at the contractually required rates, as actuarially determined� Based on those assumptions, the pension plan’s fiduciary net position was projected to be available to make all projected future benefit payments of current plan members� Therefore, the long-term expected rate of return on pension plan investments for the Traditional Pension Plan, Combined Plan and Member-Directed Plan was applied to all periods of projected benefit payments to determine the total pension liability�
The allocation of investment assets within the Defined Benefit portfolio is approved by the Board as outlined in the annual investment plan� Plan assets are managed on a total return basis with a long-term objective of achieving and maintaining a fully funded status for the benefits provided through the defined benefit pension plans� The table below displays the Board-approved asset allocation policy for 2015 and the long-term expected real rates of return�
Asset Class Target Allocation for 2015
Weighted Average Long-Term Expected Real Rate of Return
(Arithmetic)
Fixed Income 23�00% 2�31%
Domestic Equities 20�70 5�84
Real Estate 10�00 4�25
Private Equity 10�00 9�25
International Equities 18�30 7�40
Other Investments 18�00 4�59
TOTAL 100.00% 5.27%
Key Methods and Assumptions Used in Valuation of Total Pension LiabilityActuarial Information Traditional Pension Plan Combined Plan Member-Directed Plan
Valuation Date December 31, 2015 December 31, 2015 December 31, 2015
Experience Study5 Year Period Ended December 31, 2010
5 Year Period Ended December 31, 2010
5 Year Period Ended December 31, 2010
Actuarial Cost Method Individual entry age Individual entry age Individual entry age
Actuarial Assumptions
Investment Rate of Return 8�00% 8�00% 8�00%
Wage Inflation 3�75% 3�75% 3�75%
Projected Salary Increases4�25%-10�05%
(includes wage inflation at 3�75%)4�25%-8�05%
(includes wage inflation at 3�75%)4�25%-8�05%
(includes wage inflation at 3�75%)
Cost-of-living Adjustments
Pre-1/7/2013 Retirees: 3�00% SimplePost-1/7/2013 Retirees: 3�00% Simple
through 2018, then 2�80% Simple
Pre-1/7/2013 Retirees: 3�00% SimplePost-1/7/2013 Retirees: 3�00% Simple
through 2018, then 2�80% Simple
Pre-1/7/2013 Retirees: 3�00% SimplePost-1/7/2013 Retirees: 3�00% Simple
through 2018, then 2�80% Simple

Notes to Combining Financial Statements Financial Section
OPERS The Comprehensive Annual Financial Report 201568
The long-term expected rate of return on defined benefit investment assets was determined using a building-block method in which best-estimate ranges of expected future real rates of return are developed for each major asset class� These ranges are combined to produce the long-term expected real rate of return by weighting the expected future real rates of return by the target asset allocation percentage, adjusted for inflation�
OPERS manages investments in four investment portfolios: the Defined Benefit portfolio, the 401(h) Health Care Trust portfolio, the 115 Health Care Trust portfolio and the Defined Contribution portfolio� The Defined Benefit portfolio contains the investment assets of the Traditional Pension Plan, the defined benefit component of the Combined Plan, the annuitized accounts of the Member-Directed Plan, and the Member-Directed retiree medical accounts funded through the VEBA Trust� Within the Defined Benefit portfolio, contributions into the plans are all recorded at the same time, and benefit payments all occur on the first of the month� Accordingly, the money-weighted rate of return is considered to be the same for all plans within the portfolio� The money-weighted rate of return, net of investment expenses, for the Defined Benefit portfolio is 0�4% for 2015�
The following table presents the net pension liability calculated using the discount rate of 8�0%, and the expected net pension liability if it were calculated using a discount rate that is 1�0% lower or 1�0% higher than the current rate�
Sensitivity of Net Pension Liability/(Asset) to Changes in the Discount Rate ($ in millions) Employers’ Net Pension Liability/(Asset)As of December 31, 2015
1% Decrease 7�0%
Current Discount Rate 8�0%
1% Increase 9�0%
All Plans $27,597 $17,272 $8,566
Traditional Pension Plan $27,597 $17,321 $8,654
Combined Plan ($1) ($49) ($87)
Member-Directed Plan $1 $0 ($1)
The funding status of the three pension plans and their Schedules of Funding Progress may be found in the Actuarial Section of this document on pages 154-155� The Member-Directed Plan is a defined contribution plan in which at retirement, members have the option to convert their defined contribution account to a defined benefit annuity� The purchased defined benefit annuities under this plan were included in this annual report from a GASB 67 perspective for the first time as of December 31, 2015�
9. Post-employment Health Care Plans
The 115 Health Care Trust established in 2014 is not included in the table below as the OPERS Medicare Connector program, funded by the 115 Health Care Trust, participants were eligible for allocations beginning January 1, 2016 and the covered lives were already included in the actuarial valuation as of December 31, 2014� Therefore, no actuarial accrued liability exists for the 115 Health Care Trust as of December 31, 2014 and 2015� The funded status of health care as of December 31, 2014, the most recent actuarial valuation date, is as follows:
Funded Status of Health Care ($ in millions) As of December 31, 2014
Actuarial Accrued
Liabilities (AAL)Valuation Assets
Unfunded Actuarial Accrued Liabilities
(UAAL)Ratio of Assets
to AALActive Member
Payroll
UAAL as a % of Active Member
Payroll
Health Care $19,405 $12,062 $7,343 62�2% $12,654 58�0%

The Comprehensive Annual Financial Report 2015 OPERS
Financial Section Notes to Combining Financial Statements
69
Actuarial valuations of an ongoing plan involve estimates of the value of reported amounts and assumptions about the probability of occurrence of events far into the future� Examples include assumptions about future employment, mortality, and cost trends� Actuarially determined amounts are subject to continual review or modification as actual results are compared with past expectations and new estimates are made about the future� The Schedule of Funding Progress presents multi-year trend information about whether the actuarial values of plan assets are increasing or decreasing over time, relative to the actuarial accrued liabilities for benefits� The Schedule of Funding Progress for health care is presented on page 77 of the Required Supplementary Information section of this document�
The accompanying Schedule of Contributions from Employers and Other Contributing Entities (refer to page 78) presents trend information about the amounts contributed to the plan in comparison to the Annual Required Contributions� The Annual Required Contributions column represents a level of funding that, if paid on an ongoing basis, is projected to cover estimated health care costs for each year and amortize any unfunded actuarial liabilities (or funding excess) over a period not to exceed 30 years�
Projections of health care costs for financial reporting purposes are based on the substantive plan (the plan as understood by the employers and plan members) and include the types of coverage provided at the time of each valuation and the historical pattern of sharing of costs between the employers and plan members to that point� The actuarial methods and assumptions used include techniques that are designed to reduce the effects of short-term volatility in actuarial accrued liabilities and the actuarial value of assets, consistent with the long-term perspective of the calculations� Key methods and assumptions used in the latest actuarial valuations are presented below�
Key Methods and Assumptions Used in Valuation of Health Care Liability Actuarial Information Health Care
Valuation Date December 31, 2014
Actuarial Cost Method Individual entry age normal
Amortization Method Level percentage of pay, open
Amortization Period 30 years
Assets Valuation Method 4-year, smoothed market-12% corridor
Actuarial Assumptions
Investment Rate of Return 5�0%
Projected Salary Increases4�25%-10�05%
(includes wage inflation at 3�75%)
Health Care Cost Trend Rate 9�0% initial, 3�75% ultimate
10. Subsequent Event
In March 2016, OPERS received two favorable rulings from the IRS allowing OPERS to consolidate all health care assets into the 115 Health Care Trust� Transition to the new health care trust structure will occur during 2016� The Combining Statements of Changes in Fiduciary Net Position for the year ended December 31, 2016 will reflect a partial year of activity in the 401(h) Health Care Trust and VEBA Trust prior to the termination of these trusts and the assets and liabilities, or net position, of these trusts being consolidated into the 115 Health Care Trust�

Required Supplementary Information (unaudited) Financial Section
OPERS The Comprehensive Annual Financial Report 201570
Defined Benefit Pension Plans
The Schedules of Changes in Net Pension Liability display the components of the total pension liability and plan fiduciary net position for each pension plan with a defined benefit component, calculated in conformity with the requirements of GASB 67� Covered employee payroll represents the collective total of the OPERS eligible wages of all OPERS employers within each plan�
Schedules of Changes in Net Pension Liability ($ in millions) All Plans*
Year 2015 2014
Net Change in Total Pension LiabilityService CostInterest on Total Pension LiabilityChanges of Benefit TermsDifference Between Expected and Actual ExperienceChanges in AssumptionsBenefit Payments, Including Refunds of Employee Contributions
$1,710�76,978�9
-(334�0)
-(5,808�6)
$1,685�3 6,778�9
-(321�4)
-(5,502�2)
Net Change in Total Pension LiabilityTotal Pension Liability—Beginning
2,547.0 89,285�2
2,640.6 86,644�6
Total Pension Liability—Ending $91,832.2 $89,285.2
Net Change in Plan Fiduciary Net PositionEmployer ContributionsMember ContributionsNet Investment IncomeBenefit Payments, Including Refunds of Employee ContributionsNon-Investment Administrative ExpensesOther**
$1,564�71,246�7
276�3(5,808�6)
(49�1)66�9
$1,520�3 1,228�1 5,074�7
(5,502�2)(49�8)125�5
Net Change in Plan Fiduciary Net PositionPlan Fiduciary Net Position—Beginning
(2,703.1) 77,263�2
2,396.6 74,866�6
Plan Fiduciary Net Position—Ending $74,560.1 $77,263.2
Net Pension Liability/(Asset) $17,272.1 $12,022.0
Plan Fiduciary Net Position as a Percentage of the Total Pension Liability/(Asset) 81�19% 86�54%
Covered Employee Payroll $13,177�0 $12,932�5
Net Pension Liability/(Asset) as a Percentage of Covered Employee Payroll 131�08% 92�96%
* Includes Traditional Pension Plan and defined benefit portions of Combined Plan and Member-Directed Plan� ** Other includes Contract and Other Receipts, Other Income and Interplan Activity�
See Notes to Required Supplementary Information, beginning on page 79�
See accompanying Independent Auditors’ Report, beginning on page 20�

Financial Section Required Supplementary Information
The Comprehensive Annual Financial Report 2015 OPERS 71
Schedules of Changes in Net Pension Liability ($ in millions) Traditional Pension Plan*
Year 2015 2014
Net Change in Total Pension LiabilityService CostInterest on Total Pension LiabilityChanges of Benefit TermsDifference Between Expected and Actual ExperienceChanges in AssumptionsBenefit Payments, Including Refunds of Employee Contributions
$1,687�06,956�7
-(322�3)
-(5,804�1)
$1,659�6 6,759�0
-(309�7)
-(5,498�8)
Net Change in Total Pension LiabilityTotal Pension Liability—Beginning
2,517.3 89,017�3
2,610.186,407�2
Total Pension Liability—Ending $91,534.6 $89,017.3
Net Change in Plan Fiduciary Net PositionEmployer ContributionsMember ContributionsNet Investment IncomeBenefit Payments, Including Refunds of Employee ContributionsNon-Investment Administrative ExpensesOther**
$1,498�71,246�7
274�9(5,804�1)
(49�1)90�0
$1,476�1 1,228�1 5,056�3
(5,498�8)(49�8)125�8
Net Change in Plan Fiduciary Net PositionPlan Fiduciary Net Position—Beginning
(2,742.9) 76,956�2
2,337.7 74,618�5
Plan Fiduciary Net Position—Ending $74,213.3 $76,956.2
Net Pension Liability/(Asset) $17,321.3 $12,061.1
Plan Fiduciary Net Position as a Percentage of the Total Pension Liability/(Asset) 81�08% 86�45%
Covered Employee Payroll $12,321�2 $12,139�7
Net Pension Liability/(Asset) as a Percentage of Covered Employee Payroll 140�58% 99�35%
* Includes money purchase annuities for re-employed retirees and additional annuities� ** Other includes Contract and Other Receipts, Other Income and Interplan Activity�
See Notes to Required Supplementary Information, beginning on page 79�
See accompanying Independent Auditors’ Report, beginning on page 20�

Required Supplementary Information Financial Section
OPERS The Comprehensive Annual Financial Report 201572
Schedules of Changes in Net Pension Liability ($ in millions) Combined Plan*
Year 2015 2014
Net Change in Total Pension LiabilityService CostInterest on Total Pension LiabilityChanges of Benefit TermsDifference Between Expected and Actual ExperienceChanges in AssumptionsBenefit Payments, Including Refunds of Employee Contributions
$23�721�6
-(13�3)
-(3�7)
$25�7 19�4
-(13�2)
-(2�8)
Net Change in Total Pension LiabilityTotal Pension Liability—Beginning
28.3 259�6
29.1230�5
Total Pension Liability—Ending $287.9 $259.6
Net Change in Plan Fiduciary Net PositionEmployer ContributionsMember ContributionsNet Investment IncomeBenefit Payments, Including Refunds of Employee ContributionsNon-Investment Administrative ExpensesOther**
$44�0-
1�3(3�7)
-(3�1)
$44�2-
17�9(2�8)
- (2�2)
Net Change in Plan Fiduciary Net PositionPlan Fiduciary Net Position—Beginning
38.5 298�1
57.1241�0
Plan Fiduciary Net Position—Ending $336.6 $298.1
Net Pension Liability/(Asset) ($48.7) ($38.5)
Plan Fiduciary Net Position as a Percentage of the Total Pension Liability/(Asset) 116�90% 114�83%
Covered Employee Payroll $366�9 $346�0
Net Pension Liability/(Asset) as a Percentage of Covered Employee Payroll (13�26%) (11�13%)
* Includes annuitized defined contribution accounts� The Combined Plan information in the Net Pension Liability includes only the defined benefit portion of this plan to comply with GASB-reporting standards and does not include the defined contribution portion� The Combining Statements of Fiduciary Net Position and Changes in Fiduciary Net Position present the combined defined benefit and defined contribution portions of the Combined Plan�
** Other includes Contract and Other Receipts, Other Income and Interplan Activity�
See Notes to Required Supplementary Information, beginning on page 79�
See accompanying Independent Auditors’ Report, beginning on page 20�

The Comprehensive Annual Financial Report 2015 OPERS
Financial Section Required Supplementary Information
73
Schedules of Changes in Net Pension Liability ($ in millions) Member-Directed Plan*
Year 2015 2014
Net Change in Total Pension LiabilityService CostInterest on Total Pension LiabilityChanges of Benefit TermsDifference Between Expected and Actual ExperienceChanges in AssumptionsBenefit Payments, Including Refunds of Employee Contributions
-$0�6
-1�6
-(0�8)
-$0�5
-1�5
-(0�6)
Net Change in Total Pension LiabilityTotal Pension Liability—Beginning
1.4 8�3
1.4 6�9
Total Pension Liability—Ending $9.8 $8.3
Net Change in Plan Fiduciary Net PositionEmployer ContributionsMember ContributionsNet Investment IncomeBenefit Payments, Including Refunds of Employee ContributionsNon-Investment Administrative ExpensesOther**
$22�0-
0�1(0�8)
-(20�0)
--
$0�5 (0�6)
-1�9
Net Change in Plan Fiduciary Net PositionPlan Fiduciary Net Position—Beginning
1.3 8�9
1.8 7�1
Plan Fiduciary Net Position—Ending $10.2 $8.9
Net Pension Liability/(Asset) ($0.5) ($0.6)
Plan Fiduciary Net Position as a Percentage of the Total Pension Liability/(Asset) 103�91% 107�10%
Covered Employee Payroll $488�9 $446�8
Net Pension Liability/(Asset) as a Percentage of Covered Employee Payroll (0�08%) (0�13%)
* Includes annuitized defined contribution accounts� The Member-Directed Plan information in the Net Pension Liability includes only the defined benefit annuities purchased in this plan to comply with GASB-reporting standards and does not include the defined contribution portion� The Combining Statements of Fiduciary Net Position and Changes in Fiduciary Net Position present the combined defined benefit and defined contribution portions of the Member-Directed Plan�
** Other includes Contract and Other Receipts, Other Income and Interplan Activity�
See Notes to Required Supplementary Information, beginning on page 79�
See accompanying Independent Auditors’ Report, beginning on page 20�

OPERS The Comprehensive Annual Financial Report 201574
Required Supplementary Information Financial Section
Within the Traditional Pension Plan, OPERS classifies employees into four divisions: State, Local, Law Enforcement and Public Safety� The Public Safety and Law Enforcement divisions have different contribution rates, benefit formulas, and retirement eligibility requirements than those of the State and Local members� The member and employer contribution rates are actuarially determined within the constraints of statutory limits for each division� Both the member and employer contribution rates for Public Safety and Law Enforcement members are higher than those of the State and Local members to recognize the higher cost of these benefits� Accordingly, both member and employer contributions are used to calculate the proportionate shares of employers�
Schedule of Member and Employer Contributions Traditional Pension Plan*
Year Ended December 31
Actuarially Determined
Contributions** Contributions Paid
Contribution Deficiency/ (Excess)
Covered Employee Payroll
Contributions as a Percent of
Covered Payroll
2015 $2,745,411,751 $2,745,411,751 - $12,321,236,358 22�3%
2014 2,704,218,157 2,704,218,157 - 12,139,692,990 22�3
2013 2,778,566,900 2,778,566,900 - 11,999,928,351 23�2
2012 2,407,224,107 2,407,224,107 - 11,883,831,019 20�3
2011 2,454,599,959 2,454,599,959 - 12,103,258,896 20�3
2010 2,315,100,186 2,315,100,186 - 12,165,415,760 19�0
2009 2,256,548,622 2,256,548,622 - 12,289,885,494 18�4
2008 2,145,747,568 2,145,747,568 - 12,546,006,885 17�1
2007 2,235,767,340 2,235,767,340 - 12,347,230,140 18�1
2006 2,158,861,237 2,158,861,237 - 11,970,556,211 18�0
* The actuarially determined contribution to fund the cost of pensions includes member and employer contributions� The contributions reported in this schedule are consistent with the presentation of the employers’ proportionate shares�
** The Board has approved all contribution rates as recommended by the actuary�
See Notes to Required Supplementary Information, beginning on page 79�
See accompanying Independent Auditors’ Report, beginning on page 20�

The Comprehensive Annual Financial Report 2015 OPERS 75
Financial Section Required Supplementary Information
Schedule of Employer Contributions* All Plans
Year Ended December 31
Actuarially Determined
Contributions Contributions Paid
Contribution Deficiency/ (Excess)
Covered Employee Payroll
Contributions as a Percent of
Covered Payroll
2015 $1,611,150,408 $1,611,150,408 - $13,177,006,156 12�2%
2014 1,568,121,657 1,568,121,657 - 12,932,540,544 12�1
2013 1,655,726,521 1,655,726,521 - 12,331,162,054 13�4
2012 1,267,795,786 1,267,795,786 - 12,193,467,217 10�4
2011 1,290,029,652 1,290,029,652 - 12,399,464,698 10�4
2010 1,153,671,398 1,153,671,398 - 12,449,782,144 9�3
2009 1,069,336,423 1,069,336,423 - 12,548,337,499 8�5
2008 937,458,579 937,458,579 - 12,801,062,526 7�3
2007 1,092,097,882 1,092,097,882 - 12,583,371,444 8�7
2006 1,127,051,008 1,127,051,008 - 12,175,179,922 9�3
Schedule of Employer Contributions* Traditional Pension Plan
Year Ended December 31
Actuarially Determined
Contributions Contributions Paid
Contribution Deficiency/ (Excess)
Covered Employee Payroll
Contributions as a Percent of
Covered Payroll
2015 $1,498,679,737 $1,498,679,737 - $12,321,236,358 12�2%
2014 1,476,074,083 1,476,074,083 - 12,139,692,990 12�2
2013 1,571,758,150 1,571,758,150 - 11,999,928,351 13�1
2012 1,208,150,727 1,208,150,727 - 11,883,831,019 10�2
2011 1,233,002,841 1,233,002,841 - 12,103,258,896 10�2
2010 1,097,711,440 1,097,711,440 - 12,165,415,760 9�0
2009 1,019,582,360 1,019,582,360 - 12,289,885,494 8�3
2008 892,693,746 892,693,746 - 12,546,006,885 7�1
2007 1,051,808,289 1,051,808,289 - 12,347,230,140 8�5
2006 1,092,998,459 1,092,998,459 - 11,970,556,211 9�1
See Notes to Required Supplementary Information, beginning on page 79�
See accompanying Independent Auditors’ Report, beginning on page 20�
The Combined Plan defined benefit pension is funded only from the employer contributions, with the member contributions deposited to a defined contribution account� Both member and employer contributions for the Member-Directed Plan are deposited into the participants’ defined contribution accounts� However, the Member-Directed Plan defined benefit annuities purchased by eligible Member-Directed Plan retirees are funded with accumulated member contributions, vested employer contributions and gains or losses resulting from the member-selected investment options� As a result, the Member-Directed Plan table on page 76 shows all employer contributions to the plan since there are no separate actuarially determined contributions calculated for purchased annuities and employer contributions are used to determine the employer proportionate share of this activity� The tables below display the actuarially determined contributions for employers of all the pension plans based on the actuarially determined rate, and the amount of these contributions paid by the employers each year�
* The Board has approved all contribution rates recommended by the actuary� Actuarially determined contributions exclude funds deposited for purchase of service, employer-paid retirement incentive programs, interest and penalties� These deposits are included in Contract and Other Receipts in the Combining Statements of Changes in Fiduciary Net Position�

OPERS The Comprehensive Annual Financial Report 201576
Schedule of Employer Contributions* Combined Plan
Year Ended December 31
Actuarially Determined
Contributions Contributions Paid
Contribution Deficiency/ (Excess)
Covered Employee Payroll
Contributions as a Percent of
Covered Payroll
2015 $44,022,120 $44,022,120 - $366,851,607 12�0%
2014 44,196,044 44,196,044 - 346,043,977 12�8
2013 45,427,520 45,427,520 - 331,233,703 13�7
2012 23,998,486 23,998,486 - 309,636,198 7�8
2011 23,280,520 23,280,520 - 296,205,802 7�9
2010 26,432,761 26,432,761 - 284,366,384 9�3
2009 23,397,299 23,397,299 - 258,452,005 9�1
2008 20,352,999 20,352,999 - 255,055,641 8�0
2007 19,241,579 19,241,579 - 236,141,304 8�1
2006 17,689,420 17,689,420 - 204,623,711 8�6
Schedule of Employer Contributions* Member-Directed Plan
Year Ended December 31
Actuarially Determined
Contributions Contributions Paid
Contribution Deficiency/ (Excess)
Covered Employee Payroll**
Contributions as a Percent of
Covered Payroll**
2015 $68,448,551 $68,448,551 - $488,918,191 14�0%
2014 47,851,530 47,851,530 - 446,803,577 10�7
2013 38,540,851 38,540,851 -
2012 35,646,573 35,646,573 -
2011 33,746,291 33,746,291 -
2010 29,527,197 29,527,197 -
2009 26,356,764 26,356,764 -
2008 24,411,834 24,411,834 -
2007 21,048,014 21,048,014 -
2006 16,363,129 16,363,129 -
Required Supplementary Information Financial Section
See Notes to Required Supplementary Information, beginning on page 79�
See accompanying Independent Auditors’ Report, beginning on page 20�
* The Board has approved all contribution rates recommended by the actuary� Actuarially determined contributions exclude funds deposited for purchase of service, employer-paid retirement incentive programs, interest and penalties� These deposits are included in Contract and Other Receipts in the Combining Statements of Changes in Fiduciary Net Position�
** Covered payroll calculated in conjunction with GASB 67 implementation in 2014�
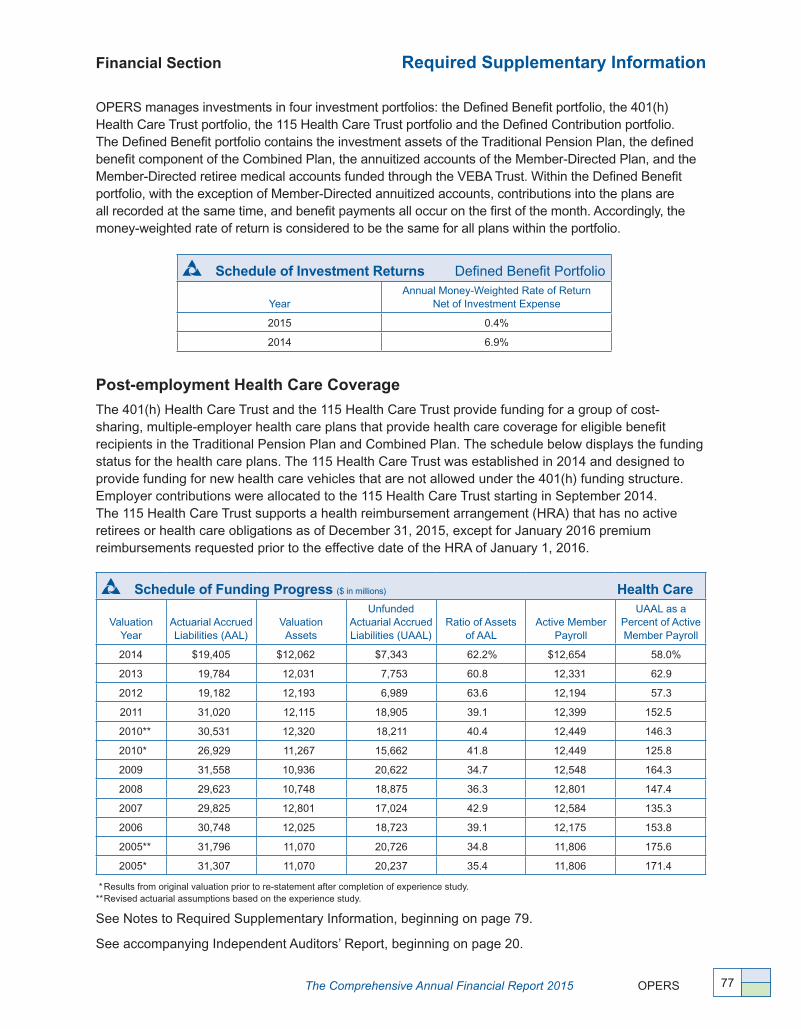
The Comprehensive Annual Financial Report 2015 OPERS 77
Financial Section Required Supplementary Information
OPERS manages investments in four investment portfolios: the Defined Benefit portfolio, the 401(h) Health Care Trust portfolio, the 115 Health Care Trust portfolio and the Defined Contribution portfolio� The Defined Benefit portfolio contains the investment assets of the Traditional Pension Plan, the defined benefit component of the Combined Plan, the annuitized accounts of the Member-Directed Plan, and the Member-Directed retiree medical accounts funded through the VEBA Trust� Within the Defined Benefit portfolio, with the exception of Member-Directed annuitized accounts, contributions into the plans are all recorded at the same time, and benefit payments all occur on the first of the month� Accordingly, the money-weighted rate of return is considered to be the same for all plans within the portfolio�
Schedule of Investment Returns Defined Benefit Portfolio
YearAnnual Money-Weighted Rate of Return
Net of Investment Expense
2015 0�4%
2014 6�9%
Post-employment Health Care Coverage
The 401(h) Health Care Trust and the 115 Health Care Trust provide funding for a group of cost-sharing, multiple-employer health care plans that provide health care coverage for eligible benefit recipients in the Traditional Pension Plan and Combined Plan� The schedule below displays the funding status for the health care plans� The 115 Health Care Trust was established in 2014 and designed to provide funding for new health care vehicles that are not allowed under the 401(h) funding structure� Employer contributions were allocated to the 115 Health Care Trust starting in September 2014� The 115 Health Care Trust supports a health reimbursement arrangement (HRA) that has no active retirees or health care obligations as of December 31, 2015, except for January 2016 premium reimbursements requested prior to the effective date of the HRA of January 1, 2016�
Schedule of Funding Progress ($ in millions) Health Care
Valuation Year
Actuarial Accrued Liabilities (AAL)
Valuation Assets
Unfunded Actuarial Accrued Liabilities (UAAL)
Ratio of Assets of AAL
Active Member Payroll
UAAL as a Percent of Active Member Payroll
2014 $19,405 $12,062 $7,343 62�2% $12,654 58�0%
2013 19,784 12,031 7,753 60�8 12,331 62�9
2012 19,182 12,193 6,989 63�6 12,194 57�3
2011 31,020 12,115 18,905 39�1 12,399 152�5
2010** 30,531 12,320 18,211 40�4 12,449 146�3
2010* 26,929 11,267 15,662 41�8 12,449 125�8
2009 31,558 10,936 20,622 34�7 12,548 164�3
2008 29,623 10,748 18,875 36�3 12,801 147�4
2007 29,825 12,801 17,024 42�9 12,584 135�3
2006 30,748 12,025 18,723 39�1 12,175 153�8
2005** 31,796 11,070 20,726 34�8 11,806 175�6
2005* 31,307 11,070 20,237 35�4 11,806 171�4
See Notes to Required Supplementary Information, beginning on page 79�
See accompanying Independent Auditors’ Report, beginning on page 20�
* Results from original valuation prior to re-statement after completion of experience study� ** Revised actuarial assumptions based on the experience study�
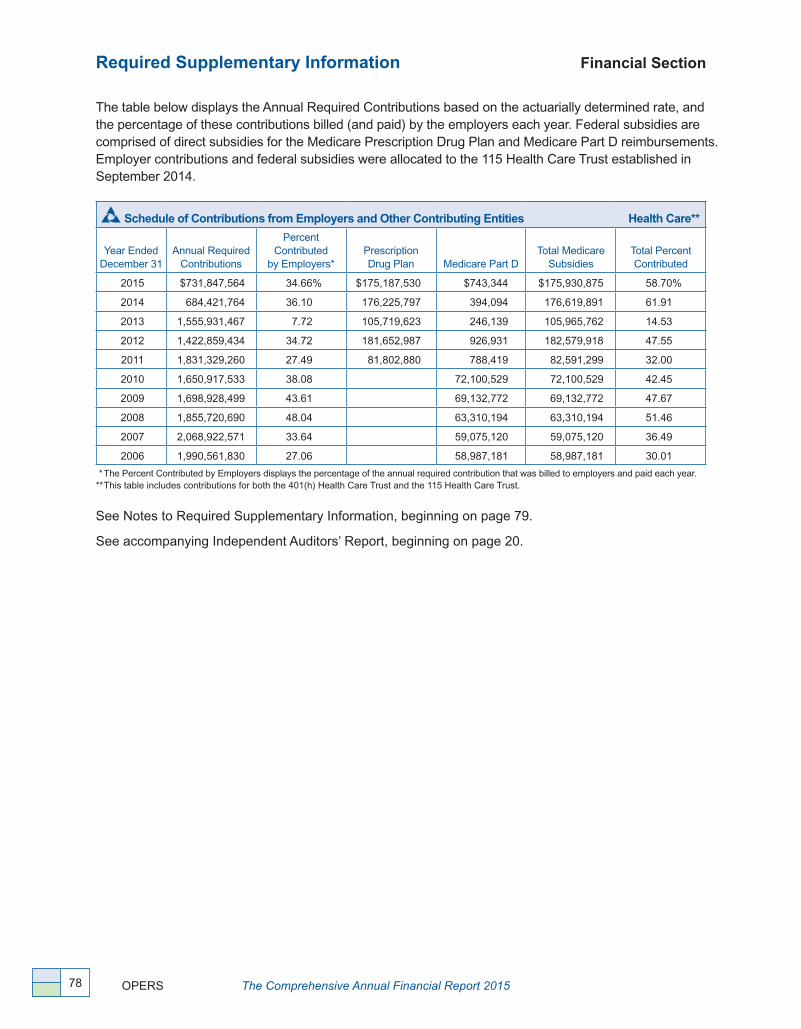
OPERS The Comprehensive Annual Financial Report 201578
The table below displays the Annual Required Contributions based on the actuarially determined rate, and the percentage of these contributions billed (and paid) by the employers each year� Federal subsidies are comprised of direct subsidies for the Medicare Prescription Drug Plan and Medicare Part D reimbursements� Employer contributions and federal subsidies were allocated to the 115 Health Care Trust established in September 2014�
Schedule of Contributions from Employers and Other Contributing Entities Health Care**
Year Ended December 31
Annual Required Contributions
Percent Contributed
by Employers*Prescription Drug Plan Medicare Part D
Total Medicare Subsidies
Total Percent Contributed
2015 $731,847,564 34�66% $175,187,530 $743,344 $175,930,875 58�70%
2014 684,421,764 36�10 176,225,797 394,094 176,619,891 61�91
2013 1,555,931,467 7�72 105,719,623 246,139 105,965,762 14�53
2012 1,422,859,434 34�72 181,652,987 926,931 182,579,918 47�55
2011 1,831,329,260 27�49 81,802,880 788,419 82,591,299 32�00
2010 1,650,917,533 38�08 72,100,529 72,100,529 42�45
2009 1,698,928,499 43�61 69,132,772 69,132,772 47�67
2008 1,855,720,690 48�04 63,310,194 63,310,194 51�46
2007 2,068,922,571 33�64 59,075,120 59,075,120 36�49
2006 1,990,561,830 27�06 58,987,181 58,987,181 30�01
Required Supplementary Information Financial Section
See Notes to Required Supplementary Information, beginning on page 79�
See accompanying Independent Auditors’ Report, beginning on page 20�
* The Percent Contributed by Employers displays the percentage of the annual required contribution that was billed to employers and paid each year�** This table includes contributions for both the 401(h) Health Care Trust and the 115 Health Care Trust�
The Comprehensive Annual Financial Report 2015 OPERS 79
Financial Section Notes to Required Supplementary Information
Defined Benefit Pension Plans
Actuarial Assumptions and Methods Used in Determining Contribution Rates
Actuarially determined contributions are constrained by contribution limits established by statute� Contribution rates are calculated as of December 31, three years prior to the end of the fiscal year in which contributions are reported� The actuarial assumptions and methods used to determine contribution rates are described below based on the actuarial valuation study for the year ended December 31, 2015�
➢ ValuationMethod—Individual entry age actuarial cost method of valuation is used in determining benefit liabilities and normal cost� Differences between assumed and actual experience (the actuarial gains and losses) become part of the total pension liability�
➢ AssetValuationMethod—For actuarial purposes, assets are valued utilizing a method that recognizes assumed investment returns fully each year� Differences between actual and assumed investment returns are phased in over a closed four-year period� This funding value is not permitted to deviate from fair value by a corridor of plus or minus 12�00%�
➢ AmortizationMethod—Level percent of payroll, closed amortization period�
➢ InvestmentReturn—An investment rate of return of 8�00% compounded annually was assumed for all members, retirees, and beneficiaries�
➢ WageInflation—The active member payroll was assumed to increase 3�75% annually, which is the portion of the individual pay increase assumption attributable to inflation and overall productivity�
➢ SalaryScale—Wage inflation plus additional projected salary increases ranging from 0�50% to 6�30% per year depending on age, attributable to seniority and merit�
Factors Significantly Affecting Trends in Reported Amounts
There were no recent significant changes of benefit terms, investment policies, the size or composition of the population covered by the benefit terms, or assumptions impacting the actuarial valuation study for the year ended December 31, 2015, since the last study performed as of December 31, 2014�
Post-employment Health Care Coverage
Description of Schedule of Funding Progress OPERS-provided health care coverage is neither a guaranteed nor statutorily required benefit� OPERS primary funding responsibility is to pensions� Health care plans are funded from a portion of the employer contribution as approved by the Board each year, after consideration of the funding needs of the pension plans�
Each time a health care plan enhancement is made that applies to service already rendered, an unfunded actuarial accrued liability is created� These additional liabilities are financed systematically over a period of future years� In addition, if actual financial experiences are less favorable than assumed financial experiences, the difference is added to the unfunded actuarial accrued liability�
In an inflationary economy, the value of the dollar is decreasing� This environment typically results in employee pay increasing in dollar amount, with a corresponding increase in the employer contributions to valuation assets� During recessionary periods, employee pay may decrease or remain constant, resulting in a potential reduction in the corresponding employer contributions to health care while the employee’s eligibility for health care continues to grow� Unfunded actuarial
OPERS The Comprehensive Annual Financial Report 201580
accrued liabilities divided by active employee payroll provides an index that adjusts for the effects of inflation or recession� The smaller the ratio of unfunded actuarial accrued liabilities to active member payroll, the more secure retiree health care coverage is considered to be� Observation of this relative index over a period of years will give an indication of whether health care plan funding is becoming financially stronger or weaker�
Actuarial Assumptions and MethodsThe actuarial assumptions and methods described below are based on the most recent actuarial valuation study for health care for the year ended December 31, 2014�
➢ Funding Method—An individual entry-age normal actuarial-cost method of valuation is used in determining liabilities and normal cost� Differences between assumed and actual experience (the actuarial gains and losses) become part of unfunded actuarial accrued liabilities� Unfunded actuarial accrued liabilities are amortized over a period of time to produce payments that are a level percent of payroll contributions based on an open amortization period�
➢ Asset Valuation Method—For actuarial purposes, assets are valued utilizing a method that recognizes assumed investment returns fully each year� Differences between actual and assumed investment returns are phased in over a closed four-year period� This funding value is not permitted to deviate from fair value by a corridor of plus or minus 12�00%�
➢ Significant Actuarial Assumptions—Assumptions employed by the actuary for funding purposes as of December 31, 2014, the date of the latest actuarial study, include:
• Investment Return—An investment return rate of 5�00% compounded annually�
• Salary Scale—The active member payroll was assumed to increase 3�75% annually for 2014, which is the portion of the individual pay increase assumption attributable to inflation and overall productivity� Also assumed were additional projected salary increases ranging from 0�50% to 6�30% per year depending on age, attributable to seniority and merit for 2014�
• Benefit Payment—For the 2014 valuation, health care expenses are assumed to increase initially at 9�00% before leveling off to 3�75% in 2024�
➢ Multiple Decrement Tables
• Mortality—The rates used for retiree allowances were the RP-2000 mortality table projected 20 years using Projection Scale AA� For males, 105% of the combined healthy male mortality rates were used� For females, 100% of the combined healthy female mortality rates were used�
The rates used for disability allowances were the RP-2000 mortality table with no projection� For males, 120% of the disabled female mortality rates are used, set forward two years� For females, 100% of the disabled female mortality rates are used�
Notes to Required Supplementary Information Financial Section

The Comprehensive Annual Financial Report 2015 OPERS 81
Financial Section Additional Information
Administrative Expenses (for the year ended December 31, 2015) Personnel Expenses
Wages and Salaries $47,674,450
Retirement Contributions —OPERS 6,294,951
Retirement Contributions—Medicare 658,561
Employee Insurance 9,106,395
Other Personnel Expense 257,143
Purchased Services and Supplies
Professional expenses
Audit Services 547,542
Actuarial Services 682,920
Consulting Services 608,055
Investment and Financial Services 15,171,328
Legal and Investigation Services 1,969,255
Medical Examinations 1,126,596
Retirement Study Council 370,363
Custodial and Banking Fees 5,252,418
Information Technology 7,676,150
Communications 2,731,540
Office Supplies, Equipment and Other Miscellaneous 725,670
Education—Member and Staff 1,355,021
Facility Expenses 4,208,200
Subtotal Operating Expenses 106,416,558
Depreciation Expense
Building 2,331,446
Furniture and Equipment 8,145,457
Subtotal Depreciation 10,476,903
Total Administrative Expenses 116,893,461
Investment Expenses (39,856,777)
Net Administrative Expenses $77,036,684
Schedule of Investment Expenses* (for the year ended December 31, 2015)
Investment Staff Expense $16,372,120
Investment Services 20,397,571
Investment Legal Services 819,150
Allocation of Administrative Expenses (See Note 2b to Financial Statements) 2,267,936
Total Investment Expenses $39,856,777
*Excludes fees and commissions, please see Schedules of Brokerage Commissions Paid beginning on page 96�

Required Supplementary Information Financial Section
OPERS The Comprehensive Annual Financial Report 201582
This page intentionally left blank

The investment markets wax and wane� We know that� In the past 80 years, OPERS has observed and invested through strong, poor and indifferent markets� We understand this� As a long-term investor, the OPERS investment professionals anticipate both robust and volatile market cycles� We work to maintain our balance so that risk is mitigated and opportunities are maximized� We remain diligent in our funding process and absolute adherence to asset allocation strategies� Our philosophy works; for the last eight decades, OPERS has generated the investment income necessary to meet our obligations—as reliably as the moon�
Note: This section is unaudited.
InvestmentSection
“ The moon is an example of practiced stability… it wanes when it must, and reliably returns to full strength… it is a humble model of reasonable potential.”
Terry Crawford Palardy, teacher, author
OPERS The Comprehensive Annual Financial Report 201584
Ohio Public Employees Retirement System277 East Town Street Columbus, Ohio 43215-4642 1-800-222-7377 www.opers.org
Dear Members and Beneficiaries:
It’s a privilege to deliver this introduction to the Investment Section� This annual letter gives me the opportunity to provide an overview of the activities of the Investment Division staff—and the capital markets environment for the year� My goal is to provide a real-world picture of our results as well as how and why those results have been achieved� Although investment experts rarely agree on much, all agree that open exchange of information is the best way to balance the expectations of all audiences—professionals as well as non-investment professionals�
The balanced record—a review of 2015
Obviously, OPERS is in the position of reacting to, not shaping, global and domestic economic forces� Through any economic climate, the OPERS investment portfolio must continue to produce returns that, measured over the long-term, will sustain the pension funded status of the System—and, secondarily, provide for access to quality health care for retirees� We have done so for pension for the past 80 years and for health care since 1974, and expect to do so for the next 80 years, and beyond�
The year 2015 was not strong for financial markets� As we entered 2015, Wall Street signaled robust expectations for the market—some major emerging markets were solid, U�S� unemployment was low, and most experts expected the Federal Reserve to raise interest rates—signaling faith in the U�S� economy and the ongoing recovery from the great recession� Taken broadly, the expectations did not become reality and returns were very muted� U�S� stocks returned only 1�4% after dividends, and U�S� bonds returned only 0�5%� For stocks, this was the worst return since the Global Financial Crisis in 2008, and for bonds, it was the third-worst return in 20 years� Still, at least both returns were positive� In much of the developed world, interest rates were negative—meaning people are investing in the safety of lending money to governments instead of risking it in business endeavors, real estate or stocks�
Many factors contributed to the flat market performance, but most experts agree the biggest negative contributors were the sharp drop in commodity prices, restrained fiscal policies, and ongoing concerns about the growth rate of China’s economy� Significantly, the stronger dollar also hurt U�S� corporations with overseas sales� The result? Earnings for 2015 did not meet earlier expectations�
Only a handful of stocks supported the overall market performance, preventing what would have been a strongly negative year without their results� This narrow market is frustrating for diversified investors such as OPERS with portfolios built on a broad range of asset classes� Narrowly driven markets make garnering strong returns extremely challenging�
Report from the Chief Investment Officer Investment Section (unaudited)

The Comprehensive Annual Financial Report 2015 OPERS 85
Investment Section Report from the Chief Investment Officer
We saw a similar market in 2011 when a handful of stocks drove market gains� History shows us that broad diversification means overall performance will never be as great as the best asset class—but neither will the performance be aligned with the poorest performer� Diversification mitigates risk and aims for moderation—and, historically, has proven to be the right path as diversification ultimately brings much greater value to the long-term investor who is disciplined and rebalances� Markets don’t just deliver a steady 8%; instead, something like a 0% and a 16% are generated, that average an 8%� OPERS is positioned to survive the zero percent, and therefore expects to be here to collect the 16%�
Global economy
The global market did worse than the U�S� in 2015� Domestically, economists believe the U�S� economy was and continues to be in a growth phase led by consumer spending—spending fueled by low energy prices, a housing-price rebound, low interest rates, higher employment, and some modest wage growth� Government spending is also increasing and will help reinforce the consumer spending� These factors were, and are, signs of continued economic recovery in the U�S�
In contrast, the global economy continued to handicap market growth and limit strong returns� The continuing slowdown, from a very high rate, of the China economy resulted in a commodities bust and a slowdown in overall global trade� Additionally, the country-specific woes of some emerging economies (Russia and Brazil) also created uncertainty in the market� These unsettling factors all conspired to slow economic growth abroad and cause markets to react with higher volatility—a reaction we saw multiple times in 2015—and ultimately resulted in the flat returns for the year, with non-U�S� losses offsetting very modest U�S� gains�
OPERS’ investment highlights for 2015
While it’s unlikely to get complete consensus from investment analysts, it’s interesting to note that the most significant, and consistent, message from internal and external experts for investing in any economy is: Keep asset allocation plans intact in both strong and weak markets�
Adhering to Board policies, OPERS did just that in 2015� While the actuarially established benchmark return for each portfolio was not attained, the Defined Benefit portfolio did provide a positive return and, most importantly, remained positioned for better results� Here’s an overview:
• ManyassetclasseswithintheOPERSportfolioexceededbenchmarks.• Investmentreturnscontributed$246milliontotheinvestedassetbasefortheDefined
Benefit portfolio, which stood at $74�4 billion as of year-end�• Investmentreturns,afterfees,were0.33%fortheDefinedBenefitportfolio.• The401(h)HealthCareTrustportfolio(formerlytheHealthCareportfolio)returneda
disappointing (2�18%), to end the year at $10�8 billion in invested assets�
A significant accomplishment for the Investment Division staff was the completion of the seven-year rebalancing project� As part of that rebalancing and as ongoing positioning for the future, Investment Division staff took the initiative to re-assess (and rebalance) some legacy investments and recommended actions to reduce portfolio risk�

OPERS The Comprehensive Annual Financial Report 201586
Report from the Chief Investment Officer Investment Section
The total OPERS portfolio now has all asset classes within the ranges defined by Board policy� Although this rebalancing reduced the portfolio exposure in U�S� stocks during a period when U�S� stocks were generally stronger than global markets, the project still captured much of those returns while positioning the OPERS portfolio to better withstand future market drawdowns� Again, as with all risk-reward balancing—OPERS’ returns will never be as low as the lowest in any given year; nor will our highs be as high�
Looking ahead at 2016
Looking back doesn’t predict the future—however; historic trends do provide insights that can help manage expectations� Simply put, the market is in a correction phase and is likely to remain slow for the coming year� This is the reality; even as the System has more need for strong return income than ever before—as we work to improve the funded status of the pension portfolio and maintain the viability of the health care funding�
Flat markets and strong needs for return will require us to focus to maintain our balance� I believe we are up to the challenge� Most market environments will provide areas of opportunity� The OPERS investment staff has the talent and the expertise to identify those areas of growth and maximize those opportunities—without jeopardizing established growth�
Remember, through ups and downs, the market, over time, has continued to move up� This staff is dedicated to continue the tradition OPERS has established and maintained for 80 years� We know how to ask the right questions and make the decisions to maintain the balance of the portfolio, mitigate risk, and provide the returns necessary for the System to continue the tradition of providing a secure financial future for our members� It is our professional responsibility and personal commitment to do just that�
In appreciation,
Richard ShaferChief Investment Officer
(A) The members of the public employees retirement board shall be the trustees of the funds created by section 145�23 of the Revised Code� The board shall have full power to invest the funds� The board and other fiduciaries shall discharge their duties with respect to the funds solely in the interest of the participants and beneficiaries; for the exclusive purpose of providing benefits to participants and their beneficiaries and defraying reasonable expenses of administering the public employees retirement system; with care, skill, prudence, and diligence under the circumstances then prevailing that a prudent person acting in a like capacity and familiar with these matters would use in the conduct of an enterprise of a like character and with like aims; and by diversifying the investments of the system so as to minimize the risk of large losses, unless under the circumstances it is clearly prudent not to do so�
(B) In exercising its fiduciary responsibility with respect to the investment of the funds, it shall be the intent of the board to give consideration to investments that enhance the general welfare of the state and its citizens where the investments offer quality, return, and safety comparable to other investments currently available to the board� In fulfilling this intent, equal consideration shall also be given to investments otherwise qualifying under this section that involve minority owned and controlled firms and firms owned and controlled by women either alone or in joint venture with other firms�
Note: The OPERS investment assets reported in the Investment Section are presented on the same basis of accounting as described in Note 2b of the Notes to Combining Financial Statements, generally fair value�
The rates of return reported in the Investment Section are presented using a time-weighted rate of return methodology based upon market values, unless disclosed otherwise in the footnotes to the associated tables� All returns presented throughout the Investment Section are net of external manager fees, overdraft charges, debit interest, registration expenses, stamp duties and taxes spent on foreign securities� In addition, the securities lending money market returns are net of custodial fees, transfer agent expenses and professional fees�
Board Investment and Fiduciary Duties (Excerpt of ORC 145.11)

The Comprehensive Annual Financial Report 2015 OPERS 87
This page intentionally left blank
OPERS The Comprehensive Annual Financial Report 201588
Independent Investment Consultant’s Report Investment Section

The Comprehensive Annual Financial Report 2015 OPERS 89
Investment Section Independent Investment Consultant’s Report
OPERS The Comprehensive Annual Financial Report 201590
Overview Investment Section
Introduction
The total OPERS investment portfolio, as reflected in the Combining Statements of Fiduciary Net Position, pages 38-39, is comprised of Defined Benefit, the 401(h) Health Care Trust, the 115 Health Care Trust, and Defined Contribution portfolio assets� The Defined Benefit portfolio assets originate from Traditional Pension Plan member and employer contributions, employer contributions to the Combined Plan, Member-Directed Retiree Medical Accounts funded through the Voluntary Employees’ Beneficiary Association (VEBA) Trust, and funds transferred from defined contribution accounts for defined benefit annuities� The management of these assets is the responsibility of the Investment staff, adhering to the policies approved by the OPERS Board of Trustees (Board)�
In 2005, the 401(h) Health Care Trust portfolio assets were segregated from the pension portfolio and invested with a more conservative asset-allocation strategy� The 401(h) Health Care Trust portfolio is comprised of assets set aside to provide post-employment health care for the retirees of the Traditional Pension Plan and Combined Plan� In 2014, the 115 Health Care Trust portfolio was created as another funding vehicle for post-employment health care for members in the Traditional Pension Plan and Combined Plan� OPERS will use both trusts to fund health care expenses� Assets were segregated into the 115 Health Care Trust beginning in September 2014 with the initial health care disbursements from this trust commencing in late 2015 for January 2016 premium reimbursements�
Defined Contribution portfolio assets originate from member contributions to the Combined Plan and both member and employer contributions to the Member-Directed Plan� The investment of Defined Contribution portfolio assets is self-directed by members of the Combined and Member-Directed plans, but is primarily limited to investment options approved by the Board�
Investment summary
The Total Investment Summary (starting on page 91) relates to the System-wide investments and includes the assets of all four portfolios� The balance of information in this Investment Section is organized as follows: Defined Benefit portfolio investments (pages 101-105) relating exclusively to the Defined Benefit assets (including VEBA mentioned above); 401(h) Health Care Trust portfolio investments (pages 107-111) relating exclusively to the health care assets in the 401(h) Health Care Trust; 115 Health Care Trust portfolio investments (pages 113-117) relating exclusively to the 115 Health Care Trust assets; and Defined Contribution portfolio investments (pages 119-121) relating exclusively to the Defined Contribution assets� The Investment Objectives and Policies and Asset Class Policies (pages 123-135) provide information on System-wide investment policies and performance objectives�
A complete listing of assets held at December 31, 2015, is available from OPERS upon request� All returns presented throughout the Investment Section are net of external manager fees, overdraft charges, debit interest, registration expenses, stamp duties and taxes spent on foreign securities� In addition, the securities lending money market returns are net of custodial fees, transfer agent expenses and professional fees�
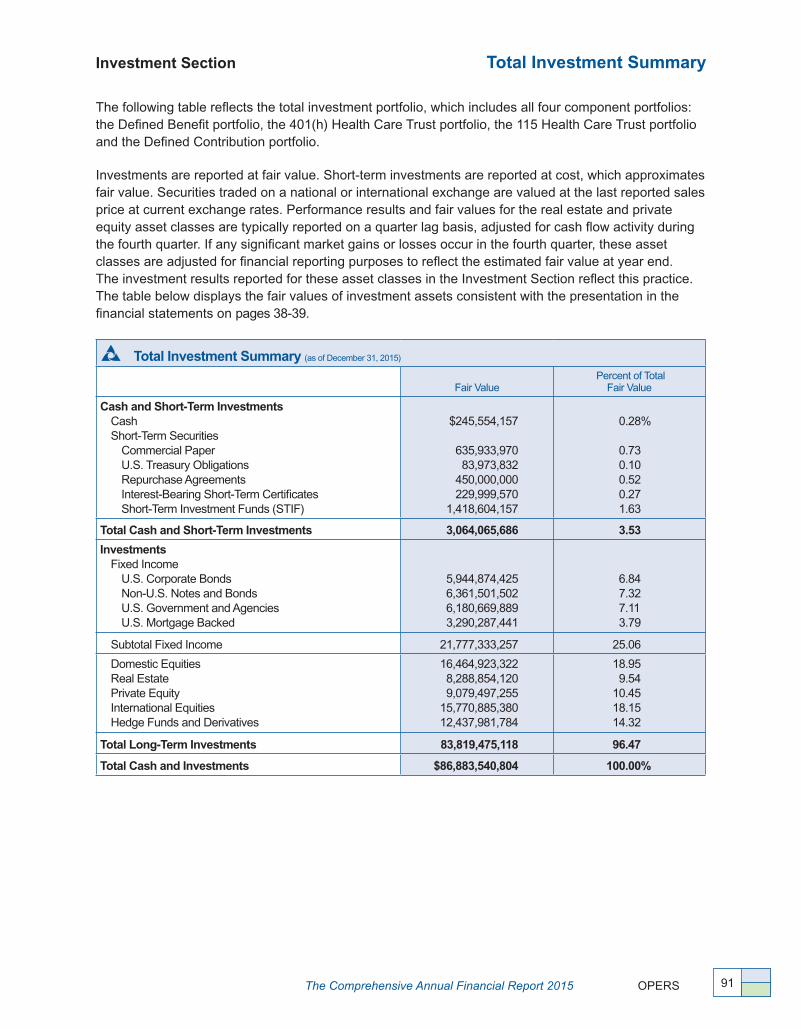
The Comprehensive Annual Financial Report 2015 OPERS 91
Investment Section Total Investment Summary
The following table reflects the total investment portfolio, which includes all four component portfolios: the Defined Benefit portfolio, the 401(h) Health Care Trust portfolio, the 115 Health Care Trust portfolio and the Defined Contribution portfolio�
Investments are reported at fair value� Short-term investments are reported at cost, which approximates fair value� Securities traded on a national or international exchange are valued at the last reported sales price at current exchange rates� Performance results and fair values for the real estate and private equity asset classes are typically reported on a quarter lag basis, adjusted for cash flow activity during the fourth quarter� If any significant market gains or losses occur in the fourth quarter, these asset classes are adjusted for financial reporting purposes to reflect the estimated fair value at year end� The investment results reported for these asset classes in the Investment Section reflect this practice� The table below displays the fair values of investment assets consistent with the presentation in the financial statements on pages 38-39�
Total Investment Summary (as of December 31, 2015)
Fair Value Percent of Total
Fair Value
Cash and Short-Term InvestmentsCashShort-Term Securities
Commercial PaperU�S� Treasury ObligationsRepurchase AgreementsInterest-Bearing Short-Term CertificatesShort-Term Investment Funds (STIF)
$245,554,157
635,933,970 83,973,832
450,000,000 229,999,570
1,418,604,157
0�28%
0�730�100�520�271�63
Total Cash and Short-Term Investments 3,064,065,686 3.53
InvestmentsFixed Income
U�S� Corporate BondsNon-U�S� Notes and BondsU�S� Government and AgenciesU�S� Mortgage Backed
5,944,874,425 6,361,501,502 6,180,669,889 3,290,287,441
6�847�327�113�79
Subtotal Fixed Income 21,777,333,257 25�06
Domestic EquitiesReal EstatePrivate EquityInternational EquitiesHedge Funds and Derivatives
16,464,923,322 8,288,854,120 9,079,497,255
15,770,885,380 12,437,981,784
18�959�54
10�4518�1514�32
Total Long-Term Investments 83,819,475,118 96.47
Total Cash and Investments $86,883,540,804 100.00%
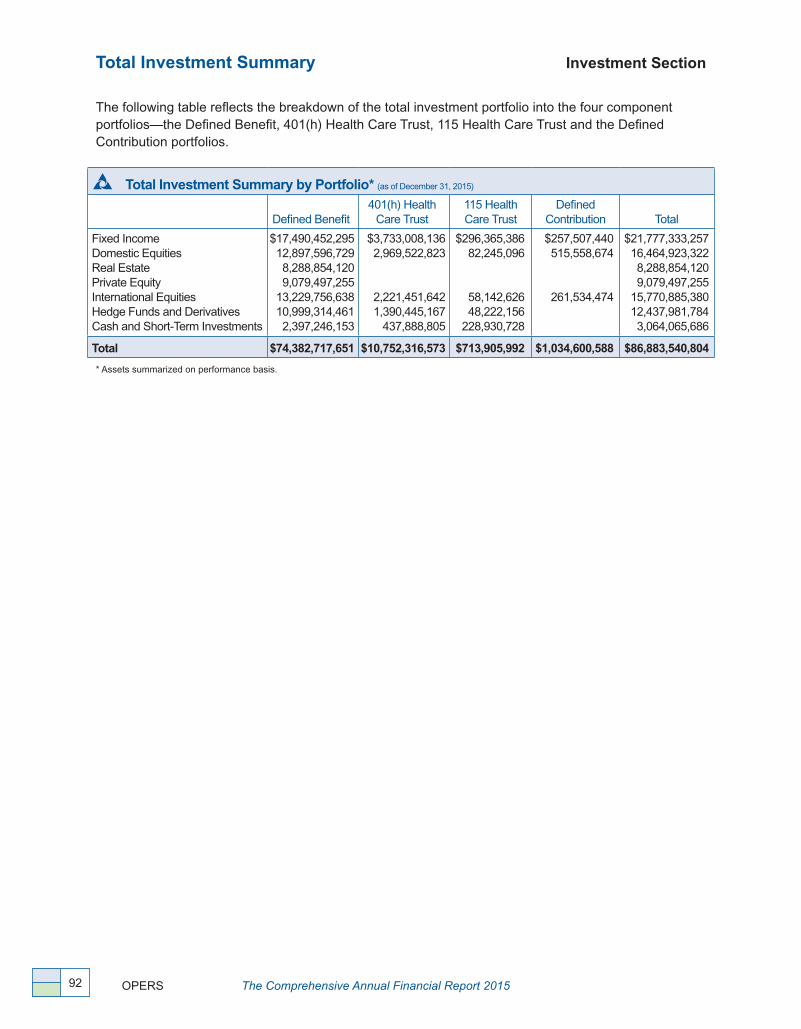
OPERS The Comprehensive Annual Financial Report 201592
Total Investment Summary Investment Section
The following table reflects the breakdown of the total investment portfolio into the four component portfolios—the Defined Benefit, 401(h) Health Care Trust, 115 Health Care Trust and the Defined Contribution portfolios�
Total Investment Summary by Portfolio* (as of December 31, 2015)
Defined Benefit401(h) Health
Care Trust115 Health Care Trust
Defined Contribution Total
Fixed IncomeDomestic EquitiesReal EstatePrivate EquityInternational EquitiesHedge Funds and DerivativesCash and Short-Term Investments
$17,490,452,29512,897,596,7298,288,854,1209,079,497,255
13,229,756,63810,999,314,461 2,397,246,153
$3,733,008,1362,969,522,823
2,221,451,6421,390,445,167 437,888,805
$296,365,38682,245,096
58,142,62648,222,156
228,930,728
$257,507,440515,558,674
261,534,474
$21,777,333,257 16,464,923,322 8,288,854,120 9,079,497,255
15,770,885,380 12,437,981,784 3,064,065,686
Total $74,382,717,651 $10,752,316,573 $713,905,992 $1,034,600,588 $86,883,540,804
* Assets summarized on performance basis�
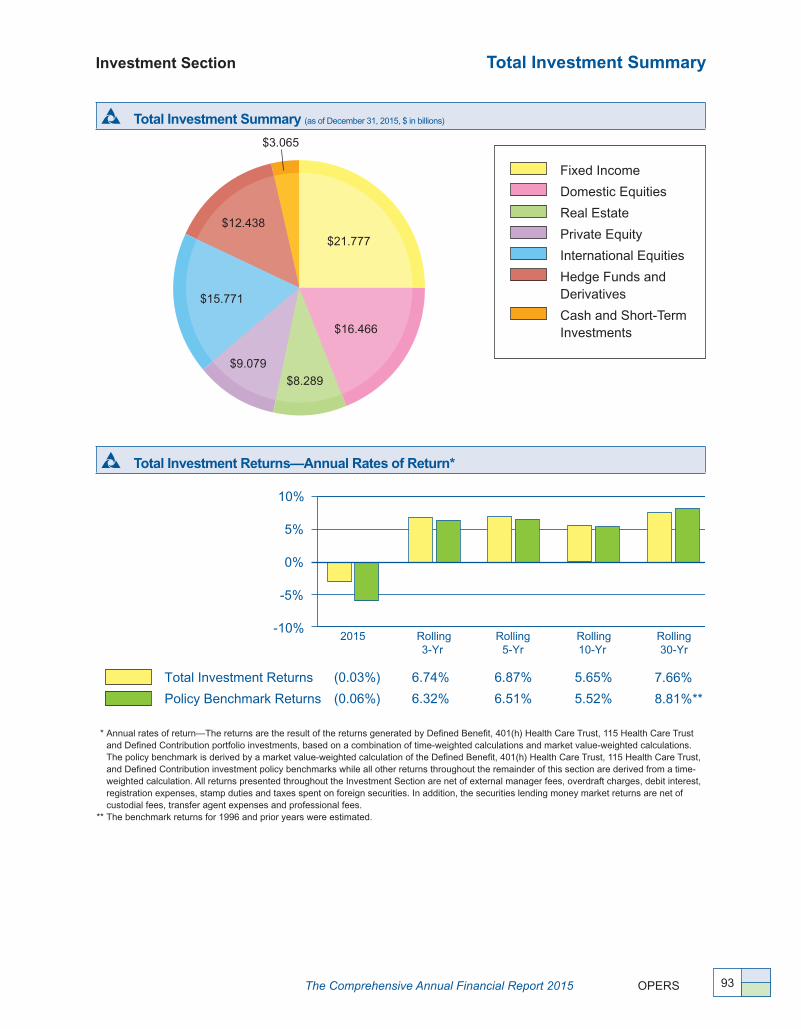
The Comprehensive Annual Financial Report 2015 OPERS 93
Investment Section Total Investment Summary
Total Investment Summary (as of December 31, 2015, $ in billions)
Fixed Income
Domestic Equities
Real Estate
Private Equity
International Equities
Hedge Funds and Derivatives
Cash and Short-Term Investments
$3�065
$21�777
$16�466
$8�289
$9�079
$15�771
$12�438
Total Investment Returns—Annual Rates of Return*
-10%
Total Investment Returns
Policy Benchmark Returns
-5%
0%
5%
10%
Rolling10-Yr
5.65%
5.52%
Rolling3-Yr
6.74%
6.32%
2015
(0.03%)
(0.06%)
Rolling5-Yr
6.87%
6.51%
7.66%
8.81%**
Rolling30-Yr
* Annual rates of return —The returns are the result of the returns generated by Defined Benefit, 401(h) Health Care Trust, 115 Health Care Trust and Defined Contribution portfolio investments, based on a combination of time-weighted calculations and market value-weighted calculations� The policy benchmark is derived by a market value-weighted calculation of the Defined Benefit, 401(h) Health Care Trust, 115 Health Care Trust, and Defined Contribution investment policy benchmarks while all other returns throughout the remainder of this section are derived from a time-weighted calculation� All returns presented throughout the Investment Section are net of external manager fees, overdraft charges, debit interest, registration expenses, stamp duties and taxes spent on foreign securities� In addition, the securities lending money market returns are net of custodial fees, transfer agent expenses and professional fees�
** The benchmark returns for 1996 and prior years were estimated�

OPERS The Comprehensive Annual Financial Report 201594
Historical Investment Returns Investment Section
Historical Investment Returns
YearTotal Portfolio
ReturnTotal Defined
Benefit Return*
Total 401(h) Health Care Trust Return*
Total 115 Health Care Trust Return**
Total Defined Contribution Return***
2015 (0�03%) 0�33% (2�18%) (3�23%) (1�71%)
2014 6�70 6�96 5�28 (0�03) 4�83
2013 14�00 14�38 11�36 20�45
2012 14�40 14�54 13�72 13�37
2011 0�20 0�36 (0�38) (2�59)
2010 13�90 13�98 13�93 13�74
2009 20�06 19�09 24�80 26�44
2008 (26�92) (27�15) (25�77) (28�00)
2007 8�52 8�89 6�87 5�80
2006 14�66 15�05 12�78 12�96
2005 9�03 9�25 8�00 6�88
2004 12�49 12�50 9�73
2003 25�39 25�39
2002 (10�73) (10�73)
2001 (4�58) (4�58)
2000 (0�71) (0�71)
1999 12�10 12�10
1998 14�45 14�45
1997 13�37 13�37
1996 7�85 7�85
1995 20�47 20�47
1994 (0�02) (0�02)
1993 9�72 9�72
1992 5�66 5�66
1991 15�68 15�68
1990 6�30 6�30
1989 18�38 18�38
1988 9�25 9�25
1987 1�29 1�29
1986 15�21 15�21
* Prior to 2005, the 401(h) Health Care Trust assets were included in the Defined Benefit portfolio� In 2005, the 401(h) Health Care Trust assets were segregated from the Defined Benefit portfolio into a separate portfolio with portfolio-specific asset allocation and investment policies� Accordingly, Defined Benefit returns for 2004 and prior represent a composite of the Defined Benefit and 401(h) Health Care Trust assets�
** The 115 Health Care Trust was established in September 2014� Returns are two-month cumulative returns in 2014 since funding of the 115 Health Care Trust portfolio began in November 2014�
***Defined Contribution plans commenced January 1, 2003, with a separate portfolio established in 2004�

The Comprehensive Annual Financial Report 2015 OPERS 95
Investment Section Lists of Largest Assets Held
Largest Equity Holdings (by fair value)* (as of December 31, 2015)
Description Shares Fair Value
Apple, Incorporated 4,264,221 $448,851,902
Microsoft Corporation 6,040,948 335,151,795
Exxon Mobil Corporation 3,126,948 243,745,597
General Electric Company 7,023,828 218,792,242
Johnson & Johnson Company 2,067,318 212,354,905
Amazon�com, Inc� 282,634 191,029,494
Wells Fargo & Company 3,451,451 187,620,876
JPMorgan Chase & Co� 2,744,504 181,219,599
Berkshire Hathaway Inc� 1,356,992 179,177,224
Facebook, Inc� 1,610,113 168,514,427
Total 31,968,957 $2,366,458,061
Largest Bond Holdings (by fair value)* (as of December 31, 2015)
Description Coupon Maturity Rating Par Value Fair Value
U�S� Treasury Note 1�625% 11/30/2020 AAA $290,221,000 $288,511,607
U�S� Treasury Note 0�875 10/15/2018 AAA 215,886,000 213,519,887
U�S� Treasury Note 0�750 10/31/2017 AAA 204,659,000 203,566,127
U�S� Treasury Note 1�375 9/30/2020 AAA 160,476,000 157,714,206
U�S� Treasury Bond 2�875 5/15/2043 AAA 153,769,000 150,023,192
U�S� Treasury Note 1�750 10/31/2020 AAA 150,000,000 149,793,000
U�S� Treasury Note 1�000 5/15/2018 AAA 138,979,000 138,318,853
U�S� Treasury Note 1�250 12/15/2018 AAA 134,351,000 134,062,151
U�S� Treasury Note 0�625 9/30/2017 AAA 130,729,000 129,833,509
U�S� Treasury Note 2�000 9/30/2020 AAA 118,642,000 119,944,689
Total $1,697,712,000 $1,685,287,221
*A complete list of assets held at December 31, 2015 is available from OPERS upon request�

OPERS The Comprehensive Annual Financial Report 201596
Schedules of Brokerage Commissions Paid Investment Section
U.S. Equity Commissions (for the year ended December 31, 2015)
Brokerage FirmU�S� Equity
Commissions Paid Shares TradedAverage Commission
Per Share
UBS Securities LLC $734,965 63,710,772 $0�012
Credit Suisse Securities (USA) LLC 505,957 35,221,650 0�014
J�P� Morgan Securities LLC 194,062 13,461,076 0�014
Liquidnet, Inc� 168,303 8,441,229 0�020
Citigroup Global Markets Inc� 149,916 9,271,984 0�016
Weeden & Co� 141,671 18,017,815 0�008
Investment Technology Group Inc� 108,053 9,146,425 0�012
RBC Capital Markets 101,571 5,804,516 0�017
Goldman Sachs & Co� 97,450 4,910,303 0�020
Merrill Lynch & Co�, Inc� 97,342 12,033,855 0�008
Morgan Stanley & Co� Inc� 96,650 5,936,300 0�016
The Bank of New York Mellon 80,176 3,778,908 0�021
Stifel, Nicolaus & Company, Incorporated 49,150 1,953,915 0�025
Deutsche Bank Securities Inc� 47,779 3,828,826 0�012
Cantor Fitzgerald & Co�, Inc� 33,897 1,690,879 0�020
Jefferies & Company, Inc� 33,393 1,661,212 0�020
Instinet 27,880 3,827,807 0�007
JonesTrading Institutional Services, LLC 27,412 1,828,847 0�015
Barclays Capital Inc� 26,567 1,197,790 0�022
Sanford C� Bernstein & Co�, Inc� 24,037 2,863,610 0�008
KCG Holdings, Inc� 22,241 882,996 0�025
Oppenheimer & Co�, Inc� 22,102 1,083,061 0�020
HSBC Securities (USA) Inc� 21,444 3,251,337 0�007
Keefe, Bruyette & Woods Inc� 21,375 725,945 0�029
BMO Capital Markets Corp� 20,197 895,821 0�023
Other Commissions less than $20,000 253,690 16,850,551 0�015
Total U.S. Equity Commissions $3,107,280 232,277,430 $0.013
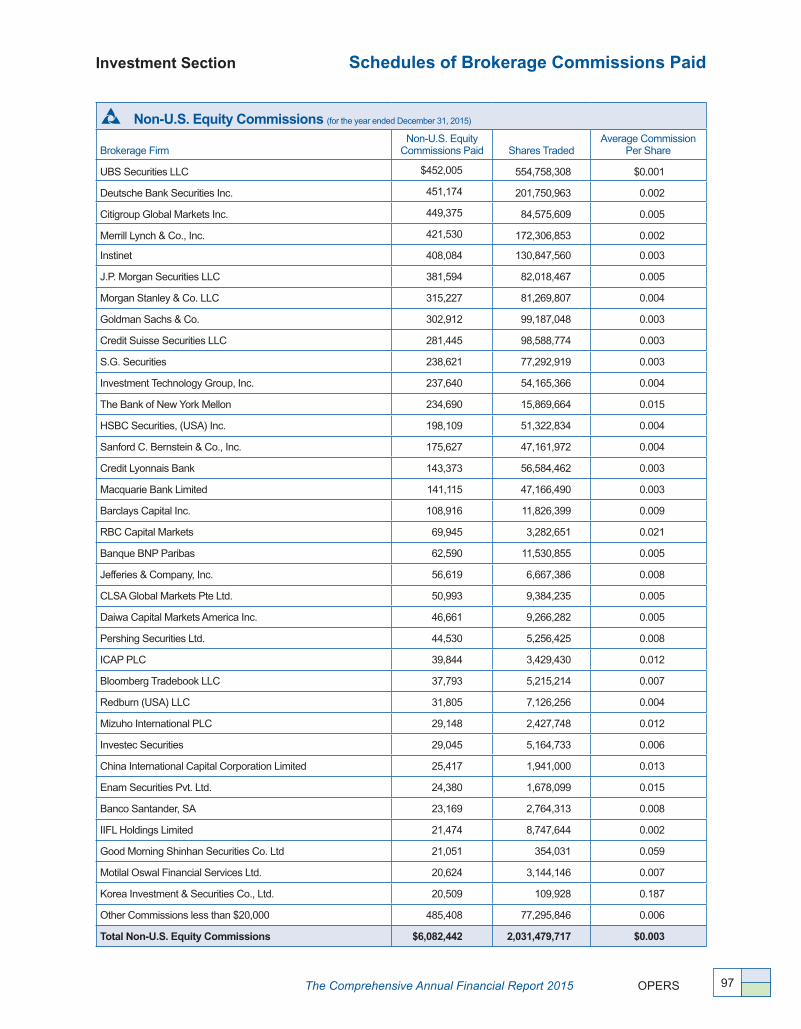
The Comprehensive Annual Financial Report 2015 OPERS 97
Investment Section Schedules of Brokerage Commissions Paid
Non-U.S. Equity Commissions (for the year ended December 31, 2015)
Brokerage FirmNon-U�S� Equity
Commissions Paid Shares TradedAverage Commission
Per Share
UBS Securities LLC $452,005 554,758,308 $0�001
Deutsche Bank Securities Inc� 451,174 201,750,963 0�002
Citigroup Global Markets Inc� 449,375 84,575,609 0�005
Merrill Lynch & Co�, Inc� 421,530 172,306,853 0�002
Instinet 408,084 130,847,560 0�003
J�P� Morgan Securities LLC 381,594 82,018,467 0�005
Morgan Stanley & Co� LLC 315,227 81,269,807 0�004
Goldman Sachs & Co� 302,912 99,187,048 0�003
Credit Suisse Securities LLC 281,445 98,588,774 0�003
S�G� Securities 238,621 77,292,919 0�003
Investment Technology Group, Inc� 237,640 54,165,366 0�004
The Bank of New York Mellon 234,690 15,869,664 0�015
HSBC Securities, (USA) Inc� 198,109 51,322,834 0�004
Sanford C� Bernstein & Co�, Inc� 175,627 47,161,972 0�004
Credit Lyonnais Bank 143,373 56,584,462 0�003
Macquarie Bank Limited 141,115 47,166,490 0�003
Barclays Capital Inc� 108,916 11,826,399 0�009
RBC Capital Markets 69,945 3,282,651 0�021
Banque BNP Paribas 62,590 11,530,855 0�005
Jefferies & Company, Inc� 56,619 6,667,386 0�008
CLSA Global Markets Pte Ltd� 50,993 9,384,235 0�005
Daiwa Capital Markets America Inc� 46,661 9,266,282 0�005
Pershing Securities Ltd� 44,530 5,256,425 0�008
ICAP PLC 39,844 3,429,430 0�012
Bloomberg Tradebook LLC 37,793 5,215,214 0�007
Redburn (USA) LLC 31,805 7,126,256 0�004
Mizuho International PLC 29,148 2,427,748 0�012
Investec Securities 29,045 5,164,733 0�006
China International Capital Corporation Limited 25,417 1,941,000 0�013
Enam Securities Pvt� Ltd� 24,380 1,678,099 0�015
Banco Santander, SA 23,169 2,764,313 0�008
IIFL Holdings Limited 21,474 8,747,644 0�002
Good Morning Shinhan Securities Co� Ltd 21,051 354,031 0�059
Motilal Oswal Financial Services Ltd� 20,624 3,144,146 0�007
Korea Investment & Securities Co�, Ltd� 20,509 109,928 0�187
Other Commissions less than $20,000 485,408 77,295,846 0�006
Total Non-U.S. Equity Commissions $6,082,442 2,031,479,717 $0.003

OPERS The Comprehensive Annual Financial Report 201598
Schedules of Brokerage Commissions Paid Investment Section
Futures Commissions (for the year ended December 31, 2015)
Brokerage FirmFutures Commissions
Paid Contracts TradedAverage Commission
Per Contract
Goldman Sachs & Co� $580,701 264,862 $2�19
Credit Suisse Securities LLC 184,518 96,704 1�91
Total Futures Commissions $765,219 361,566 $2.12
Total U.S. Equity, Non-U.S. Equity and Futures Commissions $9,954,941 N/A N/A
The brokerage commissions do not include commissions paid by external investment managers utilizing commingled fund structures� OPERS maintains a commission recapture program with several of its non-U�S� Equity managers� Capital Institutional Services Inc�, Knight Inc� and Frank Russell Securities Inc� perform record-keeping services for the commission recapture program�
The total commissions schedule includes $802,930 in commissions paid that were part of a commission sharing agreement (CSA)� CSA funds are held by the participating brokers and may be used to purchase qualifying investment research services� During 2015, $1,741,218 in investment research services were purchased using CSA funds�
Schedule of Fees to External Asset Managers (for the year ended December 31, 2015)
Defined Benefit 401(h) Health
Care Trust 115 Health Care Trust
Defined Contribution Total
Fixed Income $29,903,100 $4,511,249 $221,576 $170,835 $34,806,760
Domestic Equities 13,966,634 2,486,254 66,208 288,078 16,807,174
International Equities 43,058,451 6,822,489 894,895 272,290 51,048,125
Private Equity* 122, 823,509 122,823,509
Hedge Funds and Other 137,507,806 14,168,213 964,754 152,640,773
Real Estate 50,103,046 50,103,046
Total Fees $397,362,546 $27,988,205 $2,147,433 $731,203 $428,229,387
* All investment manager fees reported to OPERS, whether directly invoiced or subtracted from the fund on a net basis, are reported as External Asset Management Fees� These fees include investment management fees and other expenses, such as audit expenses, in limited partnership structures, as well as fee offsets that may have the effect of reducing the total amount of fees�

The Comprehensive Annual Financial Report 2015 OPERS 99
Investment Section Schedule of External Asset Managers
Schedule of External Asset Managers (for the year ended December 31, 2015)
U.S. Equity Managers
Affinity Investment Advisors Mason Capital Systematic Financial Management
Atlanta Capital Management, Company LLC Matarin Capital Wasatch Advisors
Dean Investment Associates New South Capital Management Winslow Asset Management
Decatur Capital Management Nicholas Investment Partners
Disciplined Growth Investors Oberweis Asset Management Inc�
First Fiduciary Investment Counsel, Inc� Opus Capital Management
Geneva Capital Management Ltd� Penn Capital Management
GW Capital Inc� Redwood Investments LLC
Hahn Capital Management LLC Seizert Capital Partners
Non-U.S. Equity Managers
Acadian Franklin Templeton Institutional LLC Strategic Global Advisors
AQR Capital Management LLC J�P� Morgan Trilogy Global Advisors LP
Arrowstreet J O Hambro Capital Management Ltd� T� Rowe Price International Ltd�
Ballie Gifford Lazard Vontobel Asset Management
BlackRock Inc� LSV Walter Scott & Partners
Copper Rock Capital Partners LLC Manning and Napier Wasatch Advisors Inc�
Dimensional Fund Advisors Oldfield Partners LLP
Fisher Investments Schroder Investment Management NA Inc�
Bond Managers
Aberdeen Asset Management Franklin Templeton Institutional LLC Nomura Group
AFL-CIO Housing Investment Trust J�P� Morgan Post Advisory Group
BlueBay Asset Management Lazard Shenkman Capital Management
Capital Guardian Logan Circle Partners, L�P� Stone Harbor
CIFC MacKay Shields Wellington Management
Fort Washington Investment Advisors Inc� Neuberger Berman
Hedge Fund Managers
AQR Capital Management Discovery Capital Management Prisma Capital Partners
Aristeia Capital LLC Egerton Capital Putnam Investments
Arrowgrass Partnership First Quadrant Schroders
Ascend Partners GMO Scopia Capital
Beach Point Capital Management Graham Capital Taconic Investment Partners
BHR Capital Highline Capital Partners Third Point Partners
BlackRock Jana Partners Tiger Consumer Partners
BlueCrest Capital LP K2 Advisors Visium Asset Management
Bridgewater Associates Kepos Capital Wellington Management
Brigade Capital Management LP KLS Diversified Asset Management Winton Capital
Canyon Capital Advisors LLC Kynikos Associates York Capital Management
Chatham Asset Partners Lakewood Capital Partners
CQS Management Och Ziff Capital Management
Davidson Kempner Institutional Partners LP Panagora Asset Management

OPERS The Comprehensive Annual Financial Report 2015100
This page intentionally left blank

The Comprehensive Annual Financial Report 2015 OPERS 101
Investment Section Defined Benefit Portfolio
As noted previously, the Investment Division manages the total investment portfolio by dividing it into four sub-portfolios� These portfolios are: the Defined Benefit portfolio, 401(h) Health Care Trust portfolio, 115 Health Care Trust portfolio, and the Defined Contribution portfolio� All information prior to this point has been reported on the OPERS total investment portfolio, however, all the following information will be presented on the specific portfolio level�
$8�289$9�079
Defined Benefit Portfolio Asset Allocation (as of December 31, 2015, $ in billions)
Fixed Income
Domestic Equities
Real Estate
Private Equity
International Equities
Hedge Funds and Derivatives
Cash and Short-Term Investments
$2�398
$17�490
$12�898$13�230
$10�999
Investment Returns—Annual Rates of Return Defined Benefit Portfolio*
-10%
Defined Benefit Portfolio Returns
Policy Benchmark Returns
-5%
0%
5%
10%
Rolling10-Yr
5.74%
5.56%
Rolling3-Yr
7.07%
6.61%
2015
0.33%
0.25%
Rolling5-Yr
7.13%
6.74%
7.70%
8.83%***
Rolling30-Yr**
* Annual rates of return--The Defined Benefit portfolio return is based on a time-weighted calculation� The policy benchmark is derived by a market value-weighted calculation of the Defined Benefit investment policy benchmarks� All returns are net of external manager fees, overdraft charges, debit interest, registration expenses, stamp duties and taxes spent on foreign securities�
** The 401(h) Health Care Trust portfolio was segregated from the Defined Benefit portfolio in 2005; thus, the 30-year rolling return information reflects both the Defined Benefit and 401(h) Health Care Trust portfolios�
*** The benchmark returns for 1996 and prior years were estimated�
Investment Returns
The Defined Benefit portfolio returned 0�33% in 2015� The overall portfolio return is compared to a composite benchmark return that could be achieved by a portfolio that is passively invested in the broad market, with percentage weights allocated to each asset class as specified in the OPERS Statement of Investment Objectives and Policies� The return of the policy benchmark for 2015 was 0�25%�

OPERS The Comprehensive Annual Financial Report 2015102
Defined Benefit Portfolio Investment Section
Investment returns for the Defined Benefit portfolio underlying asset class composites and their respective benchmarks are shown below:
Schedule of Investment Results (for the year ended December 31, 2015) Defined Benefit Portfolio2015 Rolling 3-Year Rolling 5-Year
Total Defined Benefit Portfolio 0.33% 7.07% 7.13%
Total Defined Benefit Portfolio Benchmark1 0.25 6.61 6.74
U�S� Equity Composite 0�59 14�36 11�98
U�S� Equity Composite Benchmark 0�48 14�74 12�18
Non-U�S� Equity Composite (4�32) 2�65 1�95
Non-U�S� Equity Composite Benchmark (6�09) 0�80 0�59
Core Fixed Composite 0�96 2�08 3�73
Core Fixed Composite Benchmark 0�55 1�44 3�25
TIPS Composite (1�43) N/A N/A
TIPS Composite Benchmark (1�44) N/A N/A
High Yield Composite (3�05) 2�18 5�23
High Yield Composite Benchmark (4�47) 1�69 5�04
Emerging Markets Debt Composite (7�20) (5�36) 0�44
Emerging Markets Debt Composite Benchmark (7�12) (5�09) 0�79
Securitized Debt Composite 4�93 14�50 15�20
Securitized Debt Composite Benchmark 2�59 3�52 6�06
Floating Rate Debt Composite 2�51 4�47 N/A
Floating Rate Debt Composite Benchmark (0�38) 2�57 N/A
Global High Yield Debt Composite (4�40) 0�64 N/A
Global High Yield Debt Composite Benchmark (2�72) 1�45 N/A
Private Equity Composite 6�09 13�32 14�87
Private Equity Composite Benchmark 6�04 14�55 15�70
Real Estate Composite 16�70 16�83 15�12
Real Estate Composite Benchmark 14�71 13�24 13�35
Hedge Funds Composite (1�20) 4�03 3�15
Hedge Funds Composite Benchmark (1�71) 2�57 4�32
Opportunistic Composite 1�12 0�13 1�87
Opportunistic Composite Benchmark 0�84 1�53 3�00
Commodities Composite (32�44) N/A N/A
Commodities Composite Benchmark (32�86) N/A N/A
Cash Composite 0�34 0�33 0�36
Cash Composite Benchmark 0�05 0�05 0�08
Additional Annuity 1�68 1�52 1�69
Additional Annuity Composite Benchmark 0�05 0�05 0�08
Risk Parity Composite (10�42) (1�26) N/A
Risk Parity Composite Benchmark 3�30 7�00 N/A
GTAA Composite 0�94 N/A N/A
GTAA Composite Benchmark (0�69) N/A N/A
U�S� Treasury (0�15)* N/A N/A
U�S� Treasury Composite Benchmark (0�16)* N/A N/A
*Returns are 10-month cumulative returns (March 2015-December 2015)�
1 Defined Benefit Portfolio Benchmark—The returns for this benchmark are derived from the asset class composite
benchmark returns summarized in the table above, the historical asset class target allocations listed on the next
page, and the asset class composite benchmark indices listed in the table on page 104�
Footnotes continue on page 105�

The Comprehensive Annual Financial Report 2015 OPERS 103
Investment Section Defined Benefit Portfolio
Historical Asset Class Target Allocations Defined Benefit PortfolioAsset Class 2015 2014 2013 2012 2011
U�S� Equity 22�3% 21�4% 22�0% 23�6% 29�1%
Opportunistic 0�1 0�1 0�5 0�7 1�6
Core Bonds 9�5 10�3 10�0 13�3 17�9
Corporate Credit 0�0 0�0 0�0 0�5 N/A
Floating Rate Debt 0�5 0�7 1�0 0�7 N/A
Global High Yield 1�0 1�0 1�5 1�5 N/A
Securitized Debt 1�0 1�0 1�0 1�0 N/A
Non-U�S� Equity 18�6 19�5 22�0 24�0 24�6
Private Real Estate/REITs 10�0 10�0 10�0 10�0 9�7
Private Equity 10�0 10�0 10�0 10�0 8�8
Cash Equivalents 0�0 0�0 2�0 2�0 2�0
High Yield 3�0 3�0 5�0 5�0 5�0
Emerging Markets Debt 6�0 6�0 3�0 3�0 0�1
Hedge Funds 8�0 8�0 6�0 4�7 1�2
Commodities 1�0 1�0 1�0 N/A N/A
Risk Parity 5�0 5�0 2�0 N/A N/A
GTAA 2�0 2�0 2�0 N/A N/A
TIPS 1�0 1�0 1�0 N/A N/A
U�S� Treasury 1�0 N/A N/A N/A N/A
Total 100.0% 100.0% 100.0% 100.0% 100.0%

OPERS The Comprehensive Annual Financial Report 2015104
Defined Benefit Portfolio Investment Section
To arrive at customized benchmarks performance, the asset allocation targets are multiplied by the performance of the corresponding asset class reference indices� The asset class reference indices are specified by the Investment Policy, and are displayed below:
Historical Asset Class Composite Benchmark Indices Defined Benefit PortfolioAsset Class Composite
Benchmarks
As of December 31
2015 2014 2013 2012 2011
U�S� EquityRussell 3000 Stock Index 2
Russell 3000 Stock Index
Russell 3000 Stock Index
Russell 3000 Stock Index
Russell 3000 Stock Index
OpportunisticCustom Opportunistic Benchmark 3
Custom Opportunistic Benchmark
Custom Opportunistic Benchmark
Custom Opportunistic Benchmark
Custom Opportunistic Benchmark
Core Bonds Custom Core Fixed 4 Custom Core Fixed Custom Core Fixed Barclays U�S� Aggregate Bond Index
Barclays U�S� Aggregate Bond Index
Corporate Credit N/A N/A N/ABarclays U�S� Corporate Investment Grade
N/A
Floating Rate DebtCredit Suisse Leveraged Loan Index 5
Credit Suisse Leveraged Loan Index
Credit Suisse Leveraged Loan Index
Credit Suisse Leveraged Loan Index
N/A
Global High YieldBarclays Global High Yield 6
Barclays Global High Yield
Barclays Global High Yield
Barclays Global High Yield
N/A
Securitized DebtBarclays CMBS Index + 2% 7
Barclays CMBS Index + 2%
Barclays CMBS Index + 2%
Barclays CMBS Index + 2%
N/A
Non-U�S� EquityCustom Non-U�S� Equity Benchmark (net) 8
Custom Non-U�S� Equity Benchmark (net)
Custom Non-U�S� Equity Benchmark (net)
Custom Non-U�S� Equity Benchmark (net)
Custom Non-U�S� Equity Benchmark (net)
Private Real Estate
Custom Private Real Estate 9
Custom Private Real Estate
Custom Private Real Estate
NCREIF Property Index (quarter lag)
NCREIF Property Index (quarter lag)
Private Equity SSPEI Index 10 Custom Private Equity Custom Private EquityRussell 3000 (quarter lag) + 3%
Russell 3000 (quarter lag) + 3%
Cash Equivalents90-day U�S� Treasury Bill Index 11
90-day U�S� Treasury Bill Index
90-day U�S� Treasury Bill Index
90-day U�S� Treasury Bill Index
90-day U�S� Treasury Bill Index
High YieldBarclays Capital U�S� Corporate High Yield 12
Barclays Capital U�S� Corporate High Yield
Barclays Capital U�S� Corporate High Yield
Barclays Capital U�S� Corporate High Yield
Barclays Capital U�S� Corporate High Yield
Emerging Markets Debt
Custom Emerging Markets Debt Benchmark 13
Custom Emerging Markets Debt Benchmark
Custom Emerging Markets Debt Benchmark
Custom Emerging Markets Debt Benchmark
Custom Emerging Markets Debt Benchmark
Hedge FundsCustom Hedge Fund Benchmark 14
Custom Hedge Fund Benchmark
Custom Hedge Fund Benchmark
Custom Hedge Fund Benchmark
Custom Hedge Fund Benchmark
CommoditiesS&P Goldman Sachs Commodity Index 15
S&P Goldman Sachs Commodity Index
S&P Goldman Sachs Commodity Index
N/A N/A
Risk ParityCustom Risk Parity Benchmark 16
Custom Risk Parity Benchmark
Custom Risk Parity Benchmark
N/A N/A
GTAACustom GTAA Benchmark17
Custom GTAA Benchmark
Custom GTAA Benchmark
N/A N/A
TIPSBarclays U�S� TIPS Index18
Barclays U�S� TIPS Index
Barclays U�S� TIPS Index
N/A N/A
U�S� TreasuryBarclays U�S� Treasury Index19
N/A N/A N/A N/A

The Comprehensive Annual Financial Report 2015 OPERS 105
Investment Section Defined Benefit Portfolio
Footnotes for Schedule of Investment Results—Defined Benefit PortfolioThe footnotes below provide definitions for the asset class composite benchmark indices as of December 31, 2015:2 Russell 3000 Stock Index—A capitalization-weighted stock index consisting of the 3,000 largest publicly
traded U�S� stocks by capitalization� This index is a broad measure of the performance of the aggregate
domestic equity market�3 Custom Opportunistic Benchmark—Market value weight of the underlying portfolio benchmarks�4 Custom Core Fixed—Market value weight of the underlying portfolio benchmarks�5 Credit Suisse Leveraged Loan Index—Is designed to mirror the investible universe of the U�S�-denominated
leveraged loan market�6 Barclays Global High Yield—The Global High Yield Index represents the union of the U�S� High Yield,
Pan-European High Yield, U�S� Emerging Markets High-Yield, and Pan-European Emerging Markets High
Yield Indices�7 Barclays Commercial Mortgage Backed Securities (CMBS) Index +2%—The Barclays CMBS ERISA-
Eligible Index is the ERISA-Eligible component of the Barclays CMBS Index� This index, which includes
investment grade securities that are ERISA-Eligible under the underwriter’s exemption, is the only CMBS
sector that is included in the U�S� Aggregate Index�8 Custom Non-U.S. Equity Benchmark (net)—As of December 31, 2015, blend was 55% MSCI World x U�S�
(net), 31% MSCI Emerging Markets (net), 10% MSCI World x U�S� Small Cap (net), and 4% MSCI Emerging
Markets Small Cap (net)�9 Custom Private Real Estate—NCREIF Net NFI-ODCE + 85 bps-NFI-ODCE Index-Open End Diversified Core
Equity is an index of investment returns reporting on both a historical and current basis the results of 30 open-
end commingled funds pursuing a core investment strategy� The NFI-ODCE Index is capitalization-weighted�10 State Street Private Equity Index (SSPEI)—Evaluates the performance of actively managed private
equity portfolios� SSPEI includes venture capital, buyout, and distressed debt funds within the U�S�11 90-day U.S. Treasury Bill Index—The 90-day Treasury Bill return as measured by Bank of America
Merrill Lynch�12 Barclays Capital U.S. Corporate High Yield—Covers the universe of fixed rate, non-investment grade debt�13 Custom Emerging Markets Debt Benchmark—As of December 31, 2015, blend was 50% JPMorgan EMBI
Global Index, 50% JPMorgan GBI-Emerging Markets Global Diversified USD Index�14 Custom Hedge Fund Benchmark—As of December 31, 2015, blend was 20% HFRI Equity Hedge (Total)
Index, 20% HFRI Macro (Total) Index, 15% HFRI Relative Value (Total) Index, 15% HFRI Fund Weighted
Composite Index, 30% HFRI Event-Driven (Total) Index�15 S&P Goldman Sachs Commodity Index—Tracks general price movements and inflation in the world economy�
The index is calculated primarily on a world-production weighted basis and is comprised of the principal
physical commodities that are the subject of active, liquid futures markets�16 Custom Risk Parity Benchmark—Market value weight of the underlying portfolio benchmarks�17 Custom GTAA Benchmark—Market value weight of the underlying portfolio benchmarks�18 Barclays U.S. TIPS Index—This index consists of inflation-protected securities issued by the U�S� Treasury�19 Barclays U.S. Treasury Index—This index is issued by the U�S� Treasury�

OPERS The Comprehensive Annual Financial Report 2015106
This page intentionally left blank

The Comprehensive Annual Financial Report 2015 OPERS 107
Investment Section 401(h) Health Care Trust Portfolio
401(h) Health Care Trust Portfolio Asset Allocation (as of December 31, 2015, $ in billions)
Fixed Income
Domestic Equities
International Equities
Hedge Funds and Derivatives
Cash and Short-Term Investments
$0�438
$3�733
$2�970
$2�221
$1�390
Investment Returns—Annual Rates of Return 401(h) Health Care Trust Portfolio*
-10%
401(h) Health Care Trust Portfolio Returns
Policy Benchmark Returns
-5%
0%
5%
10%
Rolling10-Yr**
5.37%
5.16%
Rolling3-Yr
2015
(2.18%)
(1.88%)
Rolling5-Yr
4.67%
4.48%
5.15%
5.16%
* Annual rates of return—The 401(h) Health Care Trust portfolio return is based on a time-weighted calculation and market value-weighted calculation� The policy benchmark is derived by a market value-weighted calculation of the 401(h) Health Care Trust investment policy benchmarks� All returns are net of external manager fees, overdraft charges, debit interest, registration expenses, stamp duties and taxes spent on foreign securities�
** The 401(h) Health Care Trust portfolio was segregated from the Defined Benefit portfolio in 2005; thus, the 30-year rolling return information does not exist�
Investment Returns
The 401(h) Health Care Trust portfolio returned a loss of 2�18%, or (2�18%), in 2015� The overall portfolio return is compared to a composite benchmark return that could be achieved by a portfolio that is passively invested in the broad market, with percentage weights allocated to each asset class as specified in the OPERS Statement of Investment Objectives and Policies� The return of the policy benchmark for 2015 was a loss of 1�88%, or (1�88%)�
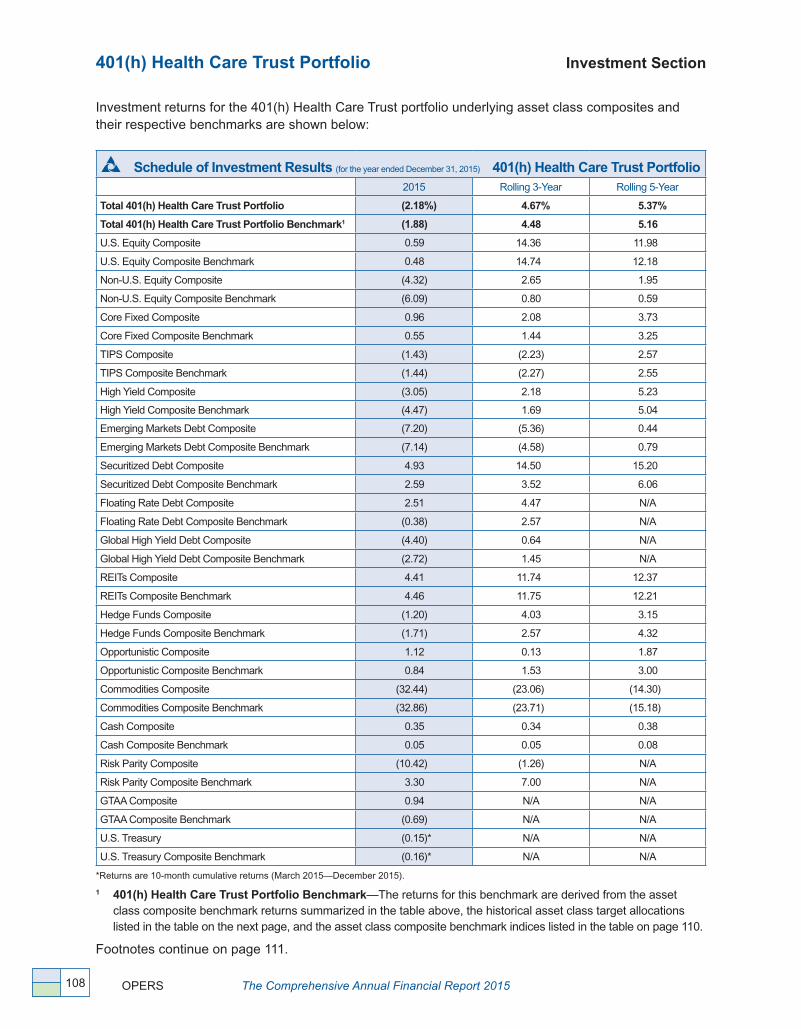
OPERS The Comprehensive Annual Financial Report 2015108
401(h) Health Care Trust Portfolio Investment Section
Investment returns for the 401(h) Health Care Trust portfolio underlying asset class composites and their respective benchmarks are shown below:
Schedule of Investment Results (for the year ended December 31, 2015) 401(h) Health Care Trust Portfolio2015 Rolling 3-Year Rolling 5-Year
Total 401(h) Health Care Trust Portfolio (2.18%) 4.67% 5.37%
Total 401(h) Health Care Trust Portfolio Benchmark1 (1.88) 4.48 5.16
U�S� Equity Composite 0�59 14�36 11�98
U�S� Equity Composite Benchmark 0�48 14�74 12�18
Non-U�S� Equity Composite (4�32) 2�65 1�95
Non-U�S� Equity Composite Benchmark (6�09) 0�80 0�59
Core Fixed Composite 0�96 2�08 3�73
Core Fixed Composite Benchmark 0�55 1�44 3�25
TIPS Composite (1�43) (2�23) 2�57
TIPS Composite Benchmark (1�44) (2�27) 2�55
High Yield Composite (3�05) 2�18 5�23
High Yield Composite Benchmark (4�47) 1�69 5�04
Emerging Markets Debt Composite (7�20) (5�36) 0�44
Emerging Markets Debt Composite Benchmark (7�14) (4�58) 0�79
Securitized Debt Composite 4�93 14�50 15�20
Securitized Debt Composite Benchmark 2�59 3�52 6�06
Floating Rate Debt Composite 2�51 4�47 N/A
Floating Rate Debt Composite Benchmark (0�38) 2�57 N/A
Global High Yield Debt Composite (4�40) 0�64 N/A
Global High Yield Debt Composite Benchmark (2�72) 1�45 N/A
REITs Composite 4�41 11�74 12�37
REITs Composite Benchmark 4�46 11�75 12�21
Hedge Funds Composite (1�20) 4�03 3�15
Hedge Funds Composite Benchmark (1�71) 2�57 4�32
Opportunistic Composite 1�12 0�13 1�87
Opportunistic Composite Benchmark 0�84 1�53 3�00
Commodities Composite (32�44) (23�06) (14�30)
Commodities Composite Benchmark (32�86) (23�71) (15�18)
Cash Composite 0�35 0�34 0�38
Cash Composite Benchmark 0�05 0�05 0�08
Risk Parity Composite (10�42) (1�26) N/A
Risk Parity Composite Benchmark 3�30 7�00 N/A
GTAA Composite 0�94 N/A N/A
GTAA Composite Benchmark (0�69) N/A N/A
U�S� Treasury (0�15)* N/A N/A
U�S� Treasury Composite Benchmark (0�16)* N/A N/A
*Returns are 10-month cumulative returns (March 2015—December 2015)�
1 401(h) Health Care Trust Portfolio Benchmark—The returns for this benchmark are derived from the asset class composite benchmark returns summarized in the table above, the historical asset class target allocations listed in the table on the next page, and the asset class composite benchmark indices listed in the table on page 110� Footnotes continue on page 111�
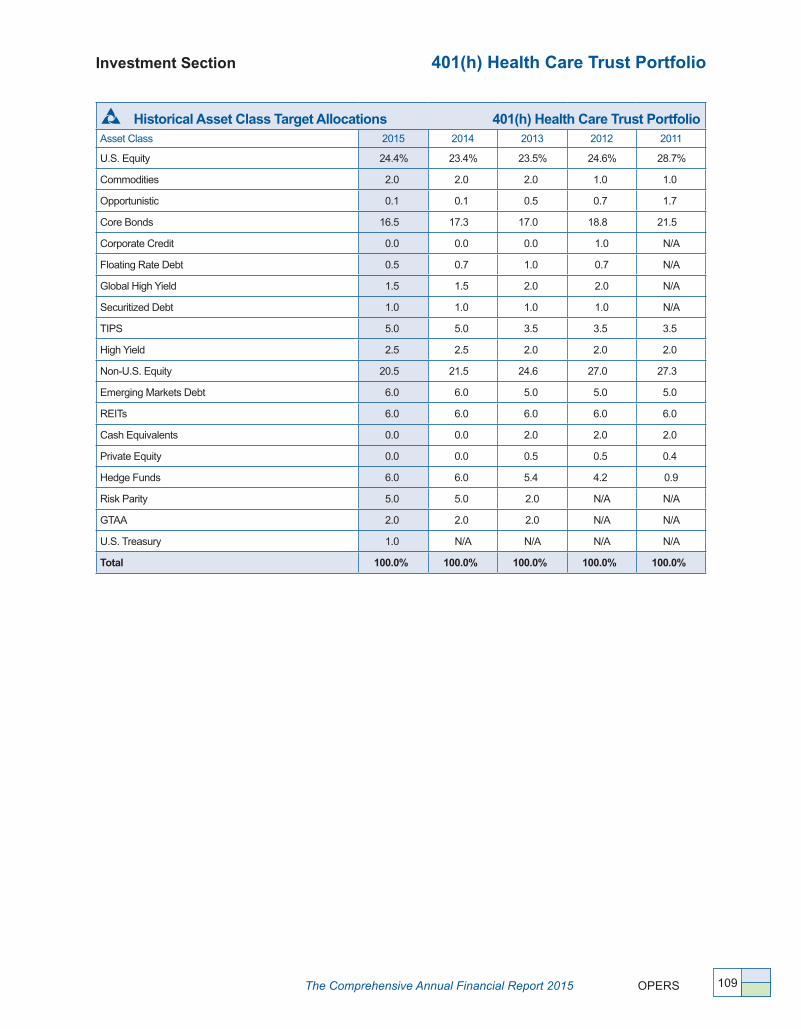
The Comprehensive Annual Financial Report 2015 OPERS 109
Investment Section 401(h) Health Care Trust Portfolio
Historical Asset Class Target Allocations 401(h) Health Care Trust PortfolioAsset Class 2015 2014 2013 2012 2011
U�S� Equity 24�4% 23�4% 23�5% 24�6% 28�7%
Commodities 2�0 2�0 2�0 1�0 1�0
Opportunistic 0�1 0�1 0�5 0�7 1�7
Core Bonds 16�5 17�3 17�0 18�8 21�5
Corporate Credit 0�0 0�0 0�0 1�0 N/A
Floating Rate Debt 0�5 0�7 1�0 0�7 N/A
Global High Yield 1�5 1�5 2�0 2�0 N/A
Securitized Debt 1�0 1�0 1�0 1�0 N/A
TIPS 5�0 5�0 3�5 3�5 3�5
High Yield 2�5 2�5 2�0 2�0 2�0
Non-U�S� Equity 20�5 21�5 24�6 27�0 27�3
Emerging Markets Debt 6�0 6�0 5�0 5�0 5�0
REITs 6�0 6�0 6�0 6�0 6�0
Cash Equivalents 0�0 0�0 2�0 2�0 2�0
Private Equity 0�0 0�0 0�5 0�5 0�4
Hedge Funds 6�0 6�0 5�4 4�2 0�9
Risk Parity 5�0 5�0 2�0 N/A N/A
GTAA 2�0 2�0 2�0 N/A N/A
U�S� Treasury 1�0 N/A N/A N/A N/A
Total 100.0% 100.0% 100.0% 100.0% 100.0%
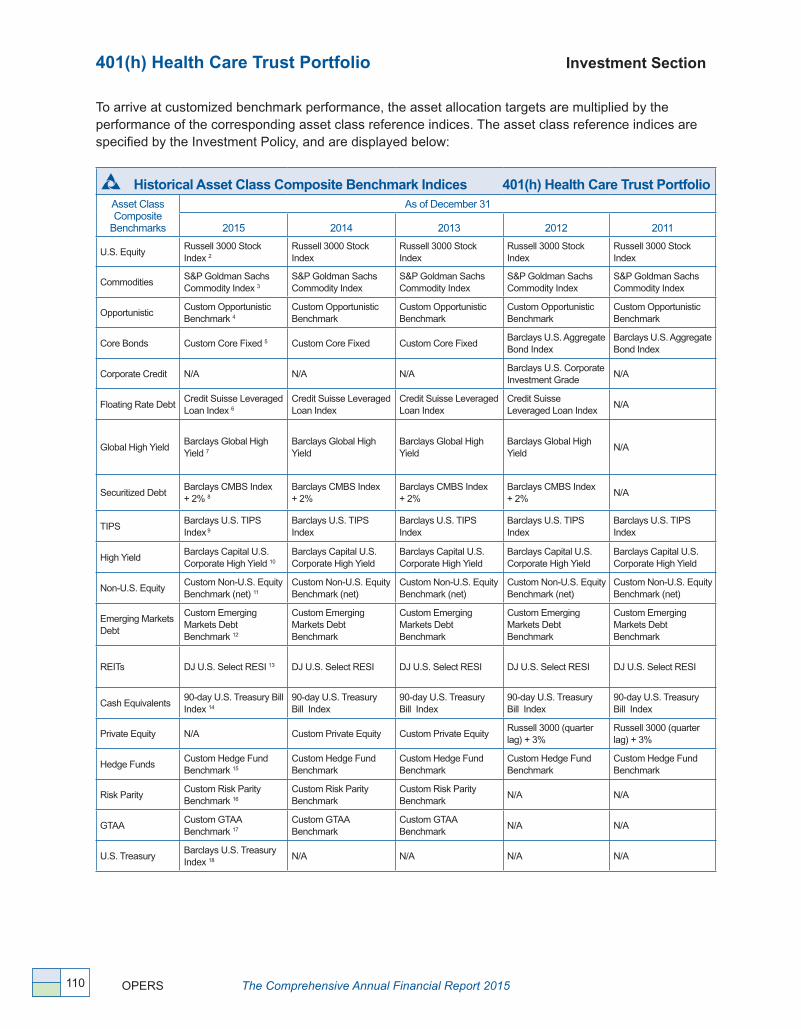
OPERS The Comprehensive Annual Financial Report 2015110
401(h) Health Care Trust Portfolio Investment Section
To arrive at customized benchmark performance, the asset allocation targets are multiplied by the performance of the corresponding asset class reference indices� The asset class reference indices are specified by the Investment Policy, and are displayed below:
Historical Asset Class Composite Benchmark Indices 401(h) Health Care Trust PortfolioAsset Class Composite
Benchmarks
As of December 31
2015 2014 2013 2012 2011
U�S� EquityRussell 3000 Stock Index 2
Russell 3000 Stock Index
Russell 3000 Stock Index
Russell 3000 Stock Index
Russell 3000 Stock Index
CommoditiesS&P Goldman Sachs Commodity Index 3
S&P Goldman Sachs Commodity Index
S&P Goldman Sachs Commodity Index
S&P Goldman Sachs Commodity Index
S&P Goldman Sachs Commodity Index
OpportunisticCustom Opportunistic Benchmark 4
Custom Opportunistic Benchmark
Custom Opportunistic Benchmark
Custom Opportunistic Benchmark
Custom Opportunistic Benchmark
Core Bonds Custom Core Fixed 5 Custom Core Fixed Custom Core Fixed Barclays U�S� Aggregate Bond Index
Barclays U�S� Aggregate Bond Index
Corporate Credit N/A N/A N/ABarclays U�S� Corporate Investment Grade
N/A
Floating Rate DebtCredit Suisse Leveraged Loan Index 6
Credit Suisse Leveraged Loan Index
Credit Suisse Leveraged Loan Index
Credit Suisse Leveraged Loan Index
N/A
Global High YieldBarclays Global High Yield 7
Barclays Global High Yield
Barclays Global High Yield
Barclays Global High Yield
N/A
Securitized DebtBarclays CMBS Index + 2% 8
Barclays CMBS Index + 2%
Barclays CMBS Index + 2%
Barclays CMBS Index + 2%
N/A
TIPSBarclays U�S� TIPS Index 9
Barclays U�S� TIPS Index
Barclays U�S� TIPS Index
Barclays U�S� TIPS Index
Barclays U�S� TIPS Index
High YieldBarclays Capital U�S� Corporate High Yield 10
Barclays Capital U�S� Corporate High Yield
Barclays Capital U�S� Corporate High Yield
Barclays Capital U�S� Corporate High Yield
Barclays Capital U�S� Corporate High Yield
Non-U�S� EquityCustom Non-U�S� Equity Benchmark (net) 11
Custom Non-U�S� Equity Benchmark (net)
Custom Non-U�S� Equity Benchmark (net)
Custom Non-U�S� Equity Benchmark (net)
Custom Non-U�S� Equity Benchmark (net)
Emerging Markets Debt
Custom Emerging Markets Debt Benchmark 12
Custom Emerging Markets Debt Benchmark
Custom Emerging Markets Debt Benchmark
Custom Emerging Markets Debt Benchmark
Custom Emerging Markets Debt Benchmark
REITs DJ U�S� Select RESI 13 DJ U�S� Select RESI DJ U�S� Select RESI DJ U�S� Select RESI DJ U�S� Select RESI
Cash Equivalents90-day U�S� Treasury Bill Index 14
90-day U�S� Treasury Bill Index
90-day U�S� Treasury Bill Index
90-day U�S� Treasury Bill Index
90-day U�S� Treasury Bill Index
Private Equity N/A Custom Private Equity Custom Private Equity Russell 3000 (quarter lag) + 3%
Russell 3000 (quarter lag) + 3%
Hedge FundsCustom Hedge Fund Benchmark 15
Custom Hedge Fund Benchmark
Custom Hedge Fund Benchmark
Custom Hedge Fund Benchmark
Custom Hedge Fund Benchmark
Risk ParityCustom Risk Parity Benchmark 16
Custom Risk Parity Benchmark
Custom Risk Parity Benchmark
N/A N/A
GTAACustom GTAA Benchmark 17
Custom GTAA Benchmark
Custom GTAA Benchmark
N/A N/A
U�S� TreasuryBarclays U�S� Treasury Index 18 N/A N/A N/A N/A

The Comprehensive Annual Financial Report 2015 OPERS 111
Footnotes for Schedule of Investment Results—401(h) Health Care Trust PortfolioThe footnotes below provide definitions for the asset class composite benchmark indices as of December 31, 2015:2 Russell 3000 Stock Index—A capitalization-weighted stock index consisting of the 3,000 largest publicly
traded U�S� stocks by capitalization� This index is a broad measure of the performance of the aggregate
domestic equity market� 3 S&P Goldman Sachs Commodity Index—Tracks general price movements and inflation in the world economy�
The index is calculated primarily on a world-production weighted basis and is comprised of the principal
physical commodities that are the subject of active, liquid futures markets� 4 Custom Opportunistic Benchmark—Market value weight of the underlying portfolio benchmarks� 5 Custom Core Fixed—Market value weight of the underlying portfolio benchmarks� 6 Credit Suisse Leveraged Loan Index—This Index is designed to mirror the investible universe of the
U�S�-denominated leveraged loan market� � 7 Barclays Global High Yield—The Global High Yield Index represents the union of the U�S� High Yield,
Pan-European High Yield, U�S� Emerging Markets High-Yield, and Pan-European Emerging Markets
High Yield Indices� 8 Barclays Commercial Mortgage Backed Securities (CMBS) Index +2%—The Barclays CMBS ERISA-
Eligible Index is the ERISA-Eligible component of the Barclays CMBS Index� This index, which includes
investment grade securities that are ERISA-Eligible under the underwriter’s exemption, is the only CMBS
sector that is included in the U�S� Aggregate Index� 9 Barclays U.S. TIPS Index—This index consists of Inflation-Protection securities issued by the U�S� Treasury�10 Barclays Capital U.S. Corporate High Yield—Covers the universe of fixed rate, non-investment grade debt� 11 Custom Non-U.S. Equity Benchmark (net)—As of December 31, 2015, blend was 55% MSCI World x
U�S� (net), 31% MSCI Emerging Markets (net), 10% MSCI World x U�S� Small Cap (net), and 4% MSCI
Emerging Markets Small Cap (net)� 12 Custom Emerging Markets Debt Benchmark—As of December 31, 2015, blend was 50% JPMorgan EMBI
Global Index, 50% JPMorgan GBI-Emerging Markets Global Diversified USD Index� 13 DJ U.S. Select RESI—The Dow Jones U�S� Select RESI represents equity REITs and REOCs traded in the U�S�14 90-day U.S. Treasury Bill Index—The 90-day Treasury Bill return as measured by Bank of America Merrill Lynch�15 Custom Hedge Fund Benchmark—As of December 31, 2015, blend was 20% HFRI Equity Hedge (Total)
Index, 20% HFRI Macro (Total) Index, 15% HFRI Relative Value (Total) Index, 15% HFRI Fund-Weighted
Composite Index, 30% HFRI Event-Driven (Total) Index� 16 Custom Risk Parity Benchmark—Market value weight of the underlying portfolio benchmarks�17 Custom GTAA Benchmark—Market value weight of the underlying portfolio benchmarks�18 Barclays U.S. Treasury Index—This index is issued by the U�S� Treasury�
Investment Section 401(h) Health Care Trust Portfolio

OPERS The Comprehensive Annual Financial Report 2015112
This page intentionally left blank

The Comprehensive Annual Financial Report 2015 OPERS 113
Investment Section 115 Health Care Trust Portfolio
115 Health Care Trust Portfolio Asset Allocation (as of December 31, 2015, $ in billions)
$0�048
$0�058
$0�297
$0�082
Investment Returns—Annual Rates of Return 115 Health Care Trust Portfolio*
-10%
115 Health Care Trust Portfolio Return**
Policy Benchmark Return
-5%
0%
5%
10%
2015
(3.23%)
(3.11%)
Investment Returns
The 115 Health Care Trust portfolio returned a loss of 3�23%, or (3�23%), in 2015� The overall portfolio return is compared to a composite benchmark return that could be achieved by a portfolio that is passively invested in the broad market, with percentage weights allocated to each asset class as specified in the OPERS Statement of Investment Objectives and Policies. The return of the policy benchmark for 2015 was a loss of 3�11%, or (3�11%)�
Fixed Income
Domestic Equities
International Equities
Hedge Funds and Derivatives
Cash and Short-Term Investments
$0�229
* Annual rates of return—The 115 Health Care Trust portfolio return is based on a time-weighted calculation and market value-weighted calculation� The policy benchmark is derived by a market value-weighted calculation of the 115 Health Care Trust investment policy benchmarks� All returns are net of external manager fees, overdraft charges, debit interest, registration expenses, stamp duties and taxes spent on foreign securities�
** The 115 Health Care Trust portfolio was established in September 2014; thus, the 3-year, 5-year, 10-year, and 30-year rolling returns information does not exist�

OPERS The Comprehensive Annual Financial Report 2015114
115 Health Care Trust Portfolio Investment Section
Investment returns for the 115 Health Care Trust portfolio underlying asset class composites and their respective benchmarks are shown below:
Schedule of Investment Results (for the year ended December 31, 2015) 115 Health Care Trust Portfolio*2015
Total 115 Health Care Trust Portfolio (3.23%)Total 115 Health Care Trust Portfolio Benchmark1 (3.11)U�S� Equity Composite 0�59U�S� Equity Composite Benchmark 0�48Non-U�S� Equity Composite (4�32)Non-U�S� Equity Composite Benchmark (6�09)Core Fixed Composite 0�96Core Fixed Composite Benchmark 0�56TIPS Composite (1�43)TIPS Composite Benchmark (1�44)High Yield Composite (3�05)High Yield Composite Benchmark (4�47)Emerging Markets Debt Composite (7�20)Emerging Markets Debt Composite Benchmark (7�12)Securitized Debt Composite N/ASecuritized Debt Composite Benchmark N/AFloating Rate Debt Composite N/AFloating Rate Debt Composite Benchmark N/AGlobal High Yield Debt Composite N/AGlobal High Yield Debt Composite Benchmark N/AREITs Composite 4�41REITs Composite Benchmark 4�46Hedge Funds Composite (1�20)Hedge Funds Composite Benchmark (1�74)Opportunistic Composite 1�12Opportunistic Composite Benchmark 0�84Commodities Composite (32�44)Commodities Composite Benchmark (32�86)Cash Composite** N/ACash Composite Benchmark** N/ARisk Parity Composite (10�42)Risk Parity Composite Benchmark 3�30GTAA Composite 0�94GTAA Composite Benchmark (0�69)U�S� Treasury N/AU�S� Treasury Composite Benchmark N/AShort-Term Liquidity 0�11***Short-Term Liquidity Composite Benchmark 0�03***
* The 115 Health Care Trust portfolio was established in September 2014; thus, the 3-year and 5-year rolling returns information does not exist� ** Cash Composite has a zero allocation in 2015 but can hold residual cash balances of the 115 Health Care Trust Portfolio� This can result in
residual performance that does not affect the overall 115 Health Care Trust Portfolio� *** Returns are three-month cumulative returns (October 2015-December 2015)�
1 115 Health Care Trust Portfolio Benchmark—The returns for this benchmark are derived from the asset class
composite benchmark returns summarized in the table above, the historical asset class target allocations listed
in the table on the next page, and the asset class composite benchmark indicies listed in the table on page 116�
Footnotes continue on page 117�
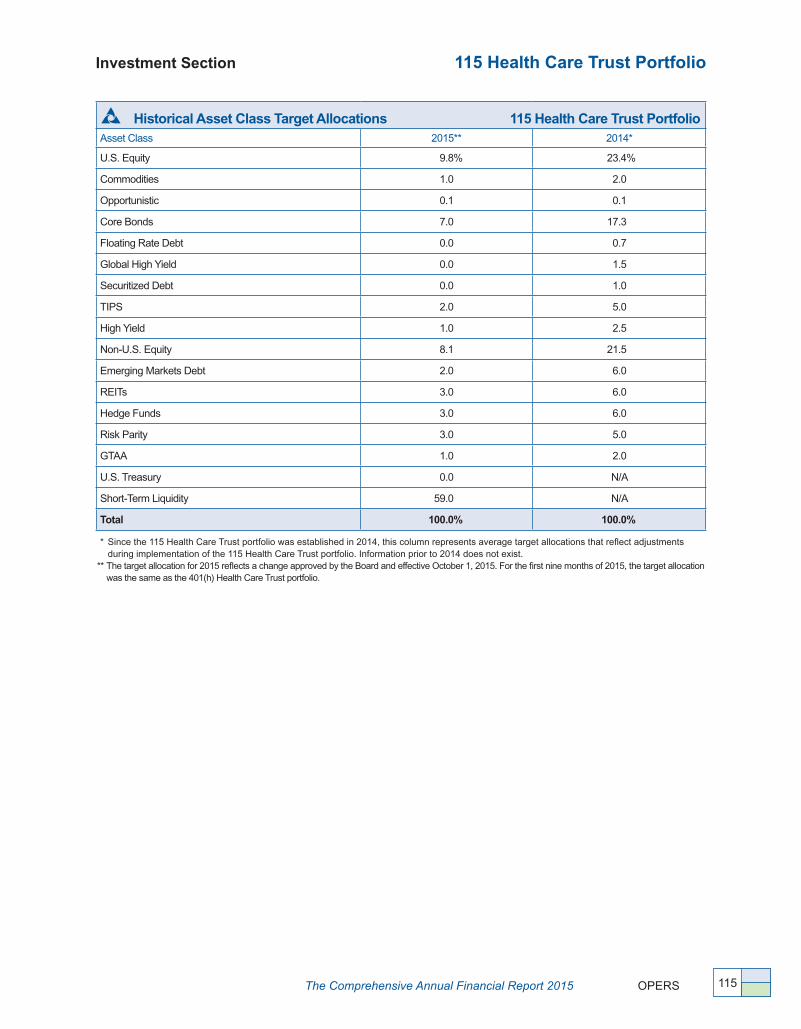
The Comprehensive Annual Financial Report 2015 OPERS 115
Investment Section 115 Health Care Trust Portfolio
Historical Asset Class Target Allocations 115 Health Care Trust PortfolioAsset Class 2015** 2014*
U�S� Equity 9�8% 23�4%
Commodities 1�0 2�0
Opportunistic 0�1 0�1
Core Bonds 7�0 17�3
Floating Rate Debt 0�0 0�7
Global High Yield 0�0 1�5
Securitized Debt 0�0 1�0
TIPS 2�0 5�0
High Yield 1�0 2�5
Non-U�S� Equity 8�1 21�5
Emerging Markets Debt 2�0 6�0
REITs 3�0 6�0
Hedge Funds 3�0 6�0
Risk Parity 3�0 5�0
GTAA 1�0 2�0
U�S� Treasury 0�0 N/A
Short-Term Liquidity 59�0 N/A
Total 100.0% 100.0%
* Since the 115 Health Care Trust portfolio was established in 2014, this column represents average target allocations that reflect adjustments during implementation of the 115 Health Care Trust portfolio� Information prior to 2014 does not exist�
** The target allocation for 2015 reflects a change approved by the Board and effective October 1, 2015� For the first nine months of 2015, the target allocation was the same as the 401(h) Health Care Trust portfolio�

OPERS The Comprehensive Annual Financial Report 2015116
115 Health Care Trust Portfolio Investment Section
To arrive at customized benchmark performance, the asset allocation targets are multiplied by the performance of the corresponding asset class reference indices� The asset class reference indices are specified by the Investment Policy, and are displayed below:
Historical Asset Class Composite Benchmark Indices 115 Health Care Trust Portfolio*Asset Class Composite
Benchmarks As of December 31
2015 2014
U�S� Equity Russell 3000 Stock Index 2 Russell 3000 Stock Index
Commodities S&P Goldman Sachs Commodity Index3 S&P Goldman Sachs Commodity Index
Opportunistic Custom Opportunistic Benchmark4 Custom Opportunistic Benchmark
Core Bonds Custom Core Fixed 5 Custom Core Fixed
Floating Rate Debt Credit Suisse Leveraged Loan Index6 Credit Suisse Leveraged Loan Index
Global High Yield Barclays Global High Yield 7 Barclays Global High Yield
Securitized Debt Barclays CMBS Index + 2%8 Barclays CMBS Index + 2%
TIPS Barclays U�S� TIPS Index9 Barclays U�S� TIPS Index
High Yield Barclays Capital U�S� Corporate High Yield 10 Barclays Capital U�S� Corporate High Yield
Non-U�S� Equity Custom Non-U�S� Equity Benchmark (net)11 Custom Non-U�S� Equity Benchmark (net)
Emerging Markets Debt Custom Emerging Markets Debt Benchmark12 Custom Emerging Markets Debt Benchmark
REITs DJ U�S� Select RESI 13 DJ U�S� Select RESI
Hedge Funds Custom Hedge Fund Benchmark14 Custom Hedge Fund Benchmark
Risk Parity Custom Risk Parity Benchmark15 Custom Risk Parity Benchmark
GTAA Custom GTAA Benchmark16 Custom GTAA Benchmark
U�S� Treasury Barclays U�S� Treasury Index17 N/A
Short-Term Liquidity 90-day U�S� Treasury Bill Index18 N/A
*Since the 115 Health Care Trust portfolio was established in 2014, information prior to 2014 does not exist�

The Comprehensive Annual Financial Report 2015 OPERS 117
Footnotes for Schedule of Investment Results—115 Health Care Trust PortfolioThe footnotes below provide definitions for the asset class composite benchmark indices as of December 31, 2015:2 Russell 3000 Stock Index—A capitalization-weighted stock index consisting of the 3,000 largest publicly
traded U�S� stocks by capitalization� This index is a broad measure of the performance of the aggregate
domestic equity market�3 S&P Goldman Sachs Commodity Index—Tracks general price movements and inflation in the
world economy� The index is calculated primarily on a world-production weighted basis and is comprised
of the principal physical commodities that are the subject of active, liquid futures markets�4 Custom Opportunistic Benchmark—Market value weight of the underlying portfolio benchmarks�5 Custom Core Fixed—Market value weight of the underlying portfolio benchmarks�6 Credit Suisse Leveraged Loan Index—This index is designed to mirror the investible universe of the U�S�-
denominated leveraged loan market�7 Barclays Global High Yield—The Global High Yield Index represents the union of the U�S� High Yield,
Pan-European High Yield, U�S� Emerging Markets High-Yield, and Pan-European Emerging Markets High
Yield Indices�8 Barclays Commercial Mortgage Backed Securities (CMBS) Index +2%—The Barclays CMBS ERISA-
Eligible Index is the ERISA-Eligible component of the Barclays CMBS Index� This index, which includes
investment grade securities that are ERISA-Eligible under the underwriter’s exemption, is the only CMBS
sector that is included in the U�S� Aggregate Index�9 Barclays U.S. TIPS Index—This index consists of Inflation-Protection securities issued by the U�S� Treasury�10 Barclays Capital U.S. Corporate High Yield—Covers the universe of fixed rate, non-investment grade debt�11 Custom Non-U.S. Equity Benchmark (net)— As of December 31, 2015, blend was 55% MSCI World x U�S�
(net), 31% MSCI Emerging Markets (net), 10% MSCI World x U�S� Small Cap (net), and 4% MSCI Emerging
Markets Small Cap (net)�12 Custom Emerging Markets Debt Benchmark—As of December 31, 2015, blend was 50% JPMorgan EMBI
Global Index, 50% JPMorgan GBI-Emerging Markets Global Diversified USD Index�13 DJ U.S. Select RESI—The Dow Jones U�S� Select RESI represents equity REITs and REOCs traded in the U�S� 14 Custom Hedge Fund Benchmark—As of December 31, 2015, blend was 20% HFRI Equity Hedge (Total)
Index, 20% HFRI Macro (Total) Index, 15% HFRI Relative Value (Total) Index, 0% HFRI ED: Distressed/
Restructuring Index, 15% HFRI Fund Weighted Composite Index, 30% HFRI Event-Driven (Total) Index�15 Custom Risk Parity Benchmark—Market value weight of the underlying portfolio benchmarks�16 Custom GTAA Benchmark—Market value weight of the underlying portfolio benchmarks�17 Barclays U.S. Treasury Index—This index is issued by the U�S� Treasury�18 90-day U.S. Treasury Bill Index—The 90-day Treasury Bill return as measured by Bank of America
Merrill Lynch�
Investment Section 115 Health Care Trust Portfolio

OPERS The Comprehensive Annual Financial Report 2015118
This page intentionally left blank

The Comprehensive Annual Financial Report 2015 OPERS 119
Investment Section Defined Contribution Portfolio
Defined Contribution Portfolio Asset Allocation (as of December 31, 2015, $ in billions)
$0�262
$0�516
Fixed Income
Domestic Equities
International Equities$0�257
Investment Returns—Annual Rates of Return Defined Contribution Portfolio*
-10%
Defined Contribution Portfolio Returns
Policy Benchmark Returns
-5%
0%
5%
10%
Rolling10-Yr
6.51%
6.57%
Rolling3-Yr
2015
(1.71%)
(1.63%)
Rolling5-Yr
7.46%
7.56%
5.42%
5.83%
* Annual rates of return—The Defined Contribution portfolio return is the result of the returns generated by defined contribution investments based on a combination of time-weighted and market value-weighted calculations� The defined contribution plans began in 2003; thus, 30-year return information does not exist�
Investment Returns
The Defined Contribution portfolio returned a loss of 1�71%, or (1�71%), in 2015� The portfolio composite is derived from the individual investment option returns and their actual year-end market values� Members may not invest in this portfolio composite but may invest in the individual investment options as they choose� The returns for the investment options and their respective indices are shown on the following page�

OPERS The Comprehensive Annual Financial Report 2015120
Defined Contribution Portfolio Investment Section
Investment returns for the Defined Contribution portfolio underlying asset class composites and their respective benchmarks are shown below:
Schedule of Investment Results (for the year ended December 31, 2015) Defined Contribution Portfolio2015 Rolling 3-Year Rolling 5-Year
Target Payout Fund (0�78%) 2�64% 3�63%
Target Payout Fund Index1 (0�64) 2�68 3�72
Target 2015 Fund 0�21* 4�32 5�15
Target 2015 Fund Index2 0�26* 4�15 5�05
Target 2020 Fund (1�40) 4�79 4�84
Target 2020 Fund Index3 (1�21) 4�80 4�82
Target 2025 Fund (2�00) 5�87 5�35
Target 2025 Fund Index4 (1�81) 5�95 5�35
Target 2030 Fund (2�58) 6�32 5�63
Target 2030 Fund Index5 (2�41) 6�38 5�64
Target 2035 Fund (2�85) 6�45 5�70
Target 2035 Fund Index6 (2�68) 6�47 5�68
Target 2040 Fund (2�93) 6�53 5�72
Target 2040 Fund Index7 (2�75) 6�71 5�79
Target 2045 Fund (3�00) 6�93 5�92
Target 2045 Fund Index8 (2�87) 6�96 5�88
Target 2050 Fund (3�12) 6�90 5�91
Target 2050 Fund Index9 (3�00) 6�92 5�86
Target 2055 Fund (3�08) 6�83 5�89
Target 2055 Fund Index10 (3�00) 6�92 5�86
Target 2060 Fund N/A** N/A N/A
Target 2060 Fund Index11 N/A** N/A N/A
Stable Value Index Portfolio 1�68 1�52 1�70
Stable Value Index Benchmark12 1�43 2�12 2�20
Bond Index Portfolio 0�53 1�46 3�24
Barclays U�S� Aggregate Index Benchmark13 0�55 1�44 3�25
Stock Index Portfolio 0�48 14�70 12�14
Russell 3000 Stock Index Benchmark14 0�48 14�74 12�18
Large Cap Index Portfolio 0�87 14�94 12�37
Russell 1000 Stock Index Benchmark15 0�92 15�01 12�44
Small Cap Index Portfolio (4�45) 11�61 9�11
Russell 2000 Index Benchmark16 (4�41) 11�65 9�19
Non-U�S� Stock Index Portfolio (5�53) 1�17 1�09
MSCI ACWI x U�S� Index Benchmark17 (5�66) 1�50 1�06
* Target 2015 Fund was closed in December 2015 and converted into a payout fund effective December 1, 2015� Returns for 2015 are 11-month cumulative returns (January 2015-November 2015)� The 3-year and 5-year rolling returns also include an 11-month cumulative return for 2015�
** Target 2060 Fund was launched in December 2015, thus, no returns are available�
Footnotes continue on page 121�
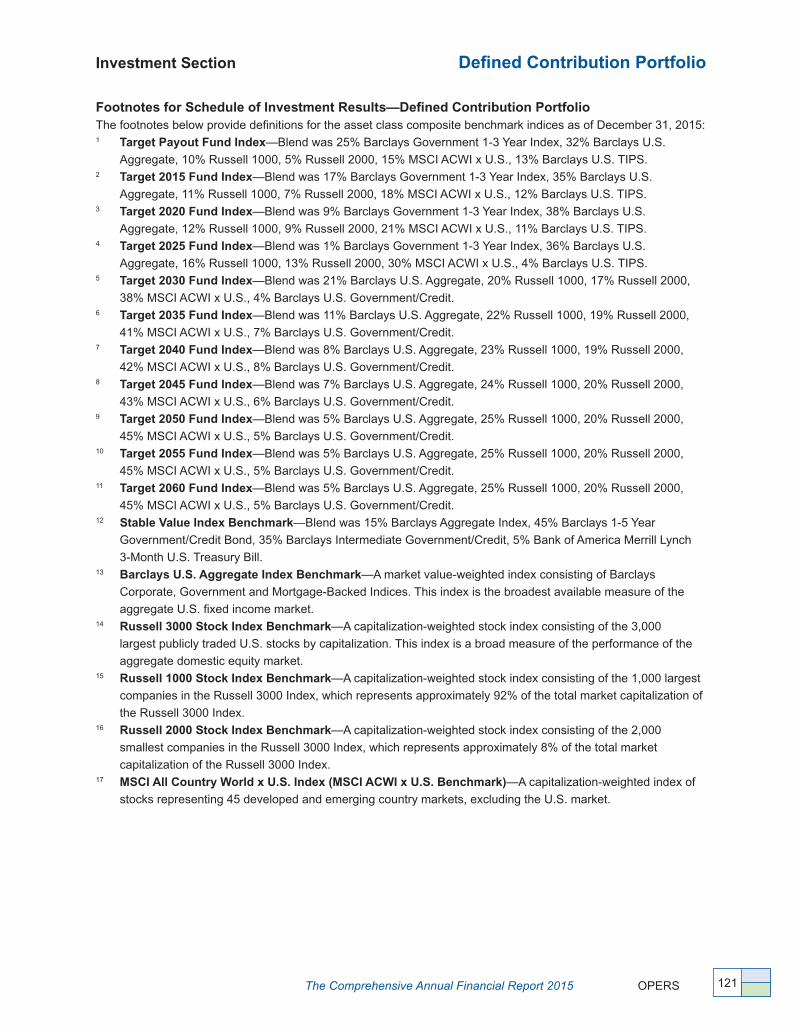
The Comprehensive Annual Financial Report 2015 OPERS 121
Investment Section Defined Contribution Portfolio
Footnotes for Schedule of Investment Results—Defined Contribution PortfolioThe footnotes below provide definitions for the asset class composite benchmark indices as of December 31, 2015:1 Target Payout Fund Index—Blend was 25% Barclays Government 1-3 Year Index, 32% Barclays U�S�
Aggregate, 10% Russell 1000, 5% Russell 2000, 15% MSCI ACWI x U�S�, 13% Barclays U�S� TIPS�2 Target 2015 Fund Index—Blend was 17% Barclays Government 1-3 Year Index, 35% Barclays U�S�
Aggregate, 11% Russell 1000, 7% Russell 2000, 18% MSCI ACWI x U�S�, 12% Barclays U�S� TIPS�3 Target 2020 Fund Index—Blend was 9% Barclays Government 1-3 Year Index, 38% Barclays U�S�
Aggregate, 12% Russell 1000, 9% Russell 2000, 21% MSCI ACWI x U�S�, 11% Barclays U�S� TIPS�4 Target 2025 Fund Index—Blend was 1% Barclays Government 1-3 Year Index, 36% Barclays U�S�
Aggregate, 16% Russell 1000, 13% Russell 2000, 30% MSCI ACWI x U�S�, 4% Barclays U�S� TIPS�5 Target 2030 Fund Index—Blend was 21% Barclays U�S� Aggregate, 20% Russell 1000, 17% Russell 2000,
38% MSCI ACWI x U�S�, 4% Barclays U�S� Government/Credit�6 Target 2035 Fund Index—Blend was 11% Barclays U�S� Aggregate, 22% Russell 1000, 19% Russell 2000,
41% MSCI ACWI x U�S�, 7% Barclays U�S� Government/Credit�7 Target 2040 Fund Index—Blend was 8% Barclays U�S� Aggregate, 23% Russell 1000, 19% Russell 2000,
42% MSCI ACWI x U�S�, 8% Barclays U�S� Government/Credit�8 Target 2045 Fund Index—Blend was 7% Barclays U�S� Aggregate, 24% Russell 1000, 20% Russell 2000,
43% MSCI ACWI x U�S�, 6% Barclays U�S� Government/Credit�9 Target 2050 Fund Index—Blend was 5% Barclays U�S� Aggregate, 25% Russell 1000, 20% Russell 2000,
45% MSCI ACWI x U�S�, 5% Barclays U�S� Government/Credit�10 Target 2055 Fund Index—Blend was 5% Barclays U�S� Aggregate, 25% Russell 1000, 20% Russell 2000,
45% MSCI ACWI x U�S�, 5% Barclays U�S� Government/Credit�11 Target 2060 Fund Index—Blend was 5% Barclays U�S� Aggregate, 25% Russell 1000, 20% Russell 2000,
45% MSCI ACWI x U�S�, 5% Barclays U�S� Government/Credit�12 Stable Value Index Benchmark—Blend was 15% Barclays Aggregate Index, 45% Barclays 1-5 Year
Government/Credit Bond, 35% Barclays Intermediate Government/Credit, 5% Bank of America Merrill Lynch
3-Month U�S� Treasury Bill�13 Barclays U.S. Aggregate Index Benchmark—A market value-weighted index consisting of Barclays
Corporate, Government and Mortgage-Backed Indices� This index is the broadest available measure of the
aggregate U�S� fixed income market�14 Russell 3000 Stock Index Benchmark—A capitalization-weighted stock index consisting of the 3,000
largest publicly traded U�S� stocks by capitalization� This index is a broad measure of the performance of the
aggregate domestic equity market�15 Russell 1000 Stock Index Benchmark—A capitalization-weighted stock index consisting of the 1,000 largest
companies in the Russell 3000 Index, which represents approximately 92% of the total market capitalization of
the Russell 3000 Index�16 Russell 2000 Stock Index Benchmark—A capitalization-weighted stock index consisting of the 2,000
smallest companies in the Russell 3000 Index, which represents approximately 8% of the total market
capitalization of the Russell 3000 Index�17 MSCI All Country World x U.S. Index (MSCI ACWI x U.S. Benchmark)—A capitalization-weighted index of
stocks representing 45 developed and emerging country markets, excluding the U�S� market�
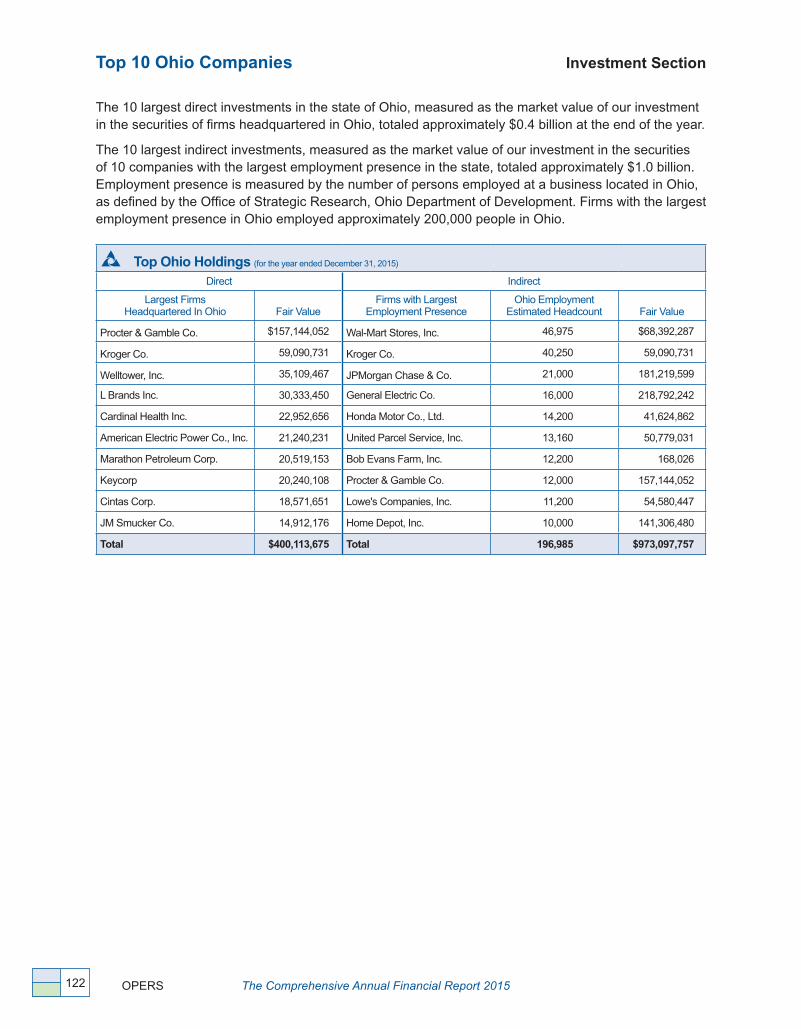
OPERS The Comprehensive Annual Financial Report 2015122
The 10 largest direct investments in the state of Ohio, measured as the market value of our investment in the securities of firms headquartered in Ohio, totaled approximately $0�4 billion at the end of the year�
The 10 largest indirect investments, measured as the market value of our investment in the securities of 10 companies with the largest employment presence in the state, totaled approximately $1�0 billion� Employment presence is measured by the number of persons employed at a business located in Ohio, as defined by the Office of Strategic Research, Ohio Department of Development� Firms with the largest employment presence in Ohio employed approximately 200,000 people in Ohio�
Top Ohio Holdings (for the year ended December 31, 2015)
Direct Indirect
Largest Firms Headquartered In Ohio Fair Value
Firms with Largest Employment Presence
Ohio Employment Estimated Headcount Fair Value
Procter & Gamble Co� $157,144,052 Wal-Mart Stores, Inc� 46,975 $68,392,287
Kroger Co� 59,090,731 Kroger Co� 40,250 59,090,731
Welltower, Inc� 35,109,467 JPMorgan Chase & Co� 21,000 181,219,599
L Brands Inc� 30,333,450 General Electric Co� 16,000 218,792,242
Cardinal Health Inc� 22,952,656 Honda Motor Co�, Ltd� 14,200 41,624,862
American Electric Power Co�, Inc� 21,240,231 United Parcel Service, Inc� 13,160 50,779,031
Marathon Petroleum Corp� 20,519,153 Bob Evans Farm, Inc� 12,200 168,026
Keycorp 20,240,108 Procter & Gamble Co� 12,000 157,144,052
Cintas Corp� 18,571,651 Lowe's Companies, Inc� 11,200 54,580,447
JM Smucker Co� 14,912,176 Home Depot, Inc� 10,000 141,306,480
Total $400,113,675 Total 196,985 $973,097,757
Top 10 Ohio Companies Investment Section
The Comprehensive Annual Financial Report 2015 OPERS 123
The investment and fiduciary responsibilities of the Board are governed by ORC 145�11 and the requirements of the OPERS Code of Ethics and Personal Trading Policy, and applicable state statutes� The Board discharges its duties solely in the interest of participants and beneficiaries, for the exclusive purpose of providing benefits and defraying reasonable expenses of administering OPERS, with the care, skill and diligence of a prudent person, by diversifying the investments�
The Board reviews all policies and approves changes or additions as appropriate� The Investment staff fulfills the mandates and obligations described in the policies and recommends changes to the Board, as appropriate� The following policies reflect those in place for the 2015 fiscal year�
The Board manages the assets in a fashion that reflects the OPERS unique liabilities, funding resources and portfolio size, by incorporating accepted investment theory and reliable, empirical evidence� The Board ensures adequate risk control of the Defined Benefit, 401(h) Health Care Trust, 115 Health Care Trust and Defined Contribution portfolios through diversification, portfolio guidelines, risk budgeting, compliance and monitoring�
The purpose of the OPERS policies is to provide a broad strategic framework for managing portfolios� Approved Board asset class policies are summarized beginning on page 130 and are posted on the OPERS website, www�OPERS�org, where they can be viewed in their entirety�
RebalancingMarkets are dynamic and portfolios must be reviewed regularly to ensure holdings remain within their strategic asset allocations� To ensure conformance with the asset allocation policies, the Defined Benefit, Defined Contribution, 401(h) Health Care Trust and 115 Health Care Trust portfolios are reviewed daily for compliance within the target asset allocation percentages, specified by portfolio, reasonable costs and best interest of OPERS�
The Board establishes and reviews asset allocation targets, ranges and investment policies against capital market expectations, the investment landscape and an annual actuarial assessment by the actuarial consultant of each portfolio� A comprehensive strategic asset allocation review is completed approximately every five years� The review helps to assess the continuing appropriateness of the asset allocation policy and could include an asset/liability study, required funding, actuarial interest rate assumption and funded status of liabilities� Additionally, the review may also include a study of portfolio design and comparisons with peers�
Defined Benefit Investment PoliciesInvestment Objective
The primary objective of the Defined Benefit portfolio is to secure statutory benefits provided by OPERS and to keep OPERS costs reasonable for employees and employers�
Asset Allocation and Performance Objectives
The Board asset allocation policy establishes a framework that has a high likelihood of realizing the OPERS long-term investment objectives� The Defined Benefit portfolio performance objectives are to exceed the OPERS performance benchmark, net of investment expenses over five-year periods; and exceed the actuarial interest rate, currently 8%, over a reasonably longer time horizon�
Investment Section Investment Objectives and Policies

OPERS The Comprehensive Annual Financial Report 2015124
Investment Objectives and Policies Investment Section
Defined Benefit Asset AllocationAsset Class Target Allocation Range Benchmark Index
Public Equity 39.0% 31 to 47%
U�S� Equity Custom Allocation* +/- 5% Russell 3000 Stock Index
Non-U�S� Equity Custom Allocation* +/- 5
Custom benchmark of the following indices: 55% MSCI World Index x U�S� Standard 10% MSCI World Index x U�S� Small Cap 31% MSCI Emerging Markets Standard4% MSCI Emerging Markets Small Cap
Fixed Income 23.0% 16 to 30%
Core Fixed 10�0 7 to 13
Custom benchmark using the market value weight of the following indices:Barclays Capital Aggregate IndexBarclays Capital Aggregate Index weightings with a maximum allocation to Treasuries and government-related issues of 25% with corresponding pro-rata increases to the credit and securitized sectors
Emerging Markets Debt 6�0 2 to 8
Custom benchmark of the following indices:50% JP Morgan Emerging Markets Bond Index (EMBI) Global50% JP Morgan Government Bond Index (GBI)-Emerging Markets Global Diversified
Floating Rate Debt 0�0 0 to 2 Credit Suisse Leveraged Loan Index
Securitized Debt 1�0 0 to 2 Non-Agency CMBS component of Barclays U�S� Aggregate Index plus 200 bps
TIPS 1�0 0 to 2 Barclays U�S� TIPS Index
High Yield 3�0 0 to 5 Barclays U�S� High Yield Index
Global High Yield 1�0 0 to 2 Barclays Global High Yield Index
U�S� Treasury 1�0 0 to 2 Barclays U�S� Treasury Index
Alternatives 31.0% 22 to 40%
Private Equity 10�0 5 to 15 State Street Private Equity Index (SSPEI)
Real Estate 10�0 5 to 15 Net NFI-ODCE plus 85 basis points
Hedge Funds 8�0 4 to 12 Custom benchmark using the HFRI Single Strategy Indices weighted by the target allocations listed in the Hedge Funds Policy
Opportunistic 2�0 0 to 4 Market value weight of underlying portfolio benchmarks
Commodities 1�0 0 to 2 S&P GSCI Total Return Index
Risk Parity 5.0% 2 to 8% Market value weight of underlying portfolio benchmarks
GTAA 2.0% 0 to 4% Market value weight of underlying portfolio benchmarks
Operating Cash 0.0% 0 to 3% N/A
Total 100.0%
* The custom allocation is reset quarterly based on the U�S� to Non-U�S� equity ratio as measured by the market capitalization of the MSCI ACWI —Investible Market Index�
The Board sets target allocations (targets) to various asset classes that are designed to meet the OPERS long-term investment objectives� Targets for the Public Equity and Fixed Income asset classes are 39% and 23%, respectively, with the remaining 31%, 5% and 2% allocated to Alternatives (Private Equity, Real Estate, Commodities, Hedge Funds, and Opportunistic), Risk Parity and Global Tactical Asset Allocation (GTAA), respectively� The Board also establishes a band of minimum and maximum allowable allocations, or ranges, surrounding each asset class target� The purpose of ranges is to appropriately and cost-effectively balance the Board’s investment policy with the investment strategies pursued over shorter time periods� The following table lists the Defined Benefit portfolio target allocations, ranges and performance benchmarks for each asset class:

The Comprehensive Annual Financial Report 2015 OPERS 125
Investment Section Investment Objectives and Policies
401(h) Health Care Trust Investment Policies
Investment Objective
The primary objective of the 401(h) Health Care Trust portfolio is to provide funding for the discretionary health care for eligible members over a solvency period as defined by the Board� The assets of the 401(h) Health Care Trust portfolio are invested with the objectives of: a) preservation of capital, and b) earning a reasonable return�
Asset Allocation and Performance Objectives
The approved asset allocation policy establishes a framework that has a high likelihood of realizing the long-term investment objective� The 401(h) Health Care Trust portfolio performance objective is to exceed the established performance benchmark, net of investment expenses� The table below sets forth targets, ranges and performance benchmarks for each asset class:
401(h) Health Care Trust Asset AllocationAsset Class Target Allocation Range Benchmark Index
Public Equity 43.0% 34 to 52%
U�S� Equity Custom Allocation* +/- 5% Russell 3000 Stock Index
Non-U�S� Equity Custom Allocation* +/- 5
Custom benchmark of the following indices: 55% MSCI World Index x U�S� Standard 10% MSCI World Index x U�S� Small Cap 31% MSCI Emerging Markets Standard 4% MSCI Emerging Markets Small Cap
Fixed Income 34.0% 24 to 44%
Core Fixed 17�0 12 to 22
Custom benchmark using the market value weight of the following indices:Barclays Capital Aggregate IndexBarclays Capital Aggregate Index weightings with a maximum allocation to Treasuries and government-related issues of 25% with corresponding pro-rata increases to the credit and securitized sectors
Emerging Markets Debt 6�0 2 to 8
Custom benchmark of the following indices:50% JP Morgan Emerging Markets Bond Index Global50% JP Morgan Government Bond Index-Emerging Markets Global Diversified
Floating Rate Debt 0�0 0 to 2 Credit Suisse Leveraged Loan Index
Securitized Debt 1�0 0 to 2 Non-Agency CMBS component of Barclays U�S� Aggregate Index plus 200 bps
TIPS 5�0 2 to 8 Barclays U�S� TIPS Index
High Yield 2�5 0 to 5 Barclays U�S� High Yield Index
Global High Yield 1�5 0 to 4 Barclays Global High Yield Index
U�S� Treasury 1�0 0 to 2 Barclays U�S� Treasury Index
Alternatives 16.0% 11 to 21%
REITs 6�0 3 to 9 Dow Jones U�S� Select RESI Total Return
Hedge Funds 6�0 3 to 9 Custom benchmark using the HFRI single strategy indices weighted by the target allocations listed in the Hedge Funds Policy
Opportunistic 2�0 0 to 4 Market value weight of underlying portfolio benchmarks
Commodities 2�0 0 to 4 S&P GSCI Total Return Index
Risk Parity 5.0% 2 to 8% Market value weight of underlying portfolio benchmarks
GTAA 2.0% 0 to 4% Market value weight of underlying portfolio benchmarks
Operating Cash N/A 0 to 3% N/A
Total 100.0%
* The custom allocation is reset quarterly based on the U�S� to Non-U�S� equity ratio as measured by the market capitalization of the MSCI ACWI–Investible Market Index�
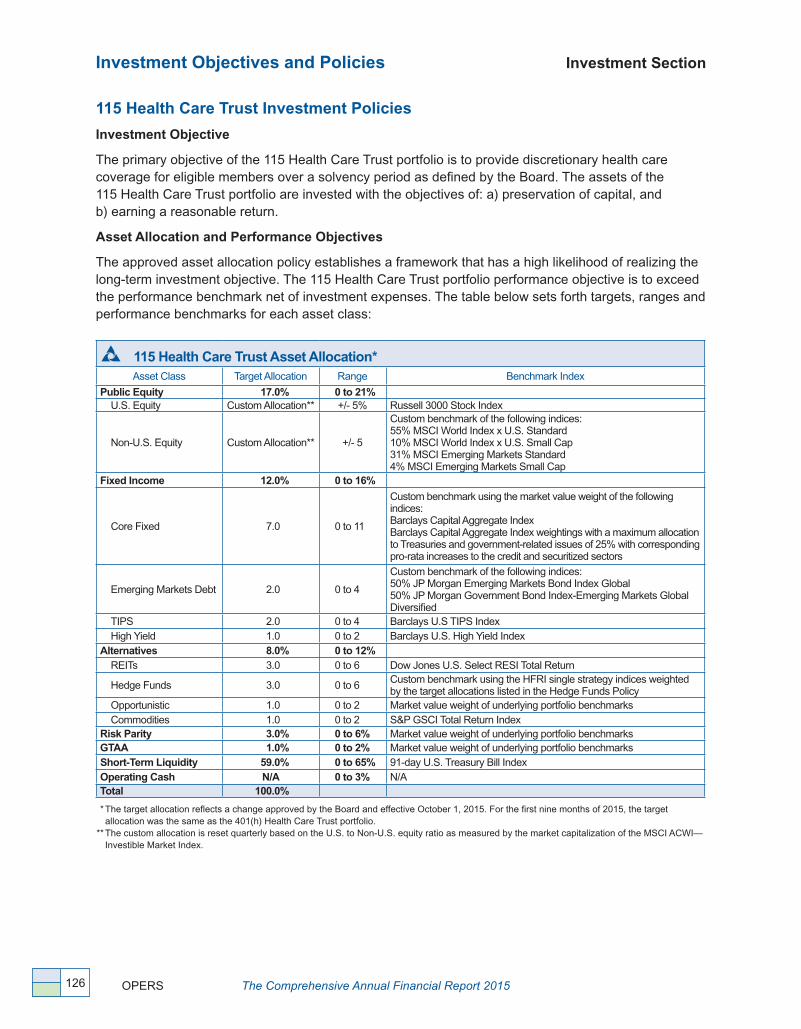
OPERS The Comprehensive Annual Financial Report 2015126
Investment Objectives and Policies Investment Section
115 Health Care Trust Investment Policies
Investment Objective
The primary objective of the 115 Health Care Trust portfolio is to provide discretionary health care coverage for eligible members over a solvency period as defined by the Board� The assets of the 115 Health Care Trust portfolio are invested with the objectives of: a) preservation of capital, and b) earning a reasonable return�
Asset Allocation and Performance Objectives
The approved asset allocation policy establishes a framework that has a high likelihood of realizing the long-term investment objective� The 115 Health Care Trust portfolio performance objective is to exceed the performance benchmark net of investment expenses� The table below sets forth targets, ranges and performance benchmarks for each asset class:
115 Health Care Trust Asset Allocation*Asset Class Target Allocation Range Benchmark Index
Public Equity 17.0% 0 to 21%U�S� Equity Custom Allocation** +/- 5% Russell 3000 Stock Index
Non-U�S� Equity Custom Allocation** +/- 5
Custom benchmark of the following indices: 55% MSCI World Index x U�S� Standard 10% MSCI World Index x U�S� Small Cap 31% MSCI Emerging Markets Standard 4% MSCI Emerging Markets Small Cap
Fixed Income 12.0% 0 to 16%
Core Fixed 7�0 0 to 11
Custom benchmark using the market value weight of the following indices:Barclays Capital Aggregate IndexBarclays Capital Aggregate Index weightings with a maximum allocation to Treasuries and government-related issues of 25% with corresponding pro-rata increases to the credit and securitized sectors
Emerging Markets Debt 2�0 0 to 4
Custom benchmark of the following indices:50% JP Morgan Emerging Markets Bond Index Global50% JP Morgan Government Bond Index-Emerging Markets Global Diversified
TIPS 2�0 0 to 4 Barclays U�S TIPS IndexHigh Yield 1�0 0 to 2 Barclays U�S� High Yield Index
Alternatives 8.0% 0 to 12%REITs 3�0 0 to 6 Dow Jones U�S� Select RESI Total Return
Hedge Funds 3�0 0 to 6 Custom benchmark using the HFRI single strategy indices weighted by the target allocations listed in the Hedge Funds Policy
Opportunistic 1�0 0 to 2 Market value weight of underlying portfolio benchmarksCommodities 1�0 0 to 2 S&P GSCI Total Return Index
Risk Parity 3.0% 0 to 6% Market value weight of underlying portfolio benchmarksGTAA 1.0% 0 to 2% Market value weight of underlying portfolio benchmarksShort-Term Liquidity 59.0% 0 to 65% 91-day U�S� Treasury Bill IndexOperating Cash N/A 0 to 3% N/ATotal 100.0%
* The target allocation reflects a change approved by the Board and effective October 1, 2015� For the first nine months of 2015, the target allocation was the same as the 401(h) Health Care Trust portfolio�
** The custom allocation is reset quarterly based on the U�S� to Non-U�S� equity ratio as measured by the market capitalization of the MSCI ACWI—Investible Market Index�

The Comprehensive Annual Financial Report 2015 OPERS 127
Investment Section Investment Objectives and Policies
Defined Contribution Investment Policies
Investment Objective
The Defined Contribution portfolio investment options are intended to be primary retirement savings vehicles for members� The long-term objectives of the Defined Contribution portfolios are to support defined contribution plan members in having independent control over their OPERS retirement assets, while providing a suitable framework to invest their assets over the long-term�
Asset Allocation
The asset allocation and diversification objective is based on three components: Target Date Funds, OPERS Funds and the self-directed brokerage account that offers members in the defined contribution plans (the Member-Directed Plan and the Combined Plan) diversified investment options� The default investment option for defined contribution plan members who fail to make a selection is to place their contributions into the Target Date Fund that most closely corresponds to their current age assuming a payout at age 65�
• Target Date Funds
Target Date Funds is a passive program that links a defined contribution member’s investment portfolio to a particular time horizon, typically an expected retirement date� A target date fund with a corresponding target date in the distant future will have an allocation tilted more toward equities and other higher risk/higher reward asset classes to enhance the opportunity to accumulate capital� As target date funds move towards their target payout dates, they reduce their allocation to such assets to better preserve accumulated capital while simultaneously increasing their allocation to fixed income and cash� These transitions, called glide paths, are accomplished by assigning each target date fund an asset class investment allocation and an asset class range surrounding such targets� The asset class ranges for each Target Date Fund are on the next page�

OPERS The Comprehensive Annual Financial Report 2015128
Investment Objectives and Policies Investment Section
Defined Contribution Asset Allocation
OPERS Investment Fund
OPERS Target Date Funds
Payout 2015* 2020 2025 2030
Target Range Target Range Target Range Target Range Target Range
Large Cap Index Fund 10�0% +/-1�3% 11�0% +/-1�4% 14�0% +/-1�7% 18�0% +/-1�9% 21�0% +/-2�1%
Small Cap Index Fund 5�0 +/-1�7 6�0 +/-1�8 11�0 +/-2�1 15�0 +/-2�4 18�0 +/-2�6
Non-U�S� Stock Index Fund 15�0 +/-2�2 17�0 +/-2�4 25�0 +/-2�6 33�0 +/-2�8 39�0 +/-2�8
Bond Index Fund 32�0 +/-4�0 33�0 +/-4�1 38�0 +/-2�7 31�0 +/-2�4 16�0 +/-2�4
Short-Term Bond Fund 25�0 +/-3�7 21�0 +/-2�1 4�0 +/-0�5 0�0 +/-0�0 0�0 +/-0�0
Long-Duration Bond Fund 0�0 +/-0�0 0�0 +/-0�0 0�0 +/-0�0 1�0 +/-1�5 6�0 +/-1�4
TIPS Fund 13�0 +/-3�4 12�0 +/-3�5 8�0 +/-0�5 2�0 +/-0�5 0�0 +/-0�0
Defined Contribution Asset Allocation (continued)
OPERS Investment Fund
OPERS Target Date Funds
2035 2040 2045 2050 2055 2060
Target Range Target Range Target Range Target Range Target Range Target Range
Large Cap Index Fund 22�0% +/-2�1% 23�0% +/-2�2% 24�0% +/-2�3% 25�0% +/-2�3% 25�0% +/-2�3% 25�0% +/-2�3%
Small Cap Index Fund 19�0 +/-2�7 19�0 +/-2�7 20�0 +/-2�8 20�0 +/-2�8 20�0 +/-2�8 20�0% +/-2�8%
Non-U�S� Stock Index Fund 41�0 +/-2�9 43�0 +/-3�0 43�0 +/-3�1 45�0 +/-3�1 45�0 +/-3�1 45�0% +/-3�1%
Bond Index Fund 10�0 +/-2�3 8�0 +/-2�2 7�0 +/-2�1 5�0 +/-2�1 5�0 +/-2�1 5�0% +/-2�1%
Short-Term Bond Fund 0�0 +/-0�0 0�0 +/-0�0 0�0 +/-0�0 0�0 +/-0�0 0�0 +/-0�0 0�0% +/-0�0%
Long-Duration Bond Fund 9�0 +/-1�3 8�0 +/-1�3 6�0 +/-1�2 5�0 +/-1�2 5�0 +/-1�2 5�0% +/-1�2%
TIPS Fund 0�0 +/-0�0 0�0 +/-0�0 0�0 +/-0�0 0�0 +/-0�0 0�0 +/-0�0 0�0% +/-0�0%
* Target 2015 Fund was closed in December 2015�

The Comprehensive Annual Financial Report 2015 OPERS 129
Investment Section Investment Objectives and Policies
• OPERS Funds
OPERS offers members in the defined contribution plans low cost, primarily passive, asset class specific investment funds� Those funds, and their respective indices, are as follows:
OPERS Fund Market Index
Stable Value Custom Index*
Bond Index Barclays U�S� Aggregate
Stock Index Russell 3000
Large Cap Russell 1000
Small Cap Russell 2000
Non-U�S� Stock Index MSCI ACWI Dividend Return x U�S� Index
* The Stable Value Fund (SVF) is managed actively and its primary objective is to preserve the value of principal� Its secondary objective is to exceed the long-term return of a Custom Index comprised of 45% of the Barclays 1-5 Year Government/Corporate Bond Index, 35% of the Barclays Intermediate Government/Corporate Bond Index, 15% of the Barclays Aggregate Bond Index and 5% of the Merrill Lynch 3-Month U�S� Treasury Bills Index� A typical stable value fund return fluctuates less than one percent a year; therefore, neither the short-term returns nor volatility of the SVF is consistent with market value instruments such as those in the Custom Index�
• Self-Directed Brokerage Account
The self-directed brokerage account option provides defined contribution members more flexibility in choosing their own retirement savings investments by allowing them to invest in a variety of active and passive mutual funds� The program parameters are the following:
➤ Only designated mutual funds can be purchased through the window�
➤ Maximum of 50% of a member’s portfolio is allowed to be invested through the brokerage window, though the Plan will not rebalance the brokerage investments should they grow to exceed 50% of participant’s assets�
➤ Account minimum of $5,000 is required before a participant can use the window�
➤ The annual cost of the window is borne by the participant using the window�
Rebalancing
The ranges specified for the target date funds are a function of the expected volatility of each asset class and the proportion of the total fund allocated to the asset class� The staff shall ensure target date funds conform to the asset allocation policy through quarterly review and rebalancing�
Performance Objectives and Risk Management
The performance objectives for the target date funds are to meet the return of the respective performance benchmarks primarily through the use of passive index funds� The performance benchmarks are a custom index comprised of market indices for the component funds weighted in accordance with the target date fund target allocations as specified in the Defined Contribution Fund policy� The performance objectives for the OPERS funds are to meet the return of their respective performance benchmarks, gross of investment manager fees� There is no plan-level performance objective for the self-directed brokerage account because the mutual funds purchased through it are selected by members�
The defined contribution fund investment options offer diversification to minimize the impact of loss from individual positions� In addition to diversification, the program is passively managed for the target date funds and OPERS funds� The self-directed brokerage account offers participants a broad range of mutual fund choices, that are self-selected and subject to the program parameters�
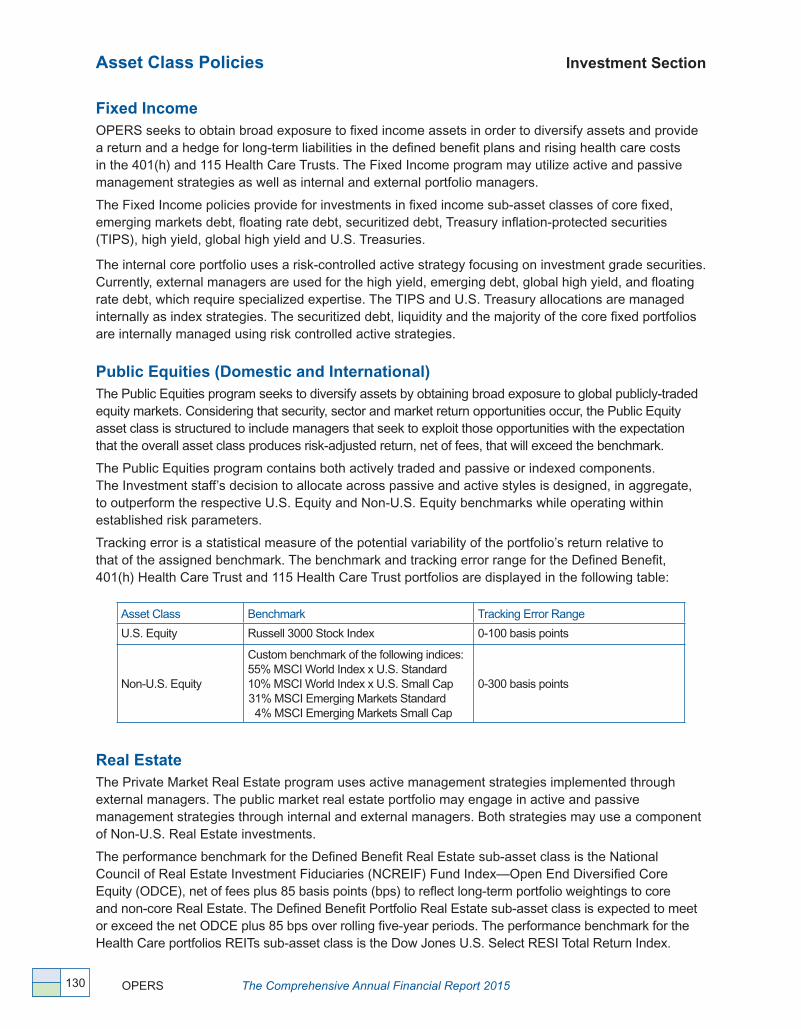
OPERS The Comprehensive Annual Financial Report 2015130
Fixed IncomeOPERS seeks to obtain broad exposure to fixed income assets in order to diversify assets and provide a return and a hedge for long-term liabilities in the defined benefit plans and rising health care costs in the 401(h) and 115 Health Care Trusts� The Fixed Income program may utilize active and passive management strategies as well as internal and external portfolio managers�
The Fixed Income policies provide for investments in fixed income sub-asset classes of core fixed, emerging markets debt, floating rate debt, securitized debt, Treasury inflation-protected securities (TIPS), high yield, global high yield and U�S� Treasuries�
The internal core portfolio uses a risk-controlled active strategy focusing on investment grade securities� Currently, external managers are used for the high yield, emerging debt, global high yield, and floating rate debt, which require specialized expertise� The TIPS and U�S� Treasury allocations are managed internally as index strategies� The securitized debt, liquidity and the majority of the core fixed portfolios are internally managed using risk controlled active strategies�
Public Equities (Domestic and International)The Public Equities program seeks to diversify assets by obtaining broad exposure to global publicly-traded equity markets� Considering that security, sector and market return opportunities occur, the Public Equity asset class is structured to include managers that seek to exploit those opportunities with the expectation that the overall asset class produces risk-adjusted return, net of fees, that will exceed the benchmark�
The Public Equities program contains both actively traded and passive or indexed components� The Investment staff’s decision to allocate across passive and active styles is designed, in aggregate, to outperform the respective U�S� Equity and Non-U�S� Equity benchmarks while operating within established risk parameters�
Tracking error is a statistical measure of the potential variability of the portfolio’s return relative to that of the assigned benchmark� The benchmark and tracking error range for the Defined Benefit, 401(h) Health Care Trust and 115 Health Care Trust portfolios are displayed in the following table:
Asset Class Benchmark Tracking Error Range
U�S� Equity Russell 3000 Stock Index 0-100 basis points
Non-U�S� Equity
Custom benchmark of the following indices:55% MSCI World Index x U�S� Standard10% MSCI World Index x U�S� Small Cap31% MSCI Emerging Markets Standard4% MSCI Emerging Markets Small Cap
0-300 basis points
Real EstateThe Private Market Real Estate program uses active management strategies implemented through external managers� The public market real estate portfolio may engage in active and passive management strategies through internal and external managers� Both strategies may use a component of Non-U�S� Real Estate investments�
The performance benchmark for the Defined Benefit Real Estate sub-asset class is the National Council of Real Estate Investment Fiduciaries (NCREIF) Fund Index—Open End Diversified Core Equity (ODCE), net of fees plus 85 basis points (bps) to reflect long-term portfolio weightings to core and non-core Real Estate� The Defined Benefit Portfolio Real Estate sub-asset class is expected to meet or exceed the net ODCE plus 85 bps over rolling five-year periods� The performance benchmark for the Health Care portfolios REITs sub-asset class is the Dow Jones U�S� Select RESI Total Return Index�
Asset Class Policies Investment Section

The Comprehensive Annual Financial Report 2015 OPERS 131
Investment Section Asset Class Policies
The Private Market Real Estate program has a single-manager exposure limited to 20% of the Private Market Real Estate program� The long-term goal is to have at least 80% of the Private Market Real Estate portfolio invested in apartment, industrial, office and retail assets� Investments outside the United States will be limited to no more than 25% of the Private Market Real Estate portfolio� OPERS limits the amount of equity in any single direct investment to 15% of the Private Market Real Estate target allocation� Single closed-end commingled funds are limited to the greater of $400 million or 5% of the Private Market Real Estate target allocation� Single open-end commingled funds are limited to 10% of the Private Market Real Estate target allocation�
Private Equity
The Private Equity sub-asset class seeks superior equity returns plus a liquidity premium by investing with managers who have a consistent record of producing top quartile returns� Private Equity investments also allow the opportunity to invest in the very significant portion of the global economy that is not publicly traded, as well as to access strategies which benefit from longer-holding or workout periods� Accessing these strategies leads not only to superior returns but also to additional diversification of assets and strategies within the Defined Benefit portfolio�
The Private Equity program exclusively uses active management strategies and is 100% externally managed with single fund exposure limited to the lesser of 24�99% of total fund raise or $400 million� Risk is also managed beyond manager and firm exposure through a combination of quantitative and qualitative constraints for liquidity, vintage, currency, industry, leverage and geography�
Private Equity performance is benchmarked against the State Street Private Equity Index (SSPEI) and is calculated using the time-weighted total return method� In addition, computed internal rate of return (IRR) results are compared to peer rankings using the SSPEI data whose performance is also based on the IRR methodology�
Cash Management
Cash Management actively seeks to preserve principal, provide adequate liquidity and achieve market returns in excess of the benchmark, net of fees� Cash management involves actively investing cash and securities and lending cash collateral relative to the respective benchmarks of each portfolio within established risk parameters� Interest rate, credit and liquidity risk are managed through a combination of quantitative and qualitative constraints with the objective being to preserve principal, maintain liquidity, and provide a market rate of return�
Derivatives
Derivatives may be used to facilitate cost-effective and timely investments, for risk management purposes, to provide for trading efficiency, and enhance or manage the risk/return profile of individual securities or portfolios� Derivatives can be used to assist in achieving investment goals within a particular investment strategy such as managing the overall asset allocation of a fund or portfolio, including rebalancing activities, transitioning assets between managers, and equitizing or bondizing cash balances� In addition, they can be used to hedge or manage exposure to equity markets, commodities, currencies, duration, total return, yield or credit, interest rates, sectors, sub-sectors and/or countries, and risk/return profiles of individual securities or portfolios�

OPERS The Comprehensive Annual Financial Report 2015132
Asset Class Policies Investment Section
Derivatives are grouped into three categories: Category I derivatives are securities-based and are traded either on an exchange or over-the-counter (OTC)� Category II derivatives are non-securities-based exchange-traded instruments such as futures, options on futures and options� Category III derivatives are non-securities-based OTC transactions�
In order to manage overall fund liquidity (Category III) and to balance the fund-level usage of derivatives versus physical securities (Category II), the following limits apply to public market assets held in separate accounts:
• ThegrossnotionalexposureofCategoryIIIderivativeswillnotexceed10%ofthetotalnetassetvalue of public market assets held in separate accounts, excluding foreign exchange derivatives used for hedging purposes� Additional portfolio level restrictions may apply�
• ThecombinedgrossnotionalexposureofCategoryIIandCategoryIIIderivativeswillnotexceed20% of the total net asset value of public market assets held in separate accounts, excluding foreign exchange derivatives used for hedging purposes� Additional portfolio level restrictions may apply�
• CurrencyforwardsshallbeoneyearorlessintenorunlessapprovedbytheChiefInvestmentOfficer.
Hedge Funds
Hedge fund investments are structured to preserve capital and provide competitive returns with a low correlation to traditional asset classes, providing diversification, reduced volatility of returns and long-term return enhancement�
The performance objective for the Hedge Funds sub-asset class is a custom benchmark using the HFRI single-strategy indices weighted by the target allocation� Risk is managed through a combination of quantitative and qualitative measures� The requirements for establishing appropriate risk metrics for each hedge fund include: (1) providing risk parameter and performance reporting on a monthly basis; (2) seeking advice from legal counsel, the due diligence consultant and/or investment advisor to determine if audited financial statements are required based on the specific structure of each investment; and, (3) establishing position-level transparency targets for the Hedge Funds asset class� Hedge fund allocations are limited to $400 million, or 10%, of the sub-asset class market value, whichever is greater for hedge fund managers; and, direct hedge fund managers are limited to $200 million, or 7%, of the sub-asset class market value, whichever is greater�
Securities Lending
The Securities Lending program actively lends securities through various programs to qualified borrowers in order to provide incremental income to the respective asset classes� Staff will assess the performance of the securities lending program on no less than an annual basis�
Cash reinvestment risk and counterparty risk are managed through a combination of quantitative and qualitative constraints� Excess collateral, marked-to-market daily, is held for each loan in the amount of 102% for domestic securities and 105% for international securities� The maximum percentage of assets that may be on loan is 50% of the eligible assets while the maximum amount that may be on loan with any one borrower is 15% of the eligible assets�

The Comprehensive Annual Financial Report 2015 OPERS 133
Investment Section Asset Class Policies
Commodities
Commodity investments are to provide exposure to global commodities and to achieve returns comparable to or in excess of the benchmark return, net of fees� Commodity portfolios shall be governed by manager portfolio guidelines that establish management parameters to achieve commodity-based returns� Commodity investments may be in any of the commodities that comprise the Standard and Poor’s-Goldman Sachs Commodity Index and/or the Bloomberg Commodity Index at the time of purchase� Risk is managed through a combination of quantitative and qualitative constraints�
Opportunistic
Investments in the Opportunistic sub-asset class include investment strategies or assets that are not currently used in the respective Defined Benefit, 401(h) Health Care Trust or 115 Health Care Trust portfolios but which have the potential to improve investment results over time� Assets and strategies used in the Opportunistic program must have the potential to be mainstreamed into the investment program over time, or be opportunistic based on either valuation or circumstances�
Every strategy within the Opportunistic sub-asset class will have a specific performance benchmark� The overall benchmark for the Opportunistic sub-asset class is the market value weight of the underlying benchmarks� Long-term returns from the Opportunistic sub-asset class should match or exceed the OPERS total fund benchmark, which is a measure of the opportunity cost of investing in this category�
The primary risk control mechanisms are the limited size of the opportunistic allocation and the limits on the size of single assets and strategies� No single investment strategy or portfolio assigned to the same benchmark within the Opportunistic sub-asset class may exceed 0�5% of the sum of the Defined Benefit, 401(h) Health Care Trust, or 115 Health Care Trust portfolio assets at the time of funding�
Global Tactical Asset Allocation (GTAA)
GTAA seeks to capitalize on short-term opportunities among global capital market assets� The strategy focuses on general movements in the market rather than on performance of individual securities� This requires investing in multiple asset types and may employ leverage to obtain the desired mix� GTAA investments are expected to provide fund level diversification and an additional source of excess return�
GTAA assets may be invested in all types of instruments intended to obtain exposure to a wide variety of asset types including equities, fixed income (both sovereign and credit-based exposures), inflation-linked bonds, commodities and other asset types� Instruments used may be exchange-traded or non-exchange traded and may be physical securities or derivatives, and some degree of leverage may be employed�
The overall benchmark for GTAA is the market value weight of the underlying managers’ benchmarks� Risk is managed through a combination of quantitative and qualitative constraints� By allocating to multiple GTAA managers, concentration to any one manager is limited� Investment Advisors will help identify managers, using a process approved by the Chief Investment Officer� In addition to the investment due-diligence process, each manager will undergo an operational due-diligence review prior to funding to evaluate non-investment related risk factors�
OPERS The Comprehensive Annual Financial Report 2015134
Risk Parity
Risk Parity seeks to diversify assets by obtaining exposure to global capital market assets in a risk-aware manner� This requires investing in multiple asset types and leveraging exposures to global markets in order to obtain the desired risk-aware mix� The Risk Parity allocation is structured to achieve roughly balanced risk exposure across equities, nominal fixed income, and inflation sensitive assets, targeting a total volatility level comparable to that of the Defined Benefit portfolio, the 401(h) Health Care Trust portfolio and the 115 Health Care Trust portfolio�
The overall benchmark for Risk Parity is the market value weight of the underlying managers’ benchmarks� The Board will set performance expectation for Risk Parity through its approval of the Annual Investment Plan� Risk is managed through a combination of quantitative and qualitative constraints� By allocating to multiple Risk Parity managers, concentration to any one manager is limited�
Asset Class Policies Investment Section
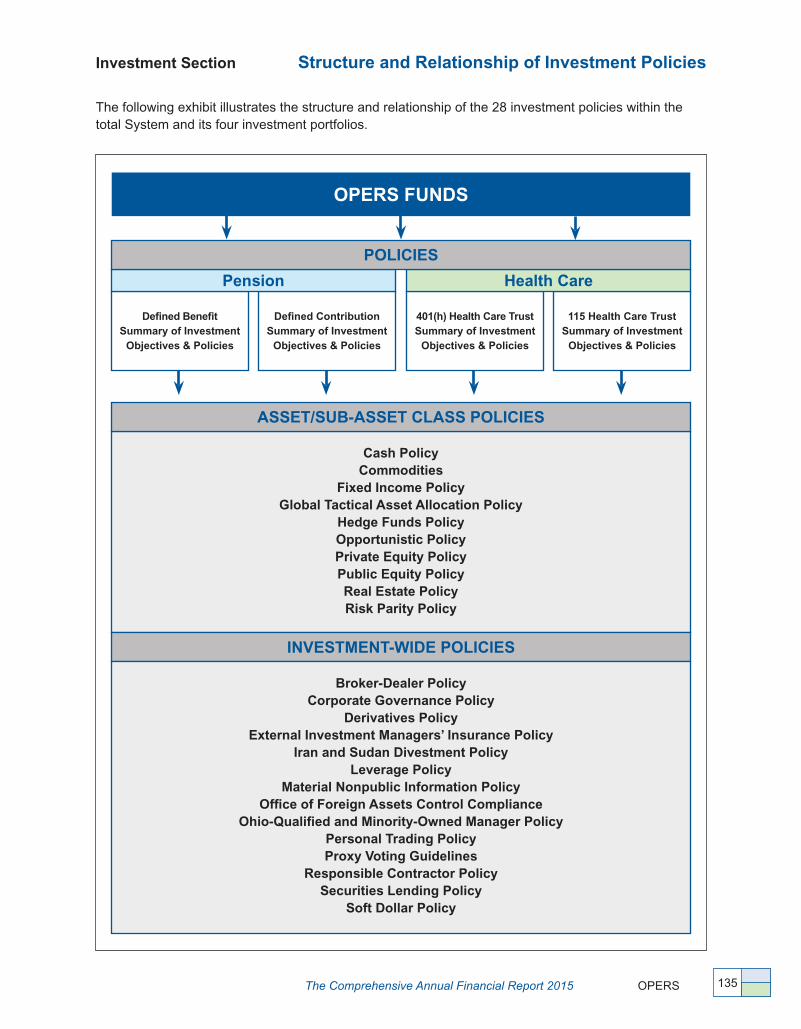
The Comprehensive Annual Financial Report 2015 OPERS 135
Defined Benefit Summary of Investment
Objectives & Policies
401(h) Health Care TrustSummary of Investment
Objectives & Policies
Defined ContributionSummary of Investment
Objectives & Policies
115 Health Care TrustSummary of Investment
Objectives & Policies
Pension Health Care
Investment Section Structure and Relationship of Investment Policies
The following exhibit illustrates the structure and relationship of the 28 investment policies within the total System and its four investment portfolios�
OPERS FUNDS
Cash PolicyCommodities
Fixed Income PolicyGlobal Tactical Asset Allocation Policy
Hedge Funds PolicyOpportunistic PolicyPrivate Equity PolicyPublic Equity PolicyReal Estate PolicyRisk Parity Policy
ASSET/SUB-ASSET CLASS POLICIES
INVESTMENT-WIDE POLICIES
Broker-Dealer PolicyCorporate Governance Policy
Derivatives PolicyExternal Investment Managers’ Insurance Policy
Iran and Sudan Divestment PolicyLeverage Policy
Material Nonpublic Information PolicyOffice of Foreign Assets Control Compliance
Ohio-Qualified and Minority-Owned Manager PolicyPersonal Trading PolicyProxy Voting Guidelines
Responsible Contractor PolicySecurities Lending Policy
Soft Dollar Policy
POLICIES

Investment Section
OPERS The Comprehensive Annual Financial Report 2015136
This page intentionally left blank
The business of pensions is the business of numbers: OPERS is 80 years young, investment returns provide approximately 60 percent of our retirement fund, members and employers contribute a percentage throughout each member’s working career, some retirees are enjoying more years in retirement than contributing years of service� With all these numbers in play—multiplied by our more than one million members—OPERS is able to maintain its balance by distilling information and by thorough, ongoing and rigorous testing of assumptions�
More than 10 years ago, anticipating the potential impact of the baby-boomer generation retiring, longevity in retirement, and the escalating cost of health care, we recognized the need for change so that the System could continue to be in the position of delivering on the promise of providing financial security for members� Our calculations were necessary and timely and helped initiate thoughtful, incremental changes that have helped further strengthen the System for future generations�
Note: This section is unaudited.
ActuarialSection
“ Forecasting our futures is built into our psyches because we will soon have to manage that future. We have no choice…we can never stop trying.”
Alan Greenspan, economist

138 OPERS The Comprehensive Annual Financial Report 2015
Letter from the Actuary Actuarial Section (unaudited)

139 The Comprehensive Annual Financial Report 2015 OPERS
Actuarial Section Letter from the Actuary

140
Letter from the Actuary Actuarial Section
OPERS The Comprehensive Annual Financial Report 2015
The Comprehensive Annual Financial Report 2015 OPERS
Actuarial Section Summary of Assumptions
141
The defined benefit pension actuarial information presented in this 2015 Comprehensive Annual Financial Report (CAFR) is based on the System’s most current actuarial valuation data as of December 31, 2015� In conjunction with the implementation of Governmental Accounting Standards Board (GASB) Statement No� 67 (GASB 67), Financial Reporting for Pension Plans–an amendment of GASB Statement No. 25, this is the second year OPERS is reporting actuarial results of pensions as of the current year� The Financial Section of the CAFR presents additional actuarial valuation information on a financial reporting basis, or Accounting Basis, as required by GASB 67� This section presents actuarial valuation information on a Funding Basis, and has been updated to reflect pension funding results as of December 31, 2015� The actuarial assumptions in this section are applicable to 2015, unless otherwise noted�
The Accounting Basis calculation methodology defined in GASB 67 requires different methods and may require different assumptions than are used to calculate the funded status of a plan� For example, GASB 67 requires the use of the fair value of assets versus the smoothed value of assets used for the Funding Basis, as reflected in the Financial Section on page 66� However, the information included in this section is reflected on a Funding Basis rather than Accounting Basis� Therefore, the GASB 67 net pension liability results will differ from the unfunded actuarial accrued liability results provided in the Schedules of Funding Progress included in this section, beginning on page 154� GASB 67 breaks the link between accounting and funding� These changes affect the accounting information disclosed in the Notes to Combining Financial Statements and Required Supplementary Information, both included in the Financial Section� However, the changes do not impact the actuarial methods and assumptions used by OPERS to determine the employer contributions needed to fund the plan� The assumptions disclosed in this section were used for both funding and financial reporting valuations, unless otherwise noted and reported in this section�
OPERS conducts experience studies every five years in accordance with Ohio Revised Code Section 145�22� The actuary conducted an experience study for the five-year period ended December 31, 2010� Following this experience study, and after consulting with the actuary, the OPERS Board of Trustees (Board) approved and adopted the methods and assumptions as disclosed in this section in 2011� These methods and assumptions apply to both the Traditional Pension Plan and the Combined Plan� The actuary will conduct a five-year experience study for the period of 2011 through 2015 in the summer of 2016� Results from that experience study will be included in this section in the 2016 CAFR�
Pension plan details can be found in the Plan Statement beginning on page 213�

Summary of Assumptions Actuarial Section
OPERS The Comprehensive Annual Financial Report 2015142
Funding Method
An individual entry-age actuarial cost method of valuation is used in determining benefit liabilities and normal cost under both the funding valuations included in this section and the financial reporting valuation done under GASB 67 included in the Financial Section� Differences between assumed and actual experience (actuarial gains and losses) become part of actuarial accrued liabilities� For funding valuation purposes, unfunded actuarial accrued liabilities are amortized to produce payments (principal and interest), which are a level percent of payroll contributions�
Economic Assumptions
The following economic assumptions were used by the actuary:
• InvestmentReturn—8�00% compounded annually, net of administrative expenses�
• WageInflationRate—3�75% per year� Wage inflation is defined to be the portion of total pay increases for an individual that are due to macroeconomic forces including productivity, price inflation, and labor market conditions� The wage inflation rate does not include pay changes related to individual merit and seniority effects�
• PriceInflation—3�00% of the investment return rate and wage inflation rate is assumed to be price inflation�
• AssumedRealRateofReturn—4�25% per year� The assumed real rate of return is defined as the portion of the 8�00% investment return that is more than the assumed total wage growth rate of 3�75%�
• ActiveMemberPopulation—Consists of the sum of the active members in the Traditional Pension Plan and Combined Plan, and is assumed to remain constant� For purposes of financing the unfunded actuarial accrued liabilities, total payroll is assumed to grow at the wage inflation rate of 3�75% per year�
• IndividualEmployeePayIncreases—An active employee’s pay is assumed to increase each year, in accordance with an age-based table� Part of the assumed increase is for merit and/or seniority increases, and the balance recognizes the wage inflation rate� The following table, on the next page, describes annual increase percentages for sample ages�

The Comprehensive Annual Financial Report 2015 OPERS
Actuarial Section Summary of Assumptions
143
Individual Employee Pay Increases
Age
Merit and Seniority
Wage Inflation
Total Increase Next Year
State LocalPublic Safety Law State Local
Public Safety Law
30 3�00% 3�00% 4�00% 4�00% 3�75% 6�75% 6�75% 7�75% 7�75%
40 1�80 1�80 0�85 0�85 3�75 5�55 5�55 4�60 4�60
50 1�20 1�20 0�50 0�50 3�75 4�95 4�95 4�25 4�25
60 0�70 0�70 0�50 0�50 3�75 4�45 4�45 4�25 4�25
• Turnover—Represents the probabilities of separation from OPERS-covered employment before age-and-service retirement because of employment termination (withdrawal from service), death, or disability� The separation probabilities are based on historical trends of OPERS actual experience, without consideration of the manner in which the members’ accounts are distributed�
Percent Separating Within Next Year–Withdrawal from Employment
Sample Ages
Years of Service
Withdrawal
State Local Public Safety Law Enforcement
Men Women Men Women Men Women Men Women
0 45�00% 45�00% 40�00% 40�00% 19�00% 19�00% 16�00% 16�00%
1 30�00 30�00 26�00 26�00 17�00 17�00 10�00 12�00
2 17�00 18�00 16�00 17�00 10�00 10�00 8�00 8�00
3 12�00 13�00 11�00 13�00 10�00 10�00 6�00 7�00
4 10�00 10�00 10�00 10�00 10�00 10�00 5�00 7�00
30 5 & over 5�16 6�66 5�24 6�54 8�80 8�80 2�66 2�90
40 5 & over 2�82 3�32 2�86 3�52 3�50 3�50 1�48 1�50
50 5 & over 1�90 2�30 2�30 2�60 2�00 2�00 1�20 1�20
60 5 & over 1�90 2�30 2�30 2�60 2�00 2�00 1�20 1�20
Percent Separating Within Next Year–Death or Disability
Sample Ages
Years of Service
Death Disability
All Divisions State LocalPublic Safety & Law
Enforcement
Men Women Men Women Men Women Men Women
25 5 & over 0�03% 0�01% 0�12% 0�12% 0�11% 0�10% 0�21% 0�34%
35 5 & over 0�07 0�03 0�26 0�26 0�23 0�17 0�65 0�88
45 5 & over 0�14 0�06 0�58 0�58 0�50 0�36 1�01 1�60
55 5 & over 0�33 0�17 1�10 1�10 1�08 0�79 2�37 2�92
60 5 & over 0�61 0�34 1�78 1�78 1�24 1�09 3�01 3�44

Summary of Assumptions Actuarial Section
OPERS The Comprehensive Annual Financial Report 2015144
The turnover probabilities in the tables on the previous page estimate the number of active members who will separate from employment based on the criteria of age, gender, and years of service� These members may be eligible for a refund of their account or an annuity benefit depending on the nature of the separation� The method of distribution and the resulting liabilities are calculated for this population based on the following assumptions:
WithdrawalfromService—Assumes that members terminating before age 35, members terminating with less than five years of service, and a percentage of all other members will withdraw their contributions and forfeit their entitlement to an employer-financed benefit� The percentage withdrawing their contributions is 100% at age 35 and is reduced for each year of age after 35, becoming 0% at age 55 (age 45 for Public Safety and Law Enforcement Division members)�
Death-in-serviceandDisabilityBenefits—Assumes that members with at least five years of service will elect to receive an annuity benefit� It is assumed that Combined Plan members will transfer to, and take a benefit from, the Traditional Pension Plan, unless a lump-sum distribution from the Combined Plan would have a greater value�
Asset Valuation Method
For actuarial purposes, and under the Funding Basis, the funding value of defined benefit assets recognizes assumed investment returns fully each year� Differences between actual and assumed investment returns are phased in over a closed four-year period� The funding value is not permitted to deviate from fair value by more than 12%� Both the Traditional Pension Plan and Combined Plan retiree health care funding value of assets are developed independently beginning with the December 31, 2004 valuation�
Valuation Data
The demographic and financial data used in the actuarial valuations were provided to the actuary by the OPERS staff� The actuary examined the data for general reasonableness and year-to-year consistency, but did not audit the information�
Decrement Assumptions
The probabilities used by the actuary related to specific risk areas are displayed in the tables starting on the next page:
• Mortality—The tables used in evaluating age-and-service and survivor benefit allowances to be paid were based on the RP-2000 mortality table projected 20 years using Projection Scale AA� For males, 105% of the Combined Healthy Male Mortality rates were used� For females, 100% of the Combined Healthy Female Mortality rates were used� The mortality rates used in evaluating disability allowances were based upon the RP-2000 mortality table with no projection� For males, 120% of the Disabled Female Mortality rates were used, set forward two years� For females, 100% of the Disabled Female Mortality rates were used�
• Retirement—Probabilities of age-and-service retirement applicable to members eligible to retire are as shown in the schedules on pages 145-149�
Senate Bill (SB) 343 was enacted into law with an effective date of January 7, 2013� In the legislation, members were categorized into three groups with varying provisions of the law applicable to each group� Members who were eligible to retire under law in effect prior to SB 343, or who will be eligible to retire no later than five years after January 7, 2013 comprise transition group A� Members who have 20 years of service credit prior to January 7, 2013 or who will be eligible to retire not later than 10 years after January 7, 2013 are included in transition group B� Group C includes those members who are not in either of the other groups and members who were hired on or after January 7, 2013� See pages 216-218 of the Plan Statement for additional information�
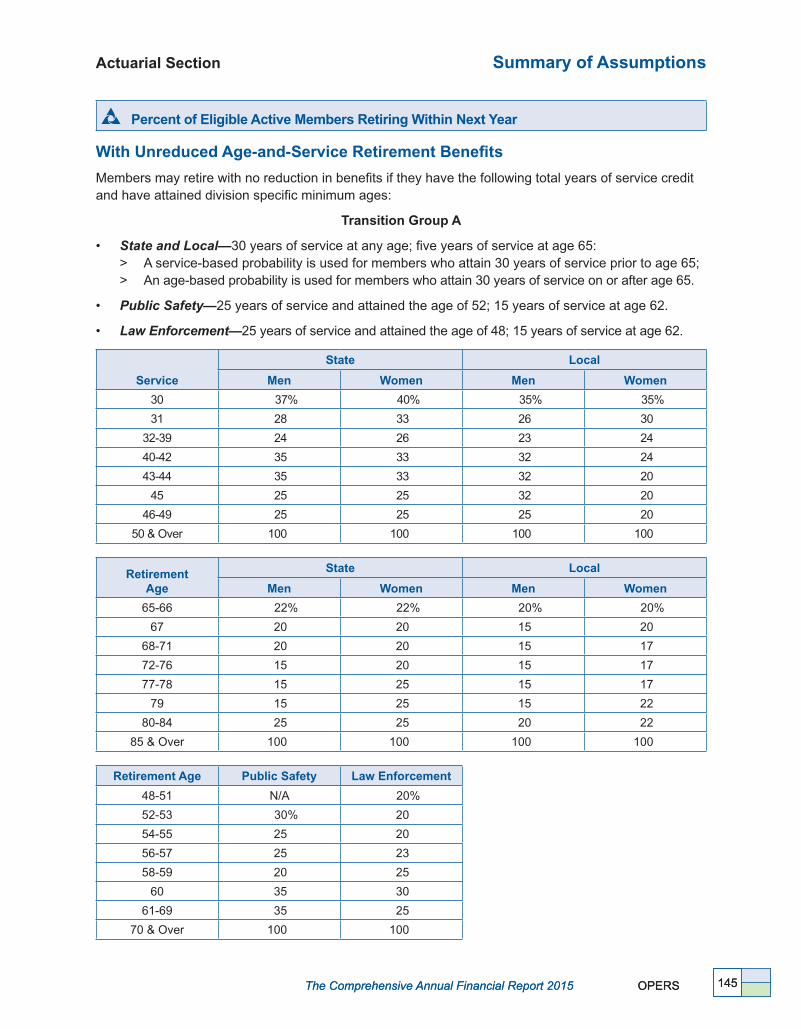
The Comprehensive Annual Financial Report 2015 OPERS
Actuarial Section Summary of Assumptions
145 The Comprehensive Annual Financial Report 2015 OPERS 145
Percent of Eligible Active Members Retiring Within Next Year
With Unreduced Age-and-Service Retirement Benefits
Members may retire with no reduction in benefits if they have the following total years of service credit and have attained division specific minimum ages:
Transition Group A
• StateandLocal—30 years of service at any age; five years of service at age 65: > A service-based probability is used for members who attain 30 years of service prior to age 65; > An age-based probability is used for members who attain 30 years of service on or after age 65�
• PublicSafety—25 years of service and attained the age of 52; 15 years of service at age 62�
• LawEnforcement—25 years of service and attained the age of 48; 15 years of service at age 62�
Service
State Local
Men Women Men Women
30 37% 40% 35% 35%
31 28 33 26 30
32-39 24 26 23 24
40-42 35 33 32 24
43-44 35 33 32 20
45 25 25 32 20
46-49 25 25 25 20
50 & Over 100 100 100 100
RetirementAge
State Local
Men Women Men Women
65-66 22% 22% 20% 20%
67 20 20 15 20
68-71 20 20 15 17
72-76 15 20 15 17
77-78 15 25 15 17
79 15 25 15 22
80-84 25 25 20 22
85 & Over 100 100 100 100
Retirement Age Public Safety Law Enforcement
48-51 N/A 20%
52-53 30% 20
54-55 25 20
56-57 25 23
58-59 20 25
60 35 30
61-69 35 25
70 & Over 100 100

Summary of Assumptions Actuarial Section
OPERS The Comprehensive Annual Financial Report 2015146
Transition Group B
• StateandLocal—31 years of service at age 52; 32 years of service at any age; or five years of service at age 66:
> A service-based probability is used for members who attain 32 years of service at any age; > An age-based probability is used for members who attain 32 years of service on or after age 66�
• PublicSafety—25 years of service and attained the age of 54; 15 years of service and attained the age of 64�
• LawEnforcement—25 years of service and attained the age of 50; 15 years of service and attained the age of 64�
Service
State Local
Men Women Men Women
31 37% 40% 35% 35%
32 28 33 26 30
33-40 24 26 23 24
41-43 35 33 32 24
44-45 35 33 32 20
46 25 25 32 20
47-50 25 25 25 20
51 & Over 100 100 100 100
Retirement Age
State Local
Men Women Men Women
66-67 22% 22% 20% 20%
68 20 20 15 20
69-72 20 20 15 17
73-77 15 20 15 17
78-79 15 25 15 17
80 15 25 15 22
81-84 25 25 20 22
85 & Over 100 100 100 100
Retirement Age Public Safety Law Enforcement
50-53 N/A 20%
54-57 25% 20
58-59 20 23
60-61 35 25
62 35 30
63-69 35 25
70 100 25
71 100 25
72 & Over 100 100
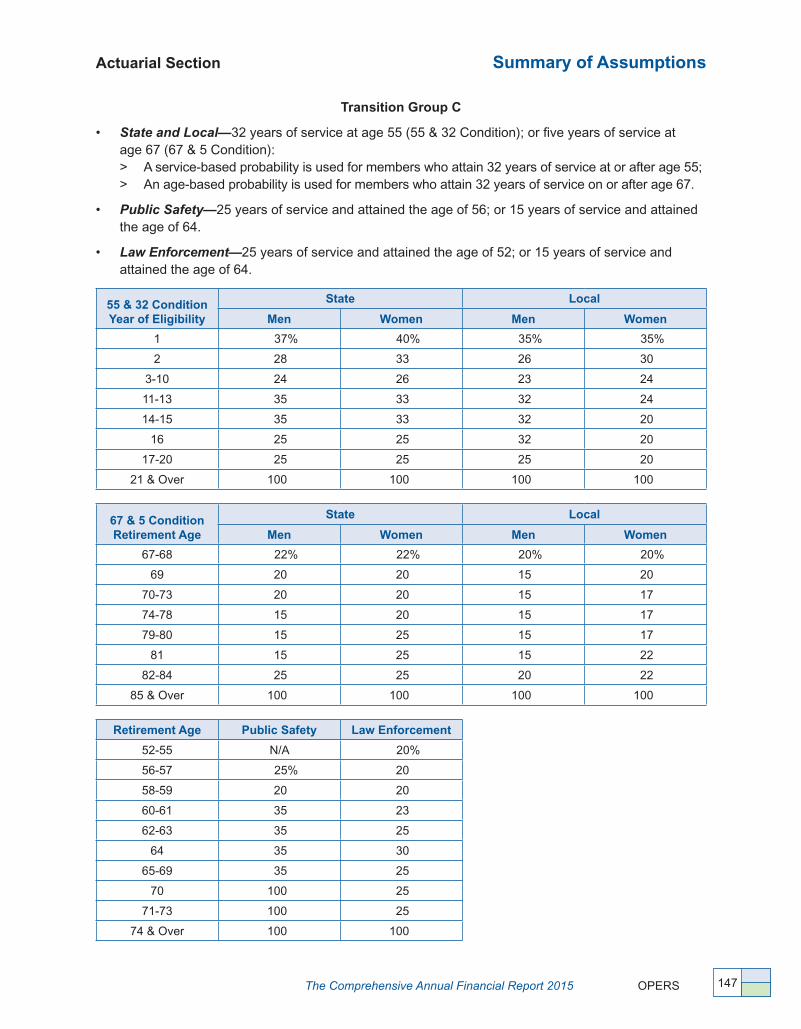
The Comprehensive Annual Financial Report 2015 OPERS
Actuarial Section Summary of Assumptions
147
Transition Group C
• StateandLocal—32 years of service at age 55 (55 & 32 Condition); or five years of service at age 67 (67 & 5 Condition):
> A service-based probability is used for members who attain 32 years of service at or after age 55; > An age-based probability is used for members who attain 32 years of service on or after age 67�
• PublicSafety—25 years of service and attained the age of 56; or 15 years of service and attained the age of 64�
• LawEnforcement—25 years of service and attained the age of 52; or 15 years of service and attained the age of 64�
55 & 32 ConditionYear of Eligibility
State Local
Men Women Men Women
1 37% 40% 35% 35%
2 28 33 26 30
3-10 24 26 23 24
11-13 35 33 32 24
14-15 35 33 32 20
16 25 25 32 20
17-20 25 25 25 20
21 & Over 100 100 100 100
67 & 5 ConditionRetirement Age
State Local
Men Women Men Women
67-68 22% 22% 20% 20%
69 20 20 15 20
70-73 20 20 15 17
74-78 15 20 15 17
79-80 15 25 15 17
81 15 25 15 22
82-84 25 25 20 22
85 & Over 100 100 100 100
Retirement Age Public Safety Law Enforcement
52-55 N/A 20%
56-57 25% 20
58-59 20 20
60-61 35 23
62-63 35 25
64 35 30
65-69 35 25
70 100 25
71-73 100 25
74 & Over 100 100

Summary of Assumptions Actuarial Section
OPERS The Comprehensive Annual Financial Report 2015148
Percent of Eligible Active Members Retiring Within Next Year
With Reduced Age-and-Service Retirement Benefits
Transition Group A
Members in the State and Local divisions who have a minimum of 25 years of total service credit and who have attained the age of 55 and members with five years of service who have attained age 60 may retire with a reduced benefit� Members in the Public Safety and Law Enforcement divisions who have a minimum of 25 years of service and who have attained age 48 and members with 15 years of service and who have attained age 52 may also retire with a reduced benefit�
RetirementAge
State Local PublicSafetyMen Women Men Women
48-51 N/A N/A N/A N/A 8%
52-54 N/A N/A N/A N/A N/A
55-58 10% 10% 9% 11% N/A
59 10 11 9 11 N/A
60 10 12 9 11 N/A
61 10 13 9 12 N/A
62 15 15 13 13 N/A
63 15 15 14 14 N/A
64 15 15 12 15 N/A
Transition Group B
Members in the State and Local divisions who have a minimum of 25 years of total service credit and who have attained the age of 55 and members with five years of service who have attained age 60 may retire with a reduced benefit� Members in the Public Safety and Law Enforcement divisions who have a minimum of 25 years of service and who have attained age 48 and members with 15 years of service and who have attained age 52 may also retire with a reduced benefit�
RetirementAge
State Local PublicSafety
Law EnforcementMen Women Men Women
48-49 N/A N/A N/A N/A 8% 8%
50-53 N/A N/A N/A N/A 8 N/A
54 N/A N/A N/A N/A N/A N/A
55-58 10% 10% 9% 11% N/A N/A
59 10 11 9 11 N/A N/A
60 10 12 9 11 N/A N/A
61 10 13 9 12 N/A N/A
62 15 15 13 13 N/A N/A
63 15 15 14 14 N/A N/A
64-65 15 15 12 15 N/A N/A

The Comprehensive Annual Financial Report 2015 OPERS
Actuarial Section Summary of Assumptions
149
Transition Group C
Members in the State and Local divisions who have a minimum of 25 years of total service credit and who have attained the age of 57 and members with five years of service who have attained age 62 may retire with a reduced benefit� Members in the Public Safety division who have a minimum of 25 years of service and who have attained age 52 and members with 15 years of service who have attained age 56 may retire with a reduced benefit� Members in the Law Enforcement division who have a minimum of 25 years of service and who have attained age 48 and members with 15 years of service who have attained age 56 may also retire with a reduced benefit�
RetirementAge
State Local PublicSafety
Law EnforcementMen Women Men Women
48-51 N/A N/A N/A N/A N/A 8%
52-55 N/A N/A N/A N/A 8% N/A
56 N/A N/A N/A N/A N/A N/A
57-60 10% 10% 9% 11% N/A N/A
61 10 11 9 11 N/A N/A
62 10 12 9 11 N/A N/A
63 10 13 9 12 N/A N/A
64 15 15 13 13 N/A N/A
65 15 15 14 14 N/A N/A
66 15 15 12 15 N/A N/A
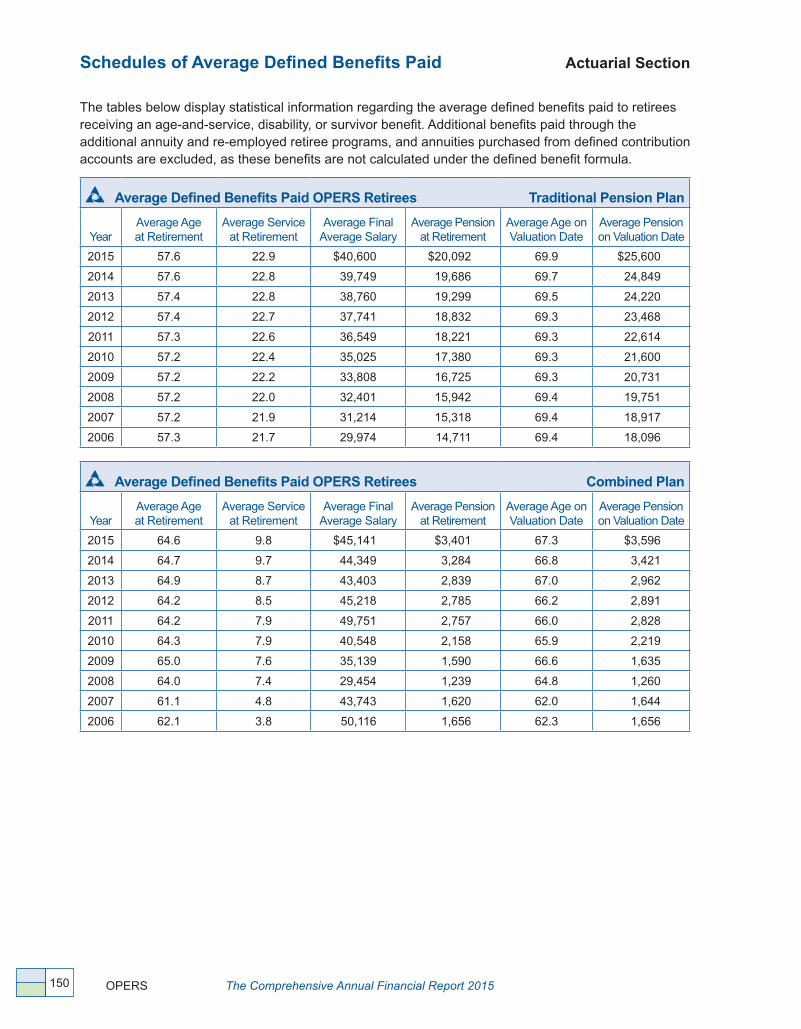
Schedules of Average Defined Benefits Paid Actuarial Section
OPERS The Comprehensive Annual Financial Report 2015150
The tables below display statistical information regarding the average defined benefits paid to retirees receiving an age-and-service, disability, or survivor benefit� Additional benefits paid through the additional annuity and re-employed retiree programs, and annuities purchased from defined contribution accounts are excluded, as these benefits are not calculated under the defined benefit formula�
Average Defined Benefits Paid OPERS Retirees Traditional Pension Plan
YearAverage Age at Retirement
Average Service at Retirement
Average FinalAverage Salary
Average Pension at Retirement
Average Age on Valuation Date
Average Pension on Valuation Date
2015 57�6 22�9 $40,600 $20,092 69�9 $25,600
2014 57�6 22�8 39,749 19,686 69�7 24,849
2013 57�4 22�8 38,760 19,299 69�5 24,220
2012 57�4 22�7 37,741 18,832 69�3 23,468
2011 57�3 22�6 36,549 18,221 69�3 22,614
2010 57�2 22�4 35,025 17,380 69�3 21,600
2009 57�2 22�2 33,808 16,725 69�3 20,731
2008 57�2 22�0 32,401 15,942 69�4 19,751
2007 57�2 21�9 31,214 15,318 69�4 18,917
2006 57�3 21�7 29,974 14,711 69�4 18,096
Average Defined Benefits Paid OPERS Retirees Combined Plan
YearAverage Ageat Retirement
Average Serviceat Retirement
Average FinalAverage Salary
Average Pension at Retirement
Average Age on Valuation Date
Average Pension on Valuation Date
2015 64�6 9�8 $45,141 $3,401 67�3 $3,596
2014 64�7 9�7 44,349 3,284 66�8 3,421
2013 64�9 8�7 43,403 2,839 67�0 2,962
2012 64�2 8�5 45,218 2,785 66�2 2,891
2011 64�2 7�9 49,751 2,757 66�0 2,828
2010 64�3 7�9 40,548 2,158 65�9 2,219
2009 65�0 7�6 35,139 1,590 66�6 1,635
2008 64�0 7�4 29,454 1,239 64�8 1,260
2007 61�1 4�8 43,743 1,620 62�0 1,644
2006 62�1 3�8 50,116 1,656 62�3 1,656

Actuarial Section Actuarial Valuation Data
The Comprehensive Annual Financial Report 2015 OPERS 151 The Comprehensive Annual Financial Report 2015 OPERS 151
The following tables display the actuarial valuation data for the active and retired members of the Traditional Pension Plan, and the defined benefit component of the Combined Plan:
Actuarial Valuation Data Traditional Pension Plan
ValuationYear
ParticipatingEmployers**
Employer Units**
Active Members Retired Lives
Number
AnnualPayroll
($ millions)Average
Pay
PercentIncrease in
Average Pay Number*
Annual Allowance($ millions)
AverageAllowance
2015 3,247 3,683 321,383 $12,321 $38,337 1�78% 210,792 $5,296 $25,124
2014 3,251 3,692 322,318 12,140 37,665 2�06 208,395 5,085 24,401
2013 3,260 3,718 325,181 12,000 36,903 1�29 201,841 4,803 23,796
2012 3,264 3,702 326,227 11,885 36,432 (1�08) 195,622 4,523 23,121
2011 3,248 3,695 328,640 12,103 36,828 1�27 189,753 4,232 22,303
2010 3,245 3,699 334,507 12,165 36,367 1�15 181,433 3,868 21,319
2009 3,264 3,714 341,777 12,290 35,953 0�29 174,637 3,576 20,477
2008 3,275 3,724 349,969 12,546 35,849 3�87 169,000 3,300 19,525
2007 3,270 3,714 357,743 12,347 34,514 2�76 163,505 3,063 18,731
2006 3,263 3,707 356,430 11,971 33,586 2�12 159,039 2,852 17,934
* The number of Retired Lives represents an individual count of retirees and beneficiaries� ** The number of employer units exceeds the number of reporting or participating employers as some employers report multiple divisions or agencies�
The employer unit count also includes private-sector employers that have assumed privatized functions from public employers for indeterminate periods� The number of participating employers is included to comply with GASB 67 requirements for presentation of a primary government and its component units as one employer�
Actuarial Valuation Data Combined Plan
ValuationYear
ParticipatingEmployers**
Employer Units**
Active Members Retired Lives
Number
AnnualPayroll
($ millions)Average
Pay
PercentIncrease in
Average Pay Number*
Annual Allowance($ millions)
AverageAllowance
2015 3,247 3,683 7,626 $367 $48,125 3�69% 196 $1 $3,596
2014 3,251 3,692 7,455 346 46,412 1�50 158 1 3,421
2013 3,260 3,718 7,239 331 45,725 2�82 100 0 2,962
2012 3,264 3,702 6,948 309 44,473 0�88 57 0 2,891
2011 3,248 3,695 6,714 296 44,087 3�13 36 0 2,828
2010 3,245 3,699 6,667 284 42,748 4�56 20 0 2,219
2009 3,264 3,714 6,335 258 40,884 2�91 8 0 1,635
2008 3,275 3,724 6,419 255 39,726 6�60 7 0 1,260
2007 3,270 3,714 6,333 236 37,265 4�12 2 0 1,693
2006 3,263 3,707 5,700 205 35,789 4�82 1 0 1,505
* The number of Retired Lives represents an individual count of retirees and beneficiaries receiving an age-and-service benefit� Plan inception January 1, 2003; first eligible retiree in 2006�
** The number of employer units exceeds the number of reporting or participating employers as some employers report multiple divisions or agencies� The employer unit count also includes private-sector employers that have assumed privatized functions from public employers for indeterminate periods� The number of participating employers is included to comply with GASB 67 requirements for presentation of a primary government and its component units as one employer�
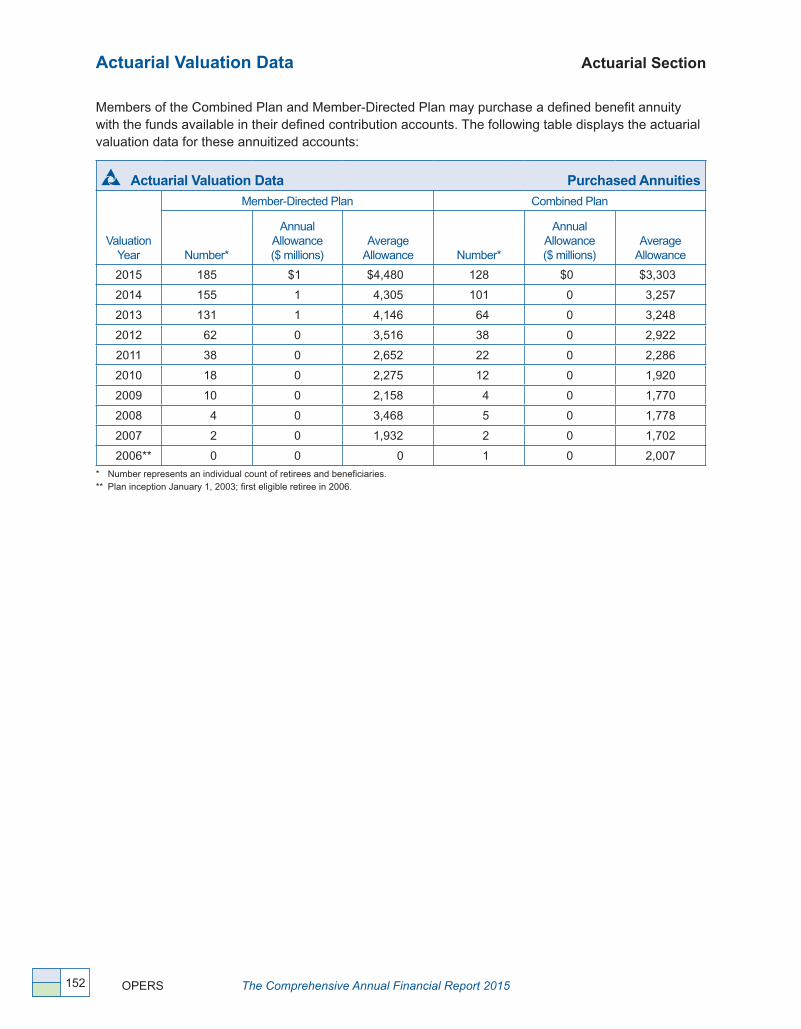
Actuarial Valuation Data Actuarial Section
OPERS The Comprehensive Annual Financial Report 2015152
Members of the Combined Plan and Member-Directed Plan may purchase a defined benefit annuity with the funds available in their defined contribution accounts� The following table displays the actuarial valuation data for these annuitized accounts:
Actuarial Valuation Data Purchased Annuities
ValuationYear
Member-Directed Plan Combined Plan
Number*
AnnualAllowance($ millions)
AverageAllowance Number*
AnnualAllowance($ millions)
AverageAllowance
2015 185 $1 $4,480 128 $0 $3,303
2014 155 1 4,305 101 0 3,257
2013 131 1 4,146 64 0 3,248
2012 62 0 3,516 38 0 2,922
2011 38 0 2,652 22 0 2,286
2010 18 0 2,275 12 0 1,920
2009 10 0 2,158 4 0 1,770
2008 4 0 3,468 5 0 1,778
2007 2 0 1,932 2 0 1,702
2006** 0 0 0 1 0 2,007
* Number represents an individual count of retirees and beneficiaries� ** Plan inception January 1, 2003; first eligible retiree in 2006�
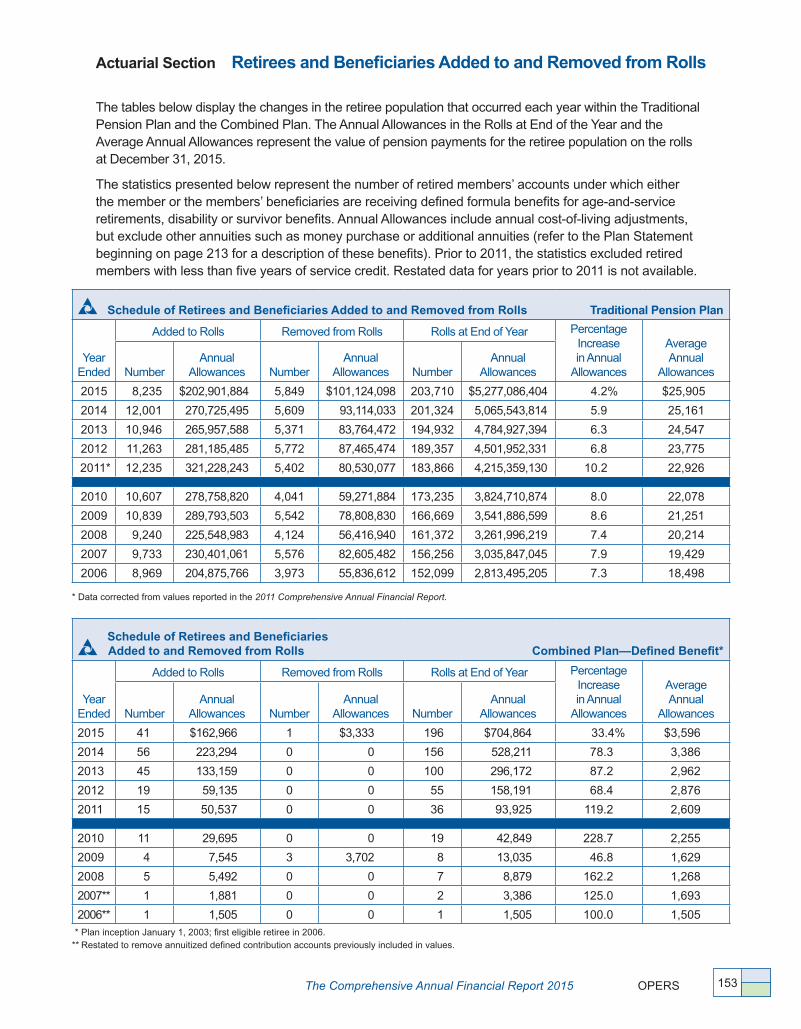
Actuarial Section Retirees and Beneficiaries Added to and Removed from Rolls
The Comprehensive Annual Financial Report 2015 OPERS 153
The tables below display the changes in the retiree population that occurred each year within the Traditional Pension Plan and the Combined Plan� The Annual Allowances in the Rolls at End of the Year and the Average Annual Allowances represent the value of pension payments for the retiree population on the rolls at December 31, 2015�
The statistics presented below represent the number of retired members’ accounts under which either the member or the members’ beneficiaries are receiving defined formula benefits for age-and-service retirements, disability or survivor benefits� Annual Allowances include annual cost-of-living adjustments, but exclude other annuities such as money purchase or additional annuities (refer to the Plan Statement beginning on page 213 for a description of these benefits)� Prior to 2011, the statistics excluded retired members with less than five years of service credit� Restated data for years prior to 2011 is not available�
Schedule of Retirees and Beneficiaries Added to and Removed from Rolls Traditional Pension Plan
Year Ended
Added to Rolls Removed from Rolls Rolls at End of Year PercentageIncreasein Annual
Allowances
AverageAnnual
AllowancesNumberAnnual
Allowances NumberAnnual
Allowances NumberAnnual
Allowances
2015 8,235 $202,901,884 5,849 $101,124,098 203,710 $5,277,086,404 4�2% $25,905
2014 12,001 270,725,495 5,609 93,114,033 201,324 5,065,543,814 5�9 25,161
2013 10,946 265,957,588 5,371 83,764,472 194,932 4,784,927,394 6�3 24,547
2012 11,263 281,185,485 5,772 87,465,474 189,357 4,501,952,331 6�8 23,775
2011* 12,235 321,228,243 5,402 80,530,077 183,866 4,215,359,130 10�2 22,926
2010 10,607 278,758,820 4,041 59,271,884 173,235 3,824,710,874 8�0 22,078
2009 10,839 289,793,503 5,542 78,808,830 166,669 3,541,886,599 8�6 21,251
2008 9,240 225,548,983 4,124 56,416,940 161,372 3,261,996,219 7�4 20,214
2007 9,733 230,401,061 5,576 82,605,482 156,256 3,035,847,045 7�9 19,429
2006 8,969 204,875,766 3,973 55,836,612 152,099 2,813,495,205 7�3 18,498
* Data corrected from values reported in the 2011 Comprehensive Annual Financial Report.
Schedule of Retirees and Beneficiaries Added to and Removed from Rolls Combined Plan—Defined Benefit*
Year Ended
Added to Rolls Removed from Rolls Rolls at End of Year PercentageIncreasein Annual
Allowances
AverageAnnual
AllowancesNumberAnnual
Allowances NumberAnnual
Allowances NumberAnnual
Allowances
2015 41 $162,966 1 $3,333 196 $704,864 33�4% $3,596
2014 56 223,294 0 0 156 528,211 78�3 3,386
2013 45 133,159 0 0 100 296,172 87�2 2,962
2012 19 59,135 0 0 55 158,191 68�4 2,876
2011 15 50,537 0 0 36 93,925 119�2 2,609
2010 11 29,695 0 0 19 42,849 228�7 2,255
2009 4 7,545 3 3,702 8 13,035 46�8 1,629
2008 5 5,492 0 0 7 8,879 162�2 1,268
2007** 1 1,881 0 0 2 3,386 125�0 1,693
2006** 1 1,505 0 0 1 1,505 100�0 1,505 * Plan inception January 1, 2003; first eligible retiree in 2006� ** Restated to remove annuitized defined contribution accounts previously included in values�

Schedules of Funding Progress Actuarial Section
The Schedules of Funding Progress below include the Traditional Pension Plan, the defined benefit component of the Combined Plan and the actuarial impact of the annuitized defined contribution accounts for the Combined Plan and Member-Directed Plan� Members in the Combined Plan and Member-Directed Plan have the option of converting their defined contribution accounts to a defined benefit annuity at retirement� Separate schedules are displayed for each plan reflecting the funding status of the plans on a valuation basis� Separate schedules are included in the Required Supplementary Information of the Financial Section disclosing the 10-year schedule of actuarially determined and actual contributions paid�
Schedule of Funding Progress* ($ in millions) All Pension Plans
Valuation Year
ActuarialAccrued
Liabilities (AAL)ValuationAssets
UnfundedActuarial AccruedLiabilities (UAAL)
Ratio ofAssetsto AAL
ActiveMemberPayroll
UAAL as Percent ofActive Member
Payroll
2015 $91,832 $78,061 $13,771 85% $13,177 105%
2014 89,285 74,865 14,420 84 12,933 111
2013 86,645 71,411 15,234 82 12,331 124
2012 83,878 67,855 16,023 81 12,194 131
2011 84,530 65,436 19,094 77 12,399 154
2010*** 80,485 63,649 16,836 79 12,449 135
2010** 79,630 60,600 19,030 76 12,449 153
2009 76,555 57,629 18,926 75 12,548 151
2008 73,466 55,315 18,151 75 12,801 142
2007 69,734 67,151 2,583 96 12,583 21
2006 66,161 61,296 4,865 93 12,175 40
Schedule of Funding Progress* ($ in millions) Traditional Pension Plan
Valuation Year
ActuarialAccrued
Liabilities (AAL)ValuationAssets
UnfundedActuarial AccruedLiabilities (UAAL)
Ratio ofAssetsto AAL
ActiveMemberPayroll
UAAL as Percent ofActive Member
Payroll
2015 $91,535 $77,700 $13,835 85% $12,321 112%
2014 89,017 74,567 14,450 84 12,140 119
2013 86,407 71,175 15,232 82 12,000 127
2012 83,664 67,670 15,994 81 11,885 135
2011 84,325 65,274 19,051 77 12,103 157
2010*** 80,307 63,515 16,792 79 12,165 138
2010** 79,459 60,461 18,998 76 12,165 156
2009 76,407 57,519 18,888 75 12,290 154
2008 73,346 55,230 18,116 75 12,546 144
2007 69,639 67,067 2,572 96 12,347 21
2006 66,089 61,235 4,854 93 11,971 41
* The amounts reported on this schedule do not include assets or liabilities for health care� ** Results from original valuation prior to re-statement after completion of experience study�*** Revised actuarial assumptions based on experience study�
OPERS The Comprehensive Annual Financial Report 2015154

Actuarial Section Schedules of Funding Progress
The Combined Plan is a retirement plan with both a defined benefit and a defined contribution component� At retirement, members have the option to convert their defined contribution account to a defined benefit annuity� The schedule below includes the funding status for both defined formula benefits and the purchased annuities, when applicable�
Schedule of Funding Progress* ($ in millions) Combined Plan
Valuation Year
ActuarialAccrued
Liabilities (AAL)ValuationAssets
UnfundedActuarial AccruedLiabilities/(Assets)
(UAAL)
Ratio ofAssetsto AAL
ActiveMemberPayroll
UAAL as Percent ofActive Member
Payroll
2015 $288 $350 ($62) 122% $367 0%
2014 260 289 (29) 111 346 0
2013 230 229 1 100 331 0
2012 212 183 29 86 309 9
2011 203 161 42 79 296 14
2010*** 177 134 43 76 284 15
2010** 171 138 33 81 284 12
2009 148 110 38 74 258 15
2008 120 85 35 71 255 14
2007 95 84 11 88 236 5
2006 72 61 11 85 205 5
* The amounts reported on this schedule do not include assets or liabilities for health care� ** Results from original valuation prior to re-statement after completion of experience study� *** Revised actuarial assumptions based on experience study�
The Member-Directed Plan is a defined contribution plan� At retirement, members have the option to convert their defined contribution account to a defined benefit annuity� The schedule below displays the funding status of the purchased defined benefit annuities�
Schedule of Funding Progress* ($ in thousands) Member-Directed Annuities#
Valuation Year
ActuarialAccrued
Liabilities (AAL)ValuationAssets
UnfundedActuarial AccruedLiabilities/(Assets)
(UAAL)
Ratio ofAssetsto AAL
ActiveMemberPayroll
UAAL as Percent ofActive Member
Payroll
2015 $9,767 $10,622 ($855) 109% N/A N/A
2014 8,291 8,772 (481) 106 N/A N/A
2013 6,884 6,826 58 99 N/A N/A
2012 2,666 2,524 142 95 N/A N/A
2011 1,173 1,156 17 99 N/A N/A
2010*** 496 454 42 92 N/A N/A
2010** 490 439 51 90 N/A N/A
2009 253 206 47 81 N/A N/A
2008 166 148 18 89 N/A N/A
* Participants in the Member-Directed Plan do not have access to health care under the Traditional Pension Plan or Combined Plan� Instead, a portion of the employer contributions are deposited into a retiree medical account (RMA) funded through the Voluntary Employees’ Beneficiary Association (VEBA) Trust� The RMA can reimburse qualified medical expenses when a Member-Directed Plan participant terminates service or retires�
** Results from original valuation prior to re-statement after completion of experience study� *** Revised actuarial assumptions based on experience study� # Plan inception January 1, 2003� Actuarial data for annuitized accounts is not available prior to 2008�
The Comprehensive Annual Financial Report 2015 OPERS 155

Short-Term Solvency Test Actuarial Section
OPERS The Comprehensive Annual Financial Report 2015156
The OPERS funding objective is to pay for retirement benefits through contributions that remain approximately level from year to year as a percent of member payroll� If the contributions to the System are level in concept and soundly executed, the System will pay all promised benefits when due–the ultimate test of financial soundness�
A short-term solvency test is one means of checking a plan’s progress under its funding program� In a short-term solvency test, the plan’s present assets (cash and investments) are compared to: 1) active and inactive member contributions on deposit; 2) the liabilities for future benefits payable to present retired lives; and 3) the liabilities for service already rendered by active/inactive members�
In a plan that has been following the discipline of level percent of payroll financing, the liabilities for member contributions on deposit (Columns (1)) and the liabilities for future benefits payable to present retired lives (Columns (2)) will be fully covered by existing assets (except in rare circumstances)� In addition, the liabilities for service already rendered by active/inactive members (Columns (3)) will be partially covered by the remaining value of actuarial assets at year end� Generally, if the plan has been using level cost financing, the funded portion of (Columns (3)) will increase over time� Columns (3) are rarely fully funded�
The following tables display the results of the Short-Term Solvency Test for asset values in the defined benefit Traditional Pension Plan and Combined Plan, based on the actuarial value of assets at year end�
Accrued Pension Liabilities ($ in millions) Traditional Pension Plan
ValuationYear
Aggregate Accrued Liabilities for
Valuation Assets*
Portions of Accrued Liabilities Covered by Reported Assets
(1) Active
MemberContributions
(2) Retirees
and Beneficiaries
(3) Active/Inactive
Members(Employer-Financed Portion) (1) (2) (3)
2015 $13,469 $56,815 $21,250 $77,700 100% 100% 35%
2014 13,191 55,102 20,724 74,567 100 100 30
2013 12,826 52,404 21,177 71,175 100 100 28
2012 12,640 49,667 21,357 67,670 100 100 25
2011 12,299 46,588 25,439 65,274 100 100 25
2010*** 12,134 42,362 25,811 63,515 100 100 35
2010** 12,134 41,715 25,609 60,461 100 100 26
2009 11,933 38,577 25,897 57,519 100 100 27
2008 11,546 35,485 26,315 55,230 100 100 31
2007 10,785 32,923 25,930 67,067 100 100 90
2006 10,374 30,636 25,078 61,235 100 100 81
* Does not include assets set aside for health care� ** Results from original valuation prior to completion of experience study� *** Results restated based on experience study�

Actuarial Section Short-Term Solvency Test
The Comprehensive Annual Financial Report 2015 OPERS 157
Accrued Pension Liabilities ($ in millions) Combined Plan
ValuationYear
Aggregate Accrued Liabilities for
Valuation Assets*
Portions of Accrued Liabilities Covered by Reported Assets
(1) Active
MemberContributions
(2) Retirees
and Beneficiaries
(3) Active/Inactive
Members(Employer-Financed Portion) (1) (2) (3)
2015 $3 $13 $272 $350 100% 100% 123%
2014 3 10 246 289 100 100 112
2013 2 6 223 229 100 100 100
2012 2 3 207 183 100 100 86
2011 1 2 200 161 100 100 79
2010*** 1 1 175 134 100 100 75
2010** 1 1 169 138 100 100 80
2009 1 0 147 110 100 100 74
2008 1 0 119 85 100 100 71
2007 0 0 95 84 100 100 89
2006 N/A 0 72 61 N/A 100 85
* Does not include assets set aside for health care� ** Results from original valuation prior to completion of experience study� *** Results restated based on experience study�
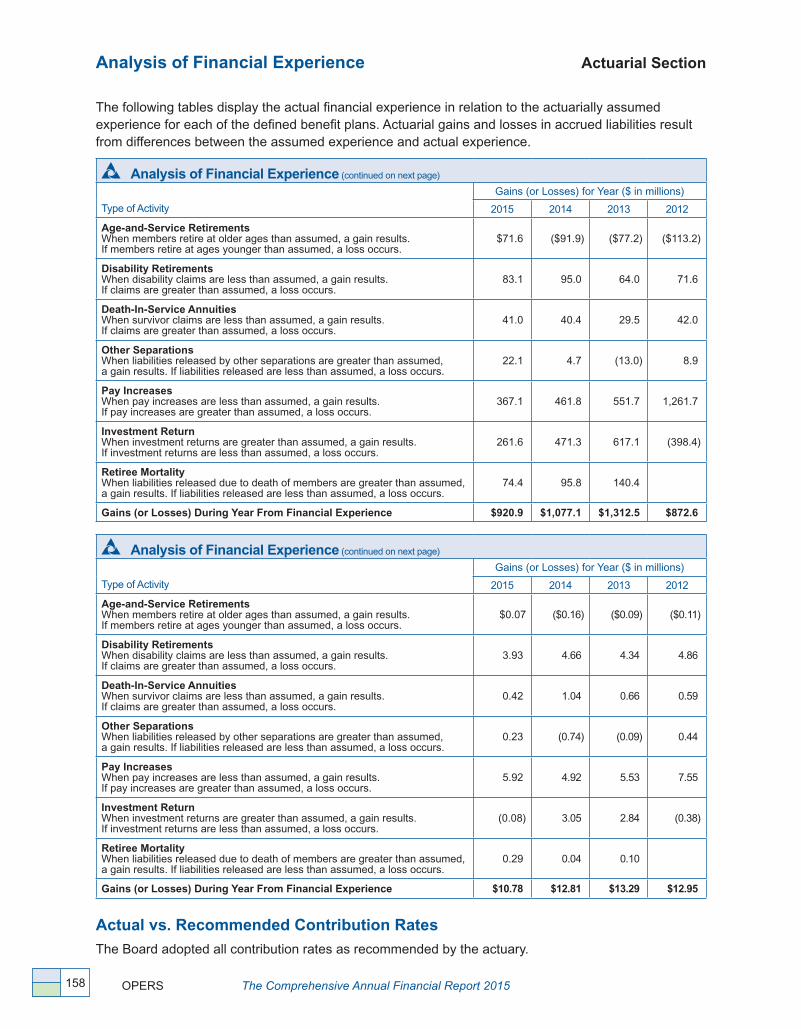
Analysis of Financial Experience Actuarial Section
OPERS The Comprehensive Annual Financial Report 2015158
The following tables display the actual financial experience in relation to the actuarially assumed experience for each of the defined benefit plans� Actuarial gains and losses in accrued liabilities result from differences between the assumed experience and actual experience�
Analysis of Financial Experience (continued on next page) Traditional Pension Plan
Type of Activity
Gains (or Losses) for Year ($ in millions) Gains (or Losses) for Year ($ in millions)
2015 2014 2013 2012 2011 2010 2009 2008 2007 2006
Age-and-Service RetirementsWhen members retire at older ages than assumed, a gain results�If members retire at ages younger than assumed, a loss occurs�
$71�6 ($91�9) ($77�2) ($113�2) ($179�0) ($20�5) ($27�5) $10�1 ($30�6) ($32�1)
Disability RetirementsWhen disability claims are less than assumed, a gain results�If claims are greater than assumed, a loss occurs�
83�1 95�0 64�0 71�6 88�1 59�2 74�0 39�1 36�7 3�0
Death-In-Service AnnuitiesWhen survivor claims are less than assumed, a gain results�If claims are greater than assumed, a loss occurs�
41�0 40�4 29�5 42�0 36�1 32�0 34�6 31�7 29�5 14�3
Other SeparationsWhen liabilities released by other separations are greater than assumed, a gain results� If liabilities released are less than assumed, a loss occurs�
22�1 4�7 (13�0) 8�9 15�9 99�8 (58�9) (27�9) (129�0) (134�4)
Pay IncreasesWhen pay increases are less than assumed, a gain results�If pay increases are greater than assumed, a loss occurs�
367�1 461�8 551�7 1,261�7 359�5 773�7 1,141�8 220�2 202�4 373�3
Investment ReturnWhen investment returns are greater than assumed, a gain results� If investment returns are less than assumed, a loss occurs�
261�6 471�3 617�1 (398�4) (1,193�8) 153�5 (620�5) (15,813�5) 1,979�3 3,332�2
Retiree MortalityWhen liabilities released due to death of members are greater than assumed, a gain results� If liabilities released are less than assumed, a loss occurs�
74�4 95�8 140�4
Gains (or Losses) During Year From Financial Experience $920.9 $1,077.1 $1,312.5 $872.6 ($873.2) $1,097.7 $543.5 ($15,540.3) $2,088.3 $3,556.3
Analysis of Financial Experience (continued on next page) Combined Plan
Type of Activity
Gains (or Losses) for Year ($ in millions) Gains (or Losses) for Year ($ in millions)
2015 2014 2013 2012 2011 2010 2009 2008 2007 2006
Age-and-Service RetirementsWhen members retire at older ages than assumed, a gain results�If members retire at ages younger than assumed, a loss occurs�
$0�07 ($0�16) ($0�09) ($0�11) ($0�09) ($0�12) ($0�12) ($0�06) ($0�03) ($0�01)
Disability RetirementsWhen disability claims are less than assumed, a gain results�If claims are greater than assumed, a loss occurs�
3�93 4�66 4�34 4�86 4�52 2�78 2�07 1�94 1�12 0�89
Death-In-Service AnnuitiesWhen survivor claims are less than assumed, a gain results�If claims are greater than assumed, a loss occurs�
0�42 1�04 0�66 0�59 (0�02) 0�04 0�53 0�05 0�21 0�14
Other SeparationsWhen liabilities released by other separations are greater than assumed, a gain results� If liabilities released are less than assumed, a loss occurs�
0�23 (0�74) (0�09) 0�44 0�55 (1�67) 7�56 1�98 1�08 (3�15)
Pay IncreasesWhen pay increases are less than assumed, a gain results�If pay increases are greater than assumed, a loss occurs�
5�92 4�92 5�53 7�55 3�00 2�29 (3�35) (0�21) 0�22 0�15
Investment ReturnWhen investment returns are greater than assumed, a gain results� If investment returns are less than assumed, a loss occurs�
(0�08) 3�05 2�84 (0�38) (2�69) (3�44) (3�25) (23�83) (0�10) (0�09)
Retiree MortalityWhen liabilities released due to death of members are greater than assumed, a gain results� If liabilities released are less than assumed, a loss occurs�
0�29 0�04 0�10
Gains (or Losses) During Year From Financial Experience $10.78 $12.81 $13.29 $12.95 $5.27 ($0.12) $3.44 ($20.13) $2.50 ($2.07)
Actual vs. Recommended Contribution Rates
The Board adopted all contribution rates as recommended by the actuary�
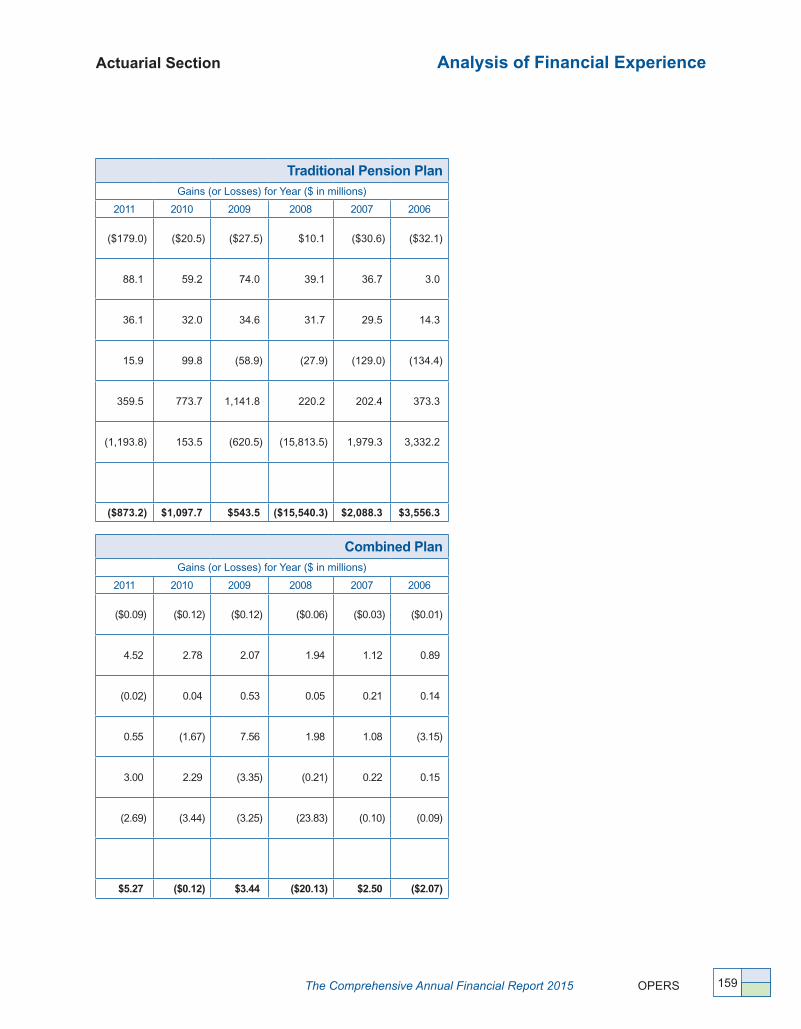
Actuarial Section Analysis of Financial Experience
The Comprehensive Annual Financial Report 2015 OPERS 159
The following tables display the actual financial experience in relation to the actuarially assumed experience for each of the defined benefit plans� Actuarial gains and losses in accrued liabilities result from differences between the assumed experience and actual experience�
Analysis of Financial Experience (continued on next page) Traditional Pension Plan
Type of Activity
Gains (or Losses) for Year ($ in millions) Gains (or Losses) for Year ($ in millions)
2015 2014 2013 2012 2011 2010 2009 2008 2007 2006
Age-and-Service RetirementsWhen members retire at older ages than assumed, a gain results�If members retire at ages younger than assumed, a loss occurs�
$71�6 ($91�9) ($77�2) ($113�2) ($179�0) ($20�5) ($27�5) $10�1 ($30�6) ($32�1)
Disability RetirementsWhen disability claims are less than assumed, a gain results�If claims are greater than assumed, a loss occurs�
83�1 95�0 64�0 71�6 88�1 59�2 74�0 39�1 36�7 3�0
Death-In-Service AnnuitiesWhen survivor claims are less than assumed, a gain results�If claims are greater than assumed, a loss occurs�
41�0 40�4 29�5 42�0 36�1 32�0 34�6 31�7 29�5 14�3
Other SeparationsWhen liabilities released by other separations are greater than assumed, a gain results� If liabilities released are less than assumed, a loss occurs�
22�1 4�7 (13�0) 8�9 15�9 99�8 (58�9) (27�9) (129�0) (134�4)
Pay IncreasesWhen pay increases are less than assumed, a gain results�If pay increases are greater than assumed, a loss occurs�
367�1 461�8 551�7 1,261�7 359�5 773�7 1,141�8 220�2 202�4 373�3
Investment ReturnWhen investment returns are greater than assumed, a gain results� If investment returns are less than assumed, a loss occurs�
261�6 471�3 617�1 (398�4) (1,193�8) 153�5 (620�5) (15,813�5) 1,979�3 3,332�2
Retiree MortalityWhen liabilities released due to death of members are greater than assumed, a gain results� If liabilities released are less than assumed, a loss occurs�
74�4 95�8 140�4
Gains (or Losses) During Year From Financial Experience $920.9 $1,077.1 $1,312.5 $872.6 ($873.2) $1,097.7 $543.5 ($15,540.3) $2,088.3 $3,556.3
Analysis of Financial Experience (continued on next page) Combined Plan
Type of Activity
Gains (or Losses) for Year ($ in millions) Gains (or Losses) for Year ($ in millions)
2015 2014 2013 2012 2011 2010 2009 2008 2007 2006
Age-and-Service RetirementsWhen members retire at older ages than assumed, a gain results�If members retire at ages younger than assumed, a loss occurs�
$0�07 ($0�16) ($0�09) ($0�11) ($0�09) ($0�12) ($0�12) ($0�06) ($0�03) ($0�01)
Disability RetirementsWhen disability claims are less than assumed, a gain results�If claims are greater than assumed, a loss occurs�
3�93 4�66 4�34 4�86 4�52 2�78 2�07 1�94 1�12 0�89
Death-In-Service AnnuitiesWhen survivor claims are less than assumed, a gain results�If claims are greater than assumed, a loss occurs�
0�42 1�04 0�66 0�59 (0�02) 0�04 0�53 0�05 0�21 0�14
Other SeparationsWhen liabilities released by other separations are greater than assumed, a gain results� If liabilities released are less than assumed, a loss occurs�
0�23 (0�74) (0�09) 0�44 0�55 (1�67) 7�56 1�98 1�08 (3�15)
Pay IncreasesWhen pay increases are less than assumed, a gain results�If pay increases are greater than assumed, a loss occurs�
5�92 4�92 5�53 7�55 3�00 2�29 (3�35) (0�21) 0�22 0�15
Investment ReturnWhen investment returns are greater than assumed, a gain results� If investment returns are less than assumed, a loss occurs�
(0�08) 3�05 2�84 (0�38) (2�69) (3�44) (3�25) (23�83) (0�10) (0�09)
Retiree MortalityWhen liabilities released due to death of members are greater than assumed, a gain results� If liabilities released are less than assumed, a loss occurs�
0�29 0�04 0�10
Gains (or Losses) During Year From Financial Experience $10.78 $12.81 $13.29 $12.95 $5.27 ($0.12) $3.44 ($20.13) $2.50 ($2.07)
Actual vs. Recommended Contribution Rates
The Board adopted all contribution rates as recommended by the actuary�

Plan Statement
OPERS The Comprehensive Annual Financial Report 2015160
This page intentionally left blank

When OPERS opened for business, the cost of bread was eight cents, a postage stamp was three cents and a pound of coffee was 25 cents� The average home cost about $4,000 and the American public first met Mickey Mouse� Today, 80 years later, the cost of items is very different� Yet, the promise OPERS made in 1935 when it opened remains—the promise of providing a secure retirement for our members� We’ve been able to deliver on that promise because we worked to anticipate change and adapt to those changes�
Each generation of OPERS staff and management works to balance the need for change with the need to continually strengthen the System� Change is never entered into lightly, but only after significant analysis of benefits and impact� That said, change is necessary to ensure current and future generations of retirees receive the benefits worked for throughout their working careers�
Note: This section is unaudited.
StatisticalSection
“ The measure of intelligence is the ability to change.”
Albert Einstein, physicist, mathematician

Overview Statistical Section (unaudited)
OPERS The Comprehensive Annual Financial Report 2015162
The Statistical Section provides pertinent information to assist readers when viewing the Financial Statements, Notes to the Financial Statements and Required Supplementary Information to help in understanding and assessing the System’s overall financial condition� The information reported here is in compliance with Governmental Accounting Standards Board (GASB) Statement No� 44, Economic Condition Reporting: The Statistical Section� This statement establishes standardized reporting requirements for the supplementary information provided in this section�
The schedules and graphs beginning on the next page show financial trend information about the growth of assets for the past 10 years (where available)� These schedules provide detailed information about the trends of key sources of additions and deductions to the System’s assets and assist in providing a context framing how the OPERS financial position has changed over time� The financial trend schedules presented are:
• Net Position by Plan,• Statutory Fund Balance by Plan,• Fiduciary Net Position by Year,• Changes in Fiduciary Net Position,• Additions by Source,• Deductions by Type,• Benefits by Type, and• Refunds by Type�
The schedules on pages 190-191 compare the pension assets accumulated to cover the projected pension liabilities that are ultimately due at retirement for each of the defined benefit plans and the corresponding funded ratio under both the accounting basis (GASB Statement No� 67) and the funding basis� The schedule on page 192 displays similar information for health care assets and projected liabilities� The Health Care Solvency schedule shows the estimated number of years for which assets are available to cover the projected liabilities� The overall objective is to maintain a funding level that will meet all future health care obligations� Refer to the schedules of pension and health care assets vs� liabilities�
The schedules beginning on page 188 show demographic and economic information and operating information� The demographic and economic information is designed to assist in understanding the environment in which OPERS operates� The operating information is intended to provide contextual information about operations to assist in assessing the System’s economic condition� The demographic and economic information, and the operating information presented includes:
• Number of Refund Payments by Plan,• Pension Assets vs� Pension Liabilities,• Health Care Assets vs� Liabilities,• Number of Retirees/Benefit Recipients by Category,• Number of Covered Lives by Category,• Schedule of Retirees by Benefit Type and Amount,• Number of New Pension Retirees,• Schedule of Average Benefits (Traditional Pension Plan and Combined Plan),• Members Count by Plan,• 2015 Pension Benefits by Ohio County,• Retirees by Geographic Location,• Contribution Rates,• Number of Employer Units, and• Principal Participating Employers�
All non-accounting data is derived from OPERS internal sources�

The Comprehensive Annual Financial Report 2015 OPERS
Statistical Section
163
Statistical Section
Net Position by Plan (last 10 fiscal years)
Year Traditional
Pension Plan Combined Plan Member-
Directed Plan 401(h) Health
Care Trust115 Health
Care Trust**
Voluntary Employees’ Beneficiary Association
Trust Total Net Position
2015 $74,213,320,352 $700,914,409 $698,540,030 $10,671,068,181 $841,112,040 $166,446,806 $87,291,401,818
2014 76,956,230,642 650,249,727 635,272,613 12,440,522,790 386,080,172 175,539,164 91,243,895,108
2013 74,618,532,269 559,612,889 547,022,037 13,111,684,807 153,084,296 88,989,936,298
2012 67,668,091,799 420,197,546 410,662,967 12,828,625,322 119,615,875 81,447,193,509
2011* 61,330,891,370 333,095,015 317,193,338 11,959,000,311 90,696,132 74,030,876,166
2010* 63,153,243,166 300,437,631 279,096,442 12,682,612,422 76,231,029 76,491,620,690
2009 57,630,423,957 223,384,797 200,588,070 11,415,195,274 55,784,131 69,525,376,229
2008 49,312,811,154 138,950,485 117,342,021 9,596,082,077 36,333,066 59,201,518,803
2007 69,959,641,078 156,864,566 123,946,918 13,282,947,482 37,227,685 83,560,627,729
2006 65,297,352,893 113,999,034 86,524,882 12,838,059,079 25,331,889 78,361,267,777
* Net Position by Plan was restated to correct allocation of investment income as of December 31, 2010, with the restatement rolled forward through 2011 and 2012� The restatement by plan does not impact the total net position of the System� �
**The 115 Health Care Trust was established in 2014� �
Net Position by Plan Traditional Pension Plan, 401(h) Health Care Trust
Net Position by Plan Combined Plan, Member-Directed Plan, 115 Health Care Trust, VEBA Trust
0
15
60
75
45
30Bill
ions
90
Traditional Pension Plan 401(h) Health Care Trust
2007 2008 2009 2010 2011 2012 2013 2014 20152006
0
50
200
250
300
150100
Mill
ions
350
400Combined Plan
VEBA Trust
115 Health Care Trust
550500
450
650600
700
750
800
2006 2007 2008 2009 2010 2011 2012 2013 2014 2015
Member-Directed Plan
850

Statistical Section
OPERS The Comprehensive Annual Financial Report 2015164
Statistical Section
Statutory Fund Balance by Plan (last 10 fiscal years)
Year 2015 2014 2013 2012
All PlansEmployees’ Savings FundEmployers’ Accumulation Fund—Pension/Health CareAnnuity and Pension Reserve FundSurvivors’ Benefit FundDefined Contribution Fund—Retirement/Health CareIncome FundExpense Fund
$13,471,062,84616,076,648,80954,705,647,8211,694,085,4971,219,165,845
122,714,0982,076,902
$13,194,306,671 22,768,644,951 52,331,183,968 1,675,926,615 1,154,079,903
114,494,235 5,258,765
$12,828,423,536 22,852,975,720 50,525,254,541 1,654,787,855 1,011,655,646
113,671,739 3,167,261
$12,641,655,468 19,074,270,351 47,232,908,883 1,627,212,197
763,702,610 107,444,000
Total Fund Balance $87,291,401,818 $91,243,895,108 $88,989,936,298 $81,447,193,509
Traditional Pension PlanEmployees’ Savings FundEmployers’ Accumulation Fund—PensionAnnuity and Pension Reserve FundSurvivors’ Benefit FundIncome FundExpense Fund
$13,468,694,3324,243,982,790
54,681,766,7331,694,085,497
122,714,0982,076,902
$13,191,067,352 9,655,043,969
52,314,439,706 1,675,926,615
114,494,235 5,258,765
$12,826,142,567 9,507,406,396
50,513,356,451 1,654,787,855
113,671,739 3,167,261
$12,639,906,042 6,066,140,290
47,227,389,270 1,627,212,197
107,444,000
Total Fund Balance $74,213,320,352 $76,956,230,642 $74,618,532,269 $67,668,091,799
Combined PlanEmployees’ Savings FundEmployers’ Accumulation Fund—PensionAnnuity and Pension Reserve FundDefined Contribution Fund—Retirement
$2,343,149320,876,51513,366,406
364,328,339
$2,994,501 286,747,478
8,359,792 352,147,956
$1,894,549 233,588,347
5,481,510 318,648,483
$1,606,472 179,466,995
3,114,881 236,009,198
Total Fund Balance $700,914,409 $650,249,727 $559,612,889 $420,197,546
Member-Directed PlanEmployees’ Savings FundEmployers’ Accumulation Fund—PensionAnnuity and Pension Reserve FundDefined Contribution Fund—Retirement
$25,365 (390,717)
10,514,682688,390,700
$244,818 250,542
8,384,470 626,392,783
$386,420 296,170
6,416,580 539,922,867
$142,954 37,744
2,404,732 408,077,537
Total Fund Balance $698,540,030 $635,272,613 $547,022,037 $410,662,967
401(h) Health Care TrustEmployers’ Accumulation Fund—Health Care $10,671,068,181 $12,440,522,790 $13,111,684,807 $12,828,625,322
Total Fund Balance $10,671,068,181 $12,440,522,790 $13,111,684,807 $12,828,625,322
115 Health Care Trust**Employers’ Accumulation Fund—Health Care $841,112,040 $386,080,172
Total Fund Balance $841,112,040 $386,080,172 $0 $0
Voluntary Employees' Beneficiary Association Trust Defined Contribution Fund—Health Care $166,446,806 $175,539,164 $153,084,296 $119,615,875
Total Fund Balance $166,446,806 $175,539,164 $153,084,296 $119,615,875
* Net Position by Plan was restated to correct the allocation of investment income as of December 31, 2010, with the restatement rolled forward through 2011 and 2012� The restatement by plan does not impact the total net position of the System�
** The 115 Health Care Trust was established in 2014�

The Comprehensive Annual Financial Report 2015 OPERS
Statistical Section
165
Statistical Section
Statutory Fund Balance by Plan (continued)
2011* 2010* 2009 2008 2007 2006
$12,300,117,438 15,959,261,830 43,513,048,458 1,568,050,108
587,622,632 99,016,985 3,758,715
$12,134,839,989 22,278,219,189 39,927,499,750 1,527,374,797
522,426,170 99,070,651 2,190,144
$11,933,642,333 20,026,006,552 35,616,195,176 1,472,264,995
376,419,373 95,184,666 5,663,134
$11,546,208,967 13,503,733,507 32,410,382,036 1,418,388,692
216,885,601 100,226,117
5,693,883
$10,815,159,012 40,336,757,059 30,699,027,425 1,373,512,884
234,047,349 99,627,634 2,496,366
$10,374,480,725 38,641,822,117 27,770,522,547 1,313,109,826
165,336,652 95,995,910
$74,030,876,166 $76,491,620,690 $69,525,376,229 $59,201,518,803 $83,560,627,729 $78,361,267,777
$12,298,673,251 3,850,924,715
43,510,467,596 1,568,050,108
99,016,985 3,758,715
$12,133,856,642 9,464,360,661
39,926,390,271 1,527,374,797
99,070,651 2,190,144
$11,932,873,455 8,508,596,858
35,615,840,849 1,472,264,995
95,184,666 5,663,134
$11,545,651,011 3,832,714,973
32,410,136,478 1,418,388,692
100,226,117 5,693,883
$10,814,646,533 26,970,418,583 30,698,939,078 1,373,512,884
99,627,634 2,496,366
$10,374,152,385 25,743,571,669 27,770,523,103 1,313,109,826
95,995,910
$61,330,891,370 $63,153,243,166 $57,630,423,957 $49,312,811,154 $69,959,641,078 $65,297,352,893
$1,362,904 149,374,928
1,514,253 180,842,930
$975,589 131,266,975
644,239 167,550,828
$768,977 102,108,811
251,905 120,255,104
$557,956 74,976,136
73,758 63,342,635
$512,479 83,391,067
60,804 72,900,216
$328,340 60,191,369
(556) 53,479,881
$333,095,015 $300,437,631 $223,384,797 $138,950,485 $156,864,566 $113,999,034
$81,283 (38,124)
1,066,609 316,083,570
$7,758 (20,869) 465,240
278,644,313
($99) 105,609 102,422
200,380,138
($39,679) 171,800
117,209,900
($73) 27,543
123,919,448 $86,524,882
$317,193,338 $279,096,442 $200,588,070 $117,342,021 $123,946,918 $86,524,882
$11,959,000,311 $12,682,612,422 $11,415,195,274 $9,596,082,077 $13,282,947,482 $12,838,059,079
$11,959,000,311 $12,682,612,422 $11,415,195,274 $9,596,082,077 $13,282,947,482 $12,838,059,079
$0 $0 $0 $0 $0 $0
$90,696,132 $76,231,029 $55,784,131 $36,333,066 $37,227,685 $25,331,889
$90,696,132 $76,231,029 $55,784,131 $36,333,066 $37,227,685 $25,331,889

Statistical Section
OPERS The Comprehensive Annual Financial Report 2015166
Statistical Section
Fiduciary Net Position by Year (last 10 fiscal years) Year 2015 2014 2013 2012
All PlansAssets
Cash and Short-Term InvestmentsReceivablesInvestmentsCollateral on Loaned SecuritiesNet Capital AssetsPrepaid Expenses and Other Assets
$3,064,065,686954,980,282
83,819,475,1188,270,812,672
132,811,6511,217,369
$2,882,858,353 1,088,837,041
87,891,142,075 7,854,368,780 133,629,210
2,261,461
$3,333,382,605 1,092,845,990
85,137,610,781 6,958,964,420
131,389,851 2,912,709
$2,780,697,535 2,212,003,770
77,617,850,120 6,827,172,458
121,172,935 3,841,978
Total Assets 96,243,362,778 99,853,096,920 96,657,106,356 89,562,738,796
Liabilities and Net PositionBenefits PayableInvestment Commitments PayableObligations Under Securities LendingOther LiabilitiesNet Position (Fund Balance)
93,550,718475,568,951
8,271,338,789111,502,502
87,291,401,818
99,844,976 593,164,943
7,852,803,699 63,388,194
91,243,895,108
90,115,030 554,398,461
6,953,717,885 68,938,682
88,989,936,298
101,188,640 1,116,869,935 6,816,672,766
80,813,946 81,447,193,509
Total Liabilities and Net Position $96,243,362,778 $99,853,096,920 $96,657,106,356 $89,562,738,796
Traditional Pension PlanAssets
Cash and Short-Term InvestmentsReceivablesInvestmentsCollateral on Loaned SecuritiesNet Capital AssetsPrepaid Expenses and Other Assets
$2,381,670,021637,347,978
71,514,345,1668,215,428,672
96,541,6051,217,369
$2,357,796,670 709,932,322
74,279,082,505 7,809,036,934
96,963,543 2,261,461
$2,826,596,339 760,735,070
71,393,042,048 6,924,316,299
98,948,820 2,912,709
$2,324,824,614 1,690,953,615
64,487,332,183 6,797,920,566
85,661,140 3,841,978
Total Assets 82,846,550,811 85,255,073,435 82,006,551,285 75,390,534,096 Liabilities and Net Position
Benefits PayableInvestment Commitments PayableObligations Under Securities LendingOther LiabilitiesNet Position (Fund Balance)
255,699393,965,905
8,215,951,26623,057,589
74,213,320,352
311,575 475,297,939
7,807,480,885 15,752,394
76,956,230,642
78,477 451,977,660
6,919,095,886 16,866,993
74,618,532,269
682,136 918,234,060
6,787,465,861 16,060,240
67,668,091,799
Total Liabilities and Net Position $82,846,550,811 $85,255,073,435 $82,006,551,285 $75,390,534,096
Combined PlanAssets
Cash and Short-Term InvestmentsReceivablesInvestmentsCollateral on Loaned SecuritiesNet Capital Assets
$10,566,32822,378,455
674,801,89334,258,8853,950,559
$8,947,770 21,472,538 623,991,406 27,497,528 3,998,438
$9,425,463 17,071,301
534,668,467 20,966,014 3,921,730
$6,574,926 9,350,843
416,161,716 18,059,949 4,357,765
Total Assets 745,956,120 685,907,680 586,052,975 454,505,199 Liabilities and Net Position
Investment Commitments PayableObligations Under Securities LendingOther LiabilitiesNet Position (Fund Balance)
1,801,00434,261,0658,979,642
700,914,409
1,787,256 27,492,049 6,378,648
650,249,727
1,549,789 20,950,208 3,940,089
559,612,889
2,690,744 18,032,174 13,584,735
420,197,546
Total Liabilities and Net Position $745,956,120 $685,907,680 $586,052,975 $454,505,199
Member-Directed PlanAssets
Cash and Short-Term InvestmentsReceivablesInvestmentsCollateral on Loaned SecuritiesNet Capital Assets
$334,22023,237,455
677,842,1122,237,4213,025,179
$274,295 21,577,499
638,145,075 767,134
3,150,369
$282,346 15,586,438
560,933,809 482,373
2,856,649
$91,299 6,821,748
432,851,458 205,837
3,667,974Total Assets 706,676,387 663,914,372 580,141,615 443,638,316 Liabilities and Net Position
Investment Commitments PayableObligations Under Securities LendingOther LiabilitiesNet Position (Fund Balance)
245,2602,237,5635,653,534
698,540,030
137,585 766,982
27,737,192 635,272,613
196,803 482,009
32,440,766 547,022,037
155,855 205,521
32,613,973 410,662,967
Total Liabilities and Net Position $706,676,387 $663,914,372 $580,141,615 $443,638,316
* Net Position by Plan was restated to correct the allocation of investment income as of December 31, 2010, with the restatement rolled forward through 2011 and 2012� The adjustment is reflected in the Cash and Short-Term Investments line and has no impact on the total net position of the System�

The Comprehensive Annual Financial Report 2015 OPERS
Statistical Section
167
Statistical Section
Fiduciary Net Position by Year (continued)
2011* 2010* 2009 2008 2007 2006
$2,847,839,851 1,554,352,796
71,149,016,095 10,401,223,945
112,092,861 779,630
$3,654,805,279 1,437,458,798
72,661,379,153 9,250,107,607
112,130,055 471,611
$1,742,538,072 1,976,201,742
66,819,524,257 9,978,449,975
113,508,936 236,290
$1,429,632,493 1,016,153,104
57,289,210,006 7,665,906,536
117,521,350 284,846
$1,030,943,608 1,029,220,765
82,001,128,270 13,159,403,768
120,859,724 387,169
$1,395,818,610 1,214,050,676
76,452,836,443 12,744,242,746
120,156,097 213,849,031
86,065,305,178 87,116,352,503 80,630,459,272 67,518,708,335 97,341,943,304 92,140,953,603
119,591,363 1,423,836,318
10,410,130,422 80,870,909
74,030,876,166
142,993,825 1,155,469,120 9,250,107,607
76,161,261 76,491,620,690
140,959,867 916,348,545
9,978,449,975 69,324,656
69,525,376,229
131,922,479 437,680,710
7,665,906,536 81,679,807
59,201,518,803
142,701,327 415,429,392
13,159,403,768 63,781,088
83,560,627,729
145,895,911 836,766,843
12,744,242,746 52,780,326
78,361,267,777
$86,065,305,178 $87,116,352,503 $80,630,459,272 $67,518,708,335 $97,341,943,304 $92,140,953,603
$2,321,930,951 1,181,127,055
58,890,460,789 10,363,838,801
84,923,332 779,630
$2,969,362,112 1,039,459,387
59,973,039,802 7,708,958,738
85,155,975 471,611
$1,652,107,085 915,977,579
55,741,813,567 9,653,891,069
86,063,353 236,290
$1,208,848,813 741,420,763
47,649,655,710 5,357,710,312
91,213,500 284,846
$858,481,646 774,558,734
68,602,804,295 11,069,869,796
93,969,101 387,169
$1,070,224,554 937,337,825
63,719,149,199 10,710,884,709
94,728,174 213,849,031
72,843,060,558 71,776,447,625 68,050,088,943 55,049,133,944 81,400,070,741 76,746,173,492
1,061,656 1,124,645,829
10,372,713,265 13,748,438
61,330,891,370
31,862 899,118,485
7,708,958,738 15,095,374
63,153,243,166
6,950,608 749,608,796
9,653,891,069 9,214,513
57,630,423,957
130,259 364,423,724
5,357,710,312 14,058,495
49,312,811,154
355,806,425 11,069,869,796
14,753,442 69,959,641,078
725,040,155 10,710,884,709
12,895,735 65,297,352,893
$72,843,060,558 $71,776,447,625 $68,050,088,943 $55,049,133,944 $81,400,070,741 $76,746,173,492
$6,248,674 7,707,808
339,986,995 23,506,898
65,084
$7,127,776 6,892,606
303,637,263 15,196,825
34,750
$3,716,643 6,259,012
233,771,271 16,765,205
1,932
$2,982,361 5,788,861
157,027,020 7,044,675
118
$2,725,143 5,264,533
172,094,212 11,788,022
68,975
$1,375,582 4,853,858
127,517,778 10,888,345
437,854
377,515,459 332,889,220 260,514,063 172,843,035 191,940,885 145,073,417
2,823,632 23,527,027 18,069,785
333,095,015
1,950,989 15,196,825 15,303,775
300,437,631
1,942,496 16,765,205 18,421,565
223,384,797
1,527,796 7,044,675
25,320,079 138,950,485
1,205,858 11,788,022 22,082,439
156,864,566
1,626,857 10,888,345 18,559,181
113,999,034
$377,515,459 $332,889,220 $260,514,063 $172,843,035 $191,940,885 $145,073,417
$980,013 7,353,279
338,695,474 111,647 94,933
$1,349,705 5,657,850
301,502,301 40,463 38,662
$2,322,907 5,901,916
221,224,028 30,222 2,294
$2,194,785 5,995,977
137,235,988 9,177
137
$3,064,085 5,397,814
140,594,070 171,375 55,124
$1,644,348 3,977,091
103,263,918 3,077,000
333,494
347,235,346 308,588,981 229,481,367 145,436,064 149,282,468 112,295,851
123,669 111,743
29,806,596 317,193,338
6,707 40,463
29,445,369 279,096,442
787,160 30,222
28,075,915 200,588,070
1,585,226 9,177
26,499,640 117,342,021
1,216,779 171,375
23,947,396 123,946,918
1,394,809 3,077,000
21,299,160 86,524,882
$347,235,346 $308,588,981 $229,481,367 $145,436,064 $149,282,468 $112,295,851
continued on page 168
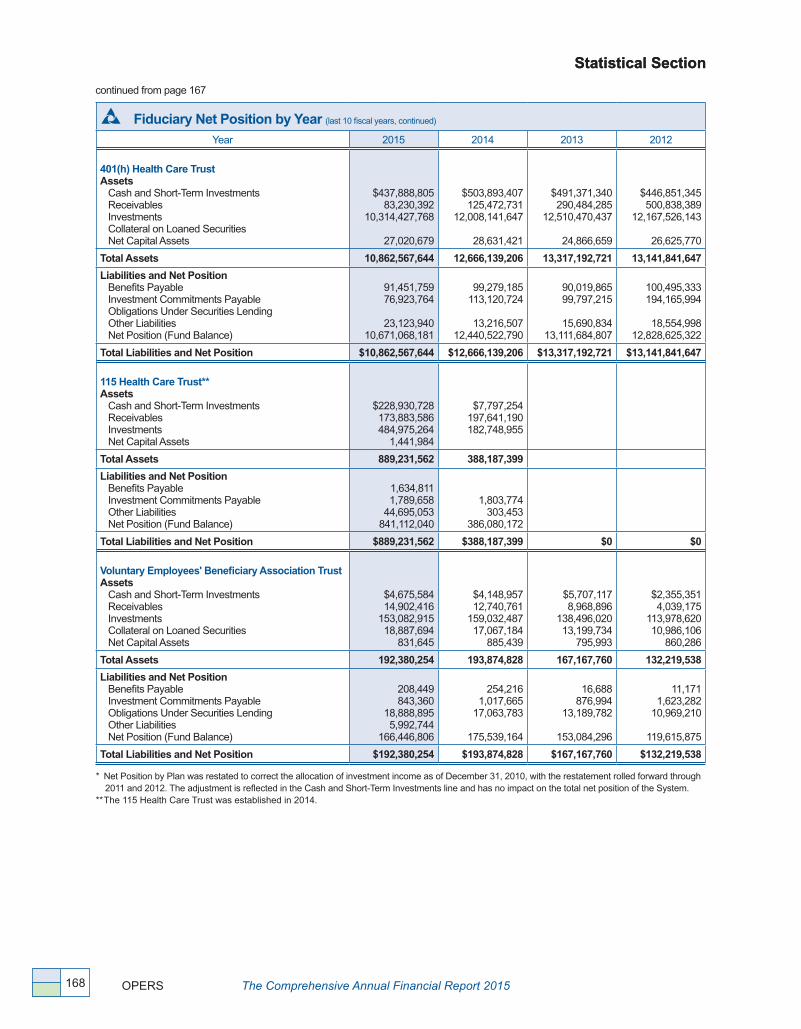
Statistical Section
OPERS The Comprehensive Annual Financial Report 2015168
Statistical Section
Fiduciary Net Position by Year (last 10 fiscal years, continued) Year 2015 2014 2013 2012
401(h) Health Care TrustAssets
Cash and Short-Term InvestmentsReceivablesInvestmentsCollateral on Loaned SecuritiesNet Capital Assets
$437,888,80583,230,392
10,314,427,768
27,020,679
$503,893,407 125,472,731
12,008,141,647
28,631,421
$491,371,340 290,484,285
12,510,470,437
24,866,659
$446,851,345 500,838,389
12,167,526,143
26,625,770
Total Assets 10,862,567,644 12,666,139,206 13,317,192,721 13,141,841,647
Liabilities and Net PositionBenefits PayableInvestment Commitments PayableObligations Under Securities LendingOther LiabilitiesNet Position (Fund Balance)
91,451,75976,923,764
23,123,94010,671,068,181
99,279,185 113,120,724
13,216,507 12,440,522,790
90,019,865 99,797,215
15,690,834 13,111,684,807
100,495,333 194,165,994
18,554,998 12,828,625,322
Total Liabilities and Net Position $10,862,567,644 $12,666,139,206 $13,317,192,721 $13,141,841,647
115 Health Care Trust**Assets
Cash and Short-Term InvestmentsReceivablesInvestmentsNet Capital Assets
$228,930,728173,883,586484,975,264
1,441,984
$7,797,254 197,641,190 182,748,955
Total Assets 889,231,562 388,187,399
Liabilities and Net PositionBenefits PayableInvestment Commitments PayableOther LiabilitiesNet Position (Fund Balance)
1,634,8111,789,658
44,695,053841,112,040
1,803,774 303,453
386,080,172
Total Liabilities and Net Position $889,231,562 $388,187,399 $0 $0
Voluntary Employees' Beneficiary Association TrustAssets
Cash and Short-Term InvestmentsReceivablesInvestmentsCollateral on Loaned SecuritiesNet Capital Assets
$4,675,58414,902,416
153,082,91518,887,694
831,645
$4,148,957 12,740,761
159,032,487 17,067,184
885,439
$5,707,117 8,968,896
138,496,020 13,199,734
795,993
$2,355,351 4,039,175
113,978,620 10,986,106
860,286
Total Assets 192,380,254 193,874,828 167,167,760 132,219,538
Liabilities and Net PositionBenefits PayableInvestment Commitments PayableObligations Under Securities LendingOther LiabilitiesNet Position (Fund Balance)
208,449843,360
18,888,8955,992,744
166,446,806
254,216 1,017,665
17,063,783
175,539,164
16,688 876,994
13,189,782
153,084,296
11,171 1,623,282
10,969,210
119,615,875
Total Liabilities and Net Position $192,380,254 $193,874,828 $167,167,760 $132,219,538
* Net Position by Plan was restated to correct the allocation of investment income as of December 31, 2010, with the restatement rolled forward through 2011 and 2012� The adjustment is reflected in the Cash and Short-Term Investments line and has no impact on the total net position of the System�
** The 115 Health Care Trust was established in 2014�
continued from page 167
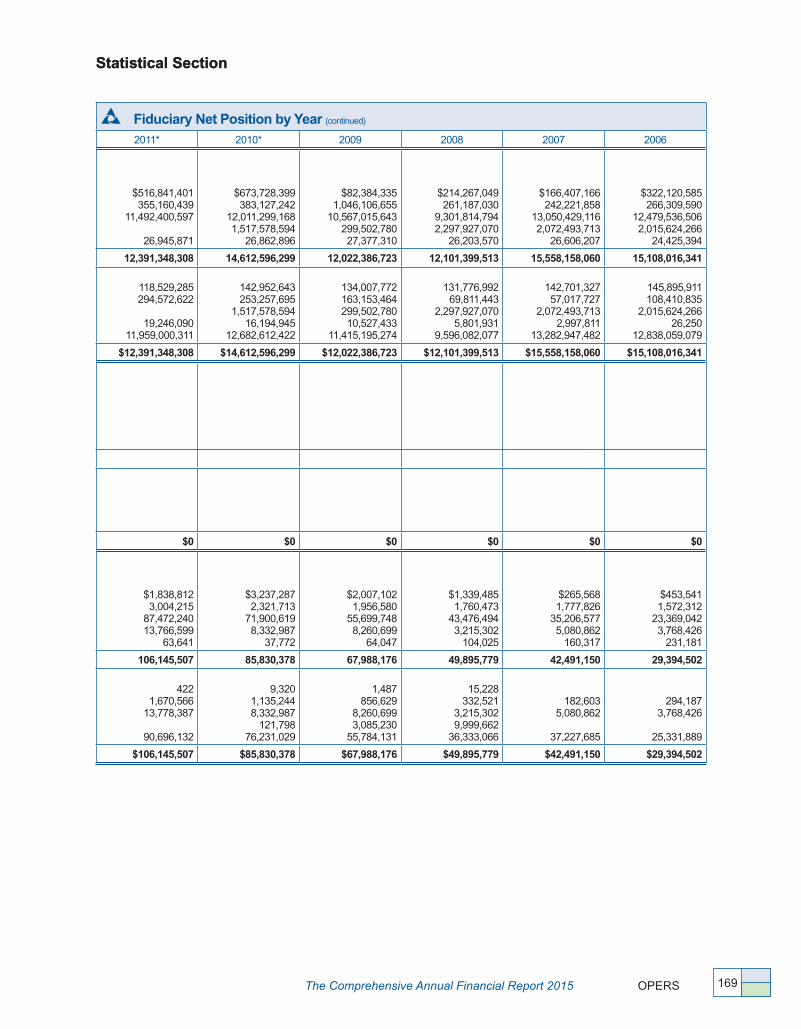
The Comprehensive Annual Financial Report 2015 OPERS
Statistical Section
169
Statistical Section
Fiduciary Net Position by Year (continued)
2011* 2010* 2009 2008 2007 2006
$516,841,401 355,160,439
11,492,400,597
26,945,871
$673,728,399 383,127,242
12,011,299,168 1,517,578,594
26,862,896
$82,384,335 1,046,106,655
10,567,015,643 299,502,780 27,377,310
$214,267,049 261,187,030
9,301,814,794 2,297,927,070
26,203,570
$166,407,166 242,221,858
13,050,429,116 2,072,493,713
26,606,207
$322,120,585 266,309,590
12,479,536,506 2,015,624,266
24,425,394
12,391,348,308 14,612,596,299 12,022,386,723 12,101,399,513 15,558,158,060 15,108,016,341
118,529,285 294,572,622
19,246,090 11,959,000,311
142,952,643 253,257,695
1,517,578,594 16,194,945
12,682,612,422
134,007,772 163,153,464 299,502,780 10,527,433
11,415,195,274
131,776,992 69,811,443
2,297,927,070 5,801,931
9,596,082,077
142,701,327 57,017,727
2,072,493,713 2,997,811
13,282,947,482
145,895,911 108,410,835
2,015,624,266 26,250
12,838,059,079
$12,391,348,308 $14,612,596,299 $12,022,386,723 $12,101,399,513 $15,558,158,060 $15,108,016,341
$0 $0 $0 $0 $0 $0
$1,838,812 3,004,215
87,472,240 13,766,599
63,641
$3,237,287 2,321,713
71,900,619 8,332,987
37,772
$2,007,102 1,956,580
55,699,748 8,260,699
64,047
$1,339,485 1,760,473
43,476,494 3,215,302
104,025
$265,568 1,777,826
35,206,577 5,080,862
160,317
$453,541 1,572,312
23,369,042 3,768,426
231,181
106,145,507 85,830,378 67,988,176 49,895,779 42,491,150 29,394,502
422 1,670,566
13,778,387
90,696,132
9,320 1,135,244 8,332,987
121,798 76,231,029
1,487 856,629
8,260,699 3,085,230
55,784,131
15,228 332,521
3,215,302 9,999,662
36,333,066
182,603 5,080,862
37,227,685
294,187 3,768,426
25,331,889
$106,145,507 $85,830,378 $67,988,176 $49,895,779 $42,491,150 $29,394,502
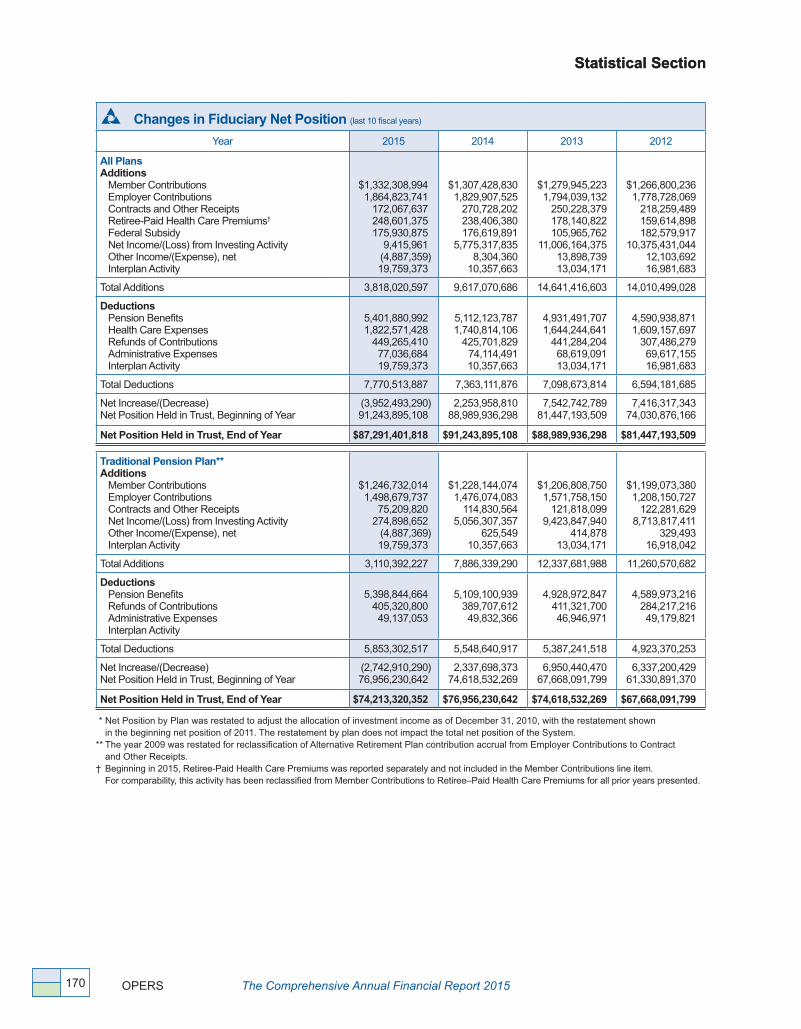
Statistical Section
OPERS The Comprehensive Annual Financial Report 2015170
Statistical Section
Changes in Fiduciary Net Position (last 10 fiscal years)
Year 2015 2014 2013 2012
All PlansAdditions
Member Contributions Employer Contributions Contracts and Other Receipts Retiree-Paid Health Care Premiums†
Federal Subsidy Net Income/(Loss) from Investing Activity Other Income/(Expense), net Interplan Activity
$1,332,308,9941,864,823,741
172,067,637248,601,375175,930,875
9,415,961(4,887,359)19,759,373
$1,307,428,830 1,829,907,525
270,728,202 238,406,380 176,619,891
5,775,317,835 8,304,360
10,357,663
$1,279,945,223 1,794,039,132
250,228,379 178,140,822 105,965,762
11,006,164,375 13,898,739 13,034,171
$1,266,800,236 1,778,728,069
218,259,489 159,614,898 182,579,917
10,375,431,044 12,103,692 16,981,683
Total Additions 3,818,020,597 9,617,070,686 14,641,416,603 14,010,499,028
Deductions Pension Benefits Health Care Expenses Refunds of Contributions Administrative Expenses Interplan Activity
5,401,880,9921,822,571,428
449,265,41077,036,68419,759,373
5,112,123,787 1,740,814,106
425,701,829 74,114,491 10,357,663
4,931,491,707 1,644,244,641
441,284,204 68,619,091 13,034,171
4,590,938,871 1,609,157,697
307,486,279 69,617,155 16,981,683
Total Deductions 7,770,513,887 7,363,111,876 7,098,673,814 6,594,181,685
Net Increase/(Decrease) Net Position Held in Trust, Beginning of Year
(3,952,493,290)91,243,895,108
2,253,958,810 88,989,936,298
7,542,742,789 81,447,193,509
7,416,317,343 74,030,876,166
Net Position Held in Trust, End of Year $87,291,401,818 $91,243,895,108 $88,989,936,298 $81,447,193,509
Traditional Pension Plan** Additions
Member Contributions Employer Contributions Contracts and Other Receipts Net Income/(Loss) from Investing Activity Other Income/(Expense), net Interplan Activity
$1,246,732,0141,498,679,737
75,209,820274,898,652 (4,887,369)19,759,373
$1,228,144,074 1,476,074,083
114,830,564 5,056,307,357
625,549 10,357,663
$1,206,808,750 1,571,758,150
121,818,099 9,423,847,940
414,878 13,034,171
$1,199,073,380 1,208,150,727
122,281,629 8,713,817,411
329,493 16,918,042
Total Additions 3,110,392,227 7,886,339,290 12,337,681,988 11,260,570,682
DeductionsPension Benefits Refunds of Contributions Administrative Expenses Interplan Activity
5,398,844,664405,320,80049,137,053
5,109,100,939 389,707,612 49,832,366
4,928,972,847 411,321,700 46,946,971
4,589,973,216 284,217,216 49,179,821
Total Deductions 5,853,302,517 5,548,640,917 5,387,241,518 4,923,370,253
Net Increase/(Decrease) Net Position Held in Trust, Beginning of Year
(2,742,910,290)76,956,230,642
2,337,698,373 74,618,532,269
6,950,440,470 67,668,091,799
6,337,200,429 61,330,891,370
Net Position Held in Trust, End of Year $74,213,320,352 $76,956,230,642 $74,618,532,269 $67,668,091,799
* Net Position by Plan was restated to adjust the allocation of investment income as of December 31, 2010, with the restatement shown in the beginning net position of 2011� The restatement by plan does not impact the total net position of the System�
** The year 2009 was restated for reclassification of Alternative Retirement Plan contribution accrual from Employer Contributions to Contract and Other Receipts�
† Beginning in 2015, Retiree-Paid Health Care Premiums was reported separately and not included in the Member Contributions line item� For comparability, this activity has been reclassified from Member Contributions to Retiree–Paid Health Care Premiums for all prior years presented�

The Comprehensive Annual Financial Report 2015 OPERS
Statistical Section
171
Statistical Section
Changes in Fiduciary Net Position (continued)
2011* 2010 2009 2008 2007 2006
$1,286,385,298 1,809,470,716
211,847,098 148,370,246 192,118,407 179,956,702
11,255,503 10,077,664
$1,275,688,737 1,796,343,429
197,507,372 111,638,313 142,658,293
9,268,181,189 7,930,265
10,528,250
$1,290,805,214 1,822,639,448
219,182,666 94,370,543 69,132,772
12,274,797,785 794,525
7,879,768
$1,303,865,947 1,840,585,266
180,763,50282,695,255 63,310,194
(22,770,412,901)1,635,996 7,470,205
$1,227,345,099 1,798,305,461
151,494,844 79,198,959 59,075,120
6,594,053,702 110,559
5,730,846
$1,099,361,151 1,673,479,701
216,390,457 71,718,182 58,987,181
10,028,554,662 1,501,275 5,286,335
3,849,481,634 12,810,475,848 15,779,602,721 (19,290,086,536) 9,915,314,590 13,155,278,944
4,329,918,267 1,576,457,152
323,672,042 70,101,033 10,077,664
3,961,552,022 1,568,065,943
233,054,714 71,030,458 10,528,250
3,661,174,109 1,488,266,219
222,580,254 75,844,945 7,879,768
3,388,953,861 1,377,274,519
221,300,825 74,022,980 7,470,205
3,136,995,197 1,282,829,856
221,092,748 69,305,991 5,730,846
2,906,859,113 1,231,882,888
235,136,633 65,152,774 5,286,335
6,310,226,158 5,844,231,387 5,455,745,295 5,069,022,390 4,715,954,638 4,444,317,743
(2,460,744,524)76,491,620,690
6,966,244,461 69,525,376,229
10,323,857,426 59,201,518,803
(24,359,108,926) 83,560,627,729
5,199,359,952 78,361,267,777
8,710,961,20169,650,306,576
$74,030,876,166 $76,491,620,690 $69,525,376,229 $59,201,518,803 $83,560,627,729 $78,361,267,777
$1,221,597,118 1,233,002,841
121,560,871 274,530,266
340,460 10,077,664
$1,217,388,746 1,097,711,440
113,080,115 7,678,536,712
763,943 10,501,974
$1,236,966,262 1,019,582,360
160,232,136 9,822,978,753
140,494 7,839,790
$1,253,053,822 892,693,746 113,351,117
(19,258,540,437) 1,021,007 7,289,779
$1,183,959,051 1,051,808,289
105,157,859 5,717,111,026
40,061 4,969,740
$1,065,862,778 1,092,998,459
122,076,019 8,529,935,923
194,492 4,520,387
2,861,109,220 10,117,982,930 12,247,739,795 (16,991,130,966) 8,063,046,026 10,815,588,058
4,329,452,581 302,812,289 51,196,146
3,961,217,461 219,808,143 52,375,762
3,661,076,709 212,209,227 56,805,048
36,008
3,388,862,796 212,802,651 53,853,085
180,426
3,136,978,910 213,007,451 50,053,260
718,220
2,906,857,436 228,034,617 44,854,241
703,612
4,683,461,016 4,233,401,366 3,930,126,992 3,655,698,958 3,400,757,841 3,180,449,906
(1,822,351,796) 63,153,243,166
5,884,581,564 57,630,423,957
8,317,612,803 49,312,811,154
(20,646,829,924) 69,959,641,078
4,662,288,185 65,297,352,893
7,635,138,152 57,662,214,741
$61,330,891,370 $63,515,005,521 $57,630,423,957 $49,312,811,154 $69,959,641,078 $65,297,352,893
continued on page172
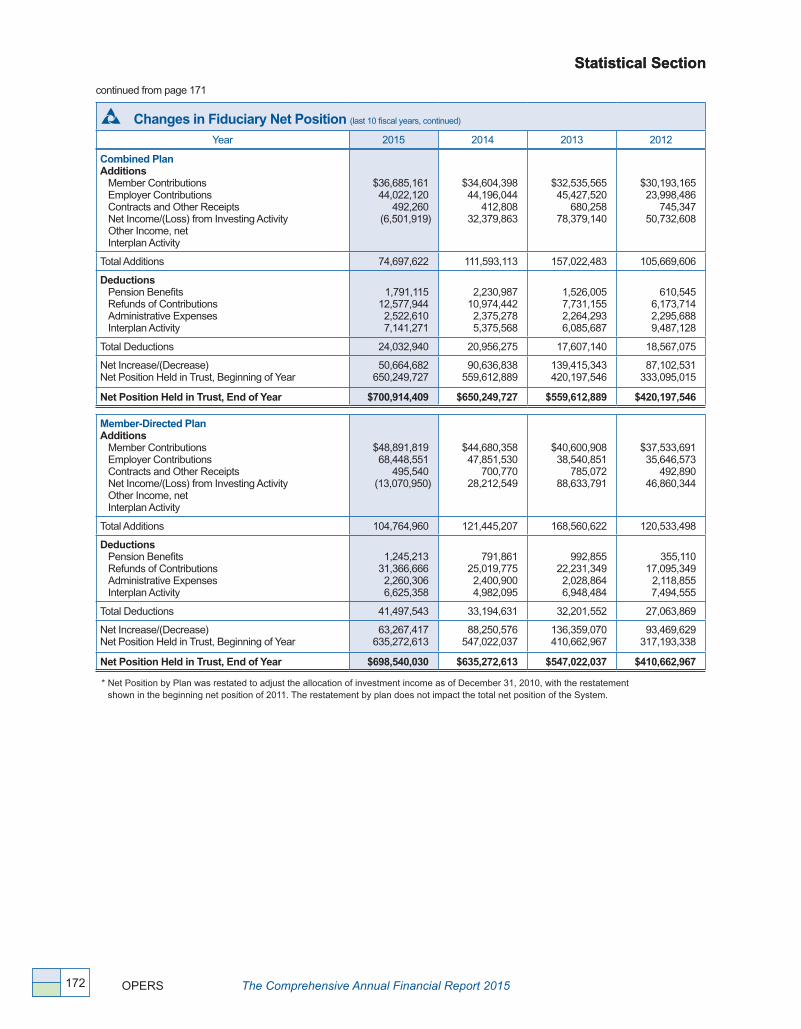
Statistical Section
OPERS The Comprehensive Annual Financial Report 2015172
Statistical Section
Changes in Fiduciary Net Position (last 10 fiscal years, continued) Year 2015 2014 2013 2012
Combined Plan Additions
Member Contributions Employer Contributions Contracts and Other Receipts Net Income/(Loss) from Investing Activity Other Income, net Interplan Activity
$36,685,16144,022,120
492,260(6,501,919)
$34,604,398 44,196,044
412,808 32,379,863
$32,535,565 45,427,520
680,258 78,379,140
$30,193,165 23,998,486
745,347 50,732,608
Total Additions 74,697,622 111,593,113 157,022,483 105,669,606
DeductionsPension Benefits Refunds of Contributions Administrative Expenses Interplan Activity
1,791,11512,577,9442,522,6107,141,271
2,230,987 10,974,442 2,375,278 5,375,568
1,526,005 7,731,155 2,264,293 6,085,687
610,545 6,173,714 2,295,688 9,487,128
Total Deductions 24,032,940 20,956,275 17,607,140 18,567,075
Net Increase/(Decrease) Net Position Held in Trust, Beginning of Year
50,664,682650,249,727
90,636,838 559,612,889
139,415,343 420,197,546
87,102,531 333,095,015
Net Position Held in Trust, End of Year $700,914,409 $650,249,727 $559,612,889 $420,197,546
Member-Directed Plan Additions
Member Contributions Employer Contributions Contracts and Other Receipts Net Income/(Loss) from Investing Activity Other Income, netInterplan Activity
$48,891,81968,448,551
495,540(13,070,950)
$44,680,358 47,851,530
700,770 28,212,549
$40,600,908 38,540,851
785,072 88,633,791
$37,533,691 35,646,573
492,890 46,860,344
Total Additions 104,764,960 121,445,207 168,560,622 120,533,498
DeductionsPension Benefits Refunds of Contributions Administrative Expenses Interplan Activity
1,245,21331,366,6662,260,3066,625,358
791,861 25,019,775 2,400,900 4,982,095
992,855 22,231,349 2,028,864 6,948,484
355,110 17,095,349
2,118,855 7,494,555
Total Deductions 41,497,543 33,194,631 32,201,552 27,063,869
Net Increase/(Decrease) Net Position Held in Trust, Beginning of Year
63,267,417635,272,613
88,250,576 547,022,037
136,359,070 410,662,967
93,469,629 317,193,338
Net Position Held in Trust, End of Year $698,540,030 $635,272,613 $547,022,037 $410,662,967
* Net Position by Plan was restated to adjust the allocation of investment income as of December 31, 2010, with the restatement shown in the beginning net position of 2011� The restatement by plan does not impact the total net position of the System�
continued from page 171

The Comprehensive Annual Financial Report 2015 OPERS
Statistical Section
173
Statistical Section
Changes in Fiduciary Net Position (continued)
2011* 2010 2009 2008 2007 2006
$29,256,952 23,280,520
386,879 (5,810,229)
$27,272,707 26,432,761
384,947 35,971,101
1,267
$26,096,068 23,397,299
124,823 44,034,607
$25,123,220 20,352,999
844,005 (53,571,566)
68,857
$21,907,704 19,241,579
347,280 9,866,238
411,764
$17,367,629 17,689,420
427,966 14,041,870
420,198
47,114,122 90,062,783 93,652,797 (7,182,485) 51,774,565 49,947,083
305,215 6,462,849 2,559,312 5,129,362
128,366 3,540,043 2,584,673 6,043,719
35,566 2,905,883 2,638,279 3,638,757
11,911 3,623,723 2,990,092 4,105,870
5,451 2,707,630 3,890,828 2,305,124
552 1,910,107 4,510,803 2,026,194
14,456,738 12,296,801 9,218,485 10,731,596 8,909,033 8,447,656
32,657,384 300,437,631
77,765,982 223,384,797
84,434,312 138,950,485
(17,914,081) 156,864,566
42,865,532 113,999,034
41,499,427 72,499,607
$333,095,015 $301,150,779 $223,384,797 $138,950,485 $156,864,566 $113,999,034
$35,531,228 33,746,291
802,270 (10,151,205)
$31,027,284 29,527,197
462,075 34,223,485
1,108
$27,742,884 26,356,764
173,832 42,835,328
$25,688,905 24,411,834
223,485 (46,084,400)
55,277
$21,478,344 21,048,014
453,716 5,860,816
278,478
$16,130,744 16,363,129
161,894 10,529,166
345,750
59,928,584 95,241,149 97,108,808 4,295,101 49,119,368 43,530,683
160,471 14,396,904 2,354,183 4,920,130
206,195 9,706,528 2,435,285 4,382,873
61,834 7,465,144 2,514,665 3,821,116
79,154 4,874,451 2,762,484 3,183,909
10,836 5,377,667 3,601,327 2,707,502
1,125 5,191,909 3,882,917 2,431,876
21,831,688 16,730,881 13,862,759 10,899,998 11,697,332 11,507,827
38,096,896 279,096,442
78,510,268 200,588,070
83,246,049 117,342,021
(6,604,897) 123,946,918
37,422,036 86,524,882
32,022,856 54,502,026
$317,193,338 $279,096,338 $200,588,070 $117,342,021 $123,946,918 $86,524,882
continued on page 174

Statistical Section
OPERS The Comprehensive Annual Financial Report 2015174
Statistical Sectioncontinued from page 173
Changes in Fiduciary Net Position (last 10 fiscal years, continued) Year 2015 2014 2013 2012
401(h) Health Care Trust** Additions
Employer Contributions Contracts and Other Receipts Retiree-Paid Health Care Premiums† Federal SubsidyNet Income/(Loss) from Investing Activity Other Income, net
$9,435248,601,375
(223,464,384)
$135,522,351 10,950,386 238,406,380 44,715,641
648,566,894 7,601,841
$120,056,440 126,941,889 178,140,822 105,965,762
1,397,348,823 13,483,861
$494,048,415 94,730,390 159,614,898 182,579,917
1,549,970,894 11,774,199
Total Additions 25,146,426 1,085,763,493 1,941,937,597 2,492,718,713
DeductionsHealth Care Expenses Administrative Expenses
1,774,989,83619,611,199
1,738,596,173 18,329,337
1,642,525,598 16,352,514
1,607,921,528 15,172,174
Total Deductions 1,794,601,035 1,756,925,510 1,658,878,112 1,623,093,702
Net Increase/(Decrease) Net Position Held in Trust, Beginning of Year
(1,769,454,609)12,440,522,790
(671,162,017) 13,111,684,807
283,059,485 12,828,625,322
869,625,011 11,959,000,311
Net Position Held in Trust, End of Year $10,671,068,181 $12,440,522,790 $13,111,684,807 $12,828,625,322
115 Health Care Trust*** Additions
Employer Contributions Contracts and Other Receipts Federal Subsidy Net Income/(Loss) from Investing Activity Other Income, net
$253,673,33395,860,582
175,930,875(23,073,355)
10
$111,561,319 143,813,190 131,904,250
(1,193,356) 76,970
Total Additions 502,391,445 386,162,373
DeductionsHealth Care ExpensesAdministrative Expenses
45,184,6202,174,957 82,201
Total Deductions 47,359,577 82,201
Net Increase/(Decrease) Net Position Held in Trust, Beginning of Year
455,031,868386,080,172
386,080,172
Net Position Held in Trust, End of Year $841,112,040 $386,080,172 $0 $0
Voluntary Employees' Beneficiary Association TrustAdditions
Employer Contributions**** Contracts and Other Receipts Net Income/(Loss) from Investing Activity Other Income, net Interplan Activity
$627,917
$14,702,198 20,484
11,044,528
$18,256,171 3,061
17,954,681
$16,883,868 9,233
14,049,787
63,641
Total Additions 627,917 25,767,210 36,213,913 31,006,529
Deductions Health Care Expenses Administrative Expenses Interplan Activity
2,396,9721,330,5595,992,744
2,217,933 1,094,409
1,719,043 1,026,449
1,236,169 850,617
Total Deductions 9,720,275 3,312,342 2,745,492 2,086,786
Net Increase/(Decrease) Net Position Held in Trust, Beginning of Year
(9,092,358)175,539,164
22,454,868 153,084,296
33,468,421 119,615,875
28,919,743 90,696,132
Net Position Held in Trust, End of Year $166,446,806 $175,539,164 $153,084,296 $119,615,875
* Net Position by Plan was restated to adjust the allocation of investment income as of December 31, 2010, with the restatement shown in the beginning net position of 2011� The restatement by plan does not impact the total net position of the System�
** The year 2010 was restated for reclassification of Early Retirement Reinsurance Program from Contracts and Other Receipts to Federal Subsidy, and the reclassification of the Pending Medical Claims adjustment from Health Care Expenses to Other Income� Pending Medical Claims consists of the annual adjustment made to the incurred but not reported liability included in Benefits Payable� This liability fluctuates from year to year based on changes in the claims experience�
*** The 115 Health Care Trust was established in 2014�**** Beginning in October 2014, the Board approved the funding of the VEBA Trust participant accounts using the reserves in the VEBA Trust rather
than the allocation of employer contributions� Instead, employer contributions were allocated to the Member-Directed Plan to repay the original plan start-up and administrative costs�
† Beginning in 2015, Retiree-Paid Health Care Premiums was reported separately and not included in the Member Contributions line item� For comparability, this activity has been reclassified from Member Contributions to Retiree–Paid Health Care Premiums for all prior years presented�

The Comprehensive Annual Financial Report 2015 OPERS
Statistical Section
175
Statistical Section
Changes in Fiduciary Net Position (continued)
2011* 2010 2009 2008 2007 2006
$503,458,21689,087,996
148,370,246192,118,407(78,923,627)10,915,043
$628,685,23783,572,868
111,638,313142,658,293
1,511,164,9647,163,609
$740,817,89158,649,54794,370,54369,132,772
2,356,554,863654,031
$891,561,07366,343,54282,695,25563,310,194
(3,400,647,342)614,989
$695,967,83745,534,01779,198,95959,075,120
858,614,43370,498
$538,312,99593,724,10471,718,18258,987,181
1,471,059,8311,306,783
865,026,281 2,484,883,284 3,320,179,647 (2,296,122,289) 1,738,460,864 2,235,109,076
1,575,561,578
13,076,814 1,567,551,611
12,782,9681,488,032,855
13,033,5951,377,146,173
13,596,9431,282,776,044
10,796,4171,231,870,038
10,892,971
1,588,638,392 1,580,334,579 1,501,066,450 1,390,743,116 1,293,572,461 1,242,763,009
(723,612,111)12,682,612,422
904,548,70511,415,195,274
1,819,113,1979,596,082,077
(3,686,865,405)13,282,947,482
444,888,40312,838,059,079
992,346,06711,845,713,012
$11,959,000,311 $12,319,743,979 $11,415,195,274 $9,596,082,077 $13,282,947,482 $12,838,059,079
$0 $0 $0 $0 $0 $0
$15,982,8489,082
311,497
$13,986,7947,367
8,284,927338
26,276
$12,485,1342,328
8,394,234
39,978
$11,565,6141,353
(11,569,156)
56,292
$10,239,7421,972
2,601,189
70,864
$8,115,698474
2,987,872
16,303,427 22,305,702 20,921,674 54,103 12,913,767 11,104,044
895,574914,57828,172
514,332851,770101,658
233,364853,358383,887
128,346820,376
53,812964,159
12,8501,011,842
124,653
1,838,324 1,467,760 1,470,609 948,722 1,017,971 1,149,345
14,465,10376,231,029
20,837,94255,784,131
19,451,06536,333,066
(894,619)37,227,685
11,895,79625,331,889
9,954,69915,377,190
$90,696,132 $76,622,073 $55,784,131 $36,333,066 $37,227,685 $25,331,889

Statistical Section
OPERS The Comprehensive Annual Financial Report 2015176
Statistical Section
Additions by Source (last 10 fiscal years)
Year 2015 2014 2013 2012
All PlansMember ContributionsEmployer ContributionsPurchase of ServiceRetiree-Paid Health Care Premiums†
Early Retirement Incentive PaymentsTransfers from Other Retirement SystemsVendor Rebates & Other ReceiptsAdditional Annuity/Voluntary ContributionsOther Employer PaymentsFederal SubsidyNet Income/(Loss) from Investing ActivityOther Income/(Expense), netInterplan Activity
$1,332,308,994 1,864,823,741
22,850,005 248,601,375
2,636,885 47,270,34991,372,4731,668,697 6,269,228
175,930,875 9,415,961
(4,887,359)19,759,373
$1,307,428,830 1,829,907,525
26,521,581 238,406,380 15,180,991 69,328,737
150,377,554 1,693,612 7,625,727
176,619,891 5,775,317,835
8,304,360 10,357,663
$1,279,945,223 1,794,039,132
60,100,714 178,140,822
7,294,662 46,370,923
121,660,735 5,786,692 9,014,653
105,965,762 11,006,164,375
13,898,739 13,034,171
$1,266,800,236 1,778,728,069
62,507,139 159,614,898 13,568,992 39,590,467 90,103,930 5,402,253 7,086,708
182,579,917 10,375,431,044
12,103,692 16,981,683
Total Additions $3,818,020,597 $9,617,070,686 $14,641,416,603 $14,010,499,028
Traditional Pension PlanMember ContributionsEmployer ContributionsPurchase of ServiceEarly Retirement Incentive PaymentsTransfers from Other Retirement SystemsAdditional Annuity ContributionsOther Employer PaymentsNet Income/(Loss) from Investing ActivityOther Income/(Expense), netInterplan Activity
$1,246,732,014 1,498,679,737
22,718,488 2,649,968
43,081,440 830,196
5,929,728 274,898,652
(4,887,369) 19,759,373
$1,228,144,074 1,476,074,083
26,297,267 14,427,760 66,309,930
945,803 6,849,804
5,056,307,357 625,549
10,357,663
$1,206,808,750 1,571,758,150
59,756,708 6,943,575
42,242,610 4,744,751 8,130,455
9,423,847,940 414,878
13,034,171
$1,199,073,380 1,208,150,727
62,193,231 13,134,027 36,013,336 4,530,704 6,410,331
8,713,817,411 329,493
16,918,042
Total Additions $3,110,392,227 $7,886,339,290 $12,337,681,988 $11,260,570,682
Combined Plan Member ContributionsEmployer ContributionsPurchase of ServiceTransfers from Other Retirement SystemsVoluntary ContributionsOther Employer PaymentsNet Income/(Loss) from Investing ActivityOther Income, netInterplan Activity
$36,685,161 44,022,120
131,373
353,335 7,552
(6,501,919)
$34,604,398 44,196,044
218,582
153,014 41,212
32,379,863
$32,535,565 45,427,520
343,752
270,861 65,645
78,379,140
$30,193,165 23,998,486
313,711
425,653 5,983
50,732,608
Total Additions $74,697,622 $111,583,113 $157,022,483 $105,669,606
Member-Directed Plan Member ContributionsEmployer ContributionsPurchase of ServiceVoluntary ContributionsOther Employer PaymentsNet Income/(Loss) from Investing ActivityOther Income, netInterplan Activity
$48,891,81968,448,551
144485,16610,230
(13,070,950)
$44,680,358 47,851,530
5,732 594,795 100,243
28,212,549
$40,600,908 38,540,851
254 771,080 13,738
88,633,791
$37,533,691 35,646,573
197 445,896 46,797
46,860,344
Total Additions $104,764,960 $121,445,207 $168,560,622 $120,533,498
† Beginning in 2015, Retiree-Paid Health Care Premiums was reported separately and not included in the Member Contributions line item� For comparability, this activity has been reclassified from Member Contributions to Retiree–Paid Health Care Premiums for all prior years presented�

The Comprehensive Annual Financial Report 2015 OPERS
Statistical Section
177
Statistical Section
Additions by Source (continued)
2011 2010 2009 2008 2007 2006
$1,286,385,298 1,809,470,716
59,976,857 148,370,246 23,366,505 31,487,779 84,515,422 5,334,480 7,166,055
192,118,407 179,956,702
11,255,503 10,077,664
$1,275,688,737 1,796,343,429
51,936,153 111,638,313 27,964,615 31,862,677 72,854,648 5,296,310 7,592,969
142,658,293 9,268,181,189
7,930,265 10,528,250
$1,290,805,214 1,822,639,448
42,247,663 94,370,543 93,149,748 26,142,599 47,557,407 3,915,521 6,169,728
69,132,772 12,274,797,785
794,525 7,879,768
$1,303,865,947 1,840,585,266
47,326,741 82,695,255 34,588,480 43,533,703 44,672,114 4,498,262 6,144,202
63,310,194 (22,770,412,901)
1,635,996 7,470,205
$1,227,345,099 1,798,305,461
45,091,289 79,198,959 30,078,951 24,071,283 41,826,091 5,538,887 4,888,343
59,075,120 6,594,053,702
110,559 5,730,846
$1,099,361,151 1,673,479,701
50,645,844 71,718,182 38,617,128 23,863,918 87,417,935 8,668,898 7,176,734
58,987,181 10,028,554,662
1,501,275 5,286,335
$3,849,481,634 $12,810,475,848 $15,779,602,721 ($19,290,086,536) $9,915,314,590 $13,155,278,944
$1,221,597,118 1,233,002,841
59,770,075 22,388,005 28,505,778 4,447,182 6,449,831
274,530,266 340,460
10,077,664
$1,217,388,746 1,097,711,440
51,738,819 26,567,998 23,234,777 4,699,133 6,839,388
7,678,536,712 763,943
10,501,974
$1,236,966,262 1,019,582,360
42,177,769 87,738,002 20,972,055 3,705,856 5,638,454
9,822,978,753 140,494
7,839,790
$1,253,053,822 892,693,746 47,167,085 32,401,549 24,779,353 3,615,649 5,387,481
(19,258,540,437) 1,021,007 7,289,779
$1,183,959,051 1,051,808,289
44,994,292 27,838,050 23,209,103 4,879,268 4,237,146
5,717,111,026 40,061
4,969,740
$1,065,862,778 1,092,998,459
50,533,824 35,579,146 21,807,617 8,184,059 5,971,373
8,529,935,923 194,492
4,520,387
$2,861,109,220 $10,117,982,930 $12,247,739,795 ($16,991,130,966) $8,063,046,026 $10,815,588,058
$29,256,952 23,280,520
201,906 35,957
134,608 14,408
(5,810,229)
$27,272,707 26,432,761
150,035
177,121 57,791
35,971,101 1,267
$26,096,068 23,397,299
68,726
48,855 7,242
44,034,607
$25,123,220 20,352,999
159,371
684,634
(53,571,566)
68,857
$21,907,704 19,241,579
83,440
239,505 24,335
9,866,238
411,764
$17,367,629 17,689,420
83,887
329,818 14,261
14,041,870
420,198
$47,114,122 $90,062,783 $93,652,797 ($7,182,485) $51,774,565 $49,947,083
$35,531,228 33,746,291
4,876 752,690 44,704
(10,151,205)
$31,027,284 29,527,197
(1,168) 420,056 43,187
34,223,485 1,108
$27,742,884 26,356,764
1,168 160,810
11,854 42,835,328
$25,688,905 24,411,834
285 197,979 25,221
(46,084,400)
55,277
$21,478,344 21,048,014
420,114 33,602
5,860,816
278,478
$16,130,744 16,363,129
155,021 6,873
10,529,166
345,750
$59,928,584 $95,241,149 $97,108,808 $4,295,101 $49,119,368 $43,530,683
continued on page 178
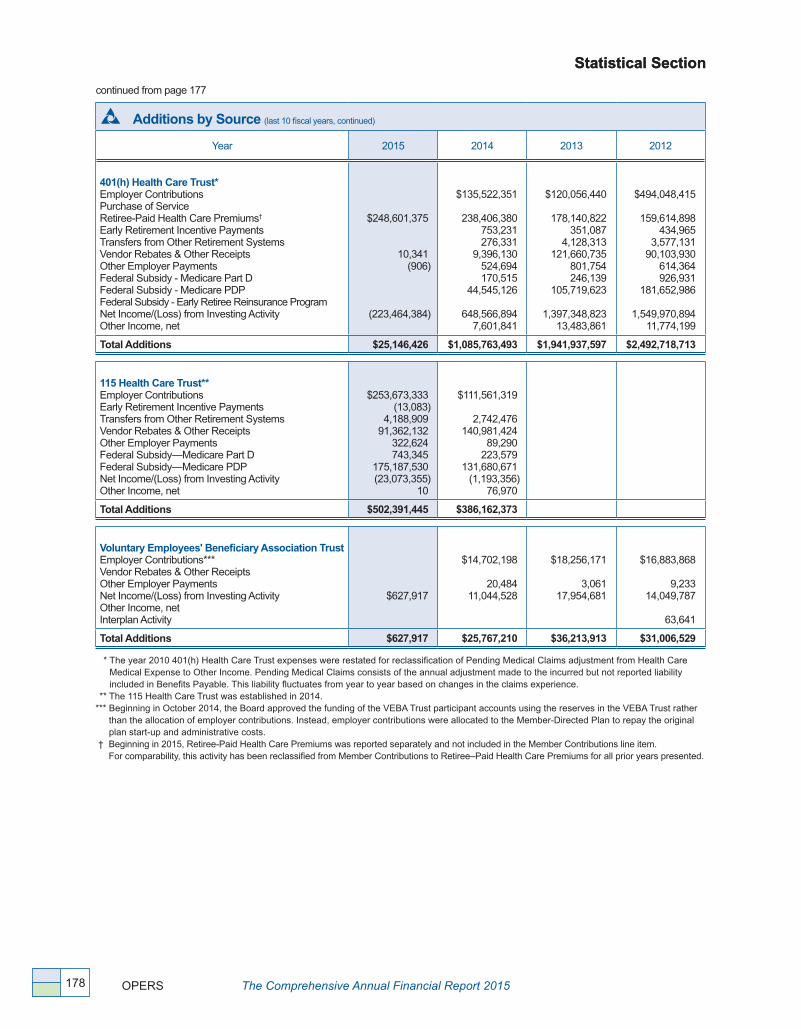
Statistical Section
OPERS The Comprehensive Annual Financial Report 2015178
Statistical Section
Additions by Source (last 10 fiscal years, continued)
Year 2015 2014 2013 2012
401(h) Health Care Trust*Employer ContributionsPurchase of ServiceRetiree-Paid Health Care Premiums†
Early Retirement Incentive PaymentsTransfers from Other Retirement SystemsVendor Rebates & Other ReceiptsOther Employer PaymentsFederal Subsidy - Medicare Part DFederal Subsidy - Medicare PDPFederal Subsidy - Early Retiree Reinsurance Program Net Income/(Loss) from Investing ActivityOther Income, net
$248,601,375
10,341 (906)
(223,464,384)
$135,522,351
238,406,380753,231 276,331
9,396,130 524,694 170,515
44,545,126
648,566,894 7,601,841
$120,056,440
178,140,822 351,087
4,128,313 121,660,735
801,754 246,139
105,719,623
1,397,348,823 13,483,861
$494,048,415
159,614,898 434,965
3,577,131 90,103,930
614,364 926,931
181,652,986
1,549,970,894 11,774,199
Total Additions $25,146,426 $1,085,763,493 $1,941,937,597 $2,492,718,713
115 Health Care Trust**Employer ContributionsEarly Retirement Incentive PaymentsTransfers from Other Retirement SystemsVendor Rebates & Other ReceiptsOther Employer PaymentsFederal Subsidy—Medicare Part DFederal Subsidy—Medicare PDPNet Income/(Loss) from Investing ActivityOther Income, net
$253,673,333(13,083)
4,188,90991,362,132
322,624743,345
175,187,530(23,073,355)
10
$111,561,319
2,742,476 140,981,424
89,290 223,579
131,680,671 (1,193,356)
76,970
Total Additions $502,391,445 $386,162,373
Voluntary Employees' Beneficiary Association Trust Employer Contributions***Vendor Rebates & Other ReceiptsOther Employer PaymentsNet Income/(Loss) from Investing ActivityOther Income, netInterplan Activity
$627,917
$14,702,198
20,484 11,044,528
$18,256,171
3,061 17,954,681
$16,883,868
9,233 14,049,787
63,641
Total Additions $627,917 $25,767,210 $36,213,913 $31,006,529
* The year 2010 401(h) Health Care Trust expenses were restated for reclassification of Pending Medical Claims adjustment from Health Care Medical Expense to Other Income� Pending Medical Claims consists of the annual adjustment made to the incurred but not reported liability included in Benefits Payable� This liability fluctuates from year to year based on changes in the claims experience�
** The 115 Health Care Trust was established in 2014�*** Beginning in October 2014, the Board approved the funding of the VEBA Trust participant accounts using the reserves in the VEBA Trust rather
than the allocation of employer contributions� Instead, employer contributions were allocated to the Member-Directed Plan to repay the original plan start-up and administrative costs�
† Beginning in 2015, Retiree-Paid Health Care Premiums was reported separately and not included in the Member Contributions line item� For comparability, this activity has been reclassified from Member Contributions to Retiree–Paid Health Care Premiums for all prior years presented�
continued from page 177
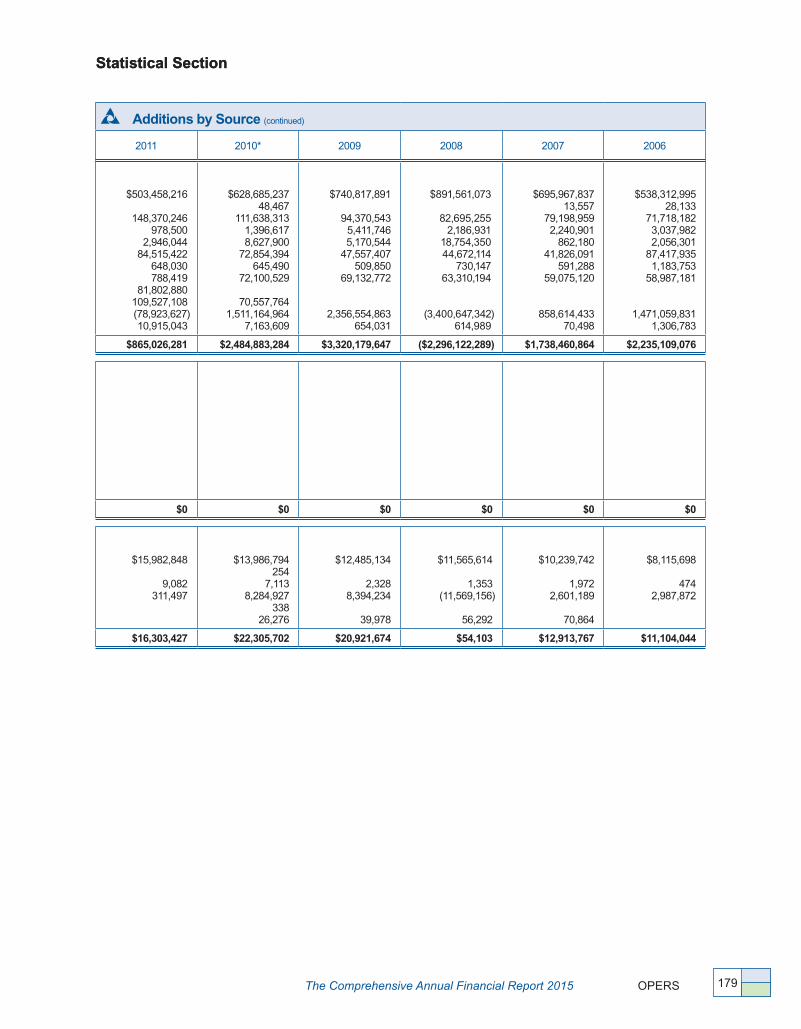
The Comprehensive Annual Financial Report 2015 OPERS
Statistical Section
179
Statistical Section
Additions by Source (continued)
2011 2010* 2009 2008 2007 2006
$503,458,216
148,370,246 978,500
2,946,044 84,515,422
648,030 788,419
81,802,880 109,527,108 (78,923,627) 10,915,043
$628,685,237 48,467
111,638,313 1,396,617 8,627,900
72,854,394 645,490
72,100,529
70,557,764 1,511,164,964
7,163,609
$740,817,891
94,370,543 5,411,746 5,170,544
47,557,407 509,850
69,132,772
2,356,554,863 654,031
$891,561,073
82,695,255 2,186,931
18,754,350 44,672,114
730,147 63,310,194
(3,400,647,342) 614,989
$695,967,837 13,557
79,198,959 2,240,901
862,180 41,826,091
591,288 59,075,120
858,614,433 70,498
$538,312,995 28,133
71,718,182 3,037,982 2,056,301
87,417,935 1,183,753
58,987,181
1,471,059,831 1,306,783
$865,026,281 $2,484,883,284 $3,320,179,647 ($2,296,122,289) $1,738,460,864 $2,235,109,076
$0 $0 $0 $0 $0 $0
$15,982,848
9,082 311,497
$13,986,794 254
7,113 8,284,927
338 26,276
$12,485,134
2,328 8,394,234
39,978
$11,565,614
1,353 (11,569,156)
56,292
$10,239,742
1,972 2,601,189
70,864
$8,115,698
474 2,987,872
$16,303,427 $22,305,702 $20,921,674 $54,103 $12,913,767 $11,104,044

Statistical Section
OPERS The Comprehensive Annual Financial Report 2015180
Statistical Section
Deductions by Type (last 10 fiscal years)
Year 2015 2014 2013 2012
All PlansPension—AnnuitiesPension—Installment PaymentsPension—OtherDisability Case Management & ExamsRefundsMedicare Part BMedical Pending Medical ClaimsPrescription DrugDentalVisionDisease ManagementAllowance Payment to Wellness RMAAllowance Payment to HRAVoluntary Employees' Beneficiary Association Trust ClaimsAdministrative ExpensesInterplan Activity
$5,390,859,2191,003,8918,647,2081,370,674
449,265,41077,867,474
940,420,011
672,710,52453,818,0279,847,9183,865,654
16,460,22845,184,6202,396,972
77,036,68419,759,373
$5,101,735,902 1,628,513 7,482,091 1,277,281
425,701,829 113,967,145 921,172,088
634,474,812 50,907,491 9,564,606 3,840,401 4,669,630
2,217,933
74,114,491 10,357,663
$4,920,408,972 1,549,139 7,913,434 1,620,162
441,284,204 112,820,822 912,071,417
551,391,403 48,106,058 9,038,035 4,535,512 4,562,351
1,719,043
68,619,091 13,034,171
$4,582,583,776 463,923
7,891,172
307,486,279 112,530,781
888,700,307
541,552,286 41,711,390 7,896,366 4,711,813
10,818,585
1,236,169 69,617,154 16,981,684
Total Deductions $7,770,513,887 $7,363,111,876 $7,098,673,814 $6,594,181,685
Traditional Pension Plan Pension—AnnuitiesPension—OtherDisability Case Management & ExamsRefundsAdministrative ExpensesInterplan Activity
$5,388,827,5618,646,4291,370,674
405,320,80049,137,053
$5,100,341,567 7,482,091 1,277,281
389,707,612 49,832,366
$4,919,439,251 7,913,434 1,620,162
411,321,700 46,946,971
$4,582,082,044 7,891,172
284,217,216 49,179,821
Total Deductions $5,853,302,517 $5,548,640,917 $5,387,241,518 $4,923,370,253
Combined Plan Pension—AnnuitiesPension—OtherPension—Installment PaymentsRefundsAdministrative ExpensesInterplan Activity
$1,255,978 779
534,358 12,577,944 2,522,610 7,141,271
$773,394
1,457,593 10,974,442 2,375,278 5,375,568
$533,920
992,085 7,731,155 2,264,293 6,085,687
$273,809
336,736 6,173,714 2,295,688 9,487,128
Total Deductions $24,032,940 $20,956,275 $17,607,140 $18,567,075
Member-Directed Plan Pension— AnnuitiesPension—Installment PaymentsRefundsAdministrative ExpensesInterplan Activity
$775,680469,533
31,366,6662,260,3066,625,358
$620,941 170,920
25,019,775 2,400,900 4,982,095
$435,801 557,054
22,231,349 2,028,864 6,948,484
$227,923 127,187
17,095,349 2,118,854 7,494,556
Total Deductions $41,497,543 $33,194,631 $32,201,552 $27,063,869

The Comprehensive Annual Financial Report 2015 OPERS
Statistical Section
181
Deductions by Type (continued)
2011 2010 2009 2008 2007 2006
$4,322,202,507 207,443
7,508,317
323,672,042 109,072,281 872,219,550
530,404,030 38,467,223 7,288,175 4,620,914
13,489,405
895,574 70,101,033 10,077,664
$3,954,057,452 246,225
7,248,345
233,054,714 107,770,173 871,299,322
526,054,523 38,978,748 7,668,138 2,557,254
13,223,453
514,332 71,030,458 10,528,250
$3,653,998,513 50,709
7,124,887
222,580,254 105,854,803 877,861,028
494,674,419
9,642,605
233,364 75,844,945 7,879,768
$3,381,914,006 41,250
6,998,605
221,300,825 103,934,337 827,135,910
441,059,097
5,016,829
128,346 74,022,980 7,470,205
$3,130,094,411 9,600
6,891,186
221,092,748 99,175,973
745,052,859 4,121,292
431,405,495
3,020,425
53,812 69,305,991 5,730,846
$2,899,824,472 1,125
7,033,516
235,136,633 92,268,184
705,427,089 6,034,535
428,140,230
12,850 65,152,774 5,286,335
$6,310,226,158 $5,844,231,387 $5,455,745,295 $5,069,022,390 $4,715,954,638 $4,444,317,743
$4,321,944,264 7,508,317
302,812,289 51,196,146
$3,953,969,116 7,248,345
219,808,143 52,375,762
$3,653,951,822 7,124,887
212,209,227 56,805,048
36,008
$3,381,864,191 6,998,605
212,802,651 53,853,085
180,426
$3,130,087,724 6,891,186
213,007,451 50,053,260
718,220
$2,899,823,920 7,033,516
228,034,617 44,854,241
703,612
$4,683,461,016 $4,233,401,366 $3,930,126,992 $3,655,698,958 $3,400,757,841 $3,180,449,906
$187,051
118,164 6,462,849 2,559,312 5,129,362
$61,125
67,241 3,540,043 2,584,673 6,043,719
$30,566
5,000 2,905,883 2,638,279 3,638,757
$11,911
3,623,723 2,990,092 4,105,870
$5,451
2,707,630 3,890,828 2,305,124
$552
1,910,107 4,510,803 2,026,194
$14,456,738 $12,296,801 $9,218,485 $10,731,596 $8,909,033 $8,447,656
$71,192 89,279
14,396,904 2,354,183 4,920,130
$27,211 178,984
9,706,528 2,435,285 4,382,873
$16,125 45,709
7,465,144 2,514,665 3,821,116
$37,904 41,250
4,874,451 2,762,484 3,183,909
$1,236 9,600
5,377,667 3,601,327 2,707,502
$1,125 5,191,909 3,882,917 2,431,876
$21,831,688 $16,730,881 $13,862,759 $10,899,998 $11,697,332 $11,507,827
Statistical Section
continued on page 182

Statistical Section
OPERS The Comprehensive Annual Financial Report 2015182
Statistical Section
Deductions by Type (last 10 fiscal years, continued)
Year 2015 2014 2013 2012
401(h) Health Care Trust* Medicare Part BMedical Pending Medical ClaimsPrescription DrugDentalVisionDisease ManagementAllowance Payment to Wellness RMAAdministrative Expenses
$77,867,474940,420,011
672,710,52453,818,0279,847,9183,865,654
16,460,22819,611,199
$113,967,145 921,172,088
634,474,812 50,907,491 9,564,606 3,840,401 4,669,630
18,329,337
$112,820,822 912,071,417
551,391,403 48,106,058 9,038,035 4,535,512 4,562,351
16,352,514
$112,530,781 888,700,307
541,552,286 41,711,390 7,896,366 4,711,813
10,818,585 15,172,174
Total Deductions $1,794,601,035 $1,756,925,510 $1,658,878,112 $1,623,093,702
115 Health Care Trust*** Allowance Payment to HRAAdministrative Expenses
$45,184,6202,174,957 $82,201
Total Deductions $47,359,577 $82,201 $0 $0
Voluntary Employees' Beneficiary Association Trust Voluntary Employees’ Beneficiary Association Trust ClaimsAdministrative ExpensesInterplan Activity
$2,396,9721,330,5595,992,744
$2,217,933 1,094,409
$1,719,043 1,026,449
$1,236,169 850,617
Total Deductions $9,720,275 $3,312,342 $2,745,492 $2,086,786
* The breakdown of medical disbursements between medical, dental, vision and disease management is not available for 2009 and prior� ** The year 2010 401(h) Health Care Trust expenses were restated for reclassification of Pending Medical Claims adjustment from Health Care
Medical Expense to Other Income� Pending Medical Claims consists of the annual adjustment made to the incurred but not reported liability included in Benefits Payable� This liability fluctuates from year to year based on changes in the claims experience�
*** The 115 Health Care Trust was established in 2014�
continued from page 181

The Comprehensive Annual Financial Report 2015 OPERS
Statistical Section
183
Statistical Section
Deductions by Type (continued)
2011 2010** 2009 2008 2007 2006
$109,072,281 872,219,550
530,404,030 38,467,223 7,288,175 4,620,914
13,489,405 13,076,814
$107,770,173 871,299,322
526,054,523 38,978,748 7,668,138 2,557,254
13,223,453 12,782,968
$105,854,803 877,861,028
494,674,419
9,642,605 13,033,595
$103,934,337 827,135,910
441,059,097
5,016,829 13,596,943
$99,175,973 745,052,859
4,121,292 431,405,495
3,020,425 10,796,417
$92,268,184 705,427,089
6,034,535 428,140,230
10,892,971
$1,588,638,392 $1,580,334,579 $1,501,066,450 $1,390,743,116 $1,293,572,461 $1,242,763,009
$0 $0 $0 $0 $0 $0
$895,574 914,578 28,172
$514,332 851,770 101,658
$233,364 853,358 383,887
$128,346 820,376
$53,812 964,159
$12,850 1,011,842
124,653
$1,838,324 $1,467,760 $1,470,609 $948,722 $1,017,971 $1,149,345

Statistical Section
OPERS The Comprehensive Annual Financial Report 2015184
Benefits by Type (last 10 fiscal years)
Year 2015 2014 2013 2012
All Plans Annuities and Installment PaymentsDisabilitiesOther Systems/Death/QEBA*SurvivorsAllowance Payment to Wellness RMAAllowance Payment to HRA
$5,836,385,1121,070,397,368
12,010,912244,014,18016,460,22845,184,620
$5,536,370,924 1,057,979,091
10,646,707 243,271,541
4,669,630
$5,278,981,628 1,040,711,575
13,550,680 237,930,114
4,562,351
$4,905,031,237 1,017,238,745
34,367,830 232,640,171 10,818,585
Total Pension Benefits and Health Care $7,224,452,420 $6,852,937,893 $6,575,736,348 $6,200,096,568
Traditional Pension Plan Pension BenefitsAge-and-Service AnnuitiesDisabilitiesOther SystemsSurvivorsAdditional AnnuitiesMoney Purchase AnnuitiesDeathQEBA*
$4,500,470,313642,937,688
503,683182,549,547
5,491,67155,385,3128,646,4292,860,021
$4,228,575,327 634,409,874
987,644 178,633,434
5,421,653 51,413,944 7,482,091 2,176,972
$4,044,320,992 624,038,549
3,534,484 174,766,735
26,011,745 46,284,146 7,913,434 2,102,762
$3,739,845,743 603,354,845 24,815,413
170,092,349 4,341,522
37,970,927 7,891,172 1,661,245
Total Pension Benefits $5,398,844,664 $5,109,100,939 $4,928,972,847 $4,589,973,216
Combined Plan Pension BenefitsAnnuitiesInstallment PaymentsDeath
$1,255,978534,358
779
$773,394 1,457,593
$533,920 992,085
$273,809 336,736
Total Pension Benefits $1,791,115 $2,230,987 $1,526,005 $610,545
Member-Directed Plan Pension BenefitsAnnuities Installment Payments
$775,680469,533
$620,941 170,920
$435,801 557,054
$227,923 127,187
Total Pension Benefits $1,245,213 $791,861 $992,855 $355,110
401(h) Health Care TrustHealth Care**AnnuitiesDisabilitiesSurvivorsAllowance Payment to Wellness RMA***
$1,269,605,295 427,459,68061,464,63316,460,228
$1,245,719,219 423,569,217 64,638,107 4,669,630
$1,158,126,842 416,673,026 63,163,379 4,562,351
$1,120,671,221 413,883,900 62,547,822 10,818,585
Total Health Care $1,774,989,836 $1,738,596,173 $1,642,525,598 $1,607,921,528
115 Health Care TrustHealth CareAllowance Payment to HRA**** $45,184,620
Total Health Care $45,184,620 $0 $0 $0
Voluntary Employees' Beneficiary Association TrustHealth CareAnnuities and Installment Payments (Claims) $2,396,972 $2,217,933 $1,719,043 $1,236,169
Total Health Care $2,396,972 $2,217,933 $1,719,043 $1,236,169
*Qualified Excess Benefit Arrangement (QEBA) commenced in 2000� ** Year 2010 401(h) Health Care Trust expenses were restated for reclassification of Pending Medical Claims adjustment from Health Care Medical
Expense to Other Income� Pending Medical Claims consists of the annual adjustment made to the incurred but not reported liability included in Benefits Payable� This liability fluctuates from year to year based on changes in the claims experience�
***Retiree Medical Account (RMA) commenced January 1, 2007� **** The 115 Health Care Trust was established and funding began in 2014� Deposits to retiree accounts and initial health care disbursements
began in October 2015, during the initial open enrollment period, for January 2016 premium reimbursements�

The Comprehensive Annual Financial Report 2015 OPERS
Statistical Section
185
Benefits by Type (continued)
2011 2010 2009 2008 2007 2006
$4,645,565,449 984,655,943 31,381,217
231,283,405 13,489,405
$4,284,704,173 982,774,343 26,785,331
222,130,665 13,223,453
$3,936,872,530 966,748,686 20,803,990
215,372,517 9,642,605
$3,612,525,198 915,061,487 25,216,043
208,408,823 5,016,829
$3,332,227,776 861,927,107 21,293,226
201,356,519 3,020,425
$3,109,822,482 815,518,857 18,413,480
194,987,182
$5,906,375,419 $5,529,617,965 $5,149,440,328 $4,766,228,380 $4,419,825,053 $4,138,742,001
$3,518,341,988 578,018,246 22,453,906
165,488,973 4,324,569
31,897,588 7,508,317 1,418,994
$3,185,230,279 556,074,897 18,490,323
159,725,674 3,432,344
29,968,936 7,248,345 1,046,663
$2,929,672,689 529,948,352 13,014,368
154,482,707 2,867,888
23,301,083 7,124,887
664,735
$2,676,785,413 509,082,328 17,565,698
149,770,901 2,537,528
25,470,583 6,998,605
651,740
$2,466,754,245 481,728,386
13,929,119 144,011,334
2,044,243 21,147,476 6,891,186
472,921
$2,274,583,165 454,254,591
11,090,453 138,952,075
1,404,610 19,249,515 7,033,516
289,511
$4,329,452,581 $3,961,217,461 $3,661,076,709 $3,388,862,796 $3,136,978,910 $2,906,857,436
$187,051 118,164
$61,125 67,241
$30,566 5,000
$11,911 $5,451 $552
$305,215 $128,366 $35,566 $11,911 $5,451 $552
$71,192 89,279
$27,211 178,984
$16,125 45,709
$37,904 41,250
$1,236 9,600 $1,125
$160,471 $206,195 $61,834 $79,154 $10,836 $1,125
$1,089,640,044 406,637,697 65,794,432 13,489,405
$1,065,223,721 426,699,446 62,404,991 13,223,453
$980,700,106 436,800,334 60,889,810 9,642,605
$907,512,263 405,979,159 58,637,922 5,016,829
$842,211,713 380,198,721 57,345,185 3,020,425
$814,570,665 361,264,266 56,035,107
$1,575,561,578 $1,567,551,611 $1,488,032,855 $1,377,146,173 $1,282,776,044 $1,231,870,038
$0 $0 $0 $0 $0 $0
$895,574 $514,332 $233,364 $128,346 $53,812 $12,850
$895,574 $514,332 $233,364 $128,346 $53,812 $12,850

Statistical Section
OPERS The Comprehensive Annual Financial Report 2015186
4.5
4.0
3.5
3.0
2.5
2.0
1.5
1.0
0.5
0
Bill
ions
Total Pension Benefits
Total Health Care Expenses
5.0
5.5
2006 2007 2008 2009 2010 2011 2012 2013 20152014
3.5
3.0
2.5
2.0
1.5
1.0
0.5
0
Bill
ions
4.0
5.0
4.5
5.5
6.0
2006 2007 2008 2009 2010 2011
Annuities
Disabilities
Survivors
Other Systems/Death/QEBA
2012 2013 2014 2015
Benefits by Type
Benefits by Type
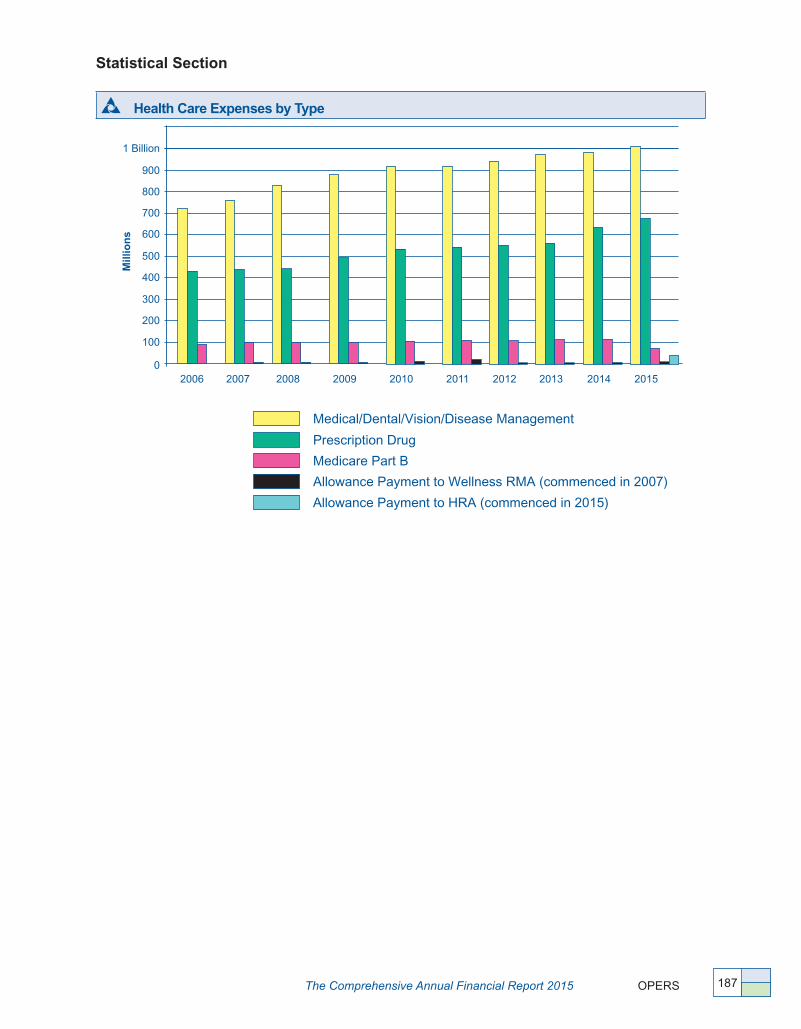
The Comprehensive Annual Financial Report 2015 OPERS
Statistical Section
187
Health Care Expenses by Type
1 Billion
900
700
800
600
400
500
200
300
100
0
Mill
ions
Medical/Dental/Vision/Disease Management
Prescription Drug
Medicare Part B
Allowance Payment to Wellness RMA (commenced in 2007)
Allowance Payment to HRA (commenced in 2015)
2006 2007 2008 2009 2010 2011 2012 20142013 2015

Statistical Section
OPERS The Comprehensive Annual Financial Report 2015188
Refunds by Type (last 10 fiscal years)
Year 2015 2014 2013 2012
All Plans SeparationBeneficiariesOther
$322,526,72025,357,397
101,381,293
$313,034,142 22,186,469 90,481,218
$299,488,361 17,577,111
124,218,732
$275,020,766 23,366,136 9,099,376
Total Refunds $449,265,410 $425,701,829 $441,284,204 $307,486,278
Traditional Pension Plan SeparationBeneficiariesOther
$279,546,17024,393,337
101,381,293
$277,494,212 21,732,182 90,481,218
$270,224,068 16,878,900
124,218,732
$252,159,989 22,957,850 9,099,376
Total Refunds $405,320,800 $389,707,612 $411,321,700 $284,217,215
Combined Plan SeparationBeneficiaries
$12,254,484323,460
$10,789,116 185,326
$7,605,803 125,352
$6,138,096 35,618
Total Refunds $12,577,944 $10,974,442 $7,731,155 $6,173,714
Member-Directed Plan SeparationBeneficiaries
$30,726,066640,600
$24,750,814 268,961
$21,658,490 572,859
$16,722,681 372,668
Total Refunds $31,366,666 $25,019,775 $22,231,349 $17,095,349
Number of Refund Payments by Plan (last 10 fiscal years) Year Traditional Pension Plan Combined Plan Member-Directed Plan Total
2015 29,454 412 998 30,864
2014 29,014 387 878 30,279
2013 25,670 378 1,071 27,119
2012 24,487 384 1,099 25,970
2011 26,686 391 893 27,970
2010 21,797 345 736 22,878
2009 21,413 389 822 22,624
2008 23,173 451 799 24,423
2007 23,679 378 739 24,796
2006 26,276 383 937 27,596
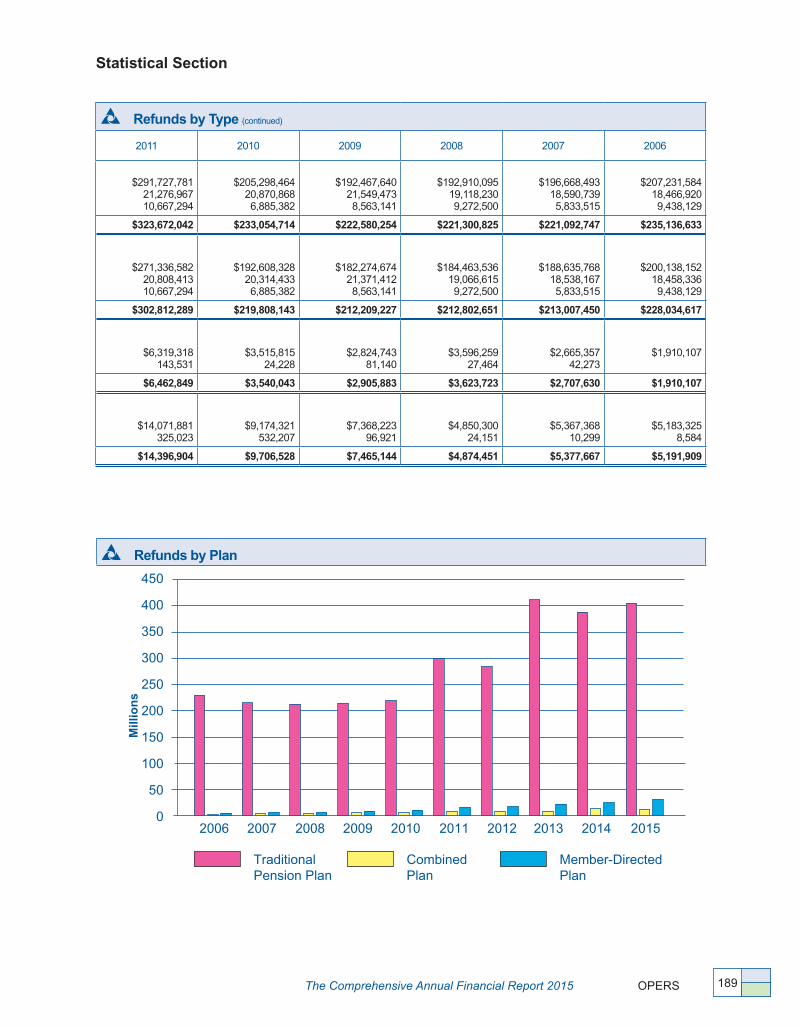
The Comprehensive Annual Financial Report 2015 OPERS
Statistical Section
189
Refunds by Type (continued)
2011 2010 2009 2008 2007 2006
$291,727,781 21,276,967 10,667,294
$205,298,464 20,870,868 6,885,382
$192,467,640 21,549,473 8,563,141
$192,910,095 19,118,230 9,272,500
$196,668,493 18,590,739 5,833,515
$207,231,584 18,466,920 9,438,129
$323,672,042 $233,054,714 $222,580,254 $221,300,825 $221,092,747 $235,136,633
$271,336,582 20,808,413 10,667,294
$192,608,328 20,314,433 6,885,382
$182,274,674 21,371,412 8,563,141
$184,463,536 19,066,615 9,272,500
$188,635,768 18,538,167 5,833,515
$200,138,152 18,458,336 9,438,129
$302,812,289 $219,808,143 $212,209,227 $212,802,651 $213,007,450 $228,034,617
$6,319,318 143,531
$3,515,815 24,228
$2,824,743 81,140
$3,596,259 27,464
$2,665,357 42,273
$1,910,107
$6,462,849 $3,540,043 $2,905,883 $3,623,723 $2,707,630 $1,910,107
$14,071,881 325,023
$9,174,321 532,207
$7,368,223 96,921
$4,850,300 24,151
$5,367,368 10,299
$5,183,325 8,584
$14,396,904 $9,706,528 $7,465,144 $4,874,451 $5,377,667 $5,191,909
0
50
200
250
150
300
100
Mill
ions
TraditionalPension Plan
CombinedPlan
Member-DirectedPlan
350
400
450
2006 2007 2008 2009 2010 2011 2012 2014 20152013
Refunds by Plan
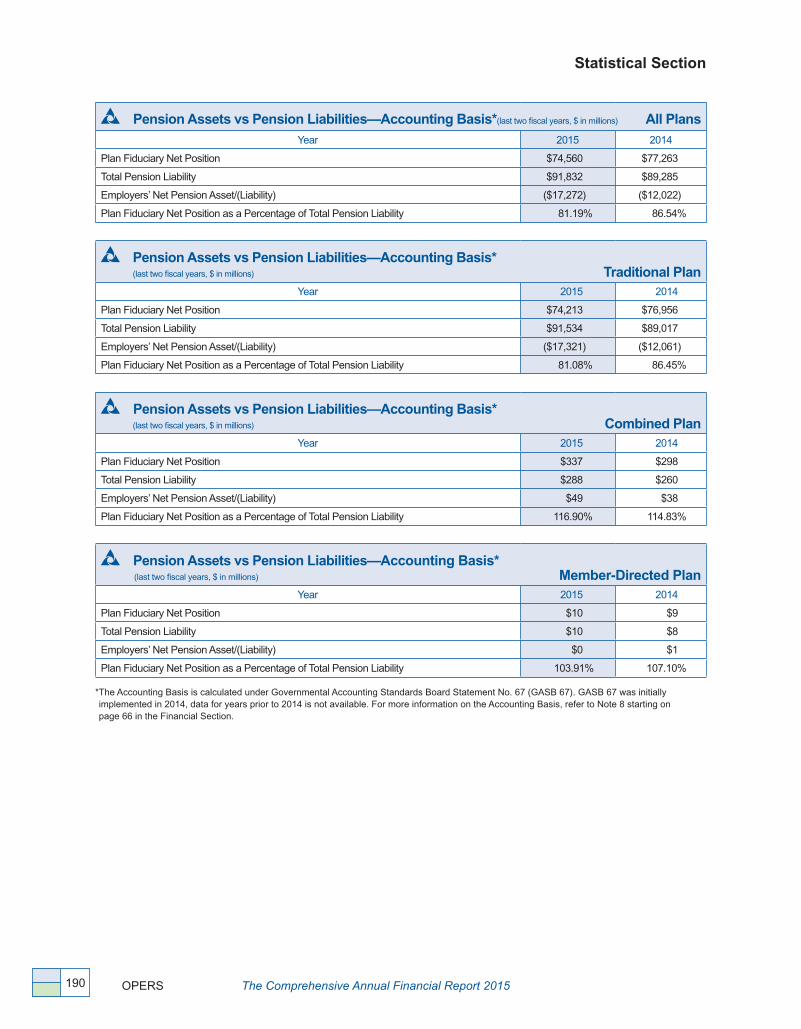
Statistical Section
OPERS The Comprehensive Annual Financial Report 2015190
Pension Assets vs Pension Liabilities—Accounting Basis*(last two fiscal years, $ in millions) All PlansYear 2015 2014
Plan Fiduciary Net Position $74,560 $77,263
Total Pension Liability $91,832 $89,285
Employers’ Net Pension Asset/(Liability) ($17,272) ($12,022)
Plan Fiduciary Net Position as a Percentage of Total Pension Liability 81�19% 86�54%
Pension Assets vs Pension Liabilities—Accounting Basis* (last two fiscal years, $ in millions) Traditional Plan
Year 2015 2014
Plan Fiduciary Net Position $74,213 $76,956
Total Pension Liability $91,534 $89,017
Employers’ Net Pension Asset/(Liability) ($17,321) ($12,061)
Plan Fiduciary Net Position as a Percentage of Total Pension Liability 81�08% 86�45%
Pension Assets vs Pension Liabilities—Accounting Basis* (last two fiscal years, $ in millions) Combined Plan
Year 2015 2014
Plan Fiduciary Net Position $337 $298
Total Pension Liability $288 $260
Employers’ Net Pension Asset/(Liability) $49 $38
Plan Fiduciary Net Position as a Percentage of Total Pension Liability 116�90% 114�83%
Pension Assets vs Pension Liabilities—Accounting Basis* (last two fiscal years, $ in millions) Member-Directed Plan
Year 2015 2014
Plan Fiduciary Net Position $10 $9
Total Pension Liability $10 $8
Employers’ Net Pension Asset/(Liability) $0 $1
Plan Fiduciary Net Position as a Percentage of Total Pension Liability 103�91% 107�10%
* The Accounting Basis is calculated under Governmental Accounting Standards Board Statement No� 67 (GASB 67)� GASB 67 was initially implemented in 2014, data for years prior to 2014 is not available� For more information on the Accounting Basis, refer to Note 8 starting on page 66 in the Financial Section�

The Comprehensive Annual Financial Report 2015 OPERS
Statistical Section
191
Pension Assets vs Pension Liabilities—Funding Basis* (last 10 fiscal years, $ in millions) All PlansYear 2015 2014 2013 2012## 2012# 2011 2010*** 2010** 2009 2008 2007 2006
Pension Assets $78,061 $74,865 $71,411 $67,855 $67,855 $65,436 $63,649 $60,600 $57,629 $55,315 $67,151 $61,296
Accrued Liabilities $91,832 $89,285 $86,645 $83,878 $87,105 $84,530 $80,485 $79,630 $76,555 $73,466 $69,734 $66,161
Unfunded Liabilities ($13,771) ($14,420) ($15,234) ($16,023) ($19,250) ($19,094) ($16,836) ($19,030) ($18,926) ($18,151) ($2,583) ($4,865)
Funded Ratio 85�00% 83�85% 82�42% 80�90% 77�90% 77�41% 79�08% 76�10% 75�28% 75�29% 96�30% 92�65%
Amortization Years 19 21 24 26 30 30 24 29 30 30 14 26
Pension Assets vs Pension Liabilities—Funding Basis* (last 10 fiscal years, $ in millions) Traditional Pension PlanYear 2015 2014 2013 2012## 2012# 2011 2010*** 2010** 2009 2008 2007 2006
Pension Assets $77,700 $74,567 $71,175 $67,670 $67,670 $65,274 $63,515 $60,461 $57,519 $55,230 $67,067 $61,235
Accrued Liabilities $91,535 $89,017 $86,407 $83,664 $86,876 $84,325 $80,307 $79,459 $76,407 $73,346 $69,639 $66,089
Unfunded Liabilities ($13,835) ($14,450) ($15,232) ($15,994) ($19,206) ($19,051) ($16,792) ($18,998) ($18,888) ($18,116) ($2,572) ($4,854)
Funded Ratio 84�89% 83�77% 82�37% 80�88% 77�89% 77�41% 79�09% 76�09% 75�28% 75�30% 96�31% 92�66%
Amortization Years 19 21 25 26 31 30 25 30 30 30 14 25
Pension Assets vs Pension Liabilities—Funding Basis* (last 10 fiscal years, $ in millions) Combined PlanYear 2015 2014 2013 2012## 2012# 2011 2010*** 2010** 2009 2008 2007 2006
Pension Assets $350 $289 $229 $183 $183 $161 $134 $138 $110 $85 $84 $61
Accrued Liabilities $288 $260 $230 $212 $226 $203 $177 $171 $148 $120 $95 $72
Unfunded Liabilities $62 $29 ($1) ($29) ($43) ($42) ($43) ($33) ($38) ($35) ($11) ($11)
Funded Ratio 121�71% 111�15% 99�57% 86�32% 80�97% 79�31% 75�71% 80�70% 74�32% 70�83% 88�42% 84�72%
Amortization Years 0 0 0 1 0 2 3 2 3 4 N/A N/A
Pension Assets vs Pension Liabilities—Funding Basis* (last eight fiscal years, $ in millions) Member-Directed AnnuitiesYear 2015 2014 2013 2012 2011 2010*** 2010** 2009 2008
Pension Assets $10�622 $8�772 $6�826 $2�524 $1�156 $0�454 $0�439 $0�206 $0�148
Accrued Liabilities $9�767 $8�291 $6�884 $2�666 $1�173 $0�496 $0�490 $0�253 $0�166
Unfunded Liabilities $0�855 $0�481 ($0�058) ($0�142) ($0�017) ($0�042) ($0�051) ($0�047) ($0�018)
Funded Ratio 108�75% 105�80% 99�16% 94�67% 98�55% 91�54% 89�63% 81�39% 88�95%
* This table presents actuarial valuation information on a Funding Basis� For more information on the Funding Basis, refer to the Actuarial Section beginning on page 137�
** Information prior to completion of the experience study� *** Information after completion of the experience study�
# Information prior to benefit changes enacted January 7, 2013�## Valuation revised to reflect benefit changes enacted January 7, 2013�
* This table presents actuarial valuation information on a Funding Basis� For more information on the Funding Basis, refer to the Actuarial Section beginning on page 137� The Member-Directed Plan commenced January 1, 2003� Actuarial data for retirement annuities not available prior to 2008�
** Information prior to completion of the experience study� *** Information after completion of the experience study�
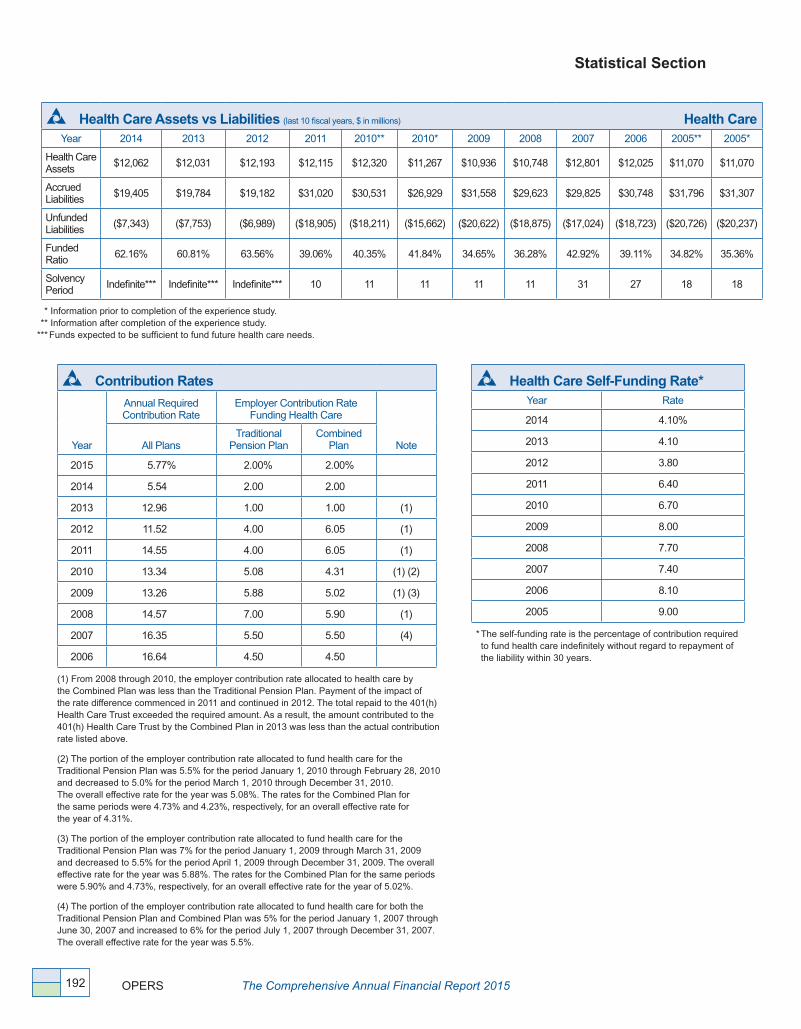
Statistical Section
OPERS The Comprehensive Annual Financial Report 2015192
Health Care Assets vs Liabilities (last 10 fiscal years, $ in millions) Health Care Year 2014 2013 2012 2011 2010** 2010* 2009 2008 2007 2006 2005** 2005*
Health Care Assets $12,062 $12,031 $12,193 $12,115 $12,320 $11,267 $10,936 $10,748 $12,801 $12,025 $11,070 $11,070
Accrued Liabilities $19,405 $19,784 $19,182 $31,020 $30,531 $26,929 $31,558 $29,623 $29,825 $30,748 $31,796 $31,307
Unfunded Liabilities ($7,343) ($7,753) ($6,989) ($18,905) ($18,211) ($15,662) ($20,622) ($18,875) ($17,024) ($18,723) ($20,726) ($20,237)
Funded Ratio 62�16% 60�81% 63�56% 39�06% 40�35% 41�84% 34�65% 36�28% 42�92% 39�11% 34�82% 35�36%
Solvency Period Indefinite*** Indefinite*** Indefinite*** 10 11 11 11 11 31 27 18 18
* Information prior to completion of the experience study� ** Information after completion of the experience study� *** Funds expected to be sufficient to fund future health care needs�
Contribution Rates
Year
Annual Required Contribution Rate
Employer Contribution Rate Funding Health Care
NoteAll PlansTraditional
Pension PlanCombined
Plan
2015 5�77% 2�00% 2�00%
2014 5�54 2�00 2�00
2013 12�96 1�00 1�00 (1)
2012 11�52 4�00 6�05 (1)
2011 14�55 4�00 6�05 (1)
2010 13�34 5�08 4�31 (1) (2)
2009 13�26 5�88 5�02 (1) (3)
2008 14�57 7�00 5�90 (1)
2007 16�35 5�50 5�50 (4)
2006 16�64 4�50 4�50
(1) From 2008 through 2010, the employer contribution rate allocated to health care by the Combined Plan was less than the Traditional Pension Plan� Payment of the impact of the rate difference commenced in 2011 and continued in 2012� The total repaid to the 401(h) Health Care Trust exceeded the required amount� As a result, the amount contributed to the 401(h) Health Care Trust by the Combined Plan in 2013 was less than the actual contribution rate listed above�
(2) The portion of the employer contribution rate allocated to fund health care for the Traditional Pension Plan was 5�5% for the period January 1, 2010 through February 28, 2010 and decreased to 5�0% for the period March 1, 2010 through December 31, 2010� The overall effective rate for the year was 5�08%� The rates for the Combined Plan for the same periods were 4�73% and 4�23%, respectively, for an overall effective rate for the year of 4�31%�
(3) The portion of the employer contribution rate allocated to fund health care for the Traditional Pension Plan was 7% for the period January 1, 2009 through March 31, 2009 and decreased to 5�5% for the period April 1, 2009 through December 31, 2009� The overall effective rate for the year was 5�88%� The rates for the Combined Plan for the same periods were 5�90% and 4�73%, respectively, for an overall effective rate for the year of 5�02%�
(4) The portion of the employer contribution rate allocated to fund health care for both the Traditional Pension Plan and Combined Plan was 5% for the period January 1, 2007 through June 30, 2007 and increased to 6% for the period July 1, 2007 through December 31, 2007� The overall effective rate for the year was 5�5%�
Health Care Self-Funding Rate*Year Rate
2014 4�10%
2013 4�10
2012 3�80
2011 6�40
2010 6�70
2009 8�00
2008 7�70
2007 7�40
2006 8�10
2005 9�00
* The self-funding rate is the percentage of contribution required to fund health care indefinitely without regard to repayment of the liability within 30 years�

The Comprehensive Annual Financial Report 2015 OPERS
Statistical Section
193
Number of Retirees/Benefit Recipients by Category
The values included in the following tables represent the number of individuals receiving benefit payments� The 2011 through 2015 counts represent retired member accounts only, regardless of the number of recipients designated by the retiree’s plan of payment� These statistics are representative of the OPERS contributing membership� Prior to 2011, the values represent the number of individuals receiving a benefit payment from OPERS, where one retiree’s account may be issued to multiple recipients or beneficiaries� Restated data for years prior to 2011 is not available�
Traditional Pension PlanYear End Annuities Disabilities Survivors Total
2015 170,411 22,230 12,570 205,211
2014 167,608 22,532 12,649 202,789
2013 160,815 22,791 12,743 196,349
2012 155,008 22,768 12,712 190,488
2011 149,598 22,476 12,802 184,876
2010 143,035 23,041 13,437 179,513
2009 135,918 22,651 13,358 171,927
2008 130,734 22,515 13,250 166,499
2007 126,002 22,108 13,232 161,342
2006 122,021 21,563 13,161 156,745
Annuities are comprised of a defined formula benefit paid to contributing members retiring with an age-and-service benefit, as well as benefit annuities paid through the Additional Annuity and Money Purchase plans (refer to the Plan Statement beginning on page 213)� Members who retired from other Ohio retirement systems may return to OPERS-covered employment under the OPERS Money Purchase plan� These members receive an annuity in accordance with that program, based on the contributions paid during the re-employment period�
The table below displays the composition of the Traditional Pension Plan Annuities by type for 2011 through 2015� The Other Annuities column represents Money Purchase and Additional Annuity plan benefits� These benefits may accrue to members whose primary retirement is with OPERS or through another Ohio retirement system (ORS retirees)�
Traditional Pension Plan Annuities
YearAge-and-Service
AnnuitiesAge-and-Service
Receiving Other Annuities
Subtotal Age-and-Service
AnnuitiesOther Annuities (ORS retirees) Total
2015 165,997 2,913 168,910 1,501 170,411
2014 163,313 2,830 166,143 1,465 167,608
2013 156,755 2,643 159,398 1,417 160,815
2012 151,765 2,112 153,877 1,131 155,008
2011 146,687 1,901 148,588 1,010 149,598

Statistical Section
OPERS The Comprehensive Annual Financial Report 2015194
Number of Retirees/Benefit Recipients by Category (continued)
The values included in the table below represent the number of retirees receiving benefit payments� Members in the Combined Plan receive an age-and-service defined formula benefit annuity from their employer contribution account, and may not elect a retirement distribution from their defined contribution account until they qualify for a defined benefit retirement� Prior to 2012, members in both the Combined Plan and Member-Directed Plan had the option to defer all or a portion of their defined contribution account, elect to purchase an annuity, or elect to receive installment payments from the defined contribution account� Effective April 1, 2012, the installment payment options were eliminated and new retirees may elect to purchase an annuity, transfer their defined contribution account to another financial institution, or refund their account (refer to the Plan Statement beginning on page 213)�
Combined Plan*
Year EndAge-and-Service
AnnuitiesAnnuitized DC
Accounts Installment PaymentsLiquidated or Deferred DC
Accounts**Number
of Retirees
2015 196 128 7 196
2014 156 99 7 156
2013 100 64 7 1 100
2012 55 37 13 5 55
2011 36 22 13 1 36
2010 21 13 7 1 21
2009 9 6 3 9
2008 7 5 2 7
2007 2 2 2
2006 1 1 1
* As of April 1, 2012, no member had elected a combination annuity and installment payment benefit distribution since commencement of the plan January 1, 2003� Retirements effective on or after April 1, 2012 no longer have this option�
** Beginning in 2013, the number of members receiving a defined benefit age-and-service benefit will not equal the number of members receiving a defined contribution benefit� The defined contribution options of transferring the defined contribution account to another financial institution or refunding the account are recorded in the OPERS systems as refund transactions� These specific types of refunds cannot be segregated from withdrawal from service refunds�
Member-Directed Plan*Year End Annuities Installment Payments Total
2015 185 9 194
2014 154 13 167
2013 131 14 145
2012 62 16 78
2011 38 15 53
2010 18 13 31
2009 9 10 19
2008 5 5 10
2007 2 2 4
2006 1 1 2
* As of April 1, 2012, no member had elected a combination annuity and installment payment benefit distribution since commencement of the plan on January 1, 2003� Retirements effective on or after April 1, 2012 no longer have this option�

The Comprehensive Annual Financial Report 2015 OPERS
Statistical Section
195
Number of Covered Lives by Category
The values included in the tables below represent the number of lives covered by OPERS health care plans� The 2010 through 2015 counts for the Health Care Plans table reflect the number of retirees and primary beneficiaries, and the number of additional dependents and other beneficiaries receiving coverage� In addition to a retiree, a primary benefit recipient could be a survivor of a deceased retiree continuing to receive coverage on the member’s account� The values in this column are representative of OPERS contributing membership, while Dependents and Other Beneficiaries represents other family members receiving primarily dental and vision coverage through a member’s account� Corresponding data for years prior to 2010 is not available� These counts represent all Traditional Pension Plan and Combined Plan retirees, dependents, and beneficiaries receiving post-employment health care coverage�
Health Care Plans
Year EndNumber of Retirees and Primary Beneficiaries
Number of Dependents and Other Beneficiaries Total Covered Lives
2015 170,687 52,110 222,797
2014 167,327 58,692 226,019
2013 165,967 61,041 227,008
2012 163,940 62,456 226,396
2011 161,315 62,507 223,822
2010 157,269 60,624 217,893
2009 N/A N/A 213,220
2008 N/A N/A 208,857
2007 N/A N/A 204,514
2006 N/A N/A 200,494
The Member-Directed Plan Retiree Medical Account (RMA) is an account in the member’s name that can be used to pay qualified medical expenses for Member-Directed Plan retirees and eligible family members� Funding for the RMA is accumulated in a Voluntary Employees’ Beneficiary Association Trust�
Member-Directed Plan Retiree Medical Accounts Year End Total Covered Lives
2015 4,063
2014 3,509
2013 3,112
2012 2,589
2011 2,073
2010 1,577
2009 1,260
2008 365
2007 176
2006 293

Statistical Section
OPERS The Comprehensive Annual Financial Report 2015196
Schedule of Retirees by Benefit Type and Amount
The values included in the following tables represent the number of retired members receiving benefits� Other Annuities represents Money Purchase and Additional Annuity plan benefits� These benefits may accrue to members whose primary retirement is with OPERS or with another Ohio retirement system (ORS retirees)�
Traditional Pension Plan (as of December 2015)
Amount of Monthly Benefit
Age-and- Service
Annuities
Age-and-Service Receiving Other
Annuities
Subtotal Age-and-Service
Annuities Disabilities SurvivorsOther Annuities (ORS retirees)
Total Retirees
$1-299 12,342 1,709 14,051 58 646 611 15,366 $300-499 9,031 465 9,496 139 1,950 270 11,855 $500-999 23,602 443 24,045 1,179 4,324 353 29,901
$1,000-1,499 21,583 148 21,731 3,128 2,596 152 27,607 $1,500-1,999 18,708 74 18,782 4,725 1,319 72 24,898 $2,000 & Over 80,731 74 80,805 13,001 1,735 43 95,584
Totals 165,997 2,913 168,910 22,230 12,570 1,501 205,211
Effective April 1, 2012, members electing to retire in the Combined Plan and Member-Directed Plan have the option to use their defined contribution accounts to purchase a defined benefit annuity, to transfer their defined contribution account to another financial institution, or to receive a refund of their defined contribution account� Prior to April 1, 2012, these members also had the option to draw on their defined contribution account under an installment payment plan� The installment payment option is still effective for members who retired prior to April 1, 2012�
Combined Plan members are also eligible for a defined formula benefit from their employer contributions� The Employer Age-and-Service Annuities column represents members receiving a formula benefit� Members may receive payments of their defined contribution accounts under the methods described above� For those members who retired prior to April 1, 2012, only installment payments with a remaining account balance are counted�
Combined Plan (as of December 2015)
Amount of Monthly Benefit
Employer Age-and-Service Annuities
Annuitized DC Accounts
DC Installment Payments
$1-299 116 85$300-499 52 34$500-999 28 7
$1,000-1,499 1$1,500-1,999 1$2,000 & Over
Various 7Totals 196 128 7
The Member-Directed Plan table displays the distribution of members electing either a defined benefit annuity or an installment payment option� For those members who retired prior to April 1, 2012, only installment payments with a remaining account balance are counted�
Member-Directed Plan (as of December 2015)
Amount of Monthly Benefit Annuitized DC Accounts
DC Installment Payments Total Retirees
$1-299 92 92$300-499 50 50$500-999 31 31
$1,000-1,499 10 10$1,500-1,999 0$2,000 & Over 2 2
Various 9 9Totals 185 9 194
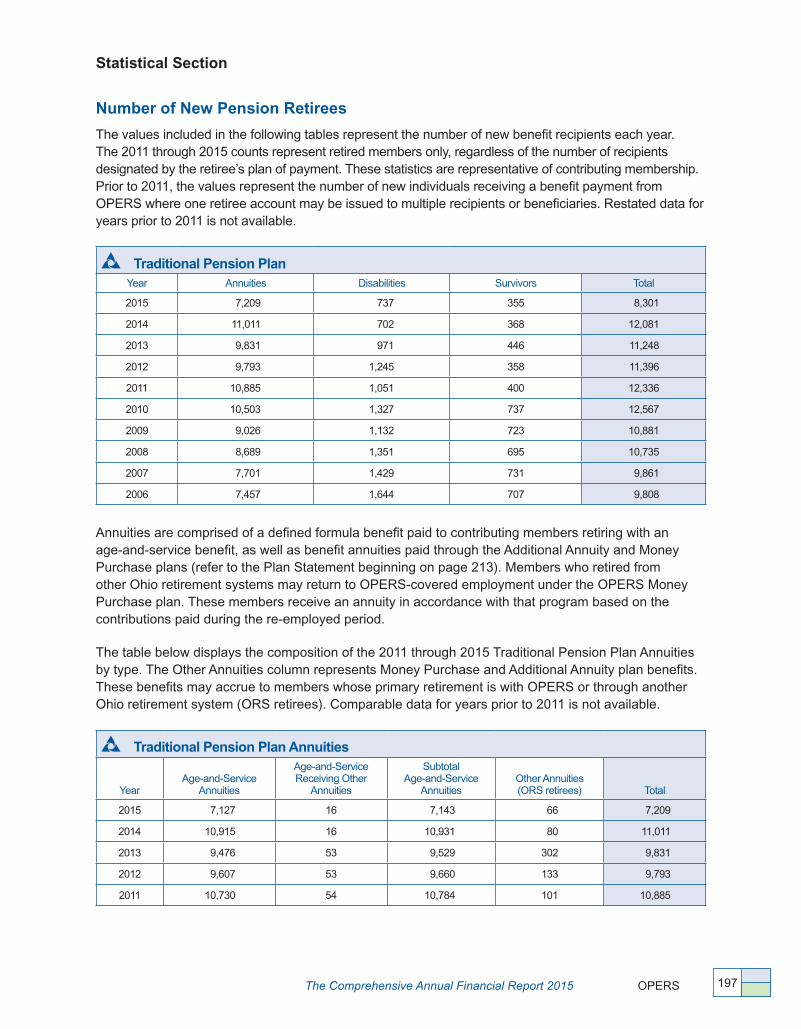
The Comprehensive Annual Financial Report 2015 OPERS
Statistical Section
197
Number of New Pension Retirees
The values included in the following tables represent the number of new benefit recipients each year� The 2011 through 2015 counts represent retired members only, regardless of the number of recipients designated by the retiree’s plan of payment� These statistics are representative of contributing membership� Prior to 2011, the values represent the number of new individuals receiving a benefit payment from OPERS where one retiree account may be issued to multiple recipients or beneficiaries� Restated data for years prior to 2011 is not available�
Traditional Pension PlanYear Annuities Disabilities Survivors Total
2015 7,209 737 355 8,301
2014 11,011 702 368 12,081
2013 9,831 971 446 11,248
2012 9,793 1,245 358 11,396
2011 10,885 1,051 400 12,336
2010 10,503 1,327 737 12,567
2009 9,026 1,132 723 10,881
2008 8,689 1,351 695 10,735
2007 7,701 1,429 731 9,861
2006 7,457 1,644 707 9,808
Annuities are comprised of a defined formula benefit paid to contributing members retiring with an age-and-service benefit, as well as benefit annuities paid through the Additional Annuity and Money Purchase plans (refer to the Plan Statement beginning on page 213)� Members who retired from other Ohio retirement systems may return to OPERS-covered employment under the OPERS Money Purchase plan� These members receive an annuity in accordance with that program based on the contributions paid during the re-employed period�
The table below displays the composition of the 2011 through 2015 Traditional Pension Plan Annuities by type� The Other Annuities column represents Money Purchase and Additional Annuity plan benefits� These benefits may accrue to members whose primary retirement is with OPERS or through another Ohio retirement system (ORS retirees)� Comparable data for years prior to 2011 is not available�
Traditional Pension Plan Annuities
YearAge-and-Service
Annuities
Age-and-Service Receiving Other
Annuities
Subtotal Age-and-Service
AnnuitiesOther Annuities (ORS retirees) Total
2015 7,127 16 7,143 66 7,209
2014 10,915 16 10,931 80 11,011
2013 9,476 53 9,529 302 9,831
2012 9,607 53 9,660 133 9,793
2011 10,730 54 10,784 101 10,885
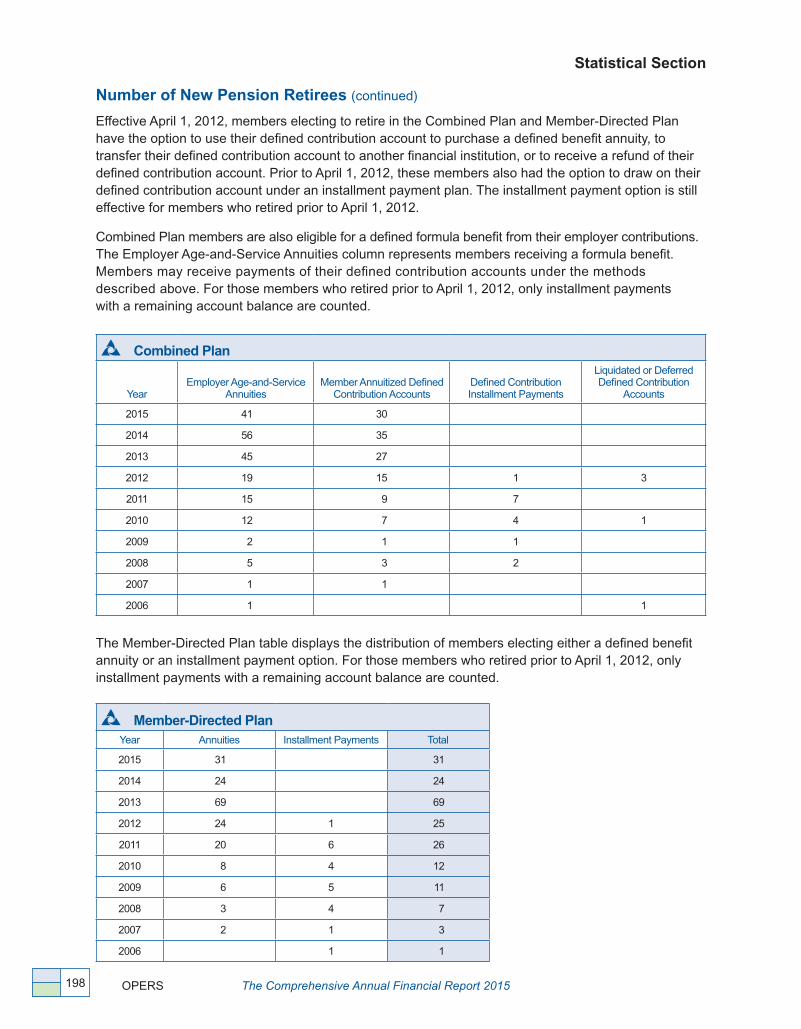
Statistical Section
OPERS The Comprehensive Annual Financial Report 2015198
Number of New Pension Retirees (continued)
Effective April 1, 2012, members electing to retire in the Combined Plan and Member-Directed Plan have the option to use their defined contribution account to purchase a defined benefit annuity, to transfer their defined contribution account to another financial institution, or to receive a refund of their defined contribution account� Prior to April 1, 2012, these members also had the option to draw on their defined contribution account under an installment payment plan� The installment payment option is still effective for members who retired prior to April 1, 2012�
Combined Plan members are also eligible for a defined formula benefit from their employer contributions� The Employer Age-and-Service Annuities column represents members receiving a formula benefit� Members may receive payments of their defined contribution accounts under the methods described above� For those members who retired prior to April 1, 2012, only installment payments with a remaining account balance are counted�
Combined Plan
YearEmployer Age-and-Service
AnnuitiesMember Annuitized Defined
Contribution AccountsDefined Contribution Installment Payments
Liquidated or Deferred Defined Contribution
Accounts
2015 41 30
2014 56 35
2013 45 27
2012 19 15 1 3
2011 15 9 7
2010 12 7 4 1
2009 2 1 1
2008 5 3 2
2007 1 1
2006 1 1
The Member-Directed Plan table displays the distribution of members electing either a defined benefit annuity or an installment payment option� For those members who retired prior to April 1, 2012, only installment payments with a remaining account balance are counted�
Member-Directed PlanYear Annuities Installment Payments Total
2015 31 31
2014 24 24
2013 69 69
2012 24 1 25
2011 20 6 26
2010 8 4 12
2009 6 5 11
2008 3 4 7
2007 2 1 3
2006 1 1

The Comprehensive Annual Financial Report 2015 OPERS
Statistical Section
199
Schedule of Average Benefits
This schedule displays the number of new retirees each year, grouped by years of credited service� Prior year numbers are not adjusted as members roll off the rolls� Retirement benefits are calculated based on the final average salary (FAS) of the member, representing the member’s three (or five) highest years of earnings (refer to the Plan Statement beginning on page 213 for benefit eligibility requirements)� The Average Final Average Salary represents a composite for each group�
The 2011 through 2015 statistics include members with less than five years of service� Comparable data for years prior to 2011 is not available� The Total New Retirees column represents the average monthly benefit and average FAS for the retiree counts listed in each year�
Schedule of Average Benefits* (last 10 fiscal years) Traditional Pension Plan
Retirement Effective Dates
Years Credited Service
0-4 5-9 10-14 15-19 20-24 25-30 30+Total New Retirees
2015
Average Monthly BenefitAverage Final Average SalaryNumber of Active Recipients
$301$9,347
180
$573$33,258
907
$865$37,596
1,165
$1,248 $42,780
967
$1,816$50,311
1,183
$2,413$56,473
1,247
$3,464$64,158
2,586
$2,053$50,136
8,235
2014
Average Monthly BenefitAverage Final Average SalaryNumber of Active Recipients
$289 $9,637
163
$560 $31,679
926
$832 $39,122
2,341
$1,218 $43,897
1,964
$1,787 $49,666
1,451
$2,370 $55,301
2,044
$3,282 $61,233
3,112
$1,880 $48,693 12,001
2013
Average Monthly BenefitAverage Final Average SalaryNumber of Active Recipients
$310 $9,762
167
$555 $30,394
1,030
$879 $38,438
1,747
$1,271 $43,362
1,413
$1,823 $48,627
1,495
$2,362 $54,957
1,810
$3,402 $61,752
3,284
$2,021 $48,997 10,946
2012
Average Monthly BenefitAverage Final Average SalaryNumber of Active Recipients
$236 $7,385
146
$668 $31,007
1,035
$904 $37,923
1,677
$1,323 $43,991
1,353
$1,824 $47,969
1,544
$2,361 $54,624
1,761
$3,309 $60,927
3,747
$2,078 $49,262 11,263
2011
Average Monthly BenefitAverage Final Average SalaryNumber of Active Recipients
$309 $10,126
156
$606 $30,676
962
$897 $37,732
1,569
$1,320 $43,790
1,410
$1,857 $49,365
1,518
$2,361 $55,207
1,786
$3,270 $60,228
4,834
$2,186 $50,406 12,235
2010
Average Monthly BenefitAverage Final Average SalaryNumber of Active Recipients
$684$30,128
806
$893$36,592
1,460
$1,216$41,616
1,203
$1,623$45,312
1,249
$2,218$51,264
1,493
$3,315$58,633
4,396
$2,190 $48,897 10,607
2009
Average Monthly BenefitAverage Final Average SalaryNumber of Active Recipients
$670$30,925
801
$901$37,211
1,435
$1,217$42,333
1,111
$1,608$45,453
1,205
$2,195$51,770
1,389
$3,263$57,750
4,898
$2,228$49,335 10,839
2008
Average Monthly BenefitAverage Final Average SalaryNumber of Active Recipients
$658$28,690
784
$803$34,193
1,360
$1,102$39,625
1,012
$1,491$43,193
1,066
$2,140$49,965
1,268
$3,006$55,247
3,750
$1,980$46,068
9,240
2007
*** Average Monthly Benefit
Average Final Average SalaryNumber of Active Recipients**
$767$31,477
852
$816$34,991
1,558
$1,099$40,020
1,165
$1,519$44,015
1,131
$2,063$48,653
1,240
$2,977$54,941
3,787
$1,927$45,837
9,733
2006
*** Average Monthly Benefit
Average Final Average SalaryNumber of Active Recipients**
$732$28,771
606
$688$30,409
1,349
$1,015$37,248
986
$1,406$40,359
993
$1,994$46,316
1,383
$2,871$52,998
3,198
$1,845$43,312
8,515
* All years begin January 1 and end December 31� ** Number of Active Recipients restated to include retirements initiated in prior years that are finalized in reported year� *** Values restated to remove Combined Plan formula benefit information�

Statistical Section
OPERS The Comprehensive Annual Financial Report 2015200
Schedule of Average Benefits (continued)
Schedule of Average Benefits* (last 10 fiscal years) Combined Plan
Retirement Effective Dates
Years Credited Service
0-4 5-9 10-14 15-19 20-24Total New Retirees
2015
Average Monthly BenefitAverage Final Average SalaryNumber of Active Recipients
$5$1,933
1
$272$54,371
15
$382$48,705
21
$370$35,431
4
$331$48,342
41
2014
Average Monthly BenefitAverage Final Average SalaryNumber of Active Recipients
$274$45,794
10
$346$45,889
42
$363$48,167
3
$270$15,897
1
$332$45,458
56
2013
Average Monthly BenefitAverage Final Average SalaryNumber of Active Recipients
$211$41,043
27
$300$41,121
18
$247$41,074
45
2012
Average Monthly BenefitAverage Final Average SalaryNumber of Active Recipients
$255$48,341
9
$263$39,064
10
$259$43,459
19
2011
Average Monthly BenefitAverage Final Average SalaryNumber of Active Recipients
$237$49,177
12
$454$75,127
3
$281$54,367
15
2010
Average Monthly BenefitAverage Final Average SalaryNumber of Active Recipients
$229$61,819
7
$217$33,958
4
$225 $51,688
11
2009
Average Monthly BenefitAverage Final Average SalaryNumber of Active Recipients
$212$54,215
1
$232$42,062
1
$222 $48,139
2
2008
Average Monthly BenefitAverage Final Average SalaryNumber of Active Recipients
$95$25,665
3
$85$21,305
2
$91$23,921
5
2007
Average Monthly BenefitAverage Final Average SalaryNumber of Active Recipients
$152$37,369
1
$152$37,369
1
2006
Average Monthly BenefitAverage Final Average SalaryNumber of Active Recipients
$118$50,116
1
$118$50,116
1
* All years begin January 1 and end December 31�
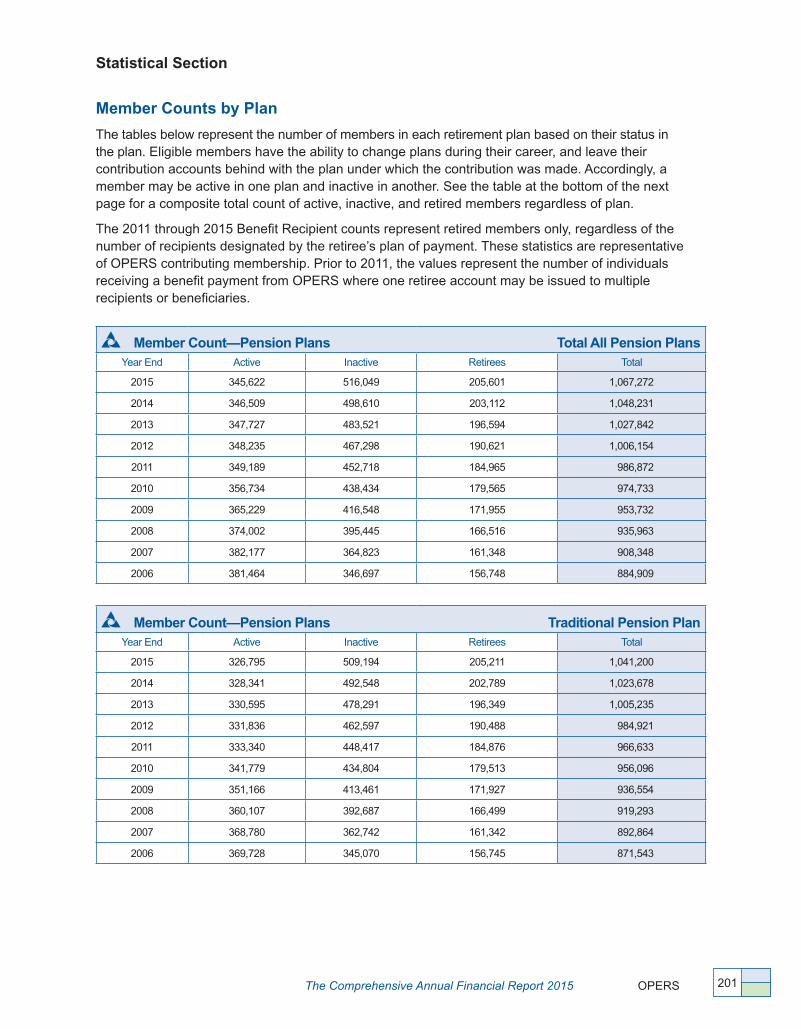
The Comprehensive Annual Financial Report 2015 OPERS
Statistical Section
201
Member Counts by Plan
The tables below represent the number of members in each retirement plan based on their status in the plan� Eligible members have the ability to change plans during their career, and leave their contribution accounts behind with the plan under which the contribution was made� Accordingly, a member may be active in one plan and inactive in another� See the table at the bottom of the next page for a composite total count of active, inactive, and retired members regardless of plan�
The 2011 through 2015 Benefit Recipient counts represent retired members only, regardless of the number of recipients designated by the retiree’s plan of payment� These statistics are representative of OPERS contributing membership� Prior to 2011, the values represent the number of individuals receiving a benefit payment from OPERS where one retiree account may be issued to multiple recipients or beneficiaries�
Member Count—Pension Plans Total All Pension PlansYear End Active Inactive Retirees Total
2015 345,622 516,049 205,601 1,067,272
2014 346,509 498,610 203,112 1,048,231
2013 347,727 483,521 196,594 1,027,842
2012 348,235 467,298 190,621 1,006,154
2011 349,189 452,718 184,965 986,872
2010 356,734 438,434 179,565 974,733
2009 365,229 416,548 171,955 953,732
2008 374,002 395,445 166,516 935,963
2007 382,177 364,823 161,348 908,348
2006 381,464 346,697 156,748 884,909
Member Count—Pension Plans Traditional Pension PlanYear End Active Inactive Retirees Total
2015 326,795 509,194 205,211 1,041,200
2014 328,341 492,548 202,789 1,023,678
2013 330,595 478,291 196,349 1,005,235
2012 331,836 462,597 190,488 984,921
2011 333,340 448,417 184,876 966,633
2010 341,779 434,804 179,513 956,096
2009 351,166 413,461 171,927 936,554
2008 360,107 392,687 166,499 919,293
2007 368,780 362,742 161,342 892,864
2006 369,728 345,070 156,745 871,543
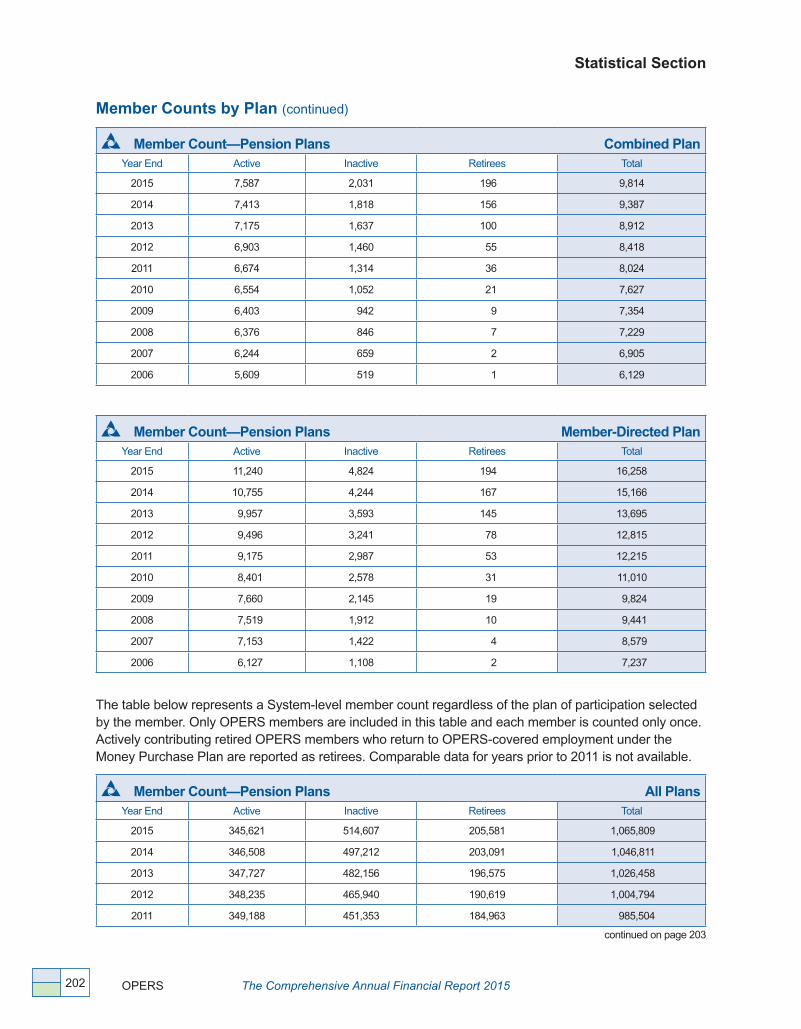
Statistical Section
OPERS The Comprehensive Annual Financial Report 2015202
Member Counts by Plan (continued)
Member Count—Pension Plans Combined PlanYear End Active Inactive Retirees Total
2015 7,587 2,031 196 9,814
2014 7,413 1,818 156 9,387
2013 7,175 1,637 100 8,912
2012 6,903 1,460 55 8,418
2011 6,674 1,314 36 8,024
2010 6,554 1,052 21 7,627
2009 6,403 942 9 7,354
2008 6,376 846 7 7,229
2007 6,244 659 2 6,905
2006 5,609 519 1 6,129
Member Count—Pension Plans Member-Directed PlanYear End Active Inactive Retirees Total
2015 11,240 4,824 194 16,258
2014 10,755 4,244 167 15,166
2013 9,957 3,593 145 13,695
2012 9,496 3,241 78 12,815
2011 9,175 2,987 53 12,215
2010 8,401 2,578 31 11,010
2009 7,660 2,145 19 9,824
2008 7,519 1,912 10 9,441
2007 7,153 1,422 4 8,579
2006 6,127 1,108 2 7,237
The table below represents a System-level member count regardless of the plan of participation selected by the member� Only OPERS members are included in this table and each member is counted only once� Actively contributing retired OPERS members who return to OPERS-covered employment under the Money Purchase Plan are reported as retirees� Comparable data for years prior to 2011 is not available�
Member Count—Pension Plans All PlansYear End Active Inactive Retirees Total
2015 345,621 514,607 205,581 1,065,809
2014 346,508 497,212 203,091 1,046,811
2013 347,727 482,156 196,575 1,026,458
2012 348,235 465,940 190,619 1,004,794
2011 349,188 451,353 184,963 985,504
continued on page 203

The Comprehensive Annual Financial Report 2015 OPERS
Statistical Section
203
Member Counts by Plan (continued from page 202)
The values included in the tables below represent the number of individuals covered by the OPERS health care plans� The 2010 through 2015 401(h) Health Care Trust counts reflect the number of retirees and primary beneficiaries only� In addition to a retiree, a primary benefit recipient could be a survivor of a deceased retiree continuing to receive coverage on the member’s account, which is representative of the OPERS contributing membership� Dependents and Other Beneficiaries, primarily receiving dental and vision coverage, is shown separately for 2010 through 2015� Corresponding data for years prior to 2010 is not available�
The new 115 Health Care Trust created in 2014 is not included in the tables below as the OPERS Medicare Connector program, funded by the 115 Health Care Trust, participants were eligible for allocations beginning January 1, 2016, and the covered lives were already included in the 401(h) Health Care Trust table�
The VEBA Trust funds a retiree medical account for members in the Member-Directed Plan� Contributions are paid into the trust during the member’s career for use after retirement� The account is in the member’s name and can only be used by the member to pay qualified medical expenses for the retiree and eligible family members� (Refer to the Plan Statement beginning on page 213�)
Member Count—Health Care Plans Total All Health Care Plans
Year End Active Inactive Retirees & Primary Beneficiaries
Dependents & Other Beneficiaries Total
2015 11,235 4,764 174,750 52,110 242,859
2014 10,745 4,194 170,836 58,692 244,467
2013 9,962 3,543 169,079 61,041 243,625
2012 9,501 3,189 166,529 62,456 241,675
2011 9,170 2,918 163,388 62,507 237,983
2010 8,392 2,574 158,846 60,624 230,436
2009 7,660 2,126 214,480 224,266
2008 7,520 1,886 209,222 218,628
2007 6,942 1,440 204,690 213,072
2006 5,742 1,122 200,787 207,651
Member Count—Health Care Plans 401(h) Health Care Trust
Year End Active InactiveRetirees & Primary
Beneficiaries*Dependents & Other
Beneficiaries* Total
2015 N/A N/A 170,687 52,110 222,797
2014 N/A N/A 167,327 58,692 226,019
2013 N/A N/A 165,967 61,041 227,008
2012 N/A N/A 163,940 62,456 226,396
2011 N/A N/A 161,315 62,507 223,822
2010 N/A N/A 157,269 60,624 217,893
2009 N/A N/A 213,220 213,220
2008 N/A N/A 208,857 208,857
2007 N/A N/A 204,514 204,514
2006 N/A N/A 200,494 200,494
* Prior to 2010, Retirees & Primary Beneficiaries was defined as the total number of covered lives�continued on page 204
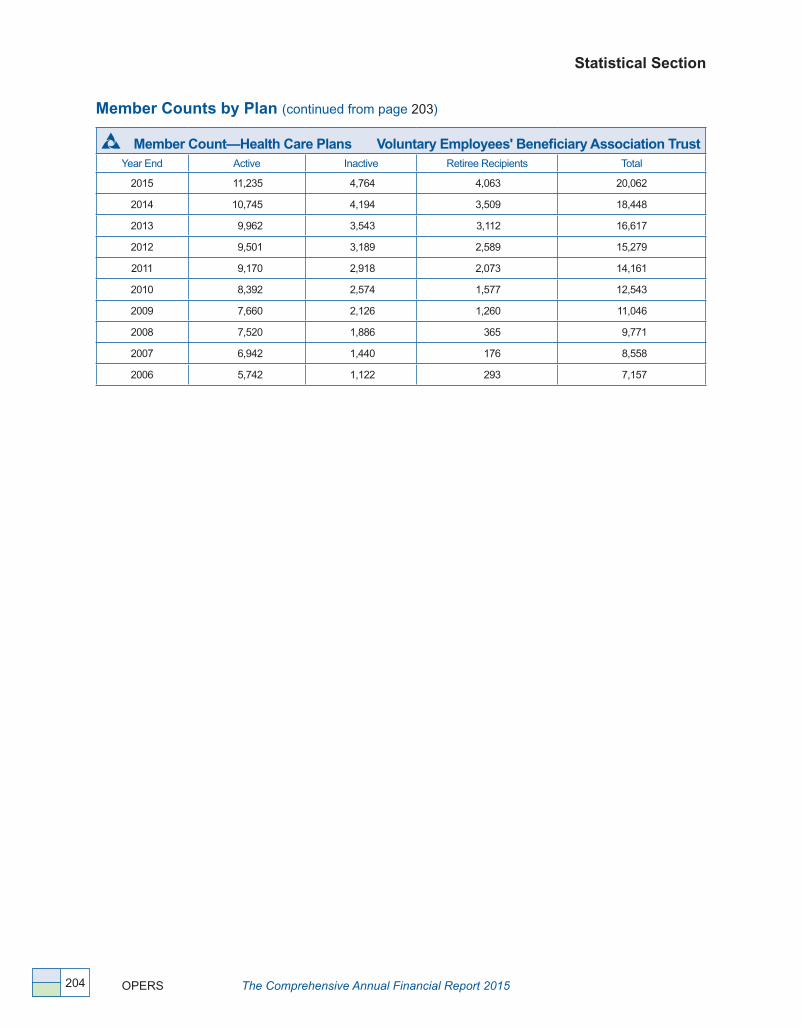
Statistical Section
OPERS The Comprehensive Annual Financial Report 2015204
Member Counts by Plan (continued from page 203)
Member Count—Health Care Plans Voluntary Employees' Beneficiary Association TrustYear End Active Inactive Retiree Recipients Total
2015 11,235 4,764 4,063 20,062
2014 10,745 4,194 3,509 18,448
2013 9,962 3,543 3,112 16,617
2012 9,501 3,189 2,589 15,279
2011 9,170 2,918 2,073 14,161
2010 8,392 2,574 1,577 12,543
2009 7,660 2,126 1,260 11,046
2008 7,520 1,886 365 9,771
2007 6,942 1,440 176 8,558
2006 5,742 1,122 293 7,157
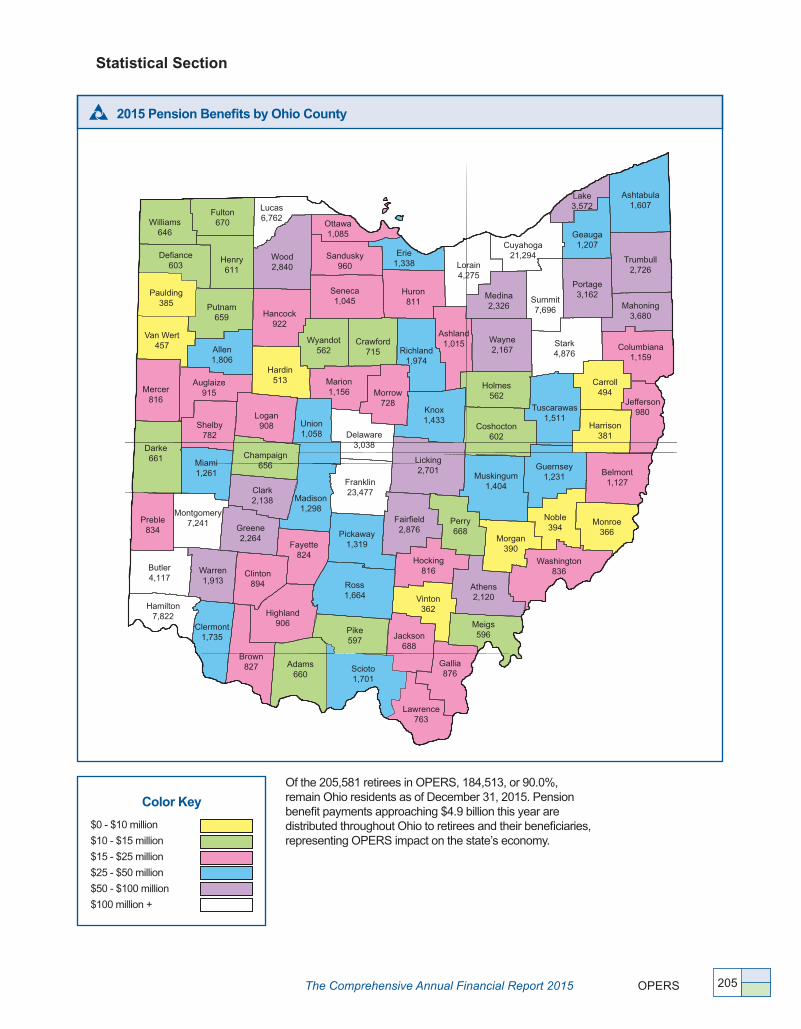
The Comprehensive Annual Financial Report 2015 OPERS
Statistical Section
205
2015 Pension Benefits by Ohio County
Color Key
$0 - $10 million
$10 - $15 million
$15 - $25 million
$25 - $50 million
$50 - $100 million
$100 million +
Of the 205,581 retirees in OPERS, 184,513, or 90�0%, remain Ohio residents as of December 31, 2015� Pension benefit payments approaching $4�9 billion this year are distributed throughout Ohio to retirees and their beneficiaries, representing OPERS impact on the state’s economy�
Williams646
Fulton670
Lucas6,762
Wood2,840
Henry611
Defiance603
Paulding385 Putnam
659 Hancock922
Allen1,806
Van Wert457
Ottawa1,085
Sandusky960
Seneca1,045
Erie1,338
Huron811
Wyandot562
Crawford715
Hardin513Auglaize
915Mercer816
Shelby782
Logan908
Marion1,156
Union1,058
Champaign656Miami
1,261
Darke661
Delaware3,038
Morrow728
Knox1,433
Richland1,974
Ashland1,015 Wayne
2,167
Holmes562
Coshocton602
Licking2,701
Muskingum1,404
Guernsey1,231
Tuscarawas1,511
Medina2,326
Summit 7,696
Stark4,876
Portage3,162
Cuyahoga21,294
Lorain4,275
Geauga1,207
Trumbull2,726
Lake Ashtabula1,607
Mahoning3,680
Columbiana1,159
Carroll494
Jefferson980
Harrison381
1,127
Monroe366
Noble394
Morgan390
Washington836
Perry668
Franklin23,477
Pickaway1,319
Madison1,298
Clark2,138
Greene2,264
Fayette824
Ross1,664
Hocking816
Athens2,120
Highland906
Vinton362
Montgomery7,241Preble
834
Butler4,117
Warren1,913
Clinton894
Brown827 Adams
660
Hamilton7,822
Clermont1,735
Scioto1,701
Gallia876
Lawrence763
Fairfield2,876
Meigs596Jackson
688
Pike597
3,572

Statistical Section
OPERS The Comprehensive Annual Financial Report 2015206
WA202
OR144
CA679
NV328
ID34
MT44
WY24
UT81
ND7
SD44
CO305
AZ1,005 NM
147
TX775
OK78
KS69
NE21
MN89
IA47
MO155
AR89
LA82
MS118
WI113
MI958
IL311
IN929
OH184,513
NY213
PA576
KY1,315
TN798
AL320
GA783
SC966
NC1,088
VA450
FL6,362
ME71VT
32
NH25
MA105
RI18CT59
NJ94
DE42MD
215DC35
WV444
AK22
HI41
Retirees by Geographical Location (as of December 31, 2015)
Retirees by State
Armed Forces—Europe ���������3Armed Forces—Pacific ���������1Australia ���������������������������������2Austria �����������������������������������1Bulgaria ���������������������������������1Canada ��������������������������������27China (Taiwan) �����������������������1Costa Rica �����������������������������2Czech Republic ���������������������1England ���������������������������������3Ethiopia ����������������������������������1France �����������������������������������4Germany ��������������������������������3Greece �����������������������������������2
Ireland ������������������������������������1Israel ��������������������������������������4Italy ����������������������������������������5Japan �������������������������������������2Jordan ������������������������������������1Latvia �������������������������������������1Lebanon ��������������������������������1Lithuania ��������������������������������1Mexico �����������������������������������1New Zealand �������������������������2Northern Mariana Islands ������1Norway ����������������������������������1Peru ���������������������������������������1Philippines �����������������������������1
Poland �����������������������������������1Puerto Rico ��������������������������18Romania ��������������������������������1Scotland ���������������������������������2Singapore ������������������������������1Slovakia ���������������������������������2Spain �������������������������������������4Thailand ���������������������������������3Turkey ������������������������������������1United Arab Emirates �������������1United Kingdom ���������������������2Virgin Islands �������������������������4West Indies ����������������������������1
Retirees Outside United States
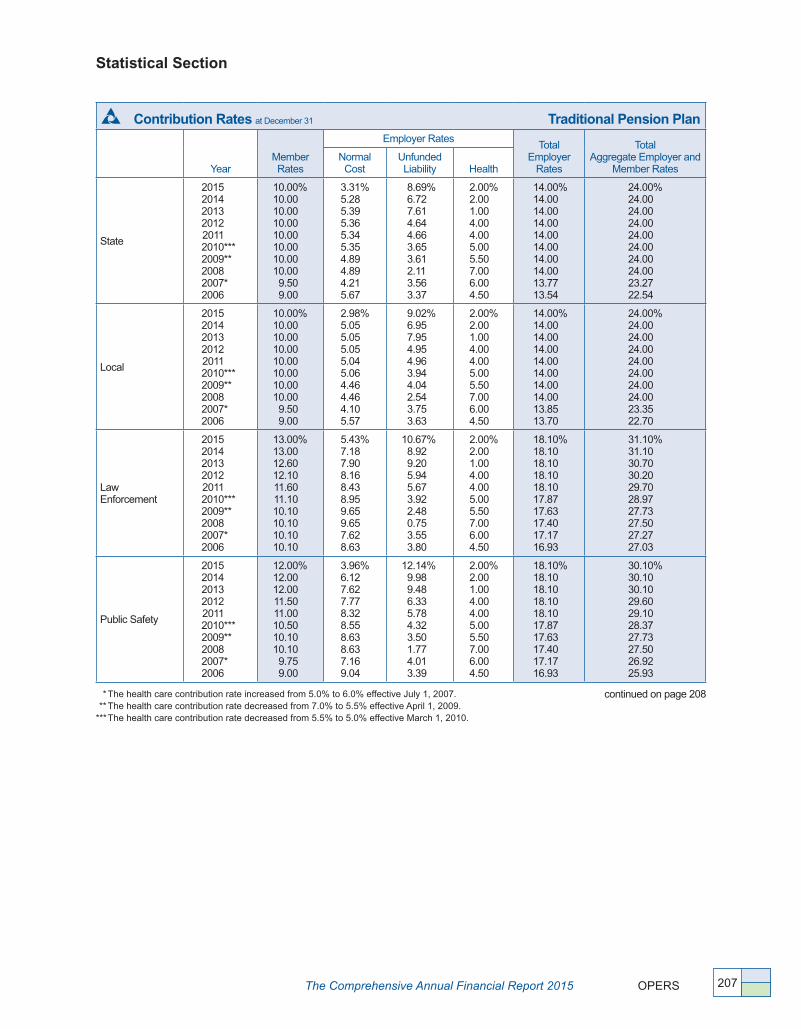
The Comprehensive Annual Financial Report 2015 OPERS
Statistical Section
207
Contribution Rates at December 31 Traditional Pension Plan
YearMemberRates
Employer RatesTotal
EmployerRates
Total Aggregate Employer and
Member RatesNormal Cost
Unfunded Liability Health
State
201520142013201220112010***2009**20082007*2006
10�00%10�0010�0010�0010�0010�0010�0010�009�509�00
3�31%5�285�395�365�345�354�894�894�215�67
8�69%6�727�614�644�663�653�612�113�563�37
2�00%2�001�004�004�005�005�507�006�004�50
14�00%14�0014�0014�0014�0014�0014�0014�0013�7713�54
24�00%24�0024�0024�0024�0024�0024�0024�0023�2722�54
Local
201520142013201220112010***2009**20082007*2006
10�00%10�0010�0010�0010�0010�0010�0010�009�509�00
2�98%5�055�055�055�045�064�464�464�105�57
9�02%6�957�954�954�963�944�042�543�753�63
2�00%2�001�004�004�005�005�507�006�004�50
14�00%14�0014�0014�0014�0014�0014�0014�0013�8513�70
24�00%24�0024�0024�0024�0024�0024�0024�0023�3522�70
LawEnforcement
201520142013201220112010***2009**20082007*2006
13�00%13�0012�6012�1011�6011�1010�1010�1010�1010�10
5�43%7�187�908�168�438�959�659�657�628�63
10�67%8�929�205�945�673�922�480�753�553�80
2�00%2�001�004�004�005�005�507�006�004�50
18�10%18�1018�1018�1018�1017�8717�6317�4017�1716�93
31�10%31�1030�7030�2029�7028�9727�7327�5027�2727�03
Public Safety
201520142013201220112010***2009**20082007*2006
12�00%12�0012�0011�5011�0010�5010�1010�109�759�00
3�96%6�127�627�778�328�558�638�637�169�04
12�14%9�989�486�335�784�323�501�774�013�39
2�00%2�001�004�004�005�005�507�006�004�50
18�10%18�1018�1018�1018�1017�8717�6317�4017�1716�93
30�10%30�1030�1029�6029�1028�3727�7327�5026�9225�93
* The health care contribution rate increased from 5�0% to 6�0% effective July 1, 2007� ** The health care contribution rate decreased from 7�0% to 5�5% effective April 1, 2009� *** The health care contribution rate decreased from 5�5% to 5�0% effective March 1, 2010�
continued on page 208

Statistical Section
OPERS The Comprehensive Annual Financial Report 2015208
Contribution Rates at December 31 Combined Plan
YearMemberRates
Employer RatesTotal
EmployerRates
Total Aggregate Employer and
Member RatesNormal Cost
Unfunded Liability*
MitigationRate Health
State
201520142013201220112010****2009***20082007**2006
10�00%10�0010�0010�0010�0010�0010�0010�009�509�00
7�54%6�997�207�187�187�187�217�217�238�50
3�69%4�245�030�000�001�821�290�12N/AN/A
0�77%0�770�770�770�770�770�770�770�540�54
2�00%2�001�006�056�054�234�735�906�004�50
14�00%14�0014�0014�0014�0014�0014�0014�0013�7713�54
24�00%24�0024�0024�0024�0024�0024�0024�0023�2722�54
Local
201520142013201220112010****2009***20082007**2006
10�00%10�0010�0010�0010�0010�0010�0010�009�509�00
7�41%6�836�876�886�886�876�886�887�158�50
3�82%4�405�360�300�302�131�620�45N/AN/A
0�77%0�770�770�770�770�770�770�770�700�70
2�00%2�001�006�056�054�234�735�906�004�50
14�00%14�0014�0014�0014�0014�0014�0014�0013�8513�70
24�00%24�0024�0024�0024�0024�0024�0024�0023�3522�70
* Unfunded Liability includes the impact of defined contribution account purchases of defined benefit annuities� ** The health care contribution rate increased from 5�00% to 6�00% effective July 1, 2007� *** The health care contribution rate decreased from 5�90% to 4�73% effective April 1, 2009� **** The health care contribution rate decreased from 4�73% to 4�23% effective March 1, 2010�
Contribution Rates at December 31 Member-Directed Plan
YearMemberRates
Employer RatesTotal
EmployerRates
Total Aggregate Employer and
Member RatesNormal Cost
Unfunded Liability
MitigationRate VEBA*
State
2015201420132012201120102009200820072006
10�00%10�0010�0010�0010�0010�0010�0010�009�509�00
8�73%8�738�738�738�738�738�738�738�738�50
N/AN/AN/AN/AN/AN/AN/AN/AN/AN/A
0�77%0�770�770�770�770�770�770�770�540�54
4�50%4�504�504�504�504�504�504�504�504�50
14�00%14�0014�0014�0014�0014�0014�0014�0013�7713�54
24�00%24�0024�0024�0024�0024�0024�0024�0023�2722�54
Local
2015201420132012201120102009200820072006
10�00%10�0010�0010�0010�0010�0010�0010�009�509�00
8�73%8�738�738�738�738�738�738�738�658�50
N/AN/AN/AN/AN/AN/AN/AN/AN/AN/A
0�77%0�770�770�770�770�770�770�770�700�70
4�50%4�504�504�504�504�504�504�504�504�50
14�00%14�0014�0014�0014�0014�0014�0014�0013�8513�70
24�00%24�0024�0024�0024�0024�0024�0024�0023�3522�70
* Beginning in October 2014, the Board approved the funding of VEBA Trust participant accounts using the reserves in the VEBA Trust rather than the allocation of employer contributions� Instead, employer contributions were allocated to the Member-Directed Plan to repay the original plan start-up and administrative costs�
continued from page 207

The Comprehensive Annual Financial Report 2015 OPERS
Statistical Section
209
Number of Employer Units All Plans*Calendar
Year State County**Law
Enforcement Municipalities Villages Miscellaneous Libraries Townships Totals
2015 260 215 239 244 665 498 253 1,309 3,683
2014 264 217 241 245 667 496 253 1,309 3,692
2013 282 219 244 245 673 494 253 1,308 3,718
2012 271 214 242 245 678 491 253 1,308 3,702
2011 271 211 241 246 675 490 253 1,308 3,695
2010 269 215 241 247 675 491 253 1,308 3,699
2009 270 238 237 248 671 489 253 1,308 3,714
2008 269 244 248 251 670 474 254 1,314 3,724
2007 273 241 245 251 671 465 254 1,314 3,714
2006 276 238 244 253 671 459 254 1,312 3,707
* The number of employer units exceeds the number of reporting employers as some employers report multiple divisions or agencies� This count also includes private-sector employers that have assumed privatized functions from public employers for indeterminate periods� The number of employers reporting at December 31, 2015 was 3,247�
** Effective January 1, 2010, House Bill 420 transferred authority for managing county law libraries to County Law Library Resource Boards within county governments� This consolidation with county governments resulted in a reduction in the number of individual employer units�
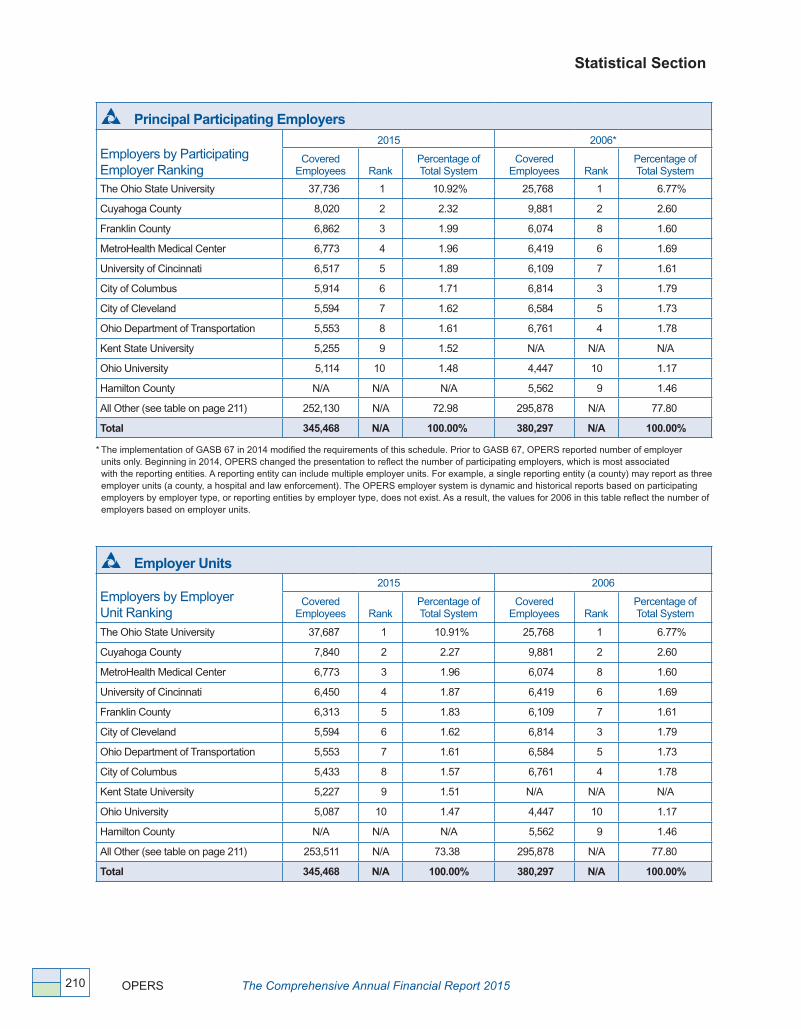
Statistical Section
OPERS The Comprehensive Annual Financial Report 2015210
Principal Participating Employers
Employers by Participating Employer Ranking
2015 2006*
Covered Employees Rank
Percentage of Total System
Covered Employees Rank
Percentage of Total System
The Ohio State University 37,736 1 10�92% 25,768 1 6�77%
Cuyahoga County 8,020 2 2�32 9,881 2 2�60
Franklin County 6,862 3 1�99 6,074 8 1�60
MetroHealth Medical Center 6,773 4 1�96 6,419 6 1�69
University of Cincinnati 6,517 5 1�89 6,109 7 1�61
City of Columbus 5,914 6 1�71 6,814 3 1�79
City of Cleveland 5,594 7 1�62 6,584 5 1�73
Ohio Department of Transportation 5,553 8 1�61 6,761 4 1�78
Kent State University 5,255 9 1�52 N/A N/A N/A
Ohio University 5,114 10 1�48 4,447 10 1�17
Hamilton County N/A N/A N/A 5,562 9 1�46
All Other (see table on page 211) 252,130 N/A 72�98 295,878 N/A 77�80
Total 345,468 N/A 100.00% 380,297 N/A 100.00%
* The implementation of GASB 67 in 2014 modified the requirements of this schedule� Prior to GASB 67, OPERS reported number of employer units only� Beginning in 2014, OPERS changed the presentation to reflect the number of participating employers, which is most associated with the reporting entities� A reporting entity can include multiple employer units� For example, a single reporting entity (a county) may report as three employer units (a county, a hospital and law enforcement)� The OPERS employer system is dynamic and historical reports based on participating employers by employer type, or reporting entities by employer type, does not exist� As a result, the values for 2006 in this table reflect the number of employers based on employer units�
Employer Units
Employers by Employer Unit Ranking
2015 2006
Covered Employees Rank
Percentage of Total System
Covered Employees Rank
Percentage of Total System
The Ohio State University 37,687 1 10�91% 25,768 1 6�77%
Cuyahoga County 7,840 2 2�27 9,881 2 2�60
MetroHealth Medical Center 6,773 3 1�96 6,074 8 1�60
University of Cincinnati 6,450 4 1�87 6,419 6 1�69
Franklin County 6,313 5 1�83 6,109 7 1�61
City of Cleveland 5,594 6 1�62 6,814 3 1�79
Ohio Department of Transportation 5,553 7 1�61 6,584 5 1�73
City of Columbus 5,433 8 1�57 6,761 4 1�78
Kent State University 5,227 9 1�51 N/A N/A N/A
Ohio University 5,087 10 1�47 4,447 10 1�17
Hamilton County N/A N/A N/A 5,562 9 1�46
All Other (see table on page 211) 253,511 N/A 73�38 295,878 N/A 77�80
Total 345,468 N/A 100.00% 380,297 N/A 100.00%
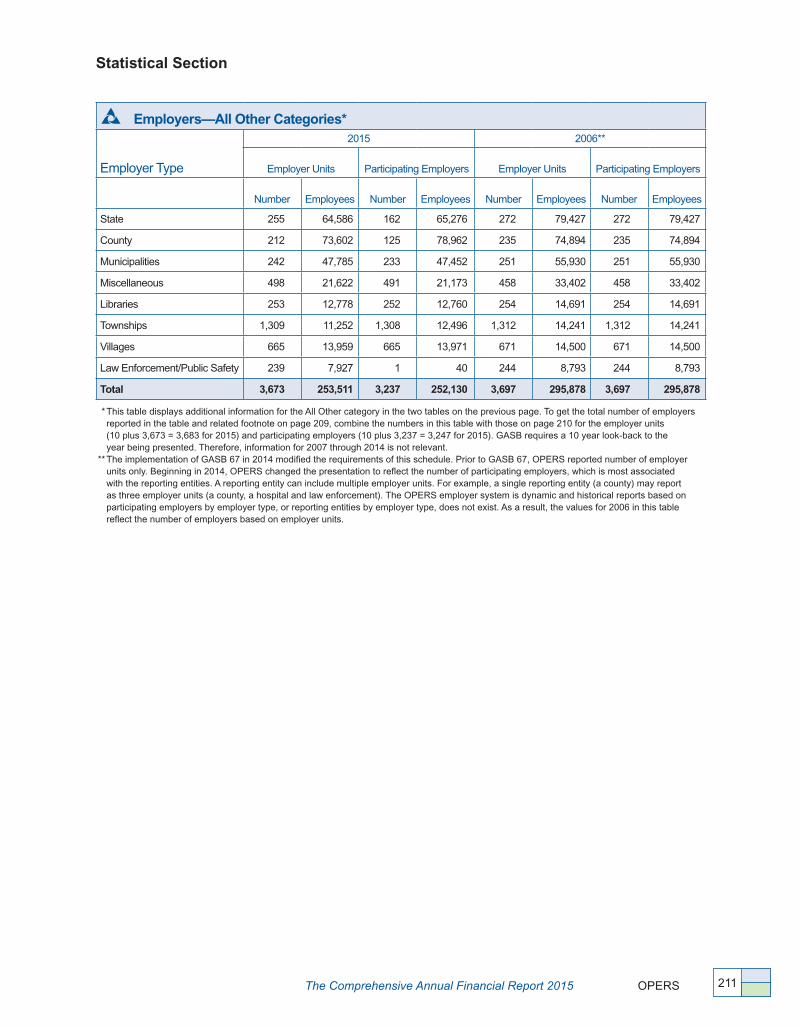
The Comprehensive Annual Financial Report 2015 OPERS
Statistical Section
211
Employers—All Other Categories*
Employer Type
2015 2006**
Employer Units Participating Employers Employer Units Participating Employers
Number Employees Number Employees Number Employees Number Employees
State 255 64,586 162 65,276 272 79,427 272 79,427
County 212 73,602 125 78,962 235 74,894 235 74,894
Municipalities 242 47,785 233 47,452 251 55,930 251 55,930
Miscellaneous 498 21,622 491 21,173 458 33,402 458 33,402
Libraries 253 12,778 252 12,760 254 14,691 254 14,691
Townships 1,309 11,252 1,308 12,496 1,312 14,241 1,312 14,241
Villages 665 13,959 665 13,971 671 14,500 671 14,500
Law Enforcement/Public Safety 239 7,927 1 40 244 8,793 244 8,793
Total 3,673 253,511 3,237 252,130 3,697 295,878 3,697 295,878
* This table displays additional information for the All Other category in the two tables on the previous page� To get the total number of employers reported in the table and related footnote on page 209, combine the numbers in this table with those on page 210 for the employer units (10 plus 3,673 = 3,683 for 2015) and participating employers (10 plus 3,237 = 3,247 for 2015)� GASB requires a 10 year look-back to the year being presented� Therefore, information for 2007 through 2014 is not relevant�
** The implementation of GASB 67 in 2014 modified the requirements of this schedule� Prior to GASB 67, OPERS reported number of employer units only� Beginning in 2014, OPERS changed the presentation to reflect the number of participating employers, which is most associated with the reporting entities� A reporting entity can include multiple employer units� For example, a single reporting entity (a county) may report as three employer units (a county, a hospital and law enforcement)� The OPERS employer system is dynamic and historical reports based on participating employers by employer type, or reporting entities by employer type, does not exist� As a result, the values for 2006 in this table reflect the number of employers based on employer units�

Statistical Section
OPERS The Comprehensive Annual Financial Report 2015212
This page intentionally left blank

Our members face a significant change when facing retirement; we are committed to providing all the accurate information necessary to ensure each can keep their financial balance� In addition to accurate financial information, OPERS works constantly to communicate and educate members on their ultimate benefits and, equally important, how decisions made throughout their careers can affect those benefits�
OPERS works to connect with members and stakeholders by providing transparent financial information and common language outreach� We understand our members are not pension experts and that it’s our responsibility to ensure our outreach helps each member make the right decision for their particular situation� The results of our 2015 outreach efforts were significant:
• MemberServicesdepartmentfielded481,960 individual calls and responded to more than 14,800 online queries�
• Everymemberpotentiallyaffectedbythechangesinhealthcare(morethan142,000) was identified and provided with individualized kits to help make their decisions� Additionally, OPERS had approximately 2�2 million minutes of online videos viewed in 2015, primarily focused on health care changes�
• TheMemberEducationgroup,inconjunctionwiththeHealthCarestaff,delivered approximately 590 presentations across the state and held approximately 160 webinars�
Plan Statement
“ Change does not necessarily assure progress, but progress implacably requires change. Education is essential to change.”
Tom Brokaw, author, journalist

Plan Statement
OPERS The Comprehensive Annual Financial Report 2015214
The Ohio Public Employees Retirement System (OPERS or System) was created in 1935 by the Ohio General Assembly to provide retirement, disability, and survivor benefit programs to state and local employees� This summary outlines the plan features; however, it is not a substitute for the state and federal laws that govern OPERS�
All public employees, except those covered by another state retirement system in Ohio or by the Cincinnati Retirement System, are required to become contributing members of OPERS when they begin public employment unless they are exempted or excluded�
The law provides for optional membership for elected public officials who did not contribute on prior elective service� Students, not already members, working for the public school, college, or university that they are attending may be exempt from contributing to OPERS by filing a request for exemption within the first month of employment�
OPERS provides special retirement coverage for certain law enforcement officers whose primary duties are to preserve the peace, to protect life and property, and to enforce the laws of Ohio� This Law Enforcement division has its own retirement, disability, and survivor benefit eligibility provisions�
Plan Types
For 80 years, OPERS has provided members with retirement benefits under a defined benefit plan, known as the Traditional Pension Plan�
In 2000, legislation required OPERS to establish one or more defined contribution plans to be offered to members in addition to the existing Traditional Pension Plan� OPERS began offering three retirement plans to its members on January 1, 2003� The plans include the Traditional Pension Plan, the Member-Directed Plan, and the Combined Plan� A brief overview of each plan is provided below�
Effective January 7, 2013, legislation modified components of the Traditional Pension and Combined plans� Members were impacted by these changes to varying degrees based on their transition group� Three transition groups (A, B and C) were designed to ease the transition for key components of the pension plan changes�
• The Traditional Pension Plan
The Traditional Pension Plan is a defined benefit plan under which a member’s retirement benefit is based on a formula� The formula is determined by the years of service credit and the average of the three or five (based on transition group) highest years of eligible salary, referred to as final average salary (FAS)� OPERS investment professionals manage the investment of employee and employer contributions to ensure that funds are available to pay the formula benefit�
• The Member-Directed Plan
The Member-Directed Plan is a defined contribution plan under which employee and employer contributions are deposited into a member’s individual account and the member directs the investment by selecting from professionally managed OPERS investment options� The investment options include six core funds comprised of a series of fixed income and equity funds, 10 target date funds, and a self-directed brokerage account� Members become vested in the employer contributions at a rate of 20% for each year of participation until the member is fully vested at the end of five years� The account value available at retirement is based on employee and vested employer contributions and the investment gains and losses on those contributions�

The Comprehensive Annual Financial Report 2015 OPERS
Plan Statement
215
• The Combined Plan
The Combined Plan is a retirement plan with both a defined benefit and a defined contribution component� The employer contributions fund the defined benefit portion of the Combined Plan� The member’s defined benefit retirement component is determined by a formula similar to, but lower than, the Traditional Pension Plan formula� OPERS investment professionals manage the investment of the employer contributions to ensure that funds are available to pay the reduced-formula benefit� Under the defined contribution portion of the Combined Plan, employee contributions are deposited into the member’s individual account and the member directs the investment by selecting from professionally managed OPERS investment options� The investment options include six core funds comprised of a series of fixed income and equity funds, 10 target date funds, and a self-directed brokerage account� The defined contribution account value available at retirement is based on employee contributions and the investment gains and losses on those contributions�
Contributions
Employers are required to make contributions to the System on the basis of a percentage of eligible salary and at a rate based upon the recommendations of the OPERS actuary subject to the statutory limitations� Penalties and interest are assessed for late payments� The contribution rate for State and Local employers in 2015 was 14�0%� Employers in the Law Enforcement and Public Safety divisions contributed 18�1%�
The 2015 employee contribution rate for State and Local members was 10�0% of eligible salary� Members in the Public Safely division contributed 12�0% of eligible salary, while members in the Law Enforcement division contributed 13�0%� Individual accounts for each member of OPERS are maintained and funds contributed by members of the Traditional Pension Plan are fully refundable at service termination or death� The refund value of contributions made by members of the Combined Plan and the Member-Directed Plan are subject to changes (gains or losses) that occur as a result of the member’s selected investment options�
Additional Voluntary Contributions
• The Traditional Pension Plan
A member or a re-employed retiree who is contributing to a money purchase annuity may deposit additional money or rollover funds into the Additional Annuity Program� Voluntary after-tax additional annuity deposits are limited by federal tax law to 100% of a member’s annual income from all public employers contributing to OPERS or to the current annual IRS limitation, whichever is less� Additional Annuity deposits are invested in the OPERS Stable Value Fund where they are subject to daily investment gains and losses� Earnings are tax-deferred until the time of distribution�
Upon termination of employment or retirement, the member may either elect to receive a refund of the account value or an annuity� The annuity program offers the same payment options as those offered for an age-and-service retirement under the Traditional Pension Plan�
• The Member-Directed Plan and Combined Plan
Members participating in the Member-Directed or Combined plans may deposit additional money or rollover funds into their individual defined contribution account� Voluntary after-tax deposits are limited by federal tax law to 100% of a member’s annual income from all public employers contributing to OPERS or to the current annual IRS limitation, whichever is less� The additional contributions are invested in the same investment options the member selected for their individual defined contribution account, and are subject to investment gains and losses�

Plan Statement
OPERS The Comprehensive Annual Financial Report 2015216
Upon termination of employment or retirement, members may elect to receive either a lump-sum refund of the account value or any of the retirement distribution options available to defined contribution accounts�
Benefits under the Traditional Pension Plan or the Combined Plan
Age-and-Service Retirement
In 2012, the Ohio General Assembly enacted into law a number of significant plan design changes that became effective on January 7, 2013� In the legislation, members were categorized into three groups with varying provisions of the new law applicable to each group� Members who were eligible to retire under law in effect prior to the legislation or who will be eligible to retire no later than five years after January 7, 2013, comprise transition Group A� Members who have 20 years of service credit prior to January 7, 2013, or who will be eligible to retire no later than 10 years after January 7, 2013, are included in transition Group B� Group C includes those members who are not in either of the other groups and members who were hired on or after January 7, 2013�
Retirement benefits are specific to each plan and members must meet the eligibility requirements based on their age and years of service within the plan� Retirement eligibility also varies by division and transition group� The charts below show the retirement eligibility requirements for all divisions and transition groups� The requirements for the State and Local divisions apply to members who participate in either the Traditional Pension Plan or the Combined Plan� The Law Enforcement and Public Safety divisions are only applicable to the Traditional Pension Plan�
UnreducedGroup A Group B Group C
Age Service Age Service Age Service
State/Local
Any 30 52 31 55 32
Any 32
65 5 66 5 67 5
LawEnforcement
48 25 50 25 52 25
62 15 64 15 64 15
Public Safety52 25 54 25 56 25
62 15 64 15 64 15
Law and PublicSafety (publicsafety benefit)
52 25 54 25 56 25
ReducedGroup A Group B Group C
Age Service Age Service Age Service
State/Local55 25 55 25 57 25
60 5 60 5 62 5
LawEnforcement
52 15 52 15 56 15
N/A N/A 48 25 48 25
Public Safety52 15 52 15 56 15
48 25 48 25 52 25
Law and PublicSafety (publicsafety benefit)
48 25 48 25 52 25

The Comprehensive Annual Financial Report 2015 OPERS
Plan Statement
217
Benefit payments vary in amount depending on years of service credit, FAS, age, and plan of payment selection� FAS is the average of the three highest years of eligible salary for Groups A and B; and the average of the five highest years of eligible salary for members in Group C� The age-and-service formula benefit cannot exceed 100% of FAS (Law Enforcement is 90%) or the limits under Internal Revenue Code Section 415 and may be subject to the contribution-based benefit cap (CBBC)� The base benefit amount calculated by the formula will be reduced if a member begins receiving a retirement benefit before he/she reaches the age-and-service requirements for an unreduced benefit�
In the Traditional Pension Plan, the benefit formula for State and Local members in transition Groups A and B applies a factor of 2�2% to the member’s FAS for the first 30 years of service� A factor of 2�5% is applied to years of service in excess of 30� The benefit formula for State and Local members in transition Group C applies a factor of 2�2% to the member’s FAS for the first 35 years of service and a factor of 2�5% is applied to years of service in excess of 35�
In the Traditional Pension Plan, the benefit formula for members in the Public Safety and Law Enforcement divisions applies a factor of 2�5% to member’s FAS for the first 25 years of service as a Public Safety or Law Enforcement member� A factor of 2�1% is applied to years of service in excess of 25�
In the Combined Plan, the benefit formula for the defined benefit component of the plan for State and Local members in transition Groups A and B applies a factor of 1�0% to the member’s FAS for the first 30 years of service� A factor of 1�25% is applied to years of service in excess of 30� The benefit formula for transition Group C applies a factor of 1�0% to the member’s FAS and the first 35 years of service and a factor of 1�25% is applied to years in excess of 35� In the defined contribution component of the Combined Plan, the current value of the individual account is available at retirement� The balance can be rolled over to another eligible retirement plan, made payable to the member with taxes withheld, or converted to a lifetime annuity through OPERS, or a combination of the three options�
Beginning in January 2013, the CBBC was introduced to reduce the impact of inflating FAS� For purposes of determining the CBBC, the member’s accumulated contributions (less any contributions attributed to a non-law annuity) are combined with a portion of employer-paid delinquent contributions, a portion of early retirement incentive plan funding and member contributions used to fund a disability under the original plan, if applicable� The total accumulated member contributions (as calculated in the previous sentence) are multiplied by the OPERS Board of Trustees (Board)-established CBBC factor� The CBBC factor in effect for 2015 was 6�0� The member is eligible for the lesser of an annuity calculated on FAS and years of service credit or the calculated CBBC value� The CBBC applies to all new retirees, with an exception for certain members in Group A� The reduction caused by the CBBC for transition Group A members may not exceed 5% of the retirement allowance the member would have otherwise received unless, for any full month of service after January 1, 1987, the member’s monthly eligible salary was less than $1,000�
Service credit allowed under Chapter 145 of the Ohio Revised Code for retirement eligibility and calculation of a formula benefit includes:
1) Service to the state of Ohio or an Ohio political subdivision for which contributions have been paid;
2) Certain military service which interrupted contributing public service;
3) Any out-of-public service period of three years or less during which the member was receiving an award under the Ohio Bureau of Workers’ Compensation;
4) Previously unreported service in Ohio;
5) Service purchased by the member for:
a) Military service that pre-dates public employment;

Plan Statement
OPERS The Comprehensive Annual Financial Report 2015218
b) Prisoner-of-war service;
c) An authorized leave of absence that did not exceed one year;
d) Comparable public service that is not being used for other retirement programs except Social Security, performed outside Ohio or with the federal government, or for which contributions were made to an Ohio municipal retirement system;
e) Restoration of previously refunded service;
f) Restoration of previously refunded service from the Ohio Police and Fire Pension Fund, Ohio State Highway Patrol Retirement System, or Cincinnati Retirement System, not being used for any other retirement benefit;
g) Service that was previously covered by a valid exemption under OPERS;
h) The amount of 35% additional credit on completed terms of full-time contributing elected official service, or board, commission, or other public body service by members who are appointed by the Governor with the advice and consent of the Senate;
i) Service purchased in the Combined Plan or the Traditional Pension Plan representing contributing service earned in the Member-Directed Plan or Combined Plan; and,
j) Restoration of contributing service earned in the Traditional Pension Plan prior to January 1, 2003 that was transferred to the Member-Directed Plan or the Combined Plan at initial plan selection�
6) Service purchased by an employer under a retirement incentive plan�
Beginning in 2014, the minimum eligible salary required to earn full-time service was increased to $600 per month, with an index feature that is based on salary increases granted to township trustees� Township trustees will receive a salary increase in 2016 and, thus, the minimum eligible salary will increase by that same percentage beginning in calendar year 2017�
A choice of several benefit payment plans is available� The choices include benefits payable throughout the member’s lifetime (Single Life Plan) or in a lesser amount during the individual’s life but continuing after the member’s death to one or more survivors (the Joint Life Plan or the Multiple Life Plan)�
A benefit payable under Joint Life Plan or Multiple Life Plan is the actuarial equivalent of the Single Life Plan, but the payment to the member is reduced because it is based on the combined life expectancies of the member and the beneficiary(ies)�
The Multiple Life Plan is an option available to members whose retirement is effective on or after November 1, 2006� The payment plan is a multiple joint survivorship annuity providing benefits to the member throughout his/her lifetime, with payments continuing to the member’s surviving beneficiaries after the member’s death� The member may designate two-to-four beneficiaries, with each receiving at least 10% of the benefit (exceptions are court ordered spousal benefits)� Total allocations to all beneficiaries may not exceed 100% of the benefit�
Effective January 1, 2004, OPERS established a Partial Lump-Sum Option Payment (PLOP) for certain retirees and benefit recipients� The PLOP is an option at retirement that allows a recipient to receive a lump-sum benefit payment along with a reduced monthly retirement allowance� The PLOP cannot be less than six times or more than 36 times the monthly amount that would be payable to the member under the plan of payment selected, and cannot result in a monthly allowance that is less than 50% of that monthly amount� The total amount paid as a lump sum and a monthly benefit is the actuarial equivalent of the amount that would have been paid had the lump sum not been selected�

The Comprehensive Annual Financial Report 2015 OPERS
Plan Statement
219
Disability Benefits
OPERS members are eligible for one of two disability programs: the original plan or the revised plan� Employees who had contributions on deposit with OPERS on July 29, 1992, had a one-time opportunity to select coverage under one of these programs� Employees hired after July 29, 1992, are covered only under the revised plan� There are a number of features common to both plans�
A member who has at least 60 contributing months of service credit in either the Traditional Pension Plan or the Combined Plan and who becomes permanently disabled due to a mentally or physically disabling condition for the performance of duty may apply to OPERS for monthly disability benefits� Members in the Law Enforcement or Public Safety divisions may apply for disability at any time if the disabling condition was the result of an on-duty illness or injury� Coverage is limited to illness or injury that occurs before the member’s contributing service terminates or, in the case of illness or injury that results from the member’s employment, becomes evident no later than two years after the date the contributing service ends� The coverage does not extend to disability resulting from elective cosmetic surgery other than reconstructive surgery�
Application must be made within two years from the date the member’s contributing service ended, unless the Board determines that the member was physically or mentally incapacitated for duty and unable to make an application� The member must not be receiving an age-and-service retirement benefit or have received a refund of his or her accumulated contributions� If the Board approves the disability benefit application and the member is otherwise eligible, the benefit is effective the first day of the month following the member’s service termination� A disability benefit recipient may be required to undergo a medical examination at least once a year� A disability benefit terminates under either disability plan if the member is no longer disabled, returns to public employment, chooses to begin receiving an age-and-service benefit, or dies�
A new disability standard will be applied to disability recipients (excluding Law Enforcement division disability recipients) whose application for disability was received by the retirement system on or after January 7, 2013� Disability benefit recipients will be evaluated under an “own occupation” standard (incapable of performing the duties of the member’s last public position) at the time of application and for the first three years of disability� This time period may be extended from three years to five years, if the recipient is receiving rehabilitative services acceptable to a physician selected by the Board� Subsequent to the three- or five-year period, the benefit recipient is evaluated under an “any occupation” standard� The “any occupation” standard for terminating a benefit is that the benefit recipient is no longer physically or mentally incapable of performing the duties of any position which meets the following criteria:
1) Replaces at least 75% of the recipient’s inflation-adjusted FAS;
2) Can reasonably be found in the recipient’s regional job market; and
3) The recipient is qualified to perform based on the recipient’s experience or education�
Members covered under the original plan must apply for disability benefits prior to turning age 60 (or age 62 for members in transition Group C)� Under the original plan, the amount of the disability allowance is based on the member’s FAS and total service credit, plus the length of time between the effective date of disability and age 60 (or 62)� The disability benefit cannot exceed 75%, nor be less than 30% of the member’s FAS� The disability benefit continues for the member’s lifetime as long as the qualifying disability persists� The benefit is funded by the employee’s accumulated contributions and reserves accumulated from employer contributions� The benefit is fully taxable until age 60 (or 62), after which a specified dollar amount each month, representing the return of previously taxed contributions, is tax-free� For a law enforcement member disabled due to an on-duty injury or illness, 30% of the benefit payment is excludable from taxable income�

Plan Statement
OPERS The Comprehensive Annual Financial Report 2015220
Under the revised plan, the disability allowance is based on the member’s FAS and service credit� The disability benefit cannot be less than 45% or exceed 60% of the member’s FAS� The benefit is funded by reserves accumulated from employer contributions, and is fully taxable� For a law enforcement member disabled due to an on-duty injury or illness, 45% of the benefit payment is excludable from taxable income�
Benefits under the revised plan are payable until age 65 (or age 67 for members in transition Group C) or for a definite period, whichever comes first, as long as the qualifying disability persists� When the disability benefit ends, the member may apply for a service retirement benefit or a refund of their account� The service retirement benefit amount is the greater of: a) 2�2% of FAS multiplied by the years of service (contributing and disability) not to exceed 45% of FAS; or b) the regular or law enforcement benefit calculation using only the member’s years of contributing service�
Members participating in the Combined Plan who elect to receive disability benefits must transfer to the Traditional Pension Plan� The disability benefit is calculated using the same formulas and criteria described above, and the member is required to transfer their individual defined contribution account to the Traditional Pension Plan to fund the benefit�
Members who apply for a disability benefit on or after January 7, 2013 are required to apply for Social Security Disability Insurance (SSDI) and, if determined to be eligible for such benefits, are subject to an offset to the extent that the member’s OPERS disability benefit plus the SSDI benefit exceed the member’s FAS, adjusted for inflation� The offset does not apply to a disability recipient who is a law enforcement member or who has at least five years of service credit for periods during which the recipient had earnings from other employment that was taxable under the Federal Insurance Contributions Act�
Survivor Benefits
A member’s beneficiary is determined by statutory automatic succession unless a specific designation is made in writing on a form provided by OPERS� Listed below is the order of automatic succession under Ohio law:
1) Spouse,
2) Children,
3) Dependent parents,
4) If none of the above, parents share equally in a refund of the account; and
5) If none of the foregoing, a refund of the account is paid to the estate�
Qualified beneficiaries will be eligible to receive monthly survivor benefits if, at the time of the member’s death, at least one of the following qualifications was met:
1) The member had 18 months of Ohio service credit with three of those months within the two and one-half years immediately before death; or
2) The member was receiving a disability benefit from OPERS; or
3) The member was eligible for retirement but did not retire�
If none of these qualifications were met at the member’s death, a refund of the member’s OPERS account value as defined by the Ohio Revised Code may be made� The member’s beneficiary may choose a refund of the member’s account only if there are no children eligible for monthly benefits� If the member dies while receiving a disability benefit under the original plan and eligible survivors select a cash refund of the account, the amount is reduced by the amount of disability benefits that had
The Comprehensive Annual Financial Report 2015 OPERS
Plan Statement
221
already been paid� There is no reduction in amount if the member dies while receiving a benefit under the revised disability plan or while still working�
Qualified surviving spouses (with no children eligible for monthly benefits) may receive a benefit representing the greater of $250 a month or an annual benefit equal to 25% of the decedent’s FAS� If the decedent had 20 or more years of service, the percent of FAS increases with each year of service over 20 up to a maximum of 60%� Benefits begin when a qualified surviving spouse reaches age 62, or at any age if the decedent had 10 or more years of Ohio service credit, qualifying children, or the spouse is adjudged physically or mentally incompetent� Benefits to a qualified survivor terminate when the survivor ceases to meet eligibility requirements�
If a deceased member was eligible for a service retirement benefit at time of death, a surviving spouse or other sole dependent beneficiary may elect to receive a monthly benefit calculated as though the member had retired and elected the Joint Life Plan with 100% to the survivor� This joint survivor option provides a monthly allowance that continues through the beneficiary’s lifetime� The beneficiary also has the option of electing a PLOP�
A child of a deceased member may qualify for monthly benefits if the child has never been married and is under age 18, or 22, if a qualified student attending an accredited school� A child who is adjudged physically or mentally incompetent at the time of the member’s death is eligible for benefits regardless of age� Benefits terminate upon the child’s first marriage, adoption by someone other than a step-parent, abandonment, death, or during active military service�
A dependent parent is one who received at least one-half support from the member during the 12 months preceding the member’s death� A dependent parent may receive survivor benefits if age 65 or older, or at any age if adjudged physically or mentally incompetent at the time of the member’s death� Survivor benefit payments terminate upon the parent’s death or remarriage�
The eligible survivors of Combined Plan members may elect to receive monthly survivor benefits� The survivor benefit is calculated using the same formulas and criteria described above, and the member’s defined contribution account is transferred to the Traditional Pension Plan to fund the benefit�
Additional Benefits
Cost-of-Living Adjustment (COLA)
When a benefit recipient has received benefits for 12 months, an annual COLA is provided� This COLA is calculated on the base retirement benefit at the date of retirement and is not compounded� For those who retired prior to January 7, 2013, the COLA will continue to be a 3% simple annual COLA� For those retiring subsequent to January 7, 2013, beginning in calendar year 2019, the COLA will be based on the average percentage increase in the Consumer Price Index, capped at 3%�
Death Benefit
Upon the death of an age-and-service or disability benefit recipient, a lump-sum death benefit is paid to the qualified beneficiary� The benefit ranges from $500 to $2,500 based on the recipient’s years of service credit�
Qualified Excess Benefit Arrangement
Total benefit payments to an individual are subject to the limitations identified in Section 415(b) of the Internal Revenue Code� In 2003, OPERS implemented a Qualified Excess Benefit Arrangement (QEBA) that allows OPERS recipients to receive the amount of their benefit that is subject to the IRS limits�
Plan Statement
OPERS The Comprehensive Annual Financial Report 2015222
Refunds
A refund may be issued after three months have elapsed since the member terminated public service� For members of the Traditional Pension Plan, the refund value is equal to their member contributions plus interest� Members of the Combined Plan may refund their defined contribution account balance comprised of member contributions and investment gains or losses on those contributions, and any member contributions plus interest in the defined benefit portion of the plan arising from the purchase of eligible service� Members of the Traditional Pension Plan and the Combined Plan may also qualify for an additional amount calculated on their eligible contributions� If the member has at least five but less than 10 years of qualified service credit in the plan, the additional amount is 33% of the member’s eligible contributions� Members with at least 10 years of qualified service credit in the plan may receive an additional amount equal to 67% of eligible contributions�
Under the Traditional Pension Plan, full recovery of all employee contributions to OPERS is guaranteed� If the individual is eligible for a monthly retirement benefit and is legally married at the time the refund application is filed, spousal consent is required� Beginning on March 19, 2015, a Traditional Pension Plan member who is also a member of the State Teachers Retirement System of Ohio or the School Employees Retirement System of Ohio is no longer required to refund from all systems at the time the member seeks a refund from OPERS�
Refunded service credit may be restored in the Traditional Pension Plan and the Combined Plan if the member returns to OPERS-covered employment for at least 18 months in the plan from which the refund was issued� The amount refunded, including interest and the additional amount (if applicable), must be repaid for service credit to be restored� The member must also pay interest (compounded annually) at a rate determined by the Board for the period from the date of refund to the date the refunded amount is repaid�
Benefits under the Member-Directed Plan
Retirement
Members participating in the Member-Directed Plan are eligible to retire after they reach age 55� The current vested value of the individual account is available at retirement� The balance can be converted to a lifetime annuity through OPERS; or a portion of the balance can be converted to an annuity through OPERS and the remainder can be rolled over to another eligible retirement plan or made payable to the member with taxes withheld�
Disability and Survivor Benefits
Participants in the Member-Directed Plan are not eligible for disability or survivor benefits� In the event of disability or death, the vested portion of the member’s individual account is available for refund to the member or qualified beneficiaries�
Refunds
A refund may be issued after three months have elapsed since the member terminated public employment� Members participating in the Member-Directed Plan may receive employee contributions and investment gains or losses on those contributions� Depending on length of participation in the Member-Directed Plan, a member may also receive a portion of the employer contributions, plus any investment gains or losses on those contributions, based on the schedule on the next page�

The Comprehensive Annual Financial Report 2015 OPERS
Plan Statement
223
Years of Participation Percent Vested
Less than 1 year 0%
1 year 20%
2 years 40%
3 years 60%
4 years 80%
5 or more years 100%
Coverage and Benefits for Re-employed Retirees
After a member retires, re-employment in an OPERS-covered job, including service in an elected position, is permitted but may affect continuing receipt of an age-and-service retirement benefit� Contributions must begin from the first day of re-employment, however members who are re-employed anytime within the first two months after their effective retirement benefit date will forfeit their retirement allowance during this two-month period� This prohibition applies even if salary is waived for the two-month forfeiture period� OPERS health care coverage is also not available during any period of pension forfeiture, and contributions remitted during the two-month forfeiture period will not be included in the calculation of a Money Purchase Plan benefit�
An OPERS retiree who returns to work in an OPERS-covered position must enroll in the employer’s health care plan if the employer offers a plan to other employees in similar positions� After the two-month forfeiture period, the retiree may continue his/her participation in an OPERS health care plan� The coverage provided by the employer plan is primary and the OPERS coverage is secondary� Federal law prohibits retirees from being covered by the OPERS health care plans as secondary coverage if the retiree is enrolled in a high deductible health plan and a health savings account� If the OPERS retiree is over age 65 and employer-sponsored coverage is not available, the retiree may either elect to participate in the OPERS-sponsored coverage offered to re-employed retirees or forgo funding and reimbursement in the Health Reimbursement Arrangement (HRA) during the period of re-employment� The HRA was established for the OPERS Medicare Connector� Refer to the Health Care Coverage for Traditional Pension Plan and Combined Plan section for more information on the OPERS Medicare Connector�
Retirees cannot continue to receive benefits and work as an independent contractor under a contract for any period of time for the employer from which they retired� This prohibition is applicable regardless of the number of hours or days actually worked� A retiree may be compensated under a contract for services as an independent contractor for another public employer� If this occurs within the first two months of retirement, he or she will forfeit pension benefits for the entire period of service as an independent contractor�
During re-employment, the retiree participates in the Money Purchase Plan� Upon termination of re-employment, retirees under age 65 may receive a refund of their Money Purchase account consisting of their employee contributions made during the period of re-employment, plus interest� Retirees age 65 and older may receive an annuity benefit that is based on the amount of their employee contributions during the period of re-employment plus interest, and an amount from the employer’s contributions established by the Board� The additional amount paid from employer contributions is currently set at 67% of the employee contributions and interest� Payment options are the same as those described under the Age-and-Service Retirement section�
Plan Statement
OPERS The Comprehensive Annual Financial Report 2015224
Health Care Coverage for Traditional Pension Plan and Combined Plan
With one exception, OPERS-provided health care coverage is neither a guaranteed nor statutorily required benefit� Medicare Part A equivalent coverage or reimbursement for eligible retirees and their eligible dependents is currently required by statute�
Eligibility
Members that applied for age-and-service retirement with effective dates of December 1, 2014, or earlier, and who had 10 or more years of service credit, had access to OPERS-provided health care coverage on a subsidized basis� Beginning January 1, 2015, members must be at least age 60 with 20 years of qualifying service� Members in Group A are eligible for coverage at any age with 30 or more years of qualifying service� Members in Groups B and C are eligible for coverage at any age with 31 and 32 years of qualifying service, respectively� See the Age-and-Service Retirement section beginning on page 216 for a description of Groups A, B and C�
Qualifying service credit for determining eligibility to participate in the health care plans includes the following types of credit: contributing service, other Ohio retirement system service transfers, interrupted military (USERRA), unreported time, and restored (refunded) service� Beginning January 1, 2014, contributing service credit for health care will be accumulated only if the member’s eligible salary is at least $1,000 per month� Partial health care credit will not be granted for months in which eligible salary is less than $1,000� Credit earned prior to January 2014 will not be affected by this requirement�
In addition to retirees, access to health care coverage is also available for disability recipients and primary survivor recipients� Spouses and dependents of eligible recipients, as defined in rules governing the health care plans, may be covered through additional premiums�
Recipients of disability benefits prior to January 1, 2014 have continued access to health care coverage while the disability benefit continues and will not be subject to the five-year rule described below� The allowance will be determined in the same way as an age-and-service retiree� If the recipient does not meet minimum age-and-service requirements, the minimum allowance will be used� Recipients with an initial disability effective date on or after January 1, 2014, will have coverage during the first five years of disability benefits� After five years, the recipient must meet minimum age-and-service health care eligibility requirements or be enrolled in Medicare due to disability status to remain enrolled in OPERS health care� If enrolled, the allowance will be determined in the same way as an age-and-service retiree�
Coverage Options
In 2015, OPERS provided monthly allowances for health care coverage for retirees and their eligible dependents, both over and under the age of 65, based on the retiree’s Medicare status� For those retiring on or after January 1, 2015, the allowance (subsidy) provided by OPERS will be based on age and years of qualifying service credit when a recipient first enrolls in OPERS health care� At the completion of a three-year transition that ends in 2018, monthly allowances will range between 51% and 90% of the full monthly premium and the same allowance table will be used for all retirees� Those who retired prior to January 1, 2015, with an allowance at or above 75%, will not have an allowance below 75%� Members retiring at any age with 30 (based on retirement group) or more years of qualifying service will have at least a 71% allowance�
In 2015, OPERS offered medical and pharmacy plans for recipients yet to enroll in Medicare and those already enrolled in Medicare, typically at age 65� Monthly allowances are used to offset the monthly premium for the coverage provided� The plan for participants who are enrolled in Medicare is a fully insured group Medicare Advantage plan and includes pharmacy coverage through a Medicare Part D prescription drug plan� OPERS self-insures the medical coverage for participants who are not eligible for Medicare and for pharmacy costs regardless of the retiree’s age�

The Comprehensive Annual Financial Report 2015 OPERS
Plan Statement
225
Beginning in 2016, OPERS will cease offering the group plan for medical and pharmacy to Medicare eligible retirees� Instead, their allowance will be deposited to a HRA and may be used to reimburse the cost of coverage selected through the OPERS Medicare Connector� The OPERS Medicare Connector is a relationship with a vendor selected by OPERS and tasked with assisting retirees, spouses and dependents with selecting a medical and pharmacy plan� OPERS introduced the OPERS Medicare Connector in 2015, with an effective date of January 1, 2016, for Traditional Pension and Combined plan retirees enrolled in Medicare Parts A and B� OPERS will continue offering a medical plan and prescription drug plan for non-Medicare participants�
Over a three-year period beginning in 2015, spouses will transition from their current monthly allowance to zero� Spouses under age 65 will have access to OPERS coverage at full cost through at least 2020� Spouses over age 65 will have access to the OPERS Medicare Connector beginning in 2016� Spouses of deceased members will no longer assume the retiree’s health care allowance� If the retiree has at least 20 years of qualifying service and is enrolled in OPERS health care, children (up to age 26) will receive half of the retiree’s allowance percentage� If the recipient has less than 20 years of qualifying service, children (up to age 26) will transition from the current allowance to zero over three years (2015 - 2017) but will have access to OPERS coverage at the full cost through at least 2020�
Medicare Part A
Beginning in July 2016, OPERS will reimburse retirees who do not have premium-free Medicare Part A (hospitalization) for their Part A premiums as well as any applicable surcharges (late-enrollment fees)� Retirees within this group must enroll in Medicare Part A and select medical coverage, and may select prescription coverage, through the OPERS Medicare Connector� OPERS also will reimburse 50 percent of the Medicare Part A premium and any applicable surcharges for eligible spouses� Proof of enrollment in Medicare Part A and confirmation that the retiree is not receiving reimbursement or payment from another source must be submitted� The premium reimbursement is added to the monthly pension benefit�
Medicare Part B
Recipients and their covered dependents who are enrolled in OPERS health care must enroll in Medicare Part B (medical) when they become eligible in order to participate in a plan sponsored by OPERS�
OPERS provides for reimbursement of eligible retiree Medicare Part B premiums at an amount approved by the Board� Eligible retirees may receive reimbursement of the actual premiums paid up to a maximum of the Board-approved rate for as long as the retiree is enrolled in the plan� (OPERS does not provide this reimbursement benefit to retiree spouses�) Proof of enrollment in Medicare Part B and confirmation that the retiree is not receiving reimbursement or payment from another source must be submitted� The premium reimbursement is added to the monthly pension benefit� For calendar year 2015, the reimbursement was set at $63�62 per month� This reimbursement will be completely eliminated by 2017�
Low Income Discount
Recipients not yet eligible for Medicare with household income below 200% of the poverty level may apply for a 30% reduction in the cost of medical and pharmacy premiums�
Dental and Vision Coverage
Recipients and dependents also have access to dental and vision coverage� These are fully insured products with the retiree paying the total cost of coverage, including premiums, plan deductibles, and out-of-pocket expenses�

Plan Statement
OPERS The Comprehensive Annual Financial Report 2015226
Retiree Medical Account (RMA) for Member-Directed Plan Participants
Members participating in the Member-Directed Plan have a portion of the employer contribution credited to an individual Retiree Medical Account (RMA)� In 2015, the account earned a fixed annual interest rate established by the Board� Members with an account prior to July 1, 2015, become vested in the account at a rate of 20% for each year of participation until the member is fully vested at the end of five years� For members establishing accounts on or after July 1, 2015, the vesting schedule is below� Upon a refund or retirement, distribution of the vested balance in the member’s RMA may be used for the reimbursement of qualified medical expenses�
Years of Participation Percent Vested
0-5 years 0%
6 years 10%
7 years 10%
8 years 10%
9 years 10%
10 years 10%
11 years 10%
12 years 10%
13 years 10%
14 years 10%
15 years 10%
Beginning January 1, 2017, interest on the RMA will accrue only if the investment fund containing the RMA assets earns a return greater than zero�
Note: The information contained in this section is intended to be a summary only� More complete details can be obtained through OPERS� This document reflects information as of the date listed and approved changes� All plans are subject to change� Health care is not a statutorily guaranteed benefit and as such the Board has the discretion to review, rescind or modify the health care plans at any time� There is no promise, guarantee, contract, or vested right to health care coverage or a premium allowance�