2015-06-30 idx companies report - us letter
TRANSCRIPT

1
Indonesian palm oil growers’ exposure to sustainability purchasing policies
(30 June 2015)
Summary
• Six out of ten largest palm oil growers listed on the Indonesian stock exchange (IDX) have high-‐risk exposure to major buyer/traders’ No Deforestation, No Peat, No Exploitation (NDPE) purchasing policies. Six out of these ten growers sell 50% or more of their crude palm oil and/or palm kernel oil to buyers that have adopted such policies for their supply chain;
• Two of the top ten growers (SSMS and ANJT) have recently had their purchasing contracts suspended over sustainability concerns. Two other growers (SMART and Astra) were recently pressured by investors and campaigners to establish stronger sustainability standards;
• Growers that try to avoid traders’ higher sustainability standards are subject to significant risk exposure as they face downstream purchasing policies from consumer brands and manufacturers that are increasingly committed to NDPE policies;
• Crude palm oil from the ten largest IDX-‐listed growers accounts for 10% of global production; • Chain Reaction Research concludes that the transformation to sustainable practices in the palm oil
industry is unavoidable, particularly for publicly traded plantation companies.
IDX-‐listed company Risk exposure PT Astra Agro Lestari (AALI) High PT Bakrie Sumatera Plantations (UNSP) High PT Dharma Satya Nusantara Group (DSNG) High PT Eagle High Plantations (BWPT) High PT Sampoerna Agro (SGRO) High PT Sawit Sumbermas Sarana (SSMS) High PT Austindo Nusantara Jaya (ANJT) Medium PT Salim Ivomas Pratama (SIMP) Medium PT Tunas Baru Lambung (TBLA) Medium PT Sinar Mas Agro Resources and Technology (SMART) Medium

2
Contents
Summary ............................................................................................................................ 1
Contents ............................................................................................................................. 2
1 No Deforestation, No Peat, No Exploitation policies ................................................... 3
2 The 10 largest IDX-‐listed palm oil growers .................................................................. 4
3 Grower’s largest customers ........................................................................................ 5
4 Risk exposure assessment for each IDX-‐listed company ............................................. 8
4.1 PT Astra Agro Lestari (Astra) ......................................................................................... 8 4.2 PT Salim Ivomas Pratama (SIMP) .................................................................................. 9 4.3 PT Sinar Mas Agro Resources and Technology (SMART) .............................................. 11 4.4 PT Dharma Satya Nusantara Group (DSNG) ................................................................ 13 4.5 PT Tunas Baru Lampung (TBLA) ................................................................................... 14 4.6 PT Eagle High Plantations (BWPT) ............................................................................... 15 4.7 PT Sampoerna Agro (SGRO) ........................................................................................ 16 4.8 PT Sawit Sumbermas Sarana (SSMS) ........................................................................... 17 4.9 PT Bakrie Sumatera Plantations (UNSP) ...................................................................... 18 4.10 PT Austindo Nusantara Jaya (ANJT) ............................................................................ 19
5 Assessment of business risk exposure ...................................................................... 21
5.1 Risk assessment results .............................................................................................. 21 5.2 Can IDX-‐listed growers avert NDPE policies? ............................................................... 22
Methodology .................................................................................................................... 23
Glossary ............................................................................................................................ 26
References ........................................................................................................................ 28

3
1 No Deforestation, No Peat, No Exploitation policies Over the past year and a half, several major palm oil traders have adopted No Deforestation, No Peat, No Exploitation (NDPE) policies. The signatories of these purchasing policies, which include Apical, Bunge, Cargill, Golden Agri-‐Resources, IOI, Kencana Agri, Kuala Lumpur Kepong, Musim Mas, and Wilmar, cover over 90% of the globally traded palm oil market.1 These commitments apply to a company’s entire supply chain, including plantations operated by their own subsidiaries and third-‐party suppliers. The policies prohibit clearance of High Conservation Value (HCV) and High Carbon Stock (HCS) areas, as well as peatlands (regardless of depth) for palm oil expansion. In addition, they require human and labour rights be upheld in accordance with the core conventions of the International Labour Organisation (ILO),2 and the right of local communities to give or withhold their Free, Prior and Informed Consent (FPIC) to any new developments. Many consumer brand companies in the processed food and personal care product industries have made similar NDPE commitments in the last couple years. The biggest of these, in terms of the quantity of palm oil use, are Unilever, Procter & Gamble, and Nestlé.3 Table 1 gives an overview of major commodity traders that have adopted NDPE policies. Most of these companies have adopted the NDPE policy only recently, and implementation is still in progress. While comparison of the various policies shows that some are more ambitious than others, they all establish the same goals of having independently-‐verified compliance, greater public transparency, and serious sanctions for “repeat offenders” of sustainability policies.
Major palm oil growers and refiners with NDPE policies Table 1
Company name Deadline for supplier
compliance
Public disclosure of suppliers
Suspension of suppliers reported?
Apical Group4 End of 2016 No Yes
Bunge5 None No Not yet
Cargill6 None No Yes
Golden Agri-‐Resources7 None Yes Yes
IOI Corp.8 None Yes Not yet
Kencana Agri9 None No Not yet
Kuala Lumpur Kepong10 None No Not yet
Musim Mas11 End of 2016 Yes Yes
Nestlé12 None No Not yet
Procter & Gamble13 2020 No Not yet
Unilever14 None No Yes
Wilmar15 End of 2015 Yes Yes

4
Wilmar International was the first palm oil trader to publish a full list of its third party suppliers (CPO and PKO mills) in March 2015, and the initiative was followed by Musim Mas and IOI Corp. subsidiary Loders Croklaan, and recently also Golden-‐Agri Resources. The disclosure enables civil society organizations to verify whether these suppliers are involved in activities that are deemed non-‐compliant with purchasing policies. Such evidence is regularly published in online sources, such as Mongabay.com, and otherwise complaints may be filed with the traders’ through their grievance or whistleblower mechanisms.
Suppliers’ accountability is not limited to the activities in plantation estates that directly supply CPO or PKO mills, whose supply base is usually fully planted at the time the mill is constructed. The supplier group, whom owns the mill, can also be held accountable for non-‐compliance in other regions, such as in remote forest areas, peatlands, or indigenous territory from where CPO or PKO cannot yet be procured. As such, even though most palm oil traded originates from Sumatra or Sabah, the purchasing policies can have impacts on growers’ subsidiary activities in different regions, such as Papua or West Africa.
When suppliers are found to be non-‐compliant, the traders’ procurement and sustainability teams typically engage the supplier to explain the purpose and impact of their NDPE policy. If the supplier develops land in contested (forest, peat, conflict) areas, it would be requested to issue a “stop-‐work order” until relevant (HCV, HCS) studies are completed and/or land conflicts are resolved. Supplier groups who fail to enforce such “stop-‐work orders” are at particularly great risk of seeing their trade with NDPE policy signatories suspended or ceased.
2 The 10 largest IDX-‐listed palm oil growers
There are 17 companies listed on the Indonesian Stock Exchange (IDX) whose predominant activities include the management of oil palm plantations and production of CPO/PKO. This study focuses on the 10 largest (Table 2). The revenue and CPO production of the seven companies that have not been part of this study were below IDR 1,500 billion and 150,000 tonnes in 2014 respectively.
The 10 largest IDX-‐listed palm oil companies Table 2
Company name and stock exchange code
Plantation footprint for 2014
(tonnes of CPO production x 1,000)
Revenue for 2014 (IDR x billion)
PT Astra Agro Lestari (AALI) 1,740 16,300
PT Salim Ivomas Pratama (SIMP) 956 15,000
PT Sinar Mas Agro Resources and Technology (SMAR) 730 32,300
PT Dharma Satya Nusantara Group (DSNG) 391 4,900
PT Tunas Baru Lambung (TBLA) 330 6,300
PT Eagle High Plantations (BWPT) 329 2,300
PT Sampoerna Agro (SGRO) 321 3,200

5
Company name and stock exchange code
Plantation footprint for 2014
(tonnes of CPO production x 1,000)
Revenue for 2014 (IDR x billion)
PT Sawit Sumbermas Sarana (SSMS) 242 2,200
PT Bakrie Sumatera Plantations (UNSP) 217 2,600
PT Austindo Nusantara Jaya (ANJT) 184 1,900
Total 5,440 87,000 Palm oil production from Indonesia accounts for approximately 40% of the entire global trade. The crude palm oil and palm kernel oil production of the 10 IDX-‐listed plantation companies accounts for approximately 10% of global production.16 Most Indonesian palm oil growers are either not listed, state-‐owned or listed on other exchanges. The study focused on IDX-‐listed companies, because they are required to disclose any company whose purchases account for more than 10% of total revenue. Their customer base can be tracked down relatively easy, compared to other palm oil growers. Total CPO production of the 10 IDX-‐listed companies can be considered as their plantation footprint. It is an indicator for the number of hectares from which they have been processing harvested Fresh Fruit Bunches (FFB), either from their own or third-‐party plantations. The total productive plantations harvested by the 10 largest companies amounted to approximately 1.4 million hectares in 2014.17 The total revenue of the 10 IDX-‐listed companies amounted to IDR 87,000 billion (USD 7 billion)18 in 2014. This revenue includes sales of products from their downstream operations (refineries, oleochemical companies) and sales of other commodities (notably rubber and sugar).
3 Grower’s largest customers
0 shows all identified trade links between the 10 IDX-‐listed companies and their customers. The links were mostly derived from the quarterly and annual reports of the companies, due to the obligation of Indonesia for listed companies to disclose which companies account for more than 10% of total revenue. Unidentified external customers, especially those of Salim Ivomas Pratama (SIMP), Sinar Mas Agro Resources and Technology (SMART) and Tunas Baru Lampung (TBLA) account for a significant portion of these companies’ trade volume. This is mainly due to relatively large downstream operations and/or internal deliveries of these three companies. This makes it harder for companies buying more than 10% of the CPO from these companies to get on the (obligatory) list of companies whose purchases account for more than 10% of total revenue.

6
Identified trade figures 2014 between IDX-‐listed companies and their Table 3customers (IDR x billion)
Customers The 10 largest IDX-‐listed palm oil plantation companies
Total AALI SIMP SMART DSNG TBLA BWPT SGRO SSMS UNSP ANJT
Golden Agri-‐Resources 1,500 1,400 700 800 1,000 5,400
Wilmar 2,800 1,000 100 200 900 100 5,100
Musim Mas 3,500 600 400 200 4,700
Kuala Lumpur Kepong (KLK) 3,900 3,900
Apical Group 400 400 500 1,300
Inter-‐United Enterprises 1,000 1,000
Permata Hijau Group 900 100 1,000
PT Unilever Indonesia 1,000 1,000
BEST Group 900 900
Louis Dreyfus Commodities 600 200 800
Nestlé 700 700
PT Royal Industries Indonesia 600 600
Hayel Saeed Anam (HSA) Group 500 500
Other identified external customers 400 200 300 900
Identified external customers 13,900 600 1,700 2,400 1,400 1,600 2,100 1,700 1,300 1,100 27,800
Related party sales 0 4,300 22,500 0 1,900 0 0 100 0 0 28,800
Unidentified external customers 2,400 10,100 8,100 2,500 3,000 700 1,100 400 1,300 800 30,400
Total revenue 16,300 15,000 32,300 4,900 6,300 2,300 3,200 2,200 2,600 1,900 87,000
Percentages
Identified external customers 85 4 5 49 22 70 66 77 50 58 32
Related party sales 0 29 70 0 30 0 0 5 0 0 33
Unidentified external customers 15 67 25 51 48 30 34 18 50 42 35
Total revenue 100 100 100 100 100 100 100 100 100 100 100
Of total revenue generated in 2014 by the 10 IDX-‐companies, CRR traced 65% to the customer level (0). Golden Agri-‐Resources, Wilmar, Musim Mas and Kuala Lumpur Kepong were the largest external customers of IDX-‐listed companies, representing over two-‐thirds (68%) of revenue from identified external customers. The main purchases parties related to the 10 IDX-‐companies also came from Golden Agri-‐Resources companies buying from PT Sinar Mas Agro Resources and Technology. PT Salim Ivomas Pratama was a major supplier to companies in the Indofood Group, its parent company.

7
Identified buyers from IDX-‐listed companies Table 4
Buyers NDPE policy?
Purchase as an external customer
(IDR x billion)
Purchase as a related party (IDR x billion)
Golden Agri-‐Resources Yes 5,400 22,600
Wilmar Yes 5,100 0
Musim Mas Yes 4,700 0
Indofood19 No 0 4,300
Kuala Lumpur Kepong (KLK) Yes 3,900 0
Sungai Budi Group20 No 0 1,900
Apical Group Yes 1,300 0
Permata Hijau Group21 No 1,000 0
Inter-‐United Enterprises22 No 1,000 0
Unilever Yes 1,000 0
BEST Group23 No 900 0
Louis Dreyfus Commodities24 No 800 0
Nestlé Yes 700 0
PT Royal Industries Indonesia25 No 600 0
Hayel Saeed Anam (HSA) Group26 No 500 0
Other n.a. 400 - yes; 500 - no 0
Total 27,800 28,800
Applying NDPE policy 80.9% 78.5% A striking finding of this analysis is that buyers with NDPE policies generated over 80% of the top 10 largest IDX-‐listed palm oil growers’ total revenue from identified third party customers, and 78.5% of revenue generated from related parties. Essentially, a large majority of the sales revenue of the sampled IDX-‐listed palm oil companies is subject to NDPE policies In the next chapter, we present further details of each IDX-‐listed company group.
8
4 Risk exposure assessment for each IDX-‐listed company
4.1 PT Astra Agro Lestari (Astra)
4.1.1 Astra’s main customers
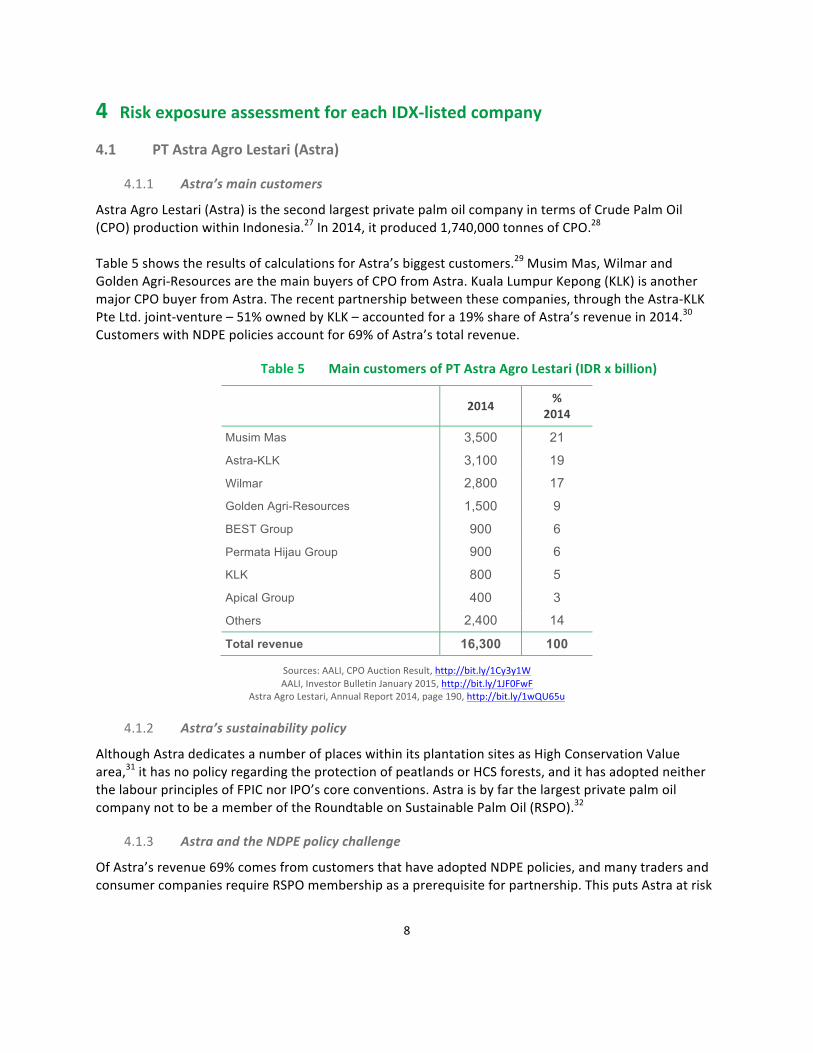
Astra Agro Lestari (Astra) is the second largest private palm oil company in terms of Crude Palm Oil (CPO) production within Indonesia.27 In 2014, it produced 1,740,000 tonnes of CPO.28 Table 5 shows the results of calculations for Astra’s biggest customers.29 Musim Mas, Wilmar and Golden Agri-‐Resources are the main buyers of CPO from Astra. Kuala Lumpur Kepong (KLK) is another major CPO buyer from Astra. The recent partnership between these companies, through the Astra-‐KLK Pte Ltd. joint-‐venture – 51% owned by KLK – accounted for a 19% share of Astra’s revenue in 2014.30 Customers with NDPE policies account for 69% of Astra’s total revenue.
Main customers of PT Astra Agro Lestari (IDR x billion) Table 5
2014 % 2014
Musim Mas 3,500 21
Astra-KLK 3,100 19
Wilmar 2,800 17
Golden Agri-Resources 1,500 9
BEST Group 900 6
Permata Hijau Group 900 6
KLK 800 5
Apical Group 400 3
Others 2,400 14
Total revenue 16,300 100
Sources: AALI, CPO Auction Result, http://bit.ly/1Cy3y1W AALI, Investor Bulletin January 2015, http://bit.ly/1JF0FwF
Astra Agro Lestari, Annual Report 2014, page 190, http://bit.ly/1wQU65u
4.1.2 Astra’s sustainability policy
Although Astra dedicates a number of places within its plantation sites as High Conservation Value area,31 it has no policy regarding the protection of peatlands or HCS forests, and it has adopted neither the labour principles of FPIC nor IPO’s core conventions. Astra is by far the largest private palm oil company not to be a member of the Roundtable on Sustainable Palm Oil (RSPO).32
4.1.3 Astra and the NDPE policy challenge
Of Astra’s revenue 69% comes from customers that have adopted NDPE policies, and many traders and consumer companies require RSPO membership as a prerequisite for partnership. This puts Astra at risk

9
of losing much of its commercial base, which could have a serious negative impact on the company’s bottom line. Astra was recently publicly criticized for its weak sustainability policy and its alleged impacts such as forest loss, peatland drainage and conversion of endangered species habitat. Several NGOs, especially the US-‐based NGO Forest Heroes, started campaigning activities.33 In response to its exposure, the company announced on 11 June 2015 that it had introduced an immediate moratorium whereby it will stop all land conversion. It committed to ensure that there will be no clearance of any natural forest either by the Astra or any of its contractors across all its operations in Indonesia. “Consistent with the principles of no deforestation, respect for community rights and the conservation of peatlands, AAL is now in the process of formulating a detailed sustainability policy which will include the need for carrying out High Conservation Value (HCV) and High Carbon Stock (HCS) assessments prior to any future expansion.”34
4.2 PT Salim Ivomas Pratama (SIMP)
4.2.1 SIMP’s main customers
PT Salim Ivomas Pratama (SIMP) is the direct parent of PT PP London Sumatra Indonesia (LSIP), which is also listed on the Indonesian Stock Exchange. SIMP (including LSIP) produced 956,000 tonnes of CPO in 2014.35 SIMP is the third largest private palm oil company in terms of Crude Palm Oil (CPO) production within Indonesia.36 SIMP’s direct parent company is Indofood Agri Resources Ltd (IndoAgri), which is listed on the Singapore Stock Exchange. SIMP, LSIP and IndoAgri are all part of the Indofood Group, which is Indonesia’s largest food company. The Hong Kong-‐listed First Pacific Company Limited, which is controlled by Mr. Anthoni Salim, has a 50.1% stake in Indofood and 60.5% stake in IndoAgri. Salim also has stakes in other businesses than First Pacific, some of which are also related to the palm oil plantation business.37 SIMP’s annual report shows the same revenue and oil palm business as IndoAgri’s annual report. IndoAgri had a revenue of IDR 15.0 trillion (~ USD 1.2 billion) in 2014.38 Oil palm is its dominant crop, followed by sugar cane, rubber and others.39 In 2014, IDR 12 trillion in revenue was derived from SIMP’s sales of cooking oils, margarine and shortening, followed by sales of its sugar, rubber and coconut operations (Table 6).40
Main customers of PT Salim Ivomas Pratama (IDR x billion) Table 6
2014 % 2014
PT Indofood CBP Sukses Makmur (ICBP, purchases are meant for manufacturing consumer branded products by ICBP) 1.8 12
PT Indomarco Adi Prima (Distribution) 1.4 9
Musim Mas Group 0.6 4

10
2014 % 2014
PT Indomarco Prismatama (Retail company, 10,593 Indomaret minimarkets in Indonesia.)41 0.4 3
PT Indolakto (Dairy) 0.2 1
Shanghai Resources International Trading Co (Trading company owned by Mr. Anthoni Salim) 42 0.2 1
PT Inti Cakrawala Citra (12 Indogrosir wholesale centers in main cities)43 0.2 1
PT Indofood Fritolay Makmur (Snack foods. 51% owned by ICBP, 49% by PepsiCo) 0.1 1
Others 10.1 68
Total revenue 15.0 100
Only 32 percent of SIMP’s revenue was traced to customers.
Sources: Salim Ivomas Pratama, Financial statement 31/12/2014, http://bit.ly/1xT5PDMP; PT PP London Sumatra Indonesia, Financial statement 31/12/2014, page 85, http://bit.ly/1BH0MkR
Indofood CBP, Annual report 2014, http://bit.ly/1Jv5nzA. Indofood, Annual report 2014, http://bit.ly/1PB3uC1
CPO (and palm kernel) customers generated almost IDR 3 trillion (20 percent) of IndoAgri’s revenue in 2014.44 IndoAgri’s CPO customers in 2014 were the main traders/processors: Musim Mas, Wilmar and IOI. Musim Mas purchased IDR 566 billion worth of CPO and/or palm kernel from IndoAgri’s subsidiary PT PP London Sumatra Indonesia (Lonsum) in 2014.45 The lists of mills supplying Wilmar and IOI show that IndoAgri’s subsidiaries PT Salim Ivomas Pratama Tbk (SIMP) and Lonsum delivered CPO and/or palm kernel oil to Wilmar and IOI from at least ten mills in 2014.46 IndoAgri sold IDR 4.3 trillion (29 percent) worth to related parties in 2014. These are companies within the Indofood group, or within the wider influence of Anthoni Salim.47 Procter & Gamble and PT Unilever Indonesia are likely also large (indirect) customers of IndoAgri, considering their large trade purchases from Indofood CBP Sukses Makmur in 2013 and 2014.48 However, it is not clear whether these purchases relate to palm oil. The majority of palm oil used by Unilever Indonesia is for margarine (Blue Band brand), ice cream (among other Wall’s), soaps and home care products (such as Pepsodent tooth paste).49 Some joint ventures of First Pacific and Indofood are interesting in the context of NDPE policy. In March 2015, Wilmar and First Pacific -‐ the parent company of Indofood -‐ completed a 50-‐50 acquisition of Goodman Fielder, a leading food company across Australia, New Zealand and Asia Pacific.50 PT Indofood Sukses Makmur has a 50/50 joint venture with Nestlé: PT Nestlé Indofood Citarasa Indonesia.51 PT Indofood CBP Sukses Makmur Tbk (ICBP) has a 51/49 joint venture on snack foods with PepsiCo.52
4.2.2 SIMP’s sustainability policy
In its 2013 Sustainability Report, IndoAgri lists the protection of primary forests, peatland and High Conservation Value (HCV) areas as one of its sustainability principles. Furthermore, IndoAgri states that

11
it respects the concept of Free, Prior and Informed Consent (FPIC) for communities on new developments.53 IndoAgri has not yet taken a stance on High Carbon Stock (HCS) areas. In addition, the company has made no specific statements on compliance with the ILO core conventions, though it has made statements with regard to prohibition of all forms of child or forced labour, freedom of association and the elimination of discrimination.54 IndoAgri’s certified sustainable palm oil (CSPO) production stood at 332,000 tonnes at the end of 2014, or 35% of its total CPO production.55 The present certified mils and supply bases are all located in Sumatra. So far no certification assessments have started for IndoAgri’s Kalimantan operations.56
4.2.3 SIMP and the NDPE policy challenge
It is estimated that SIMP’s revenue covers customers with a NDPE policy in the range of 20 to 30 percent. The group is an important player in Indonesia’s domestic consumer goods market, where sustainability concerns are still in their infancy. However, SIMP trades with NDPE policy signatories Wilmar and IOI. Furthermore, First Pacific and Indofood have joint ventures with Wilmar, Nestlé and PepsiCo whilst Procter & Gamble and PT Unilever Indonesia are likely palm oil customers of Indofood.
4.3 PT Sinar Mas Agro Resources and Technology (SMART)
4.3.1 SMART’s main customers
SMART is part of Singapore-‐based Golden Agri-‐Resources (GAR). With an area of 470,000 hectares, including plasma estate, planted with oil palm, GAR is by far the largest private palm oil plantation company in Indonesia.57 SMART manages 139,000 hectares of GAR’s total land bank. In 2013, SMART produced 730,000 tonnes of CPO58 -‐ which, using average 2014 prices, means the company had a revenue of approximately IDR 6 billion.59 SMART’s revenue is derived mainly from downstream activities. Its CPO is processed into value-‐added bulk, industrial and branded products through its own refineries, with a total capacity of 2.3 million tonnes per annum. Its palm kernel crushing plants have an annual capacity of 480 thousand tonnes, producing higher-‐value palm kernel oil and palm kernel meal. SMART also distributes, markets and exports palm-‐based consumer products. In addition to bulk and industrial oil, SMART also markets its refined products under several brands, such as Filma and Kunci Mas.60 Most of SMART’s revenue is generated by related parties that are incorporated under Golden-‐Agri Resources. As Table 7 shows, only 30% is generated by external customers. No external customers generate more than IDR 3,200 billion of SMART’s revenue, otherwise SMART would have to mention them in its quarterly reports.
Main customers of PT SMART (IDR x billion) Table 7
2013 2014 %
2013 %
2014

12
2013 2014 %
2013 %
2014
Related parties 16,472 22,532 69 70
External customers 7,463 9,809 31 30
Total revenue 23,935 32,341 100 100
Source: PT SMART, Financial statement 31/12/2014, pages 87 and 93, http://bit.ly/1N5rvDf Some information on SMART’s main external customers was traced by reviewing the lists of trade receivables in its 2014 quarterly reports.61 Table 8 shows the results of our estimates, based on SMART’s average share of total trade receivables from third parties for each quarter. Unilever and Nestlé turn out be SMART’s largest external customers, assuming the receivables they owe SMART represents revenue generated from third parties.
Estimates for SMART’s main external customers (IDR x billion) Table 8
Estimated revenue
generated for SMART in 2014
SMART’s % of trade
receivables from third parties
during 2014
PT Unilever Indonesia 1,000 10.7
Nestlé Thai, Indonesia and Pakistan 700 7.1
PT Sumi Asih62 500 5.3
Agri Resindo Holdings Pte Ltd. 400 4.1
Marubeni Corporation-‐Tokyo 300 2.9
Others 6,900 69.9
Total revenue external customers 9,800 100.0
Source: SMART, Announcements to Indonesian Stock Exchange, Quarterly reports 2014, http://bit.ly/1zCAW6t
4.3.2 SMART’s sustainability policy
As a subsidiary of Golden Agri-‐Resources, SMART is subject to GAR’s NDPE policy.63 GAR has not set a deadline for compliance by its suppliers. In February 2010, GAR decided not to develop on any peatland regardless of depth, although the Government of Indonesia allows planting on peatland less than 3 metres deep.64 GAR currently co-‐chairs the Indonesian HCV Task Force, which was formed to explore means for effectively securing HCV areas in oil palm development regions in Indonesia in line with RSPO Principles and Criteria (P&C), and to explore options for reforming local and national laws and procedures for securing HCV areas and accommodating the RSPO P&C.65

13
SMART has been an RSPO member since 29 January 2005. It expects to achieve RSPO certification for 100% of its estates by 201566, as does GAR.67 However, GAR’s palm oil operations established after 30 June 2010 will be part of a separate time-‐bound plan.68
4.3.3 SMART and the NDPE policy challenge
SMART has an NDPE policy itself. Its policy may attract customers like Unilever and Nestlé that have also adopted the NDPE policy. On the other hand, lack of progress in implementing its NDPE policy may result in pressure from those same customers. Unilever and Nestlé, both of which have suspended trade with GAR/SMART in 2010, generated an estimated 5% (30% of 17.8%) of PT SMART’s revenue in 2014. In May 2015, The Forest Trust suspended its partnership with GAR following confirmation of several breaches of PT SMART’s Forest Conservation Policy (FCP).69 Although TFT does not trade in palm oil, its decision may well affect purchasing decisions by its other members, which include Nestlé, Unilever, Mars and others. In response, GAR issued a statement in which it re-‐commits to leading our industry's sustainability efforts, as the first Indonesian oil palm company to commit to zero deforestation.70
4.4 PT Dharma Satya Nusantara Group (DSNG)
4.4.1 DSNG’s main customers
DSNG’s CPO production amounted to 391,000 tonnes in 2014.71 In its presentation of results for 2014, DSNG states: “Our customers are primarily Indonesian CPO refineries located in Kalimantan and Java, close to DSN’s operations. Regular customers include SMART (GAR), Wilmar, Kuala Lumpur Kepong, Musim Mas and Dermaga Kencana Indonesia (50/50 joint-‐venture Kencana Agri/Louis Dreyfus Commodities). The company expects Astra’s new refinery on Sulawesi Island to become a customer in the near future as well.”72 Table 9 shows DSNG’s main customers, with revenue from PT Binasawit Abadi Pratama until 30/9/2014 and 30/9/2013 added.73
Main customers of PT Dharma Satya Nusantara Group Table 9(IDR x billion)
2013 2014 %
2013 %
2014
Golden Agri-‐Resources 1,464 1413 38 29
Wilmar International 872 988 23 20
Others 1,506 2,497 39 51
Total revenue 3,842 4,898 100 100
Source: Dharma Satya Nusantara Group, Financial statement 31/12/2014, http://bit.ly/1EXR27O; DSNG, Financial statement 30/9/2014, 29 October 2014, http://bit.ly/1zCAW6t
4.4.2 DSNG’s sustainability policy
14
In a recent presentation for investors DSNG stated: “We have set aside 6,600 hectares of land, or an area roughly equivalent to 10% of our total planted area, for conservation purposes.”74 No statements regarding HCS, peat, FPIC/ILO could be found on the company’s website or in its 2014 annual report. DSNG has been an RSPO member since 4 December 2012. The company plans to have all of its estates certified by 2015, and associated smallholders and independently sourced FFB by 2021.75
4.4.3 DSNG and the NDPE policy challenge
Wilmar International and Golden Agri-‐Resources generated at least 49% of DSNG’s revenue in 2014. DSNG also supplied to Musim Mas and Kencana Agri, companies that also have an NDPE policy. Our estimate is that at least 50% of DSNG’s revenue is generated by companies with an NDPE policy.
4.5 PT Tunas Baru Lampung (TBLA)
4.5.1 TBLA’s main customers
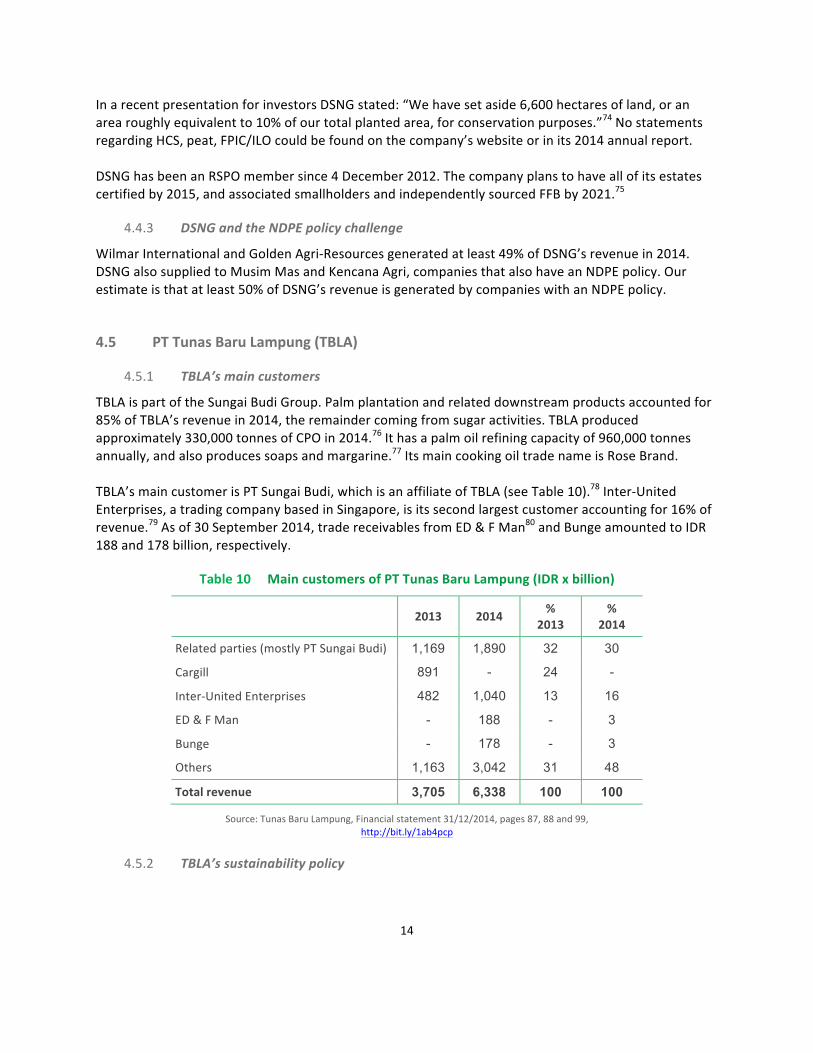
TBLA is part of the Sungai Budi Group. Palm plantation and related downstream products accounted for 85% of TBLA’s revenue in 2014, the remainder coming from sugar activities. TBLA produced approximately 330,000 tonnes of CPO in 2014.76 It has a palm oil refining capacity of 960,000 tonnes annually, and also produces soaps and margarine.77 Its main cooking oil trade name is Rose Brand. TBLA’s main customer is PT Sungai Budi, which is an affiliate of TBLA (see Table 10).78 Inter-‐United Enterprises, a trading company based in Singapore, is its second largest customer accounting for 16% of revenue.79 As of 30 September 2014, trade receivables from ED & F Man80 and Bunge amounted to IDR 188 and 178 billion, respectively.
Main customers of PT Tunas Baru Lampung (IDR x billion) Table 10
2013 2014 %
2013 %
2014
Related parties (mostly PT Sungai Budi) 1,169 1,890 32 30
Cargill 891 - 24 -
Inter-‐United Enterprises 482 1,040 13 16
ED & F Man - 188 - 3
Bunge - 178 - 3
Others 1,163 3,042 31 48
Total revenue 3,705 6,338 100 100
Source: Tunas Baru Lampung, Financial statement 31/12/2014, pages 87, 88 and 99, http://bit.ly/1ab4pcp
4.5.2 TBLA’s sustainability policy

15
No statements regarding HCV, HCS, peat, fires, FPIC and ILO could be found on the company’s website and in its 2013 annual report.81 TBLA has been an RSPO member since 23 July 2006. It expects to achieve RSPO certification for 100% of its estates by 2021.82 So far, one of its mills and supply bases has already been certified under the RSPO scheme.83
4.5.3 TBLA and the NDPE policy challenge
TBLA does not conduct significant business with NDPE policy signatories. From the customers traced, only Bunge has an NDPE policy.
4.6 PT Eagle High Plantations (BWPT)
4.6.1 BWPT’s main customers
PT Eagle High Plantations was established in December 2014 after the reverse takeover by Rajawali Corporation, which acquired the holdings and the stock exchange listing of BW Plantation. As of March 2015, PT Rajawali Capita owned 65.5% of shares in PT Eagle High Plantations.84 Table 11 below shows BWPT’s main customers in 2014 and 2013. In 2014, Golden Agri-‐Resources was the main customer of the newly expanded company, accounting for at least 29% of its revenue. The second largest customer was Louis Dreyfus, considering the 18% it bought directly, and 19% through its 50/50 joint venture with Kencana Agri, PT Dermaga Kencana Indonesia (PT DKI). Louis Dreyfus has an agreement with Kencana Agri that it will buy 100% of products derived from the trading and refinery company PT DKI.85
Main customers of PT Eagle High Plantations (IDR x billion) Table 11
2013 2014 %
2013 %
2014
Golden Agri-‐Resources 467 653 27 29
Kencana Agri / Louis Dreyfus 330 423 19 19
Louis Dreyfus 442 411 26 18
Wilmar International 321 92 19 4
Others 171 685 10 30
Total revenue 1,731 2,264 100 100
Source: Eagle High Plantations, Financial statement 31/12/2014, page 107, http://bit.ly/1xIeN6z; PT BW Plantation and Its Subsidiaries, Preliminary Offering Circular, 5 November 2014.
Customers accounting for some 30% of BWPT’s revenue in 2014, remain unidentified, though trade receivables as of 31/12/2014 reveal some other buyers: Wilmar’s subsidiary PT Multimas Nabati Asahan, Indofood and the Apical Group.86 The Wings Group is another of BWPT’s buyers, considering advance

16
payments amounting to IDR 211 billion by its subsidiary, PT Karya Indah Alam Sejahtera as of 31/12/2014.87
4.6.2 BWPT’s sustainability policy
No statements regarding HCS, peat and FPIC/IPO could be found either on the expanded company’s website88 or in its financial statement dated 31/12/2014. BW Plantation, the company prior to expansion, claimed to have carried out High Conservation Value assessments for all of its plantations.89 The Green Eagle group, prior to the expansion, had stated that its policy on peat going forward was to plant only on mineral soil.90 Neither statement, however, reflects the current position of the entire company. BW Plantation has been an RSPO member since 21 March 2008. No Annual Communication of Progress reports could be found. The preliminary offering circular of November 2014 mentions that BW Plantation was seeking to secure RSPO certification for all of its oil palm plantations by 2018.91 Green Eagle Holdings became a member more recently. Its membership is now in the name of PT Eagle High Plantations.92 The certification body, Mutuagung Lestari, announced on 11 March 2015 that it would conduct preliminary assessments on three estates and one mill in Central Kalimantan.93
4.6.3 BWPT and the NDPE policy challenge
At least 52% of BWPT’s revenue in 2014 was generated by signatories to the NDPE policy.94
4.7 PT Sampoerna Agro (SGRO)
4.7.1 SGRO’s main customers
SGRO’s CPO production amounted to 321,000 tonnes in 2014, while the average price for the CPO it sold amounted to IDR 8,351 per kg.95 This puts the figure for SGRO’s CPO revenue at IDR 2.7 billion, or 83% of its total revenue for 2014. Table 12 below shows SGRO’s main customers, based on its financial statement dated 31/12/2014.96 Up to then, Sampoerna Agro’s main customers were Golden Agri-‐Resources (25%), PT Royal Industries Indonesia (18%) and the Apical Group (12%). Revenues from Wilmar have decreased substantially compared to 2013 and now account for only 2 percent of total revenue. There was no trade with related parties during 2013 and 2014. The lists of mills supplying to Musim Mas and IOI show 2014 deliveries from 5 and 3 SGRO mills respectively.97
Main customers of PT Sampoerna Agro (IDR x billion) Table 12
2013 2014 %
2013 %
2014
Golden Agri-‐Resources 406 796 16 25
PT Royal Industries Indonesia 247 583 10 18
Apical Group 165 398 6 12

17
2013 2014 %
2013 %
2014
PT Wahana Citra Nabati 103 250 4 8
Wilmar International 367 71 14 2
Others 1,273 1,144 50 35
Total revenue 2,561 3,242 100 100
Source: Sampoerna Agro, Financial statement 31/12/2014, page 84, http://bit.ly/1xt4VgB; Sampoerna Agro, Financial statement 30/9/2014, http://bit.ly/1zCAW6t
4.7.2 SGRO’s sustainability policy
SGRO’s sustainability report for 2013, included in its 2013 annual report, states: “The Company identifies areas that have high conservation value (HCV) before undertaking land clearing.”98 With regard to social issues the company states: “Therefore, pursuant to its internal policies, the Company neither employs under-‐age minors nor carries out forced labour practices.” Employees at SGRO have access to labour unions, while agreements between labour unions and management are outlined in collective labour agreements (CLA).99 No statements regarding HCS, peat or FPIC could be found on the company’s website or in its 2013 annual report. SGRO has been an RSPO member since 9 January 2007. It expects to achieve RSPO certification for 100% of its estates by 2017 and for 100% of its associated smallholders and out-‐growers by 2020.100
4.7.3 SGRO and the NDPE policy challenge
Our estimate is that around 50% of SGRO’s revenue is generated by signatories to the NDPE policy. Golden Agri-‐Resources, the Apical Group and Wilmar International accounted for already 39% of SGRO’s revenue in 2014.
4.8 PT Sawit Sumbermas Sarana (SSMS)
4.8.1 SSMS’s main customers
SSMS’s CPO production amounted to 242,000 tonnes in 2014.101 Its customer base has changed in 2014, compared to 2013. In 2014, Wilmar has largely stopped buying from the company, while Golden Agri-‐Resources (GAR) and the Apical Group have increased their purchases. As Table 13 below shows, GAR currently accounts for almost half of SSMS’s revenue, while Apical Group purchases account for a further twenty-‐five percent.102
Main customers of PT Sawit Sumbermas Sarana (IDR x billion) Table 13
2013 2014 %
2013 %
2014
Golden Agri-‐Resources 518 1,026 26 47
Apical Group 39 535 2 25

18
2013 2014 %
2013 %
2014
Wilmar 995 177 51 8
Related party: PT Tanjung Sawit Abadi 285 51 15 2
Others 125 393 6 18
Total revenue 1,962 2,182 100 100
Source: SSMS, Quarterly reports and annual report 2013, http://bit.ly/1zCAW6t
4.8.2 SSMS’s sustainability policy
In an investor presentation dated March 2015, SSMS lists several commitments with regard to sustainability: no burning; no planting on High Conservation Value (HCV) areas; a zero waste policy; HCV assessments; and conservation area development.103 However, SSMS has no policies on peatland, High Carbon Stock (HCS) areas, the principle of Free, Prior and Informed Consent (FPIC) for communities, or core conventions of the ILO. SSMS has been a member of the RSPO since 17 April 2007. One of its mills and supply bases is certified, and a second mill has been assessed recently. SSMS expects two more mills and supply bases to be certified by 2016. No commitment is known with regard to RSPO certification for two other recently acquired plantation companies.104 On 8 June 2015 the UK-‐based NGO the Environmental Investigation Agency (EIA) and its Indonesian partner JPIK Kalteng lodged a formal complaint with the RSPO against SSMS and its subsidiary PT Sawit Mandiri Lestari (PT SML). EIA argued, after a field investigation, that the required HCV Assessment and Social and Environmental Impact Assessment (SEIA) for PT SML were seriously flawed and affected communities did not have opportunity to participate in them. The total amount of forests scheduled for clearance comprises 10,100 ha, a known orangutan habitat.105 In the beginning of June 2015 the NGO Greenomics Indonesia reported that SSMS had continued clearing of forested peatlands and orangutan habitat between November 2014 and May 2015.106
4.8.3 SSMS and the NDPE policy challenge
Companies that have an NDPE policy account for 80 percent of SSMS’s revenue. Following the RSPO-‐complaint filed by EIA, Golden Agri-‐Resources published its decision to suspend "all new purchases [from SSMS] until these allegations have been thoroughly investigated."107 Wilmar International had already severely scaled back purchases from SSMS in early 2014, leaving NDPE policy signatory Apical to decide whether it will enforce its policy on its supplier or that it will fill the sale gap left by SSMS’ former main buyers.
4.9 PT Bakrie Sumatera Plantations (UNSP)
4.9.1 UNSP’s main customers

19
UNSP’s CPO production amounted to an estimated 217,000 tons in 2014.108 Wilmar and Musim Mas are UNSP’s main customers. Together they account for approximately half of its total revenue.
Main customers of PT Bakrie Sumatera Plantations (IDR x billion) Table 14
2013 2014 %
2013 %
2014
Wilmar 520 934 25 35
Musim Mas 288 421 14 16
Others 1,268 1,282 61 49
Total revenue 2,076 2,637 100 100
Source: Bakrie Sumatera Plantations, Financial statement 31/12/2014, page 98, http://bit.ly/1ain9H5
4.9.2 UNSP’s sustainability policy
UNSP sets aside High Conservation Value (HCV) areas.109 No statements regarding HCS, peat or FPIC/IPO could be found on the company’s website or in its 2013 annual report. UNSP has been a member of the RSPO since 22 May 2007. It expects to achieve RSPO certification for 100% of its own, and associated smallholder and out-‐grower estates by 2015.110
4.9.3 UNSP and the NDPE policy challenge
Wilmar and Musim Mas, both signatories to the NDPE policy, account for more than 51% of UNSP’s revenue.
4.10 PT Austindo Nusantara Jaya (ANJT)
4.10.1 ANJT’s main customers
ANJT’s CPO production amounted to 184,000 tonnes in 2014.111 As Table 15 below shows, its main customers were the Hayel Saeed Anam Group and Musim Mas, accounting for 26% and 12% of net revenue respectively.112
Main customers of PT Austindo Nusantara Jaya (IDR x billion) Table 15
2013 2014 %
2013 %
2014
Hayel Saeed Anam (HSA) Group 231 486 14 26
Musim Mas 166 238 10 12
Louis Dreyfus Commodities 29 157 2 8
Permata Hijau Group 202 102 12 5
FELDA IFFCO/Tabung Haji 219 81 13 4

20
2013 2014 %
2013 %
2014
Wilmar 135 51 8 3
Others 703 787 42 42
Total revenue 1,685 1,902 100 100
Source: Austindo Nusantara Jaya, Quarterly report 2014, http://bit.ly/1HPzxt4
In the first quarter of 2015 Golden Agri-‐Resources surfaced as a main customer of ANJT, covering 43 percent of revenue over the three months. The Apical group followed with 11 percent.113 GAR’s purchases were suspended in Q2, however.
4.10.2 ANJT’s sustainability policy
ANJT claims it conducts High Conservation Value (HCV) area assessments regularly, and implements the RSPO’s New Planting Procedures (NPP).114 No statements regarding HCS, peat or FPIC/ILO could be found on the company’s website or in its 2013 annual report. ANJT has been a RSPO member since 26 February 2007. It expects to achieve RSPO certification for 100% of its estates by 2019, and for 100% of its associated smallholders and outgrowers by 2018.115
4.10.3 ANJT and the NDPE policy challenge
At least 15% of ANJT’s revenue in 2014 was generated from NDPE signatories. Customers accounting for 42% of its revenue remain unidentified, while customers without an NDPE policy make up the remaining 43%. For this report it was estimated that 20 to 40% of ANJT’s revenue in 2014 was generated from NDPE signatories. ANJT’s practices in West Papua have been criticized for their clearance of intact forest landscapes.116 In April 2015, Wilmar suspended with immediate effect trade with ANJT, a decision followed by GAR in May.117

21
5 Assessment of business risk exposure
5.1 Risk assessment results
Table 16 presents CRR’s summary business risk assessment for each of the largest 10 IDX-‐listed palm oil growers (see below for methodology):
IDX-‐listed palm oil growers’ risk exposure due to NDPE purchasing policies Table 16
IDX-‐listed palm oil grower Overall risk
exposure
Assessment results
Grower policy versus NDPE policy
RSPO progress
(membership and time-‐
bound estate certification
plan)
NDPE challenge (% of customers
with an NDPE policy)
PT Sinar Mas Agro Resources and Technology (SMART) Medium Full NDPE policy. Substandard compliance 2015 < 10%
PT Astra Agro Lestari (AALI) High Some commitment on HCV. None on peat, HCS, FPIC, ILO Non member 69%
PT Salim Ivomas Pratama (SIMP) Medium Says no to peat. Some commitment on HCV. None on HCS, FPIC and ILO 2016 20%-‐30%
PT Tunas Baru Lampung (TBLA) Medium None on HCV, peat, HCS, FPIC, ILO 2021 < 10%
PT Dharma Satya Nusantara Group (DSNG) High Some commitment on HCV.
None on peat, HCS, FPIC, ILO 2015 > 50%
PT Sampoerna Agro (SGRO) High Some commitment on HCV and ILO. None on peat, HCS, FPIC 2017 ~50%
PT Bakrie Sumatera Plantations (UNSP) High Some commitment on HCV.
None on peat, HCS, FPIC, ILO 2015 > 50%
PT Eagle High Plantations (BWPT) High Enlarged company has made no commitments on HCV, peat, HCS, FPIC, ILO Just starting > 50%
PT Sawit Sumbermas Sarana (SSMS) High Some commitment on HCV. None to peat, HCS, FPIC, ILO
No date, but progress 80%
PT Austindo Nusantara Jaya (ANJT) Medium Some commitment on HCV. None to peat, HCS, FPIC, ILO 2019 ~20%-‐40%
CRR’s main findings: • Nine out of ten largest IDX-‐listed growers’ commitments to sustainable practices are not up to par
with buyer/traders’ “No Deforestation, No Peat, No Exploitation” (NDPE) purchasing policies. Seven out of the ten sell 50% or more CPO/PKO to buyers whom have adopted such policies;
• Two (SSMS and ANJT) growers have recently seen their business suspended over sustainability concerns. Two other growers (SMART and Astra) were recently forced by market parties to (re) affirm their commitment to high sustainability standards.

22
5.2 Can IDX-‐listed growers avert NDPE policies?
There is growing evidence that major palm oil buyers are prepared to diminish, suspend or cancel trade with suppliers that are suspected or proven to be non-‐compliant with sustainable purchasing policies. We expect the finance community to follow suit, whilst government regulations and certification schemes are less likely to hold growers accountable for practices that are not accepted in the market place. This industry transformation is largely driven by personal commitments by major palm oil trading companies’ top management, even when such commitments were the result of civil society campaigns. As a result, growers will have to respond to this dramatic industry transformation. Growers have the option to work towards NDPE policy compliance, or to redirect their sales to alternative markets, which are quickly diminishing. When growers opt to comply with their buyers NDPE policies, direct costs involved are manageable, although no “green premiums” should be expected – although buyers may grant growers preferential treatment. The main cost that may affect some growers would involve the opportunity cost of foregoing development of legally awarded landbanks with HCV, HCS, or peatland. Additionally, growers may have to absorb losses due to previous investments incurred (payment for permits, land compensation expenses). The opportunity cost incurred will vary greatly among growers. Growers that would choose to avoid buyers with NDPE policies by targeting markets with lower sustainability standards will face considerable challenges. In the more remote areas of Indonesia, growers’ CPO output would have to be shipped out, and the required port facilities may not be available. Even when CPO is sent to markets with low sustainability standards, the final retailer may be a subsidiary of companies that have committed to NDPE policies (e.g. Unilever in India, Nestlé in China). With efforts to make palm oil traceable to the source, growers will encounter increasing difficulty to access new overseas markets. Most such growers would opt to access Indonesia’s biofuel market, which is the current government’s priority target for redirecting fossil fuel subsidies. The main player in this market is the state-‐owned company Pertamina, which has no real sustainability policy on palm oil procurement. Given the commitment of the current Indonesian government to put an end to deforestation and peatland conversion, we expect that sustainability criteria will inevitably be introduced in Indonesia’s domestic biofuel market as well. The main game for growers with weak sustainability commitments would be to attempt to stall and clear as much land as possible, putting them in non-‐compliance with traders that have NDPE policies. We believe that this approach may have dominated various IDX-‐listed companies’ business plans until now. However, it is clear that this strategy cannot be sustained for long the commercial palm oil trade moves forward toward greater levels of transparency and sustainability.

23
Methodology
Assessment of company policy versus NDPE policy
The sustainability policies of IDX-‐listed palm oil companies were assessed by looking at their commitments with regard to climate change, biodiversity and social issues. For climate change, the existence of policies to not clear carbon-‐rich peatlands for oil palm cultivation was the main criterion, while the main criterion for biodiversity was the protection of High Conservation Value (HCV) areas. For both climate change and biodiversity, the protection of High Carbon Stock (HCS) areas was another important criterion. For social issues, there were two main criteria. The first was the recognition of local communities’ right to give or withhold their Free, Prior and Informed Consent (FPIC) to any new developments on their lands. The second was the recognition of the International Labour Organization (ILO) of the United Nations’ fundamental rights with regard to labor. These rights are laid down in eight conventions dealing with: freedom of association and the effective recognition of the right to collective bargaining; the elimination of all forms of forced or compulsory labour; the effective abolition of child labour; and the elimination of discrimination in respect of employment and occupation.118 Many companies claim to protect High Conservation Value (HCV) areas in their annual reports; however, they rarely provide evidence of the location and amount of land that are being protected to preserve ecological, cultural and social values. For the purpose of this assessment, this often led often to categorizing a company as having “some commitment on HCV.” Ultimately, company assessments were based on four main indicators, with one point given for each of the following: HCV protection, peatland protection, HCS protection, and upholding FPIC/ILO rights. A total score of zero or one point would result in the RED category; two or three points in ORANGE; and four points in GREEN.
Assessment of RSPO progress
For rankings on RSPO progress, two criteria were used: a company’s membership in the RSPO, and its time-‐bound plan to achieve 100% certification for its own estates. Non-‐membership and 100% certification after 2020 scored RED (0 points), RSPO membership and 100% certification between 2016 and 2019 scored ORANGE (1 point), while 100% certification by 2015 scored GREEN (two points).
Assessment of NDPE challenge
The risks that some IDX-‐listed companies might face from their buyers with NDPE policies were evaluated on the extent to which these customers have applied and enforced the NDPE policy. Indonesia’s Ministry of Finance requires that IDX-‐listed companies disclose, in their quarterly and annual reports, the customers that have generated more than 10% of their revenue.119 Such data provides insight into the customer base of IDX-‐listed companies, though there are some limitations. Some IDX-‐listed companies have relatively large downstream operations and/or internal deliveries. This makes it harder for companies buying more than 10% of the CPO from these companies to get on the list of companies whose purchases account for more than 10% of total revenue. Another limitation is that
24
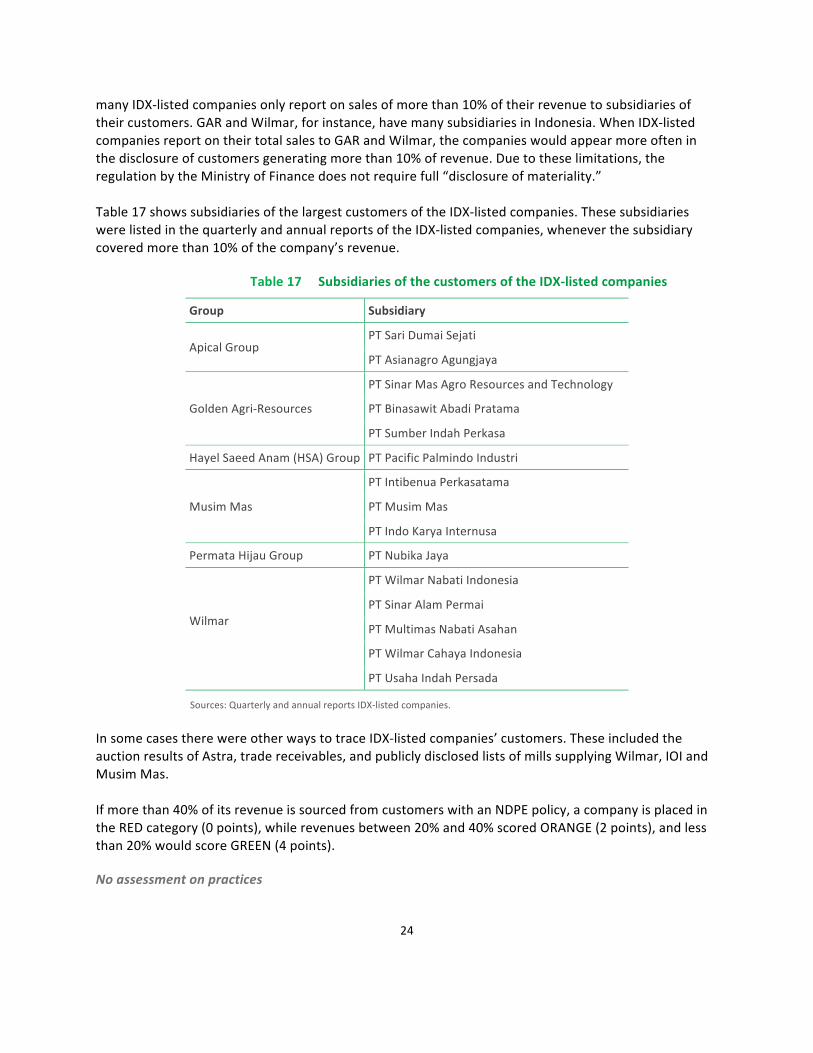
many IDX-‐listed companies only report on sales of more than 10% of their revenue to subsidiaries of their customers. GAR and Wilmar, for instance, have many subsidiaries in Indonesia. When IDX-‐listed companies report on their total sales to GAR and Wilmar, the companies would appear more often in the disclosure of customers generating more than 10% of revenue. Due to these limitations, the regulation by the Ministry of Finance does not require full “disclosure of materiality.” Table 17 shows subsidiaries of the largest customers of the IDX-‐listed companies. These subsidiaries were listed in the quarterly and annual reports of the IDX-‐listed companies, whenever the subsidiary covered more than 10% of the company’s revenue.
Subsidiaries of the customers of the IDX-‐listed companies Table 17
Group Subsidiary
Apical Group PT Sari Dumai Sejati
PT Asianagro Agungjaya
Golden Agri-‐Resources
PT Sinar Mas Agro Resources and Technology
PT Binasawit Abadi Pratama
PT Sumber Indah Perkasa
Hayel Saeed Anam (HSA) Group PT Pacific Palmindo Industri
Musim Mas
PT Intibenua Perkasatama
PT Musim Mas
PT Indo Karya Internusa
Permata Hijau Group PT Nubika Jaya
Wilmar
PT Wilmar Nabati Indonesia
PT Sinar Alam Permai
PT Multimas Nabati Asahan
PT Wilmar Cahaya Indonesia
PT Usaha Indah Persada
Sources: Quarterly and annual reports IDX-‐listed companies. In some cases there were other ways to trace IDX-‐listed companies’ customers. These included the auction results of Astra, trade receivables, and publicly disclosed lists of mills supplying Wilmar, IOI and Musim Mas. If more than 40% of its revenue is sourced from customers with an NDPE policy, a company is placed in the RED category (0 points), while revenues between 20% and 40% scored ORANGE (2 points), and less than 20% would score GREEN (4 points).
No assessment on practices

25
This assessment looked only at policy statements and not at practices on the ground. Practices on the ground may contrast with policy statements, and also lead to business risks. One exception has been made to the rule of not looking at practices on the ground. On 15 April 2015 several NGOs sent out a press release stating that there remain some major issues with regard to the implementation of Golden Agri-‐Resources’ NDPE policy.120 Therefore, Golden Agri-‐Resources only received two points for its company policy, instead of the possible 4 points companies with a NDPE policy could receive.
Assessment of overall risk exposure
The overall risk exposure was also categorized as RED (high risk), ORANGE (medium risk) and GREEN (low risk). Table 18 below shows how the overall risk exposure was calculated.
Calculation of overall risk exposure Table 18
Assessments Maximum
score (points)
Red, Orange, Green
Grower policy versus NDPE policy 4 4 = Green; 2 or 3 = Orange; 0 or 1 = Red
RSPO progress 2 2 = Green; 1 = Orange; 0 = Red
NDPE challenge (% of customers with an NDPE policy) 4 4 = Green; 2 = Orange; 0 = Red
Overall risk exposure 10 9 or 10 = Green; 4 – 8 = Orange; 0 -‐ 3 = Red

26
Glossary
Abbreviation Explanation
CO2 Carbon dioxide
CPO Crude Palm Oil
FFB Fresh Fruit Bunches
FPIC Free, Prior and Informed Consent
HCS High Carbon Stock. The current industry HCS-‐standard defines High Density, Medium Density, Low Density and Regenerating Forests, and excludes oil palm from these forest types. The categories Scrub and Cleared/open land are considered low carbon stock and potentially suitable for oil palm plantation development. The standard was developed by Golden Agri-‐Resources (GAR), The Forest Trust (TFT) and Greenpeace.121
HCV High Conservation Value. HCV does not stop short at the protection of species and ecosystems. The RSPO has identified and defined six categories of HCV area.122 HCV areas also include critical ecosystem services for water catchment and erosion control, sites fundamental for satisfying the basic necessities of local communities or indigenous peoples, and sites with a high cultural value.
IDR Indonesian Rupiah
ILO International Labour Organization of the United Nations
ISPO Indonesian Sustainable Palm Oil System
NDPE No Deforestation, No Peat, No Exploitation
PKO Palm Kernel Oil
RSPO Roundtable on Sustainable Palm Oil
USD United States Dollar

27
Colophon
This report was authored by Albert ten Kate, Eric Wakker, Rimousky Menkveld, Jan Willem van Gelder, Ben Cushing, and Joel Finkelstein. Chain Reaction Research 1320 19th Street NW Washington, DC, 20036 United States Website: www.chainreactionresearch.com Email: [email protected]
Disclaimer
This report and the information herein is derived from selected public sources. Chain Reaction Research is an unincorporated project of Climate Advisers, Profundo and Aidenvironment (individually and together, the "Sponsors"). The Sponsors believe the information in this report comes from reliable sources, but they do not guarantee the accuracy or completeness of this information, which is subject to change without notice, and nothing in this document shall be construed as such a guarantee. The statements reflect the current judgment of the authors of the relevant articles or features, and do not necessarily reflect the opinion of the Sponsors. The Sponsors disclaim any liability, joint or severable, arising from use of this document and its contents. Nothing herein shall constitute or be construed as an offering of financial instruments or as investment advice or recommendations by the Sponsors of an investment or other strategy (e.g., whether or not to “buy”, “sell”, or “hold” an investment). Employees of the Sponsors may hold positions in the companies, projects or investments covered by this report. No aspect of this report is based on the consideration of an investor or potential investor's individual circumstances. You should determine on your own whether you agree with the content of this document and any information or data provided by the Sponsors.
28
References
1 Unilever, Leading market transformation in palm oil, http://bit.ly/1AHHFgU
2 United Nations, International Labour Organization, Conventions and Recommendations, http://bit.ly/1FiYJYd, as viewed on 3 April 2015.
3 WWF-‐World Wide Fund for Nature, 2013 Palm Oil Buyers Scorecard, http://bit.ly/1k0nEI7, November 2013.
4 Apical Group, Sustainability Policy, September 2014, http://bit.ly/1AHo0qE Apical Group, Asian Agri and Apical Team Up with TFT to Enhance Supply Chain Traceability, 16 June 2015, http://bit.ly/1CeXaIh
5 Bunge, Bunge Global Palm Oil Sourcing Policy, October 2014, http://bit.ly/1rSnhPS
6 Cargill, Cargill Policy on Sustainable Palm Oil, July 2014, http://bit.ly/1au3HrB
7 Golden Agri-‐Resources Ltd, presentation, Full Year 2013 Results Performance, 28 February 2014, page 15, http://bit.ly/1vZomgt Golden Agri-‐Resources Ltd, The Forest Trust (TFT) and Greenpeace, presentation, High Carbon Stock Forest Conservation, 12 February 2014, http://bit.ly/1lW0vZC Golden Agri-‐Resources, GAR sustainability dashboard, http://bit.ly/1DsN1er, as viewed on 3 April 2015.
8 IOI Loders Croklaan, Sustainable Sourcing, http://bit.ly/1au005b IOI Loders Croklaan and IOI Corporation, Mutual Responsibility Statement, 12 January 2015, http://bit.ly/1au005b IOI Loders Croklaan, List of mills, http://bit.ly/1yKEoXy
9 Kencana Agri, Kencana Agri Limited Environmental Sustainability Policy, 19 January 2015, http://bit.ly/1FaeyOU
10 Kuala Lumpur Kepong, Sustainability Policy, December 2014/January 2015, http://bit.ly/1SqHmvj
11 Musim Mas Group, Musim Mas Ups The Ante on Sustainability, 4 December 2014, http://bit.ly/1AEiJCN Musim Mas Group: Sustainability Policy, December 2014, http://bit.ly/14Jalqk Musim Mas Group, Mapping supply chain: a preliminary list of CPO suppliers, http://bit.ly/1M1VDfST Musim Mas, Joint Statement – Musim Mas and PT Pati Sari, 14 November 2014, http://bit.ly/1fiXmBr Musim Mas, Fixing PT Pati Sari’s supply chain, January 2015, http://bit.ly/1LgWyKH
12 Nestlé, Nestlé committed to traceable sustainable palm oil to ensure no-‐deforestation, http://bit.ly/1krneJV, September 2013.
13 Procter & Gamble, "Our commitment to no deforestation in our palm supply chain is unequivocal”, http://bit.ly/Q8lavn, 8 April 2014. Procter & Gamble, Palm Oil Commitment, http://bit.ly/1dYYvqg
14 Unilever, “100% of Palm Oil bought will be traceable to known sources by end 2014”, http://bit.ly/QmBcRY, 12 November 2013. Unilever, Sustainable Palm Oil Sourcing Policy, http://bit.ly/1dp0sSv, November 2013.
15 Wilmar, news release, Wilmar International Announces Policy to Protect Forests and Communities, http://bit.ly/IOviVF, 5 December 2013. Wilmar, No Deforestation, No Peat, No Exploitation Policy, http://bit.ly/1hDCOBB, 5 December 2013. Wilmar International, Dashboard, http://bit.ly/15gcDgR, as viewed on 3 April 2015.
16 United States Department of Agriculture, Foreign Agricultural Service, Oil Seeds: World Markets and Trade, April 2015, table 19, http://1.usa.gov/1AO202i
17 CIFOR, FACT FILE – Indonesia world leader in palm oil production, 8 July 2013, http://bit.ly/1R1FpIw
18 The US Dollar to Indonesian Rupiah exchange rate on 31 December 2014 was as follows: 1 USD = 12,417.0275 IDR. Source: Exchange Rates UK, http://bit.ly/1Hi4NmH

29
19 Indofood Agri Resources Ltd, Our business, http://bit.ly/1NITZxQ
PT Salim Ivomas Pratama Tbk, Membership RSPO, http://bit.ly/19Rxtp6 PT PP London Sumatra Indonesia Tbk, Membership RSPO, http://bit.ly/1xMVwAF
20 PT Tunas Baru Lampung Tbk, Company, http://bit.ly/1DxqzNi PT Budi Starch & Sweetener Tbk, Company In Brief, http://bit.ly/1E5SJne
21 Permata Hijau Group, Home, http://bit.ly/1CpvzCT, as viewed on 4 April 2015. Permata Hijau Group, Certification, http://bit.ly/1D3fVlv, as viewed on 4 April 2015.
22 Bloomberg, Company profile Inter-‐United Enterprises Pte Ltd, http://bloom.bg/1HdML6n
23 BEST Group (Berkah Emas Sumber Terang), About Best Group, http://bit.ly/1IdxpyP, as viewed on 4 April 2015.
24 Louis Dreyfus Commodities, Sustainability report 2013, http://bit.ly/1y5WvfP Louis Dreyfus Commodities Asia, RSPO membership, http://bit.ly/1yKHESK Louis Dreyfus Commodities Asia, Annual Communication of Progress RSPO 2013/2014, http://bit.ly/1yKHKtH
25 Royal Industries Indonesia, About US, http://bit.ly/1J42kLB, as viewed on 4 April 2015.
26 Hayel Saeed Anam (HSA) Group, About HSA, http://bit.ly/1BZGC5C, as viewed on 4 April 2015. Hayel Saeed Anam (HSA) Group, Indonesian Companies, http://bit.ly/1GTF5os, as viewed on 4 April 2015.
27 The SGX-‐listed Golden Agri-‐Resources (GAR) produced 2.39 million tonnes of CPO in 2014. GAR cultivates 472,800 hectares of oil palm plantations in Indonesia, including plasma smallholders. Golden Agri-‐Resources, Annual report 2014, pages 1 and 8, http://bit.ly/1JU7n15 Astra Agro Lestari produced 1.74 million tonnes of CPO in 2014. Astra Agro Lestari, Annual report 2014, March 2015, page 7, http://bit.ly/1s6Zm1T As of 31 December 2014 Wilmar International managed a planted area of 166,800 ha in Indonesia (excluding smallholders), so it is assumed that Wilmar produced less CPO in Indonesia compared to IndoAgri with its oil palm planted area of 246,000 ha (excluding smallholders). Wilmar International, Annual report 2014, page 34, http://bit.ly/1P9p0vi
28 Astra Agro Lestari, Annual report 2014, page 7, http://bit.ly/1wQU65u
29 Astra makes the results of its CPO-‐auctions, which take place every day from Monday to Friday (except for Indonesian national holidays), available on its website.29 This provides a clear overview to link most of Astra’s CPO sales volume to individual customers. The companies’ shares of Astra’s revenue were calculated using two assumptions: first, that they accounted for the part of Astra’s CPO sales that could not be linked to a CPO-‐buyer, in the same proportions as their shares of CPO purchases that could be traced; and second, that the companies bought palm kernel oil from Astra in the same proportions as their shares of CPO purchases.
30 Astra Agro Lestari, Investor Bulletin January 2015 (unaudited), http://bit.ly/1JF0FwF Astra Agro Lestari, website Consolidated financial statements 31 December 2014 and 2013, 25 February 2015, http://bit.ly/1JRyuOF
31 Astra Agro Lestari, Biodiversity, http://bit.ly/1JqYJG8 Astra Agro Lestari, Sustainability report 2014, http://bit.ly/1G26l0m Astra Agro Lestari, Sustainability report 2011, May 2012, appendix, http://bit.ly/1ykLgja
32 Jakarta Globe, RSPO Wants to Add More Members From Indonesia, 29 January 2014, http://bit.ly/1OBpNFe
33 Aidenvironment, commissioned by Rainforest Foundation Norway, Forest Heroes, SumOfUs, KKI Warsi and Yayasan Merah Putih (YMP), Sustainability assessment of Astra Agro Lestari/ Penilaian kesinambungan Astra Agro Lestari, May 2015, http://bit.ly/PrPO2t Forest Heroes, She's Not a Fan, http://bit.ly/1LePBcY Forest Heroes, Forest Heroes drone footage: Astra's forest destruction in Indonesia, http://bit.ly/1AGpW9D SumOfUs, The Sumatran Elephant is under threat from…. Pizza Hut?, http://bit.ly/1IjVhfs Rainforest Foundation Norway, Luxury hotel chain is destroying the rainforest, 21 May 2015, http://bit.ly/1GshXMp

30
The Independent, Jardine Matheson subsidiary accused of threatening at-‐risk species by cutting down swathes of rainforest for palm oil plantations, 17 May 2015, http://ind.pn/1FriQaU The Independent, Victory for campaigners as palm oil company vows to stop felling rainforest, 13 June 2015, http://ind.pn/1eguiu5
34 Astra Agro Lestari, Astra Agro Lestari takes a major step towards IPOP, 11 June 2015, http://bit.ly/1ffUJjW
35 Indofood Agri Resources Ltd., Presentation of FY2014 Results, 27 February 2015, http://bit.ly/1yeaG2w
36 The SGX-‐listed Golden Agri-‐Resources (GAR) produced 2.39 million tonnes of CPO in 2014. GAR cultivates 472,800 hectares of oil palm plantations in Indonesia, including plasma smallholders. Golden Agri-‐Resources, Annual report 2014, pages 1 and 8, http://bit.ly/1JU7n15 Astra Agro Lestari produced 1.74 million tonnes of CPO in 2014. Astra Agro Lestari, Annual report 2014, March 2015, page 7, http://bit.ly/1s6Zm1T As of 31 December 2014 Wilmar International managed a planted area of 166,800 ha in Indonesia (excluding smallholders), so it is assumed that Wilmar produced less CPO in Indonesia compared to IndoAgri with its oil palm planted area of 246,000 ha (excluding smallholders). Wilmar International, Annual report 2014, page 34, http://bit.ly/1P9p0vi
37 Hong Kong Stock Exchange, First Pacific Co. Ltd., Complete list of substantial shareholders, http://bit.ly/1a2fc8C, as viewed on 28 April 2015. Indofood Agri Resources, Annual report 2014, 10 April 2015, page 5, http://bit.ly/1aBzZjU. PT Indofood CBP Sukses Makmur Tbk, Annual report 2014, page 14, http://bit.ly/1Jv5nzA First Pacific Company Limited, Corporate Profile, http://bit.ly/1QsC3vv First Pacific Company Limited, Business Structure, http://bit.ly/1HCcghR
38 Indofood Agri Resources Ltd., Annual report 2014, page 145, 10 April 2015, http://bit.ly/1HC6pYb In its annual report 2014 PT Indofood Sukses Makmur Tbk (Indofood) states that the agribusiness revenue amounted to IDR 14.7 billion, including inter-‐segment sales (to Indofood CBP Sukses Makmur Tbk) of IDR 2.0 trillion. PT Salim Ivomas Pratama Tbk reports a total revenue of IDR 15.0 billion, of which PT Indofood CBP Sukses Makmur took into account IDR 1.8 billion and other related parties IDR 2.5 billion. PT Salim Ivomas Pratama Tbk., Annual report 2014, April 2015, http://bit.ly/1I7oEWd
39 The SGX-‐listed Golden Agri-‐Resources (GAR) produced 2.39 million tonnes of CPO in 2014. GAR cultivates 472,800 hectares of oil palm plantations in Indonesia, including plasma smallholders. Golden Agri-‐Resources, Annual report 2014, pages 1 and 8, http://bit.ly/1JU7n15 Astra Agro Lestari produced 1.74 million tonnes of CPO in 2014. Astra Agro Lestari, Annual report 2014, March 2015, page 7, http://bit.ly/1s6Zm1T As of 31 December 2014 Wilmar International managed a planted area of 166,800 ha in Indonesia (excluding smallholders), so it is assumed that Wilmar produced less CPO in Indonesia compared to IndoAgri with its oil palm planted area of 246,000 ha (excluding smallholders). Wilmar International, Annual report 2014, page 34, http://bit.ly/1P9p0vi
40 Salim Ivomas Pratama, Financial statement 31/12/2014, http://bit.ly/1xT5PDM
41 PT Indoritel Makmur Internasional Tbk, Company Update June 2013, page 62, http://bit.ly/1JHA5lW PT Indoritel Makmur Internasional Tbk., Annual report 2014, 30 April 2015, http://bit.ly/1EVlsxj
42 First Pacific Company Limited, Continuing connected transactions, 9 December 2013, http://bit.ly/1Je9uwu
43 First Pacific Company Limited, Continuing connected transactions, 9 May 2014, http://bit.ly/1GN0iBP Indogrosir, Sekilas Tentang Indogrosir, http://bit.ly/1QTbqQx.
44 Calculation: 362,000 tonnes of CPO x average price of IDR 8,228 per kg makes IDR 2.8 trillion. Indofood Agri Resources Ltd., Presentation of FY2014 Results, 27 February 2015, http://bit.ly/1yeaG2w Indofood Agri Resources Ltd., Annual report 2014, 10 April 2015, http://bit.ly/1HC6pYb
45 PT PP London Sumatra Indonesia Tbk, Financial Statements 31/12/2014, page 85, http://bit.ly/1zgHTKV

31
46 Wilmar International, Dashboard, http://bit.ly/15gcDgR, as viewed on 3 April 2015.
IOI Loders Croklaan, List of mills, http://bit.ly/1yKEoXy
47 PT Salim Ivomas Pratama Tbk, Financial Statements 31/12/2014, page 98, http://bit.ly/1I7oEWd
48 PT Indofood CBP Sukses Makmur Tbk, Consolidated Financial Statements as of 31/12/2014, page 58, http://bit.ly/1Jv5nzA
49 PT Unilever Indonesia Tbk, Annual report 2014, pages 39, 163, 227 and 235, http://bit.ly/1blrA4b
50 First Pacific, Further update in relation to proposal by First Pacific and Wilmar to acquire the entire issued share capital of Goodman Fielder, 17 March 2015, http://bit.ly/1CYAKNI Goodman Fielder, Who we are, http://bit.ly/1GOPqBN
51 First Pacific Company Limited, press release, Indofood Nestlé joint venture, 24 February 2005, http://bit.ly/1FqD26N PT Nestlé Indofood Citarasa Indonesia, Products, http://bit.ly/1Ctu7jf
52 Indofood CBP Sukses Makmur Tbk, Annual report 2014, pages 31, 60 and 157, http://bit.ly/1Jv5nzA Indofood, Snack foods, http://bit.ly/1drEXkT PT Indofood Sukses Makmur Tbk, Annual report 2014, page 17, http://bit.ly/1PB3uC1
53 Indofood Agri Resources Ltd., Sustainability report 2013, page 37, http://bit.ly/1c7Lelz
54 Indofood Agri Resources Ltd., Annual report 2014, 10 April 2015, pages 40-‐41, http://bit.ly/1HC6pYb
55 Indofood Agri Resources Ltd., Presentation of FY2014 Results, 27 February 2015, http://bit.ly/1yeaG2w
56 RSPO, Principles & Criteria assessment progress, http://bit.ly/1IeEdwr, as viewed on 5 May 2015.
57 Golden Agri-‐Resources Ltd, Company Presentation, November 2014, page 8, http://bit.ly/1yIzPBy
58 PT SMART, Operational information, http://bit.ly/1FldEiR
59 Astra Agro Lestari, Investor Bulletin January 2015, http://bit.ly/1JF0FwF
60 SMART, Annual Report 2013, page 1, http://bit.ly/1F9gKpO
61 SMART, Announcements Indonesian stock exchange, quarterly reports 2014, http://bit.ly/1zCAW6t
62 PT Sumi Asih, Introduction, http://bit.ly/1CV1HSu
63 Golden Agri-‐Resources Ltd, presentation, Full Year 2013 Results Performance, 28 February 2014, page 15, http://bit.ly/1vZomgt Golden Agri-‐Resources Ltd, The Forest Trust (TFT) and Greenpeace, presentation “High Carbon Stock Forest Conservation, 12 February 2014, http://bit.ly/1lW0vZC Golden Agri-‐Resources, GAR sustainability dashboard, http://bit.ly/1DsN1er, as viewed on 3 April 2015.
64 SMART, Annual Report 2013, page 61, http://bit.ly/1F9gKpO
65 SMART, RSPO membership and Annual Communication of Progress 2013-‐2014, http://bit.ly/1a5H4Zv
66 SMART, RSPO membership and Annual Communication of Progress 2013-‐2014, http://bit.ly/1a5H4Zv
67 GAR, Annual Communication of Progress 2013-‐2014, http://bit.ly/1OaI1CG
68 SMART, Annual Report 2013, page 58, http://bit.ly/1F9gKpO PT SMART, RSPO, http://bit.ly/1IBFk66
69 TFT suspend PT SMART partnership, 19 May 2015, http://bit.ly/1Gi6g82
70 Response to The Forest Trust statement on 19 May 2015, 20 May 2015, http://bit.ly/1JWnejx
71 DSNG, 2014 Full Year Results Presentation, 2 February 2015, http://bit.ly/1GwCSjE
72 DSNG, 2014 Full Year Results Presentation, 2 February 2015, http://bit.ly/1GwCSjE

32
73 In its financial statement dated 31/12/2014, DSNG reports two external companies: PT Wilmar Nabati Indonesia (Wilmar)
and PT Sinar Mas Agro Resources and Technology (Golden Agri-‐Resources) generating more than 10% of its revenue. However, PT Binasawit Abadi Pratama (Golden Agri-‐Resources) is not mentioned despite DSNG’s financial statement for 30/9/2014 stating the company had already generated more than 10% (IDR 676 billion) of DSNG’s entire 2014 revenue.73 Similarly, PT Binasawit Abadi Pratama had generated IDR 315 billion in revenue as of 30/9/2013, but does not appear in the financial statement for 31/12/2013.
74 DSNG, 2014 Full Year Results Presentation, 2 February 2015, http://bit.ly/1GwCSjE
75 DSNG, RSPO membership and Annual Communication of Progress 2013-‐2014, http://bit.ly/1P2BN5u
76 Saham WS, TBLA CPO production to be 10% higher than target, 18 December 2014, http://bit.ly/1cdWlJr
77 TBLA, Investor Presentation, November 2014, http://bit.ly/1HRN9Eg Tunas Baru Lampung, Financial statement 31/12/2014, pages 87, 88 and 99, http://bit.ly/1ab4pcp
78 No information regarding TBLA trade receivables from Cargill could be found for 2014. Sales to Cargill represented less than 10% of TBLA’s revenue in 2014, considerably lower than the 24% in 2013.
79 TBLA, Announcements Indonesian stock exchange, quarterly reports 2014, http://bit.ly/1zCAW6t Some information on TBLA’s main external customers was traced by reviewing the lists of trade receivables in its 2014 quarterly reports.
80 ED & F Man, About us, http://bit.ly/1C5JO0A
81 TBLA, Annual report 2013, http://bit.ly/1EmUi1V
82 TBLA, RSPO membership and Annual Communication of Progress 2013-‐2014, http://bit.ly/1PnotsP
83 RSPO, P&C assessment progress, http://bit.ly/1PoqWDa
84 Eagle High Plantation, Laporan Bulanan Registrasi Pemegang Efek [BWPT], 12 March 2015, http://bit.ly/1IAA2Iz
85 Kencana Agri, Annual report 2013, http://bit.ly/1E6Ntko
86 Eagle High Plantations, Financial statement 31/12/2014, page 59, http://bit.ly/1xIeN6z For Wilmar International, figures were only available up until 30/6/2014, but total sales to its subsidiary, PT Wilmar Nabati Indonesia, were apparently below 10% of BWPT’s revenue for 2014. BWPT’s CPO production amounted to 329,000 tonnes in 2014.
87 Eagle High Plantations, Financial statement 31/12/2014, page 93, http://bit.ly/1xIeN6z
88 Eagle High Plantations, http://bit.ly/1Dt3VtT
89 PT BW Plantation and Its Subsidiaries, Preliminary Offering Circular, 5 November 2014.
90 PT BW Plantation and Its Subsidiaries, Preliminary Offering Circular, 5 November 2014.
91 PT BW Plantation and Its Subsidiaries, Preliminary Offering Circular, 5 November 2014.
92 Eagle High Plantations, RSPO membership, http://bit.ly/1IMOrkl
93 PT Mutuagung Lestari, Notification RSPO Initial Certification Assessment, 11 March 2015, http://bit.ly/1IvAZEG
94 Deliveries to Kencana Agri / Louis Dreyfus (19% of revenue) were calculated as full NDPE policy as Kencana Agri’s policy requires its joint venture with Louis Dreyfus to comply with its NDPE policy.
95 Sampoerna Agro, Newsletter March 2015, 30 March 2015, http://bit.ly/1JvR8HW
96 Though not appearing in this financial statement, PT Wahana Citra Nabati has also been added to the table because it generated revenue up until 30/9/2013 and 30/9/2014.
97 IOI Loders Croklaan, List of mills, http://bit.ly/1yKEoXy Musim Mas Group, Mapping supply chain: a preliminary list of CPO suppliers, http://bit.ly/1M1VDfST

33
98 SGRO, Annual report 2013, page 139, http://bit.ly/1BW9ls2
99 SGRO, Annual report 2013, pages 143 and 144, http://bit.ly/1BW9ls2
100 SGRO, RSPO membership and Annual Communication of Progress 2013-‐2014, http://bit.ly/1D1tST3
101 Including its recently acquired plantations PT TSA and PT SMU. Source: Sawit Sumbermas Sarana, Investor Presentation, 12 March 2015, http://bit.ly/1HN5GlB
102 SSMS, Quarterly reports and annual report 2013, http://bit.ly/1zCAW6t
103 Sawit Sumbermas Sarana, Investor Presentation, 12 March 2015, http://bit.ly/1HN5GlB
104 SSMS, RSPO membership and Annual Communication of Progress 2013-‐2014, http://bit.ly/1NWahmV MUTU Certification International, Notification of Initial Assessment Selangkun POM of PT Sawit Sumbermas Sarana, October 2014, http://bit.ly/1KqvDZX MUTU Certification International, Certification Sulung Palm Oil Mil and its supply base (PT Sawit Sumbermas Sarana), 19 March 2013, http://bit.ly/1NdnIAB Sawit Sumbermas Sarana, Investor Presentation, 12 March 2015, http://bit.ly/1HN5GlB
105 Environmental Investigation Agency, Ex timber crook’s palm oil firm threatens orangutan habitat, 8 June 2015, http://bit.ly/1dJpDjm Vimeo, EIA releases footage of indigenous forest threatened by palm oil firm, 10 June 2015, http://bit.ly/1IjM8Ug RSPO, “PT Sawit Mandiri Lestari, New Planting Procedures Public Notification”, 12 March 2015, http://bit.ly/1Ehmbm8 UNEP World Conservation Monitoring Centre, “World Atlas of Great Apes and their Conservation”, http://bit.ly/1lbGEQ2, 2005. IUCN/SSC Conservation Breeding Specialist Group, Orangutan Population and Habitat Viability Assessment: Final Report”, August 2004, page 192, http://bit.ly/1iFJcnJ
106 Greenomics Indonesia, IPOP signatories are the biggest buyers of palm oil, June 2015, http://bit.ly/1GMeaew
107 Mongabay, Oil palm company accused of violating RSPO, IPOP standards in Indonesia, 11 June 2015, http://bit.ly/1Gd5CIX
108 Estimate based on extrapolation CPO production until 30/9/2014. UNSP, Materi Public Expose Des-‐2014, 5 December 2015, http://bit.ly/1zCAW6t
109 UNSP, Annual Report 2013, pages 148 and 149, http://bit.ly/1wZzMiV
110 UNSP, RSPO membership and Annual Communication of Progress 2013-‐2014, http://bit.ly/1NdXX6x
111 ANJT, Investor Newsletter 01-‐2015, 26 February 2015, http://bit.ly/1HcCnKP
112 ANJT’s sales to Wilmar and Louis Dreyfus may have been larger than those shown below, but still below 10% of ANJ’s 2014 net revenue, as no details were provided for these companies for the fourth quarter of 2014.
113 ANJT, 1Q report 2015, http://bit.ly/1zCAW6t
114 RSPO, New Planting Procedures Public Notifications, http://bit.ly/1cjfsBG
115 ANJT, RSPO membership and Annual Communication of Progress 2013-‐2014, http://bit.ly/1FEKGNv
116 Greenomics Indonesia, report Busy Years Ahead until 2017, 21 July 2014, http://bit.ly/1OkjzLw
117 Mongabay, GAR/Wilmar punish palm oil supplier for clearing rainforest in New Guinea, 28 May 2015, http://bit.ly/1K27z0L Greenomics Indonesia, Golden Agri-‐Resources, the biggest buyer of CPO produced by a company that is relentlessly clearing HCS forests in Papua, 20 May 2015, http://bit.ly/1K27z0L
118 United Nations, International Labour Organization, Conventions and Recommendations, http://bit.ly/1FiYJYd, as viewed on 3 April 2015.

34
119 Ministry of Finance Republic of Indonesia, Capital Market and Financial Institutions Supervisory Board (Bapepam),
Presentation and disclosure of financial statements of the issuer or public company, 25 June 2012, http://bit.ly/1IyCLF1
120 Forest Peoples Programme, Rainforest Action Network, TuK Indonesia, Bruno Manser Fund, Friends of the Earth US, Friends of Siberian Forests, Fern, Facing Finance, Urgewald, Banktrack, Briefing to banks and potential investors on the ongoing risks and outstanding social conflicts in the palm oil agribusiness sector: Golden Agri-‐Resources (GAR) Bond Offering, 15 April 2015, http://bit.ly/1E64o5o Golden Agri-‐Resources, Response to press release by NGOs issued on 15 April 2015, 16 April 2015, http://bit.ly/1K1MxgL
121 Wilmar, No Deforestation, No Peat, No Exploitation policy, http://bit.ly/1hDCOBB, 5 December 2013. Golden Agri-‐Resources, presentation High Carbon Stock Forest Conservation, http://bit.ly/1lW0vZC, 12 February 2014. Greenpeace, The HCS Approach: No Deforestation in practice, http://bit.ly/1FMFFDd, 10 March 2014.
122 RSPO, Principles and Criteria for the Production of Sustainable Palm Oil, 25 April 2013, available at http://bit.ly/1tosTWh