2015 02 27_ research on car painting quality control based on fmea and spc v5
TRANSCRIPT

I
摘要
质量专家所使用的术语“标准”涵盖了很多内容,比如指标、规格、量具、报表、
分类、分段、分组或者行为。管理标准提出了组织培训、质量审核、质量管理系统的需
求。全球汽车制造业要求世界一流的产品质量、生产力和竞争力以及持续改进。为了达
到这个目标,许多汽车制造企业使用质量控制工具来提高产品质量从而达到零缺陷和较
高的客户满意度。当今,有很多质量工具被应用到快速解决问题中,但是我们需要找到
又快又有效的解决方法。
本文的重点在于潜在故障的识别;生产过程中可能会发生故障,会导致车辆报废、
返修,影响内部生产和质量目标(缺陷控制率)。在全面研究生产过程和生产数据(故障
原因、故障率和数据)的基础上,FMEA发现了在汽车喷涂过程中具有较高风险优先级的
薄弱环节,这就要求通过识别和处理缺陷来降低风险从而提高汽车表面喷涂的过程质量。
对于分析汽车表面缺陷的改进,SPC工具在缺陷可视化方面更有效。SPC图表是制造业用
于了解、控制和提高生产过程的数据的时间序列图,它虽然建立在统计理论领域基础上,
实践者使用和解释起来也很容易。
为了实现汽车表面涂装零缺陷的目标,本文应用 PFMEA 技术对缺陷分优先级,统计
分析造成缺陷的原因,通过持续改进过程控制缺陷。
关键词:质量管理,FMEA,SPC,控制图,质量改进控制,优化的过程

II
Abstract
Quality professionals use the term “standards” to mean many things, such as metrics,
specifications, gages, statements, categories, segments, groupings or behaviors. Management
standards address the needs of organizations in training, quality auditing and
quality-management systems. The global automotive industry demands world class levels of
product quality, productivity and competitiveness as well as continual improvement. To
achieve this goal many vehicle manufacturers company using quality control tools to improve
the quality of the product with zero defects and highly satisfied to the customer. Now days,
there are lot of quality tools applied to solve the problem quicker but it’s still the fact to find
out good and efficient solving way.
This thesis papers emphasis on identification of potential failure; failures may
encountered in the production process and its will leads to car scrap, rework and influence of
the internal production and quality target (defects control rate). After the complete study of
manufacturing process and production data -failure causes, failure rate and data etc. FMEA
discover the weak processes in the form of higher risk priority number in the manufacturing of
the car painting process, which required reducing by identifying and implementing of the
defects and this will improve the process quality of the painting surface of the car. To analysis
the improvement of the car surface defects SPC (Statistical process control) tools are more
efficient where can easily visible the defects trends.SPC chart are chronological graphs of
process data that are used in manufactures industries to help understand, control and improve
process and that although based in statistical theory area easy for practitioners to use and
interpret.
In order to orient goal of zero defects of the car surface use the PFMEA technique to
prioritized the defects and statistically analysis the roots cause of the defect and control the
defects through continues improvements process.
Key Words: Quality management, FMEA, SPC, Control technology, Quality improvement
Control, Optimization process

III
Table of Contents
1.1 Importance of the quality management in the automotive industry…………………..2
1.2 Goal and significance of the FMEA & SPC.................................................................. 3
1.3 Quantitative quality management ................................................................................. 4
1.4 Development of the FMEA and SPC ............................................................................ 5
1.4.1 Oversease development ....................................................................................... 5
1.4.2 Internal development ........................................................................................... 7
1.5 Research of the SPC and FMEA models ...................................................................... 7
2.1 Introduction of the FMEA methods .......................................................................... 10
2.2 FMEA approach .......................................................................................................... 11
2.3 Implementation methods for FMEA ......................................................................... 12
2.4 The interaction between SPC system and FMEA repository ...................................... 16
2.5 Significant of the SPC in the manufacturing process.................................................. 17
3.1 Identify the potential defects through painting process .............................................. 20
3.1.1 Car painting process methods ........................................................................... 21
3.1.2 Process related factors of paint performance .................................................... 24
3.2 Quality aspect of the painting process ........................................................................ 27
3.3 Process Monitoring and Regulation ............................................................................ 30
4.1 Data collection and statistical analysis ....................................................................... 32
4.2 Potential root cause and risk analysis by FMEA ........................................................ 34
4.3 Reflow SPC measurement data .................................................................................. 37
4.4 Evaluation of the data ................................................................................................. 38
4.5 Defects control system ............................................................................................... 39
摘要............................................................................................................................... ……...I
Abstract ………………………………………………………………………………………II
CHAPTER1 INTRODUCTION… ………………………………………………………………..1
CHAPTER2 SPC AND FMEA METHODOLOGY……………………………………………………..10
CHAPTER3 PAINTING PROCESS & DEFECT ANALYSIS………………………………………20
CHAPTER4 DATA ANALYSIS AND DISCUSSION………………………………………………...31

Master's Degree Dissertation of Shenyang University
IV
CHAPTER5 - CONCLUSION …………………………………………………………………....44
References …………………………………………………………………………………45
Research project ………………………………………………………………………….48
Acknowledgement.………………………………………………………………………….49

1
Chapter1 Introduction
1.1 Importance of the quality management in automotive industry
Considering the incessantly increasing requirements to the quality of products and
process, it is necessary to improve a quality-oriented management in all types of
manufacturing company. In addition to diverse technical requirements are also considering
the requirements of the national, international and company specific norms. The company
must not only fulfill the requirements of the quality, but also the requirement of safety,
environment and economy. As following some aspect of the manufacturing quality
management and their integration manufacturing process will be introduced. Usually
technological advance will lead to process improvement with time and could ultimately
approach the states of the Zero-defect. In the tremendous, competition, survival of the fittest
is the law of competition in the market. The manufacturers need to use what kind of products,
entirely by the market to make a fair conclusion. Automotive products only “high quality
low cost “in order to dominate the market, and seek survival and development of space. In
such a climate conditions, automobile production quality, efficiency, resilience has become
hard in pursuit of the goal of the manufacturers and the increasingly fierce market
competition, forcing the manufacturers must continue to introduce new varieties, while
meeting the needs of users [1]
. In order to quickly seize the market, car manufacturers must
be more variety, fast-paced, high-quality mixed production , what products the market
needs ,we can as fast as the best products to the market[ 2 ]
.
In automotive company, Paint shop top coat inspection line is one of the important areas
to produce the car smoothly without major defects formation. It’s very common fact that, in
the top coat inspection line can highly influence the production rate and efficiency if there is
no control of the defects and solving of the root cause of the defects origination. For rational
and effective use of top coat inspection line, we must solve the problem and must control the
defects to get the high quality results of the automotive cars.
1.2 Goal and significance of the FMEA & SPC
Since market competition goes higher day by day extremely, each car plant must
continue to introduce new models to meet different user needs. In order to achieve the largest

Master's Degree Dissertation of Shenyang University
2
profit of the product, we must do everything possible to reduce input costs and the cost of
production models, so SPC and FMEA process methods, will promote the further
development of its manufacturing technology. The complexity of the equipment, costly
materials and wrong process standard will increase the rate of the production and influence
the target of the production. Most of the automotive company’s one of the big issue is the
repairing cost and repairing rate out of control[3]
.As China's major automobile gradually
enrich our product range, high cost performance SPC and FMEA technology will have
broad application prospects.
Mass production system is important for the all automotive company in order to get the
high value of the production. After the lean production method invented in Japan, People is
beginning to thinking about the quality, cost, and efficiency. At the beginning time the USA
automotive car always prefer to the Mass production but after the lean production theory
using globally all automotive car company peoples thinking how to reduce the cost , how to
achieve the zero defects and satisfied the customer to sell the car with low price and with the
tremendous quality [4]
.
In order to satisfied the customer requirement many of the research about the quality
control methodology and in this title the main focus will be how to control the defects with
SPC control model and find out the defects root cause of the defects and get the solution as
well as get the better quality of the products.
Goal of the SPC and FMEA model
(1) In the automotive company the processing time is very short .If the car take lot
processing time then the cycle time will getting longer and the production rate will get
lower. ,The SPC and FMEA model will help to solve the problem and lead to mass
production in a short time and put into the market, So that enterprises in the market occupies
more components and get opportunities[5]
.
(2) The materials cost is higher and the equipment is costly. The development of the
new model can control the defects which will increase the line efficiency. If the paint shops
top coat creates small kind of defects which will lead to increase the production cost and
efficiency as well as waste the lot of time. According to the monthly view the most of the
time waste in the top coat line because of the defects and which increasing the repairing rate
and operator do the overtime everyday which creates the labor cost as well as put into

Chapter1 Introduction
3
production, human, energy consumption, etc. but it can save considerable costs. Under
normal circumstances, the new models will help to reduce the cost of the labor, shorting the
time, reduce the materials cost without changing the production line of station, operating the
number of workers, equipment, also remained unchanged. After using the new technology it
will greatly saving the cost of production, and equipment, electrical and other kinds of
resources can be more fully utilized. Transformation of production lines required for a
relatively short time, usually require only 4-6 months, the newly developed mass production
models in a short time, and put into the market, so that enterprises in the market has more
weight and get opportunities[6]
.
(3)Statistical process control (SPC) is an important real-time online method by which a
production process can be monitored and control plans can be monitored and controls plan
can be initiated to keep quality standard within acceptable limits .Statistical quality control
provides offline analysis of the big picture such as what was the impact of the previous
improvements [7].
(4) The FMFA is an important tools which can help us to find out the root cause and
solve the problem according to the defects priority and SPC help us to find out the control
methods and evaluating the trends of the values and which can easily understand the
situation of the line and according to this situation find out the solution way [8].
In the paint shop plant, as the equipment is different, in the same station the working
procedure is different, even the working time is different, in order to each of the different
process on the specified position to complete the work of specified parts, not only need to
consider the limited stations but also I can get to the need to install the parts, but also need to
consider the workers' assembly time of the match, for example, will require assembly time
models and the need to assemble a longer time interval shorter models with order to balance
the assembly time. So the assembly shop of mixing production is very sensitive to the
production line balancing [9]
.
1.3 Quantitative quality management
A good quality management approach should provide warning signs early in the project
and not only towards the end, when the options available are limited. Early warnings will
allow timely intervention. For this, it is essential to predict values of some parameters at
different stages in the project such that controlling these parameters in project execution will

Master's Degree Dissertation of Shenyang University
4
ensure that the final product has the desired quality. If these predictions can be made, then
the actual data during the execution of the process can be used to judge whether the process
has been effectively applied. With this approach, a defect detection process does not finish
by the declaration that the process has been executed – the data from process execution is
used to ensure that the process has been performed in a manner that its full potential has
been exploited.
The concept of defect removal efficiency can be used for quantitative management of
quality, though these measures have some limitations for quality management [10-11]
.Infosys
implements quantitative quality management through defect prediction. In this approach, the
quality goal is set in terms of delivered defect density. Intermediate goals are set by
estimating the defects that may be detected by various defect detection. In other words, once
the quality goal has been set, the defect levels at different stages are estimated such that if
the estimates are met then the target quality will be achieved. Then for process management,
the predicted defect levels become the benchmark against which actual defect levels are
compared to evaluate if the development process is moving in the direction of achieving the
quality goal. The effectiveness of this approach depends on how well we can predict the
defect levels at different stages of the project. At Infosys, defect patterns observed in past
projects are used for predicting defect levels. Through this approach, phase-wise control can
be established. However, this level of control is too “macro” for a project as a phase is too
large an activity, and a finer or more “micro” control is needed such that corrective and
preventive actions can be taken quickly. This is achieved by employing SPC technique to the
two quality control activities that detect the maximum defects –reviews and unit testing. For
employing SPC, based on past data, control limits are established for key parameters like
defect density, coverage rate, etc [12]
.
1.4 Development of the FMEA and SPC
1.4.1 Internal development
SPC was pioneered by Walter A. Shewhart at Bell Laboratories in the early 1920s.
Shewhart developed the control chart in 1924 and the concept of a state of statistical control.
Statistical control is equivalent to the concept of exchange ability developed by
logician William Ernest Johnson also in 1924 in his book Logic, Part III: The Logical
Foundations of Science. Along with a gifted team at AT&T that included Harold Dodge and

Chapter1 Introduction
5
Harry Romig he worked to put sampling inspection on a rational statistical basis as well[13]
.
Shewhart consulted with Colonel Leslie E. Simon in the application of control charts to
munitions manufacture at the Army's Picatinney Arsenal in 1934. That successful application
helped convince Army Ordnance to engage AT&T's George Edwards to consult on the use of
statistical quality control among its divisions and contractors at the outbreak of World War
II. W. Edwards Deming invited Shewhart to speak at the Graduate School of the U.S.
Department of Agriculture, and served as the editor of Shewhart's book Statistical Method
from the Viewpoint of Quality Control (1939) which was the result of that lecture. Deming
was an important architect of the quality control short courses that trained American industry
in the new techniques during WWII. The graduates of these wartime courses formed a new
professional society in 1945, the American Society for Quality Control, which elected
Edwards as its first president. Deming traveled to Japan during the Allied Occupation and
met with the Union of Japanese Scientists and Engineers (JUSE) in an effort to introduce
SPC methods to Japanese industry [14]
.
In china many of the manufacturing company using the SPC model to solve the process
problems and all automobile company using the FMEA technique to find out the root cause
of the defects and take a preventive action plan to reduce the cost and improve the quality of
the product with the less repairing rate [15]
.
1.4.2 Overseas development
The major concern of this paper is to provide a review of the use of SPC techniques in
batch production. Data transformation is considered as one of the most important activities
when implementing SPC in such an environment. Other activities include focusing attention
on the process rather than on the product and the use of standardized control charts (SCCs)
in place of traditional charts. Aspects of data transformation are dealt with especially with
regard to explaining the mechanism of data transformation and selecting as well as
evaluating several transformation techniques[16]
.Statistical process control (SPC) using
Shewhart-based control charts is not appropriate in the presence of autocorrelation, a
problem often predominant in surface mount manufacturing. These charts are not able to
detect instances of process improvement or deterioration. Hence, careful examination is
needed on the appropriate use of Shewhart models. Alternative modeling strategies and
control schemes are required for an effective process monitoring implementation. This
research is motivated by the quality and reliability concerns in SMT manufacturing. The

Master's Degree Dissertation of Shenyang University
6
objective is to re-examine the adequacy of existing SPC set-up and explore viable
alternatives for a more effective [17]
.
Implementation to date, literature addressing statistical tools and SPC in manufacturing
company has been few and far between.The traditional Shewhart u-charts and c-charts have
been applied to monitor defects of wave-soldering process (Tong, 1990) and the reflow
soldering process (Montgomery, 1997).Goh (1991)investigated the use of run rules for
process control that is applicable to the wave-soldering process.In essence, control of the
process is based on frequency of defectives rather than the occurrence of a specific number
of defects in any defective. However, his study considered only processes with low average
defect rates[18]
.Ermer and Hurtis (1995) proposed an extension to Goh’s (1991) methodology
by considering processes with higher defect rates. Rowland (1992) also highlighted the
limitations of Shewhart attribute charts in SMT, especially for low defect rates. Besides
adopting pareto analysis to identify the most regularly occurring defect types, alternative
solutions using moving sum and its variants, together with a combination of Poisson and
binomial distributions are proposed. These techniques are useful as they can provide early
warning of a change in the process behavior.Albin and Friedman (1992), on the other hand,
disputed the use of Pareto charts in ranking the relative importance of defect types [19]
.
misleading results may arise due to clustering of defects and high variability-to-mean defect
ratios.The assumptions of Poisson model for defect distribution need to be validated and the
authors recommended yield loss methods to measure the more significant defects. In fact,
more works related to design of experiments (DOE) are reported where classical planned
experiments were performed to determine the influence of various printing parameters on the
solder paste height in the solder paste deposition process (Gopalakrishnan and Srihari, 1998),
or to identify the critical factors that affect the yield of wave-soldering process (Lim, 1990).
On the other hand, Gagne, Quaglia and Shina (1996) investigated both the effect of different
paste formulation and the effect of solder reflow parameters using Taguchi’s orthogonal
arrays.More recently, Messina (1999) reiterated the importance of statistical methods to deal
with excessive variation in surface mount processes, and presented a comprehensive review
of some alternatives to Shewhart models.As for the automated component placement process,
published literature on the use of statistical methods for process control is almost nonexistent.
Research activities in this area mainly centered on component sequencing and assignment,
Chapter1 Introduction
7
set-up management and operational planning, and component partitioning problem and
retrieval problems [20]
.For example, Bard, Clayton, and Feo (1994) developed algorithms for
minimizing component placement times using nonlinear integer programming. Ball and
Magazine (1988) proposed a decomposition approach of determining optimal plan for
component sequencing. Furthermore, Lin and Tardif (1999) investigated the problem of
optimizing component partitioning under uncertainty constraints [21]
.
1.5 Research of the SPC and FMEA models
SPC was pioneered by Walter A. Shewhart at Bell Laboratories in the early 1920s.
Shewhart developed the control chart in 1924 and the concept of a state of statistical control.
Statistical control is equivalent to the concept of exchange ability developed by logician
William Ernest Johnson also in 1924 in his book Logic, Part III: The Logical Foundations of
Science [22]
. Along with a gifted team at AT&T that included Harold Dodge and Harry Romig
worked to put sampling inspection on a rational statistical basis as well. Shewhart consulted
with Colonel Leslie E. Simon in the application of control charts to munitions manufacture
at the Army's Picatinney Arsenal in 1934. That successful application helped convince Army
Ordnance to engage AT&T's George Edwards to consult on the use of statistical quality
control among its divisions and contractors at the outbreak of World War II. W. Edwards
Deming invited Shewhart to speak at the Graduate School of the U.S. Department of
Agriculture, and served as the editor of Shewhart's book Statistical Method from the
Viewpoint of Quality Control (1939) which was the result of that lecture.
Failure modes and effects analysis (FMEA) is one potential tool with extended use in
reliability engineering for the electrical and electronic components production field as well
as in complicated assemblies (aerospace and automotive industries). The main purpose is to
reveal system weaknesses and thereby minimize the risk of failure occurrence. The FMEA
technique is used in the design stage of a system or product (DFMEA) as well as in the
manufacturing process (PFMEA). Currently, the implementation of quality systems (such as
ISO 9001, QS9000, TS 16949, etc.) requires the establishment of preventive procedures;
therefore, the use of risk analysis methods, such as FMEA, is mandatory [23-25]
. Modern
companies require successful implementation and operation quality-management systems in
order to develop strong customer/supplier relationships, increase profitability, and contribute
to development and growth. Modern quality systems converge to become total quality
Master's Degree Dissertation of Shenyang University
8
management, based on management commitment, people involvement, process management,
and continual improvement. The recently revised ISO 9000 quality-management system is
based on the following eight management principles.
(1) Customer focus
(2) Leadership
(3) People involvement
(4) Process approach
(5) Systems approach
(6) Continual improvement
(7) Factual decision making
(8) Organization/supplier mutually
(9) Beneficial relationships
One of the most important quality management techniques is FMEA ,Its devoted to
minimizing the risk of the failure and understanding what actions need to be taken as a result
of significant unplanned events .The development of a rigorous FMEA ensures preventive
action have been identified prior to an incident and are implemented without delay[26-30]
.For
indentifying the defects with the FMEA tool its very helpful to analysis the results with the
fishbone diagram and also use the 5S(who,what,when,where why), technique to find the
initials problems of the line and finally getting the preventive control with the SPC tools.
Before begin the analysis it’s very important to understanding the process flow and working
steps [31]
.
1.6 Development of the research
In addition, there is lot of research in the quality control field to improve the production
rate, reduction of the cost and improve the efficiency. The research not limited only the
domestic also huge development in the overseas. There is a lot of quality control methods
has been studied during the several decades but in the automotive company the research
application related to practices . In order to get the better quality of the product there is only
continuous improvement process and reduce the repair rate in the automotive company. For
the automotive company ,it’s very important to find out the root cause of the each defect and
print out long term solution because the defects is very sensitive in the car surface . So ,after
researching the many research papers , here will be introduce the new way to find out the

Chapter1 Introduction
9
defects solutions . For the defects analysis here will use the FMEA methodology to find out
the most priority of the defects and use the fishbone diagram to analysis the origin of the
defects. After figure out the main reason of the defects there will use SPC tool identify the
performance trends. This factor is combined to assign prioritization for SPC implementation.
This exercise that should be monitored on a periodic basis via an enhance method.

10
Chapter2 SPC and FMEA methodology
Failure mode and effects analysis (FMEA) has long been used as a planning tool during
the development of processes, products, and services. In developing the FMEA, the team
identifies failure modes and actions that can reduce or eliminate the potential failure from
occurring. Input is solicited from a broad group of experts across design, test, quality,
product line, marketing, manufacturing, and the customer to ensure that potential failure
modes are identified. The FMEA is then used during deployment of the product or service
for troubleshooting and corrective action. The standard FMEA process evaluates failure
modes for occurrence, severity, and detection (Chrysler Corp., Ford Motor Co., and General
Motors Corp., 1995). The multiplication of these values leads to what is known as the risk
priority number (RPN) .RPN = Occurrence * Severity * Detection
2.1 Introduction of FMEA Methods
FMEA is a reliability tool, which requires identifying failure modes of a specific
product or system, their frequency and potential causes. According to Fiorenzo Franceschini
and Maurizio Galetto(2001),the life cycle of a product is analyzed by an inter-functional
work team[32]
.Daimler Chrysler, Ford and General Motors are jointly developed an
international standard named SAE J1739-2006 documentation for FMEA.This document
provides general guidance in the application of different types of FMEA[33]
.First, the
potential failure modes and potential causes are identified along with its effects and then the
current controls are determined [34]
.FMEA method is used to calculate RPN for each failure
mode and then proposed recommended actions to reduce the RPN [35]
. The basic steps are to
identify the root causes and potential problems that could occur, and then derive RPN which
can direct improvement effort to the areas of greatest concern. Actions are then undertaken
to reduce the risk presented by the failure mode [36]
.FMEA was developed at Grumman
Aircraft Corporation in the 1950 and 1960s and it was first applied to the naval aircraft flight
control systems at Grumman. Since, then, it has been extensively used as a powerful
technique for system safety and reliability analysis of products and processes in wide range
of industries [37]
.Xiuxu Zhao presented a new approach for enterprises which combined
Statistical Process Control (SPC) with FMEA knowledge library.

Chapter2 SPC and FMEA methodology
11
FMEA is primarily quality planning tool. It is used to develop features and goals for
product and process, in identifying critical of product/process factor, designing customaries
the potential problems, establishing the control to prevent the errors and prioritizing the
process submit to ensure reliability.FMEA most commonly applied but not limit to design
(DFMEA) and manufacturing process (PFMEA).
Design failure mode and effect analysis (DFMEA) identify the potential failure of
design before they occur.DFMEA then goes to establish a potential effects of the failures,
there causes, how often and when they might occur and their potential seriousness.
Process failure mode and effect analysis (PFMEA) is systemized group of activities
intended to recognized and evaluated the potential failure of a product/process and its effect
identify action which could eliminate or reduce the occurrence or improve the defect ability,
document the process and track change to avoid the potential failure cause.
2.2 FMEA approach
FMEA is carried out by a cross-functional team of experts from various departments.
Normally, a team is formed at the planning stage of a new product based on a concurrent
engineering approach. The team analyzes each component and subsystem of the product for
the failure modes. Then, the potential causes and effects are determined.
The risk of each failure is prioritized based on the risk priority number (RPN). RPN is a
decision factor based on three ratings: Severity (S), Occurrence (O) and Detection (D).
These ratings are scaled with numbers between 1 and 10 [38]
. The analysis starts from the
basic structure of the system and particularly from those system elements for which accurate
information about failure mode and its causes are available. By analyzing the functional
relationships among these elements, it is possible to identify the possibility of propagation of
each type of failure to predict its effects on the production performance of the entire system.
This is an inductive method to analyze failure modes using down-top methodology [39]
.The
FMEA is a formalized but subjective analysis for the systematic identification of possible
root causes and failure modes and the estimation of their relative risks. The main goal is to
identify and then limit or avoid risk within a design. Hence, the FMEA drives towards higher
reliability, higher quality and enhance safety [40]
.FMEA concentrates in identifying the
severity and criticality of failures. FMEA is a fully bottom-up approach [41]
. Risk Priority
Number, which is the product of the severity, occurrence and detection ratings is calculated

Master's Degree Dissertation of Shenyang University
12
as RPN = S x O x D. The RPN must be calculated for each cause of failure. RPN shows the
relative likelihood of a failure mode, in that the higher number, the higher the failure mode.
From RPN, a critical summary can be drawn up to highlight the areas where action is mostly
needed [42-43]
.The RPN is re-calculated after the failure has been addressed.The revised RPN
confirms the effectiveness of the corrective active undertaken.
2.3 Implementation methods for FMEA
Implementation starts with the FMEA planning and cross function team and creation for
FMEA development and the evaluation of the results. From the Fig. 2.1 shows that process
FMEA model which has 11 basic requirements that’s are heading requirements ,process
methodology, process functions, potential failure mood , potential effect of failure, severity,
causes of failure , risk priority number ,detection and actions. After preparation of the team
and planning next step is to delay with the manufacturing process and identification of each
step process and documentation in the FMEA sheet .Standard FMEA sheet is develop by the
IATF (international automotive task force which is given below:
Fig.2.1Potential failure mode and effects analysis Process FMEA model
(1) Heading requirement
Item: Indicated the name and number of the year of the system, subsystem and
component for which the process is being analyzed.
Model of the year: Enter the intended model of the year and program that will be use.
Core team: List of name of the core team members. It’s recommended that all team
members name, department, telephone number and address etc be included on a distribution
list and attach to the FMEA.
Process responsible: Enter the department or the group and also include the supplier
number.

Chapter2 SPC and FMEA methodology
13
Key date: Enter the initial FMEA due date and the date should not exceed the schedule
the start of the production.
Prepared by: Enter the name of the name, telephone number, company of the engineer
responsible for prepare of the FMEA
FMEA date: Enter the date the original FMEA was compile and the latest version of the
date.
(2) Process/methodology steps
From the fig. 2.2 implemented that’s process methodology of the FMEA which is 8
process steps such as description of the process , identify potential failure mode, describe the
effects of the failure ,determine the cause , detection of process, calculated RPN , action plan
and action results. A process methodology step is given below:
Fig. 2.2 Basic process steps of the Process FMEA
Indentify the functions of the scope. Ask, “What is the purpose of this system, design,
process or service? What do our customers expect it to do?” Name it with a verb followed by a
noun. Usually it will break the scope into separate subsystems, items, parts, assemblies or
process steps and identify the function of each. Process identification characteristics come
from the process diagram .A product characteristic is a feature such as dimension, size, form,
location , orientation ,location , texture , coating , hardness ,strength, appearance, reflectivity.
(3) Process function

Master's Degree Dissertation of Shenyang University
14
Indentify the functions of the scope. Ask, “What is the purpose of this system, design,
process or service? What do our customers expect it to do?” Name it with a verb followed by a
noun. Usually it will break the scope into separate subsystems, items, parts, assemblies or
process steps and identify the function of each. Process identification characteristics come
from the process diagram .A product characteristic is a feature such as dimension ,size ,
form ,location , orientation ,location , texture , coating , hardness ,strength, appearance,
reflectivity.
(4) Potential failure mode
For each function, identify all the ways failure could happen. These are potential failure
modes. If necessary, go back and rewrite the function with more detail to be sure the failure
modes show a loss of that function. Potential failure modes is define the manner in which the
process could potentially fail to meet the process requirement .it’s a description of a non
conference at the specific operation .it can be cause associated with a potential failure mode
in the subsequent (downstream) operation or effect associate with a potation failure in a
process operation .how ever preparation of FMEA, the assumption may be made that the
incoming part /materials are correct.
(5) Potential effect of failure
Potential effect of failure is defined as the effect of the failure mode on customer. The
customer in this content could be next operation, subsequent operation or location, the dealer,
the vehicle owner. Each must be consider when assessing the potential effect of failure.
(6) Severity
Severity is an assessment of the seriousness of the effect and refers directly to the
potential failure mode being studied. The customer in process FMEA is both internal and
where appropriate, external customer. The severity ranking is also an estimate of how
difficult it will be for the subsequent operation to be carried out to its specification it
performance, cost and time. The ranking and suggested criteria are based on IATF manual of
FMEA version 3. A common industry standard scale uses 1 to represent no effect and 10 to
indicate very much severe with failure affecting system operation and safety without
warning.
(7) Cause of failure mode
Identify the cause for each failure mode .A failure cause is defined as a design weakness

Chapter2 SPC and FMEA methodology
15
that may result in a failure. The potential causes for each failure mode should be listed in
technical terms and not in terms of symptoms. Examples of potential causes included
improper torque applied, improper operating conditions, too much solvent, improper
alignment, excessive voltage.
(8) Occurrence
The occurrence is the assessment of the probability that the specific cause of the failure
mode will occur. A numerical weight should be assigned to each cause that indicates how
likely that cause is (probability of the occurrence). For that failure history is helpful
increasing the truth of probability .therefore historical data stored in database can be used
and questions like the following are very helpful to solve this problem.
What statistical data is available from previous or similar process designs?
Is the process a repeat of a previous design or have there been some change?
Is the process design completely new?
Has the environment in which the process is to operate changeable?
Have the mathematical or engineering studies been used to predict failure
A common industry standard scale uses 1 to represent unlikely and 10 to indicate
inevitable.
(9) Detection
The detection steps distinguish between two steps of detection. On one hand to
indentify the current control process. Current control process is mechanism that prevent the
cause of the failure mode from occurring or which defect the failure before it reaches the
customer. The engineer should now identify testing analysis, monitoring and other
techniques that can or have been used on the same or similar products / process to detect
failure.
The other things are to assess the probability that the proposed process controls will
detect a potential cause of failure or a process weakness. Assume the failure has occurred
and then assess the ability of the control to prevent shipment of the part with that defect, low
occurrence does not mean low detection. The control should detect the low occurrence. In
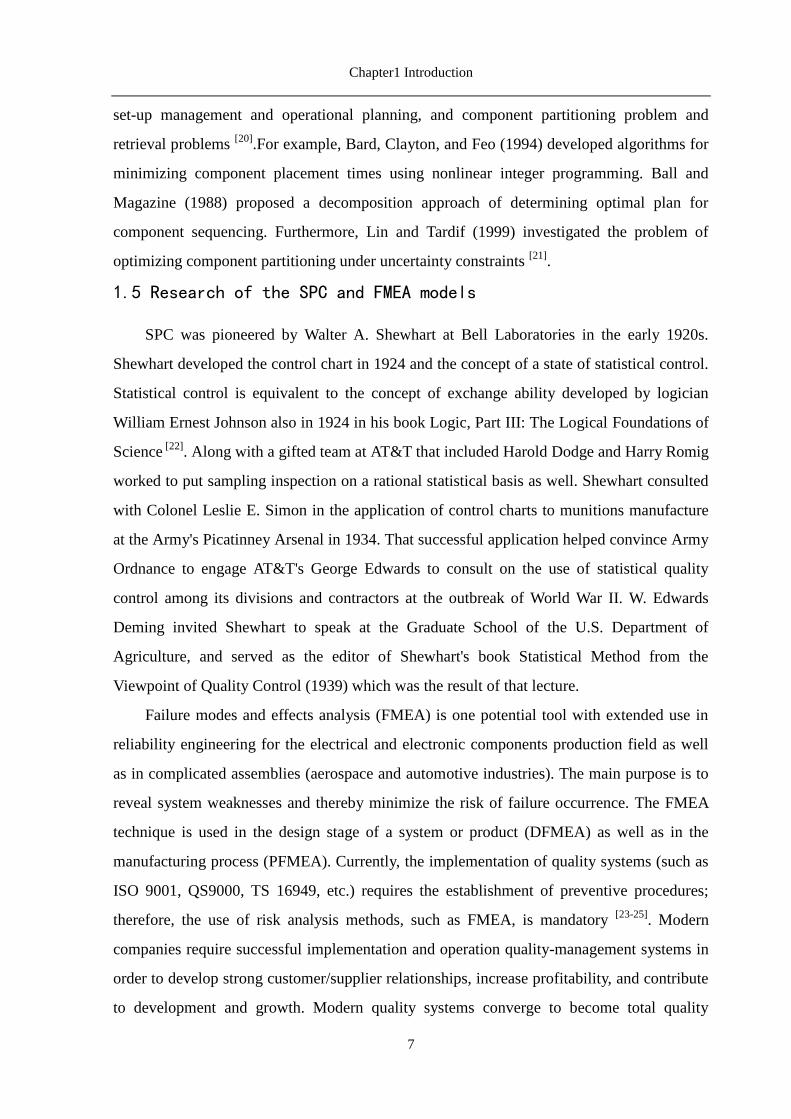
the Tab. 2.1 explain about the qualitative scale of severity, occurrence and deduction. The
rank has been distributed 1-10 and each rank has the deferent scale of the severity,
occurrence and deduction methods which is given below:
Master's Degree Dissertation of Shenyang University
16
Tab.2.1 Qualitative scale for severity, Occurrence and Deduction.
(10) Risk priority number (RPN)
The risk priority number is a mathematical product of the numerical severity,
probability and detection rating.
RPN= (severity * occurrence * detection)
The RPN is use to prioritize items that require addition quality planning action. If the
RPN number high that mean the occurrence of the failure is high.
(11) Actions
Determine recommended action to address potential failures that have a high RPN.
These actions could include specific of different components or materials, de-rating, limiting
environmental stresses or operating range, redesign of the item to avoid the failure mode,
monitoring mechanisms and inclusion of backup system [44]
.
2.4 Significant of the SPC in the manufacturing process
The utility of statistical process control (SPC) methods has received growing interest in
the healthcare community to help improve clinical and administrative processes.SPC charts
are chronological graphs of process data that are used in many other industries to help
understand , control, and improve processes and that, although based in statistical theory,
Rank Severity Occurrence Deduction Resolution
1 None Almost Never Almost certain If the numerical value falls between two
Numbers always select the higher number. If
the team has a disagreement in the ranking
value the following may help.
1. If the disagreement is an adjacent category,
average out the difference. For example, if
one member says 5 and someone else says
6,the ranking in this case should be 6 (5 and
6are adjacent categories. Therefore 5 + 6 = 11,
11/2 = 5.5)
2. If the disagreement jumps one category,
then consensus must be reached. Even with
One person holding out, total consensus must
be reached. No average, no majority.
Everyone in that team must have ownership of
the ranking. They may not agree 100Percent,
but they can live with it.
2 Very minor Remote Very High
3 Minor Very Light High
4 Very Low Light Moderately High
5 Low Low Moderate
6 Moderate Medium Low
7 High Moderately
High
Very Low
8 Very High High Remote
9 Serious Very High Very Remote
10 Hazardous Almost
certain
Almost
impossible
Chapter2 SPC and FMEA methodology
17
are easy for practitioners to use and interpret. The objective of this article is to provide an
overview of SPC charts, the different types and uses of control charts, when to use each chart
type, their statistical performance, and simple methods for determining appropriate sample
sizes. The intended audience includes practitioners and healthcare researchers seeking either
an introduction to these methods or further insight into their design and performance.
Methods for dealing with rare events and low occurrence rates also are discussed. Methods:
Recent empirical examples are used to illustrate appropriate applications of each chart type,
sample size determination, and chart performance. Sensitivities are calculated and tabulated
for a wide range of scenarios to aid practitioners in designing control charts with desired
statistical properties.Control charts are valuable for analyzing and improving clinical process
outcomes. Different types of charts should be used in different applications and sample size
guidelines should be used to achieve the desired sensitivity and specificity. SPC is both a
data analysis method and a process management philosophy, with important implications on
the use of data for improvement rather than for blame, the frequency of data collection, and
the type and format of data that should be collected.When dealing with low rates, it also can
be advantageous to collect data on the number of cases or the amount of time between
adverse events, rather than monthly rates.
2.5 The interaction between SPC system and FMEA repository
In practice of quality engineering exists possibility presentation of range quality
researching and estimation methods on background of life cycle product. In this kind of
system this methods are divided on [45]
:
(1)Preparations of production methods: Quality Function Deployment, Failure Mode
and Effect Analysis (FMEA), The old and new quality tools, Benchmarking.
(2)Quality control and inspection methods uses in production process: Statistical
Process Control, Failure Mode and Effect Analysis, Shainin Method, Taguchi Method,
AQLMethod.
Among these groups of method exists and works information system which is
connected with realization of quality intentional activities. Among replaced quality
researching methods we favor expert methods, one of them uses more and more often -
FMEA method in automotive company. This method is especially instructed at working and
production of product, because makes possible recognition of potential defect with such

Master's Degree Dissertation of Shenyang University
18
advance, so that we can eliminate them across usage of preventive centers yet before
beginning of production. FMEA method can be use not only to analysing of reasons of
defects formation already ascertained, but also in aim of prevention to defect, which
potentially can step out in new product [46]
.FMEA is realized in three principle stages:
preparations, execution of proper analysis and also introductions and superintending of
preventive activities .Behind help created of FMEA sheet we can execute estimation of
activity, persistence, safeties, reliabilities and describe possibility reparability in existing
circumstances of leadership process. Evidencing all of researches and estimation, which are
showed in FMEA sheets, contributes to realizations format condition of project reviews.
Evidencing all of researches and estimations, which are showed in FMEA sheets, contributes
to realizations formal condition of project reviews .In the same time when we use in our
company FMEA method we can estimate quality capability of process and creating control
chart type. This kind of activities name Statistical Process Control. SPC involves using
statistical techniques to measure and analyse the variation of process. Most often used for
manufacturing processes, the intent of SPC is to monitor product quality and maintain
processes to fixed target [47]
.
Statistical quality control refers to using statistical techniques for measuring and
improving the quality of processes and includes SPC in addition to other techniques, such as
sampling plans, experimental design, variation reduction, process capability analysis and
process improvement plans. SPC is used to monitor the consistency of processes used to
manufacture a product designed. It aims to get and keep process under control [45, 46]
. Due to
usage SPC we can say, that process is stable controllability, when variability in process is
exclusively result of chance causes because in process step out systematic causes of
variability [48]
.Industrial experiences of implementations statistical regulations of processes
show that later advantages from usage of method SPC in decisive degree depend on
thorough preparations.SPC can’t be implement to production in such manner in which one
begins exploitations new devices measuring. SPC is method and because demand deeply
well-thought-out, stage preparations, perintended by management methods of with projects
just like FMEA.Using those methods in manufacturing industry introduced on example of
own researches of select production process of automobile industry. The analysis embraced
to operation in case of more often defects in this steps process.
Chapter2 SPC and FMEA methodology
19
Fig. 2.3 Principle of quality control based on FMEA and SPC
Fig.2.3shows the relationship about the FMEA and SPC. From the fig. we can
emphasize that at the input collection the data based on 5M methods and then analysis by the
SPC trends of the defects frequency. After analyzing the defects priority use the FMEA tools
to identified the root cause of the defects and get the FMEA repository. Finally takes the
process control of the defects.

20
Chapter3 Painting process and defect analysis
3.1 Identify the potential defects through painting process
The paint shop is one of the most complex production areas of vehicle manufacture.
From today’s perspective, the most important paint application procedures can be found here,
involving a relatively long process chain. In the paint shop, the highest demands are made on
the functional and visual quality of the painting, on the productivity of the painting
installations, and on the environmental compatibility of the processes. These are responsible
for the high degree of automation that can be found in automobile painting. In most paint
shops, the individual coating processes are classified into coherent functional fields. They
are arranged in such a way in the layout of the painting installation that a material flow
results that is as simple and logical as possible, in relation to the connection of the paint shop
to the neighboring production areas, the body shop, and the assembly line. A standard
coating line (see Figure 3.1.1) for painting 60 units per hour is about 2 km long. The dwell
time of a body is between 6 and 11 hours. About 30–50 people are employed per shift in a
fully automated paint shop, mainly for maintenance, process control, and trouble shooting.
The process chain includes value-adding and non value-adding scopes of work. Non
value-adding jobs are typically manual jobs, for instance, repairs of body shop faults,
sanding and polishing, cleaning, smoothing, and repainting. A future objective is to eliminate
non-value-adding jobs completely, or at least reduce them to the minimum extent possible.
Value-adding processes have reached a high degree of automation today and it is expected
that full automation will be achieved in the future [49]
.
The increasing pressure for reduction in costs is reflected in the effort to reduce the cost
per unit (CPU). This has led to innovations in the customer–supplier relationship and in the
painting process. The standard painting process, which has been used for years by all
Original Equipment Manufacturers:OEMs), consists of the steps primer, base coat 1,
basecoat 2, and clear coat. Consolidated processes are now being introduced which involve
shorter process times, where either the primer application is dispensed with, or where all
coats are applied wet-on-wet, without intermediary drying (see Figure 3.1.2).Surface coating
technology is going through an exciting time. The purpose here is clear-cost reduction,
environmental compliance and improved quality [50]
.
Chapter3-Introduction of paint process
21
3.1.1Car painting process methods
(1)Pretreatment;
(2)Electro coating;
(4)Sealing and underbody protection;
(3)Paint application;
(5)Function layer and Base coat application;
(6)Clear coat application;
(7)Cavity and wax application;
From the fig. 3.1 can see the general process steps of the automotive paint shops. At the
beginning car enter from the body shop to the pretreatment area and after that car goes
through the baking booths and sealing, UBS sealing process. After drying the sealing of the
car its goes into the primer sanding area and finally goes though the base coat and clear coat
application system. After applying the final coat car goes to the sanding, wax and foaming
line and finally handover to the assembly shop. For clear idea of the painting process steps
below figure given below:
Fig. 3.1 Process steps in modern automotive paint shops.
From the fig. 3.2 shows that there is 3steps film build on the car surface which is base coat 1 ,
base coat2 and clear coat. Each automotive car painting company has their own process but
the basic standard process steps can be identified by the below figure.

Master's Degree Dissertation of Shenyang University
22
Fig. 3.2 Standard painting process in different automotive paint shops.
Pretreatment consists of the steps of precleaning, degreasing, purging, and
phosphating.Precleaning removes the rough contaminations. Degreasing solubilizes grease,
for example, deep-drawing greases, oil, wax, and other contaminations acquired from the
earlier working processes.Phosphating following after a purging process, serves as a
temporary corrosion protection, and improves the adhesiveness of the paint film when it is
applied.
Electrocoat paints are water soluble (suspensions of binders and pigments in DI
(deionized) water) with only low proportions of organic solvents (approximately
3%).Electrocoating covers all dip painting processes, where the paint precipitates on the
work piece owing to chemical conversion and associated coagulation of the binder.
The overlapping, spot-welded metal sheets must be sealed in such a way that no
humidity can penetrate between the metal sheets and water in the vehicle interior, which may
lead to corrosion there. On the weld seams, high viscous Polyvinylchloride (PVC) material is
mostly sprayed as paths with airless application or extruded by flat stream nozzles. The
underbody protection also serves as protection from corrosion, mostly for areas exposed to a
high strain because of stone chips. It is applied partially two-dimensionally, for instance, in
wheel arches and in the rocker panel area.
The primer surface which is called BC1 applied on top of the electro coat protects the
cataphoretically ectrocoating film from ultra violet (UV) radiation, serves as a surface
smoothing primer for the following top coat film, and reduces the risk of damage to the
layers below, in case of stone chips. Bumps and faults stemming from the body shop like
Chapter3-Introduction of paint process
23
grinding remains can be repaired by sanding the primer coat. The primer is applied with the
high-speed-rotating application with electrostatic charging of the paint material. For reasons
of volatile organic compounds (VOC) emission, hydro primer materials are mostly used in
Europe and powder, to a certain degree, in North America. A further reduction of emissions
has been achieved with the development of two different processes.
The function layer combines the characteristics of the primer and the base coat material.
It is matched in color to the following base coat material, which is then only applied in one
coat on the wet or flashed off function layer. This is also valid for the metallic effect material.
In this process, the entire process chain consists only of four paint applications cathodic
electrocoating, function layer, base coat, and clear coat, compared to five layers for the
conventional metallic painting cathodic electrocoating, primer surface, basecoat 1, base coat
2, and clear coat. Apart from the emission reduction, this process has the advantages of the
reduced installation investment and overheads owing to the omission of one painting line. A
disadvantage is the fact that faults from the body shop and the cataphoretic electrocoat
process that are not eliminated after the cataphoretic electrocoat can only be processed after
the top coat painting. The top coat is applied after a thorough cleaning of the entire car body.
The prevalent process for the top coat application is the application of a waterborne base
coat, followed by a clear coat. One- and two component high-solid clear coats are mainly
used as clear coats. For waterborne clear coats, powder clear coats, and water-dispersed
powder clear coat systems, so-called powder slurries are formed and so these could not
capture any significant market share.2 wet, 2 coat 1 bake (3C1B), compressed compact
process, in the IPP (2) process the flash off time is verifying with the condition of different
company .it varies 55-80 degree and time is3- 6 min and after flash off the cooling time is 3
min approximately. The oven temperature after clear coat is 144 degree and time is 20
min .UV transmission rate is ≤0.1% when wave length is 290-380nm≤0.5% when wave
length is 380-400 nm ≤1% when wave length is 400-500nm.
Solid base coats are applied as a single coat, using high-speed-rotating atomizers.
Metallic effect paints are applied in two coats, the first coat with high-speed-rotating
atomizers, the second, usually pneumatically. The reason for the second pneumatic
application lies in the desired effect of the painting, which can be reached to the required
extent only in certain application cases with high-speed-rotating atomizers. Also, the
repairing process is more easily accomplished owing to the fact that repair of top coats,

Master's Degree Dissertation of Shenyang University
24
especially in the field, is carried out manually by pneumatic guns. It can be expected,
however, that the electro statically supported application of both coats will prevail in the near
future. With the clear coats, there has been an increase in development activities towards
achieving high scratch resistance. These, and other equally important features, are achieved
by paint formulations that are linked with a higher degree of polymerization by means of UV
radiation. The top coat application is followed by a quality control check. Here, the paint
film is examined for faults like dirt inclusions, wetting disturbances, runners, and other such
defects. Additionally, the film thickness and the visual parameters like color shade, gloss,
and leveling are measured regularly.
The corrosion protecting measures are finalized with the sealing of the cavities with
wax materials. For this, two procedures are usually followed – spraying and flooding. For
spraying, special nozzles are inserted in the cavities, and an exactly measured quantity of
material is sprayed inside each cavity. For flooding, the cavities are filled with flooding wax,
under pressure.
Fig. 3.3 Typical layout of the paint shop.
3.1.2 Process related factors of paint performance
The reliable, objective, and reproducible measurement of the quality-relevant data like
film thickness, color shade and leveling are absolute requirements for a quality-oriented
process-control system. From fig. 3.4 shows that the film thickness distribution on a surface
is subject to a more or less distinct fluctuation that is caused by many factors. The main
factors are the application technology, the setting of the atomizer parameters, the number of
overlaps of the individual spraying paths and spray-booth conditions. In the paint surface
there are various factors that can influence the paint quality. According lab analysis, paint
surface affected by the process parameter, environment, dosing factors, equipments, manual
operational Etc. After long research and experience from the different car manufacturing
Chapter3-Introduction of paint process
25
company the paint main defects oriented by the customer which is orange peel, hiding power,
sagging ,pinholes popping, wetting, Structure hiding ,overspray absorption, redesolving
attacking, cloudiness mottling, effect color, structure etc.
Fig. 3.4 Process related factors of the paint performance.
According to the customer feedback and comparing with the different car
manufacturing it has been concluded that there is branch of defects which has highly
tendency of the car surface technology. As reference, from BMW group defect standard (Ref:
GS97003) is shown in the fig.3.5.Car surface has been evaluated in the five main sections
which is A, B, C, D, E type and defects type has been identified with the different type such
asBI4,BI5, BI6, BI7,BI8 . A type area defects range must not exceed the >2 mm and not
more than 4 BI7 defects at the same areas. In the B area the standard is not more than 2 BI6
defects and the range is not exceed >2mm. Hood and four door down side is the C type area
and which customer can’t see the defects easily and the defects rate is not more than 6 BI6
defects in the one parts . Four door cutout inside, Hood door inside and trunk lid inside is the
D type area and E type area is fuel flap inside and engine compartment and trunk lid inside
which is determine that’s car paint has not been peel off from the surface and no corrosion
adhesion on the surface. So from the fig. 3.5 can easily understand the surface defects type
and its range.

Master's Degree Dissertation of Shenyang University
26
Fig. 3.5 Shows defects evaluation standard corresponding to surface area.
Paint function defects evolution standard for process parameters factors:
Tab. 3.1 shows that main four regular type defects on the car surface and to evaluate the
defects such as color tolerance, paint appearance, film build and gloss has their own standard
and each car manufacturing company set their standard according to the customer
requirements .In the figure shows the 4 types of regular defects which is corresponding (ref:
GS97003) from the BMW company.
Tab. 3.1 Defects type with surface description
Type of defects Defects description
Color tolerance DE=<1.4 (good),DE<1.7(Accepted)
DE>1.7 out of tolerance
Paint Appearance
Horizontal Vertical
N1
<6.0
6.0<X<7.0
7<x<8
>=8
N3
<6.0
6.0<X<7.0
7<x<8
>=8
N1
<3.2
3.2.<X<4.2
4.2<x<5.2
>=5.2
N3
3.7
3.7.<X<4.7
4.7<x<5.7
>=5.7
Film build
Horizontal ≤90 (bad)
>100≤125
(good)
>125(bad)
Vertical ≤90 (bad)
>100-<120
(good)
>120(bad)
Gloss DOI>90(good)
Fig.3.6 is the defects evaluation standard of the car painting surface. In the car surface
has lots of type of the defects but in the BMW car manufacturing company there is 28 type

Chapter3-Introduction of paint process
27
of defects which has potential influence on the car surface and which is determine by the
experiment from the lab results. There is certain kind of defects such as scratch, damage,
chip paint, bulge, waviness adhesive residue which is occur by the damages on the paint
surface and also oriented by the Body in white. During the paint application some defects
cause the paint process such as paint structure, missing paint coat, contact damage, Haze,
clear coat drop. In the reworking process some defects also cause the paint defects such as
sanding spot, polishing through, sanding stains, sanding groove, masking edges. All the
defects determine with the P0/P1,P2,S1,S2 area and also implemented the defects type such
as BI8,BI7,BI6,BI5,BI4.
Fig. 3.6 Defects evaluation standard (ref: GS97003).
3.2 Quality aspects of painting process
The management level of a paint shop requires constantly updated data and facts about
the state of the painting installation, to be able to make decisions based on the facts available.
From the fig. 3.7 it emphasize that there is 4 section of the quality aspect in the paint shop
such as by machine, internal audit, manual checking and customer feedback. These may be
short-term decisions such as introduction of extra shifts, or changes in operations owing to a
high repair rate, or long-term measures like change of a subcontractor owing to quality
Master's Degree Dissertation of Shenyang University
28
problems. The system accesses the data from the process data recording and consolidates
them to the required management data. The data feedback from different module which is
depending on the machine, manual checking, internal audit and customer feedback. Quality
manual inspection is carried out by different measuring device such as color measurement
device, film build device, appearance measuring device, gloss measuring device. Aside
Quality online measuring system AQM is control by the trained qualified specialist which
data monitor by the quality database and processed immediately and shows on the work
piece, according to their place of measurement .IPSQ system use to input the defects online
during the manual operation by the qualified operator .They can be used both for a 100%
quality inspection of individual work pieces and for installation and process optimization, as
well as for statistical evaluation and trend analyses. In order to make the process
standardized need to organized the audit according to the international standard and need to
figure the out the actual deviation of the process capability and process performance relevant
to the standard. Internal and external audit is one of the important data which can help to
evaluate the customer satisfaction and help to improvement the process and take corrective
action immediately. Form the figure we can understand the quality management module in
the paint shop.
Fig. 3.7 Quality control methods in the Painting process
From Fig. 3.8 shows the Quality gate in the different working station and offline
checking of the care and section audit area in the paint shop. During the production if there is
any deviation of the process parameters or equipments instant can figure out the root cause
Chapter3-Introduction of paint process
29
from the quality gate and continue checking till is back to the normal batch production. Each
working station has the internal target as hourly put, repair rate which is help us to figure out
root cause incase of any tolerance of the production .
Fig. 3.8 Quality control gate in the Painting process
Fig. 3.9 Online AQM measurement data output for the car appearance
Fig. 3.9 shows the results of the automotive coating surface measurement data which is
control the surface defects as film build, paint structure, color measurement. All this three
important surface factor is measuring by the robots technology and get a initially results of
the car surface and can see the color deviation from the standard. The measuring requirement
is according to the production batch of the color and if their some non conforming product
found initially test the certain amount of car to figure out the defective cars and analysis the
measuring data by the responsible engineers. In order to make sure the data of the

Master's Degree Dissertation of Shenyang University
30
automotive measuring equipment is in control also measuring car with the manual device to
compare with AQM data in order to make sure the capability of the process performance is
in range.The Automatic painting installations with units like process equipment,
environmental equipment, conveyors, robots, and application equipment are complex
systems whose controllability is subject to the performance of the total process and the
coating result. Therefore, the functionality and the operability of the control-technology
equipment are essential, and high demands are made on the appropriate control technology.
The most important factors are listed below:
• Open, modular, and flexible architecture
• Compatibility with international standards
• Process-orientated
• High uptime
• Convenient, clearly arranged viewing system on PC basis, uniform operating
philosophy
3.3Process Monitoring and Regulation
The complexity of automatic painting installations and the large number of different
process parameters makes it complicated for the plant operator to maintain a high quality of
production, and for the service personnel to eliminate defects without delay. Systems that
support the operator in the diagnosis, optimization, and monitoring of the processes are
already in use. New systems are being developed to further improve on these, by taking into
consideration quality-oriented control of the painting processes and process parameters. The
linking up of such systems with all levels of the process and the installation, and with the
control technology necessary for doing so, makes them very effective tools [51]
.
As shown in Fig. 3.10, the structure of the quality and process control methods mainly
contains three steps:
Step 1: Function step: It makes real time data acquisition and analysis in the
manufacturing process. It can output the statistical analysis results in the form of quality
report. Input the data of manufacturing process into the SPC system. Data mainly collect in
the basis of the Manual inspection, Audit feedback (internal and external audit), automotive
measuring feedback (AQM, IPSQ system).
Step 2: Data evaluation: It implements the FMEA process, which conducted by the
Chapter3-Introduction of paint process
31
experts coming from different area .The knowledge and experience of experts will be
extracted by the brain storming activity. Then, The FMEA results will be transformed into
FMEA knowledge according with specific method and put into FMEA repository.
Step 3: Risk Priority: It’s designed to store the data collected by SPC system and find
out the potential root cause after priorities the specific repository and take immediately
control plan and corrective action in order to improvement of the quality.
Fig. 3.10 A specific control based on FMEA repository and SPC system

32
Chapter4 Data analysis and Discussion
4.1Data collection and statistical analysis
In order to get the defects frequency rate use the SPC control chart. Its help to figure
out the highest frequency of the defects that influence of the process during the production.
Fig. 4.1 shows the defect frequency range within five calendar week. Calendar week1 shows
that among the defects inclusion is one of the most higher falling rate per unit and its one of
the reason for the scraping of the car and influence the TAKT time during the production and
its directly influence the production target . In the TOP coat line each car defects setting
target is 10defects but from the data we can see that inclusion defects mostly influence the
target. To analysis the defective car from the total production, Take the sample as a 5
subgroup and each group check the 10 car as a sample.
Fig.4.1 Diagram of the weekly percentages of the non-conformities
Pareto charts are graphical demonstration of the occurrences, with the most frequently
occurring event to the left and less frequent occurrence to the right. The Pareto charts in Fig.
4.2 shows the occurrences of defects in a painting process organization. 78% of the defects
in the surface are inclusion, followed clear coat drop at16%. The from the chart can see that
these two types of defects are the most prevalent.
In the final inspection line, a certain number of cars are rejected due to Inclusion
scratches, chips, bends, clear coat drop, popping or dents. In order to evaluated the defects
frequency use Pareto chart to see which defect is causing most of the problems. Operator

Chapter 4- Results and Discussion
33
checks the each car surface and put the information into the IPSQ system .so from the fig.
4.2, we can see that inclusion is one of the top problem in the car surface.
Fig. 4.2 Pareto diagram for the surface defects trends in the TC
Ishikawa analysis to figure out the potential causes of the inclusion defects:
Fig.4.3 Ishikawa diagram prepared for investigation of cause of the particles on surfaces
These diagrams depict an array of potential causes of quality problems. The problem
(the head of the fish) is displayed on the right, and the bones of the fish—representing the
potential causes of the problem—are drawn to the left. Potential causes are often categorized
as materials, equipment, people, environment, and management. Other categories may be
included as appropriate. Useful in brainstorming the causes of problems (including potential

Master's Degree Dissertation of Shenyang University
34
problems) from multiple perspectives, these diagrams should include all possible reasons for
a problem. When completed, further analysis is done to identify the root cause. Fig. 4.3 is an
Ishikawa diagram to figure out the root cause of the particle issues in the top coat line. From
this issues need to priorities the possible causes that may influence the inclusion defects on
the car surface. To eliminate this defects, first need established a team which integrated by
the relevant departments as core team.
4.2 Potential root cause and risk analysis by FMEA
FMEA method is applied in painting technological process, so the severity (SEV) of
risk occurrence, the probability (OCC) of risk occurrence and the probability of risk
detection (DET) are determined. All assessments are expressed by numerical values
From 0-10, as shown in Tab. 4.1.
Tab. 4.1 Numerical values of the severity, probability &risk detection
By these numerical value can be calculated the value of Risk priority Number (RPN) with
equitation (1):
RPN = O × S × D (1)
The ranking of RPN is present in Tab. 4.2. Tab. 4.2 General indication of the risk
FMEA worksheet creation, there have been used data from: Department for control and
quality assurance, Maintenance department for equipment interventions, Production
Very small Small Medium Strong Very strong
1 2-3 4-5-6 7-8-9 10
BI8 defects and
online rework
without
production
target
influences
BI7 defects car need
to repair in rework
area and no
customer complaint
without quality risk
BI6 defects
which need to
major rework and
partially
influence
production target
BI5 or BI4
defects with
customer
dissatisfied
and has
quality risk
May be
endangering the
machine or
operator without
warning.
Value of RPN Evaluation of the risk
>100 Significant
10<RPN<100 Less significant
<10 Negligible

Chapter 4- Results and Discussion
35
Department and IT department.
Fig
. 4.4
FM
EA
anal
ysi
s fo
r In
clusi
on d
efec
ts i
n T
op c
oat
pro
cess
Fig
. 4.4
FM
EA
anal
ysi
s fo
r In
clusi
on d
efec
ts i
n T
op c
oat
pro
cess

Master's Degree Dissertation of Shenyang University
36
Fig.4.5 Line plot chart for evaluation the RPN rate before and after the corrective action.
FMEA is made in each step of the production process of paint shop, and there are
determined some potential causes of failure function in separate phase.In Fig.4.5 FMEA
Worksheet is presented for the process of production of Top coat line inclusion defects
reasons, prepared on 11/14/2014.
FMEA analysis shows that RPN has higher value of 245 in the process of manual
inspection of the car surface, RPN rate is 126 in the process steps roller bed and skid
inspection and Lab test results process steps RPN is 128. As the risk value priority is higher
of 100, the risk in the 1st, 3rd and 5
th step (process of inspection, roller and skid, lab test)
from the production process is considered as significant, while in the rest of the steps the
value of the RPN ranges between 8-100. Therefore, it is considered as less significant or
insignificant. If surface inclusion is determined during the control measurement of the
inspection process and small opportunities for the detection i.e. DET=5. While in the daily
roller bed and skid inspection process and lab test process the fault is obvious and the
probability that the product with defects will be distributed is low (DET=2-3).The value of
RPN shows in plot chart (Figure 4.1.4), it can be immediately concluded that the 1st,3
rd and
5th
process cause of the diagram is considerably higher in relation to the other phases and
after take action the RPN rate is in control rate and mean value is 5.8 that is negligible
according to the RPN rating scale .so the process is in the control limit.

Chapter 4- Results and Discussion
37
4.3 Reflow SPC measurement data
To verify that the process has been improved and need to analysis that how efficient the
FMEA during the production process, it’s necessary to reevaluate the data falls in the TOP
coat line. From the figure 4.5 shows that after RPN action improvement inclusion trends is
going down 18 to the 5 defects in the car surface which can easily understand that new
improvement actions could be proposed toward the minimization of the RPN . From the
figure 4.6 C-chart shows that average inclusion trends rate is 3.94 which are in the control.
The data is collection after the corrective action taken which improvement is obvious.
Fig. 4.5 Diagram of the weekly percentages of the non-conformities after corrective action
Fig. 4.6 C -chart for inclusion defects after the corrective action.

Master's Degree Dissertation of Shenyang University
38
4.4 Evaluation of the data
FMEA is a very effective risk analysis method for a company but it is not obligatory to
use but if any organization uses it must get several benefits as it is mentioned in this report.
In automotive company, they use only Design and Process FMEA and some qualitative part
of criticality analysis. To complete an FMEA analysis, it is necessary to make a cross
functional group from different departments of the company. The team will be composed of
experienced and devoted person will search for failure mode, cause, effect, severity,
occurrence, detection etc. together. Brainstorming is very necessary for this FMEA
worksheet. It is also required to find the proper way to lessen the failure mode. Severity
ranking remains almost same if the failure mode is not eliminated. In FMEA worksheet, if
severity ranks 10 or 9, it shows red mark (Red marks suggest for quick preventive work).
There will be an acceptable RPN limit for any company. It may differ for different
companies. Painting process has a grand limit of 100 RPN. The FMEA team needs to see
after the action was taken for the design or process whether the RPN value is less than 100
or not (first part of figure-6).One will get a graph of RPN of before (red marked) and after
action (blue marked).Second part of figure-6, this part comes automatically after the first
part of figure-6 is finished. Here it is possible to compare the performance development by
FMEA process. In the second part of figure-6, it is seen that before the action was taken the
RPN value was 150-260 but when the corrective action was taken the RPN values plunged
exponentially from 150-260 to 30-100. If it is not less than 200, the FMEA team is instructed
to take necessary corrective action and will have to compare the RPN value of before the
action was taken and after the action was taken. In criticality analysis, the occurrence data’s
are plotted in X-axis and severity data’s are plotted in Y-axis. As a result there are four zones
for considered according to the position of failure modes named: confirmed critical
characteristics which have maximum severity points, confirmed significant characteristics,
RPN- Top 20% by Pareto and annoyance region that’s severity points are low but occurrence
ranking is high(fig.4.4). From these zones the FMEA team can decide that which failure
modes should be prioritized more. According to Fig.4.5, the zones should be considered
respectively, confirmed critical characteristics zone, confirmed significant characteristics,
annoyance region and RPN-Top 20% by Pareto.As first priority is for severity then

Chapter 4- Results and Discussion
39
occurrence, detection consecutively. RPN-Top 20% by Pareto means which 20% failure
mode should be prioritized of 100% (fig.4.5). Top 20% failure modes should be considered
as the most part of the zone is very acceptable. The report consists some differences between
FMEA and FMECA. Importantly, FMEA is used for system and FMECA is used for process.
FMEA is the primary steps to generate FMECA. FMECA is just FMEA with criticality
analysis. In FMEA multiple analysis levels (Sub-FMEAs) can be possible. On the other hand,
FMECA does not account for multiple-failure interactions, meaning that each failure is
considered individually and the effect of several failures is not accounted for. FMECA is
time consuming than FMEA.So companies are not very sincere to perform FMECA after
performing FMEA. Parker Hannifin, Borås is performing FMEA analysis if the organization
is asked from the top management of company but it is not hampering of their quality of
analysis. As a result, the main difference between the company findings and the theoretical
finding of this report is: Parker Hannifin is using a grand limit for RPN value and it is 200. If
severity ranks 10 or 9, it marks red for alarming the design or process. In criticality analysis,
the company is only performing the qualitative part (avoiding quantitative part).
4.5 Defects control system
It is the simplicity of this system that makes it so effective.
1) Huge emphasis is placed on
2) Classification of the defect
3) Communication of the problem
4) Action on that problem
From the Fig.4.7 shows the how to classification the defects during the analysis and for
the defects control .Defects classification begin from the process. If the product rejected its
cause two reasons one of is unusual and another is normal cause. Most of the unusual cause
should influence three causes such as most critical, critical and serious.
Master's Degree Dissertation of Shenyang University
40
Fig. 4.7 Defect classification methods for the corrective action.
Any manufacturing process has only two possible outcomes: acceptable product or
rejected product. Rejected product can also be classified into two groups: ‘normal’ (meaning
typical rejects) and ‘unusual’ (abnormal in either nature or magnitude). In most companies,
normal rejects are already managed through systems designed to capture cost or output
losses (scrap and re-work systems). What can be missing in the management of quality is
effective treatment of abnormal events. Such events may occur at relatively low frequencies
(for example, monthly rather than daily). Without a systematic approach to their
management great risk can be present to outgoing quality. It is not safe to take comfort from
the low frequency and assume low risk. NSK developed the XYZ system to effectively deal
with the threat of unusual product events occurring in manufacturing operations. The system
borrows core principles from FMEA (Failure Mode Effect Analysis) - although the nature of
the implementation and how it is applied practically in the work place is believed to be
unique.

Master's Degree Dissertation of Shenyang University
41
Three levels of unusual defect are distinguished:
1) Serious
2) Critical
3) Most critical
The level of ranking applied to any particular product defect is estimated from a simple risk
evaluation (FMEA based):
(SEVERITY x WHERE FOUND x FREQUENCY).
For instance, in the manufacture of bearings, a crack could contribute to a serious
breakdown. Engineers detail all the separate process steps and note what could happen and
the outcome should that defect ever reach the end customer. They then try to find ways in
which they can detect such outcomes in the existing process. Based on this evaluation a
rating level is given to each problem (X, Y or Z):
X = Low risk, or higher risk but detected early in process
Y = Medium risk detected before final detection mechanisms
Z = High criticality defect anywhere in the process
Emphasis is placed on the escalation of action where problems of greatest potential
effect are discovered in plant.
The system exists to keep any problems within the company, and to prevent escapes to
the market. Customers want reliable, consistent products – first time, every time: they are not
interested in how well you manage a quality problem that you have allowed to get out! When
problems are detected in plant they are ranked according to the XYZ matrix. This document
is the guts of the system: containing the expert knowledge relating to the types of defect
possible and their potential detection position.

Master's Degree Dissertation of Shenyang University
42
Fig. 4.8 Defect classification matrix for the process sequence.
From this‘database’ any employee can quickly and easily determine an accurate
ranking for any concern. Generating this matrix is the key activity in XYZ implementation,
needing input from all functions involved in the manufacturing process. Once completed it
needs only infrequent update according to changes in process methods or to reflect new
insight from external feedback. A benefit of applying this matrix is the generation of
consistency across sites in a large organization where similar processes are applied. Utilizing
simple pro-forma documents, the vital step of communicating the concern can start. It is a
very simple systemThe four-part document is rapidly routed around the organization
structure, across department boundaries and hierarchies – in both manufacturing and quality
functions.
Fig. 4.9 Defect communication route.
Chapter 4- Results and Discussion
43
Note the particular emphasis on the Z problem: it must be reported within 30 minutes.
There must be a management meeting within 60 minutes. This urgency is the key to
consistently high levels of quality control. That rapid communication, via hard copy
documents, is not dependent on somebody reading an email, but is personally delivered to
the appropriate person for immediate action. This is well beyond what is required by
accreditation standards (QS 9000 or ISO 9000).If the defect is not critical but might reduce
performance; it is generally classified as a Y problem, and drives a meeting of group leaders
within a day. Less critical problem(X problems), although auctioned promptly, are reviewed
weekly through the supervisory levels to ensure follow-up has taken place. This means
management attention is always focused to the critical few (Z level). The XYZ system can
be applied to any process – whether it is making bearings, cars, ice lollipops or providing a
service – it has a broad application. The most important point is that communication is great,
but action is more important. In a safety-critical product like bearings, only one standard is
allowed: perfection. There is no passing the buck. A Total Quality Culture is in operation.
There are many versions of it, but success relies on practical as well as conceptual
understanding. It also means that the whole supply chain has to be involved.

44
Chapter5 Conclusion
The application of a FMEA reveals the hidden process weaknesses, leading to the
quantification of failure related indicators/failure risks and the creation of a prioritization
matrix for further improvement actions. Risk reassessment and further preventive action
planning could lead to effective risk minimization. The use of a FMEA can also be applied
successfully in various other business sectors (e.g., supplies, sales, financial), leading to
continual improvement and increasing the bottom-line results. After execution of the process
FMEA for inclusion defects problem, it is clear that FMEA is most useful tool to identify
potential failures reduces those effects by implementing control plans. Hence it can be
heavily improve the quality of the product and enhance product performance. FMEA
execution is only present potential failure and ask to implement preventive measure to stop
occurrence of failure and enhance product and process performance so it identification and
implementation of prevention technique for potential failure is very important.
(1)The application of appropriate methods and techniques for monitoring and quality
control in painting process, will allow managers scientific approach in the quality assurance
and production of high quality products at minimum costs.
(2) Based on the results of FMEA and Pareto analysis, the source of poor quality is
identified and it’s reduction of 80% of the top 1 defects. The corrective action is taken and
the required accuracy in top coat line is achieved.
(3) With the combination of the FMEA and SPC method figure out the excellent tools
for organizations self-assessment and tend to improve performance of top coat defects. From
the input of the data of the combination model has the potential influence in the output
results. So it’s concluded that utilization of the combination methods not only increase the
production efficiency but also saving the cost with planned target.
45
Refferences
[1] Ajit Ashok Shenvi.Defect Prevention with Orthogonal Defect Classification [J]. IIETransactions,
2009,165(34):133-136.
[2] Mukesh soni.Defect Prevention, Reducing cost and improving quality” [J]. IEEE Computer, August
1997, 163(30):120-129.
[3] Deming, W. Edwards.Lectures on statistical control of quality [M].Nippon Kagaku Gijutsu Remmei,
1950.
[4] Deming, W. Edwards and Dowd S. John (translator) Lecture to Japanese Management [J].Deming
Electronic Network Web Site, 1950,189(223):556-667.
[5] Mal Owens. Quality improvement methods [M].British Deming Association SPC Press, Inc. 1992.
[6] William ,Florac A , Anita D. Carleton Measuring the Software Process: Statistical Process Control
for Software Process Improvement[J]. SEI Series of Addison Wesley, 2009, 123(23):156-189.
[7] Adrian Burr, Mal Owens .Statistical Methods for Software Quality: Using Metrics for Process
Improvement [J].Thomson Computer Press/ITP, 2012, 23(12), 167-223.
[8] Dr. Deming: The American Who Taught the Japanese about Quality by Rafeal Aguayo[M].United
Kingdom: England, 2015.
[9] Rosenblatt M J ,Kropp D H. The single period stochastic plant layout problem [J]. IIE Transactions,
1992, 45 (24) : 169~176.
[10] P. Jalote, CMM in Practice. Processes for executing software projects at Infosys, Addison
Wesley Longman[J], SEI Series on Software Engineering, 1999,12(23):789-988.
[11] S. H. Kan. Metrics and Models in Software Quality Engineering[M]. Boston: Addison-Wesley, 1995.
[12] J. D. Musa, A. Iannino, and K.Okumoto. Software reliability measurement, prediction,
application [M].New York:McGraw Hill Book Company,1987.
[13] Sperber, William H.; Stier, Richard F.Happy 50th Birthday to HACCP: Retrospective and
Prospective"[J]. Food Safety magazine: 2009, 23(42), 44–46.
[14] Matsumoto, K.; T. Matsumoto, Y. Goto (1975). "Reliability Analysis of Catalytic Converter as an
Automotive Emission Control System"[J]. SAE Technical Paper, 2008, 53(42), 17–46.
[15] Sperber, William H.Potential Failure Mode and Effect Analysis[M].Milwaukee: American Quality
Press, 2003.
[16] S. H. Kan. Potential Failure Mode and Effect Analysis (FMEA) [J]. Automotive Industry, 2008,
156(134):123-433.
[17] Erik .Potential Failure Mode and Effects Analysis in Design (Design FMEA) and Potential
Failure Mode and Effects Analysis in Manufacturing and Assembly Processes (Process FMEA) and
Effects Analysis for Machinery (Machinery FMEA)[J]. SAE, 2008, 130(34):234-239.
[18] Keith Case .Quality Associates International's History of FMEA [J]. Journal of Materials Processing
Technology, 2008, 153(154): 223-260.

Master's Degree Dissertation of Shenyang University
46
[19] Fadlovich, Erik .Performing Failure Mode and Effect Analysis [M]. New York: American Statistical
Quality Press, 2007. [20] Pierre D.L.Failure Mode Effects Analysis (FMEA)[J]. ASQ. Retrieved 2012, 02(15):23-26.
[21] Firenze F, Maurizio Galetto. A New Approach for Evaluation of Risk Priorities of Failure Modes in
FMEA[J]. International Journal of Production Research, 2001, 39(13): 2991-3002.
[22] Teoh, P. C., & Keith Case.Failure modes and effects analysis through knowledge
modeling[J].Journal of Materials Processing Technology, 2004,153(154): 253-260.
[23] Reckiek B, Pierre D. L. Designing mixed- product assembly lines. IEEE Transaction and
Automation [J].IEE, 2000, 16(3): 268-280.
[24] Stamatis, D. H. Failure Mode and Effect Analysis: FMEA from Theory to Execution.(2nd
ed.)[M].Milwaukee: American Quality Press, 2003.
[25] Arabian-Hoseynabadi, H., Oraee, H., & Tavner, P. J.Failure Modes and Effects Analysis
(FMEA) for Wind Turbines [J]. Electrical Power and Energy Systems, 2008, 32(7): 817-824.
[26] Tsu-Ming Yeh, & Jia-Jeng Sun. Preventive Maintenance Model with FMEA and Monte Carlo
Simulation for the key Equipment in Semiconductor Foundries[J]. Scientific Research and Essays,
2011, 6(26): 5534-5547.
[27] M€uller, H. Lewitschnig, N. Kortik, W. Kanert .Quality assurance in automotive electronics [J].
Electrical Power and Energy Systems, 2008, 32(7): 817-824.
[28] J. Fleischer Æ G. Lanza Æ M. Schlipf Æ I. Behrens Quality assurance in micro production. Electrical
Power and Energy Systems[J], 2008,32(7): 330-430.
[29] Huang, J. Shi and K.L.Mak.Failure mode and effect analysis (FMEA) over the WWW[J]. The
International Journal of Advanced Manufacturing Technology, 2007, 16(7):603-608.
[30] Chrysler LLC. Potential Failure Mode & Effects Analysis FMEA Reference Manual (4th Edition),
[M]. Automotive Industry Action Group (AIAG),2008.
[31] Fiorenzo Franceschini, & Maurizio Galetto. A new approach for evaluation of risk priorities of
failure modes in FMEA. International Journal of Production Research [J], 2001, 39(13):2991-3002.
[33] Xu, K., Tang, L. C., Xie, M., Ho, S. L., & Zhu, M. L. Fuzzy assessment of FMEA for engine
System [J].Reliability Engineering and System Safety, 2002, 30(75)75: 17-29.
[34] Teoh, P. C., & Keith Case. Failure modes and effects analysis through knowledge modeling [J].
Journal of Materials Processing Technology, 2013, 34(05):153-154.
[35] Tie Liu, Chi-Liang Lin, & Johnson Lie.Application of FMEA and KT Method on Fab
Daily Management [J]. Journal of Quality, 2011, 15(6): 399-407.
[36] Crites, J. W., & Kittinger, S. W. Use of failure modes and effects analysis (FMEA) methodology in
evaluation of process transfer of ohmic lift off from low-pressure-solvent to high-pressure-nmp
Liftoff [J]. CS MANTECH Conference, 2009, 1(4):18-21.
[37] Sharma, R. K., Kumar, D., & Kumar, P. fuzzy decision support system (FDSS) for
conducting FMEA[J].IE Journal-MC, 2007,50(88): 39-44.
[38] Xiuxu Zhao. A process oriented quality control approach based on dynamic SPC and

47
FMEA repository [J]. International Journal of Industrial Engineering, 2011,14(8): 444-451.
[39] Stamatis, D. H.BFailure mode and effect analysis: FMEA from theory to execution [M].
MilwaukeeLA: American Quality Press, 2003.
[40] D. H. Stamatis.Failure Mode and Effect Analysis [M]. Michigan: Southgate, 2003.
[41] Arabian-Hoseynabadi, H., Oraee, H., & Tavner, P. J. Failure modes and effects
analysis (FMEA) for wind turbines[J]. International Journal of Electrical Power and Energy
Systems, 2010 (7): 817-824.
[42] Ben Swarup Medikonda, Seetha Ramaiah, P.,Anu A. Gokhale.FMEA and fault
tree based software safety analysis of a crossing critical system[J]. Journal of Computer
Science and Technology, 2011(8): 57-62.
[43] Masoud Hekmatpanah, Arash Shahin, & Natraj Ravichandran.The Application of
FMEA in the oil industry in Iran: The case of four liter oil canning process of Sepahan Oil
Company[J]. African Journal of Business Management, 2001, 6(8): 3019-3027.
[44] William W. Barnard. Ford FMEA handbook [M].Ford motor company, 2003.
[45] Tkaczyk S., Dudek Quality rescarch with usage FMEA methods[M].CA:Thousand Oaks,1999.
[46] Lucano A. Choosing the FMEA Paramter in Engineering Process Control[J].Journal of
Quality Technology, 1995, 5(27):162-168.
[47] Paul A .Statistical Design of Attribute Charts [J].Journal of Quality Technology, 1995, 3(27):56-73.
[48] Chen I.J., Coccari R.L., Paetsch K.A., Paul A. Quality managers and the successful
management of quality: an insight[J].Quality Management Journal, 2000,3(7):2-5.
[49] Mutschelknaus, R.Staff optimization and economy enhancement in the paint shop–an
Innovative conception [J].Proceedings of 5th International Strategy Conference on Car Body
Painting, 2006, 4(2):26-62.
[50] Challener, C.Paint modern technology [J].Journal of Coatings Technology, 2006, 12 (7): 28-35.
[51] Hans-Joachim Streitberger and Karl-Friedrich D ossel .Automotive paint coating[M].
Berlin: William Andrew Pub, 1995.

48
Academic Research
[1] Masud M. Research on the measurement analysis and improvement system according to
the ISO9001 in the automotive industry [J]. Journal of Quality Technology:Theory,
Applications and Practice, 2015,27 (2):162-168.

49
Acknowledgement
In the process of research and writing papers from start to finish getting unconditional
support, careful guidance and help from Professor Dr.Zhang Xinmin and his vast knowledge
of broad vision gave me a deep inspiration. In the paper of complete process, instructors
provide detailed references to the professional standards set strict demands to me, from the
topic, given the title, has been repeatedly modified in the final paper.Prof.Dr.Zhan Xinmin is
always responsible to give me a profound and detailed guidance to help me develop ideas,
careful coaching and valuable encouragement. More than two years of academic thinking in
science realistic attitude toward research, extensive deep academic level, creative, make me
a stronger in deepen knowledge in the quality filed . Loving care and support of classmate
during study period led me to the successful completion of their studies. During my learning
period who help me and give me lot of encouragement toward to success would like to
express my deep respect and heartfelt thanks.
Here, I also expressed deep gratitude to my entire instructor during graduate school!