20140824 abnormalities in human pluripotent cells due to reprogramming mechanisms
TRANSCRIPT

ARTICLEdoi:10.1038/nature13551
Abnormalities in human pluripotent cellsdue to reprogramming mechanismsHong Ma1,2*, Robert Morey3*, Ryan C. O’Neil4,5, Yupeng He4,5, Brittany Daughtry1,2, Matthew D. Schultz4, Manoj Hariharan4,Joseph R. Nery4, Rosa Castanon4, Karen Sabatini3, Rathi D. Thiagarajan3, Masahito Tachibana2{, Eunju Kang1,2,Rebecca Tippner-Hedges1,2, Riffat Ahmed1,2, Nuria Marti Gutierrez1,2, Crystal Van Dyken1,2, Alim Polat2{, Atsushi Sugawara2,Michelle Sparman2, Sumita Gokhale6, Paula Amato7, Don P.Wolf2, Joseph R. Ecker4,8, Louise C. Laurent3 & Shoukhrat Mitalipov1,2,7
Human pluripotent stem cells hold potential for regenerative medicine, but available cell types have significant limitations.Although embryonic stem cells (ES cells) from in vitro fertilized embryos (IVF ES cells) represent the ‘gold standard’, they areallogeneic to patients. Autologous induced pluripotent stem cells (iPS cells) are prone to epigenetic and transcriptionalaberrations. To determine whether such abnormalities are intrinsic to somatic cell reprogramming or secondary to thereprogramming method, genetically matched sets of human IVF ES cells, iPS cells and nuclear transfer ES cells (NT EScells) derived by somatic cell nuclear transfer (SCNT) were subjected to genome-wide analyses. Both NT ES cells and iPScells derived from the same somatic cells contained comparable numbers of de novo copy number variations. In contrast,DNA methylation and transcriptome profiles of NT ES cells corresponded closely to those of IVF ES cells, whereas iPS cellsdiffered and retained residual DNA methylation patterns typical of parental somatic cells. Thus, human somatic cells canbe faithfully reprogrammed to pluripotency by SCNT and are therefore ideal for cell replacement therapies.
The derivation of human ES cells from in vitro fertilized embryos1 isrelevant for cell-based therapies, and while iPS cell technology2,3 overcomesallogenicity issues, a high frequency of genetic and epigenetic abnormalitieshave been observed, including subchromosomal duplications and deletionsdetected as copy number variations (CNVs)4,5, protein-coding mutations6
and defects in DNA methylation and gene expression at regions subjectto imprinting and X-chromosome inactivation7–10. Although it is not yetunderstood whether these aberrant epigenetic marks reflect errors aris-ing during reprogramming or incomplete reversion to pluripotency, theycould impact the accuracy of in vitro disease modelling or, more impor-tantly, the utility of iPS cells for regenerative medicine. With the avail-ability of somatic cell nuclear transfer as an alternative approach to somaticcell reprogramming11, we explored the mechanisms underlying transcrip-tion factor- and SCNT-based reprogramming.
Genetically matched cell linesIn addition to four NT ES cell lines derived from fetal human dermalfibroblasts (HDFs), designated NT1–NT4 (ref. 11), we generated seveniPS cell lines from the same HDFs using retroviral vectors12 (two lines,named iPS-R1 and iPS-R2) and Sendai-virus-based vectors13 (five lines,named iPS-S1, iPS-S2, iPS-S3, iPS-S4 and iPS-S5). Two IVF ES cell lines(human ES Oregon (hESO)-7 and hESO-8) were derived following IVFof oocytes from the same egg donor used for SCNT11. All cell lines main-tained typical morphology, expressed pluripotency markers, formedteratomas and retained diploid karyotypes with no detectable numer-ical or structural chromosomal abnormalities.
Short tandem repeat (STR) genotyping verified that all NT ES celland iPS cell lines were genetically matched to each other and to HDFs.
The one exception to this was iPS-R1, which had a homozygous D3S1768locus on chromosome 3 (Supplementary Table 1), whereas all other lineswere heterozygous at this locus.
SNP genotyping also confirmed that all NT ES cell and iPS cell lineswere essentially identical to each other and to the HDFs in terms of theirnuclear genomes (.99.96% similarity, Supplementary Table 2). Oocyteand sperm donors showed first-degree genetic relationships to IVF ES cells.
Using whole methylome and transcriptome sequencing, the mito-chondrial DNA (mtDNA) in NT ES cells matched those of the IVF EScells, whereas the iPS cell and HDF sequences differed from those of theIVF ES cells at 13 nucleotide positions (Extended Data Fig. 1a, b). Con-sistent with previous measurements, we detected a small amount of HDFmtDNA carryover (1–4.9%) in some NT ES cells (Supplementary Table 3).
Subchromosomal aberrationsHigh-throughput SNP genotyping identified ten de novo CNVs in early-passage iPS cells and three in NT ES cells (Extended Data Fig. 2a). NT3carried a one-copy deletion on chromosome 16, and NT4 had two dupli-cations on chromosomes 3 and 6. Among the iPS cells, iPS-S1 harbouredtwo duplications on chromosomes 1 and 5; iPS-S2 had three one-copydeletions on chromosomes 1, 4 and 17; iPS-S3 carried a single one-copydeletion on chromosome 10; iPS-R1 displayed two duplications on chro-mosomes 3 and 4, one large run of homozygosity (ROH) encompassingmost of the short arm of chromosome 3 and one two-copy deletion withinthe ROH. This ROH was consistent with STR analysis (SupplementaryTable 1). A single one-copy deletion on the X chromosome was iden-tified in human hESO-7. All CNVs were validated using quantitativePCR (qPCR) analysis (Extended Data Table 1).
*These authors contributed equally to this work.
1Center for Embryonic Cell and Gene Therapy, Oregon Health & Science University, 3303 Southwest Bond Avenue, Portland, Oregon 97239, USA. 2Division of Reproductive and Developmental Sciences,Oregon National Primate Research Center, Oregon Health & Science University, 505 Northwest 185th Avenue, Beaverton, Oregon 97006, USA. 3Department of Reproductive Medicine, University ofCalifornia, San Diego, SanfordConsortium for RegenerativeMedicine, 2880Torrey Pines ScenicDrive, La Jolla, California92037,USA. 4Genomic Analysis Laboratory, the Salk Institute for Biological Studies,La Jolla, California 92037, USA. 5Bioinformatics Program, University of California at San Diego, La Jolla, California 92093, USA. 6University Pathologists LLC, Boston University School of Medicine, RogerWilliams Medical Center, Providence, Rhode Island 02118, USA. 7Division of Reproductive Endocrinology, Department of Obstetrics and Gynecology, Oregon Health & Science University, 3181 SouthwestSam Jackson Park Road, Portland, Oregon 97239, USA. 8Howard Hughes Medical Institute, the Salk Institute for Biological Studies, La Jolla, California 92037, USA. {Present addresses: Department ofObstetrics and Gynecology, South Miyagi Medical Center, Shibata-gun, Miyagi 989-1253, Japan (M.T.); Departmentof Cell and Molecular Biology, Karolinska Institutet, SE-17177Stockholm, Sweden (A.P.).
1 0 J U L Y 2 0 1 4 | V O L 5 1 1 | N A T U R E | 1 7 7
Macmillan Publishers Limited. All rights reserved©2014
CNV analysis was extended to a second matched set, consisting of NTES cell (Leigh-NT1) and iPS cell lines (Leigh-iPS1, Leigh-iPS2 and Leigh-iPS3) derived from a patient with Leigh syndrome11. G-banding did notreveal any numerical or chromosomal abnormalities and STR genotyp-ing corroborated that all lines were from the Leigh patient (Leigh-fib,Supplementary Table 1). Leigh-NT1 carried oocyte mtDNA while allLeigh iPS cells inherited patient mtDNA including the homoplasmicm.8993T.G mutation14 (Extended Data Fig. 1c). Nine de novo CNVswere identified in this data set, including multiple CNVs in Leigh-iPS1and Leigh-iPS3 and one each in Leigh-iPS2 and Leigh-NT1 (ExtendedData Fig. 2a and Extended Data Table 1).
In summary, iPS cells, NT ES cells and IVF ES cells carried an average of1.8, 0.8 and 0.5 CNVs per line, respectively (Extended Data Fig. 2b), withno statistically significant differences among cell types. InDel analysis usingRNA sequencing (RNA-seq) also showed a trend towards fewer muta-tions in NT ES cells compared with iPS cells, but the differences amongcell types were again not statistically significant (P . 0.05, Extended DataFig. 2c, d). Thus, it seems that the mutagenic and selective pressures forboth reprogramming approaches are not statistically different, but thisconclusion is limited by the small numbers of cell lines analysed.
Global DNA methylationDNA methylation is an important epigenetic mechanism contributingto cell identity, and significant differences have been reported between
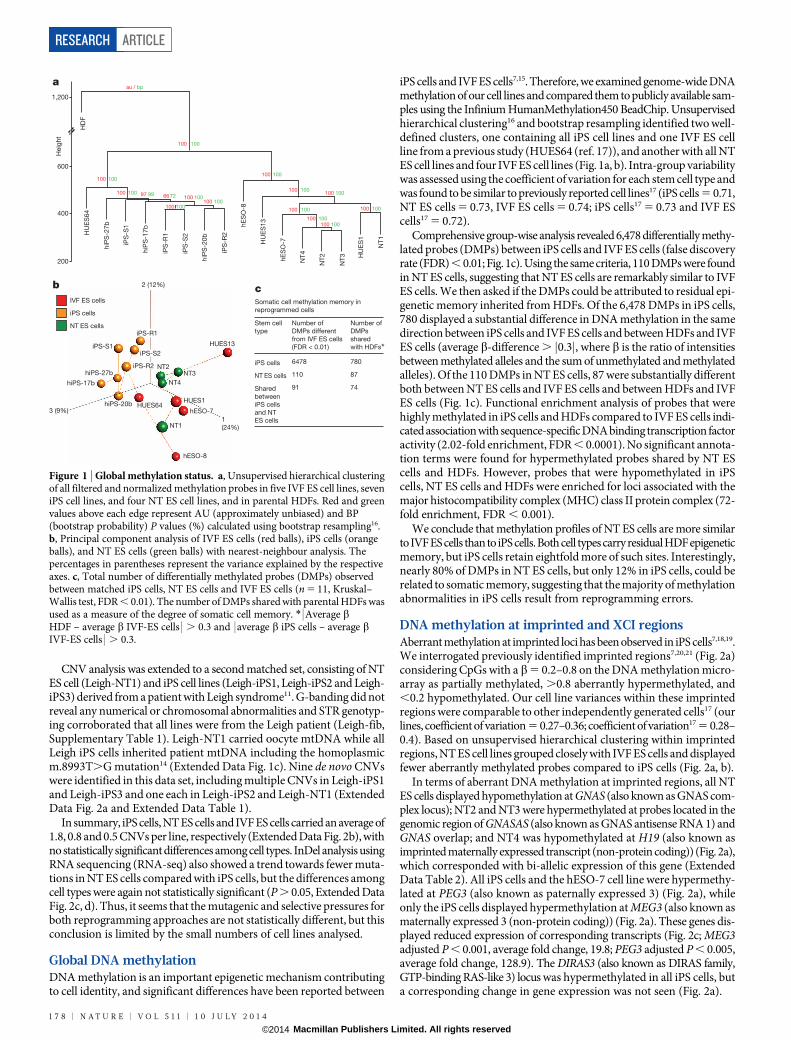
iPS cells and IVF ES cells7,15. Therefore, we examined genome-wide DNAmethylation of our cell lines and compared them to publicly available sam-ples using the Infinium HumanMethylation450 BeadChip. Unsupervisedhierarchical clustering16 and bootstrap resampling identified two well-defined clusters, one containing all iPS cell lines and one IVF ES cellline from a previous study (HUES64 (ref. 17)), and another with all NTES cell lines and four IVF ES cell lines (Fig. 1a, b). Intra-group variabilitywas assessed using the coefficient of variation for each stem cell type andwas found to be similar to previously reported cell lines17 (iPS cells 5 0.71,NT ES cells 5 0.73, IVF ES cells 5 0.74; iPS cells17 5 0.73 and IVF EScells17 5 0.72).
Comprehensive group-wise analysis revealed 6,478 differentially methy-lated probes (DMPs) between iPS cells and IVF ES cells (false discoveryrate (FDR) , 0.01; Fig. 1c). Using the same criteria, 110 DMPs were foundin NT ES cells, suggesting that NT ES cells are remarkably similar to IVFES cells. We then asked if the DMPs could be attributed to residual epi-genetic memory inherited from HDFs. Of the 6,478 DMPs in iPS cells,780 displayed a substantial difference in DNA methylation in the samedirection between iPS cells and IVF ES cells and between HDFs and IVFES cells (average b-difference . j0.3j, where b is the ratio of intensitiesbetween methylated alleles and the sum of unmethylated and methylatedalleles). Of the 110 DMPs in NT ES cells, 87 were substantially differentboth between NT ES cells and IVF ES cells and between HDFs and IVFES cells (Fig. 1c). Functional enrichment analysis of probes that werehighly methylated in iPS cells and HDFs compared to IVF ES cells indi-cated association with sequence-specific DNA binding transcription factoractivity (2.02-fold enrichment, FDR , 0.0001). No significant annota-tion terms were found for hypermethylated probes shared by NT EScells and HDFs. However, probes that were hypomethylated in iPScells, NT ES cells and HDFs were enriched for loci associated with themajor histocompatibility complex (MHC) class II protein complex (72-fold enrichment, FDR , 0.001).
We conclude that methylation profiles of NT ES cells are more similarto IVF ES cells than to iPS cells. Both cell types carry residual HDF epigeneticmemory, but iPS cells retain eightfold more of such sites. Interestingly,nearly 80% of DMPs in NT ES cells, but only 12% in iPS cells, could berelated to somatic memory, suggesting that the majority of methylationabnormalities in iPS cells result from reprogramming errors.
DNA methylation at imprinted and XCI regionsAberrant methylation at imprinted loci has been observed in iPS cells7,18,19.We interrogated previously identified imprinted regions7,20,21 (Fig. 2a)considering CpGs with a b5 0.2–0.8 on the DNA methylation micro-array as partially methylated, .0.8 aberrantly hypermethylated, and,0.2 hypomethylated. Our cell line variances within these imprintedregions were comparable to other independently generated cells17 (ourlines, coefficient of variation 5 0.27–0.36; coefficient of variation17 5 0.28–0.4). Based on unsupervised hierarchical clustering within imprintedregions, NT ES cell lines grouped closely with IVF ES cells and displayedfewer aberrantly methylated probes compared to iPS cells (Fig. 2a, b).
In terms of aberrant DNA methylation at imprinted regions, all NTES cells displayed hypomethylation at GNAS (also known as GNAS com-plex locus); NT2 and NT3 were hypermethylated at probes located in thegenomic region of GNASAS (also known as GNAS antisense RNA 1) andGNAS overlap; and NT4 was hypomethylated at H19 (also known asimprinted maternally expressed transcript (non-protein coding)) (Fig. 2a),which corresponded with bi-allelic expression of this gene (ExtendedData Table 2). All iPS cells and the hESO-7 cell line were hypermethy-lated at PEG3 (also known as paternally expressed 3) (Fig. 2a), whileonly the iPS cells displayed hypermethylation at MEG3 (also known asmaternally expressed 3 (non-protein coding)) (Fig. 2a). These genes dis-played reduced expression of corresponding transcripts (Fig. 2c; MEG3adjusted P , 0.001, average fold change, 19.8; PEG3 adjusted P , 0.005,average fold change, 128.9). The DIRAS3 (also known as DIRAS family,GTP-binding RAS-like 3) locus was hypermethylated in all iPS cells, buta corresponding change in gene expression was not seen (Fig. 2a).
HUES13
hESO-8
NT1
NT2NT3
NT4
hiPS-20b
hiPS-17b
hiPS-27b
iPS-S1
IVF ES cells
NT ES cells
iPS cells
1
(24%)
2 (12%)
3 (9%)
a
Stem cell
type
Number of
DMPs different
from IVF ES cells
(FDR < 0.01)
Number of
DMPs
shared
with HDFs
iPS cells
NT ES cells
Shared
between
iPS cells
and NT
ES cells
6478
110
91
780
87
74
Somatic cell methylation memory in
reprogrammed cells
b c
200
400
600
1,200
Heig
ht
iPS
-R1
iPS
-R2
iPS
-S2
iPS
-S1 h
ES
O-8
hE
SO
-7
NT
4
NT
2
NT
3
NT
1
HU
ES
1
HU
ES
13
hiP
S-1
7b
hiP
S-2
7b
HU
ES
64
HD
F
hiP
S-2
0b
au / bp
100 100
100 100
100 100100 100
100 100100 100
100 100100 100
100 100
100 100100 100667297 99100 100
hESO-7
HUES1HUES64
iPS-R2
iPS-R1
iPS-S2*
100 100
Figure 1 | Global methylation status. a, Unsupervised hierarchical clusteringof all filtered and normalized methylation probes in five IVF ES cell lines, seveniPS cell lines, and four NT ES cell lines, and in parental HDFs. Red and greenvalues above each edge represent AU (approximately unbiased) and BP(bootstrap probability) P values (%) calculated using bootstrap resampling16.b, Principal component analysis of IVF ES cells (red balls), iPS cells (orangeballs), and NT ES cells (green balls) with nearest-neighbour analysis. Thepercentages in parentheses represent the variance explained by the respectiveaxes. c, Total number of differentially methylated probes (DMPs) observedbetween matched iPS cells, NT ES cells and IVF ES cells (n 5 11, Kruskal–Wallis test, FDR , 0.01). The number of DMPs shared with parental HDFs wasused as a measure of the degree of somatic cell memory. * | Average bHDF – average b IVF-ES cells | . 0.3 and | average b iPS cells – average bIVF-ES cells | . 0.3.
RESEARCH ARTICLE
1 7 8 | N A T U R E | V O L 5 1 1 | 1 0 J U L Y 2 0 1 4
Macmillan Publishers Limited. All rights reserved©2014

X-chromosome inactivation (XCI) can be detected by allele-specificexpression and coating of the X chromosome by the long noncoding RNAsXIST (also known as X inactive specific transcript (non-protein coding))and XACT22,23. Based on RNA-seq, all female cells in our dataset expressedsimilar levels of XIST, but only pluripotent cells expressed XACT (Ex-tended Data Fig. 3a, b). hESO-8 (male) was unmethylated at previouslyannotated XCI loci7, whereas all female lines were predominantly par-tially methylated (b5 0.2–0.8; Fig. 3a). NT ES cells and IVF ES cells dem-onstrated higher DNA methylation levels at XCI loci compared to HDFs.However, methylation levels in iPS cells were significantly higher thanin NT ES cells and female hESO-7 (Fig. 3b, P,0.001), with substantialvariation among lines. With aberrant methylation defined asb, 0.2 or. 0.8, NT ES cells and hESO-7 had fourfold fewer aberrations than iPScells (Fig. 3c, P , 0.001). POU3F4 (also known as POU class 3 homeo-box 4), SLITRK2 (also known as SLIT and NTRK-like family, member 2)and SLITRK4 (also known as SLIT and NTRK-like family, member 4)hypermethylation in iPS-R2 correlated with lower gene expression whilehypomethylation of DACH2 (also known as Dachshund homologue 2),RPS6KA6 (also known as ribosomal S6 kinase 4) and CHM (also knownas choroideremia rab escort protein 1) in iPS-R1 and TMEM187 (alsoknown as transmembrane protein 187) in iPS-S2 correlated with increasedgene expression (Fig. 3a and Extended Data Fig. 4a, b).
Autosomal non-imprinted lociDifferential DNA methylation analysis of autosomal non-imprinted sitesrevealed 1,621 DMPs between our groups (Kruskal–Wallis test, P , 0.01,Db. 0.5). We grouped these probes into six major clusters using an unsu-pervised self-organizing map algorithm24 (Extended Data Fig. 5). All sixclusters were analysed for cis-regulatory functional enrichments using
GREAT25, but only cluster 3 showed significant enrichments for cat-egories associated with morphogenesis and neural development (Sup-plementary Table 4). iPS cells displayed higher DNA methylation levelscompared to NT ES cells and IVF ES cells for most clusters, with theexception of cluster 4, in which the highest DNA methylation was seenin the IVF ES cells. NT ES cells displayed intermediate DNA methyla-tion, but overall were closer to IVF ES cells. We examined several dif-ferent probe subsets, and noted higher methylation levels in iPS cellscompared to IVF ES cells, as reported previously26,27 (Extended DataFig. 6a–o).
Whole-genome bisulphite sequencingTo gain a more detailed picture of the underlying methylation differ-ences in our cells, we generated high-coverage base-resolution methy-lomes (143 to 253) using MethylC-seq8. We also assessed the methylomesof three additional IVF ES cells (H1, H9 and HUES6)28–30. Hierarchicalclustering at CG differentially methylated regions (DMRs) demonstratedthat the methylation landscape of NT ES cells more closely matched IVFES cells compared to iPS cells (Fig. 4a). By comparing the methylomesand filtering regions that were obscure or highly variable in IVF EScells, 678 CG DMRs were identified (Supplementary Table 5) that werepresent in at least one NT ES cell or iPS cell line but not in IVF ES cells(FDR 5 0.01). Most of these CG DMRs were identified within iPS cells(619), whereas NT ES cells contained threefold fewer (212) and 153 CGDMRs were shared (Fig. 4b). Using a similar approach, we calculatedthat five previously profiled iPS cells8 carried a total of 792 CG DMRs,suggesting that both iPS cell groups are comparable. Most of the CG DMRswere localized within CG islands and gene bodies (Fig. 4c). Analysis of CG-DMR distribution among individual cell lines showed that each NT ES
NT
2
NT
3
NT
4
NT
1
hE
SO
-8
hE
SO
-7
iPS
-R2
iPS
-R1
iPS
-S1
iPS
-S2
HD
F
NT ES cells
IVF ES cells
iPS cells
HDFs
β = 0 unmethylated
β = 1 methylated
DIRAS3 (n = 3)
NAP1L5 (n = 11)
PLAGL1/HYMAI (n = 9)
GRB10 (n = 3)
SGCE/PEG10 (n = 44)
MESTIT1/MEST (n = 45)
DLGAP2 (n = 1)
KCNK9 (n = 1)
H19 (n = 12)
KCNQ1/KCN1OT1 (n = 23)
MEG3 (n = 1)
MKRN3 (n = 3)
MAGEL2 (n = 2)
PEG3 (n = 9)
L3MBTL (n = 14)
GNASAS/GNAS (n = 6)
SNRPN (n = 6)
PEG3/ZIM2 (n = 15)
GNAS (n = 5)
b
0%
18%
16%
14%
12%
10%
8%
6%
4%
2%
20%
Perc
en
tag
e o
f
tota
l im
prin
ted
pro
bes
Total imprinting probes with β < 0.2 or > 0.8
00
PEG3 gene expression and average methylation
0.90.80.70.60.50.40.30.20.10
1.0
0
1,8001,6001,4001,2001,000
800600400200
1,600
1,400
1,200
1,000
800
600
400
200
2,000
MEG3 gene expression and methylationc
a
iPS-S
2
iPS-S
1
iPS-R
1
iPS-R
2
hESO
-7
hESO
-8NT4
NT1
NT3
HDF
HDF
iPS-S
2
iPS-S
1
iPS-R
1
iPS-R
2
hESO
-7
hESO
-8NT4
NT1
NT3
HDF
HDF
iPS-S
2
iPS-S
1
iPS-R
1
iPS-R
2
hESO
-7
hESO
-8NT4
NT1
NT3
HDF
HDF
β (m
eth
yla
tio
n)
0.90.80.70.60.50.40.30.20.1
1.0
β (m
eth
yla
tio
n)
Avera
ge n
orm
aliz
ed
read
s (R
NA
-seq
)A
vera
ge n
orm
aliz
ed
read
s (R
NA
-Seq
)
Figure 2 | Methylation at imprinted regions. a, Heat map of previouslyidentified imprinted regions. For each gene, an average b-value (the ratio ofintensities between methylated alleles and the sum of methylated andunmethylated alleles) for all DNA methylation probes assigned to a specificgene is shown and the number of included probes is indicated next to the gene.White box, hypermethylation at DIRAS3 locus, no change in gene expression;black boxes, DNA methylation changes at H19, GNASAS or GNAS, and GNAS
loci (no change in gene expression); grey box, hypermethylation at the MEG3locus (reduced gene expression); yellow box, hypermethylation at the PEG3locus (reduced gene expression). b, Bar graph showing percentage of totalimprinted probes that had ab, 0.2 or . 0.8. c, Bar and line graphs showing thenormalized RNA-seq read count (bars, averaged between replicates) and theDNA methylation b-values (black line) for MEG3 and PEG3. Solidus symbolsindicate genes with overlapping genomic regions.
ARTICLE RESEARCH
1 0 J U L Y 2 0 1 4 | V O L 5 1 1 | N A T U R E | 1 7 9
Macmillan Publishers Limited. All rights reserved©2014

cell line had fewer aberrant regions than any of the iPS cell lines (Fig. 4d,P 5 0.0147, Mann–Whitney test). CG DMRs were then assigned intothree groups: memory DMRs (mDMRs; shared with HDF), NT-specificDMRs (ntDMRs) and iPS-cell-specific DMRs (iDMRs). On average, 38%of total CG DMRs in the NT ES cell lines and 22% of DMRs in iPS cellswere mDMRs (Fig. 4d).
Inspection of the recurrent CG DMRs (hotspot DMRs8) in everyiPS cell or NT ES cell line revealed that NT ES cell lines had 50 hotspotDMRs, or twofold fewer than iPS cells (104) (Fig. 4e). Interestingly, 48 of50 hotspot DMRs in NT ES cells were also shared with iPS cells (P ,
0.001, Hypergeometric test). Of the hotspot DMRs shared among all 8cell lines 63% (30 out of 48) were mDMRs, suggesting regions resistantto reprogramming by either approach. Only 2 (4%) hotspot DMRs wereunique to NT ES cells compared to 56 (54%) iPS-cell-specific hotspots(Fig. 4e).
Non-CG methylation in NT ES cellsWe previously identified pervasive and exclusive non-CG methylationin pluripotent cells31. We also reported that iPS cells carry frequent aber-rant non-CG methylations8. We identified regions showing megabase-scale non-CG methylation differences (non-CG mega DMRs) in NT EScells and iPS cells when compared to IVF ES cells. Five IVF ES cell lines,two from this study and the three described previously, served as ourcontrol methylation landscape28–30. Autosomal non-CG mega DMRs(150) were identified when the methylomes of 13 iPS cell lines and NTES cell lines were compared to controls (Extended Data Fig. 7a andSupplementary Table 6). Non-CG mega DMRs linked to the sex chro-mosomes were excluded due to the mixed gender of controls. A total of150 autosomal non-CG mega DMRs covered 123 megabases (Mb) ofgenome and included all regions reported previously8 (99% of bases);of these, 77 non-CG mega DMRs were identified from the iPS and NTcells, 70 of which occurring exclusively in iPS cells (Fig. 5a). These DMRswere distributed on every autosomal chromosome except chromosome13 (Fig. 5b). Only 7 non-CG mega DMRs (tenfold less) were present inNT ES cells. Consistent with our previous findings8, non-CG mega DMRswere significantly closer to centromeric and telomeric regions comparedwith shuffled non-CG mega DMRs (Fig. 5b, P , 0.001). We also observedseveral different patterns of aberrant non-CG methylation, includinghypomethylation in iPS cells only, or in both NT ES cells and iPS cells,and hypermethylation in iPS cells only (Extended Data Fig. 7b, c, d).However, the vast majority of non-CG mega DMRs (92.5% of total bases)were hypomethylated in iPS cells and/or NT ES cells compared with IVFES cells (Fig. 5c).
We asked whether methylomes from our four iPS cells were similarto other iPS cells8. The former contained a total of 75 DMRs, while thelatter carried 121, indicating that despite different somatic cell origin andculture conditions, iPS cells carried similar levels of aberrant non-CG me-thylation. In contrast, NT ES cells showed the least amount of aberrantnon-CG methylation (Fig. 5c, d; P , 0.005). Hierarchical clustering for allnon-CG mega DMRs also supported the conclusion that the NT ES cellsare more similar to IVF ES cells (Extended Data Fig. 7a).
To understand the functional impact of non-CG mega DMRs, we focusedon transcriptional activity within those regions. On average, 2 genes in NT EScells and 30 in iPS cells were located within non-CG mega DMRs, imply-ing that fewer genes in NT ES cells are affected (Extended Data Fig. 8a, b;P 5 0.0147). Gene ontology analysis32 for genes in hypomethylated non-CG DMRs revealed that these genes were related to olfactory transduc-tion, epidermal cell differentiation, cytoskeleton, immunoglobulin andhomeobox proteins (FDR # 0.001; Supplementary Table 7). Gene expres-sion in the iPS cells for 2 genes in the hypermethylated non-CG megaDMRs was upregulated (Extended Data Fig. 8c, P , 0.05), whereasexpression of 24 genes in the iPS cells and 6 genes in the NT ES cells inthe hypomethylated non-CG mega DMRs were down regulated (ExtendedData Fig. 8d, e; P , 0.001). These observations indicate that NT ES cellswere more faithfully reprogrammed to a state closely matching IVF EScells compared to iPS cells. Particularly, NT4 had the least aberrant meth-ylation in both CG and non-CG contexts.
Global gene expressionLastly, we examined global gene expression patterns from strand-specificRNA-seq. Consistent with DNA methylation, intra-group variability wassimilar among cell types (coefficients of variation: NT ES cells 5 1.41, IVFES cells 5 1.45, iPS cells 5 1.44) and unsupervised hierarchical clusteringpositioned NT ES cells closely with IVF ES cells (Fig. 6a). Differential expre-ssion analysis (FDR , 0.05) yielded 1,220-transcripts, grouped into 10 clus-ters. The majority (65%) of these genes were either significantly upregulatedor downregulated in iPS cells compared to NT ES cells and IVF ES cells.Clusters 2 and 3 showed higher gene expression in NT ES cells and IVFES cells compared to iPS cells; when subjected to functional enrichmentanalysis, these clusters were associated with p38 MAPK signalling pathwaygenes (FDR 5 0.02; n 5 51) and Krueppel-associated box genes (FDR 5
0.001; n 5 91). Cluster 10 contained transcripts that were upregulated in
0 Mb
20 Mb
30 Mb
40 Mb
50 Mb
60 Mb (Centromere)
70 Mb
80 Mb
110 Mb
120 Mb
130 Mb
140 Mb
90 Mb
100 Mb
154 Mb
IVF ES cellsiPS cellsHDFs
hE
SO
-8
NT
1
NT
2
NT
3
NT
4
hE
SO
-7
iPS
-R1
iPS
-R2
iPS
-S2
iPS
-S1
HD
F
β = 0 unmethylated
β = 1 methylated
POU3F4
SLITRK2/SLITRK4
DACH2/RPS6KA6/CHM
TMEM187
NT ES cells
P < 0.001
0.00
0.20
0.40
0.60
0.80
1.00
Total XCI probes with β < 0.2 or > 0.8
a
c
Perc
enta
ge o
f to
tal X
CI p
rob
es
b
P < 0.0010.55
0.5
0.45
0.4
0.35
Avera
ge β
-valu
e
Average β-value for all XCI probes
iPS-S
1
iPS-S
2
iPS-R
2
iPS-R
1
hESO
-7NT4
NT3
NT2
NT1
HDF
iPS-S
1
iPS-S
2
iPS-R
2
HDF
iPS-R
1
hESO
-7NT4
NT3
NT2
NT1
Figure 3 | Methylation at X-chromosome inactivation sites. a, Heat mapdisplaying b-values of previously identified XCI probes on the DNAmethylation array in NT ES cells, IVF ES cells, iPS cells and HDFs. The geneshighlighted with black boxes showed both aberrant hypermethylation andcorresponding changes in gene expression. The hypomethylated geneshighlighted in white boxes were associated with corresponding changes in geneexpression. b, Line graph showing an average b-value for all XCI probes foreach cell line (two-sided t-test, P , 0.001, error bars s.e.m.). c, The percentage oftotal XCI probes with b , 0.2 or . 0.8 (two-sided t-test, P , 0.001).
RESEARCH ARTICLE
1 8 0 | N A T U R E | V O L 5 1 1 | 1 0 J U L Y 2 0 1 4
Macmillan Publishers Limited. All rights reserved©2014

IVF ES cells compared to both NT ES cells and iPS cells and included genesassociated with zinc finger and C2H2-like genes (FDR 5 0.002; n 5 227).Cluster 8 was enriched for MGI expression of TS10 primary trophoblastgiant cells (FDR 5 0.03; n 5 46) and cluster 5 was associated with Y-linkedinheritance.
Based on differential expression analysis, we searched for genes dis-playing transcriptional memory in both iPS cells and NT ES cells. Threeseparate t-tests between HDFs and IVF ES cells, NT ES cells and IVF EScells and iPS cells and IVF ES cells were conducted at a FDR cut-off of 0.05.We found 24 genes that were expressed at significantly lower levels in theNT ES cells and HDFs compared to IVF ES cells, probably indicating in-completely reactivated genes, and 12 genes that were expressed at signifi-cantly higher levels representing incompletely silenced genes (Fig. 6b). Incontrast, 171 genes were incompletely reactivated and 32 were incomple-tely silenced in iPS cells.
We found that incompletely reactivated genes in iPS cells also retainedsignificantly higher promoter methylation (P , 2.2 3 10216, Mann–Whitney test), possibly indicating incomplete demethylation during repro-gramming (Fig. 6c). Overall, the gene expression and DNA methylationresults were consistent, both suggesting that NT ES cells are more similarto IVF ES cells than to iPS cells.
ConclusionsHere, we showed that transcription-factor-based reprogramming is assoc-iated with incomplete epigenetic reprogramming. In contrast, the samesomatic cells reprogrammed by SCNT displayed epigenetic and transcrip-tional signatures remarkably similar to those of IVF ES cell controls.
Both NT ES cells and iPS cells contained similar levels of de novoCNVs, with some lines (iPS-R2, iPS-S4, iPS-S5 and NT1 and NT2) dis-playing no detectable alterations. This observation indicates that screen-ing of multiple cell lines may allow recovery of genetically normal lines.However, CNV analysis does not completely exclude the presence of pointmutations, small indels, or translocations. Indeed, exome sequencing hasdemonstrated that iPS cells carry, on average, six non-synonymous pointmutations per line33.
Using genome-wide microarray-based DNA methylation as an indi-cator of reprogramming, we demonstrated that NT ES cells undergo morecomplete reprogramming than iPS cells. We also confirmed the persistenceof somatic patterns of CpG methylation in human iPS cells, consistent witha mouse study34. Although NT ES cells also carried evidence of epigeneticmemory, iPS cells contained eightfold more CpG sites that retained theDNA methylation pattern of parental HDFs. Whole-genome bisulphitesequencing was consistent with the DNA methylation microarray ana-lysis, showing that iPS cells carried threefold more aberrant CG andtenfold more aberrant non-CG methylation compared to NT ES cells,indicating that SCNT reprogramming is capable of resetting the DNAmethylation and corresponding gene expression program more faith-fully than iPS cell reprogramming.
cbaiP
S-R
2iP
S-S
1iP
S-R
1iP
S-S
2hE
SO
-8hE
SO
-7N
T1
NT
3N
T4
NT
2
d
0 1mCG/CG
619 iPS cell
CG DMRs
212 NT ES cellCG DMRs
All
Gene ±
2 k
b
CG
I
TS
S ±
2 k
b
TE
S ±
2 k
b
Gene
Num
ber
of
CG
DM
Rs
0
100
200
300
400
500
600
NT ES cellsiPS cells
700
Num
ber
of
CG
DM
Rs
0
50
100
150
200
250
300
NT
1
NT
2
NT
3
NT
4
iPS
-R1
iPS
-R2
iPS
-S1
iPS
-S2
mDMRs
ntDMRs
iDMRs
49
40
42
34
60
71
76
57
90
72
62
50
248
17
0 232 2
87
e400
56
2
48
iPS cell hotspot
DMRs (n = 104)
NT ES cell
hotspot DMRs (n = 50)
Hotspot DMRs
466
153
59
Figure 4 | CG DMRs across NT ES cells and iPS cells. a, Completehierarchical clustering of CG methylation for a total 678 CG DMRs identifiedby comparing methylomes of NT ES cells and iPS cells to IVF ES cells.b, Venn diagram showing the overlap of CG DMRs across iPS cells and NT EScells in cases in which the DMR is found in at least one of the lines in the samegroup. c, The number of 678 CG DMRs that overlapped (at least 1 bp) withindicated genomic features. CGI, CG islands; TES, transcription end sites; TSS,transcription start sites. d, Distribution of CG DMRs among each NT ES cell
and iPS cell line. DMRs that were also shared with parental somatic cells wereidentified as memory or mDMRs. Other DMRs were then assigned intoNT-specific DMRs (ntDMRs) and iPS-cell-specific DMRs (iDMRs) if theDMRs were present in NT ES cell lines and iPS cell lines, respectively.e, The Venn diagram shows the hotspot CG DMRs that were identified in everyiPS cell or NT ES cell line in the same group. Hotspot CG DMRs (48) wereshared among all iPS cell and NT ES cell lines.
a
To
tal b
ases in
no
n-C
G m
eg
a D
MR
s (M
b)
0
20
40
60
80 Non-CG hypomethylationNon-CG hypermethylation
c
Num
ber
of
no
n C
G m
eg
a-D
MR
s
0
20
40
60
80
NT
1
NT
2
NT
3
NT
4
iPS
-R1
iPS
-R2
iPS
-S1
iPS
-S2
IMR
90-i
PS
C
AD
S-i
PS
C
FF
-iP
SC
19.1
1
FF
-iP
SC
19.7
FF
-iP
SC
6.9
NT
1
NT
2
NT
3
NT
4
iPS
-R1
iPS
-R2
iPS
-S1
iPS
-S2
IMR
90-i
PS
C
AD
S-i
PS
C
FF
-iP
SC
19.1
1
FF
-iP
SC
19.7
FF
-iP
SC
6.9
Non-CG hypomethylationNon-CG hypermethylation
d
70
2
75 non-CG mega DMRs
in iPS cells
7 non-CG
mega DMRs
in NT ES cells
Non-CG mega DMRs
iPS cells
NT ES cells
Shared
1 2 3 4 5 6 7 8 9 10 11121314 1516 171819 202122
b
5
Figure 5 | Non-CG mega DMRs in NT ES cells and iPS cells. a, Venndiagram showing the overlap of the 77 non-CG mega DMRs identified in theiPS cell and the NT ES cell lines from this study. Numbers within circles denoteDMRs identified exclusively within each group. Five DMRs were shared amongall cell lines in both groups. b, Chromosome ideogram showing the location ofthe 77 non-CG mega DMRs found in both NT ES cell and iPS cell lines fromthis study. Orange circles and lines indicate the location of the individual DMRsspecific for iPS cells; green circles and lines denote those specific for NT ES cellsand yellow circles and lines are DMRs shared by both cell types. c, Total lengthof the non-CG mega DMRs identified in 4 NT ES cell and 9 iPS cell lines. TheNT ES cells had a significantly lower size of DMRs (Mann–Whitney test,P , 0.005) compared to the iPS cells. FF, foreskin fibroblasts. d, Total numberof the non-CG mega DMRs identified in the cell lines. The NT ES cells had asignificantly lower number of DMRs (Mann–Whitney test, P , 0.005)compared to the iPS cells.
ARTICLE RESEARCH
1 0 J U L Y 2 0 1 4 | V O L 5 1 1 | N A T U R E | 1 8 1
Macmillan Publishers Limited. All rights reserved©2014

An explanation for this more effective reprogramming by SCNT isthat the ooplasm provides ‘physiologic’ levels of reprogramming factorsthat are upstream of pluripotency. It has been suggested that oocyte fac-tors rapidly demethylate the somatic genome, whereas this process occurspassively during factor-based reprogramming34. Clearly, elucidation ofoocyte-based reprogramming mechanisms will support the develop-ment of improved reprogramming protocols.
In summary, although IVF ES cells most closely resemble cells resid-ing in embryos, they are allogeneic. Human iPS cells might remain themost facile cell type for many in vitro applications, but show extensiveepigenetic and transcriptomic aberrations compared to NT ES cells andIVF ES cells. NT ES cells combine significant advantages of both types;epigenetic stability of IVF ES cells and the histocompatible nature ofiPS cells. Further studies on additional NT ES cell lines, especially linesderived from aged patients, and their differentiation potential are nowwarranted.
Online Content Methods, along with any additional Extended Data display itemsandSourceData, are available in the online version of the paper; references uniqueto these sections appear only in the online paper.
Received 9 December 2013; accepted 5 June 2014.
Published online 2 July 2014.
1. Thomson, J. A. et al. Embryonic stem cell lines derived from human blastocysts.Science 282, 1145–1147 (1998).
2. Takahashi, K. et al. Induction of pluripotent stem cells from adult humanfibroblasts by defined factors. Cell 131, 861–872 (2007).
3. Rais, Y. et al. Deterministic direct reprogramming of somatic cells to pluripotency.Nature 502, 65–70 (2013).
4. Hussein,S.M.et al. Copynumbervariationandselectionduring reprogramming topluripotency. Nature 471, 58–62 (2011).
5. Laurent, L. C. et al. Dynamic changes in the copy number of pluripotency and cellproliferation genes in human ESCs and iPSCs during reprogramming and time inculture. Cell Stem Cell 8, 106–118 (2011).
6. Ruiz, S. et al. Analysis of protein-coding mutations inhiPSCsand their possible roleduring somatic cell reprogramming. Nature Commun. 4, 1382 (2013).
Singletons
Negative regulation
of histone acetylation
(fold 41.6) FDR = 0.007
p38 MAPK signalling pathway
(fold 17.7) FDR = 0.02
Krueppel-associated box
(fold 8.02) FDR = 0.001
TS10 primary trophoblast giant cells
(fold 10.7) FDR = 0.028
Y-linked inheritance
(fold 58.3) FDR = 0.005N
T2
-1
NT
3-1
NT
4-2
NT
1-1
hE
SO
-8-1
hE
SO
-7-1
iPS
-R2
-2
iPS
-R2
-1
iPS
-S1
-2
iPS
-S2
-1
HD
F1
HD
F2
hE
SO
-7-2
hE
SO
-8-2
NT
1-2
NT
2-2
NT
4-1
NT
3-2
iPS
-S3
-2
iPS
-R1
-1
iPS
-R1
-2
iPS
-S1
-1
iPS
-S2
-2
iPS
-S3
-1
2.0
1.0
0.0
–1.0
–2.0
Zinc finger, C2H2-like
(fold 2.4) FDR = 0.002
NT ES
cells
IVF ES
cells
iPS ES
cells
Pro
mo
ter
β (n
= 1
,217)
P < 2.2 × 10⁻¹⁶
a
b c Promoter methylation of genes significantly lower
compared to IVF ES cells in both HDF and iPS cellsIPS cells vs IVF ES cells
629 genes
Q < 0.05
203 genes
NT ES cells vs IVF ES cells
48 genes
Q < 0.05
36 genes
HDFs vs IVF ES cells
5,820 genes
Q value < 0.05
IVF ES cells
iPS cells
HDFs
NT ES cells
Cluster 1
Cluster 2
Cluster 3
Cluster 4
Cluster 5
Cluster 6
Cluster 7
Cluster 8
Cluster 9
Cluster 10
0.8
0.6
0.4
0.2
0.0
1.0
Figure 6 | Gene expression analysis by RNA-seq. a, Heat map displaying1,220 differentially expressed genes between NT ES cells, iPS cells and IVF EScells (n 5 22) (ANOVA adjusted p-value ,0.05). Genes were clustered intoten-groups for functional analysis and presented as a heat map. Cluster 4, 6, 7,and 9 showed no significant functional enrichments. b, Venn diagram showingthe number of genes differentially expressed between the HDFs and the IVFES cells (large circle), the iPS cells and the IVF ES cells (medium circle) and theNT ES cells and IVF ES cells (small circle; t-test FDR ,0.05). Overlappingregions represent the number of genes differentially expressed in both the
HDFs and either the NT ES cells or iPS cells. c, Notched box plots represent theb-value of all probes in the promoter regions (22,000 bp to 500 bp) of the genesthat were expressed at significantly lower levels (t-test FDR , 0.05) in boththe HDFs and the iPS cells (exhibiting transcriptional memory) whencompared to the IVF ES cells. The box represents the interquartile range(25th to 75th percentile), and the line within the box marks, the median. Thenotch in the box represents the 95% confidence interval around the median.The whiskers above and below the box contain 99.3% of the data and thenumber of CpGs interrogated is shown on the y axis.
RESEARCH ARTICLE
1 8 2 | N A T U R E | V O L 5 1 1 | 1 0 J U L Y 2 0 1 4
Macmillan Publishers Limited. All rights reserved©2014

7. Nazor, K. L. et al. Recurrent variations in DNA methylation in humanpluripotent stem cells and their differentiated derivatives. Cell Stem Cell 10,620–634 (2012).
8. Lister,R.et al.Hotspotsofaberrantepigenomic reprogramming inhuman inducedpluripotent stem cells. Nature 471, 68–73 (2011).
9. Ohi, Y. et al. Incomplete DNA methylation underlies a transcriptional memory ofsomatic cells in human iPS cells. Nature Cell Biol. 13, 541–549 (2011).
10. Ruiz, S. et al. Identification of a specific reprogramming-associated epigeneticsignature in human induced pluripotent stem cells. Proc. Natl Acad. Sci. USA 109,16196–16201 (2012).
11. Tachibana, M. et al. Human embryonic stem cells derived by somatic cell nucleartransfer. Cell 153, 1228–1238 (2013).
12. Lowry,W.E.et al.Generation ofhuman inducedpluripotent stemcells fromdermalfibroblasts. Proc. Natl Acad. Sci. USA 105, 2883–2888 (2008).
13. Fusaki, N., Ban, H., Nishiyama, A., Saeki, K. & Hasegawa, M. Efficient induction oftransgene-free humanpluripotent stem cells using a vectorbasedon Sendai virus,an RNA virus that does not integrate into the host genome. Proc. Jpn Acad. B 85,348–362 (2009).
14. Taylor, R. W. & Turnbull, D. M. Mitochondrial DNA mutations in human disease.Nature Rev. Genet. 6, 389–402 (2005).
15. Bock, C. et al. Reference maps of human ES and iPS cell variation enablehigh-throughput characterization of pluripotent cell lines. Cell 144, 439–452(2011).
16. Suzuki, R. & Shimodaira, H. Pvclust: an R package for assessing theuncertainty in hierarchical clustering. Bioinformatics 22, 1540–1542(2006).
17. Ziller, M. J. et al. Genomic distribution and inter-sample variation of non-CpGmethylation across human cell types. PLoS Genet. 7, e1002389 (2011).
18. Stelzer, Y. et al. Identification of novel imprinted differentially methylated regionsby global analysis of human-parthenogenetic-induced pluripotent stem cells.Stem Cell Rep. 1, 79–89 (2013).
19. Rugg-Gunn,P. J., Ferguson-Smith,A.C.&Pedersen,R.A.Statusofgenomic imprintinginhumanembryonicstemcellsasrevealedbyalargecohortof independentlyderivedand maintained lines. Hum. Mol. Genet. 16, R243–R251 (2007).
20. de Hoon, M. J., Imoto, S., Nolan, J. & Miyano, S. Open source clustering software.Bioinformatics 20, 1453–1454 (2004).
21. Saldanha, A. J. Java Treeview–extensible visualization of microarray data.Bioinformatics 20, 3246–3248 (2004).
22. Silva, S. S., Rowntree, R. K., Mekhoubad, S. & Lee, J. T. X-chromosome inactivationand epigenetic fluidity in human embryonic stem cells. Proc. Natl Acad. Sci. USA105, 4820–4825 (2008).
23. Vallot, C. et al. XACT, a long noncoding transcript coating the active X chromosomein human pluripotent cells. Nature Genet. 45, 239–241 (2013).
24. Newman, A. M.& Cooper, J. B. AutoSOME: a clustering method for identifying geneexpression modules without prior knowledge of cluster number. BMCBioinformatics 11, 117 (2010).
25. McLean, C. Y. et al. GREAT improves functional interpretation of cis-regulatoryregions. Nature Biotechnol. 28, 495–501 (2010).
26. Nishino, K. et al. DNA methylation dynamics in human induced pluripotent stemcells over time. PLoS Genet. 7, e1002085 (2011).
27. Polo, J. M. et al. Cell type of origin influences the molecular and functionalproperties of mouse induced pluripotent stem cells. Nature Biotechnol. 28,848–855 (2010).
28. Xie, W. et al. Epigenomic analysis of multilineage differentiation of humanembryonic stem cells. Cell 153, 1134–1148 (2013).
29. Laurent, L. et al. Dynamic changes in the human methylome duringdifferentiation.Genome Res. 20, 320–331 (2010).
30. Lister, R. et al. Global epigenomic reconfiguration during mammalian braindevelopment. Science 341, 1237905 (2013).
31. Lister, R. et al. Human DNA methylomes at base resolution show widespreadepigenomic differences. Nature 462, 315–322 (2009).
32. Ashburner, M. et al. Gene ontology: tool for the unification of biology. The GeneOntology Consortium. Nature Genet. 25, 25–29 (2000).
33. Gore, A. et al. Somatic coding mutations in human induced pluripotent stem cells.Nature 471, 63–67 (2011).
34. Kim, K. et al. Epigenetic memory in induced pluripotent stem cells. Nature 467,285–290 (2010).
Supplementary Information is available in the online version of the paper.
Acknowledgements The authors acknowledge the OHSU Embryonic Stem CellResearch Oversight Committee and the Institutional Review Board for providingoversight and guidance. We thank oocyte and sperm donors and the Women’s HealthResearch Unit staff at the Center for Women’s Health, University Fertility Consultantsand the Reproductive Endocrinology and Infertility Division in the Department ofObstetrics and Gynecology of Oregon Health and Science University for their supportand procurement of human gametes. We are grateful to C. Penedo for microsatelliteanalysis and W. Sanger and D. Zaleski for karyotyping services. We are also indebted toY. Li, H. Sritanaudomchai and D. Melguizo Sanchis for their technical support.We thankthe staff at the Institute for Genomic Medicine Genomics Facility at UCSD for runningthe Infinium HumanMethylation450 BeadChips and sequencing of the RNA-seqlibraries. The authors acknowledge the Texas Advanced Computing Center (TACC) atThe University of Texas at Austin (http://www.tacc.utexas.edu) and the San DiegoSupercomputing Center (through an allocation from the eXtreme Science andEngineering Discovery Environment (XSEDE)) for providing HPC resources that havecontributed to the research results reported within this paper. SCNT and iPS cellstudies were supported by grants from the Leducq Foundation and OHSU institutionalfunds. R.M., K.S., R.T. and L.C.L. were supported by the UCSD Department ofReproductive Medicine. Methylome studies were supported by the Salk InternationalCouncil Chair fund endowment and the Mary K. Chapman Foundation to J.R.E. J.R.E. isan investigator of the Howard Hughes Medical Institute and the Gordon and BettyMoore Foundation (GMBF3034). A.P. received a fellowship from the Swedish ResearchCouncil, Vetenskapsradet. E.K. was partially funded by a fellowship from the CollinsMedical Trust.
Author Contributions H.M., R.M., L.C.L. and S.M. conceived the study and designed theexperiments. P.A., M.S. and N.M.G. coordinated recruitment of gamete donors. P.A.performed ovarian stimulations and oocyte retrievals. M.T., M.S., N.M.G. and S.M.conducted SCNT, IVF and embryo culture experiments. R.T.-H., S.M., M.T., M.S., N.M.G.,H.M., A.P., B.D., E.K., A.S. and R.A. derived and cultured IVF ES cells, NT ES cells and iPScells. S.G. performed teratoma analysis. H.M., M.T. and C.V.D. performed the DNA andRNA extractions, mtDNA amplification refractory mutation system qPCR analyses, andqPCR. R.M., K.S., R.D.T. and L.C.L. performed SNP, DNA methylation and RNA-seqstudies and bioinformatic analysis of the data. R.C.O., Y.H., M.D.S., M.H., J.R.N., R.C. andJ.R.E. conducted MethylC-seq studies. H.M., R.M., R.C.O., Y.H., J.R.E., L.C.L., D.P.W. andS.M. wrote the paper.
Author Information Processed data sets canbedownloaded from the NCBI GEO underaccession GSE53096 for RNA-seq, SNP array and 450K methylation array, andaccession GSE57179 for MethylC-seq data. Analysed MethylC-seq data sets can alsobe accessed at http://neomorph.salk.edu/SCNT/browser.html. Reprints andpermissions information is available at www.nature.com/reprints. The authors declareno competing financial interests. Readers are welcome to comment on the onlineversion of the paper. Correspondence and requests for materials should be addressedto S.M. ([email protected]), L.C.L. ([email protected]) or J.R.E ([email protected]).
ARTICLE RESEARCH
1 0 J U L Y 2 0 1 4 | V O L 5 1 1 | N A T U R E | 1 8 3
Macmillan Publishers Limited. All rights reserved©2014