2014 valvular heart disease guideline data...
TRANSCRIPT

1 © American College of Cardiology Foundation and American Heart Association, Inc.
2014 Valvular Heart Disease Guideline Data Supplements
(Section numbers correspond to the full-text guideline.)
Table of Contents Data Supplement 1. Outcomes in Adults With Low-Flow/Low-Gradient Aortic Stenosis With Reduced Left Ventricular Ejection Fraction (stage S1) (Sections 3.2.1.1 and 3.2.3) ............... 2
Data Supplement 2. Hemodynamic Progression of Aortic Stenosis in Adult Patients (stages B and C) (Section 3.2.1.3) ............................................................................................................ 5
Data Supplement 3. Exercise Stress Testing in Asymptomatic Adults With Aortic Stenosis (stages B and C) (Sections 3.2.1.5 and 3.2.3) ................................................................................ 6
Data Supplement 4. Clinical Trials of Lipid Lowering Therapy in Adults With Asymptomatic Mild to Moderate Aortic Stenosis (stage B (Section 3.2.2) ...................................................... 8
Data Supplement 5. Clinical Outcomes in Asymptomatic Adults With Aortic Stenosis (stages B and C) of Known Hemodynamic Severity (Section 3.2.3) .................................................... 9
Data Supplement 6. Incidence of Sudden Death in Asymptomatic Adults With Aortic Stenosis (stages B and C) (Section 3.2.3) ............................................................................................ 11
Data Supplement 7. Clinical Outcomes in Symptomatic Adults With Aortic Stenosis of Known Hemodynamic Severity (Section 3.2.3) ............................................................................... 12
Data Supplement 8. Outcomes in Adults With Low-Flow/Low-Gradient Aortic Stenosis With Preserved Left Ventricular Ejection Fraction (stage S2) (Section 3.2.3) ............................... 14
Data Supplement 9. Choice of Intervention in Symptomatic Adults With Severe Aortic Stenosis (stage D): Surgical Versus Transcatheter Aortic Valve Replacement (Section 3.2.4) ........ 16
Data Supplement 10. Clinical Outcomes of Asymptomatic Patients With Chronic Aortic Regurgitation (Sections 4.3.1.1 and 4.3.3) ...................................................................................... 17
Data Supplement 11. Vasodilator Therapy in Asymptomatic Patients With Chronic Aortic Regurgitation (Section 4.3.2) ....................................................................................................... 20
Data Supplement 12. Determinants of Outcome After Surgery for Chronic Aortic Regurgitation (Section 4.3.3) ..................................................................................................................... 21
Data Supplement 13. Hemodynamic Effects Percutaneous Mitral Balloon Commissurotomy (PMBC) Compared to Surgical Closed Commissurotomy (CC) or Open Commissurotomy
(OC) (Section 6.2.3) ...................................................................................................................................................................................................................................................................... 27
Data Supplement 14. Echocardiographic Prediction of Outcome of Percutaneous Balloon Mitral Commissurotomy (Section 6.2.3) ....................................................................................... 28
Data Supplement 15. Randomized Trials of Percutaneous Mitral Balloon Commissurotomy Versus Surgery for Mitral Stenosis (Section 6.2.3) .................................................................... 29
Data Supplement 16. Preoperative Predictors of Surgical Outcome in Mitral Regurgitation (Section 7.3.3) .............................................................................................................................. 31
Data Supplement 17. Primary Mitral Regurgitation—Evidence for Intervention (Section 7.3.3) ................................................................................................................................................ 32
Data Supplement 18. Secondary Mitral Regurgitation—Evidence for Intervention (7.4.3) ......................................................................................................................................................... 34
Data Supplement 19. Functional Tricuspid Regurgitation: Outcomes Following Tricuspid Valve Surgery (Sections 8.2.3 and 8.4.3) ...................................................................................... 35
Data Supplement 20. Clinical Outcomes With Bioprosthetic and Mechanical Valves (Section 11.1.2) ...................................................................................................................................... 37
Data Supplement 21. Bridging Anticoagulation Therapy for Mechanical Heart Valves (Section 11.3.2) ................................................................................................................................... 40
Data Supplement 22. Fibrinolytic Therapy for Prosthetic Valve Thrombosis (Section 11.6.2) ................................................................................................................................................... 42
Data Supplement 23. Paravalvular Regurgitation (Section 11.8.3) .............................................................................................................................................................................................. 44
Data Supplement 24. Surgical Outcome in Infective Endocarditis (Section 12) .......................................................................................................................................................................... 46
Data Supplement 25.Outcomes in Pregnant Women With a Mechanical Prosthetic Valve Treated with Warfarin or Unfractionated Heparin (UFH) (Section 13.3.2) ................................... 51
Data Supplement 26. Outcomes in Pregnant Women With a Mechanical Prosthetic Valve Treated With Low Molecular Weight Heparin (LMWH) (Section 13.3.2) ................................... 54
Data Supplement 27. Outcomes With the Maze Procedure for Atrial Fibrillation in Patients With Valvular Heart Disease (Section 14.2.2) ............................................................................ 56
Data Supplement 28. Noncardiac Surgery in Patients With Valvular Heart Disease (Section 15.3) ........................................................................................................................................... 59
References ..................................................................................................................................................................................................................................................................................... 61

2 © American College of Cardiology Foundation and American Heart Association, Inc.
Data Supplement 1. Outcomes in Adults With Low-Flow/Low-Gradient Aortic Stenosis With Reduced Left Ventricular Ejection Fraction (stage S1) (Sections 3.2.1.1 and 3.2.3)
Study Aim of Study Study Type Study Size Definition of LFLG Severe AS With rLVEF
Exclusion Criteria
Stress Findings/Clinical Outcomes
Comments
DeFillippi, 1995 (1) 7810504
To determine if DSE can distinguish severe fixed AS from flow-dependent AS
Prospective 24 AVAi ≤0.5 cm2/m2
Pmean ≤30 mm Hg LVEF ≤45% All symptomatic
Too ill AF
IA. (n=7, 39%) No change in AVA with ≥20% improvement in LVEF (contractile reserve).
IB. (n=5, 28%) AVA ≥0.3 cm2 and contractile reserve. II. (n=6, 33%) No contractile reserve.
IA. 4 underwent AVR with improved symptoms (1 perioperative death). IB. 4 medical Rx and alive at 1 y. 1 CAD death. II. 3 deaths and 3 persistent CHF.
Connolly, 1997 (2) 9170402
Determine outcome after AVR for severe AS with LG and low LVEF
Retrospective surgical database
154 LVEF 35% Undergoing AVR
Other valve disease
Baseline mean AVA 0.6±0.2 cm2, Mean cardiac output 4.1±1.5 L/min, Perioperative (30 d) mortality 9%, Postoperative LVEF improved in 76% of pts.
Study group had low LVEF, but not all had LG or LF.
Pereira, 2002 (3) 11955855
Evaluate outcome with AVR vs. medical Rx in LFLG severe AS
Retrospective, propensity score matched
68 AVA ≤0.75 cm2
Pmean ≤30 mm Hg LVEF ≤35%
Other valve disease.
In propensity matched pts, survival at 4 y was 78% with AVR vs.15% with medical Rx (p<0.0001).
Multivariate predictors of survival were AVR, age, and renal function.
Nishimura, 2002 (4) 12176952
Diagnostic value of invasive hemodynamics with dobutamine stress
Prospective, comparison with surgical findings
32 AVA <1.0 cm2
Pmean <40 mm Hg LVEF <40%
N/A With dobutamine, final AVA 1.2 cm2 with a Pmean >30 mm Hg in 21 pts; severe AS confirmed at surgery. In 15 pts with CR, mortality was 7% (1 death) with medical therapy.
CR defined as SV 20% with dobutamine.
Monin, 2003 (5) 12835219
Assess prognostic value of DSE in LFLG AS
Prospective, multicenter
136 AVA ≤1.0 cm2
Cardiac index 3 L/min/m2
Pmean ≤40 mm Hg
Other valve disease, severe comorbidities
Operative mortality 5% with CR vs. 32% without CR (p=0.0002). Predictors of long-term survival were AVR and CR.
CR defined as SV 20% on DSE.
Quere, 2006 (6) 16585393
Determine relationship between CR on DSE and postoperative LVEF
Prospective, multicenter
66 AVA ≤1.0 cm2
Pmean ≤40 mm Hg LVEF ≤40% All symptomatic
Excluded operative deaths
I. CR in 70%; post-AVR LVEF improved ≥10 LVEF units in 83%. II. No contractile reserve in 30%; post-AVR LVEF improved ≥10 LVEF units in 65%.
Symptoms improved by ≥2 classes after AVR in 58%. Mean LVEF increased from 29±6% to 47±11% after AVR.
Blais, 2006 (7) 16461844
Improve differentiation of true from pseudo severe AS on DSE
In vitro model and prospective pt group
23 AVAi ≤0.6 cm2/m2 LVEF ≤40%
Pmean ≤40 mm Hg All symptomatic undergoing AVR
Other valve disease AF or paced rhythm
Projected effective orifice area at a normal transvalvular flow rate was accurate for identifying true vs. pseudo severe AS in comparison to surgical findings.
No outcome data.
Bergler-Klein, 2007 (8) 15117847
Relationship between BNP and outcome in LFLG AS
Prospective, multicenter
69 AVAi <0.6 cm2/m2
Pmean ≤40 mm Hg LVEF ≤40%
Other valve disease, AF, or paced rhythm
BNP was higher with true-severe AS compared to pseudo-severe AS (p=0.12).
1-y survival 47±9% with BNP 550 pg/mL vs. 97±3% with BNP <550 pg/mL (p=0.0001).
Classified as severe AS if DSE
showed AVA 1.0 cm2 at projected flow rate of 250 mL/s; pseudo-severe if AVA >1.0 cm2 projected at 250 mL/s.

3 © American College of Cardiology Foundation and American Heart Association, Inc.
Study Aim of Study Study Type Study Size Definition of LFLG Severe AS With rLVEF
Exclusion Criteria
Stress Findings/Clinical Outcomes
Comments
Pai, 2008 (9) 19021976
Surgical outcome with low-gradient AS
Retrospective surgical database
362 AVA ≤0.8 cm2 AND
Pmean ≤30 mm Hg OR LVEF ≤35%
N/A In 194 pts with LVEF ≤35%, 5-y survival was 50% with AVR vs. 23% without AVR (p<0.0001).
In 168 pts with Pmean ≤30 mm Hg, 5-y survival was 80% with AVR vs. 22% without AVR (p<0.0001).
Univariate predictors of mortality were older age, lower LVEF, renal insufficiency, and lack of AVR.
Levy, 2008 (10) 18402902
Evaluate perioperative mortality with LFLG severe AS
Surgical series AVR for LGLF AS
217 AVA <1 cm2 LVEF ≤35%
Pmean ≤30 mm Hg
Other valve disease
Perioperative mortality 16% overall (decreased from 20% in 1990s to 10% after 2000). 5-y survival was 49±4%.
Predictors of perioperative mortality were very LG, multivessel CAD, and absence of CR on DSE.
Clavel, 2010 (11) 20975002
Compare outcomes after TAVR vs. SAVR with low LVEF severe AS
Prospective comparison of echo data
200 SAVR; 83 TAVR
AVA ≤1 cm2 LVEF ≤50%
No LVEF by echo
LVEF improved more with TAVR compared to SAVR (ΔLVEF, 14±15% vs. 7±11%; p=0.005). At 1 y, LVEF was normal in 58% of TAVR compared to 20% SAVR pts.
Treatment not randomized.
Tribouilloy, 2009 (12) 19442886
Effect of AVR on outcomes in LFLG severe AS without contractile reserve
Prospective, multicenter
81 AVA <1 cm2 LVEF ≤40%
Pmean ≤40 mm Hg No contractile reserve
N/A Survival at 5 y was higher with AVR compared to medical therapy (54±7% vs. 13±7%; p=0.001). Operative mortality was 22% (n=12).
Contractile reserve defined as SV
20% on DSE. Multivariate predictors of mortality were associated bypass surgery
(p=0.007) and Pmean ≤20 mm Hg (p=0.035).
Gotzmann, 2012 (13) 21805576
Outcomes after TAVR with low LVEF and LG AS
Prospective CoreValve TAVR
202 LVEF groups >50% or ≤50%
Pmean groups >40 or ≤40 mm Hg
N/A
1 y mortality LVEF >50% LVEF ≤50%
Pmean >40 14% (n=86) 27% (n=45)
Pmean ≤40 22% (n=27) 39% (n=44)
1-y mortality after TAVR was higher with LG, low LVEF severe AS. Severe AS defined as AVA ≤1.0 cm2. All pts were high surgical risk.
Fougeres, 2012 (14) 22733832
Outcome of pseudo-severe AS without AVR
Multicenter registry of severe symptomatic LFLG AS
107 AVA ≤1 cm2 or AVAi ≤0.6 cm2/m2 LVEF ≤40%
Pmean ≤40 mm Hg Cardiac index ≤3.0 L/min/m2
Severe comorbidities, Other valve disease, AF
IA: 43 with true-severe AS IB: 29 with pseudo-severe AS defined as CR with final
AVA ≥1.2 cm2 and Pmean ≤40 mm Hg
II: 23 with no CR (SV <20%)
74 deaths (69%) at a median interval of 10 m. Outcomes with pseudo-severe AS (Group IB) were similar to pts with HF without AS. Multivariate predictors of mortality in Group 1B were CAD (HR: 1.88; 95% CI: 1.35–2.63) and
Pmean <20 mm Hg (HR: 1.55; 95% CI: 1.07–02.23).
Herrmann 2013 (15) 23661722
Surgical vs. transcatheter AVR for in operable pts with LFLG severe AS with
Subgroup analysis of RCT
42 randomized to TAVR vs.
AVA ≤0.8 cm2 or AVAi <0.5 cm2/m2 LVEF <50%
N/A Mortality at 2 y was 80.0% with medical therapy vs. 47.1% with TAVR (HR: 0.43; 95% CI: 0.19–0.98; p=0.040)
No difference in 2-y outcomes in the 105 pts with LFLG severe AS with low LVEF randomized to SAVR vs.

4 © American College of Cardiology Foundation and American Heart Association, Inc.
Study Aim of Study Study Type Study Size Definition of LFLG Severe AS With rLVEF
Exclusion Criteria
Stress Findings/Clinical Outcomes
Comments
reduced LVEF medical Rx Pmean ≤40 mm Hg SVi < 35 mL/m2
TAVR (42.9% vs. 37.1%; HR: 1.25, 95% CI: 0.66–2.36; p=0.50).
AF indicates atrial fibrillation; AS, aortic stenosis; AVA, aortic valve area; AVAi, aortic valve area indexed to body surface area; AVR, aortic valve replacement; BNP, brain natriuretic peptide; CAD, coronary artery disease; CHF, congestive
heart failure; CR, contractile reserve; DSE, dobutamine stress echocardiography; HF, heart failure; LFLG, low-flow/low-gradient; LF, low flow; LG, low gradient; N/A, nonapplicable; Pmean, mean transaortic systolic pressure gradient; pts, adult
patients; Rx, prescription; rLVEF, left ventricular reduced ejection fraction; Pmean , mean transaortic pressure gradient; SAVR, surgical aortic valve replacement; SV, stroke volume; SVi, stroke volume indexed to body surface area; and TAVR, transcatheter aortic valve replacement.

5 © American College of Cardiology Foundation and American Heart Association, Inc.
Data Supplement 2. Hemodynamic Progression of Aortic Stenosis in Adult Patients (stages B and C) (Section 3.2.1.3) First Author, Year N Type of Study Entry Criteria Mean Follow-up (y) Increase in Pmean
(mmHg/y) (mean± SD)
Increase in Vmax (m/s/y) (mean± SD)
Decrease in AVA (cm2/y) (mean± SD)
Otto, 1989 (16) 2918158
42 Prospective Asymptomatic; Vmax >2.5 m/s 1.7 8 (-7–23) 0.36±0.31 0.1
Roger, 1990 (17) 2301222
112 Retrospective AS on echo 2.1 N/A 0.23±0.37 N/A
Faggiano, 1992 (18) 1626512
45 Prospective AS on echo 1.5 N/A 0.4±0.3 0.1±0.13
Peter, 1993 (19) 8404089
49 Retrospective AS on echo 2.7 7.2 N/A N/A
Brener, 1995 (20) 7829781
394 Retrospective AS on echo 6.3 N/A N/A 0.14
Otto, 1997 (21) 9142003
123 Prospective Asymptomatic, Vmax >2.5 m/s 2.5 7±7 0.32±0.34 0.12±0.19
Bahler, 1999 (22) 10569661
91 Retrospective AS on echo 1.8 2.8 0.2 0.04
Palta, 2000 (23) 10831524
170 Retrospective AS on echo 1.9 N/A N/A 0.10±0.27
Rosenhek, 2000 (24) 10965007
128 Prospective Vmax >4.0m/s 1.8 Slow 0.14±0.18 N/A
Rapid 0.45±0.38 N/A
Rosenhek, 2004 (25) 14972419
176 Retrospective Vmax 2.5–3.9 m/s 3.8 N/A 0.24±0.30 N/A
Rossebo, 2008 (26) 18765433
1,875 Prospective Vmax 2.5–4 m/s 4.3 Statin Rx 0.15±0.01 0.03±0.1
Placebo 0.16±0.01 0.03±0.1
AS indicates aortic stenosis; AVA, aortic valve area; echo, echocardiography; N/A, not applicable; Pmean , mean transaortic pressure gradient; Vmax, maximum velocity.

6 © American College of Cardiology Foundation and American Heart Association, Inc.
Data Supplement 3. Exercise Stress Testing in Asymptomatic Adults With Aortic Stenosis (stages B and C) (Sections 3.2.1.5 and 3.2.3) Study Aim of Study Study Type Study Size Inclusion Criteria Exclusion
Criteria Exercise Findings/Clinical Outcomes
Comments
Nylander, 1986 (27) 3707789
Describe hemodynamics, clinical features, noninvasive findings in elderly pts with suspected severe symptomatic AS
Observational, exercise test
76 (37 in NHYA class III/IV)
Suspected symptomatic severe AS, Mean age 65 y
N/A Inadequate BP increase with exercise in 82%. ETT was at variance with reported NYHA class in 25%. Exercise tolerance was <80% expected for age.
ETT stopped for low BP in 36% and chest pain in 29%. No clinical outcome data. Most pts were symptomatic at baseline.
Clyne, 1991 (28) 1746429
Evaluate exercise response ETT, Thallium perfusion imaging, MUGA
14 Asymptomatic AS
N/A AS pts had decreased exercise tolerance and VO2max vs. controls
ST depression >1 mm flat or downsloping in 71%. Reversible perfusion defect in 21%.
BP >10 mm Hg in 7%. No clinical outcome data.
Otto, 1992 (29) 1401617
Measure physiologic response to exercise
Prospective, Bruce protocol ETT, Doppler echo
28 Asymptomatic AS
N/A Exercise duration 6.7±4.3 min
Vmax 3.99±0.93 to 4.61±1.12 m/s (p<0.0001)
Pmean 39±20 to 52±26 mm Hg (p<0.0001)
Stroke volume 98±29 to 89±32 mL (p=0.01)
Qmax 422±117 to 523±209 mL/s (p<0.0001)
SEP 0.33±0.04 to 0.24±0.002 (p<0.0001)
Cardiac output 6.5±1.7 to 10.2 4.4 L/min (p<0.0001) AVA 1.17±0.45 to 1.28±0.65 (p=NS)
BP >10 mm Hg in 11%. ST depression >1 mm flat or downsloping in 75%. Occasional PVCS in 39%. Asymptomatic 3-beat VT in 4% (1 pt.). No clinical outcome data.
Otto, 1997 (21) 9142003
Identify predictors of clinical outcome
Prospective, clinical, echo, and ETT data
104 pts 274 exercise tests
Asymptomatic AS (Vmax >2.5 m/s)
Unable to walk on treadmill
Univariate predictors of clinical outcome (AVR or death)
included a smaller exercise AVA, BP, and cardiac output
and stroke volume with exercise. Multivariate predictors of outcome were resting Vmax, the rate of change in Vmax (m/s/y), and functional status score; exercise variables did provide additive prognostic information.
No complication in 85%.
BP >10 mm Hg in 9%. ST depression >1 mm flat or downsloping in 69%. ST depression >2 mm flat or downsloping persisting >5 m in recovery in 2%.
Amato, 2001(30) 11559673
To determine prognostic value of exercise testing
Prospective 66 Mean age 49.5 y, 67% men
Severe AS (AVA ≤1.0 cm2)
CAD, arrhythmias, abnormal baseline ECG, comorbid disease
Main outcome measure of sudden death (6%) or symptom onset (52%). Positive ETT in 67%: symptoms in 35%, BP rise <20 mm Hg in 20%, ST changes alone in 12%, ventricular arrhythmia in 7%. Event free survival at 2 y was 19% with a positive ETT and 85% with a negative ETT.
Dizziness during ETT in 12%, no other complications of ETT. The 66 pts were derived from a cohort of 853 consecutive pts. These data may not apply to all AS pts.
Alborino, 2002 (31)
Risk stratification of asymptomatic pts with
Prospective 30 Mean age
Asymptomatic AS N/A Abnormal ETT in 18 (60%) with: Fall in BP (3), angina (1), ECG ST changes (3), dyspnea
At 1 y: All 12 pts with a normal ETT

7 © American College of Cardiology Foundation and American Heart Association, Inc.
Study Aim of Study Study Type Study Size Inclusion Criteria Exclusion Criteria
Exercise Findings/Clinical Outcomes
Comments
12000161 moderate-severe AS 62±14 y (11) remained symptom free. 10/18 with abnormal ETT required AVR
Das, 2005 (32) 15820999
Accuracy of stress testing to predict symptom onset at 12 mo
Prospective 125 Asymptomatic AS AVA <1.4 (mean 0.9±0.2) cm2/m2 Normal LVEF
Other valve disease. Regional wall motion.
At 1-y follow-up, 36 (29%) developed symptoms. ETT provoked symptoms in 26 (72%) of these pts. Abnormal BP response or ST changes did not improve accuracy of ETT for predicting symptom onset.
Symptoms provoked by ETT had a PPV of 57% and NPV of 87% for onset of symptoms within 1 y. Accuracy was higher in pts under 70 y of age.
Lancellotti, 2005 (33) 16159850
Role of quantitative exercise Doppler
Prospective 69 Asymptomatic AS AVA <1.0 cm2
Other valve disease, AF, AVR within 2 mo
Abnormal exercise response in 26 (38%) including symptoms, ST depression, failure of BP rise.
Cardiac events (n=18) at 15±7 mo follow-up were predicted by an
exercise Pmean ≥18 mm Hg, an abnormal exercise test or an AVA <0.75 cm2.
Marechaux, 2010 (34) 20308041
Assess if exercise hemodynamics provide incremental prognostic value to standard ETT data
Prospective, multicenter
186 Moderate-severe AS Normal LV (LVEF ≥50%)
Symptoms Other valve disease CAD AF/flutter
In the 73% with a normal ETT, 67 had an event (AVR or CV death) at 20±14 mo follow-up. The 27% with an abnormal ETT (symptoms limiting exercise, fall in BP below baseline or complex ventricular arrhythmias) were excluded from analysis.
Adverse events associated with age 65 y, diabetes mellitus, LVH,
resting Pmean 35 mm Hg, exercise
Pmean >20 mm Hg.
Rajani, 2010 (35) 11479246
Test if exercise symptoms are due to changes in LV function
Prospective 38 Asymptomatic AVA <1.5 cm2
N/A ETT revealed symptom in 10 (26%) which was associated with a lower cardiac index, stroke index, and VO2max
compared to those without symptoms.
The only independent predictor of peak cardiac index was the log BNP level (p<0.001; r=0.71)
AF indicates atrial fibrillation, AS, aortic stenosis; AVA, aortic valve area; AVR, aortic valve replacement; BNP, brain natriuretic peptide; BP, blood pressure; CAD, coronary artery disease; CV, cardiovascular, echo; echocardiography; ECG, electrocardiogram; ETT, exercise treadmill test; LV, left ventricular, LVEF, left ventricular ejection fraction; LVH; left ventricular hypertrophy; MUGA; multi gated acquisition scan; N/A, nonapplicable; NS, nonsignificant; NPV, negative predictive
value; NYHA, New York Heart Association; Pmean, mean transaortic systolic pressure gradient ; PPV, positive predictive value; pt(s), patients; PVCs, premature ventricular contractions; Qmax, maximum flow rate; SEP, systolic ejection period; VO2max, maximal oxygen consumption.

8 © American College of Cardiology Foundation and American Heart Association, Inc.
Data Supplement 4. Clinical Trials of Lipid Lowering Therapy in Adults With Asymptomatic Mild to Moderate Aortic Stenosis (stage B (Section 3.2.2) Study Name, First Author,
Year
Type of Study, Mean Follow-
Up (y)
N Entry Criteria Exclusion Criteria Treatment Group
Serum LDL on Rx (% change from baseline)
Increase in Vmax (m/s/y)
or Pmean
(mm Hg/y)
Decrease in AVA (cm2/y)
Other Endpoints Clinical Endpoints
Study Limitations and Adverse Events
SALTIRE Cowell, 2005 (36) 15944423
Randomized, double-blind, Placebo controlled 2.1 y
134 Vmax >2.5 m/s Aortic valve Ca++ Age >8 y Asymptomatic
Severe MS, AR, or MR LVEF <35% Statin Rx or indication Cholesterol <150 mg/dL Pacer or ICD Child bearing potential Liver disease Alcohol or drug abuse history
Atorvastatin 80 mg/d (n=77)
63±23 mg/dL
(53%)
Vmax 0.2±0.21 0.08±0.11 CT valve Ca++
22.3±21.0 %/y
Primary endpoints were hemodynamics and valve Ca++
Study drug discontinued in 5% of placebo and 9% of treatment groups. Study not powered for clinical outcomes.
Placebo (n=78)
130±30 mg/dL (0%)
0.2±0.21 (p=NS)
0.08±0.11 (p=NS)
CT valve Ca++
21.7±19.8 %/y
RAAVE Moura, 2007 (37) 17276178
Open-label, prospective. 1.4 y
121 AVA 1.0–1.5 cm2
Asymptomatic CAD, rheumatic mitral valve disease, BAV, liver disease, elevated creatinine, comorbidities
Rosuvastatin 20 mg/d (n=61)
93±21 mg/dL
(42%)
Vmax 0.04±0.38
0.05±0.12 Inflammatory markers showed
CRP in statin
group; IL-6 and
sCD4OL in both groups
Endpoints were cholesterol levels and AS severity
Pts with LDL >130 mg/dL at baseline were treated, those with LDL <130 received placebo
No statin (n=60)
118±29 mg/dL (0%)
0.24±0.30 (p=0.007)
0.1±0.09 (p=0.041)
ASTRONOMER Chan, 2010 (38) 20048204
Randomized, double-blind, Placebo controlled 3.5 y
269 Vmax 2.5–4.0 m/s Age 18–82 y Asymptomatic Trileaflet or bicuspid (49%) valve
Clinical indication for statin including CAD, CVD, PVD
Rosuvastatin 40 mg/d (n=134)
1.45 mmol/L
(54%) Pmean 3.8±4.4
0.08±0.21 7 cardiac deaths 55 AVR
No difference in survival or AVR between groups.
Primary endpoint was AS progression. Composite clinical outcome was secondary outcome.
Placebo (n=135)
1.61 mmol/L
(1.8%)
3.9 ±4.9 (p=NS)
0.07±0.15 (p=NS)
SEAS Rossebø, 2008 (26) 18765433
Randomized, double-blind, Placebo controlled 5.4 y
1,873 Vmax 2.5–4.0 m/s Age 45–85 y Asymptomatic
CAD, PVD, CVD, DM Clinical indication for statin
Simvastatin 40 mg plus ezetimibe 10 mg/d (n=944)
53±23 mg/dl
(61%)
Vmax
0.15±0.01 0.03±0.01 333 composite
outcome of CV death, AVR, CHF, and CAD events
No difference for aortic valve related events HR: 1.00; 95% CI: 0.84–1.18
Noncardiac deaths occurred in 5.9% of treatment group and 4.75 of placebo group (p=0.26) Placebo
(n=929) 139±35 mg/dL (0%)
0.16±0.01 (p=NS)
0.03±0.01 (p=NS)
335 composite outcome (p=NS)
AR indicates aortic regurgitation; AS, aortic stenosis; AVA, aortic valve area; AVR, aortic valve replacement; BAV, bicuspid aortic valve; CA++, calcium; CAD, coronary artery disease; CHF, congestive heart failure; CI, 95% confidence interval; CRP,C-reactive protein; CVD, cardiovascular disease; DM, diabetes mellitus; HR, hazard ratio; ICD, implantable cardioverter defibrillator; IL-6; interleukin-6; LDL, low density lipoprotein; LVEF, left ventricular ejection fraction; MR, mitral
regurgitation; MS, mitral stenosis; NS, non-significant; Pmean, mean transaortic systolic pressure gradient; PVD, peripheral vascular disease; pt(s), patient(s); Rx, prescription; sCD4OL soluble CD40 ligand; Vmax, maximum transvalvular aortic velocity.

9 © American College of Cardiology Foundation and American Heart Association, Inc.
Data Supplement 5. Clinical Outcomes in Asymptomatic Adults With Aortic Stenosis (stages B and C) of Known Hemodynamic Severity (Section 3.2.3) Author, Year Study
Size (N) Patient Population Inclusion Criteria
Exclusion Criteria Pt. Age (y)
% Male
Follow-Up (mo)
AS Severity at Entry
Event-Free Survival Cardiac Events Multivariate Predictors of Clinical Outcome
Kelly, 1988 (39) 3337000
51 Vmax ≥3.5 m/s Asymptomatic
Other valve disease 63±19 75% 17±0 P 68±19 mm Hg 60% at 2 y 21 AS symptom onset 8 deaths (2 cardiac)
N/A
Pellikka, 1990 (40) 2312954
113 Vmax ≥4.0 m/s
Age40 y Asymptomatic
Other valve disease CAD Prior valve procedure Early aortic intervention
70 (40–94)
67% 20 Vmax 4.3 (4–6) m/s 62% at 2 y 37 AS symptoms (20 with AVR) 14 deaths (6 cardiac)
Vmax 4.5 m/s; RR: 4.9 (1.64–14.6) LVEF <50%; RR: 2.93 (0.84–10.2)
Kennedy, 1991 (41) 1991886
66 AVA 0.7–1.2 cm2 at cath
Other valve disease Previous valve surgery
67±10 77% 35 AVA 0.92±0.13cm2 59% at 4 y 21 AVR (13 for symptoms) 14 deaths due to AS
LVEF <50%; RR: 1.94 (0.86–4.41). LV-end diastolic pressure >18 mm Hg RR: 2.71 (1.23–5.97). AVA index <0.5 cm2 RR: 1.93 (0.89–4.23).
Otto, 1997 (21) 9142003
123 Vmax >2.6 m/s Asymptomatic
Severe comorbid disease
63±16 70% 30 Vmax <3 m/s 84% at 2 y 48 AVR for symptoms 8 deaths
Vmax Functional status score Rate of change in Vmax
Vmax 3–4 m/s 66% at 2 y
Vmax >4 m/s 21% at 2 y
Rosenhek, 2000 (24) 10965007
128 Vmax ≥4.0 m/s Asymptomatic
Other valve disease 60±18 54% 22±18 Vmax 5.0±0.7 m/s 67% at 1 y 59 AVR for symptoms 8 deaths
Extent of valve calcification RR: 4.6 (1.6–14.0). 56% at 2 y
33% at 4 y
Rosenhek, 2004 (25) 14972419
176 Vmax 2.5–3.9 m/s LVEF >50% No AS symptoms
Other valve disease 58±19 59% 48±19 Vmax 3.1±0.4 m/s 95% at 1 y 33 AVR for symptoms 34 deaths
Severe valve calcification RR: 2.0 (1.3–3.3).
Vmax 3 m/s RR: 1.6 (1.04–2.8). CAD RR: 1.7 (1.2–2.7).
75% at 2 y
60% at 5 y
Pellikka, 2005 (42) 15956131
622 Vmax ≥4.0 m/s No AS symptoms
Other valve disease CAD
72±11 62% 65±48 Vmax 4.4 ±0.4 m/s 82% at 1 y 297 AS symptoms (AVR in 207 of these) 103 deaths without AVR or AS symptoms
AVA HR: 0.33 for a 1 cm2 increase (95%CI: 0.15–0.71). LVH by ECG HR: 1.39 (95% CI: 1.02–1.89).
67% at 2 y
33% at 5 y
Rossebo, 2008 (26) 18765433
1,873 Vmax 2.5 m/s to 4.0 m/s
CAD, CHF, diabetes mellitus, CVA, PVD, and other valve disease
68±9 59% 52 (median)
Vmax 3.1±0.55 65% at 5 y 668 (36%) Major CV events (death, AVR, CHF, coronary events, and ischemic stroke)
No effect of statin therapy on major CV events.
Lancellotti, 2010 (43) 20483891
163 AVAi ≤0.6 cm2/m2
No AS symptoms LVEF ≥55%
Nonsinus rhythm Other valve disease
70±10 65% 20±19 ≤0.6 cm2/m2 50% at 2 y 11 symptoms, but no AVR 57 AVR 6 deaths
Vmax ≥4.4 m/s, LV longitudinal deformation ≤15.9%, valvulo-arterial impedance ≥4.9 mm Hg/m2, LA area
44% at 4 y

10 © American College of Cardiology Foundation and American Heart Association, Inc.
Author, Year Study Size (N)
Patient Population Inclusion Criteria
Exclusion Criteria Pt. Age (y)
% Male
Follow-Up (mo)
AS Severity at Entry
Event-Free Survival Cardiac Events Multivariate Predictors of Clinical Outcome
≥12.2 cm2/m2
Kang, 2010 (44) 20308614
95 AVA 0.75 cm2 plus Vmax ≥4.5 m/s or
Pmean ≥50 mm Hg No AS symptoms
LVEF <50% Other valve disease Age >85 y Malignancy Known CAD
63±12 46% 50 Vmax 4.9±0.4 71±5% at 2 y 18 cardiac deaths 10 noncardiac deaths 46 AVR for symptoms
Vmax ≥5 m/s age, male sex, EuroScore, degree of valve calcification. 47±5% at 4 y
28±6% at 6 y
Stewart, 2010 (45) 20513730
183 Vmax >3 m/s LVEF >50% No AS symptoms
Other valve disease, ACS in previous 6 mo, LVOT obstruction, Respiratory disease, Renal dysfunction
70 65% 31 (median)
AVA 0.81 (IQR: 0.62–1.01) cm2
Vmax 3.8 (IQR: 3.3–4.4) m/s
Probability of symptom free survival at 3 y (95% CI) Vmax <3.5 m/s 0.72 (0.61–0.84). Vmax 3.5–4.0 m/s 0.46 (0.30 0.62). Vmax >4.0 m/s 0.32 (0.20–0.44).
103 AS symptoms 3 sudden death
Vmax HR: 1.43 for each 0.5 m/s increase (95% CI: 1.25–1.64). AVA HR: 1.23 for each -0.1 cm2 (95% CI: 1.12–1.35).
Rosenhek, 2010 (46) 20026771
116 Vmax ≥5.0 m/s No AS symptoms
Other valve disease 67±15 49% 41 (median)
Vmax 5.0–5.5 m/s 43% at 2 y 90 AVR 6 cardiac deaths
Vmax, but not AVA predicted outcome
Vmax ≥5.5 m/s 25% at 2 y
Jander, 2011 (47)
21321152
435 Low gradient “severe” AS: AVA <1 cm2 with
Pmean ≤40 mm Hg
CAD, CHF, diabetes, CVA, PVD, and other valve disease (SEAS substudy)
70±9 45% 46±14 Vmax 3.3±0.5 m/s
Pmean 26±7 mm Hg AVA 0.82±0.13 cm2
No difference in event rates between groups
183 AVR 17 HF 34 CV death
Low gradient “severe” AS defined as an
AVA <1 cm2 with Pmean ≤40 mm Hg was NOT a predictor of clinical outcome
184 Moderate AS: AVA 1–1.5 cm2,
Pmean 25–40 mmHg
67±9 73% Vmax 3.6±0.3 m/s
Pmean 31±4 mm Hg AVA 1.19±0.13 cm2
82 AVR 4 HF 9 CV death
Saito, 2012 (48) 22497679
103 AVA <1.0 cm2
No AS symptoms Hx CAD Other valve disease HCM
72±11 45% 36±27 AVAi <0.6 cm2/m2 AVAi ≥0.6 cm2/m2
41% at 3 y 86% at 3 y
31 AVR 20 cardiac deaths
AVAi <0.6 cm2/m2 (HR: 2.6; 95% CI: 11.1–6.3). Vmax >4.0 m/s (HR: 2.6; 95% CI: 1.2–5.8). (AVA<0.75 cm2 did not predict outcome) (Mean BSA 1.50±0.15 m2).
ACS indicates acute coronary syndrome; AS, aortic stenosis; AVA, aortic valve area; AVAi, indexed AVA; AVR, aortic valve replacement; BSA; body surface area; CAD, coronary artery disease; CHF, congestive heart failure; CV, cardiovascular; CVA, cerebral vascular accident; HCM, hypertrophic cardiomyopathy; HF, heart failure; Hx, history; HR, hazard ratio; IQR, interquartile range; LA, left atrium; LV, left ventricular, LVEF, left ventricular ejection fraction; LVOT, left
ventricular outflow tract; N/A, not available; Pmean, mean transaortic systolic pressure gradient; pt(s), patient(s); PVD, peripheral vascular disease; RR, relative risk; SEAS, Simvastatin Ezetimibe in Aortic Stenosis study; Vmax, maximum velocity.

11 © American College of Cardiology Foundation and American Heart Association, Inc.
Data Supplement 6. Incidence of Sudden Death in Asymptomatic Adults With Aortic Stenosis (stages B and C) (Section 3.2.3) First Author N Follow-Up
(mo)* Vmax at Entry
(m/s) AVA at Entry
(cm2) Sudden Deaths
(n) Sudden Deaths
(% per y)
Kelly, 1988 (39) 3337000
51 18 ≥3.5 N/A 0 0
Faggiano, 1992 (18) 1626512
37 24 N/A 0.85±015 0 0
Otto, 1997 (21) 9142003
114 30 3.6±0.6 N/A 0 0
Rosenhek, 2000 (24) 10965007
128 22 ≥4.0 N/A 1 0.4
Amato, 2001(30) 11559673
66 15 N/A ≤1.0 4 4.8
Das, 2005 (32) 15820999
125 12 N/A ≤1.4 0 0
Pellikka, 2005 (42) 15956131
270 65 ≥4.0 N/A 11 0.75
Rossebø, 2008 (26) 18765433
1,873 52 2.5–4.0 N/A 40 0.5
Monin, 2009 (49) 19546391
211 22 ≥3.0 ≤1.5 2 0.5
Lancellotti, 2010 (43) 20483891
163 20 N/A ≤0.6 cm2/m2 3 1.1
Kang, 2010 (44) 20308614
95 59 ≥4.5 ≥0.75 9 1.9
Marechaux, 2010 (34) 20308041
135 20 N/A ≤1.5 1 0.4
Rosenhek, 2010 (46) 20026771
116 41 ≥5.0 N/A 1 0.3
Total 3,384 31* N/A N/A 72 0.8
*Mean follow-up duration. AVA indicates aortic valve area; N/A, not applicable; and Vmax, maximum aortic velocity From Rosenhek R et al., (50). (PERMISSION NEEDED)

12 © American College of Cardiology Foundation and American Heart Association, Inc.
Data Supplement 7. Clinical Outcomes in Symptomatic Adults With Aortic Stenosis of Known Hemodynamic Severity (Section 3.2.3) Author, Year Aim of Study Study Type Study
Size (N) Patient Population Primary Endpoint Predictors of Mortality or
AVR Comments
Frank, 1973 (51) 4685905
Outcomes with AS of known hemodynamic severity
Observational 15 Isolated AS. Not referred for AVR Symptomatic (10) or asymptomatic (5) No other valve disease
Mortality from symptom onset: 15% at 2 y 36% at 3 y 52% at 5 y 90% at 10 y
Overlap in hemodynamic parameters between 5 asymptomatic and 10 symptomatic pts
Indexed AVA ranged from 0.26–0.63 cm2/m2.
Transaortic gradient ranged from 30–90 mm Hg.
Chizner, 1980 (52) 7189084
Outcomes with AS of known hemodynamic severity
Observational 32 Symptomatic AS Not referred for AVR
Mortality from symptom onset: 25% at 1 y 57% by 3 y 64% by 5 y 80% by 8 y
Mortality was no different with “moderate” (AVA 0.71–1.1
cm2, peak P <70 mm Hg) compared to “severe” AS
(AVA 0.7 cm2, peak P >70 mm Hg).
Time from symptom onset to death: Angina 1.4 (0.25–3.3) y Syncope 0.8 (0.25–2.0) y CHF 2.0 (0.3–3.0) y
Lombard & Selzer, 1987 (53) 3800187
Describe clinical findings in pts with AS of known hemodynamic severity
Retrospective 397 Undergoing cardiac cath for AS Mean age 61 y AVA <1 cm2 in 87% No other valve disease
Early symptoms (angina and syncope) correlated with AS severity, but not LV function. Late symptoms (HF) correlated with LV dysfunction.
N/A No outcome data
Turina, 1987 (54) 3609042
Determine prognostic value of hemodynamic and clinical variables
Observational N/A Referred for cardiac cath. No AVR due to disease severity or pt refusal
Survival without AVR by AS severity; Severe AS (AVA <0.9 cm2): 60% at 1 y, 9% at 10 y Moderate AS (AVA 0.95–1.4 cm2): 97% at 1 y, 35% at 10 y Mild AS (AVA >1.5 cm2): 85% at 10 y
Survival without AVR by symptom status with severe AS: Symptomatic AS 27% at 2 y 12% at 5 y Asymptomatic AS: 100% at 2 y 75% at 5 y
AS was more severe in severely symptomatic vs. oligosymptomatic pts:
Pmean 69 vs. 57 mm Hg (p=NS), AVA 0.56 vs. 0.76 cm2 (<0.01), Cardiac index 2.6 vs. 3.3 L./min/m2 (p<0.01), LVEDP 17 mm Hg vs.12 mm Hg (p<0.05).
Horstkotte, 1988 (55) 3042404
Compare outcomes with symptomatic vs. asymptomatic severe AS
Retrospective 35 Severe symptomatic AS Refused AVR. AVA 0.4–0.8 cm2
Mean interval from symptom onset to death: 4.5 y for angina (n=18) 2.6 y for syncope (n=13) <1 y for HF (n=20)
Mortality reached 100% at: 10 y for angina 5 y for syncope 2.4 y for HF
There were 3 sudden deaths before symptom onset
Kelly, 1988 (39) 3337000
Compare outcomes with symptomatic vs. asymptomatic severe AS
Prospective 39 Referred for echo for systolic murmur with
Doppler P ≥50 mm Hg cardiac symptoms, but did not undergo AVR. No other valve disease.
Death in 15 (38%) with a mean follow-up of 12 mo. Compared to 8 (%) deaths in 51 initially asymptomatic pts (See Table 6).
N/A Study group represents 19% of all surgical candidates for AVR for severe symptomatic AS. Surgery refused by 26/39 pts; symptoms judged not severe in 13 by referring clinician.

13 © American College of Cardiology Foundation and American Heart Association, Inc.
Author, Year Aim of Study Study Type Study Size (N)
Patient Population Primary Endpoint Predictors of Mortality or AVR
Comments
Other valve disease. No difference in Doppler AS severity between these 39 symptomatic and 51 asymptomatic pts during the same time interval.
Otto, 1988 (56) 3143323
Identify echo criteria for AVR with symptomatic AS
Prospective, split sample decision analysis
103 Symptomatic pts undergoing cardiac cath for suspected AS Clinical outcome defined as AVR as determined by clinical cardiologist without knowledge of echo data or death
Decision model recommended AVR in 73 with: Vmax >4.0 m/s, or Vmax 3 m/s-4 m/s and AVA<1.0 cm2 or Vmax 3 m/s-4 m/s, AVA >1.0 and 2-3+AR
AVR in 68, 2 noncardiac death, 2 nonsurgical candidates, 1 refused
Overall diagnostic accuracy for clinical outcome 94%
AVR not recommended in 30 with: Vmax <3.0 m/s or Vmax 3-4 m/s with AVA ≥1.7 cm2 or Vmax 3-4 m/s, AVA 1.1-1.6 cm2 and 0-1+ AR
No AVR in 28. AVR for severe AR in 2 pts confirmed absence of severe AS by surgical inspection
Oh, 1988 (57) 3366997
Compare echo and cath data
Prospective 100 Symptomatic AS undergoing cardiac cath
Severe AS at cath defined as (Gorlin AVA
0.75 cm2)
No outcome data Vmax >4.5 m/s predicted severe AS at cath with 60% accuracy–specificity 93%, but sensitivity 44% Doppler velocity ratio <0.25 had sensitivity of 92% for severe AS
Galan, 1991 (58) 2018003
Identify echo predictors of AVR
Observational, retrospective
510 Consecutive AS pts undergoing Doppler echo
Comparison with diagnosis of critical AS at
cath, defined as Gorlin AVA 0.75 cm2
In 160 pts with Vmax >4.5 m/s
or Doppler AVA 0.75 cm2, 109 underwent AVR No long-term outcome data
Vmax >4.5 m/s or Doppler AVA 0.75 cm2 was 97% specific for critical AS at cath (n=105)
Vmax 4.5 m/s or Doppler AVA >0.75 cm2 was 95% specific for noncritical AS at cath (n=133)
Otto, 1994 (59) 8313553
Outcomes after aortic balloon dilation
Registry 674 Severe symptomatic AS undergoing aortic balloon dilation Vmax 4.4±0.8 (2.3–6.6) m/s AVA 0.6 ±0.2 ( 0.1–1.4) cm2
Overall survival was 55% at 1 y, 35% at 2 y, and 23% at 3 y, with 70% of deaths classified as cardiac
Multivariate predictors of outcome were functional status, LV systolic function, renal function, sex, cardiac output, and MR
All pts underwent aortic balloon dilation in this registry so outcomes may be worse with no intervention.
AS indicates aortic stenosis; AVA, aortic valve area; AVR, aortic valve replacement; cath, catheterization; CHF, congestive heart failure, echo, echocardiography; HF, heart failure; LV, left ventricular; LVEDP, left ventricular end diastolic
pressure; MR, mitral regurgitation; N/A, not applicable; NS, nonsignificant; Pmean, mean transaortic systolic pressure gradient; pt(s), patient(s); and Vmax, maximum velocity.

14 © American College of Cardiology Foundation and American Heart Association, Inc.
Data Supplement 8. Outcomes in Adults With Low-Flow/Low-Gradient Aortic Stenosis With Preserved Left Ventricular Ejection Fraction (stage S2) (Section 3.2.3) Study Aim of Study Study Type Study Size Definition of LFLG severe AS Exclusion
Criteria Clinical Outcomes Comments
Hachicha, 2007 (60) 17533183
Determine prevalence, mechanisms and clinical relevant of LFLG severe AS with pLVEF
Retrospective, consecutive pts with severe AS (AVAi ≤0.6 cm2
and LVEF ≥50%)
512 pts, mean age 70±14 y, 43% women
181 (35%) LFLG severe AS pLVEF: SVi ≤35 mL/m2 and AVAi ≤0.6 cm2 and LVEF≥50% 331 (65%) with normal flow (SVi >35 mL/m2) despite AVAi ≤0.6 cm2 and LVEF≥ 50%
LVEF <50% 76% survival at 3 y with LFLG severe AS 86% survival at 3 y with normal flow severe AS (p=0.006) Multivariate predictors of overall death were older age, valvulo-arterial impedance ≥5.5 mm Hg/mL/m2, and medical (vs. surgical) treatment
In LFLG severe AS group: Average BSA 1.8±0.2 m2
Average AVA 0.76±0.23 cm2
Average Vmax 3.5±0.9 m/s LFLG severe AS typically associated with small LV with restrictive physiology
Jander, 2011 (47) 21321152
Evaluate outcome of LG severe AS
Prospective (SEAS substudy)
435 with LG severe AS vs. 184 with moderate AS
AVA <1.0 cm2 and
Pmean ≤40 mm Hg (Moderate AS defined as AVA
1.0–1.5 cm2, Pmean 25–40 mm Hg)
See SEAS study in Table 4
Aortic valve events (CV death, AVR,HF due to AS) at 46 mo were no different in pts with LG severe AS vs. those with moderate AS (48.5% vs. 44.6%; p=0.37)
In 223 pts with LFLG severe AS pLVEF (SVi ≤35 mL/m2) aortic valve events were no different compared to pts with a normal SVi (46.2% vs. 50.9%; p=0.53).
Tarantini, 2011 (61) 21619977
Investigate outcome after AVR for LFLG severe AS with pLVEF
Retrospective surgical series
73 AVR 29 medical Rx
AVA ≤1.0 cm2 LVEF >50%
Pmean ≤30 mm Hg
Age <18 y Other valve disease Previous valve surgery
Overall mortality 37% at mean 42 mo follow-up. Cardiac death in 13 (18%) AVR and 15 (52%) medical Rx pts (p=0.001) AVR was a predictor of survival on multivariate analysis, even in the 78 pts with an AVA between 0.8 and 1.0 cm2.
Low SVi present in 20 (27%) AVR and 6 (21%) medical Rx pts with no difference in outcome for normal vs. low SVi Retrospective database of 2,055 pts with an AVA ≤1.0 cm2; LVEF <50% in 25% and LFLG severe AS pLVEF in 5% of pts
Clavel, 2012 (62) 22657269
Compare outcome in AS with normal LVEF with 1) LFLG severe AS, 2) high mean gradient (>40 mm Hg) severe AS, and 3) moderate AS (AVA >1.0 cm2)
Case match study 187 with LFLG severe AS matched to 187 moderate AS and 187 high-flow severe AS
Pmean <40 mm Hg SVi <35 mL/m2 and AVA ≤1.0 cm2
LVEF <50% Survival at 1 and 5 y: LFLG severe AS pLVEF 89±2% and 64±4% High-gradient severe AS 96±1% and 82±3% Moderate AS 96±1% and 81±3%
AVR associated with improved survival for high-gradient severe AS (HR: 0.18; p=0.001) and LFLG severe AS pLVEF (HR: 0.50; p=0.04), but not for moderate AS
Lancellotti, 2012 (63) 22240128
Evaluate clinical course in AS pts stratified by SVi
and Pmean
Prospective 150 consecutive pts with asymptomatic severe AS (AVA <1.0 cm2) referred for ETT
LF: SVi <35 mL/m2
LG: Pmean <40 mm Hg (all had AVA <1.0 cm2)
LVEF <55%, other valve disease, AS, pulmonary disease, inability to exercise
Event free survival at 2 y (p<0.0001):
Normal flow (SVi ≥35 mL/m2) Low-flow (SVi <35 mL/m2)
High-gradient
Pmean ≥40 mm Hg
44±6% (n=78) 30±12% (n=15)
Low-gradient
Pmean <40 mm Hg
83±6% (n=46) 27±13% (n=11)
Predefined endpoints were CV death in 6 and AVR in 70 pts

15 © American College of Cardiology Foundation and American Heart Association, Inc.
Study Aim of Study Study Type Study Size Definition of LFLG severe AS Exclusion Criteria
Clinical Outcomes Comments
Herrmann 2013 (15) 23661722
Evaluate outcomes with TAVR compared to medical therapy with LG severe AS
Subgroup analysis of RCT
52 inoperable symptomatic pts with LFLG severe AS with normal LVEF
Pmean <40 mm Hg SVi <35 mL/m2 and AVA <0.8 cm2 or AVAi <0.5 cm2/m2
LVEF <50%
In 52 inoperable pts with LFLG severe AS with preserved LVEF, 1-y mortality was 66% with TAVR compared to 35% with medical therapy (HR: 0.38; p=0.02). In 87 pts at high risk for surgery, there was no difference between TAVR and SAVR (39.0% vs. 38.3%; HR: 0.91; 95% CI: 0.57–1.45; p=0.69.
Le Ven 2013 (64) 23770162
Evaluate effect of LV EF and gradient on outcomes after TAVR
Retrospective analysis of registry data
639 severe AS undergoing TAVR
Low flow (SVi <35 mL/m2) with a normal EF (>50%) was present in 86 (13%) of pts
--- Low flow (but not low EF) was an independent predictor of 30-day mortality (odds ratio: 1.94, p=0.026), cumulative all-cause mortality (hazard ratio: 1.27 per 10 mL/m² SVi decrease, p=0.016), and cumulative cardiovascular mortality (hazard ratio: 1.29 per 10 mL/m² decrease, p=0.04).
Mehrotra 2013 (65) 23533186
Compare clinical characteristics and outcomes in AS subgroups
Retrospective echocardiographic database
LFLG severe AS in 38 pts, compared to 75 normal flow low gradient and 70 moderate AS pts.
AVA 1.0 cm2 with LVEF 55%, mead gradient <40 mm Hg and SVi <35 mL/m2.
Mitral valve disease, aortic regurgitation, poor quality study. Severe AS with mean gradient >40 mm Hg.
Survival at 3 years was significantly lower in LF LG compared with NF LG (p=0.006) and moderate AS (p=0.002), but not different between NF LG and moderate AS (p=0.49).
Ozkan 2013 (66) 23812184
Compare outcomes of LG severe AS with AVR or medical therapy
Prospective follow-up of symptomatic severe LG AS
260 pts with symptomatic severe AS
(AVAi 0.6 cm2/m2 ) and mean gradient <40 mm Hg
Normal flow present in 125; low flow (SVi ≤35 mL/m2) in 135.
Mitral disease, aortic regurgitation
At 28 ±24 mos follow-up, 105 pts died (40%): 32 (30%) in the AVR group and 73 (70%) in the medical treatment group. AVR (hazard ratio, 0.54; 95% confidence interval, 0.32–0.94; p<0.001) was independently associated with outcome and remained a strong predictor of survival after adjustment for propensity score. The protective effect of AVR was similar in 125 pts with normal flow (stroke volume index >35 mL/m2; p=0.22).
Eleid 2013 (67) 24048203
Evaluate impact of stroke volume with normal EF on outcomes with severe AS
Echocardiographic database.
1,704 consecutive pts with severe AS (AVA <1.0 cm2)
and LVEF50%
Low flow = SVi ≤35 mL/m2
Low gradient <40 mm Hg. LFLG present in 53 pts (3%) compared to normal flow LG (n=352, 21%) and to high gradient severe AS.
Prosthetic valve, congenital or other native valve disease
AVR was associated with a 69% mortality reduction (HR 0.31 (0.25, 0.39) p<0.0001) in LF/LG and NF/HG, with no survival benefit associated with AVR in NF/LG and LF/HG.
AS indicates aortic stenosis; AVAi, aortic valve area indexed to body surface area; AVR, aortic valve replacement; BSA, body surface area; CV, cardiovascular; ETT, exercise treadmill testing; HG, high gradient; HF, heart failure; LFLG,
low-flow low-gradient; LF, low-flow; LG, low-gradient; LV, left ventricular; NF, normal flow; pLVEF, preserved left ventricular ejection fraction; Pmean, mean transaortic systolic pressure gradient; RCT, randomized controlled clinical trial; Rx, prescription; SEAS, Simvastatin Ezetimibe in Aortic Stenosis study; SVi, stroke volume index; TAVR, transcatheter aortic valve replacement; and Vmax, maximum velocity.

16 © American College of Cardiology Foundation and American Heart Association, Inc.
Data Supplement 9. Choice of Intervention in Symptomatic Adults With Severe Aortic Stenosis (stage D): Surgical Versus Transcatheter Aortic Valve Replacement (Section 3.2.4) Study Aim of Study Study
Type Study Groups (N) Patient Population Major Endpoints Other Results
PARTNER COHORT A (high-surgical risk) (68) 21639811 (69) 22443479
To show that TAVR is not inferior to SAVR
RCT TAVR 348 vs. SAVR 351 TAVR was transfemoral in 244 and transapical in 104
Severe symptomatic calcific AS defined as AVA
<0.8 cm2 plus a mean P ≥40 mm Hg or Vmax ≥4.0 m/s with NYHA class II-IV symptoms. High surgical risk defined as ≥15% risk of death by 30 d after the procedure. An STS score ≥10% was used for guidance with an actual mean STS score of 11.8±3.3% Exclusions were bicuspid aortic valve, AMI, significant CAD, LVEF<20%, aortic annulus <18 or >25 mm, severe AR or MR, TIA within 6 mo, or severe renal insufficiency
All cause death (intention to treat analysis):
TAVR SAVR p-value
30 d 3.4% 6.5% 0.07
1 y* 24.2% 26.8% 0.44%
2 y 33.9% 35.0% 0.78
*(p=0.001 for noninferiority) Composite endpoint at 2 y –all-cause death or stroke: TAVR 37.1% vs. SAVR 36.4% (p=0.85) HR: 0.93; 95% CI: 0.73–1.18; p=0.55
Stroke or TIA at 2 y: TAVR 11.2 % vs. SAVR 6.5 % (p=0.05) Major vascular complications at 30 d: TAVR 11.0% vs. SAVR 3.2% (p<0.001) Major bleeding at 30 d: TAVR 9.3% vs. SAVR 19.5% (p<0.001) New-onset AF at 30 d: TAVR 8.6% vs. SAVR 16.0% (p=0.006).
PARTNER COHORT B (inoperable) (70) 22443478 (71) 20961243
Compare TAVR to medical Rx in inoperable pts with severe symptomatic AS
RCT TAVR in 179 vs. standard medical therapy in 179 (including BAV in 150 (84%)
Severe symptomatic calcific AS defined as AVA
<0.8 cm2 plus a mean P ≥40 mm Hg or Vmax ≥4.0 m/s with NYHA class II-IV symptoms. Inoperable due to coexisting conditions with predicted ≥50% risk of death within 30 d of intervention or a serious irreversible condition. Exclusions were bicuspid aortic valve, AMI, significant CAD, LVEF<20%, aortic annulus <18 or >25 mm, severe AR or MR, TIA within 6 mo, or severe renal insufficiency
All-cause death at 2 y (Kaplan–Meier): TAVR 43.3% vs. standard therapy 68% HR: with TAVR, 0.58 (95% CI: 0.36–0.92; p=0.02). Repeat hospitalization: TAVR 55% vs. 72.5% standard therapy (p<0.001). Survival benefit of TAVR stratified by STS score: STS score <5% HR: 0.37 (95% CI: 0.13–1.01 ); p=0.04 STS score 5%–14.9% HR: 0.58 (95% CI: 0.41–0.81); p=0.002 STS score ≥15% HR: 0.77 (95% CI: 0.46–1.28); p=0.31
Cardiac symptoms (NYHA class III or IV) were present in 25.2% of survivors at 1 y after TAVR vs. 58% with standard therapy (p<0.001). Major stroke rate at 30 d, was 5.0% with TAVR vs. 1.1% with standard therapy (p=0.06) and remained high at 2 y 13.8% with TAVR vs. 5.5% (p=0.01) Major vascular complications occurred in 16.2% with TAVR vs. 1.1% with standard therapy (p<0.001).
AF indicates atrial fibrillation; AMI, acute myocardial infarction; AS, aortic stenosis; AR, aortic regurgitation; AVA, aortic valve area; CAD, coronary artery disease; LVEF, left ventricular ejection fraction; MI, myocardial infarction; MR, mitral
regurgitation; NYHA, New York Heart Association; P, mean transaortic pressure gradient; pt(s), patient(s); RCT, randomized controlled trial; Rx, prescription; SAVR, surgical aortic valve replacement; STS, Society of Thoracic Surgeons; TAVR, transcatheter aortic valve replacement; TIA, transient ischemic attack; and Vmax, aortic valve maximum velocity.

17 © American College of Cardiology Foundation and American Heart Association, Inc.
Data Supplement 10. Clinical Outcomes of Asymptomatic Patients With Chronic Aortic Regurgitation (Sections 4.3.1.1 and 4.3.3) Study, Year Aim of Study Study Type Study
Size (n) Mean
Follow-Up (y)
Inclusion Criteria, Details
Outcomes Comments, Limitations
Bonow, 1983 (72) 6872164
Determine clinical outcome of asymptomatic pts with chronic AR and normal LV systolic function
Prospective, observational series; consecutive pts enrolled 1973-1982; single institution
77 4.1 Initially asymptomatic pts with chronic AR and normal LV systolic function Mean age 37 y (range 17–67) Serial echo and radionuclide angiographic studies 63 pts had 3+–4+ AR on aortic root angiography, and the other 14 pts had pulse pressures >70 mm Hg Endpoints: death, symptoms, LV systolic dysfunction
No pt died 12 pts underwent AVR because of symptoms (n=11) or asymptomatic LV dysfunction (n=1) Progression to symptoms or LV dysfunction: less than 4%/y No perioperative deaths in pts who underwent AVR
Percent of pts who did not need surgery was 90±3% (±SE) at 3 y, 81+6% at 5 y, and 75±7% at 7 y. Outcome associated with LVESD, LVEDD, FS, change in LVEF with exercise
Scognomiglio, 1986 (73) 3720042
Determine factors predictive of progression to LV systolic dysfunction
Observational series; single institution
30 4.7 38 initially asymptomatic pts with chronic AR, 30 of whom had normal LV fractional shortening Mean age 26±10 y Serial echo studies Endpoints: death, symptoms, subnormal LV fractional shortening
No pt died Progression to symptoms or LV dysfunction: 2.1%/y Progression to asymptomatic LV dysfunction: 2.1%/y
3 pts developing asymptomatic LV dysfunction had lower initial PAP/ESV ratios and trend toward higher LVESD and LVEDD and lower fractional shortening
Siemienczuk, 1989 (74) 2930091
Determine clinical outcome of asymptomatic pts with chronic AR and normal LV function.
Observational series derived from screening for randomized clinical trial; single institution
50 3.7 Pts included those receiving placebo and medical dropouts in a randomized drug trial of hydralazine therapy; included some pts with NYHA II symptoms. Mean age 48±16 y Serial echo and radionuclide LV angiographic studies
No pt died Progression to symptoms or LV dysfunction: 4.0%/y Progression to asymptomatic LV dysfunction: 0.5%/y
Outcome associated with LVESV, EDV, change in LVEF with exercise, and end-systolic wall stress
Bonow, 1991 (75) 1914102
Determine outcomes of asymptomatic pts with chronic AR; extension of Bonow, 1983
Prospective, observational series; consecutive pts enrolled 1973-1988; single institution
104 8.0 Initially asymptomatic pts with chronic AR and normal LV systolic function Mean age 37 y (range 17–67) Serial echo (average 7.5 per pt) and radionuclide LV angiographic (average 5.0 per pt) studies Endpoints: death, symptoms, LV systolic dysfunction
2 pts died suddenly Progression to symptoms or LV dysfunction: 2.1%/y Progression to asymptomatic LV dysfunction: 2.1%/y
Outcome associated with age, LVESD, LVEDD, change in LVEF with exercise, and rate of change in LVESD and LVEF at rest with time Initial LVESD >50 mm was associated with risk of death, symptoms, and/or LV dysfunction of 19% per y
Scognomiglio, 1994 (76) 8058074
Effect of nifedipine on outcomes of pts with severe AR and normal LV function
Randomized clinical drug trial (see Data Supplement 11); single institution
74 6.0 Initially asymptomatic pts with chronic AR and normal LV systolic function Mean age 36±12 y Serial echo studies Endpoints: death, symptoms, LV systolic dysfunction
No pt died Progression to death, symptoms or LV dysfunction: 5.7%/y Progression to asymptomatic LV dysfunction: 3.4%/y
This table include only the pts who received digoxin as part of a randomized trial See Data Supplement 11 for outcomes in those receiving active drug (nifedipine, n=69)

18 © American College of Cardiology Foundation and American Heart Association, Inc.
Study, Year Aim of Study Study Type Study Size (n)
Mean Follow-Up (y)
Inclusion Criteria, Details
Outcomes Comments, Limitations
Tornos, 1995 (77) 7631617
Determine clinical outcome of asymptomatic pts with chronic AR and normal LV systolic function
Prospective, observational series; consecutive pts beginning in 1982; single institution
101 4.6 Initially asymptomatic pts with chronic AR and normal LV systolic function Mean age 41±14 y Serial echo and radionuclide LV angiographic studies Endpoints: death, symptoms, LV systolic dysfunction
No pt died Progression to symptoms or LV dysfunction: 3.0%/y Progression to asymptomatic LV dysfunction: 1.3%/y
Outcome associated with pulse pressure, LVESD, LVEDD, and LVEF at rest Initial LVESD >50 mm was associated with risk of death, symptoms, and/or LV dysfunction of 7% per y
Ishii, 1996 (78) 8759822
Clinical outcome and LV response to chronic AR
Prospective, observational series; consecutive pts 1970-1990; single institution
27 14.2 94 consecutive pts followed for ≥6 mo; the 27 asymptomatic pts with normal LV function are included here Mean age 42±12 y LV function assessed by echo
No pt died Progression to symptoms or LV dysfunction: 3.6%/y
Development of symptoms associated with systolic BP, LVESD, LVEDD, mass index, and wall thickness. LV function not reported in all pts
Borer, 1998 (79) 9494022
Determine clinical outcome of asymptomatic pts with chronic AR and normal LV systolic function
Prospective, observational series; consecutive pts beginning in 1979; single institution
104 7.3 Initially asymptomatic pts with chronic AR and normal LV systolic function Mean age 46±15 y 20% of pts in NYHA II initially Serial echo and radionuclide LV angiographic studies Endpoints: death, symptoms, LV systolic dysfunction
4 pts died suddenly Progression to symptoms or LV dysfunction: 6.2%/y Progression to asymptomatic LV dysfunction: 0.9%/y
Change in LVEF from rest to exercise, normalized for change in end-systolic stress from rest to exercise was strongest predictor of any endpoint or of sudden cardiac death alone Outcome also associated with initial NYHA II symptoms, change in LVEF with exercise, LVESD, and LVFS
Tarasoutchi, 2003 (80) 12706927
Clinical outcome of asymptomatic pts with chronic AR and normal LV systolic function
Prospective, observational series; consecutive pts beginning in 1979; single institution
72 10 Initially asymptomatic pts with chronic AR and normal LV systolic function Mean age 28±9 y Serial echo and radionuclide LV angiographic studies Endpoints: death, symptoms, LV systolic dysfunction
No pt died Progression to symptoms or LV dysfunction: 4.7%/y Progression to asymptomatic LV dysfunction: 0.1%/y
AR of predominant rheumatic etiology LV function not reported in all pts Development of symptoms associated with LVESD and LVEDD Initial LVESD >50 mm was associated with risk of symptoms and/or LV dysfunction of 7.6%/y
Evangelista, 2005 (81) 16192479
Effect of nifedipine versus enalapril on outcomes of pts with severe AR and normal LV function
Randomized clinical drug trial (see Data Supplement 11); single institution
31 7 Initially asymptomatic pts with chronic AR and normal LV systolic function Mean age 42±15 y Serial echo studies Endpoints: death, symptoms, LV systolic dysfunction
1 pt died from HF Progression to death, symptoms or LV dysfunction: 3.6%/y
Pts reported here were in the control (placebo) group of this clinical trial See Data Supplement 11 for pts receiving active drugs nifedipine (n=32) and enalapril (n=31)

19 © American College of Cardiology Foundation and American Heart Association, Inc.
Study, Year Aim of Study Study Type Study Size (n)
Mean Follow-Up (y)
Inclusion Criteria, Details
Outcomes Comments, Limitations
Detaint, 2008 (82) 19356398
Predictive value of quantitative measures of AR severity and LV volumes in asymptomatic pts with chronic AR and normal LV systolic function
Prospective, observational series; consecutive pts enrolled from 1991–2003; single institution.
251 8 Initially asymptomatic pts with chronic AR and normal LV systolic function Mean age 60±17 y Serial echo studies to assess severity of AR (ROA and RV) as well as LV dimensions and volumes Endpoints: death, HF, AF, surgery
33 pts died Progression to death or surgery: 5.0%/y Survival at 10 y: Mild AR: 92±4% Moderate AR: 75±6% Severe AR: 69±9% Survival free from AVR at 10 y: Mild AR: 92±4% Moderate AR: 57±6% Severe AR: 20±5%
Surgical indications included symptoms (n=38), LV dysfunction or enlargement (n=17), aortic aneurysm (n=11), IE (n=3, and clinician and/or pt preference [n=11]) Cardiac events (defined as cardiac death, HR, or new onset of AF) associated with RV and ROA as well as ESV index, which superseded M-mode LV dimensions Mortality rate in this series is highest of all series Pts in this series older than all others; only 1 death in pts <50 y in this series
Pizzaro, 2011 (83) 21982316
Predictive value of BNP and quantitative measures of AR severity and LV volumes in asymptomatic pts with chronic AR and normal LV systolic function
Prospective, observational series; consecutive pts enrolled from 1991–2003; single institution
294 3.5 Initially asymptomatic pts with chronic AR and normal LV systolic function The first 160 consecutive pts were analyzed as the derivation set of data (mean age 51±9 y) The next 134 consecutive pts were analyzed as the validation set (mean age 53±10 y) BNP and serial echo studies to assess severity of AR (ROA and RV) as well as LV dimensions and volumes
5 pts died Progression to symptoms or LV dysfunction: 10%/y Progression to asymptomatic LV dysfunction: 2.8%/y
Outcome associated with BNP >130 pg/mL Outcome also associated with RV, ROA, LVESD index, LVEDD index, ESV index, and EDV index
Olsen, 2011 (84) 21414568
Predictive value of speckle-tracking echo in asymptomatic pts with chronic AR and normal LV systolic function
N/A 35 1.6 35 initially asymptomatic pts with chronic AR and normal LV systolic function were followed sequentially Mean age 56±14 y Serial echo studies Endpoints: symptoms, increase in LVEDV >15%, or decrease in LVEF >10% 29 additional pts who underwent AVR at the outset are not reported here
No pts died Progression to death, symptoms, increase in LVEDV or decrease in LVEF: 14.3%/y
Disease progression defined as symptoms, increase in LVEDV >15%, or decrease in LVEF >10% Disease progression associated with reduced myocardial systolic strain, systolic strain rate, and early diastolic strain rate
AF indicates atrial fibrillation; AR, aortic regurgitation; AVR, aortic valve replacement; BNP; brain natriuretic peptide; BP, blood pressure; EDV, end-diastolic volume; ESV, end-systolic volume; HF, heart failure; Hx, history; LV, left ventricular; LVEDD, end-diastolic dimension; LVEDV, left ventricular end-diastolic volume; LVEF, left ventricular ejection fraction; LVESD, left ventricular end-systolic volume; IE, infective endocarditis; N/A, not applicable; NYHA, New York Heart Association; PAP, pulmonary artery pressure; pt(s), patient(s); ROA, regurgitant orifice area; RV, regurgitant volume; and SE, standard error.

20 © American College of Cardiology Foundation and American Heart Association, Inc.
Data Supplement 11. Vasodilator Therapy in Asymptomatic Patients With Chronic Aortic Regurgitation (Section 4.3.2) Study Name, Author, Year
Study Aim Study Type/ Size (N)
Intervention vs. Comparator (n)
Patient Population Study Intervention Study Comparator
Endpoints Results
Inclusion Criteria Exclusion Criteria
Primary Endpoint &
Results
Evangelista, 2005 (81) 16192479
Effects of vasodilator therapy on LV function and time to AVR
RCT/95 Intervention: open-label nifedipine-32 pts (20 mg every 12 h) or open label enalapril-32 pts (20 mg every 12 h) vs. Comparator: no treatment-31 pts
Asymptomatic, chronic, severe AR and normal LV function
LVEF <50%., other valve disease. Hypertension, AF, CAD, aortic aneurysm
Open-label nifedipine (20 mg every 12 h) or open-label enalapril (20 mg/d)
No treatment LVEF Time to AVR
Rate of AVR was similar among the groups: Control group 39% Enalapril group 50% Nifedipine group 41%; p=0.62) No significant group differences in AR severity, LV size or LVEF. Follow-up mean 7 y
Scognomiglio, 1994 (76) 8058074
Assess whether vasodilator therapy reduces or delays the need for AVR
RCT/143 Intervention: Nifedipine (20 mg twice daily)-69 pts vs. Comparator: Digoxin (0.25 mg twice daily)-74 pts
Asymptomatic chronic severe AR with normal LV function
LVEF <50%, recent or worsening AR, hypertension, CAD, AS, other valve disease.
Nifedipine Digoxin Time to AVR AVR in 34%+6% of pts on digoxin versus 15%+3% of pts on nifedipine pts (p<0.001) at 6 y follow-up
AF indicates atrial fibrillation; AR, aortic regurgitation; AS, aortic stenosis; AVR, aortic valve replacement; CAD, coronary artery disease; LV, left ventricular; LVEF, left ventricular ejection fraction; pts, patients; and, RCT, randomized controlled trial.

21 © American College of Cardiology Foundation and American Heart Association, Inc.
Data Supplement 12. Determinants of Outcome After Surgery for Chronic Aortic Regurgitation (Section 4.3.3) Study, Year Aim of Study Study Type Study
Size (n)
Mean Follow-Up
(y)
Inclusion Criteria, Outcome Assessed Outcomes Comments, Limitations
Forman 1980 (85) 7377109
Determinants of survival after AVR
Retrospective, observational series; pts undergoing AVR 1972–1978; single institution
90 3 Indications for AVR not specified; age not specified Preoperative angiography Lillehei-Kastor, Starr Edwards model 2400, and Bjork-Shiley mechanical valves and first generation porcine bioprostheses Endpoint: survival
3-y survival: Overall 79±6% LVEF ≥50% 93±4% LVEF <50% 64±10%
p<0.02 CI: ≥2.5 L/m/m2 93±4% CI: <2.5 L/m/m2 63±10%
p<0.02
High-risk group identified by preoperative angiographic LVEF <50% and/or CI: <2.5 L/m/m2
Henry 1980 (86) 7353236
Determinants of survival after AVR
Prospective, observational series; consecutive pts undergoing AVR 1972–1977; single institution
50 3.7 Indications for AVR; symptoms Mean age 46 y (range 19–68 y) Preoperative echo and hemodynamics Endpoint: survival
4-y survival: Overall 61% LVESD <55 mm 75% LVESD ≥55mm 38%
p=0.006
High-risk group identified by preoperative echocardiographic LVFS <25% and/or LVESD >55 mm
Cunha 1980 (87) 7351849
Determinants of survival after AVR
Retrospective, observational series; consecutive pts undergoing AVR 1973–1977; single institution
86 2.4 (range 1–5.4)
79 symptomatic pts, 7 asymptomatic Mean age 49.6 y (range 17–82 y) Preoperative echo (all pts) and hemodynamics (37 pts) Endpoint: survival
3-y survival: LVFS >35% 100% LVFS 31-35% 91% LVFS ≤30% 78%
p<0.05 LVEF ≥60% 100% LVEF <60% 77%
p<0.05
High-risk group identified by preoperative echocardiographic LVFS <30%. Mortality also significantly associated with preoperative LVESD. Among pts with FS <30%, mortality higher in NYHA III-IV than in I-II.
Bonow 1980 (88) 6777072
Determinants of survival and LV function after AVR
Prospective, observational series; pts undergoing AVR 1972-1978; single institution
45 3.2 Symptomatic pts undergoing AVR Mean age 44 y (range 20-68 y) Studied with echo, radionuclide LV angiography, and graded treadmill testing Good exercise capacity defined as >stage 1 of NIH protocol Endpoints: survival and LV function
Among 32 pts with subnormal LVFS, those with good vs. poor exercise capacity had: Better survival (100% vs. 47%, p<0.01). Lower postoperative LVEDD (56±8 vs. 68±11 mm, p<0.005) Higher exercise LVEF (5±15 vs. 42±8%, p<0.01)
Exercise capacity imprecise in assessing preoperative LV function in symptomatic pts with AR, but useful in predicting long-term survival after AVR and reversibility of LV dilatation and systolic dysfunction
Borow 1980 (89) 7377221
Determinants of LV function after AVR
Retrospective, observational series; pts undergoing AVR starting 1971; single institution
20 2.0 (range 0.5–5.8)
NYHA: II (20%), III (70%), IV (10%) Preoperative hemodynamics and angiography; postoperative echo Endpoint: LV function (LVFS)
Preoperative LVESVi correlated with postoperative LVFS (r=0.77) The 3 postoperative deaths occurred in pts with preoperative LVESVi 0.60 mL/m2
In symptomatic pts with AR, preoperative LVESV is an important determinant of postoperative LV systolic function

22 © American College of Cardiology Foundation and American Heart Association, Inc.
Study, Year Aim of Study Study Type Study Size (n)
Mean Follow-Up
(y)
Inclusion Criteria, Outcome Assessed Outcomes Comments, Limitations
Greves 1981 (90) 6451163
Determinants of survival after AVR
Retrospective, observational series; pts undergoing AVR 1973–1979; single institution
42 3.7 (range 0.2–6.6)
38 symptomatic pts, 4 asymptomatic Mean age 45 (range 14–74) Preoperative hemodynamics and angiography Endpoint: survival
5-y survival: Overall 65.3±7.8% (SE) LVEF ≥45% 86.6±6.2% LVEF <45% 53.6±20.1%
p=0.04 Cardiac index: ≥2.5L/m/m2 92±6% Cardiac index: <2.5L/m/m2 66±16.1%
p<0.02
High-risk group identified by preoperative angiographic LVEF <45% and/or cardiac index: <2.5 L/m/m2 Among pts with LVEF <45%, mortality higher in NYHA III-IV than in I-II.
Kumpuris 1982 (91) 6461239
Determinants of survival, LV function, symptoms after AVR
Prospective, observational series; consecutive pts undergoing AVR 1973–1979; single institution
43 0.67 43 pts with chronic AR and 14 pts with acute AR; only the pts with chronic AR reported here Mean age 46 y (range 18–72 y) Pre- and postoperative echos Endpoint: survival, HF, LV function
Prediction of persistent LV dilatation after AVR (LVEDD >58 mm): Index Accuracy LVEDD 72 mm 77% LVESD 50 mm 86% FS 28% 70% Mean R/Th 2.5 93% MWS 300 mm Hg 88% ESS 235 mm Hg 91%
Persistent LV dilatation after AVR predicted by preoperative LVESD, R/Th ratio, mean and end-systolic wall stress; greater precision than LVFS or LVEDD. All deaths occurred in pts with persistent LV dilatation.
Gaasch 1983 (92) 6219153
Determinants of LV function, symptoms after AVR
Prospective, observational series; pts undergoing AVR 1975–1980; single institution
32 Range 1–6 Group A: 25 pts with normal LVEDD after AVR (mean age 45 y, range 18–63 y) Group B: 7 pts with LVEDD >33 mm/m2 after AVR (mean age 58 y, range 23–74 y) 24 symptomatic pts, 9 asymptomatic (8 in Group A) Pre- and serial postoperative echos Endpoint: symptoms, LV function
Preoperative data, Group A vs. Group B (p<0.001): —LVEDD 69±6 mm vs. 79±6 mm —LVESD 46±7 mm vs. 58±7 mm —LVFS 34±6% vs. 27±6% —R/Th 3.4±0.4 vs. 4.1±0.3 More postoperative symptoms in Group B
Persistent LV dilatation after AVR predicted by echocardiographic LVESD >2.6 cm/m2 and R/Th ratio >3.8. Trend toward worse survival in Group B (but only 2 deaths in each group at 4 y). Note: Group B was also 12 y older than Group A and more symptomatic.
Fioretti 1983 (93) 6847800
Determinants of LV function after AVR
Retrospective, observational series; consecutive pts undergoing AVR 1972–1980; single institution
47 3.4 (range 0.5–6.3)
All pts symptomatic Group A: 27 pts with LVESD <55 mm (45 y of age, range 22-75 y) Group B: 20 pts with LVESD ≥55 mm (49 y of age, range 22-65 y) NYHA III-IV: Group A 26%, Group B 65% Preoperative echo and angiographic data; postoperative echo at 3 mo and 36 mo Endpoint: LV function
Preoperative data, Group A vs. Group B (p<0.001): —LVEDD 67±7 vs. 82±6 mm —LVFS 33±6 vs. 24±6% —LVEDV 147±43 vs. 247±42 mL/m2 —LVEF 54±7 vs. 42±9% Postoperative data, Group A vs. Group B: —LVEDD 53±8 vs. 63±7 mm (p<0.001)
Persistent LV dysfunction predicted by preoperative LVEDD ≥75 mm and/or LVESD ≥55 mm. Note greater preoperative symptoms in Group B than Group A

23 © American College of Cardiology Foundation and American Heart Association, Inc.
Study, Year Aim of Study Study Type Study Size (n)
Mean Follow-Up
(y)
Inclusion Criteria, Outcome Assessed Outcomes Comments, Limitations
Stone 1984 (94) 6707364
Determinants of LV function after AVR
Prospective, observational series; consecutive pts undergoing AVR 1962–1977; single institution.
113 4.6±3.3 108 pts symptomatic Mean age 51 y (range 25–77 y) Hemodynamics and angiography in all pts; echo in 44 pts 20 pts with pre- and postoperative echos Endpoint: survival (all pts) and LV function (20 pts)
43 pts died after AVR (8 from HF), no predictors of death Predictors of postoperative LVEDD ≤57 mm: LVESD, LVFS, R/Th ratio Predictors of postoperative LVESD ≤40 mm: LVESD, LVEDD, LV mass
No preoperative variable predicted postoperative LV function. Normal LV size after AVR most likely in pts with preoperative LVFS >26%, LVESD <55 mm, and LVEDD <80 mm
Bonow 1985 (95) 4064269
Determinants of survival and LV function after AVR
Prospective, observational series; consecutive pts undergoing AVR 1976–1983; single institution.
80 3.75 (range 0.5–7.5)
96 consecutive pts; 16 with CAD excluded Group A: 30 pts with normal LVEF Group B: 50 pts with subnormal LVEF Mean age 44 y (range 15–74 y) Preoperative and postoperative echo and radionuclide angiography; preoperative exercise testing Endpoint: Survival, LV function
5 y survival was 83±5%, significantly better than pts undergoing AVR from 1972–1976 (62±9%) Preoperative determinants of postoperative survival: LVEF and FS (both p<0.001) and LVESD (p<0.01) 5 y survival: 96±3% in Group A, 63±12% in Group B (p<0.001)
High-risk group identified by subnormal LVEF at rest. Pts in Group B with poor exercise tolerance and prolonged duration of LV dysfunction were the highest-risk group (5 y survival 52±11) and had greater LVEDD and lower LVEF (both p<0.001) than the others.
Daniel 1985 (96) 3156010
Determinants of survival, symptoms and LV function after AVR
Retrospective, observational series; pts undergoing AVR 1975–1983; single institution.
84 2.5 Consecutive series of pts with high-quality echos Preoperative symptoms not specified Age 46±11 y (range 18–71) Pts with CAD excluded Endpoint: Survival, symptoms, LV function
Survival at 2.5 y: 90.5% in pts with LVFS >25% and LVESD ≤55 mm, but only 70% with LVESD >55 mm and LVFS ≤25%. Survival at 2.5 y: 79% in pts with LVESD >55 mm or LVFS ≤25%.
Outcome after AVR predicted by preoperative LVFS and LVESD. Pts with preoperative LVFS ≤25% had greater postoperative LVEDD compared to those with LVFS >25%: 62±10 vs. 54±7 mm (p<0.05)
Cormier 1986 (97) 3727677
Determinants of survival after AVR
Prospective, observational series; consecutive pts undergoing AVR 1968–1983; single institution.
73 4.9±0.8 (range 0.3–14)
All pts in NYHA FC I-II (26 FC I, 47 FC II) Age 46±11 y (range 14–76 y) Echo in 58 pts (LVEDD 70±12 mm; hemodynamics and angiography in 62 pts) (LVEDV 222±55 mL/m2) Pts with CAD excluded Endpoint: Survival
84% survival at 8 y There were only 2 determinants of survival after AVR: LVEF (p<0.05) and LVESD (p<0.05)
Overall survival good in asymptomatic/mildly symptomatic pts High-risk group identified by preoperative LVEF <40% and LVESD ≥55 mm.
Sheiban 1986 (98) 3727678
Determinants of survival after AVR
Retrospective, observational series; consecutive pts undergoing AVR 1973–1982; single institution.
84 6.5 (range 3–10)
NYHA: I (12%), II (33%), III (45%), IV (10%) Mean age 42 y (range 20–68) Echo, hemodynamics, and angiography Endpoint: Survival
10-y survival (p<0.01): NYHA I 100%, II 86%, III 70%, IV 0% 5-y survival (p<0.01): —82% in LVESD ≤55 mm; —37% in LVESD <55 mm —81% in LVEF ≥50% ; 62% in LVEF <50%
High-risk group identified by preoperative LVEF <50% and LVESD >55 mm. Severity of preoperative symptoms associated with late survival

24 © American College of Cardiology Foundation and American Heart Association, Inc.
Study, Year Aim of Study Study Type Study Size (n)
Mean Follow-Up
(y)
Inclusion Criteria, Outcome Assessed Outcomes Comments, Limitations
Carabello 1986 (99) 3779916
Determinants of LV function after AVR in pts with preoperative LV dysfunction
Retrospective, observational series; pts undergoing AVR 1980–1987; single institution.
14 1.9±0.67 (range 0.5–6)
Pts with isolated severe AR and LVEF <55% Mean age 49±6 y Pts with CAD excluded Preoperative hemodynamic and echo data; postoperative radionuclide angiography Endpoint: LV function
Preoperative LVESD 57±3 mm Correlation with postoperative LVEF: —LVEDD r=-0.47; p<0.05 —LVEF r=0.55; p<0.05 —R/Th r=-0.56; p<0.05 —LVESV r=-0.62; p<0.05 —LVFS r=0.71; p<0.01 —LVESD r=-0.91; p<0.001
Postoperative LVEF correlated with preoperative LVESD, FS, LVEDD, R/Th ratio Postoperative LVEF most strongly associated with preoperative LVESD
Taniguchi 1987 (100) 3624657
Determinants of survival after AVR
Retrospective, observational series; consecutive pts undergoing AVR 1978–1985; single institution.
62 3.8±2.2 Age 43±12 y (range 18–64) Group A: LVESV <200 mL/m2 (n=48), Group B: LVESV >200 mL/m2 (n=12) Pts with CAD excluded Preoperative hemodynamic and angiographic data Postoperative catheterization in 29 pts Endpoint: Survival and LV function
7-y survival 83±5% Preoperative LVESV index was most important indicator of postoperative death (p<0.001) 6.5 y survival: 92±4% in Group A, 51±16% in Group B (p<0.001) Postoperative data, Group A vs. Group B (p<0.001) —LVEF: 62±7 vs. 42±8% —LVEDV: 98±19 vs. 124±58 mL/m2
High-risk group identified by preoperative LVESV index >200 mL/m2 and/or LVEF <40%. No cardiac deaths in Group A
Bonow 1988 (95) 4064269
Factors influencing short- and long-term changes in LV function after AVR
Prospective, observational series; pts undergoing AVR 1976–1983; single institution.
80 Range 3-7
Mean age 43 y (range 19–72 y) Pts with CAD excluded Echo and radionuclide angiography before, 6–8 mo after AVR and 3–7 y after AVR; preoperative exercise testing Endpoint: LV function
Preoperative to early postoperative changes (p<0.001): —LVEDD 75±6 to 56±9 mm —LVEF 43±9 to 51±16% —LVPSS 247±50 to 163±42 dynes/cm2 Early to late postoperative: no change in LVEDD or PSS, but further increase in LVEF to 56±19% (p<0.001)
Short- and long-term LV function after AVR predicted by preoperative LVEF, FS, LVESD. Among pts with subnormal preoperative LVEF, those with poor exercise tolerance or prolonged duration of LV dysfunction are at highest risk for persistent LV dysfunction
Michel 1995 (101) 8563993
Determinants of long-term survival after AVR
Retrospective, observational series; consecutive pts undergoing AVR 1980–1994; single institution.
286 6 NYHA: I (19%), II (34%), III (44%), IV (3%) Age 52±13 y (range 17–76 y) Pts with CAD excluded Hemodynamic and echo data Endpoint: Postoperative LV dysfunction defined as clinical HF or LVEF <40% Group A: no postoperative LV dysfunction (n=247); Group B: postoperative LV dysfunction (n=28)
5- and 10-y survival 80% and 60%, respectively Preoperative data, Group A vs. Group B (p<0.001): —LVEF: 48±9 vs. 37±5% —LVFS: 29±7 vs. 21±5% —LVEDD: 69±7 vs. 76±7 mm —LVESD: 49±7 vs. 61±5 mm —NYHA: 44% vs. 82%
Postoperative LV dysfunction predicted by severity of preoperative symptoms and preoperative LVEF, FS, LVESD, LVEDD. On multivariate analysis, preoperative symptoms (p<0.01), LVESD (p<0.03) and LVEF (p<0.04) were significant factors. Determinants of survival not presented.

25 © American College of Cardiology Foundation and American Heart Association, Inc.
Study, Year Aim of Study Study Type Study Size (n)
Mean Follow-Up
(y)
Inclusion Criteria, Outcome Assessed Outcomes Comments, Limitations
Klodas 1996 (102) 8606280
Impact of LV function on survival after AVR
Retrospective, observational series; consecutive pts undergoing AVR 1980–1989; single institution
219 5-y and 10-y survival data reported
Group A: preoperative LVEDD <80 mm (n=188, age 55±16 y) Group B: preoperative LVDD ≥80 mm (n=31, age 50±15 y) NYHA III-IV symptoms: Group A 37%, Group B 29% Includes pts with CAD: Group A 37%, Group B 29% Endpoint: Survival
Preoperative data, Group A vs. Group B (p<0.001): —LVEF: 53±11 vs. 43±12% —LVEDD: 67±8 vs. 84±4 mm —LVESD: 45±9 vs. 63±8 mm —LVESS: 96±39 vs. 147±39 dynes x 105/s Postoperative survival, Group A vs. Group B (p=NS): —5 y: 89±3% vs. 87±6% —10 y: 73±5% vs. 71±9% Postoperative survival, LVEF ≥50% vs. <50% (p<0.01): —10 y: 80±5% vs. 63±7%
Extreme LV dilatation associated with LV systolic dysfunction Preoperative LVEF, not degree of LV dilatation, associated with survival
Klodas 1997 (103) 9283535
Impact of symptom severity on survival after AVR
Retrospective, observational series; consecutive pts undergoing AVR 1980–1989; single institution
289 5-y and 10-y survival data reported
Group A: NYHA I-II (n=161, age 50±16 y, 86% men) Group B: NYHA III-IV (n=128, age 61±14 y, 70% men) Includes pts with CAD: Group A 11%, Group B 35%; including AVR plus CABG: Group A 8%, Group B 32% (both p<0.0001) Echo data in 249 pts Endpoint: survival
Preoperative data, Group A vs. Group B (p<0.05): —LVEF: 5 3±11 vs. 49±14% 10-y survival, Group A vs. Group B (p<0.001) —Total: 78±7% vs.45±4% —LVEF ≥50%: 82% vs. 40% —LVEF <50%: 73% vs. 40% —Men: 80% vs. 55% —Women: 73% vs. 21% —CAD: 76% vs. 39% —No CAD: 79% vs. 48%
High-risk group identified by symptom severity and preoperative LVEF <50% Survival in Group A equivalent to normal age/sex matched population Note higher frequency of CAD and CABG surgery (and other comorbidities) in the more symptomatic Group B
Turina 1998 (104) 9852889
Determinants of survival after AVR
Retrospective, observational series; consecutive pts undergoing AVR 1970–1983; single institution
192 18.7 (range 13–26)
Mean age 44 y Endpoint: Survival
Survival rates 76% at 10 y, 55% at 20 y. 83% of long-term survivors in NYHA I-II. Multivariate predictors of late survival: age, LVESV, NYHA, previous IE. LVEF significant in univariate analysis.
High-risk group identified by symptom severity, low LVEF, and elevated ESV.
Chaliki 2002 (105) 12438294
Survival after AVR in pts with normal versus reduced LV function
Retrospective, observational series; consecutive pts undergoing AVR 1980–1995; single institution
450 8.1 (median)
Group A (273 pts, age 56±16) with LVEF ≥50% Group B (134 pts, age 58±15) with LVEF 35%–50% Group C (43 pts, age 58±14) with LVEF <35% LVEF measured by left ventriculography
Operative mortality, Group A vs. B vs. C: 3.7%, 6.7%, 14% (p=0.02) 10-y mortality, Group A vs. B vs. C: 30%, 44%, 59% (p<0.001) 10-y HF rate, Group A vs. B vs. C: 9%, 17%, 25% (p<0.003) Postoperative change in LVEF, Group A vs.
Pts with markedly low LVEF incur have high rates of short- and long-term mortality and HF after AVR. However, postoperative LVEF improves significantly, and most pts survive without recurrence of HF. Thus they should not be denied benefits

26 © American College of Cardiology Foundation and American Heart Association, Inc.
Study, Year Aim of Study Study Type Study Size (n)
Mean Follow-Up
(y)
Inclusion Criteria, Outcome Assessed Outcomes Comments, Limitations
and/or echo Endpoint: Survival
B vs. C: -2.3%, 4%, 4.9% (p<0.01)
of AVR.
Tornos 2006 (106) 16516086
Determinants of survival after AVR
Prospective, observational series; consecutive pts undergoing AVR 1982–2002; single institution
170 10±6 (range 1–22)
Group A (60 pts age 47±15) mild symptoms (NYHA II), mild LV dysfunction (LVEF 45–50%) or LVESD 50–55 mm Group B (110 pts age 53±14) with NYHA III-IV symptoms or more severe LV dysfunction (LVEF <45% or LVESD >55 mm) Echo data Endpoint: Survival
Cardiac deaths: 5 (9%) in Group A, 28 (28%) in Group B (p=0.002). Survival Group A vs. Group B (p=0.009):
90% vs. 75% at 5 y, 86% vs. 64% at 10 y, 78% vs. 53% at 15 y
Early AVR as defined in the 2006 ACCF/AHA guidelines improves long-term survival in pts with chronic AR. Delaying AVR until more severe symptoms or more severe LV dysfunction decreases postoperative survival.
Bhudia 2007 (107) 17397676
Survival after AVR in pts with marked LV dysfunction compared to normal LV function or mild LV dysfunction
Prospective, observational series; consecutive pts undergoing AVR 1972–1999; single institution
724 8.3±6.5 Group A (88 pts, age 56±12) with severe LV dysfunction (LVEF <30%) Group B (636 pts, age 50±15) with either less severe LV dysfunction or normal LV function Endpoint: Survival
Survival diminished in Group A (severe LV dysfunction) compared to Group B (p=0.04):
81% vs. 92% at 1 y, 68% vs. 81% at 5 y, 46% vs. 62% at 10 y, 26% vs. 41% at 15 y, 12% vs. 24% at 20 y
In propensity matched pts since 1985, these survival trends persisted, but were not significant between pts in Groups A and B (p=0.9):
92% vs. 96% at 1 y, 79% vs. 83% at 5 y, 51% vs. 55% at 10 y
AR indicates aortic regurgitation; AVR, aortic valve replacement; CABG, coronary artery bypass graft surgery; CAD, coronary artery disease; echo, echocardiography; ESS, end-systolic stress; ESV, end-systolic volume; FS, fractional shortening; HF, heart failure; IE, infective endocarditis; LV, left ventricular; LVEDD, left ejection end-diastolic dimension; LVEF, left ventricular ejection fraction; LVESD, left ventricular end-systolic dimension; LVESV (i), left ejection end-systolic volume (indexed to body surface area); LVFS, left ventricular fractional shortening; LVPSS, left ventricular peak systolic wall stress; MWS, mean wall stress; NIH, National Institute of Health; NYHA , New York Heart Association; PSS, peak systolic wall stress; pts, patients; and, R/Th, radius to wall thickness ratio.

27 © American College of Cardiology Foundation and American Heart Association, Inc.
Data Supplement 13. Hemodynamic Effects Percutaneous Mitral Balloon Commissurotomy (PMBC) Compared to Surgical Closed Commissurotomy (CC) or Open Commissurotomy (OC) (Section 6.2.3)
Author, Year Mean Follow-Up
Procedure No. of Patients
Age, y Average Morphology
Score*
Mitral Gradient (mm Hg) Mitral Valve Area (cm2) Restenosis (%) Freedom From Reintervention (%)
NYHA I (%)
Pre Post Pre Post
Patel 1991 (108) 1918709
Immediate PMBC
23 30±11 6.0 12±4 4±3 0.8±0.3 2.1±0.7† N/A N/A 91
CC 22 26±26 6.0 12±5 6±3 0.7±0.2 1.3±0.3 N/A N/A N/A
Turi 1991 (109) 2013139
7 mo PMBC 20 27±8 7.2 18±4 10±2 0.8±2 1.6±0.2 N/A N/A N/A
CC 20 28±1 8.4 20±6 12±2 0.9±0.4 1.7±0.2 N/A N/A N/A
Arora 1993 (110) 8465732
22 mo PMBC 100 19±5 N/A N/A N/A 0.8±0.3 2.3±0.1 5 N/A N/A
CC 100 20±6 N/A N/A N/A 0.8±0.2 2.1±0.4 4 N/A N/A
Reyes 1994 (111) 8084354
3 y PMBC 30 30±9 6.7 N/A N/A 0.9±0.3 2.4±0.4† 10 N/A 72
CC 30 31±9 7.0 N/A N/A 0.9±0.3 1.8±0.4 13 N/A 57
Ben Farhat 1998 (112) 9462525
7 y PMBC 30 29±12 6.0 N/A N/A 0.9±0.2 1.8±0.4 N/A 90 87
OC 30 27±9 6.0 N/A N/A 0.9±0.2 1.8±0.3 N/A 93 90 CC 30 28±10 6.0 N/A N/A 0.9±0.2 1.3±0.3 N/A 50 33
Cotrufo 1999 (113) 10386411
38 mo PMBC 111 47±14 7.6 N/A N/A 1.0±0.2 1.8±0.3 28 88 67
50 mo OC 82 49±10 8.2 N/A N/A 1.0±0.2 2.3±0.3 18 96 84
*Wilkins echocardiographic mitral valve morphology score, the sum of a 0 to 4 score for each of 4 characteristics: eaflet mobility, thickness, calcification and chordal involvement . †Significant difference (p<0.05) in increased mitral valve area by PMBC compared with surgical commissurotomy. CC indicates closed commissurotomy; N/A, not available; NYHA, New York Heart Association; OC, open commissurotomy; Post, postprocedure; PMBC, percutaneous mitral balloon commissurotomy; and, Pre, preprocedure. Adapted from Bonow et al. (114). Bhudia SK, McCarthy PM, Kumpati GS, et al. Improved outcomes after aortic valve surgery for chronic aortic regurgitation with severe left ventricular dysfunction. J Am Coll Cardiol. 2007;49;1465-71.

28 © American College of Cardiology Foundation and American Heart Association, Inc.
Data Supplement 14. Echocardiographic Prediction of Outcome of Percutaneous Balloon Mitral Commissurotomy (Section 6.2.3) Author, Year Mean Follow-
Up, mo Echo Criteria Number of
Patients Age
(y±SD) Survival (%) Survival Free of Events (%) Events
Cohen et al., 1992 (115) 1406834
36±20 Score ≤8 Score >8
84 52
N/A N/A 68% at 5 y 28% at 5 y
Death, MVR, repeat PMBC
Palacios et al., 1995 (116) 7828292
20±12 Score ≤8 Score >8
211 116
48±14 64±11
98% at 4 y 39% at 4 y
98% at 4 y 39% at 4 y
Death, MVR, NYHA III-IV symptoms
Dean et al., 1996 (117) 8917257
38±16 Score ≤8 Score 8–12 Score >12
272 306 24
49±13 58±15 58±15
95% at 4 y 83% at 4 y 24% at 4 y
N/A Death
Iung et al., 1996 (118) 8557913
32±18 Group 1 Group 2 Group 3
87 311 130
46±13
N/A 89% at 3 y 78% at 3 y 65% at 3 y
Death, MVR, repeat PMBC, FC III-IV symptoms
Cannan et al., 1997 (119) 8996311
22±10 Com Ca- Com Ca+
120 29
N/A N/A 86% at 3 y 40% at 3 y
Death, MVR, repeat PMBC
Palacios et al., 2002 (120) 11914256
50±44 Score >8 Score <8
278 601
63+14 51+14
82% at 12 y 57% at 12 y
38% at 12 y 22% at 12 y
Death, MVR, repeat PMBC
Echo score based on scoring system of Wilkins et al. (121) mitral valve morphology score, the sum of a 0 to 4 score for each of 4 characteristics: leaflet mobility, thickness, calcification and chordal involvement. Echo groups defined as 1, 2, or 3 based on valve flexibility, chordal fusion and valve calcification (Iung, et al. (112)). Com Ca indicates commissural calcification; echo, echocardiographic; MVR, mitral valve replacement; N/A, not available; NYHA, New York Heart Association; and, PMBC, percutaneous mitral balloon commissurotomy.

29 © American College of Cardiology Foundation and American Heart Association, Inc.
Data Supplement 15. Randomized Trials of Percutaneous Mitral Balloon Commissurotomy Versus Surgery for Mitral Stenosis (Section 6.2.3) Study Name, Author, Year
Study Aim Study Type/
Size (N)
Intervention vs. Comparator (n)
Patient Population Study Intervention
Study Comparator
Results
Inclusion Criteria Exclusion Criteria
Patel 1991 (108) 1918709
Compare PMBC by single catheter technique versus CC
RCT/45
Intervention: 23 PMBC vs. comparator: 22 CC
Symptomatic NYHA II or III, tight MS
Mitral valve calcification or left atrial thrombus on 2D echo, more than mild MR or AR, history of systemic embolism within 3 mo of presentation
PBMC Closed surgical valvotomy
PBMC: MVA increased from 0.8+0.3 cm2 to 2.1±0.7 cm2
(p<0.001) CC: MVA increased from 0.7±0.2 cm2 to 1.3±0.3 cm2 (p<0.001)
Ben 1998 (112) 9462525
Compare the early invasive and long-term (7 y) clinical and echo follow-up results of PBMC with those of OC and CC for the treatment of tight pliable rheumatic MS
RCT/90 Intervention: PBMC vs. comparator: CC; OC
Rheumatic tight rheumatic mitral valve stenosis (MVA <1.3 cm2),
Other valve disease, previous thromboembolism, mitral valve calcification, and left atrium thrombus, AF, severe pulmonary hypertension or mild-to-moderate TR
PBMC CC or OC Increase in Gorlin MVA : PBMC (from 0.9±0.16 to 2.2±0.4 cm2), OC (from 0.9+0.2 to 2.2±0.4 cm2), CC (from 0.9±0.2 to 1.6±0.4 cm2). Residual MS (MVA <1.5 cm2): 0% after PBMC or OC and 27% after CC. No early or late mortality or thromboembolism among the 3 groups. At 7-y follow-up, echo MVA was similar and greater after PBMC and OC (1.8±0.4 cm2) than after CC (1.3±0.3 cm2; p<0.001). Restenosis (MVA <1.5 cm2) rate was 6.6% after PBMC or OC vs. 37% after CC. Residual ASD in 2 pts and 3+ MR in 1 pt in the PBMC group. NYHA class I in 87% of pts after PBMC and 90% of pts after OC vs. CC 33% (p<0.0001) Freedom from reintervention 90% after PBMC, 93% after OC, and 50% after CC.
Turi 1991 (109) 2013139
Compare PBMC with surgical CC
RCT/40 Intervention: 20 PBMC vs. Comparator: 20 CC
Pts deemed acceptable as candidates for both procedures
N/A PBMC Surgical CC No differences between groups in pulmonary artery wedge pressures, mitral valve gradients, and MVA at 1 wk and at 8 mo. (all p>0.4).
Arora 1993 (110) 8465732
Compare the immediate and long-term results of PBMC vs. CMC
RCT/200 Intervention: 100 vs. Comparator: 100
Symptomatic pts with moderate-to-severe MS
Pts with more than minimal mitral valve calcification AF, or >2+ MR
PBMC CC Both procedures resulted in significant and similar increases in MVA (PBMV: 0.85+0.28 to 2.39±0.94 cm2; CC: 0.79±0.21 to 2.2±0.85 cm2; p=NS). MR developed in 14 pts after PBMC and in 12 pts after CC. Restenosis (defined as a loss of >50% of the achieved

30 © American College of Cardiology Foundation and American Heart Association, Inc.
Study Name, Author, Year
Study Aim Study Type/
Size (N)
Intervention vs. Comparator (n)
Patient Population Study Intervention
Study Comparator
Results
Inclusion Criteria Exclusion Criteria
increase in MVA) was seen in 4 (5%) pts after PBMV and in 3 (4%) after CC.
Reyes 1994 (111) 8084354
Compare PBMC to OC for treatment of rheumatic MS
RCT/60 Intervention: 30 vs. Comparator: 30
Severe rheumatic MS, in sinus rhythm, no severe subvalvular disease/ calcification or more than mild MR
Coexisting other cardiac or valve disease, stroke, severe pulmonary hypertension, low body weight, Lutembacjer's syndrome, and pt decision not to be randomized
PBMC Open surgical commissurotomy
MVA at 3 years was larger after PBMC (2.4±0.6 cm2 ) vs. OC (1.8±0.4 cm2).
NYHA class I at 3 years in 72% or PBMC pts and 57% of OC pts
Cotrufo 1999 (113) 10386411
Compare PPMC vs. OC
RCT/193 Intervention: PBMC 111 vs. Comparator: OC 82
N/A N/A PBMC OC Survival, event free analysis, recurrent restenosis No hospital mortality in both groups (p=0.3) Hospital complications: 4/111 PBMC vs. 1/82 OC (p=0.3)
2D indicates 2-dimensional; AF, atrial fibrillation; AR, aortic regurgitation; ASD, atrial septal defect; CC, closed commissurotomy; echo, echocardiography; MR, mitral regurgitation, MS, mitral stenosis; MVA, mitral valve area; N/A, not applicable; NS, nonsignificant; NYHA, New York Heart Association; OC, open commissurotomy; PMBC; percutaneous mitral balloon commissurotomy; pts, patients; RCT, randomized controlled trial; and, TR, tricuspid regurgitation.

31 © American College of Cardiology Foundation and American Heart Association, Inc.
Data Supplement 16. Preoperative Predictors of Surgical Outcome in Mitral Regurgitation (Section 7.3.3) Study, Year Study Design Type of Surgery Number of
Patients Outcome Assessed Findings
Schuler 1979 (122) 436214
Retrospective MVR 20 LV function 12 pts with average LVEF 0.70 had normal postoperative LVEF; 4 pts with average LVEF 0.58 had postoperative LVEF 0.25.
Phillips 1981 (123) 7282546
Retrospective MVR 105 Survival LVEF <0.50 predicted poor survival.
Zile 1984 (124) 6693615
Prospective MVR 16 HF, LV function
LVESD index >2.6 cm/m2 (45 mm) and LVFS <0.32 predicted poor outcome.
Crawford 1990 (125) 2317900
Prospective MVR 48 Survival, LV function
LVEF <0.50 predicted reduced survival; ESV >50 mL/m2 predicted persistent LV dilatation.
Wisenbaugh 1994 (126) 8012639
Registry MVR 26 Survival, LV function
LVESD, LVEDD, and FS predicted poor survival and LV function; only LVESD significant in multivariate analysis.
MVR-CP 35
Enriquez-Sarano 1994 (127) 8044955
Retrospective MVR 214 Survival LVEF <0.60 predicted poor survival whether MVR or CP was preformed; LVEF estimated by echo FS or visual analysis.
Repair 195
Enriquez-Sarano 1994 (128) 7930287
Retrospective MVR 104 LV function LVEF, LVESD, LV diameter/thickness ratio and end-systolic wall stress predicted outcome; LVEF estimated by echo FS or visual analysis.
Repair 162
CP indicates chordal preservation procedure; ESV, end-systolic volume; FS, fractional shortening; HF, heart failure; LA, left atrial; LV, left ventricular; LVEF, left ventricular ejection fraction; LVESD, left ventricular end-systolic dimension; LVFS, left ventricular fractional shortening; MVR, mitral valve replacement; PAWP, pulmonary artery wedge pressure; and, pts, patients.
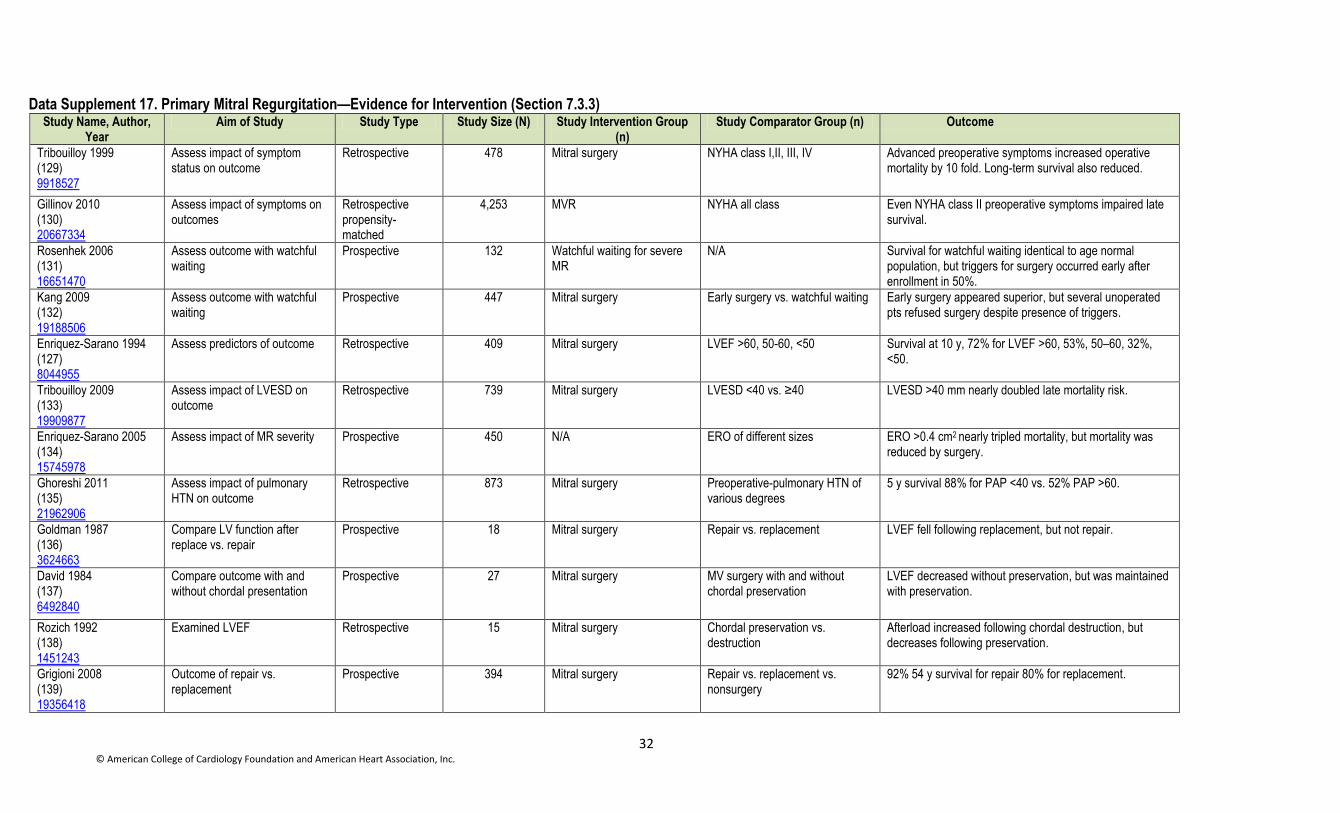
32 © American College of Cardiology Foundation and American Heart Association, Inc.
Data Supplement 17. Primary Mitral Regurgitation—Evidence for Intervention (Section 7.3.3) Study Name, Author,
Year Aim of Study Study Type Study Size (N) Study Intervention Group
(n) Study Comparator Group (n) Outcome
Tribouilloy 1999 (129) 9918527
Assess impact of symptom status on outcome
Retrospective 478 Mitral surgery NYHA class I,II, III, IV Advanced preoperative symptoms increased operative mortality by 10 fold. Long-term survival also reduced.
Gillinov 2010 (130) 20667334
Assess impact of symptoms on outcomes
Retrospective propensity-matched
4,253 MVR NYHA all class Even NYHA class II preoperative symptoms impaired late survival.
Rosenhek 2006 (131) 16651470
Assess outcome with watchful waiting
Prospective 132 Watchful waiting for severe MR
N/A Survival for watchful waiting identical to age normal population, but triggers for surgery occurred early after enrollment in 50%.
Kang 2009 (132) 19188506
Assess outcome with watchful waiting
Prospective 447 Mitral surgery Early surgery vs. watchful waiting Early surgery appeared superior, but several unoperated pts refused surgery despite presence of triggers.
Enriquez-Sarano 1994 (127) 8044955
Assess predictors of outcome Retrospective 409 Mitral surgery LVEF >60, 50-60, <50 Survival at 10 y, 72% for LVEF >60, 53%, 50–60, 32%, <50.
Tribouilloy 2009 (133) 19909877
Assess impact of LVESD on outcome
Retrospective 739 Mitral surgery LVESD <40 vs. ≥40 LVESD >40 mm nearly doubled late mortality risk.
Enriquez-Sarano 2005 (134) 15745978
Assess impact of MR severity Prospective 450 N/A ERO of different sizes ERO >0.4 cm2 nearly tripled mortality, but mortality was reduced by surgery.
Ghoreshi 2011 (135) 21962906
Assess impact of pulmonary HTN on outcome
Retrospective 873 Mitral surgery Preoperative-pulmonary HTN of various degrees
5 y survival 88% for PAP <40 vs. 52% PAP >60.
Goldman 1987 (136) 3624663
Compare LV function after replace vs. repair
Prospective 18 Mitral surgery Repair vs. replacement LVEF fell following replacement, but not repair.
David 1984 (137) 6492840
Compare outcome with and without chordal presentation
Prospective 27 Mitral surgery MV surgery with and without chordal preservation
LVEF decreased without preservation, but was maintained with preservation.
Rozich 1992 (138) 1451243
Examined LVEF Retrospective 15 Mitral surgery Chordal preservation vs. destruction
Afterload increased following chordal destruction, but decreases following preservation.
Grigioni 2008 (139) 19356418
Outcome of repair vs. replacement
Prospective 394 Mitral surgery Repair vs. replacement vs. nonsurgery
92% 54 y survival for repair 80% for replacement.

33 © American College of Cardiology Foundation and American Heart Association, Inc.
Study Name, Author, Year
Aim of Study Study Type Study Size (N) Study Intervention Group (n)
Study Comparator Group (n) Outcome
Gillinov 2008 (140) 18721551
Outcome of repair vs. replacement
Retrospective 328 N/A Repair vs. replacement propensity
5, 10, 15 y survival 95, 87, 68 repair vs. -80, 60, 44 replacement.
ERO indicates effective regurgitant orifice; HTN, hypertension; LV, left ventricular; LVEF, left ventricular ejection fraction; LVESD, left ventricular end-systolic dimension; MR, mitral regurgitation; MV, mitral valve; MVR, mitral valve repair; N/A not applicable; NYHA, New York Heart Association; PAP, pulmonary artery pressure; and, pts, patients.

34 © American College of Cardiology Foundation and American Heart Association, Inc.
Data Supplement 18. Secondary Mitral Regurgitation—Evidence for Intervention (7.4.3) Study Name, Author,
Year Aim of Study Study Type Study Size
(N) Study Intervention Group
(n) Study Comparator Group (n) Outcome
Kang 2006 (141) 16820626
Outcome surgery in moderate-to-severe ischemic MR
Retrospective 107 CABG + repair CABG Higher operative mortality with CABG and MV repair vs CABG alone (12% vs 2%) but similar 5 year survival (88% vs 87%)
Rossi 2011 (142) 21807656
Impact of SMR on outcome Retrospective 1,256 None Impact of SMR on HF After adjusting for LVEF and other factors-SMR increased mortality by 2-fold
Wu 2005 (143) 15680716
Impact of surgery on moderate-severe MR
Retrospective 126 Surgery with mitral annuloplasty
Med Rx No survival advantage to mitral valve annuloplasty
Mihaljevic 2007 (144) 17543639
Impact of mitral surgery moderate-severe on SMR
Retrospective 290 CABG+ MV surgery CABG 1-, 5-, 10-y survival -88, 75, 47 CABG vs. 92, 74, 39 CABG + MV Sx; (p=NS) functional class improved equally in both groups
Benedetto 2009 (145) 19377377
Impact of MV surgery on SMR Meta-analysis 2,479 CAGB+MV surgery CABG No difference in survival or symptomatic status
Fattouch 2009 (146) 19619766
Impact of MV surgery in ischemic MR Randomized prospective
102 CABG + repair CABG No difference in mortality. Repair group had reduced cardiac dimensions and symptoms vs. CABG alone
Deja 2012 (147) 22553307
Impact of repair in ischemic SMR Randomized to medical Rx vs. surgery
104 CABG + repair CABG 53% mortality CABG, vs. 43% mortality CABG + MVR (p=NS); after adjustment CABG + MVR had better survival
CABG indicates coronary artery bypass graft; HF, heart failure; LVEF, left ventricular ejection fraction; MR, mitral regurgitation; MV, mitral valve, MVR, mitral valve repair; NS, nonsignificant; pts, patients; Rx, prescription; SMR, secondary mitral regurgitation; and, Sx, symptoms.

35 © American College of Cardiology Foundation and American Heart Association, Inc.
Data Supplement 19. Functional Tricuspid Regurgitation: Outcomes Following Tricuspid Valve Surgery (Sections 8.2.3 and 8.4.3) Study, Year Aim of Study Study Type Study Size, Details Outcomes Comments, Limitations
Dreyfus, 2005 (148) 15620928
Determine benefit of TV annuloplasty based on intraoperative measurement of TA size
Prospective, observational series 1989–2001; single surgeon
311 pts undergoing MVR for chronic severe MR. 163 pts with TA <70 mm received isolated MVR (Group 1); 148 pts with TA ≥70 mm received MVR + TVR (Group 2). 88% of pts had 0-1+ TR preoperatively. No pts in Group 1 had >2+ TR; 2 pts in Group 2 had 3+ TR.
Postoperative TR grade 2.1±1.0 Group 1 vs. 0.4±0.6 Group 2; (p<0.001). TR severity increased >2 grades in 48% of Group 1 pts vs. 2% of Group 2 pts. Progressive TR occurred independent of residual MR, LVEF, and PA pressures. No differences between groups in 10-y actuarial survival or cardiac event-free survival.
No echo core lab. Time at which postoperative echo obtained not specified. Median y of follow-up not specified. Predictors of worsening TR not reported.
Chan, 2009 (149) 19766809
Determine the effects of TR and TV repair on clinical and TTE outcomes in pts undergoing MV replacement.
Retrospective, observational, single center, 1990–2005
624 pts undergoing MV replacement. 231 with ≥2+TR; 125 received TVR, 106 did not. Mean follow-up 6.8±4.8 y.
TVR was associated with a reduction in TR grade and HF symptoms. No difference in survival between groups. Trend for worsening TR in pts with ≤1+TR but dilated TA.
Study spans 15 y Multiple annuloplasty techniques used. 22% of pts had suture annuloplasty.
Calafiore, 2009 (150) 19231373
Evaluate clinical outcomes of pts undergoing TV annuloplasty for ≥moderate TR at time of MVR for functional MR.
Retrospective, observational, single center, 1988–2003
110 pts with ≥moderate TR undergoing MVR for functional MR. 51 pts underwent TV annuloplasty (treated). 59 pts did not have TV annuloplasty (untreated). Midterm propensity score analysis.
Adjusted 5-y survival was 45.0±6.1% in untreated group and 74.5±5.1% in treated group (p=0.004). Untreated ≥moderate TR a risk factor for lower midterm survival (HR: 2.7; 95% CI: 1.3–5.4) and survival in NYHA class I or II (HR: 1.9; 95% CI: 1.1–3.4). Follow-up functional TR progression rate (3+/4+) was 5% in treated group vs. 40% in untreated group (p<0.001). The progression of functional TR grade at follow-up was a risk factor for worse survival and the possibility to be alive in NYHA class I or II.
Study span 15 y. DeVega annuloplasty in all pts. All pts had functional MR. Incomplete TTE follow-up.
Di Mauro, 2009 (4) (151) 19233670
Evaluate impact of ≥moderate TR on midterm outcomes of pts undergoing surgery for functional MR
Retrospective, observational, single center 1988–2003
165 pts with functional MR and untreated TR 102 pts with 0-1+TR 63 pts with 2-3+TR
5-y survival and NYHA class better for pts with 0-1+TR. Negative impact on survival of untreated moderate or more TR (HR: 3.1; 95% CI: 1.8–5.1; p<0.001). TR grade initially declined after MV surgery, but then progressed in pts with 2-3+ preoperative TR.
Study span 15 y. Incomplete TTE follow-up. No information on success of MV surgery. Same pt cohort as reported by Calafiore 2009.
Van de Veire, 2011 (152) 20832082
Determine if TV annuloplasty in pts with TA dilatation undergoing MVR prevents progression of TR and RV remodeling
Retrospective, observational, single center series, 2 separate cohorts: 2002 and 2004
2002: 13 pts with 3-4+ TR underwent TV annuloplasty at time of MVR 2004: 21 pts with 3-4+TR and 43 pts with TA ≥40 mm underwent TV annuloplasty at time of MVR
2002 cohort: no evidence of RV reverse remodeling; TR grade unchanged. For 23 pts without 3-4+ TR but with TA dilatation, TR grade worse and RV size larger at 2 y. 2004 cohort: RV reverse remodeling with reduction in TR grade in 43 pts with TA dilatation who underwent TV annuloplasty.
Limited clinical data. Reason for choice of these 2 observational pt cohorts not provided.
Yilmaz, 2011 (153) 21277597
Examine clinical and TTE outcomes of pts with “clinically silent” TR undergoing isolated MVR for prolapse
Retrospective, observational, single center, 1995–2006
n=699 pts with MVP Preoperative TR grade was 1-2+ in ≥80% of pts. Pts with right HF or primary TR excluded.
Overall TR grade decreased significantly at 1 y. Independent risk factors for worsening TR included female sex, preoperative AF, diabetes mellitus. In pts with <moderate preoperative TR (mean grade, 1.6 [0.49]), mean TR grade remained stable and increased only slightly after 5-y follow-up (mean, 2.0 [0.86]; p<0.01).
TA measurements not provided. All pts had MVP. Other, but not all investigators have reported that the incidence of TR after MVR may be dependent on the etiology of

36 © American College of Cardiology Foundation and American Heart Association, Inc.
Study, Year Aim of Study Study Type Study Size, Details Outcomes Comments, Limitations
In pts with at least moderate preoperative TR, mean TR grade decreased significantly from preoperative values after MVR (p<0.001 at hospital discharge, <1 y, and 1–3 y). Mean TR grade trended down at 3 and 5 y after surgery (p=0.18 after 3 y; p=0.33 after 5 y). Degree of preoperative TR was not associated with early or late mortality.
MR. Effect of recurrent TR on survival not reported.
Calafiore, 2011 (154) 21163499
Determine benefit of TV annuloplasty for TR based on TA diameter
Retrospective, observational, single center 2006–2008
298 pts with ≥1+ TR undergoing MV surgery. 167 underwent TVR, 108 with ≥moderate TR and 59 with TA >24 mm. 137 did not have TVR, 16 with ≥moderate TR and 81 with TA >24 mm.
In pts who did not undergo TVR, TA >24 mm was a risk factor for increasing TR grade during follow-up (HR: 2.4; 95% CI: 1.4–5.1; p=0.020).
DeVega annuloplasty used in all pts with TA <28 mm. Small cohort sizes.
Navia, 2012 (155) 22093694
Identify factors associated with TVR; assess safety and efficacy of TVR
Retrospective, observational, single center series 1997–2008
91(5%) of 1,724 pts with 2+ TR undergoing left-sided heart valve surgery. Propensity analysis performed for 91 matched pairs. Pts nonrandomly selected for TVR had more severe indices of RV remodeling with TV tethering.
In propensity-matched groups, prevalence of early postoperative TR grades 0 and 1 was 83% after TVR vs. 46% in the no-repair group 11% of the repair group had persistent grade 2+ TR after TVR, compared with 39% of the no-repair group. Worse TR on was present in 7% of the TVR group, vs. 15% of the no-repair group (p<0.0001). Differences in TR grade for matched pts were sustained at over 3 y. TVR did not add significant in-hospital morbidity or mortality. Long-term survival of propensity matched pts did not differ.
Multiple TVR techniques used Limited long-term outcome and TTE data. Matched pairs differed significantly.
Kim, 2012 (156) 21930721
Assess clinical and TTE outcomes of TVR in pts with mild-to-moderate TR at time of MV replacement
Retrospective, observational, single center, 1997-2008
236 pts with mild-moderate TR undergoing mechanical MV replacement for rheumatic disease. 123 pts underwent TVR. 113 pts did not undergo TVR.
Freedom from moderate-severe TR at 5 y 92.9±2.9% in repair group vs. 60.8+/16.9% in nonrepair group (p<0.001). Approximately 10% of pts with mild TR who did not have repair progressed to ≥moderate TR over 10 y. No differences between groups in mortality, need for TV reoperation, or HF. Postoperative moderate-severe TR an independent predictor of poorer event-free survival (HR: 2.90; p=0.038).
All pts had rheumatic MV disease. Groups significantly unbalanced at baseline. Limited TTE follow-up information, especially regarding MV prosthesis function, PA pressures, etc.
Benedetto 2012 (157) 22244561
Determine if TV annuloplasty in pts with TA dilatation and ≤moderate TR prevents TR progression after MV surgery
Randomized, prospective, single institution, 2008-2009
44 pts undergoing MV surgery with ≤2+ TR and TA ≥40 mm on preoperative TTE. Randomized 1:1 to TV annuloplasty with a flexible ring or no TV annuloplasty. Primary endpoint: ≥3+ TR at 1 y.
≥3+ TR at 1 y 0% in TV annuloplasty group vs. 28% in no annuloplasty group (p=0.02). Compared with no annuloplasty, TV annuloplasty resulted in significant RV reverse remodeling. Distance during 6-min walk test greater in the TV annuloplasty group (p=0.008).
Small sample size. Nonblinded endpoint assessment.
AF indicates atrial fibrillation; echo, echocardiography; HF, heart failure; LVEF, left ventricular ejection fraction; MR, mitral regurgitation; MV, mitral valve; MVP, mitral valve prolapse; MVR, mitral valve repair; NYHA, New York Heart Association; PA, pulmonary artery; pt(s), patients; RV, right ventricle; TA, tricuspid annulus; TR, tricuspid regurgitation; TTE, transthoracic echocardiography TV, tricuspid valve; and, TVR, tricuspid valve repair.

37 © American College of Cardiology Foundation and American Heart Association, Inc.
Data Supplement 20. Clinical Outcomes With Bioprosthetic and Mechanical Valves (Section 11.1.2) Author, Year Study Size Methods Patient Population
Follow-Up Outcomes Study Limitations
Inclusion Criteria Exclusion Criteria
Hammermeister 2000 (158) 11028464
575 pts undergoing isolated AVR (394) or MVR (181) at 13 VA medical centers (1977–1982)
RCT Isolated AVR or MVR. Concurrent CABG performed in 39% of AVR and 36% of MVR pts.
Women, contraindications to VKA anticoagulation, requirement for antiplatelet therapy,
valve size 19 mm AVR
or 25 mm MVR, active endocarditis.
15 y AVR, all-cause mortality at 15 y was lower for MHV vs. BHV: (66±3% [mean±SE] vs. 79±3%; p=0.02) No difference for MVR. Primary valve failure was significantly greater with a BHV vs. MHV valve, both for AVR (23±5% vs. 0±0%; p=0.0001) and MVR (44±8% vs. 5±4%; p=0.0002). Primary valve failure nearly always (93%) occurred in pts <65 y. AVR reoperation was higher after BHV vs. MHV (29±5% vs. 10±3%; p=0.004). No statistically significant difference for MVR.
Pts receiving mechanical MVR were older and had more hypertension than those with a bioprosthetic MVR.
Oxenham, 2003 (159) 12807838
541 pts undergoing MVR (261), AVR (211), or both (61) 1975–1979
RCT Mean age 53.9 (10.6) y. 56% female.
Additional valve procedures or not eligible for VKA anticoagulation.
20 y No difference in overall survival (Bjork-Shiley vs. porcine prosthesis [mean (SEM]): 25.0 (2.7)% vs. 22.6 (2.7)%, log rank test p=0.39. Combined endpoint of death and reoperation occurred in 23.5 (2.6)% with BHV vs. 6.7 (1.6)% with MHV (log rank test; p<0.0001). Major bleeding was more common in pts with MHV (40.7 [5.4]% vs. 27.9 [8.4]% after 20 y; p=0.008), with no significant difference in major embolism or endocarditis.
Older generation valve types.
Stassano 2009 (160) 19892237
310 pts undergoing AVR 1995–2003
RCT Age 55–70 y Other valve surgery. Contraindication to VKA anticoagulation
Mean 106±28 mo
No survival difference at 13 y between BHV and MHV groups. Valve failures and reoperations were more frequent in the BHV group compared with the MHV group (p=0.0001 and p=0.0003, respectively). No differences in the linearized rate of thromboembolism, bleeding, endocarditis, and MAPE between the MHV and BHV valve groups.
Power may not be adequate to detect a clinically meaningful difference at longer follow-up.
Khan 2001 (161) 11479498
Initial AVR in 1389 pts, MVR in 915 pts, 1976–2001 at
Retrospective, observational
Age 64.5±12.9 y for MHV Age 72.0±12.6 y for BHV
Homografts, combined MHV and BHV procedure, any previous
20 y Freedom from reoperation at 15 y for AVR was 67±4.8% for BHV and 99±0.5% for MVH. For MVR, freedom from reoperation was 52±5.7% for BHV and 93±3.2% for MHV.
Not prospective, not randomized. Concurrent CABG in

38 © American College of Cardiology Foundation and American Heart Association, Inc.
Author, Year Study Size Methods Patient Population
Follow-Up Outcomes Study Limitations
Inclusion Criteria Exclusion Criteria
a single medical center.
valve surgery Survival at 15 y (BHV vs. MHV, p=NS for all): AVR in pts <65 y (55±5.9 vs. 61±5.3%), AVR in pts >65 y (17±3.4 vs. 17±3.8%). MVR in pts <65 y (32±5.5 vs. 51±5.4%), MVR in pts >65 y (12±3.5 vs. 18±3.8%)
50%.
Chan 2006 (162) 16733156
3,063 pts undergoing AVR 1982–1998
Retrospective, observational
2,195 BHV and 980 MHV. Previous cardiac surgery
Average follow-ups in y for the BHV and MHV groups were 7.5±4.7% and 5.9±3.3% (p<0.001), respectively
Valve-related mortality (per pt-y): BHV 1.0% vs. MHV 0.7% Valve-related reoperation (per pt-y): BHV 1.3% vs. MHV 0.3% (p<0.001) Valve-related morbidity: BHV 0.4% vs. MHV 2.1% (p<0.001) Actual freedom from valve-related reoperation favored MHV for pts <60 y. Actual freedom from valve-related morbidity favored BHV for pts >40 y. Actual freedom from valve-related mortality was similar for BHV vs. MHV >50 y.
Not randomized. AVR only. Concomitant CABG in 43.5% of BHV pts and 26.0% of MHV pts.
Kulik 2006 (163) 16857373
659 pts age 50–65 y with initial AVR or MVR
Prospective, observational
AVR in 388 (MHV 306, BHV 48). MVR in 236 (MHV 188, BHV 48).
Enrolled only if survived perioperative period. Valve repair excluded.
Mean 5.1±4.1 y; maximum 18.3 y
Freedom from primary endpoint MAPE at 10 y (reoperation, endocarditis, major bleeding, or thromboembolism): AVR MHV 70±4.1% vs. BHV 41.0±30.3% (p=0.55) MVR MHV 53.3±8.8% vs. BHV 61.2±9.2% (p=0.34) Multivariate analysis did not identify valve type as an independent risk factor for MAPE
Not randomized. Surgeon choice of valve type. Concurrent CABG in 29%.
Ruel 2007 (164) 17846320
567 pts undergoing AVR or MVR
Retrospective, observational
Age <60 y. First heart valve operation.
N/A Mean survivor follow-up, 24.0±3.1 y
Survival in AVR: no difference between BHV vs. MHV (HR:0.95, 95% CI: 0.7–1.3); Survival in MVR: no difference between BHV or MHV (HR: 0.9, 95% CI: 0.5–1.4); Long-term survival worse in MVR than AVR (HR: 1.4, 95% CI: 1.1–1.8); Reoperation in 89% of BHV AVR and 84% of BHV MVR (older generation devices) with reoperative mortality 4.3%.
Not randomized or prospective, follow-up available in only 23% of original cohort.
van Geldorp 2009 (165) 19327512
Bioprosthetic AVR=2,860 (73%) vs. mechanical AVR=1,074 (27%)
Retrospective cohort (1982–2003) Microsimulation used to calculate age-specific pt
Bioprosthetic AVR: mean age=70 y, mean follow-up=6.1 y, CABG=47% vs. Mechanical AVR: mean age=58 y, mean follow-up=8.5 y, CABG=28%
N/A Bioprosthetic AVR: mean follow-up=6.1 y. Mechanical AVR: mean follow-up=8.5 y.
Simulated events for a 60-y man undergoing AVR, favors a BP vs. MP:
life-expectancy: 11.9 vs. 12.2 y,
event-free survival: 9.8 vs. 9.3 y,
reoperation-free: 10.5 vs. 11.9 y,
reoperation risk: 25% vs. 3%,
Methodology of microsimulation is dependent on quality of dataset, wide chronological age of prostheses.

39 © American College of Cardiology Foundation and American Heart Association, Inc.
Author, Year Study Size Methods Patient Population
Follow-Up Outcomes Study Limitations
Inclusion Criteria Exclusion Criteria
outcome after AVR
risk of bleeding: 12% vs. 41%
Badhwar 2012 (166) 22364968
172 pts undergoing isolated AVR or MVR (2003–2007)
Prospective, nonrandomized, matched pairs for BP vs. MP
Mean age 56.2±9.6 y (range, 24–72 y).
Limited 5 y survival based on comorbidity
Median follow-up 4.0 y
At a median 4-y follow-up, thromboembolism was 0.77% for MP and 0.78% for BP (p=NS) There was a survival benefit of mechanical prostheses at 7.5 y. Noninferiority to bioprosthetic AVR for bleeding and thromboembolic complications.
Prosthesis choice by surgeon, not randomized. Low INR targets (AVR: 2.0, MVR: 2.5) with home monitoring point-of-care system
Weber 2012 (167) 22341653
206 pts undergoing AVR (2000–2009)
Retrospective, with propensity matching of 103 BP to 103 MP AVR
Age <60 y. AVR with or without concurrent CABG, aortic root surgery, mitral or tricuspid valve repair.
Additional valve replacement.
Median follow-up 33±24 mo (2–120 mo)
Overall survival was worse with BP (90.3% vs. MP=98%, p=0.038; HR:0.243, 0.054–0.923 Freedom from valve related complication complications was similar: BP=54.5% vs. MP=51.6%, p=NS
Concurrent CABG in 49.9%, 14% were reoperations
AVR indicates aortic valve replacement; BHV, bioprosthetic heart valve; CABG, coronary artery bypass graft; HTN, hypertension; INR, international normalized ratio; MAPE, major adverse prosthesis-related events; MHV, mechanical heart valve; MVR, mitral valve replacement; N/A, not applicable; NS, nonsignificant; RCT, randomized controlled trial; pts, patients; VA, Veterans Affairs; and, VKA, vitamin K antagonist.

40 © American College of Cardiology Foundation and American Heart Association, Inc.
Data Supplement 21. Bridging Anticoagulation Therapy for Mechanical Heart Valves (Section 11.3.2) Author, Year Study Type Patient Population
Study Size and Comparator (N) Outcomes Study Limitations
Inclusion Criteria Exclusion Criteria
Hammerstingl 2007 (168) 17578050
Prospective, observational
Pts with MHV undergoing major surgery (n=25) or minor surgery (n=36), pacer implantation (n=21), or cardiac cath (n=34)
N/A 116 pts: MVR 31) , AVR (76) or DVR (9) Bridging with enoxaparin in all (renal function dose adjusted)
No thromboembolic (95% CI: 0–3.1%) complications. 1 major bleeding complication (0.86%; 95% CI: 0.02–4.7%). Minor bleeding in 10 pts (8.6%; 95% CI: 4.2–15.3%) at a mean of 5.4±1.4 d LMWH therapy.
Not randomized, no comparison group, relatively small study group.
Spyropoulos 2008 (169) 18805116
Observational, prospective, multicenter registry in USA, Canada
Adults undergoing elective surgery or invasive procedure with a mechanical valve on long-term VKA
Enrolled in another bridging study within 30 d.
73 with IV UFH (1,535±532 U/h) vs. 172 with SQ LMWH (76% enoxaparin 1 mg/kg bid, 13% dalteparin 100 U/kg bid, 4% tinzaparin 175 U/kg/d)
Major adverse event rates (5.5% vs. 10.3%; p=0.23) and major bleeds (4.2% vs. 8.8%; p=0.17) were similar in the LMWH and UFH groups, respectively; 1 arterial thromboembolic event occurred in each group. More LMWH-bridged pts were treated as outpts or discharged from the hospital in <24 hours (68.6% vs. 6.8%; p <0.0001). Multivariate logistic analysis found no significant differences in major bleeds and major composite adverse events when adjusting for cardiothoracic or major surgery between groups.
Not randomized, bridging therapy chosen by clinician. The LMWH group was less likely to undergo major surgery (33.7% vs. 58.9%; p=0.0002) and cardiothoracic surgery (7.6% vs. 19.2%; p=0.008), and to receive intraprocedural anticoagulants or thrombolytics (4.1% vs. 13.7%; p=0.007)
Pengo 2009 (170) 19470892
Prospective inception cohort at 22 Italian centers, 2005–2007
Adults undergoing surgical or invasive procedures that required interruption of long-term VKA therapy
Body weight <40 kg. Creatinine >2.0 mg/dL, contraindication to LMWH, need for dual antiplatelet Rx
N=189 MHV valve pts (15% of total study size of 1,262). Bridging with 70 anti-Xa U/kg/bid for high-risk pts.
Intention-to-treat analysis for the entire study population: Thromboembolic events in 5 pts (0.4%; 95% CI: 0.1–0.9), all in high-thromboembolic-risk pts Major bleeding in 15 (1.2%; 95% CI: 0.7–2.0) and minor bleeding in 53 pts (4.2%; 95% CI: 3.2–5.5). Major bleeding was associated with twice-daily LMWH (high-risk pts), but not with the bleeding risk of the procedure.
Only 15% had mechanical valves, no comparison group. Safety in pts with MHV valves has not been conclusively established

41 © American College of Cardiology Foundation and American Heart Association, Inc.
Author, Year Study Type Patient Population
Study Size and Comparator (N) Outcomes Study Limitations
Inclusion Criteria Exclusion Criteria
Daniels 2009 (171) 19232682
Retrospective cohort, 1997–2003
MHV on chronic VKA therapy undergoing invasive procedures or surgery
N/A A total of 580 procedures: 372 AVR, 136 MVR and 48 multivalvular. UFH or LMWH bridging used in high-risk pts (older AVR, any MVR, additional risk factors for TE). No bridging in isolated AVR pts.
Events at 3 mo N (%)
No Heparin
LMWH Only Any UFH
N=213 N=243 N=99
Thromboembolism 1 (0.5) 2 (0.8) 2 (3.1)
Major Bleeding 5 (2.4) 9 (3.7) 6 (6.1)
Minor Bleeding 13 (6.1) 13 (5.4) 8 (8.1)
Overall cumulative incidence of TE at 3 mo was 0.9%; all events occurred within 1 wk of the procedure. No TE events in 93 pts with isolated AVR with no bridging.
Not randomized, choice of therapy individualized based on estimated TE and bleeding risk. Most frequent procedures were GI endoscopy (19.1%), urologic procedures (14.0%), angiography or transcatheter interventions (10.5%), and orthopedic surgery (10.3%).
Bui HT 2009 (172) 19892063
Retrospective cohort study
173 pts on VKA anticoagulation for MHV (n=90) or for nonvalvular AF undergoing invasive or surgical procedures
Age <18 y, Pregnancy, Hypercoagulable condition, bioprosthetic valve
130 bridging episodes with LMWH were used to compare outcomes in MHV vs. pts with AF.
No deaths or thromboembolic events at 2 mo. Major and minor bleeding rates were similar between the MHV and AF groups (3.2% and 2.9%, 14.5% and 13.2% respectively, p=NS).
Isolated AVR in 43 (48%) of mechanical valve pts. Not randomized. Comparator group of AF may not require bridging. No sample size calculation for power of study.
Biteker 2012 (173) 22591673
Prospective cohort, single center
Consecutive pts undergoing noncardiac surgery
Bioprosthetic valves, severe liver or renal disease, contraindication to heparin
140 pts with MHV (77 AVR, 46 MVR, and 17 DVR) receiving enoxaparin 1 mg/kg bid compared to 1,200 pts with native valves (control group) receiving no anticoagulation.
Events (3 mo) N (%)
MHV with LMWH
Native valves
N=140 N=1200 p-value
Bleeding 18.6% 14.2% NS
Thromboembolism 3.6% 2% NS
Mortality 1.4% 1.3% NS
Cardiovascular events 10.8% 10.7% NS
Not randomized. Comparison group did not have valve disease. No power calculation with small number of MHV pts.
Weiss 2013 (174) 23648452
Retrospective, single-center cohort study
Consecutive pts requiring postoperative bridging therapy after cardiac surgery during a 19 mo period
N/A N=402 receiving LMWH (enoxaparin): comparison of full-dose (FD=1 mg/kg bodyweight bid) to half-dose (HD=0.5 mg/kg bid) with renal function dose adjustment.
Events (by hospital discharge) N (%)
Full dose LMWH
Low dose LVWH
N=210 N=210 p-value
Mortality 0.5% 5.5% 0.003
Thromboembolism 5% 9% 0.277
Bleeding 11% 5% 0.126
Hospital stay (d) 15.1±9.3 12.5±8.1 0.003
Not randomized, but well matched (first half of cohort received FD, second half HD) Included only 100 (25.9% of total) pts with MHV, also included AF in 83.6%.
AF indicates atrial fibrillation; AVR, aortic valve replacement; DVR, double-valve replacement; FD, dull dose; GI, gastrointestinal; HD, half dose; LMWH, low molecular weight heparin; MHV, mechanical heart valve; MVR, mitral valve replacement; N/A, not available; NS, nonsignificant; pt(s), patient(s); TE, thromboembolism; UFH, unfractionated heparin; USA, United States of America; and, VKA, vitamin K antagonist.

42 © American College of Cardiology Foundation and American Heart Association, Inc.
Data Supplement 22. Fibrinolytic Therapy for Prosthetic Valve Thrombosis (Section 11.6.2) Author, Year Study Type Patient Population Intervention vs.
Comparator (n) Outcomes Study Limitations
Inclusion Criteria Exclusion Criteria
Deviri 1991 (175) 1993782
Observational, single center, surgical treatment for PVT, 1980–1989
n=100 (32 male) aged 5 mo–82 y (median 32 y) with PVT (n=61) or pannus (n=7), or both (n=44)
N/A Only included pts undergoing surgery for PVT or pannus. AVR in 51 (48%), MVR in 49 (46%), and both in 6 (6%)
Early mortality 12.3% (n=13) Perioperative mortality higher in pts with NYHA IV (17.5%) vs. NYHA I-III (4.7%) symptoms, p<0.05 Same outcome between valve replacement vs. declotting
Older generation mechanical PHV, chart-recovered data, various diagnostic approaches.
Tong 2004 (176) 14715187
International registry of pts with suspected PVT, 1985–2001
107 pts (71 females; age 24 to 86 y) from 14 centers (6 in the U.S.) MVR=79, AVR=13, TVR=15
N/A Only included pts with suspected PVT who underwent TEE and were treated with FT
Hemodynamic success rate 85% Overall complications rate 17.8% Death in 5.6% Independent predictors of complications: 1) thrombus area >0.8cm2 (OR: 2.41 per cm2, CI: 1.12–5.19) and 2) Hx of stroke (OR: 4.55, CI: 1.35–15.380) Presentation with shock was associated with clinical failure 10.7% vs. 0%; p=0.0032
Not all pts had PHV obstruction, thrombolysis criteria not standardized. Goal of study was to assess role of TEE measurement of thrombus burden.
Roudaut 2009 (177) 19427604
Observational, nonrandomized single center over 20 y, 1978–2001
n=263 episodes in 210 pts (98% left sided valves)
Decision for surgical vs. FT made by each clinician.
Surgery=136 Fibrinolysis=127
Outcomes
Surgery FT p-value
N=136 N=127 ….
Restored valve fx 89% 70.9% <0.001
Mortality (6 y) 26% 48% 0.002
Thromboembolism 0.7% 15% <0.001
Major Comp. 11.1% 25.2% 0.05
Recurrent PVT 11% 25% 0.021
Not randomized (standard clinical practice). Use of FT decreased over study interval. Older generation valves.
Karthikeyan 2009 (178) 19738134
Randomized, controlled, single Indian center
120 pts with first episode of left sided PVT
Contraindications to FT, symptom duration >2 wk, recurrent PVT
Accelerated infusion of streptokinase vs. conventional infusion
Complete clinical response: Accelerated=38/59 (64.4%) vs. Conventional=32/60 (53.3%), HR: 1.6, 95% CI: 0.9-2.5, p=0.055. Overall success rate 59%, with lower success rate (24%) in pts with NYHA III/IV symptoms. Composite secondary outcome (death, major bleeding, embolic stroke, systemic TE): HR: 1.4%,95% CI: 0.5–3.5; p=0.50 Major bleeding: HR: 2.2, 95% CI: 0.6–7.7, p=0.24
No surgical comparison group. Low success rate with both types of therapy.
Keuleers 2011 Retrospective, n=31 PVT: Contraindications Surgery (n=18) compared Surgery: 2 (11%) perioperative deaths, Small numbers, no data on

43 © American College of Cardiology Foundation and American Heart Association, Inc.
Author, Year Study Type Patient Population Intervention vs. Comparator (n)
Outcomes Study Limitations
Inclusion Criteria Exclusion Criteria
(179) 21211605
nonrandomized, single center, 1988–2008
MVR=17 (55%), AVR=8 (26%), TVR=6 (19%).
to FT to FT (n=13) 2 (11%) recurrent PVT (follow-up 76 mo) FT: 8 (61%) with restoration of normal valve function. 4 (31%) recurrent PVT (follow-up 18 mo)
4 (31%) major complications (death, stroke, TIA, or bleeding requiring surgery)
thrombus size
Özkan 2013 (66) 23489534
Observational , single center clinical experience, 1993–2009
TEE-guided FT in 182 consecutive pts with 220 episodes of PVT in 220 different episodes (156 women; mean age, 43.2±13.06 y).
Contraindications to FT, asymptomatic PVT with normal valve hemodynamics and no TE or with, thrombus size <10 mm.
FT regimen adjusted over study duration with Groups: I–Slow streptokinase II–Rapid streptokinase III–tPA 100 mg (bolus) IV–tPA 50 mg 6 h infusion V–tPA 25 mg 6 h infusion
Outcomes N
I II III IV V p-value
16 41 12 27 124
Overall success 68.8% 85.4% 75% 81.5% 85.5% 0.46
Major nonfatal comp. 12.5% 12.2% 8.3% 11.1% 4.8% NS
Death 12.5% 2.4% 16.7% 3.7% 0% 0.01
Multivariate predictors of mortality plus major nonfatal complications: Any thrombolytic therapy regimen other than Group V and a history of stroke/TIA.
Karthikeyan 2013 (180) 23329151
Meta-analysis Published articles on left-sided PVT with at least 5 pts each treated with surgery and FT
Lack of data on primary outcome (restoration of normal valve function)
7 studies with 690 episodes of left sided PVT, 446 treated with surgery, and 244 with FT.
Outcomes
Surgery FT OR p-value
N=446 N=244
Restored valve Fx 86.5% 69.7% 2.53, 95% CI: 0.94–6.78 0.066
Death 13.5% 9% 1.95, 95% CI: 0.63–5.98 0.244
Thromboembolism 1.6% 16% 0.10, 95% CI: 0.04–0.24 <0.001
Major Bleeding 1.4% 5% 0.27, 95% CI: 0.08–0.98 0.046
Recurrent PVT 7.1% 25.4% 0.25, 95% CI: 0.08–0.74 0.013
AVR indicates aortic valve replacement; FT, fibrinolytic therapy; fx, function; Hx, history; MVR, mitral valve replacement, N/A, not available; NS, nonsignificant; NYHA, New York Heart Association; PHV, prosthetic heart valves; pts, patients; PVT, prosthetic valve thrombosis; TE, thromboembolism, TEE, transesophageal echocardiography; TIA, transient ischemic attack (stroke); TVR, tricuspid valve replacement; and, U.S., United States.

44 © American College of Cardiology Foundation and American Heart Association, Inc.
Data Supplement 23. Paravalvular Regurgitation (Section 11.8.3) Study Name,
Author, Year
Study Aim Study Type/Size
(N)
Intervention vs.
Comparator (n)
Patient Population Endpoints Adverse Events
Inclusion/Exclusion Criteria
Primary Endpoint & Results Secondary Endpoint & Results
Orszulak 1983 (181) 6860002
To report outcome with surgical reoperation for PVR
Retrospective N=105
Surgical reoperative repair of prosthetic PVR
Aortic PVR (n=75) and mitral PVR (n=29)
Early mortality for entire cohort: 5.7%. 5-y survival was 94% for aortic PVR pts and 75% for mitral PVR pts.
21 pts required multiple operations for persistent PVR. 85% of survivors at follow-up up to 14 y were NYHA I or II. Murmur of residual or recurrent PVR evident in 21% of pts.
N/A
Miller 1995 (182) 8556176
To identify clinical features that predict occurrence of PVR. Outcome after surgical repair also reported
Retrospective N=30
Surgical reoperative repair of aortic prosthetic PVR
Aortic prosthetic PVR 30-d survival=90%; 5-d survival=73%
Prosthesis replacement in 26, suture repair in 4. Trivial or no residual regurgitation in 16 of 20 with echocardiography in follow-up.
N/A
Akins 2005 (183) 16359061
To examine acute and long-term outcome of surgery for PVR
Retrospective N=136
Surgical reoperative repair of aortic or mitral prosthetic PVR
Mitral PVR in 68% Aortic PVR in 32%
Operative mortality, 6.6% Perioperative stroke, 5.1% 10-y survival, 30%
Primary repair in 48%, prosthesis replacement in 52%
N/A
Pate 2006 (184) 16969856
To describe outcome in series of pts undergoing percutaneous repair of PVR
Retrospective N=10 (10 defects)
Percutaneous repair of PVR
Mitral PVR (n=9) and aortic PVR (n=1); 9 were not surgical candidates
7 with successful procedure 3 pts died at 1 y
4 of 10 required second procedure 6 with sustained improvement in symptoms
1 retroperitoneal bleed 1 device dislodgement
Shapira 2007 (185) 11479246
To examine the feasibility and early outcome of percutaneous repair of PVR
Retrospective N=11 (13 defects)
Percutaneous repair of PVR
Mitral PVR (n=8), aortic PVR (n=1), and both aortic and mitral PVR (n=2) Estimated surgical mortality, 17.8%
10 with device deployment 6 with reduction in regurgitation 5 with NYHA improvement by 1 class
Hemolysis improved in 4, worsened in 4, and was unchanged in 2 in early follow-up 3 deaths in follow-up
N/A
Cortes 2008 (186) 18237605
To examine utility of TEE in percutaneous repair of PVR
Retrospective N=27 (27 defects)
TEE before and procedure (n=27) and at follow-up ≥1 mo (n=17)
Mechanical mitral PVR in pts at high risk for surgery
62% with procedure success TEE helped guide procedure and identified variety of complications
N/A 2 stroke 1 cardiac perforation 6 needing blood transfusion for postprocedural anemia
Ruiz 2011 (187) 22078427
To examine feasibility and efficacy of the percutaneous repair of PVR
Retrospective/ N=43 (57 defects)
Percutaneous repair of PVR
Mitral PVR (n=36), aortic PVR (n=9), and both aortic and mitral PVR (n=2)
Device deployment success in 86% of pts and 86% of leaks Survival: 92% at 6 m, 86% at 18 m
12 pts required multiple procedures Reduction in need for transfusions or EPO from 56–5% NYHA class improved by ≥1 in 28/35 pts
2 device embolizations 1 emergency surgery 1 vascular complication 1 procedural death
Sorajja 2011 To examine the feasibility and Retrospective Percutaneous repair of 78% mitral PVR, 22% aortic Device deployment in 89% Leaflet impingement in 4.3% 30-d events

45 © American College of Cardiology Foundation and American Heart Association, Inc.
Study Name,
Author, Year
Study Aim Study Type/Size
(N)
Intervention vs.
Comparator (n)
Patient Population Endpoints Adverse Events
Inclusion/Exclusion Criteria
Primary Endpoint & Results Secondary Endpoint & Results
(188) 21791673
early outcome of percutaneous repair of PVR
N=115 pts (141 defects)
PVR PVR Average STS risk score=6.9%
Mild or no residual regurgitation in 77% No procedural death
Procedure time average 147 min and decreased with case experience
Death, 1.7% Stroke, 2.6% Emergency surgery, 0.9%, Bleeding=5.2%
Sorajja 2011 (189) 22078428
To determine the long-term clinical efficacy of percutaneous repair of PVR
Retrospective N=126 (154 defects)
Percutaneous repair of PVR
79% mitral PVR, 21% aortic PVR Average STS risk score=6.7%
3-y survival, 64% HF accounted to 37% of deaths; noncardiac cause in 30%
Symptom improvement occurred only in pts with mild or no residual regurgitation Hemolytic anemia persisted in 14 of 29 pts
Survival free of death or need for cardiac surgery was 54% at 3 y Need for cardiac surgery related to degree of residual regurgitation
EPO indicates erythropoietin; HF, heart failure; N/A, not applicable; NYHA, New York Heart Association; pts, patients; PVR, paravalvular regurgitation; STS, Society of Thoracic Surgeons; and, TEE, transesophageal echocardiography.

46 © American College of Cardiology Foundation and American Heart Association, Inc.
Data Supplement 24. Surgical Outcome in Infective Endocarditis (Section 12) Author/
Year Aim of Study Study Type Study
Size (N)
Patient Population
Study Intervention Primary Endpoint Predictors of Outcome
Jault, 1997 (190) 9205176
Identify significant predictors of operative mortality, reoperation, and recurrent IEs
Retrospective single-center surgical cohort study
247 NVE alone; surgery 100%
Registration of epidemiological and microbiological features, echocardiography data, treatment strategy
Operative mortality was 7.6% (n=19). Overall survival
rate (operative mortality excluded) was 71.3% at 9 y. The probability of freedom from reoperation (operative mortality included) was 73.3±4.2% at 8 y. The rate of IE of the implanted prosthetic valve was 7%.
Increased age, cardiogenic shock at the time of operation, insidious illness, and greater thoracic ratio (>0.5) were the predominant risk factors for operative mortality; the length of antibiotic therapy appeared to have no influence. Increased age, preoperative neurologic complications,
cardiogenic shock at the time of operation, shorter duration of the illness, insidious illness before the operation, and mitral valve endocarditis were the predominant risk factors for late mortality. Risk factors for reoperation were younger age and aortic valve endocarditis.
Castillo, 2000 (191) 10768901
To determine the clinical features and long-term prognosis of IE in pts who were not drug users.
Prospective single-center case series
138 NVE 69%, PVE 31%; surgery 51%
Registration of epidemiological and microbiological features, echocardiography data, treatment strategy
Severe complications (HF, embolic phenomenon, severe valve dysfunction, abscesses, renal failure, and immunologic phenomenon) occurred in 83% of pts. 51% of pts underwent surgery during the active phase (22% was emergency surgery) Inpt mortality was 21%. Overall 10 y survival was 71%
There were no significant differences in survival depending on the type of treatment received during the hospital stay (medical vs. combined medical-surgical) in this observational study.
Alexiou, 2000 (192) 10881821
Single center experience in the surgical treatment of active culture-positive
IE and identify determinants of early and late outcome
Retrospective single-center surgical cohort study
118 NVE 70%, PVE 30%; 100% of pts underwent surgery
Registration of epidemiological and microbiological features, echocardiography data, treatment strategy
Operative mortality was 7.6% (9 pts). Endocarditis recurred in 8 (6.7%). A reoperation was required in 12 (10.2%). There were 24 late deaths, 17 of them cardiac. Actuarial freedom from recurrent endocarditis, reoperation, late cardiac death, and long-term survival at 10 y were 85.9%, 87.2%, 85.2%, and 73.1%, respectively.
Predictors of operative mortality: HF, impaired LV function. Predictors of recurrence: PVE. Predictors of late mortality: myocardial invasion, reoperation. Predictors of poor long-term survival: coagulase-negative staphylococcus, annular abscess, long ICU stay.
Wallace, 2002 (193) 12067945
To identify clinical markers available within the first 48 h of admission that are associated with poor outcome in IE
Retrospective single-center cohort study
208 NVE 68%, PVE 32%; surgery 52%
Registration of epidemiological, clinical, microbiological and other laboratory features, echocardiography data, and treatment strategy
Mortality at discharge was 18% and at 6 mo 27%. Surgery was performed in 107 (51%) pts. In-hospital mortality was not influenced by surgery (23% vs. 15% in the nonsurgical group); p=0.3 At 6 mo there was a trend towards increased mortality in the surgical group (33% vs. 20%)
Duration of illness, age, gender, site of infection, organism, and LV function did not predict outcome. Abnormal white cell count, raised creatinine, ≥2 major Duke criteria, or visible vegetation conferred poor prognosis.
Hasbun, 2003 (194)
To derive and externally validate a prognostic
Retrospective multicenter cohort study
513 Pts with left-sided NVE with current
Registration of clinical information, sociodemographic data, comorbid conditions, previous heart disease,
In the derivation and validation cohorts, the 6-mo mortality rates were 25% and 26%, respectively. In the derivation cohort, pts were classified into 4
5 baseline features were independently associated with 6 mo mortality (comorbidity [p=0.03], abnormal mental status [p=0.02], moderate-to-severe congestive HF

47 © American College of Cardiology Foundation and American Heart Association, Inc.
Author/ Year
Aim of Study Study Type Study Size (N)
Patient Population
Study Intervention Primary Endpoint Predictors of Outcome
12697795 classification system for pts with complicated left-sided native valve IE
indication of surgery in 45%`
symptoms, physical findings, blood cultures, electrocardiogram, echocardiography, type of surgery performed, and operative findings
groups with increasing risk for 6-mo mortality: 5%, 15%, 31%, and 59% (p<0.001). In the validation cohort, a similar risk among the 4 groups was observed: 7%, 19%, 32%, and 69% (p<0.001).
[p=0.01], bacterial etiology other than viridans streptococci [p<0.001 except S. aureus, p=0.004], and medical therapy without valve surgery [p=0.002])
Vikram, 2003 (195) 14693873
To determine whether valve surgery is associated with reduced mortality in pts with complicated, left-sided native valve IE
Retrospective multicenter cohort study; Propensity analysis
513 Pts with left sided NVE with current surgical intervention in 45%
Registration of clinical information, sociodemographic data, comorbid conditions, previous heart disease, symptoms, physical findings, blood cultures, ECG, echocardiography, type of surgery performed, and operative findings
After adjustment for baseline variables associated with mortality (including hospital site, comorbidity, HF, microbial etiology, immunocompromised state, abnormal mental status, and refractory infection), valve surgery remained associated with reduced mortality (adjusted HR: 0.35; 95% CI: 0.23–0.54; p<0.02). In further analyses of 218 pts matched by propensity scores, valve surgery remained associated with reduced mortality (15% vs. 28%; HR: 0.45; 95% CI: 0.23–0.86; p=0.01). After additional adjustment for variables that contribute to heterogeneity and confounding within the propensity-matched group, surgical therapy remained significantly associated with a lower mortality (HR: 0.40; 95% CI: 0.18-0.91; p=0.03). In this propensity-matched group, pts with moderate-to-severe congestive HF showed the greatest reduction in mortality with valve surgery (14% vs. 51%; HR: 0.22; 95% CI: 0.09–0.53; p=0.001).
Pts with moderate-to-severe HF showed the greatest reduction in mortality with valve surgery. Stratifying the data by congestive HF among propensity-matched pts undergoing surgery revealed that among pts with none to mild HF, valve surgery was not associated with reduced mortality compared with medical therapy (HR: 1.04; 95% CI: 0.43–2.48; p=0.93). Among propensity-matched pts with moderate-to-severe HF, valve surgery was associated with a significant reduction in mortality compared with medical therapy (HR: 0.22; 95% CI: 0.08–0.53; p=0.01).
Habib, 2005 (196) 15958370
To identify prognostic markers in 104 pts with PVE and the effects of a medical versus surgical strategy outcome in PVE
Retrospective multicenter cohort study
104 100% PVE pts; surgery 49%
Registration of epidemiological, clinical, microbiological and other laboratory features, echocardiography data, and treatment strategy
Overall, 22 (21%) died in hospital. By multivariate analysis, severe HF (OR: 5.5) and S. aureus infection (OR: 6.1) were the only independent predictors of in-hospital death. Among 82 in-hospital survivors, 21 (26%) died during a 32 mo follow-up. Mortality was not significantly different between surgical and nonsurgical pts (17% vs. 25%, respectively, not significant). Both in-hospital and long-term mortality were reduced by a surgical approach in high-risk subgroups of pts with staphylococcal PVE and complicated PVE.
Factors associated with in-hospital death were severe comorbidity (6% of survivors vs. 41% of those who died; p=0.05), renal failure (28% vs.45%, p=0.05), moderate-to-severe regurgitation (22% vs. 54%; p=0.006), staphylococcal infection (16% vs. 54%; p=0.001), severe HF (22% vs. 64%; p=0.001), and occurrence of any complication (60% vs. 90%; p=0.05).
Revilla, Describe the profile Prospective 508 NVE 66%, Brucella, Q fever, Legionella, and Of these 508 episodes, 132 (34%) were electively Univariate analysis identified renal failure, septic shock,

48 © American College of Cardiology Foundation and American Heart Association, Inc.
Author/ Year
Aim of Study Study Type Study Size (N)
Patient Population
Study Intervention Primary Endpoint Predictors of Outcome
2007 (197) 17032690
of pts with left-sided IE who underwent urgent surgery and to identify predictors of mortality
multicenter cohort study
PVE 34%; surgery studied for the present report
Mycoplasma. Persistent infection despite appropriate antibiotic treatment (31%).
operated on, and 89 pts required urgent surgery (defined as prior to completion of antibiotic course). Primary reasons for urgent surgery in these 89 pts were HF that did not respond to medication (72%) and persistent infection despite appropriate antibiotic treatment (31%). 32 pts (36%) died during their hospital stay. 32% of NVE died vs. 45% of pts with PVE. Late PVE was associated with a higher mortality than early PVE (53% vs. 36%)
Gram-negative bacteria, persistent infection, and surgery for persistent infection as factors associated with mortality. Multivariate analysis confirmed only persistent infection and renal insufficiency as factors independently associated with a poor prognosis.
Hill, 2007 (198) 17158121
Analyze epidemiology, optimal treatment, and predictors of 6-mo mortality in IE
Prospective single-center cohort study
193 NVE 66%, PVE 34%; surgery 63%
Registration of epidemiological, clinical, microbiological and other laboratory features, echocardiography data, and treatment strategy
43% included staphylococci, 26% streptococci, and 17% enterococci. At least 1 complication occurred in 79% of the episodes and 63% had surgical intervention. 6-mo mortality was 22%: 33% for staphylococci, 24% for enterococci, and 8% for streptococci. 74% of pts with a contraindication to surgery died when compared with 7% with medical treatment without a contraindication and 16% with surgical treatment.
S. aureus, contraindication to surgery (present in 50% of deaths).
Remadi, 2007 (199) 17383330
To evaluate the predictors of outcome and to establish whether early surgery is associated with reduced mortality
Prospective multicenter cohort study
116 S. aureus IE alone; NVE 83%, PVE 17%; surgery 47%
Registration of epidemiological, clinical, microbiological and other laboratory features, echocardiography data, and treatment strategy. Antibiotic treatment.
The in-hospital mortality rate was 26%, and the 36-mo survival rate was 57% Surgical group mortality was 16% vs. 34% in the medically treated group (p<0.05) In unadjusted analyses, early surgery performed in 47% of pts was associated with lower in-hospital mortality (16% vs. 34%; p=0.034) and with better 36-mo survival (77% vs. 39%; p<0.001).
Multivariate analyses identified comorbidity index, HF, severe sepsis, prosthetic valve IE, and major neurologic events as predictors of in-hospital mortality Severe sepsis and comorbidity index were predictors of overall mortality After adjustment of baseline variables related to mortality, early surgery remained associated with reduced overall mortality.
Aksoy, 2007 (200) 17205442
To better understand the impact of surgery on the long-term survival of pts with IE
Prospective single-center cohort study with propensity score matching
426 NVE 69%, PVE 19%, “other” 12%; surgery in 29%
Registration of epidemiological, clinical, microbiological and other laboratory features, echocardiography data, and treatment strategy. Pts’ propensities for surgery
The fit of the propensity model to the data was assessed using the concordance index with pts who underwent surgery matched to those who did not undergo surgery, using individual propensity scores. The following factors were statistically associated with surgical therapy: age, transfer from an outside hospital, evidence of IE on physical examination, the presence of infection with staphylococci, HF, intracardiac abscess, and hemodialysis without a chronic catheter.
Revealed that surgery was associated with decreased mortality (HR: 0.27; 95% CI: 0.13–0.55). A history of diabetes mellitus (HR: 4.81; 95% CI: 2.41–9.62), the presence of chronic intravenous catheters at the beginning of the episode (HR: 2.65; 95% CI: 1.31–5.33), and with increased mortality.
Tleyjeh, To examined the Matched 546 NVE alone; Propensity score to undergo valve Death occurred in 99 of the 417 pts (23.7%) in the After adjustment for early (operative) mortality, surgery

49 © American College of Cardiology Foundation and American Heart Association, Inc.
Author/ Year
Aim of Study Study Type Study Size (N)
Patient Population
Study Intervention Primary Endpoint Predictors of Outcome
2007 (201) 17372170
association between valve surgery and all-cause 6 mo mortality among pts with left-sided IE
propensity analysis
surgery 24% surgery was used to match pts in the surgical and nonsurgical groups. To adjust for survivor bias, the follow-up time was matched so that each pt in the nonsurgical group survived at least as long as the time to surgery in the respective surgically-treated pt. Valve surgery was used as a time-dependent covariate in different Cox models.
nonsurgical group vs. 35 deaths among the 129 pts (27.1%) in the surgical group. 18 of 35 (51%) pts in the surgical group died within 7 d of valve surgery.
was not associated with a survival benefit (adjusted HR: 0.92; 95% CI: 0.48–1.76).
Tleyjeh, 2008 (202) 18308866
To examine the association between the timing of valve surgery after IE diagnosis and 6-mo mortality among pts with left-sided IE
Retrospective single-center cohort propensity analysis
546 NVE alone; surgery 24%
The association between time from IE diagnosis to surgery and all-cause 6 mo mortality was assessed using Cox proportional hazards modeling after adjusting for the propensity score (to undergo surgery 0–11 d vs. 11 d, median time, after IE diagnosis).
The median time between IE diagnosis and surgery was 11 d (range 1–30). Using Cox proportional hazards modeling, propensity score and longer time to surgery (in d) were associated with unadjusted HRs of (1.15, 95% CI: 1.04–1.28, per 0.10 unit change; p=0.009) and (0.93; 95% CI: 0.88–0.99, per d; p=0.03), respectively. In multivariate analysis, a longer time to surgery was associated with an adjusted HR (0.97; 95% CI: 0.90–1.03). The propensity score and time from diagnosis to surgery had a correlation coefficient of r=20.63, making multicollinearity an issue in the multivariable model.
On univariate analysis, a longer time to surgery showed a significant protective effect for the outcome of mortality. After adjusting for the propensity to undergo surgery early versus late, a longer time to surgery was no longer significant, but remained in the protective direction.
Thuny, 2009 (203) 19329497
To determine whether the timing of surgery could influence mortality and morbidity in pts with complicated IE
Retrospective single-center cohort propensity analysis
291 NVE 82%, PVE 18%; surgery 100%
The time between the beginning of the appropriate antimicrobial therapy and surgery was used as a continuous variable and as a categorical variable with a cut-off of 7 d to assess the impact of timing of surgery. 2 groups of pts were formed according to the timing of surgery: the “<1st wk surgery group” and the “>1st wk surgery group”. The impact of the timing of surgery on 6 mo mortality, relapses, and PVD was analyzed using PS analyses.
1st wk surgery was associated with a trend of decrease in 6-mo mortality in the quintile of pts with the most likelihood of undergoing this early surgical management (quintile 5: 11% vs. 33%, OR: 0.18, 95% CI: 0.04 –0.83; p=0.03). Pts of this subgroup were younger, were more likely to have S. aureus infections, congestive HF, and larger vegetations. <1st wk surgery was associated with an increased number of relapses or PVD (16% vs. 4%, adjusted OR: 2.9, 95% CI: 0.99–8.40; p=0.05).
Very early surgery (<7 d) associated with improved survival (especially in highest risk pts), but greater likelihood of relapse or post-operative valve dysfunction.
Manne, 2012 (204)
Describe the morbidity and mortality associated
Retrospective single-center surgical
428 NVE 58%, PVE 42%; surgery 100%
Registration of epidemiological, clinical, microbiological and other laboratory features, echocardiography
Overall 90% of pts survived to hospital discharge. When compared with pts with NVE, pts with PVE had significantly higher 30-d mortality (13% vs. 5.6%;
Pts with IE caused by S. aureus had significantly higher hospital mortality (15% vs. 8.4%; p<0.05), 6 mo mortality (23% vs. 15%; p=0.05), and 1 y mortality (28%

50 © American College of Cardiology Foundation and American Heart Association, Inc.
Author/ Year
Aim of Study Study Type Study Size (N)
Patient Population
Study Intervention Primary Endpoint Predictors of Outcome
22206953 with surgery for IE and compare differences in characteristics, pathogens, and outcomes for pts with NVE and PVE from a large surgery-minded tertiary referral center
cohort study data, and treatment strategy p<0.01), but long-term survival was not significantly different (35% vs. 29%; p=0.19).
vs. 18%; p=0.02) compared with non–S. aureus IE.
Kang, 2012 (205) 22738096
To compare clinical outcomes of early surgery and conventional treatment in pts with IE
Prospective randomized trial at 2 centers with intention to treat analysis
76 Left-side NVE and high risk of embolism to early surgery (49%) vs. conventional treatment (51%)
Pts were randomly assigned in a 1:1 ratio to the early-surgery group or the conventional-treatment group with the use of a Web-based interactive response system. The protocol specified that pts who were assigned to the early-surgery group should undergo surgery within 48 h after randomization. Pts assigned to the conventional-treatment group were treated according to the AHA guidelines, and surgery was performed only if complications requiring urgent surgery developed during medical treatment or if symptoms persisted after the completion of antibiotic therapy.
The primary endpoint (composite of in-hospital death and embolic events that occurred within 6 wk after randomization) occurred in 1 pt (3%) in the early surgery group as compared with 9 (23%) in the conventional-treatment group (HR: 0.10; 95% CI: 0.01 –0.82; p=0.03). There was no significant difference in all-cause mortality at 6 mo in the early-surgery and conventional-treatment groups (3% and 5%, respectively; HR: 0.51; 95% CI: 0.05–5.66; p=0.59). The rate of the composite en point of death from any cause, embolic events, or recurrence of IE at 6 mo was 3% in the early-surgery group and 28% in the conventional-treatment group (HR: 0.08; 95% CI: 0.01–0.65; p=0.02).
As compared with conventional treatment, early surgery in pts with IE and large vegetations significantly reduced the composite endpoint of death from any cause and embolic events by effectively decreasing the risk of systemic embolism.
AHA indicates American Heart Association; HF, heart failure; ICU, intensive care unit, IE, infective endocarditis; NVE, native valve endocarditis; pts, patients; PVE, prosthetic valve; and S. aureus, Staphylococcus aureus. Table modified from Prendergast BD and Tornos P. Surgery for infective endocarditis: who and when? Circulation 2010, 121:1141-1152.

51 © American College of Cardiology Foundation and American Heart Association, Inc.
Data Supplement 25.Outcomes in Pregnant Women With a Mechanical Prosthetic Valve Treated with Warfarin or Unfractionated Heparin (UFH) (Section 13.3.2) Author, Year Study Aim Study Size
(N) Patient Population Study Type Type of
Anticoagulation Endpoints Summary Study
Limitations
Maternal Fetal
Chan, 2000 (206) 10647757
Systematic review anticoagulation mechanical valves
1,234 pregnancies in 976 women
All pts with mechanical prosthesis–40 articles–treated with differing anticoagulation regimens 1966–1997
Systematic review of literature
1. Warfarin throughout 2. UFH 1st trimester, then warfarin 3. UFH throughout pregnancy 4. No AC
Maternal Death 1. 1.8% 2. 4.2% 3. 15% 4. 4.7% Thromboembolic 1. 3.9% 2. 9.2% 3. 33% 4. 24%
Fetal anomalies 1. 6.4% 2. 3.4% 3. 0% 4. 3.3% Fetal wastage 1. 33% 2. 26% 3. 43% 4. 20%
Reduction of thromboembolic events for mother greatest with warfarin throughout pregnancy, worse maternal outcome with heparin throughout pregnancy. Heparin in 1st trimester reduces risk of fetopathic effects, but with increased risk of thromboembolic embolic events.
Retrospective systematic review–prior to LMWH use
Meschengieser, 1999 (207) 10377303
Single center experience anticoagulation mechanical valves
92 pregnancies in 59 women
Consecutive unselected pregnancies between 1986–1997
Observational 1. Warfarin throughout pregnancy 2. UFH 1st trimester, then warfarin 3. UFH throughout pregnancy 4. No A/C
Thromboembolic 1. 0.3 episodes/100 pt mo 2. 4.9 episodes/100 pt mo
Fetal wastage 1. 25% 2. 19%
Reduction of thromboembolic events for mother greatest with warfarin throughout pregnancy. No maternal deaths or valve thrombosis occurred in this study.
Retrospective review of small number pts–prior to LMWH use
Vitale, 1999 (208) 10334435
Single center experience anticoagulation mechanical valves
58 pregnancies in 43 pts
Consecutive unselected pregnancies between 1987–1997
Observational Warfarin throughout pregnancy: A. Dose <5 mg vs. B. Dose >5 mg
Maternal Death None Valve thrombosis 2 pts
Fetal complications A. 4 SA and 1 GR (28/32 healthy babies) vs. B: 2 WE, 18 SA, 1 SB, 1 VSD (3/25 healthy babies)
First to show that fetal complications are dose-dependent, relatively safe if dose ≤5 mg
Retrospective review–only warfarin throughout was used
Salazar, 1996 (209) 8636556
Single center experience anticoagulation mechanical valves
40 pregnancies in 37 pts
Single center experience of a prospective protocol using UFH SQ during the 1st trimester
Prospective cohort trial
All pts had SQ UFH from 6–12 wk and then during the last 2 wks of gestation
2 cases of massive thrombosis of a MVR tilting disk. 1 death from GI bleeding during warfarin.
37% spontaneous abortion 2.5% neonatal death No embryopathy
UFH is a poor anticoagulant and does not prevent massive thrombosis
Trial stopped after 2 events occurred
Sbarouni, 1994 (210) 8130033
Questionnaire to all cardiac centers in Europe
214 pregnancies in 182 pts (133 with
Questionnaire sent 1994 to all cardiac centers in Europe
Questionnaire data
N/A 6 maternal deaths (4 valve thrombosis, 1 cerebral embolism, 1 pulmonary edema)
No embryopathies in 36 women on warfarin
Heparin is neither effective or safe for both fetus and mother with increased risk thromboembolism and bleeding
No detailed information on level of anticoagulation

52 © American College of Cardiology Foundation and American Heart Association, Inc.
Author, Year Study Aim Study Size (N)
Patient Population Study Type Type of Anticoagulation
Endpoints Summary Study Limitations
Maternal Fetal
mechanical prosthesis)
13 valve thrombosis–10/13 on heparin, 12/13 MVR 8 embolic events–5/8 heparin
Fetal outcome similar for warfarin vs. heparin–22% abortion and 10% stillbirths
dose. Selection bias of those who responded to the questionnaire
Al-Lawati 2002 (211) 12142189
Single center experience anticoagulation mechanical valves from country of Oman
63 pregnancies in 21 pts
Consecutive unselected pregnancies between 1983–1997
Observational 1. Warfarin throughout 2. UFH 1st trimester, then Warfarin
Thrombosis of valves 1. None 2. 2 pts
Fetal complications 1. 74% live
babies 2. 71% live
babies Spontaneous abortion 1. 26% 2. 14% No embryopathy (2 pts with 6 mg,
rest with 5 mg)
Role of warfarin embryopathy overstated. Warfarin recommended, especially with low dose of warfarin. Valve thrombosis occurred only in pts with UFH during 1st trimester–none with warfarin.
Retrospective review—only warfarin throughout was used
Sadler 2000 (212) 10688509
Historical cohort of women with mechanical, bioprosthetic and homograft valves from New Zealand
147 pregnancies in 79 pts
All women in New Zealand who had valve replacement 1972–1992 and had subsequent pregnancy
Observational 1. Warfarin throughout pregnancy 2. Warfarin for 6 wk then subq UFH 3. Warfarin for 28 wk then subq UFH
Valve thrombosis 1. 0% 2. 20% 3. 0% Embolic events 1. 0% 2. 20% 3. 25% Hemorrhage 1. 3% 2. 30% 3. 25%
Pregnancy loss 1. 70% 2. 22% 3. 33%
Warfarin had high rate of fetal loss High rate of thromboemboli on heparin (29%) Bioprosthesis or homografts were associated with successful pregnancies
Retrospective review of small number pts—prior to LMWH use
De Santo 2005 (213) 15999035
Single center experience of all pts who had mechanical prosthesis and became pregnant
48 pregnancies in 37 pts
All women from a single center who had MVR 1975 to 2002 and had subsequent pregnancy
Observational 1. Warfarin throughout A. Dose <5 mg B. Dose >5 mg 2. 2 pts with UFH
2/2 pts with UFH had valve thrombosis No pt with warfarin had adverse cardiac or valve related event
1A. 2/23 (8.6%) adverse fetal event 1B. 17/21 (81%) adverse fetal event
If continue warfarin throughout pregnancy, there are no maternal events Adverse fetal events mainly if dose >5 mg
Retrospective review of small number pts—prior to LMWH use

53 © American College of Cardiology Foundation and American Heart Association, Inc.
AC indicates anticoagulation; GI, gastrointestinal; GR, growth retardation; LMWH, low molecular weight heparin; MVR, mitral valve replacement; N/A, not available; pts, patients; SA, spontaneous abortion; SB, still birth; SQ subcutaneous; UFH, unfractionated heparin; VSD, ventricular septal defect; and, WE, warfarin embryopathy.

54 © American College of Cardiology Foundation and American Heart Association, Inc.
Data Supplement 26. Outcomes in Pregnant Women With a Mechanical Prosthetic Valve Treated With Low Molecular Weight Heparin (LMWH) (Section 13.3.2) Author, Year Study Aim Study Size (N) Type of
Anticoagulant Patient Population Study Type Endpoints Summary Study Limitations
Maternal Fetal
Rowan 2001 (214) 11568791
Examine pregnancy outcomes in women with mechanical prosthesis treated with LMWH throughout pregnancy
14 pregnancies in 11 women
LMWH throughout pregnancy
All pts with mechanical prosthesis treated with LMWH single center—1997–1999—fixed dose LMWH
Observational One valve thrombosis 14.3% hemorrhage
9 live births 3 miscarriages 2 terminations
Can achieve successful pregnancy using LMWH throughout pregnancy, but risk of valve thrombosis
Use fixed dose LMWH with mean anti-Xa level 0.46 pre- and 0.89 post dose. Retrospective review of small number pts.
James, 2006 (215) 16966122
Examine pregnancy outcomes in women with mechanical prosthesis treated with LMWH throughout pregnancy
76 pregnancies LMWH throughout pregnancy
Medline search of 73 cases 1966–2006 and 3 of single center using LMWH throughout pregnancy
Meta-analysis 22% thrombotic events 4% maternal mortality
No congenital anomalies 8 spontaneous abortions
Use of LMWH during pregnancy associated with high risk of life threatening thrombosis
No anti X-a levels performed. Meta-analysis only
Abildgaard, 2009 (216) 19162303
Examine pregnancy outcomes in women with mechanical prosthesis treated with LMWH throughout pregnancy
12 pregnancies in 12 women
LMWH throughout pregnancy
All pts with mechanical prosthesis treated with LMWH throughout pregnancy in country Norway—1997–2008—use anti-Xa levels
Observational 1 systemic embolism and 1 valve thrombosis (both subtherapeutic doses) Pooled risk of thromboembolism 7.1% vs. prior data 25% with UFH
13 healthy babies If use anti-Xa levels, successful in 10/12 pregnancies, risk lower than UFH by retrospective comparison
Retrospective review of small number pts
Oran, 2004 (217) 15467905
Meta-analysis of pregnancy outcomes in women with mechanical prosthesis treated with differing anticoagulation regimens, including LMWH
10 reports (2 prospective) 81 pregnancies in 75 women
LMWH 1st trimester, then warfarin vs. LMWH throughout pregnancy
Medline search of studies in pts with prostheses receiving LMWH from 1989–2004
Meta-analysis 12% had thromboemboli–all MVR–all with LMWH throughout–9/10 did not have anti-Xa monitoring. Valve thrombosis 8.6%
Spontaneous abortion in 7.4% Stillbirth in 1.2% 87% live births
All thromboemboli occurred in pts with mitral prosthesis who had LMWH throughout pregnancy. Anti Xa levels were not monitored in 90% of thromboembolic events.
Meta-analysis only
McLintock, 2009 (218) 19681850
Examine pregnancy outcomes in women with mechanical prosthesis treated with differing anticoagulation regimens including LMWH
47 pregnancies in 31 women
Warfarin throughout pregnancy vs. LMWH 1st trimester, then warfarin vs. LMWH throughout pregnancy
All pts with mechanical prosthesis treated with differing anticoagulation regimens including LMWH—2 centers—1997–2008—use anti-Xa levels
Observational Thromboembolism 7 total–5 (10.6%) LMWH Antepartum bleeding 10.6% LMWH Postpartum bleeding 12.7% LMWH
96% live births with LMWH vs. 75% live births with warfarin
Poor compliance or subtherapeutic anti-Xa levels were present in all valve thrombosis on LMWH
Retrospective review of small number pts

55 © American College of Cardiology Foundation and American Heart Association, Inc.
Author, Year Study Aim Study Size (N) Type of Anticoagulant
Patient Population Study Type Endpoints Summary Study Limitations
Maternal Fetal
Yinon, 2009 (219) 19840573
Examine pregnancy outcomes in women with mechanical prosthesis treated with LMWH throughout pregnancy
23 pregnancies in 17 women
LMWH throughout pregnancy
All pts with mechanical prosthesis treated with LMWH—single center 1998–2008—use anti-Xa levels
Observational 1 (4%) maternal thrombosis died 5 (22%) pulmonary edema, arrhythmias, and endocarditis 13% postpartum hemorrhage
19 live births 2 first trimester miscarriages 2 intrauterine deaths
Even with careful monitoring of anti X-a levels thrombosis may occur, even with low risk AVR
Retrospective review of small number pts
Quinn, 2009 (220) 19880782
Examine pregnancy outcomes in women with mechanical prosthesis treated with LMWH throughout pregnancy
12 pregnancies in 11 women
LMWH throughout pregnancy
All pts with mechanical prosthesis treated with LMWH—single center—2001–2007—use anti-Xa levels
Observational 3 major bleeds 3 minor bleeds BS MVR thrombosis 1 pt (Xa level not done and later subtherapeutic)
11/12 live births Increasing dose LMWH during pregnancy necessary Only valve thrombosis occurred in pt with subtherapeutic level Xa
Retrospective review of small number pts
AVR indicates aortic valve replacement; BS, Bjork-Shiley; GI, gastrointestinal; LMWH, low molecular weight heparin; MVR, mitral valve replacement; N/A, not available; pts, patients; UFH, unfractionated heparin; and, SES, socioeconomic status.

56 © American College of Cardiology Foundation and American Heart Association, Inc.
Data Supplement 27. Outcomes With the Maze Procedure for Atrial Fibrillation in Patients With Valvular Heart Disease (Section 14.2.2) Author, Year Aim of Study Study Type Study Size (N) Study “Intervention”
Group (n) Study Comparator Group
(n) Outcomes
Prognostic Significant of AF at Time of Surgery
Eguchi et al 2005 (221) 15845559
Examine impact of preoperative AF on outcome of MV repair for 1° MR
Retrospective observational
283 pts with moderate-to-severe MR who underwent MV repair between 1991 and 2002
129 in AF Age 59±13 y 60% male
154 in NSR Age 52±14 y 67% male
5 y outcomes were better in pts in NSR vs. AF for: survival (96±2.1 vs. 87±3.2%; p=0.002) and freedom from cardiac events (96±2.0 vs. 75±4.4%; p<0.001)
Alexiou 2007 (222) 17280837
Impact of preoperative AF on early and late outcome after MV repair
Retrospective observational
349 pts undergoing MV repair for primary MR
152 (44%) in AF 197 (56%) in NSR Kaplan-Meier survival at 7 y was 75±6% for AF pts vs. 90±3% (p=0.005) for SR pts.
Ngaage 2006 (223) 17643612
Prognostic significance of preoperative AF at the time of AVR
Retrospective observational, cohort comparison
381 AVR 1993 and 2002 matched for age, gender, and LVEF
Preoperative AF (n=129) Preoperative NSR (n=252) Pts with preoperative AF had had worse late survival (RR for death=1.5; p=0.03) with 1-, 5-, and 7-y survival rates of 94%, 87%, and 50%, respectively, for those in AF vs. 98%, 90%, and 61% for pts in SR preoperatively. Pts with AF more frequently developed HF (25% vs. 10%; p=0.005) and stroke (16% vs. 5%; p=0.005). By multivariable analysis, preoperative AF was an independent predictor of late adverse cardiac and cerebrovascular events, but not late death.
Predictors of Return of Sinus Rhythm After Valve Surgery
Chua 1994 (224) 8302059
Determine frequency of reversion to NSR after MV repair among pts with preoperative AF
Retrospective, observational
323 consecutive pts who underwent surgical MV valvuloplasty for MR from 1980–1991
97 in AF before surgery 216 in NSR before surgery At late follow-up (mean 2.6 y, range 3 mo–10 y), AF was present in 5% pts with preoperative NSR, 80% pts with preoperative chronic AF, and 0% pts with preoperative recent onset AF (p<0.01)
Obadia 1997 (225) 9270633
Determine predictors for return to NSR after MVR
Retrospective, observational
191 pts undergoing surgery for MVR
Preoperative AF in 96 (50%)
Preoperative NSR in 95 (40%) The probability of return to stable NSR was 93.7% when NSR was already present before the operation and 80% when AF was intermittent or of less than 1 y duration; probability of postop NSR declined abruptly for preoperative duration of AF >1 y
Jessurun 2000 (226) 10814915
Outcome analysis of arrhythmias after MV surgery
Retrospective, observational
162 consecutive pts undergoing MV surgery between 1990 and 1993
Preoperative chronic AF in 74 (46%) and paroxysmal AF in 29 (18%)
Preoperative NSR in 59 (36%) NSR present postop in 40 of 57 (70%) pts with preop NSR. AF present postop in 58 of 68 (85%) of pts with preop chronic AF (>1 y). NSR present postop in 10 of 29 (34%) pts with preoperative paroxysmal AF.
Outcomes With Surgical Maze for AF
Deneke 2002 (227) 11922646
Efficacy of a modified maze procedure in pts with chronic AF undergoing MVR
Prospective randomized
30 consecutive pts undergoing MVR
Modified maze at time of MVR
MVR alone After 12 mo, NSR was present significantly more often in pts undergoing modified maze (cumulative rate NSR=0.800) compared to pts with MV replacement alone (0.267) (p<0.01)

57 © American College of Cardiology Foundation and American Heart Association, Inc.
Author, Year Aim of Study Study Type Study Size (N) Study “Intervention” Group (n)
Study Comparator Group (n)
Outcomes
Akpinar 2003 (228) 12895612
Assess the feasibility and effectiveness of irrigated RF modified maze procedure through a port access approach during MV surgery
Prospective randomized
67 pts with chronic AF eligible for port access MV surgery
33 irrigated RF modified Maze procedure
34 valve procedure alone 100% of pts who underwent RF modified maze were free of AF at the end of the operation (76% NSR, 24% pacemaker) compared with 41% of those who underwent MV repair alone. At 6 and 12 mo freedom from AF was 87.2 and 93.6% for those undergoing RF maze and 9.4% (p=0.0001) for those undergoing MVR alone
Jessarun 2003 (229) 12627066
Assess outcome of combining the Maze III procedure with MV surgery
Prospective. randomized (2.5:1 ratio)
35 pts with AF undergoing MVR. Mean age 64 y
Maze III in 25 MVR along in 10 Freedom from AF in the maze + MVR group was 56% at discharge and 92% at 12 mo. MVR alone group, freedom from AF was 0% at discharge and 20 at 1 y. Group differences at discharge p=0.002 and at 1 y p=0.0007.
Abreu Filho 2005 (230) 16159816
Evaluate effectiveness of maze procedure for permanent AF in pts with rheumatic MV disease
Prospective randomized
70 consecutive pts (2002−03) with rheumatic MV disease and permanent AF
MV surgery plus Maze III procedure saline-Irrigated cooled-tip RF ablation
MV surgery alone Cumulative rates of NSR were 79.4% for those undergoing maze and 26.9% for those undergoing mitral surgery alone (p=0.001). Group differences were significant at discharge (p=0.002), after 12 mo (p=0.0007).
Doukas 2005 (231) 16278360
To determine whether intraoperative RF ablation increases the long-term restoration of NSR and improves exercise capacity
Randomized, double-blind trial
97 pts referred for MV surgery with AF for at least 6 mo
MV surgery plus RF left atrial ablation
MV surgery alone At 12 mo NSR was present in 20 (44.4%) of 45 RFA pts and in 2 (4.5%) of 44 controls, RR: 9.8; 95% CI: 2.4–86.3; p<0.001
Von Oppell 2009 (232) 19233678
Evaluate the effect of maze procedure on postop AF in pts undergoing MV surgery
Prospective randomized
49 pts undergoing MV surgery with AF of more than 6 mo duration in 2004−06
MV surgery plus RF maze procedure (n=24)
MV surgery plus intensive rhythm control strategy (n=25).
At discharge, 3 and 12 mo follow-up, more pts in the maze group returned to NSR compared to control (29%, 57% and 75% vs. 20%, 43% and 39%; p=0.030).
Cheng 2010 (233) 22437354
To determine if surgical maze ablation for AF improves clinical outcomes and resource utilization
Meta-analysis 4647 Adults with persistent and permanent AF undergoing maze surgical ablation at the time of cardiac surgery
Persistent or permanent AF undergoing cardiac surgery without maze procedure
The number of pts in NSR was significantly improved at discharge in the surgical AF ablation group (68.6%) versus the surgery alone group (23.0%) in RCTs (OR: 10.1, 95% CI: 4.5-22.5) and non-RCTs (OR: 7.15, 95% CI: 3.42-14.95). Meta-analysis includes both coronary bypass and valve surgery (numbers not stated).
Long-Term Outcomes After Surgical Maze Procedure
Bando 2003 (234) 12928631
Identify risk factors for mortality and stroke after mechanical MVR
Retrospective 812 pts undergoing MVR between 1977−2001. Chronic AF present in 630 (78%)
In addition to MVR: 493 (61%) had LV appendage closure 148 (18%) had LA plication 185 (23%) had maze procedure 348 (43%) had tricuspid
Endpoints were early and late mortality and freedom from stroke
At 8 y, freedom from stroke was significantly greater in pts with MVR plus maze (99%) compared to MVR alone (89%, p<0.001) Of 72 pts with late stroke, 65 (90%) were in AF and 47 (65%) had LA appendage closure. Multivariate analysis show that late AF (OR: 3.39; 95% CI: 1.72–6.67; p=.0001) and omission of the maze procedure (OR: 3.40; 95% CI: 1.14–10.14; p=0.003) were significant risk factors for

58 © American College of Cardiology Foundation and American Heart Association, Inc.
Author, Year Aim of Study Study Type Study Size (N) Study “Intervention” Group (n)
Study Comparator Group (n)
Outcomes
annuloplasty. late stroke.
Bum Kim 2012 (235) 22456472
Evaluate long-term benefits of the maze procedure in pts with chronic AF undergoing mechanical MVR
Retrospective, observational
569 pts undergoing mechanical MVR between 1997−2010
317 with MVR plus a concomitant maze procedure
252 with MVR alone Pts who had undergone the maze procedure were at similar risks of death (HR: 1.15; 95% CI: 0.65–2.03; p=0.63) and the composite outcomes (HR: 0.82; 95% CI: 0.50–1.34; p=0.42), but a significantly lower risk of thromboembolic events (HR: 0.29; 95% CI: 0.12–0.73; p=0.008) compared with those who underwent valve replacement alone
Malaisrie 2012 (236) 22808837
Determine the impact of concomitant AF ablation in pts undergoing AVR
Retrospective, observational
124 pts (mean age 74±12 y) with pre-existing AF undergoing AVR
80 (65%) had concomitant surgical AF ablation
44 had AVR alone Postop freedom from AF when not receiving anti-arrhythmic drugs occurred in 58 pts (82%) in the ablation group, compared to 8 (36%) in the nonablation group (p<0.001)
Liu 2010 (237) 20573636
Compare pulmonary vein isolation versus maze procedure for treatment of permanent AF
Prospective randomized
99 with rheumatic heart disease and permanent AF
49 with valve surgery plus circumferential pulmonary vein isolation
50 with valve surgery plus maze procedure for AF
After one procedure, pts undergoing the maze procedure had a significantly higher freedom from atrial arrhythmias (82% vs. 55.2%, p<0.001). At 15–20 mo follow-up, cumulative rates of sinus rhythm were 71% vs. 88% (p<0.001).
1° indicates primary; AF, atrial fibrillation; AVR, aortic valve replacement; CABG, coronary artery bypass grafting; LA, left atrial; LV, left ventricle; LVEF, left ventricular ejection fraction; MR, mitral regurgitation; MV, mitral valve; MVR, mitral valve replacement; NSR, normal sinus rhythm; preop, preoperative; postop, postoperative; pts, patients; RCT, randomized clinical trial; RF, radiofrequency; RFA, radiofrequency ablation; and, SR, sinus rhythm.

59 © American College of Cardiology Foundation and American Heart Association, Inc.
Data Supplement 28. Noncardiac Surgery in Patients With Valvular Heart Disease (Section 15.3) Study Name,
Author, Year
Aim of Study Study Type Study Intervention
Group (n)
Study Comparator
Group (n)
Patient Population Endpoints Predictors of Adverse Outcomes
Study Limitations
Inclusion Criteria Exclusion Criteria
Primary Endpoint (Efficacy) and Results
Secondary Endpoint and Results
Aortic Stenosis
Agarwal 2013 (238) 23481524
Compared outcomes with noncardiac surgery in pts with moderate vs. severe AS.
Retrospective surgical and echocardiographic database
634 pts with AS; 244 with severe AS and 390 with moderate AS
2,536 controls without AS propensity matched for 6 revised cardiac risk index criteria plus age and sex.
Severe AS defined as valve area <1 cm2. Moderate AS as valve area 1.0–1.5 cm2
Emergency surgery.
Combined primary endpoint of 30-d mortality plus MI occurred in 4.9% of pts with AS vs. 2.1% in controls (p<0.001)
30-d mortality was 2.1% for pts with AS vs. 1.0% in non-AS controls (p=0.036). Post-op MI occurred in 3.0% of AS vs 1.1% of controls (p=0.001).
Predictors of adverse outcomes in AS were symptomatic severe AS, MR, coronary disease.
Some pts with AS were symptomatic. Not an RCT.
Calleja 2010 (239) 20381670
Evaluate post-op outcomes of pts with asymptomatic, severe AS
Retrospective 30 pts with asymptomatic severe AS undergoing noncardiac surgery.
60 pts with mild-moderate AS age and sex matched.
Noncardiac surgery, intermediate risk severe AS vs. mild or moderate AS=77% vs. 83%, ASA 3=63% vs. 62%, general anesthesia=73% vs. 82%.
AR >moderate, symptomatic AS.
Composite endpoint (hospital mortality, MI, HF, arrhythmia, and hypotensive requiring vasopressors) in severe AS: 10/30 (33%) vs. 14/60 (23%) in those with mild to moderate AS; p=0.06; MI: 3% in both groups; p=0.74
Hypotension AS severe: 9/30 (30%) vs. AS mild/moderate: 10/60 (17%); p=0.11.
For severe AS: Hypotension OR: 2.5, CI: 0.8–7.6; p=0.11, MI OR: 0.63, CI: 0.04–10; p=0.74.
Use of composite endpoint. Majority of pts underwent intermediate (not high) risk noncardiac surgery.
Leibowitz 2009 (240) 19287130
Outcome of pts with AS undergoing hip fracture repair
Retrospective Pts with AS (n=32)
Age-matched control (n=88)
Elderly pts >70 y, with AVA <1 cm2
N/A 30-d mortality AS=6.2%, control=6.8%
Cardiac event rate (death, ACS, pulmonary edema): AS=18.7%, control=11.8%
N/A Retrospective, 50% of anesthetics were regional techniques
Zahid 2005 (241) 16054477
Evaluate the perioperative risk of noncardiac surgery in pts with AS
Retrospective Based on National Hospital Discharge Survey
AS=5,149 AS-no=10,284 age/surgical risk matched
Noncardiac surgery (1996–2002)
Cardiac surgery The presence of AS is not a significant predictor for mortality after adjusting for all significant univariate predictor of in-hospital death.
The presence of AS increased the likelihood of AMI (3.86% in AS vs. 2.03% in controls, p<0.001): OR: 1.55, 95% CI: 1.27–1.9; p<0.001
N/A Pts with AS more likely to have concomitant CAD and CHF, controls more likely to have DM and HTN.
Torsher 1998
Outcomes of pts with AS
Retrospective Severe AS=19 N/A Noncardiac N/A In selected pts with severe AS, the risk of noncardiac
N/A
N/A Coexisting mild AR=9, moderate

60 © American College of Cardiology Foundation and American Heart Association, Inc.
Study Name,
Author, Year
Aim of Study Study Type Study Intervention
Group (n)
Study Comparator
Group (n)
Patient Population Endpoints Predictors of Adverse Outcomes
Study Limitations
Inclusion Criteria Exclusion Criteria
Primary Endpoint (Efficacy) and Results
Secondary Endpoint and Results
(242) 9485135
undergoing noncardiac surgery
surgery is acceptable: Death=2, hypotension was frequent (14 pts)
AR=4, mild MR=12, balloon aortic valvuloplasty=2
Mitral Regurgitation
Lai 2007 (243) 17383316
Perioperative outcome of pts with MR undergoing noncardiac surgery
Retrospective 84 pts with moderate-severe MR
NA Undergoing noncardiac surgery
Tracheal intubation prior to noncardiac surgery
Intraoperative course had frequent (31%) minor complications: controllably hypotension and bradycardia
Post-op complications were serious: Death=11.9%, MI=0, Vtach/fib=4.8%, pulmonary edema=23.8%
For post-op complications: AF OR: 3.058, CI: 1.02–9.14, intermediate surgical risk=5.12, CI: 1.28–20.4, low LVEF: 0.96, CI: 0.92–0.99
N/A
Aortic Regurgitation
Lai 2010 (244) 19930243
Perioperative outcome of chronic, moderate-severe AR who undergo noncardiac surgery
Retrospective (1999–2006)
Chronic, moderate-severe AR=167
Case-matched=167
Chronic moderate-severe AR
N/A Prolonged intubation and acute pulmonary edema: 16.2% vs. 5.4%; p=0.003, Death: AR=9% vs. 1.8%; p=0.008
LVEF, renal dysfunction, high surgical risk and no cardiac meds predictors of in-hospital death in pts with AR intraoperative hypotension and bradycardia were similar between groups
N/A N/A
ACS indicates acute coronary syndrome; AF, atrial fibrillation; AR, aortic regurgitation; AS, aortic stenosis; ASA, aspirin; AVA, aortic valve area; CAD, coronary artery disease; CHF, congestive heart failure; DM, diabetes mellitus; HF, heart
failure; HTN, hypertension; LV, left ventricular; LVEF, left ventricular ejection fraction; MI, myocardial infarction; MR, mitral regurgitation; N/A, not applicable; pts, patients; and, post-op, postoperative.

61 © American College of Cardiology Foundation and American Heart Association, Inc.
References
1. deFilippi CR, Willett DL, Brickner ME, et al. Usefulness of dobutamine echocardiography in distinguishing severe from nonsevere valvular aortic stenosis in patients with depressed left ventricular
function and low transvalvular gradients. Am J Cardiol. 1995;75:191-4.
2. Connolly HM, Oh JK, Orszulak TA, et al. Aortic valve replacement for aortic stenosis with severe left ventricular dysfunction. Prognostic indicators. Circulation. 1997;95:2395-400.
3. Pereira JJ, Lauer MS, Bashir M, et al. Survival after aortic valve replacement for severe aortic stenosis with low transvalvular gradients and severe left ventricular dysfunction. J Am Coll Cardiol.
2002;39:1356-63.
4. Nishimura RA, Grantham JA, Connolly HM, et al. Low-output, low-gradient aortic stenosis in patients with depressed left ventricular systolic function: the clinical utility of the dobutamine
challenge in the catheterization laboratory. Circulation. 2002;106:809-13.
5. Monin JL, Quere JP, Monchi M, et al. Low-gradient aortic stenosis: operative risk stratification and predictors for long-term outcome: a multicenter study using dobutamine stress hemodynamics.
Circulation. 2003;108:319-24.
6. Quere JP, Monin JL, Levy F, et al. Influence of preoperative left ventricular contractile reserve on postoperative ejection fraction in low-gradient aortic stenosis. Circulation. 2006;113:1738-44.
7. Blais C, Burwash IG, Mundigler G, et al. Projected valve area at normal flow rate improves the assessment of stenosis severity in patients with low-flow, low-gradient aortic stenosis: the
multicenter TOPAS (Truly or Pseudo-Severe Aortic Stenosis) study. Circulation. 2006;113:711-21.
8. Bergler-Klein J, Klaar U, Heger M, et al. Natriuretic peptides predict symptom-free survival and postoperative outcome in severe aortic stenosis. Circulation. 2004;109:2302-8.
9. Pai RG, Varadarajan P, Razzouk A. Survival benefit of aortic valve replacement in patients with severe aortic stenosis with low ejection fraction and low gradient with normal ejection fraction. Ann
Thorac Surg. 2008;86:1781-9.
10. Levy F, Laurent M, Monin JL, et al. Aortic valve replacement for low-flow/low-gradient aortic stenosis operative risk stratification and long-term outcome: a European multicenter study. J Am Coll
Cardiol. 2008;51:1466-72.
11. Clavel MA, Webb JG, Rodes-Cabau J, et al. Comparison between transcatheter and surgical prosthetic valve implantation in patients with severe aortic stenosis and reduced left ventricular ejection
fraction. Circulation. 2010;122:1928-36.
12. Tribouilloy C, Levy F, Rusinaru D, et al. Outcome after aortic valve replacement for low-flow/low-gradient aortic stenosis without contractile reserve on dobutamine stress echocardiography. J Am
Coll Cardiol. 2009;53:1865-73.
13. Gotzmann M, Lindstaedt M, Bojara W, et al. Clinical outcome of transcatheter aortic valve implantation in patients with low-flow, low gradient aortic stenosis. Catheter Cardiovasc Interv.
2012;79:693-701.
14. Fougeres E, Tribouilloy C, Monchi M, et al. Outcomes of pseudo-severe aortic stenosis under conservative treatment. Eur Heart J. 2012;33:2426-33.
15. Herrmann HC, Pibarot P, Hueter I, et al. Predictors of Mortality and Outcomes of Therapy in Low-Flow Severe Aortic Stenosis: A Placement of Aortic Transcatheter Valves (PARTNER) Trial
Analysis. Circulation. 2013;127:2316-26.
16. Otto CM, Pearlman AS, Gardner CL. Hemodynamic progression of aortic stenosis in adults assessed by Doppler echocardiography. J Am Coll Cardiol. 1989;13:545-50.
17. Roger VL, Tajik AJ, Bailey KR, et al. Progression of aortic stenosis in adults: new appraisal using Doppler echocardiography. Am Heart J. 1990;119:331-8.
18. Faggiano P, Ghizzoni G, Sorgato A, et al. Rate of progression of valvular aortic stenosis in adults. Am J Cardiol. 1992;70:229-33.
19. Peter M, Hoffmann A, Parker C, et al. Progression of aortic stenosis. Role of age and concomitant coronary artery disease. Chest. 1993;103:1715-9.
20. Brener SJ, Duffy CI, Thomas JD, et al. Progression of aortic stenosis in 394 patients: relation to changes in myocardial and mitral valve dysfunction. J Am Coll Cardiol. 1995;25:305-10.
21. Otto CM, Burwash IG, Legget ME, et al. Prospective study of asymptomatic valvular aortic stenosis. Clinical, echocardiographic, and exercise predictors of outcome. Circulation. 1997;95:2262-70.
22. Bahler RC, Desser DR, Finkelhor RS, et al. Factors leading to progression of valvular aortic stenosis. Am J Cardiol. 1999;84:1044-8.
23. Palta S, Pai AM, Gill KS, et al. New insights into the progression of aortic stenosis: implications for secondary prevention. Circulation. 2000;101:2497-502.
24. Rosenhek R, Binder T, Porenta G, et al. Predictors of outcome in severe, asymptomatic aortic stenosis. N Engl J Med. 2000;343:611-7.
25. Rosenhek R, Klaar U, Schemper M, et al. Mild and moderate aortic stenosis. Natural history and risk stratification by echocardiography. Eur Heart J. 2004;25:199-205.
26. Rossebo AB, Pedersen TR, Boman K, et al. Intensive lipid lowering with simvastatin and ezetimibe in aortic stenosis. N Engl J Med. 2008;359:1343-56.

62 © American College of Cardiology Foundation and American Heart Association, Inc.
27. Nylander E, Ekman I, Marklund T, et al. Severe aortic stenosis in elderly patients. Br Heart J. 1986;55:480-7.
28. Clyne CA, Arrighi JA, Maron BJ, et al. Systemic and left ventricular responses to exercise stress in asymptomatic patients with valvular aortic stenosis. Am J Cardiol. 1991;68:1469-76.
29. Otto CM, Pearlman AS, Kraft CD, et al. Physiologic changes with maximal exercise in asymptomatic valvular aortic stenosis assessed by Doppler echocardiography. J Am Coll Cardiol.
1992;20:1160-7.
30. Amato MC, Moffa PJ, Werner KE, et al. Treatment decision in asymptomatic aortic valve stenosis: role of exercise testing. Heart. 2001;86:381-6.
31. Alborino D, Hoffmann JL, Fournet PC, et al. Value of exercise testing to evaluate the indication for surgery in asymptomatic patients with valvular aortic stenosis. J Heart Valve Dis. 2002;11:204-9.
32. Das P, Rimington H, Chambers J. Exercise testing to stratify risk in aortic stenosis. Eur Heart J. 2005;26:1309-13.
33. Lancellotti P, Lebois F, Simon M, et al. Prognostic importance of quantitative exercise Doppler echocardiography in asymptomatic valvular aortic stenosis. Circulation. 2005;112:I377-I382.
34. Marechaux S, Hachicha Z, Bellouin A, et al. Usefulness of exercise-stress echocardiography for risk stratification of true asymptomatic patients with aortic valve stenosis. Eur Heart J.
2010;31:1390-7.
35. Rajani R, Rimington H, Chambers JB. Treadmill exercise in apparently asymptomatic patients with moderate or severe aortic stenosis: relationship between cardiac index and revealed symptoms.
Heart. 2010;96:689-95.
36. Cowell SJ, Newby DE, Prescott RJ, et al. A randomized trial of intensive lipid-lowering therapy in calcific aortic stenosis. N Engl J Med. 2005;352:2389-97.
37. Moura LM, Ramos SF, Zamorano JL, et al. Rosuvastatin affecting aortic valve endothelium to slow the progression of aortic stenosis. J Am Coll Cardiol. 2007;49:554-61.
38. Chan KL, Teo K, Dumesnil JG, et al. Effect of Lipid lowering with rosuvastatin on progression of aortic stenosis: results of the aortic stenosis progression observation: measuring effects of
rosuvastatin (ASTRONOMER) trial. Circulation. 2010;121:306-14.
39. Kelly TA, Rothbart RM, Cooper CM, et al. Comparison of outcome of asymptomatic to symptomatic patients older than 20 years of age with valvular aortic stenosis. Am J Cardiol. 1988;61:123-30.
40. Pellikka PA, Nishimura RA, Bailey KR, et al. The natural history of adults with asymptomatic, hemodynamically significant aortic stenosis. J Am Coll Cardiol. 1990;15:1012-7.
41. Kennedy KD, Nishimura RA, Holmes DR, Jr., et al. Natural history of moderate aortic stenosis. J Am Coll Cardiol. 1991;17:313-9.
42. Pellikka PA, Sarano ME, Nishimura RA, et al. Outcome of 622 adults with asymptomatic, hemodynamically significant aortic stenosis during prolonged follow-up. Circulation. 2005;111:3290-5.
43. Lancellotti P, Donal E, Magne J, et al. Risk stratification in asymptomatic moderate to severe aortic stenosis: the importance of the valvular, arterial and ventricular interplay. Heart. 2010;96:1364-
71.
44. Kang DH, Park SJ, Rim JH, et al. Early surgery versus conventional treatment in asymptomatic very severe aortic stenosis. Circulation. 2010;121:1502-9.
45. Stewart RA, Kerr AJ, Whalley GA, et al. Left ventricular systolic and diastolic function assessed by tissue Doppler imaging and outcome in asymptomatic aortic stenosis. Eur Heart J.
2010;31:2216-22.
46. Rosenhek R, Zilberszac R, Schemper M, et al. Natural history of very severe aortic stenosis. Circulation. 2010;121:151-6.
47. Jander N, Minners J, Holme I, et al. Outcome of patients with low-gradient "severe" aortic stenosis and preserved ejection fraction. Circulation. 2011;123:887-95.
48. Saito T, Muro T, Takeda H, et al. Prognostic value of aortic valve area index in asymptomatic patients with severe aortic stenosis. Am J Cardiol. 2012;110:93-7.
49. Monin JL, Lancellotti P, Monchi M, et al. Risk score for predicting outcome in patients with asymptomatic aortic stenosis. Circulation. 2009;120:69-75.
50. Rosenhek R, Baumgartner H. Aortic Stenosis. In: The Practice of Clinical Echocardiography. Elsevier/Saunders ; 2012.
51. Frank S, Johnson A, Ross J, Jr. Natural history of valvular aortic stenosis. Br Heart J. 1973;35:41-6.
52. Chizner MA, Pearle DL, deLeon AC, Jr. The natural history of aortic stenosis in adults. Am Heart J. 1980;99:419-24.
53. Lombard JT, Selzer A. Valvular aortic stenosis. A clinical and hemodynamic profile of patients. Ann Intern Med. 1987;106:292-8.
54. Turina J, Hess O, Sepulcri F, et al. Spontaneous course of aortic valve disease. Eur Heart J. 1987;8:471-83.
55. Horstkotte D, Loogen F. The natural history of aortic valve stenosis. Eur Heart J. 1988;9 Suppl E:57-64.
56. Otto CM, Pearlman AS. Doppler echocardiography in adults with symptomatic aortic stenosis. Diagnostic utility and cost-effectiveness. Arch Intern Med. 1988;148:2553-60.
57. Oh JK, Taliercio CP, Holmes DR, Jr., et al. Prediction of the severity of aortic stenosis by Doppler aortic valve area determination: prospective Doppler-catheterization correlation in 100 patients. J
Am Coll Cardiol. 1988;11:1227-34.
58. Galan A, Zoghbi WA, Quinones MA. Determination of severity of valvular aortic stenosis by Doppler echocardiography and relation of findings to clinical outcome and agreement with
hemodynamic measurements determined at cardiac catheterization. Am J Cardiol. 1991;67:1007-12.

63 © American College of Cardiology Foundation and American Heart Association, Inc.
59. Otto CM, Mickel MC, Kennedy JW, et al. Three-year outcome after balloon aortic valvuloplasty. Insights into prognosis of valvular aortic stenosis. Circulation. 1994;89:642-50.
60. Hachicha Z, Dumesnil JG, Bogaty P, et al. Paradoxical low-flow, low-gradient severe aortic stenosis despite preserved ejection fraction is associated with higher afterload and reduced survival.
Circulation. 2007;115:2856-64.
61. Tarantini G, Covolo E, Razzolini R, et al. Valve replacement for severe aortic stenosis with low transvalvular gradient and left ventricular ejection fraction exceeding 0.50. Ann Thorac Surg.
2011;91:1808-15.
62. Clavel MA, Dumesnil JG, Capoulade R, et al. Outcome of patients with aortic stenosis, small valve area, and low-flow, low-gradient despite preserved left ventricular ejection fraction. J Am Coll
Cardiol. 2012;60:1259-67.
63. Lancellotti P, Magne J, Donal E, et al. Clinical outcome in asymptomatic severe aortic stenosis: insights from the new proposed aortic stenosis grading classification. J Am Coll Cardiol.
2012;59:235-43.
64. Le VF, Freeman M, Webb J, et al. Impact of low flow on the outcome of high-risk patients undergoing transcatheter aortic valve replacement. J Am Coll Cardiol. 2013;62:782-8.
65. Mehrotra P, Jansen K, Flynn AW, et al. Differential left ventricular remodelling and longitudinal function distinguishes low flow from normal-flow preserved ejection fraction low-gradient severe
aortic stenosis. Eur Heart J. 2013;34:1906-14.
66. Ozkan M, Gunduz S, Biteker M, et al. Comparison of different TEE-guided thrombolytic regimens for prosthetic valve thrombosis: the TROIA trial. JACC Cardiovasc Imaging. 2013;6:206-16.
67. Eleid MF, Sorajja P, Michelena HI, et al. Flow-gradient patterns in severe aortic stenosis with preserved ejection fraction: clinical characteristics and predictors of survival. Circulation.
2013;128:1781-9.
68. Smith CR, Leon MB, Mack MJ, et al. Transcatheter versus surgical aortic-valve replacement in high-risk patients. N Engl J Med. 2011;364:2187-98.
69. Kodali SK, Williams MR, Smith CR, et al. Two-year outcomes after transcatheter or surgical aortic-valve replacement. N Engl J Med. 2012;366:1686-95.
70. Makkar RR, Fontana GP, Jilaihawi H, et al. Transcatheter aortic-valve replacement for inoperable severe aortic stenosis. N Engl J Med. 2012;366:1696-704.
71. Leon MB, Smith CR, Mack M, et al. Transcatheter aortic-valve implantation for aortic stenosis in patients who cannot undergo surgery. N Engl J Med. 2010;363:1597-607.
72. Bonow RO, Rosing DR, McIntosh CL, et al. The natural history of asymptomatic patients with aortic regurgitation and normal left ventricular function. Circulation. 1983;68:509-17.
73. Scognamiglio R, Fasoli G, Dalla VS. Progression of myocardial dysfunction in asymptomatic patients with severe aortic insufficiency. Clin Cardiol. 1986;9:151-6.
74. Siemienczuk D, Greenberg B, Morris C, et al. Chronic aortic insufficiency: factors associated with progression to aortic valve replacement. Ann Intern Med. 1989;110:587-92.
75. Bonow RO, Lakatos E, Maron BJ, et al. Serial long-term assessment of the natural history of asymptomatic patients with chronic aortic regurgitation and normal left ventricular systolic function.
Circulation. 1991;84:1625-35.
76. Scognamiglio R, Rahimtoola SH, Fasoli G, et al. Nifedipine in asymptomatic patients with severe aortic regurgitation and normal left ventricular function. N Engl J Med. 1994;331:689-94.
77. Tornos MP, Olona M, Permanyer-Miralda G, et al. Clinical outcome of severe asymptomatic chronic aortic regurgitation: a long-term prospective follow-up study. Am Heart J. 1995;130:333-9.
78. Ishii K, Hirota Y, Suwa M, et al. Natural history and left ventricular response in chronic aortic regurgitation. Am J Cardiol. 1996;78:357-61.
79. Borer JS, Hochreiter C, Herrold EM, et al. Prediction of indications for valve replacement among asymptomatic or minimally symptomatic patients with chronic aortic regurgitation and normal left
ventricular performance. Circulation. 1998;97:525-34.
80. Tarasoutchi F, Grinberg M, Spina GS, et al. Ten-year clinical laboratory follow-up after application of a symptom-based therapeutic strategy to patients with severe chronic aortic regurgitation of
predominant rheumatic etiology. J Am Coll Cardiol. 2003;41:1316-24.
81. Evangelista A, Tornos P, Sambola A, et al. Long-term vasodilator therapy in patients with severe aortic regurgitation. N Engl J Med. 2005;353:1342-9.
82. Detaint D, Messika-Zeitoun D, Maalouf J, et al. Quantitative echocardiographic determinants of clinical outcome in asymptomatic patients with aortic regurgitation: a prospective study. JACC
Cardiovasc Imaging. 2008;1:1-11.
83. Pizarro R, Bazzino OO, Oberti PF, et al. Prospective validation of the prognostic usefulness of B-type natriuretic peptide in asymptomatic patients with chronic severe aortic regurgitation. J Am
Coll Cardiol. 2011;58:1705-14.
84. Olsen NT, Sogaard P, Larsson HB, et al. Speckle-tracking echocardiography for predicting outcome in chronic aortic regurgitation during conservative management and after surgery. JACC
Cardiovasc Imaging. 2011;4:223-30.
85. Forman R, Firth BG, Barnard MS. Prognostic significance of preoperative left ventricular ejection fraction and valve lesion in patients with aortic valve replacement. Am J Cardiol. 1980;45:1120-5.

64 © American College of Cardiology Foundation and American Heart Association, Inc.
86. Henry WL, Bonow RO, Borer JS, et al. Observations on the optimum time for operative intervention for aortic regurgitation. I. Evaluation of the results of aortic valve replacement in symptomatic
patients. Circulation. 1980;61:471-83.
87. Cunha CL, Giuliani ER, Fuster V, et al. Preoperative M-mode echocardiography as a predictor of surgical results in chronic aortic insufficiency. J Thorac Cardiovasc Surg. 1980;79:256-65.
88. Bonow RO, Borer JS, Rosing DR, et al. Preoperative exercise capacity in symptomatic patients with aortic regurgitation as a predictor of postoperative left ventricular function and long-term
prognosis. Circulation. 1980;62:1280-90.
89. Borow KM, Green LH, Mann T, et al. End-systolic volume as a predictor of postoperative left ventricular performance in volume overload from valvular regurgitation. Am J Med. 1980;68:655-63.
90. Greves J, Rahimtoola SH, McAnulty JH, et al. Preoperative criteria predictive of late survival following valve replacement for severe aortic regurgitation. Am Heart J. 1981;101:300-8.
91. Kumpuris AG, Quinones MA, Waggoner AD, et al. Importance of preoperative hypertrophy, wall stress and end-systolic dimension as echocardiographic predictors of normalization of left
ventricular dilatation after valve replacement in chronic aortic insufficiency. Am J Cardiol. 1982;49:1091-100.
92. Gaasch WH, Carroll JD, Levine HJ, et al. Chronic aortic regurgitation: prognostic value of left ventricular end-systolic dimension and end-diastolic radius/thickness ratio. J Am Coll Cardiol.
1983;1:775-82.
93. Fioretti P, Roelandt J, Bos RJ, et al. Echocardiography in chronic aortic insufficiency. Is valve replacement too late when left ventricular end-systolic dimension reaches 55 mm? Circulation.
1983;67:216-21.
94. Stone PH, Clark RD, Goldschlager N, et al. Determinants of prognosis of patients with aortic regurgitation who undergo aortic valve replacement. J Am Coll Cardiol. 1984;3:1118-26.
95. Bonow RO, Picone AL, McIntosh CL, et al. Survival and functional results after valve replacement for aortic regurgitation from 1976 to 1983: impact of preoperative left ventricular function.
Circulation. 1985;72:1244-56.
96. Daniel WG, Hood WP, Jr., Siart A, et al. Chronic aortic regurgitation: reassessment of the prognostic value of preoperative left ventricular end-systolic dimension and fractional shortening.
Circulation. 1985;71:669-80.
97. Cormier B, Vahanian A, Luxereau P, et al. Should asymptomatic or mildly symptomatic aortic regurgitation be operated on? Z Kardiol. 1986;75 Suppl 2:141-5.
98. Sheiban I, Trevi GP, Casarotto D, et al. Aortic valve replacement in patients with aortic incompetence. Preoperative parameters influencing long-term results. Z Kardiol. 1986;75 Suppl 2:146-54.
99. Carabello BA, Williams H, Gash AK, et al. Hemodynamic predictors of outcome in patients undergoing valve replacement. Circulation. 1986;74:1309-16.
100. Taniguchi K, Nakano S, Hirose H, et al. Preoperative left ventricular function: minimal requirement for successful late results of valve replacement for aortic regurgitation. J Am Coll Cardiol.
1987;10:510-8.
101. Michel PL, Iung B, Abou JS, et al. The effect of left ventricular systolic function on long term survival in mitral and aortic regurgitation. J Heart Valve Dis. 1995;4 Suppl 2:S160-S168.
102. Klodas E, Enriquez-Sarano M, Tajik AJ, et al. Aortic regurgitation complicated by extreme left ventricular dilation: long-term outcome after surgical correction. J Am Coll Cardiol. 1996;27:670-7.
103. Klodas E, Enriquez-Sarano M, Tajik AJ, et al. Optimizing timing of surgical correction in patients with severe aortic regurgitation: role of symptoms. J Am Coll Cardiol. 1997;30:746-52.
104. Turina J, Milincic J, Seifert B, et al. Valve replacement in chronic aortic regurgitation. True predictors of survival after extended follow-up. Circulation. 1998;98:II100-II106.
105. Chaliki HP, Mohty D, Avierinos JF, et al. Outcomes after aortic valve replacement in patients with severe aortic regurgitation and markedly reduced left ventricular function. Circulation.
2002;106:2687-93.
106. Tornos P, Sambola A, Permanyer-Miralda G, et al. Long-term outcome of surgically treated aortic regurgitation: influence of guideline adherence toward early surgery. J Am Coll Cardiol.
2006;47:1012-7.
107. Bhudia SK, McCarthy PM, Kumpati GS, et al. Improved outcomes after aortic valve surgery for chronic aortic regurgitation with severe left ventricular dysfunction. J Am Coll Cardiol.
2007;49:1465-71.
108. Patel JJ, Shama D, Mitha AS, et al. Balloon valvuloplasty versus closed commissurotomy for pliable mitral stenosis: a prospective hemodynamic study. J Am Coll Cardiol. 1991;18:1318-22.
109. Turi ZG, Reyes VP, Raju BS, et al. Percutaneous balloon versus surgical closed commissurotomy for mitral stenosis. A prospective, randomized trial. Circulation. 1991;83:1179-85.
110. Arora R, Nair M, Kalra GS, et al. Immediate and long-term results of balloon and surgical closed mitral valvotomy: a randomized comparative study. Am Heart J. 1993;125:1091-4.
111. Reyes VP, Raju BS, Wynne J, et al. Percutaneous balloon valvuloplasty compared with open surgical commissurotomy for mitral stenosis. N Engl J Med. 1994;331:961-7.
112. Ben FM, Ayari M, Maatouk F, et al. Percutaneous balloon versus surgical closed and open mitral commissurotomy: seven-year follow-up results of a randomized trial. Circulation. 1998;97:245-50.
113. Cotrufo M, Renzulli A, Ismeno G, et al. Percutaneous mitral commissurotomy versus open mitral commissurotomy: a comparative study. Eur J Cardiothorac Surg. 1999;15:646-51.

65 © American College of Cardiology Foundation and American Heart Association, Inc.
114. Bonow RO, Carabello BA, Chatterjee K, et al. 2008 focused update incorporated into the ACC/AHA 2006 guidelines for the management of patients with valvular heart disease: a report of the
American College of Cardiology/American Heart Association Task Force on Practice Guidelines (Writing Committee to revise the 1998 guidelines for the management of patients with valvular
heart disease). Endorsed by the Society of Cardiovascular Anesthesiologists, Society for Cardiovascular Angiography and Interventions, and Society of Thoracic Surgeons. J Am Coll Cardiol.
2008;52:e1-142.
115. Cohen DJ, Kuntz RE, Gordon SP, et al. Predictors of long-term outcome after percutaneous balloon mitral valvuloplasty. N Engl J Med. 1992;327:1329-35.
116. Palacios IF, Tuzcu ME, Weyman AE, et al. Clinical follow-up of patients undergoing percutaneous mitral balloon valvotomy. Circulation. 1995;91:671-6.
117. Dean LS, Mickel M, Bonan R, et al. Four-year follow-up of patients undergoing percutaneous balloon mitral commissurotomy. A report from the National Heart, Lung, and Blood Institute Balloon
Valvuloplasty Registry. J Am Coll Cardiol. 1996;28:1452-7.
118. Iung B, Cormier B, Ducimetiere P, et al. Functional results 5 years after successful percutaneous mitral commissurotomy in a series of 528 patients and analysis of predictive factors. J Am Coll
Cardiol. 1996;27:407-14.
119. Cannan CR, Nishimura RA, Reeder GS, et al. Echocardiographic assessment of commissural calcium: a simple predictor of outcome after percutaneous mitral balloon valvotomy. J Am Coll
Cardiol. 1997;29:175-80.
120. Palacios IF, Sanchez PL, Harrell LC, et al. Which patients benefit from percutaneous mitral balloon valvuloplasty? Prevalvuloplasty and postvalvuloplasty variables that predict long-term outcome.
Circulation. 2002;105:1465-71.
121. Wilkins GT, Weyman AE, Abascal VM, et al. Percutaneous balloon dilatation of the mitral valve: an analysis of echocardiographic variables related to outcome and the mechanism of dilatation. Br
Heart J. 1988;60:299-308.
122. Schuler G, Peterson KL, Johnson A, et al. Temporal response of left ventricular performance to mitral valve surgery. Circulation. 1979;59:1218-31.
123. Phillips HR, Levine FH, Carter JE, et al. Mitral valve replacement for isolated mitral regurgitation: analysis of clinical course and late postoperative left ventricular ejection fraction. Am J Cardiol.
1981;48:647-54.
124. Zile MR, Gaasch WH, Carroll JD, et al. Chronic mitral regurgitation: predictive value of preoperative echocardiographic indexes of left ventricular function and wall stress. J Am Coll Cardiol.
1984;3:235-42.
125. Crawford MH, Souchek J, Oprian CA, et al. Determinants of survival and left ventricular performance after mitral valve replacement. Department of Veterans Affairs Cooperative Study on Valvular
Heart Disease. Circulation. 1990;81:1173-81.
126. Wisenbaugh T, Sinovich V, Dullabh A, et al. Six month pilot study of captopril for mildly symptomatic, severe isolated mitral and isolated aortic regurgitation. J Heart Valve Dis. 1994;3:197-204.
127. Enriquez-Sarano M, Tajik AJ, Schaff HV, et al. Echocardiographic prediction of survival after surgical correction of organic mitral regurgitation. Circulation. 1994;90:830-7.
128. Enriquez-Sarano M, Tajik AJ, Schaff HV, et al. Echocardiographic prediction of left ventricular function after correction of mitral regurgitation: results and clinical implications. J Am Coll Cardiol.
1994;24:1536-43.
129. Tribouilloy CM, Enriquez-Sarano M, Schaff HV, et al. Impact of preoperative symptoms on survival after surgical correction of organic mitral regurgitation: rationale for optimizing surgical
indications. Circulation. 1999;99:400-5.
130. Gillinov AM, Mihaljevic T, Blackstone EH, et al. Should patients with severe degenerative mitral regurgitation delay surgery until symptoms develop? Ann Thorac Surg. 2010;90:481-8.
131. Rosenhek R, Rader F, Klaar U, et al. Outcome of watchful waiting in asymptomatic severe mitral regurgitation. Circulation. 2006;113:2238-44.
132. Kang DH, Kim JH, Rim JH, et al. Comparison of early surgery versus conventional treatment in asymptomatic severe mitral regurgitation. Circulation. 2009;119:797-804.
133. Tribouilloy C, Grigioni F, Avierinos JF, et al. Survival implication of left ventricular end-systolic diameter in mitral regurgitation due to flail leaflets a long-term follow-up multicenter study. J Am
Coll Cardiol. 2009;54:1961-8.
134. Enriquez-Sarano M, Avierinos JF, Messika-Zeitoun D, et al. Quantitative determinants of the outcome of asymptomatic mitral regurgitation. N Engl J Med. 2005;352:875-83.
135. Ghoreishi M, Evans CF, deFilippi CR, et al. Pulmonary hypertension adversely affects short- and long-term survival after mitral valve operation for mitral regurgitation: implications for timing of
surgery. J Thorac Cardiovasc Surg. 2011;142:1439-52.
136. Goldman ME, Mora F, Guarino T, et al. Mitral valvuloplasty is superior to valve replacement for preservation of left ventricular function: an intraoperative two-dimensional echocardiographic
study. J Am Coll Cardiol. 1987;10:568-75.
137. David TE, Burns RJ, Bacchus CM, et al. Mitral valve replacement for mitral regurgitation with and without preservation of chordae tendineae. J Thorac Cardiovasc Surg. 1984;88:718-25.

66 © American College of Cardiology Foundation and American Heart Association, Inc.
138. Rozich JD, Carabello BA, Usher BW, et al. Mitral valve replacement with and without chordal preservation in patients with chronic mitral regurgitation. Mechanisms for differences in
postoperative ejection performance. Circulation. 1992;86:1718-26.
139. Grigioni F, Tribouilloy C, Avierinos JF, et al. Outcomes in mitral regurgitation due to flail leaflets a multicenter European study. JACC Cardiovasc Imaging. 2008;1:133-41.
140. Gillinov AM, Blackstone EH, Alaulaqi A, et al. Outcomes after repair of the anterior mitral leaflet for degenerative disease. Ann Thorac Surg. 2008;86:708-17.
141. Kang DH, Kim MJ, Kang SJ, et al. Mitral valve repair versus revascularization alone in the treatment of ischemic mitral regurgitation. Circulation. 2006;114:I499-I503.
142. Rossi A, Dini FL, Faggiano P, et al. Independent prognostic value of functional mitral regurgitation in patients with heart failure. A quantitative analysis of 1256 patients with ischaemic and non-
ischaemic dilated cardiomyopathy. Heart. 2011;97:1675-80.
143. Wu AH, Aaronson KD, Bolling SF, et al. Impact of mitral valve annuloplasty on mortality risk in patients with mitral regurgitation and left ventricular systolic dysfunction. J Am Coll Cardiol.
2005;45:381-7.
144. Mihaljevic T, Lam BK, Rajeswaran J, et al. Impact of mitral valve annuloplasty combined with revascularization in patients with functional ischemic mitral regurgitation. J Am Coll Cardiol.
2007;49:2191-201.
145. Benedetto U, Melina G, Roscitano A, et al. Does combined mitral valve surgery improve survival when compared to revascularization alone in patients with ischemic mitral regurgitation? A meta-
analysis on 2479 patients. J Cardiovasc Med (Hagerstown). 2009;10:109-14.
146. Fattouch K, Guccione F, Sampognaro R, et al. POINT: Efficacy of adding mitral valve restrictive annuloplasty to coronary artery bypass grafting in patients with moderate ischemic mitral valve
regurgitation: a randomized trial. J Thorac Cardiovasc Surg. 2009;138:278-85.
147. Deja MA, Grayburn PA, Sun B, et al. Influence of mitral regurgitation repair on survival in the surgical treatment for ischemic heart failure trial. Circulation. 2012;125:2639-48.
148. Dreyfus GD, Corbi PJ, Chan KM, et al. Secondary tricuspid regurgitation or dilatation: which should be the criteria for surgical repair? Ann Thorac Surg. 2005;79:127-32.
149. Chan V, Burwash IG, Lam BK, et al. Clinical and echocardiographic impact of functional tricuspid regurgitation repair at the time of mitral valve replacement. Ann Thorac Surg. 2009;88:1209-15.
150. Calafiore AM, Gallina S, Iaco AL, et al. Mitral valve surgery for functional mitral regurgitation: should moderate-or-more tricuspid regurgitation be treated? a propensity score analysis. Ann Thorac
Surg. 2009;87:698-703.
151. Di MM, Bivona A, Iaco AL, et al. Mitral valve surgery for functional mitral regurgitation: prognostic role of tricuspid regurgitation. Eur J Cardiothorac Surg. 2009;35:635-9.
152. Van de Veire NR, Braun J, Delgado V, et al. Tricuspid annuloplasty prevents right ventricular dilatation and progression of tricuspid regurgitation in patients with tricuspid annular dilatation
undergoing mitral valve repair. J Thorac Cardiovasc Surg. 2011;141:1431-9.
153. Yilmaz O, Suri RM, Dearani JA, et al. Functional tricuspid regurgitation at the time of mitral valve repair for degenerative leaflet prolapse: the case for a selective approach. J Thorac Cardiovasc
Surg. 2011;142:608-13.
154. Calafiore AM, Iaco AL, Romeo A, et al. Echocardiographic-based treatment of functional tricuspid regurgitation. J Thorac Cardiovasc Surg. 2011;142:308-13.
155. Navia JL, Brozzi NA, Klein AL, et al. Moderate tricuspid regurgitation with left-sided degenerative heart valve disease: to repair or not to repair? Ann Thorac Surg. 2012;93:59-67.
156. Kim JB, Yoo DG, Kim GS, et al. Mild-to-moderate functional tricuspid regurgitation in patients undergoing valve replacement for rheumatic mitral disease: the influence of tricuspid valve repair on
clinical and echocardiographic outcomes. Heart. 2012;98:24-30.
157. Benedetto U, Melina G, Angeloni E, et al. Prophylactic tricuspid annuloplasty in patients with dilated tricuspid annulus undergoing mitral valve surgery. J Thorac Cardiovasc Surg. 2012;143:632-8.
158. Hammermeister K, Sethi GK, Henderson WG, et al. Outcomes 15 years after valve replacement with a mechanical versus a bioprosthetic valve: final report of the Veterans Affairs randomized trial.
J Am Coll Cardiol. 2000;36:1152-8.
159. Oxenham H, Bloomfield P, Wheatley DJ, et al. Twenty year comparison of a Bjork-Shiley mechanical heart valve with porcine bioprostheses. Heart. 2003;89:715-21.
160. Stassano P, Di TL, Monaco M, et al. Aortic valve replacement: a prospective randomized evaluation of mechanical versus biological valves in patients ages 55 to 70 years. J Am Coll Cardiol.
2009;54:1862-8.
161. Khan SS, Trento A, DeRobertis M, et al. Twenty-year comparison of tissue and mechanical valve replacement. J Thorac Cardiovasc Surg. 2001;122:257-69.
162. Chan V, Jamieson WR, Germann E, et al. Performance of bioprostheses and mechanical prostheses assessed by composites of valve-related complications to 15 years after aortic valve replacement.
J Thorac Cardiovasc Surg. 2006;131:1267-73.
163. Kulik A, Bedard P, Lam BK, et al. Mechanical versus bioprosthetic valve replacement in middle-aged patients. Eur J Cardiothorac Surg. 2006;30:485-91.

67 © American College of Cardiology Foundation and American Heart Association, Inc.
164. Ruel M, Chan V, Bedard P, et al. Very long-term survival implications of heart valve replacement with tissue versus mechanical prostheses in adults <60 years of age. Circulation. 2007;116:I294-
I300.
165. van Geldorp MW, Eric Jamieson WR, Kappetein AP, et al. Patient outcome after aortic valve replacement with a mechanical or biological prosthesis: weighing lifetime anticoagulant-related event
risk against reoperation risk. J Thorac Cardiovasc Surg. 2009;137:881-5.
166. Badhwar V, Ofenloch JC, Rovin JD, et al. Noninferiority of closely monitored mechanical valves to bioprostheses overshadowed by early mortality benefit in younger patients. Ann Thorac Surg.
2012;93:748-53.
167. Weber A, Noureddine H, Englberger L, et al. Ten-year comparison of pericardial tissue valves versus mechanical prostheses for aortic valve replacement in patients younger than 60 years of age. J
Thorac Cardiovasc Surg. 2012;144:1075-83.
168. Hammerstingl C, Tripp C, Schmidt H, et al. Periprocedural bridging therapy with low-molecular-weight heparin in chronically anticoagulated patients with prosthetic mechanical heart valves:
experience in 116 patients from the prospective BRAVE registry. J Heart Valve Dis. 2007;16:285-92.
169. Spyropoulos AC, Turpie AG, Dunn AS, et al. Perioperative bridging therapy with unfractionated heparin or low-molecular-weight heparin in patients with mechanical prosthetic heart valves on
long-term oral anticoagulants (from the REGIMEN Registry). Am J Cardiol. 2008;102:883-9.
170. Pengo V, Cucchini U, Denas G, et al. Standardized low-molecular-weight heparin bridging regimen in outpatients on oral anticoagulants undergoing invasive procedure or surgery: an inception
cohort management study. Circulation. 2009;119:2920-7.
171. Daniels PR, McBane RD, Litin SC, et al. Peri-procedural anticoagulation management of mechanical prosthetic heart valve patients. Thromb Res. 2009;124:300-5.
172. Bui HT, Krisnaswami A, Le CU, et al. Comparison of safety of subcutaneous enoxaparin as outpatient anticoagulation bridging therapy in patients with a mechanical heart valve versus patients with
nonvalvular atrial fibrillation. Am J Cardiol. 2009;104:1429-33.
173. Biteker M, Tekkesin AI, Can MM, et al. Outcome of noncardiac and nonvascular surgery in patients with mechanical heart valves. Am J Cardiol. 2012;110:562-7.
174. Weiss A, Brose S, Ploetze K, et al. Half-dose enoxaparin vs. full-dose enoxaparin for postoperative bridging therapy in patients after cardiac surgery: Which dose regimen should be preferred? Clin
Hemorheol Microcirc. 2013.
175. Deviri E, Sareli P, Wisenbaugh T, et al. Obstruction of mechanical heart valve prostheses: clinical aspects and surgical management. J Am Coll Cardiol. 1991;17:646-50.
176. Tong AT, Roudaut R, Ozkan M, et al. Transesophageal echocardiography improves risk assessment of thrombolysis of prosthetic valve thrombosis: results of the international PRO-TEE registry. J
Am Coll Cardiol. 2004;43:77-84.
177. Roudaut R, Lafitte S, Roudaut MF, et al. Management of prosthetic heart valve obstruction: fibrinolysis versus surgery. Early results and long-term follow-up in a single-centre study of 263 cases.
Arch Cardiovasc Dis. 2009;102:269-77.
178. Karthikeyan G, Math RS, Mathew N, et al. Accelerated infusion of streptokinase for the treatment of left-sided prosthetic valve thrombosis: a randomized controlled trial. Circulation.
2009;120:1108-14.
179. Keuleers S, Herijgers P, Herregods MC, et al. Comparison of thrombolysis versus surgery as a first line therapy for prosthetic heart valve thrombosis. Am J Cardiol. 2011;107:275-9.
180. Karthikeyan G, Senguttuvan NB, Joseph J, et al. Urgent surgery compared with fibrinolytic therapy for the treatment of left-sided prosthetic heart valve thrombosis: a systematic review and meta-
analysis of observational studies. Eur Heart J. 2013.
181. Orszulak TA, Schaff HV, Danielson GK, et al. Results of reoperation for periprosthetic leakage. Ann Thorac Surg. 1983;35:584-9.
182. Miller DL, Morris JJ, Schaff HV, et al. Reoperation for aortic valve periprosthetic leakage: identification of patients at risk and results of operation. J Heart Valve Dis. 1995;4:160-5.
183. Akins CW, Bitondo JM, Hilgenberg AD, et al. Early and late results of the surgical correction of cardiac prosthetic paravalvular leaks. J Heart Valve Dis. 2005;14:792-9.
184. Pate GE, Al ZA, Chandavimol M, et al. Percutaneous closure of prosthetic paravalvular leaks: case series and review. Catheter Cardiovasc Interv. 2006;68:528-33.
185. Shapira Y, Hirsch R, Kornowski R, et al. Percutaneous closure of perivalvular leaks with Amplatzer occluders: feasibility, safety, and shortterm results. J Heart Valve Dis. 2007;16:305-13.
186. Cortes M, Garcia E, Garcia-Fernandez MA, et al. Usefulness of transesophageal echocardiography in percutaneous transcatheter repairs of paravalvular mitral regurgitation. Am J Cardiol.
2008;101:382-6.
187. Ruiz CE, Jelnin V, Kronzon I, et al. Clinical outcomes in patients undergoing percutaneous closure of periprosthetic paravalvular leaks. J Am Coll Cardiol. 2011;58:2210-7.
188. Sorajja P, Cabalka AK, Hagler DJ, et al. Percutaneous repair of paravalvular prosthetic regurgitation: acute and 30-day outcomes in 115 patients. Circ Cardiovasc Interv. 2011;4:314-21.
189. Sorajja P, Cabalka AK, Hagler DJ, et al. Long-term follow-up of percutaneous repair of paravalvular prosthetic regurgitation. J Am Coll Cardiol. 2011;58:2218-24.

68 © American College of Cardiology Foundation and American Heart Association, Inc.
190. Jault F, Gandjbakhch I, Rama A, et al. Active native valve endocarditis: determinants of operative death and late mortality. Ann Thorac Surg. 1997;63:1737-41.
191. Castillo JC, Anguita MP, Ramirez A, et al. Long term outcome of infective endocarditis in patients who were not drug addicts: a 10 year study. Heart. 2000;83:525-30.
192. Alexiou C, Langley SM, Stafford H, et al. Surgery for active culture-positive endocarditis: determinants of early and late outcome. Ann Thorac Surg. 2000;69:1448-54.
193. Wallace SM, Walton BI, Kharbanda RK, et al. Mortality from infective endocarditis: clinical predictors of outcome. Heart. 2002;88:53-60.
194. Hasbun R, Vikram HR, Barakat LA, et al. Complicated left-sided native valve endocarditis in adults: risk classification for mortality. JAMA. 2003;289:1933-40.
195. Vikram HR, Buenconsejo J, Hasbun R, et al. Impact of valve surgery on 6-month mortality in adults with complicated, left-sided native valve endocarditis: a propensity analysis. JAMA.
2003;290:3207-14.
196. Habib G, Tribouilloy C, Thuny F, et al. Prosthetic valve endocarditis: who needs surgery? A multicentre study of 104 cases. Heart. 2005;91:954-9.
197. Revilla A, Lopez J, Vilacosta I, et al. Clinical and prognostic profile of patients with infective endocarditis who need urgent surgery. Eur Heart J. 2007;28:65-71.
198. Hill EE, Herijgers P, Claus P, et al. Infective endocarditis: changing epidemiology and predictors of 6-month mortality: a prospective cohort study. Eur Heart J. 2007;28:196-203.
199. Remadi JP, Habib G, Nadji G, et al. Predictors of death and impact of surgery in Staphylococcus aureus infective endocarditis. Ann Thorac Surg. 2007;83:1295-302.
200. Aksoy O, Sexton DJ, Wang A, et al. Early surgery in patients with infective endocarditis: a propensity score analysis. Clin Infect Dis. 2007;44:364-72.
201. Tleyjeh IM, Ghomrawi HM, Steckelberg JM, et al. The impact of valve surgery on 6-month mortality in left-sided infective endocarditis. Circulation. 2007;115:1721-8.
202. Tleyjeh IM, Steckelberg JM, Georgescu G, et al. The association between the timing of valve surgery and 6-month mortality in left-sided infective endocarditis. Heart. 2008;94:892-6.
203. Thuny F, Beurtheret S, Mancini J, et al. The timing of surgery influences mortality and morbidity in adults with severe complicated infective endocarditis: a propensity analysis. Eur Heart J.
2011;32:2027-33.
204. Manne MB, Shrestha NK, Lytle BW, et al. Outcomes after surgical treatment of native and prosthetic valve infective endocarditis. Ann Thorac Surg. 2012;93:489-93.
205. Kang DH, Kim YJ, Kim SH, et al. Early surgery versus conventional treatment for infective endocarditis. N Engl J Med. 2012;366:2466-73.
206. Chan WS, Anand S, Ginsberg JS. Anticoagulation of pregnant women with mechanical heart valves: a systematic review of the literature. Arch Intern Med. 2000;160:191-6.
207. Meschengieser SS, Fondevila CG, Santarelli MT, et al. Anticoagulation in pregnant women with mechanical heart valve prostheses. Heart. 1999;82:23-6.
208. Vitale N, De FM, De Santo LS, et al. Dose-dependent fetal complications of warfarin in pregnant women with mechanical heart valves. J Am Coll Cardiol. 1999;33:1637-41.
209. Salazar E, Izaguirre R, Verdejo J, et al. Failure of adjusted doses of subcutaneous heparin to prevent thromboembolic phenomena in pregnant patients with mechanical cardiac valve prostheses. J
Am Coll Cardiol. 1996;27:1698-703.
210. Sbarouni E, Oakley CM. Outcome of pregnancy in women with valve prostheses. Br Heart J. 1994;71:196-201.
211. Al-Lawati AA, Venkitraman M, Al-Delaime T, et al. Pregnancy and mechanical heart valves replacement; dilemma of anticoagulation. Eur J Cardiothorac Surg. 2002;22:223-7.
212. Sadler L, McCowan L, White H, et al. Pregnancy outcomes and cardiac complications in women with mechanical, bioprosthetic and homograft valves. BJOG. 2000;107:245-53.
213. De Santo LS, Romano G, Della CA, et al. Mitral mechanical replacement in young rheumatic women: analysis of long-term survival, valve-related complications, and pregnancy outcomes over a
3707-patient-year follow-up. J Thorac Cardiovasc Surg. 2005;130:13-9.
214. Rowan JA, McCowan LM, Raudkivi PJ, et al. Enoxaparin treatment in women with mechanical heart valves during pregnancy. Am J Obstet Gynecol. 2001;185:633-7.
215. James AH, Brancazio LR, Gehrig TR, et al. Low-molecular-weight heparin for thromboprophylaxis in pregnant women with mechanical heart valves. J Matern Fetal Neonatal Med. 2006;19:543-9.
216. Abildgaard U, Sandset PM, Hammerstrom J, et al. Management of pregnant women with mechanical heart valve prosthesis: thromboprophylaxis with low molecular weight heparin. Thromb Res.
2009;124:262-7.
217. Oran B, Lee-Parritz A, Ansell J. Low molecular weight heparin for the prophylaxis of thromboembolism in women with prosthetic mechanical heart valves during pregnancy. Thromb Haemost.
2004;92:747-51.
218. McLintock C, McCowan LM, North RA. Maternal complications and pregnancy outcome in women with mechanical prosthetic heart valves treated with enoxaparin. BJOG. 2009;116:1585-92.
219. Yinon Y, Siu SC, Warshafsky C, et al. Use of low molecular weight heparin in pregnant women with mechanical heart valves. Am J Cardiol. 2009;104:1259-63.
220. Quinn J, Von KK, Brooks R, et al. Use of high intensity adjusted dose low molecular weight heparin in women with mechanical heart valves during pregnancy: a single-center experience.
Haematologica. 2009;94:1608-12.
221. Eguchi K, Ohtaki E, Matsumura T, et al. Pre-operative atrial fibrillation as the key determinant of outcome of mitral valve repair for degenerative mitral regurgitation. Eur Heart J. 2005;26:1866-72.

69 © American College of Cardiology Foundation and American Heart Association, Inc.
222. Alexiou C, Doukas G, Oc M, et al. The effect of preoperative atrial fibrillation on survival following mitral valve repair for degenerative mitral regurgitation. Eur J Cardiothorac Surg. 2007;31:586-
91.
223. Ngaage DL, Schaff HV, Mullany CJ, et al. Influence of preoperative atrial fibrillation on late results of mitral repair: is concomitant ablation justified? Ann Thorac Surg. 2007;84:434-42.
224. Chua YL, Schaff HV, Orszulak TA, et al. Outcome of mitral valve repair in patients with preoperative atrial fibrillation. Should the maze procedure be combined with mitral valvuloplasty? J Thorac
Cardiovasc Surg. 1994;107:408-15.
225. Obadia JF, el FM, Bastien OH, et al. Outcome of atrial fibrillation after mitral valve repair. J Thorac Cardiovasc Surg. 1997;114:179-85.
226. Jessurun ER, van Hemel NM, Kelder JC, et al. Mitral valve surgery and atrial fibrillation: is atrial fibrillation surgery also needed? Eur J Cardiothorac Surg. 2000;17:530-7.
227. Deneke T, Khargi K, Grewe PH, et al. Efficacy of an additional MAZE procedure using cooled-tip radiofrequency ablation in patients with chronic atrial fibrillation and mitral valve disease. A
randomized, prospective trial. Eur Heart J. 2002;23:558-66.
228. Akpinar B, Guden M, Sagbas E, et al. Combined radiofrequency modified maze and mitral valve procedure through a port access approach: early and mid-term results. Eur J Cardiothorac Surg.
2003;24:223-30.
229. Jessurun ER, van Hemel NM, Defauw JJ, et al. A randomized study of combining maze surgery for atrial fibrillation with mitral valve surgery. J Cardiovasc Surg (Torino ). 2003;44:9-18.
230. Abreu Filho CA, Lisboa LA, Dallan LA, et al. Effectiveness of the maze procedure using cooled-tip radiofrequency ablation in patients with permanent atrial fibrillation and rheumatic mitral valve
disease. Circulation. 2005;112:I20-I25.
231. Doukas G, Samani NJ, Alexiou C, et al. Left atrial radiofrequency ablation during mitral valve surgery for continuous atrial fibrillation: a randomized controlled trial. JAMA. 2005;294:2323-9.
232. Von Oppell UO, Masani N, O'Callaghan P, et al. Mitral valve surgery plus concomitant atrial fibrillation ablation is superior to mitral valve surgery alone with an intensive rhythm control strategy.
Eur J Cardiothorac Surg. 2009;35:641-50.
233. Cheng DC, Ad N, Martin J, et al. Surgical Ablation for Atrial Fibrillation in Cardiac Surgery: A Meta-Analysis and Systematic Review. Innovations (Phila ). 2010;5:84-96.
234. Bando K, Kobayashi J, Hirata M, et al. Early and late stroke after mitral valve replacement with a mechanical prosthesis: risk factor analysis of a 24-year experience. J Thorac Cardiovasc Surg.
2003;126:358-64.
235. Bum KJ, Suk MJ, Yun SC, et al. Long-term outcomes of mechanical valve replacement in patients with atrial fibrillation: impact of the maze procedure. Circulation. 2012;125:2071-80.
236. Malaisrie SC, Lee R, Kruse J, et al. Atrial fibrillation ablation in patients undergoing aortic valve replacement. J Heart Valve Dis. 2012;21:350-7.
237. Liu X, Tan HW, Wang XH, et al. Efficacy of catheter ablation and surgical CryoMaze procedure in patients with long-lasting persistent atrial fibrillation and rheumatic heart disease: a randomized
trial. Eur Heart J. 2010;31:2633-41.
238. Agarwal S, Rajamanickam A, Bajaj NS, et al. Impact of aortic stenosis on postoperative outcomes after noncardiac surgeries. Circ Cardiovasc Qual Outcomes. 2013;6:193-200.
239. Calleja AM, Dommaraju S, Gaddam R, et al. Cardiac risk in patients aged >75 years with asymptomatic, severe aortic stenosis undergoing noncardiac surgery. Am J Cardiol. 2010;105:1159-63.
240. Leibowitz D, Rivkin G, Schiffman J, et al. Effect of severe aortic stenosis on the outcome in elderly patients undergoing repair of hip fracture. Gerontology. 2009;55:303-6.
241. Zahid M, Sonel AF, Saba S, et al. Perioperative risk of noncardiac surgery associated with aortic stenosis. Am J Cardiol. 2005;96:436-8.
242. Torsher LC, Shub C, Rettke SR, et al. Risk of patients with severe aortic stenosis undergoing noncardiac surgery. Am J Cardiol. 1998;81:448-52.
243. Lai HC, Lai HC, Lee WL, et al. Mitral regurgitation complicates postoperative outcome of noncardiac surgery. Am Heart J. 2007;153:712-7.
244. Lai HC, Lai HC, Lee WL, et al. Impact of chronic advanced aortic regurgitation on the perioperative outcome of noncardiac surgery. Acta Anaesthesiol Scand. 2010;54:580-8.