2014 uk greenhouse gas emissions, final figures supply ... the latest uk projections1 show that the...
TRANSCRIPT
2014 UK Greenhouse Gas Emissions, Final Figures
Statistical release
2nd February 2016
2
© Crown copyright 2016
URN [16D/006]
You may re-use this information (not including logos) free of charge in any format or medium, under the terms of the Open Government Licence.
To view this licence, visit www.nationalarchives.gov.uk/doc/open-government-licence/ or write to the Information Policy Team, The National Archives, Kew, London TW9 4DU, or email: [email protected].
Any enquiries regarding this publication should be sent to us at: [email protected].
The responsible statistician for this publication is Laura Bates.
Contact telephone: 0300 068 5471.
This document is also available from our website at: https://www.gov.uk/government/publications/final-uk-emissions-estimates
3
Contents
Executive summary .................................................................................................................. 4
Introduction ............................................................................................................................... 6
UK performance against emissions reduction targets .............................................................. 7
Kyoto Protocol target ............................................................................................................ 7
The Climate Change Act 2008 .............................................................................................. 8
EU Effort Sharing Decision ................................................................................................... 9
European Union Emissions Trading System ....................................................................... 10
2014 Emissions ...................................................................................................................... 11
Emissions by sector................................................................................................................ 14
Energy supply ..................................................................................................................... 14
Transport ............................................................................................................................ 16
Business ............................................................................................................................. 18
Residential .......................................................................................................................... 19
Agriculture ........................................................................................................................... 20
Waste management ............................................................................................................ 22
Industrial process ................................................................................................................ 23
Public sector ....................................................................................................................... 24
Land Use, Land Use Change and Forestry (LULUCF) ....................................................... 25
Emissions from UK-based international aviation and shipping bunkers ................................. 26
Revisions from provisional estimates of greenhouse gas emissions ...................................... 28
Revisions to the UK’s Greenhouse Gas Inventory ................................................................. 29
Estimating emissions on a temperature adjusted basis .......................................................... 31
Background Information ......................................................................................................... 32
Coverage of emissions reporting ........................................................................................ 32
Emissions Trading .............................................................................................................. 33
Future updates to emissions estimates ............................................................................... 34
Further information and feedback ....................................................................................... 34
Notes for Editors ................................................................................................................. 34
4
Executive summary
This publication provides the latest estimates of UK greenhouse gas emissions by source only from 1990 to 2014.
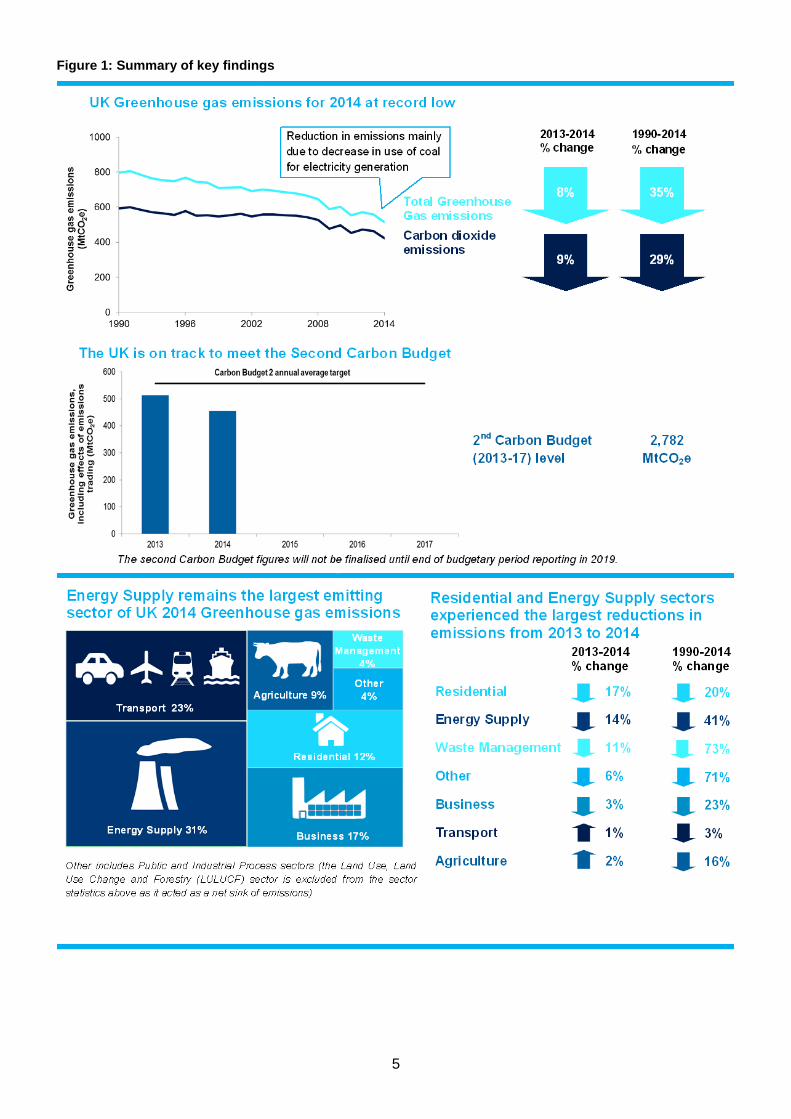
In 2014, UK emissions of the basket of seven greenhouse gases covered by the Kyoto Protocol were estimated to be 514.4 million tonnes carbon dioxide equivalent (MtCO2e). This was 7.7 percent lower than the 2013 figure of 557.3 million tonnes.
Between 2013 and 2014, the largest decreases came from the energy supply sector, down 13.6 percent (25.7 MtCO2e) due to a decrease in the use of coal for electricity generation; and the residential sector, down by 17.0 percent (13.1 MtCO2e) due to a reduction in use of natural gas for space heating. Demand for heating was lower in 2014 due to the temperature being 1.2 degrees Celsius warmer on average than 2013.
Carbon dioxide (CO2) is the main greenhouse gas, accounting for 82 percent of total UK greenhouse gas emissions in 2014. In 2014, UK net emissions of carbon dioxide were estimated to be 422.0 million tonnes (Mt). This was around 8.9 percent lower than the 2013 figure of 463.3 Mt. Around half of this decrease was due to 2014 being a warmer year than 2013.
For the purposes of carbon budgets reporting, UK greenhouse gas emissions in 2014 were 455.6 MtCO2e which is 100.8 MtCO2e below the average annual emissions required to meet the second carbon budget (2013-2017).
All the sectoral breakdowns included in this statistical release are based on the source of the emissions, as opposed to where the end-user activity occurred. Emissions related to electricity generation are therefore attributed to power stations, the source of these emissions, rather than homes and businesses where electricity is used.
Note that as part of this release the 1990-2013 emissions figures have been revised since the previous publication in February 2015, to incorporate methodological improvements and new data. Details of these revisions can be found later in this statistical release.
5
Figure 1: Summary of key findings
6
Introduction
This publication provides estimates of UK greenhouse gas (GHG) emissions by source sector from 1990-2014. These figures are used as the basis for reporting against UK greenhouse gas emissions reduction targets, and provide information for users on the drivers of emissions trends since 1990. The geographic coverage of this report has changed from UK and Crown Dependencies to UK only from this year. This change has been made to better align with the needs of users of the statistics, and with the geographical coverage of the UK’s domestic carbon budget targets.
For the purposes of reporting, greenhouse gas emissions are allocated into sectors as follows:
Energy supply
Business
Transport
Public
Residential
Agriculture
Industrial processes
Land use, land use change, and forestry (LULUCF)
Waste management The Department of Energy and Climate Change (DECC) also publish emissions projections up to 2035 based on assumptions of future economic growth, fossil fuel prices, electricity generation costs, UK population and other key variables1.
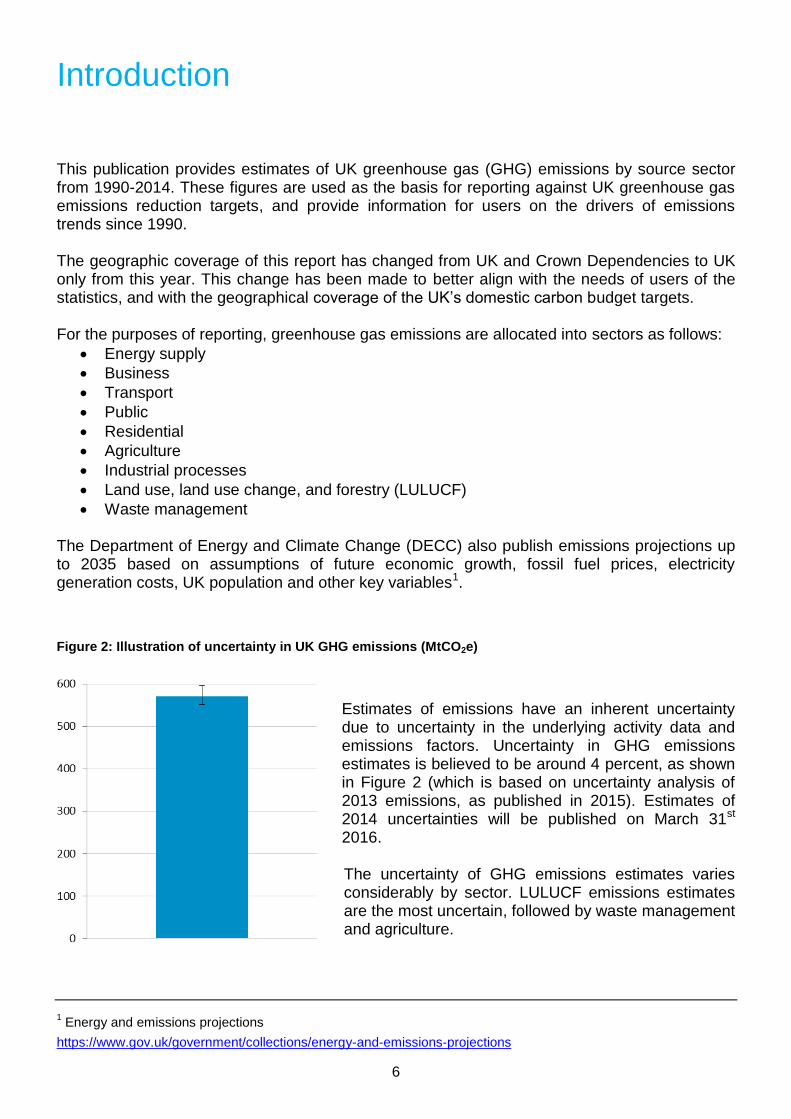
Figure 2: Illustration of uncertainty in UK GHG emissions (MtCO2e)
Estimates of emissions have an inherent uncertainty due to uncertainty in the underlying activity data and emissions factors. Uncertainty in GHG emissions estimates is believed to be around 4 percent, as shown in Figure 2 (which is based on uncertainty analysis of 2013 emissions, as published in 2015). Estimates of 2014 uncertainties will be published on March 31st 2016. The uncertainty of GHG emissions estimates varies considerably by sector. LULUCF emissions estimates are the most uncertain, followed by waste management and agriculture.
1 Energy and emissions projections
https://www.gov.uk/government/collections/energy-and-emissions-projections
7
UK performance against emissions reduction targets
Kyoto Protocol target
The Kyoto Protocol is an international agreement linked to the United Nations Framework Convention on Climate Change (UNFCCC).
First Commitment Period (2008-2012)
The UK met its emissions reductions target for the first commitment period of the Kyoto Protocol. Under the first commitment period of the Kyoto Protocol (2008-12), EU countries
collectively made a commitment to reduce greenhouse gas emissions across the EU by 8 percent on 1990 levels by 2012. As part of this, the UK undertook to reduce total greenhouse gas emissions by 12.5 percent below base year levels over the five-year period 2008-122.
UK emissions of the basket of greenhouse gases covered by the Kyoto Protocol were an average 600.6 MtCO2e per year (exclusive of emissions trading) over the first commitment period (2008-12), 23 percent lower than base year emissions3.
Second Commitment Period (2013-2020)
Under the second commitment period the EU has a collective target to reduce its emissions by 20 percent relative to base year levels over the period. The UK’s allocated emissions level for the second commitment period of the Kyoto Protocol is set in line with our 2020 target under the Effort Sharing Decision (see below), but also covers emissions from the Land Use, Land Use Change and Forestry (LULUCF) sector. UK emissions from the traded sector of the EU Emissions Trading System are managed centrally by the EU and are not counted towards our UK target.
Once ratified this Kyoto Protocol target will cover the UK, and the relevant Crown Dependencies and Overseas Territories that wish to join the UK’s ratification. As ratification is not yet complete and exact details of the UK’s target for the second commitment period are still being finalised, these statistics do not include information on the UK’s progress against its second commitment period target.
Beyond 2020
Following the United Nations Conference on Climate Change in December 2015, 195 countries adopted a universal climate change agreement (pending ratification). The EU and its Member States are committed to a target of at least a 40 percent domestic reduction in greenhouse gas emissions by 2030 compared to 1990 levels. The UK’s contribution to this target is yet to be
formally agreed.
2 Council Decision (2002/358/EC) of 25 April 2002
http://www.eea.europa.eu/policy-documents/council-decision-2002-358-ec 3 Record of UK base year emissions
https://www.gov.uk/government/uploads/system/uploads/attachment_data/file/345163/base_year_tables.xlsx
8
The Climate Change Act 2008
The UK has domestic targets for reducing greenhouse gas emissions under the Climate Change Act 20084, which established a long-term legally-binding framework to reduce GHG emissions, committing the UK to reducing emissions by at least 80 percent below 1990 baselines by 2050, with an interim target to reduce GHG emissions by at least 34 percent compared to the 1990 baseline3 by 2020.
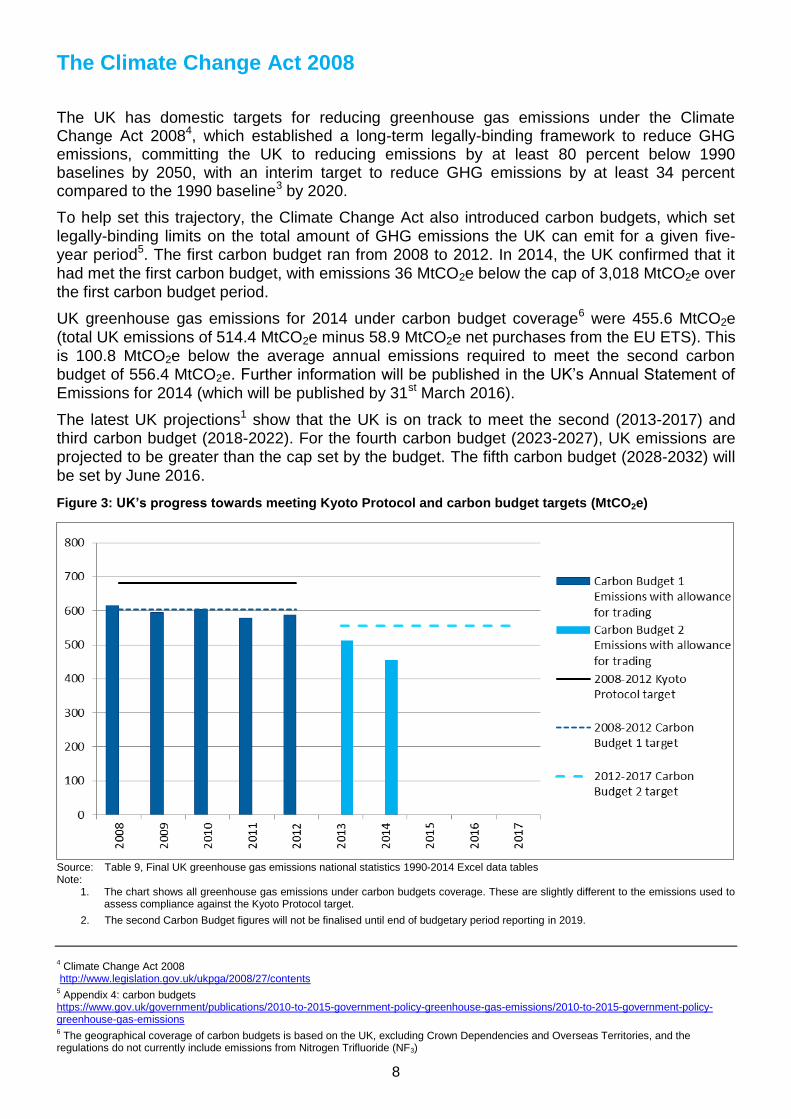
To help set this trajectory, the Climate Change Act also introduced carbon budgets, which set legally-binding limits on the total amount of GHG emissions the UK can emit for a given five-year period5. The first carbon budget ran from 2008 to 2012. In 2014, the UK confirmed that it had met the first carbon budget, with emissions 36 MtCO2e below the cap of 3,018 MtCO2e over the first carbon budget period.
UK greenhouse gas emissions for 2014 under carbon budget coverage6 were 455.6 MtCO2e (total UK emissions of 514.4 MtCO2e minus 58.9 MtCO2e net purchases from the EU ETS). This is 100.8 MtCO2e below the average annual emissions required to meet the second carbon budget of 556.4 MtCO2e. Further information will be published in the UK’s Annual Statement of Emissions for 2014 (which will be published by 31st March 2016).
The latest UK projections1 show that the UK is on track to meet the second (2013-2017) and third carbon budget (2018-2022). For the fourth carbon budget (2023-2027), UK emissions are projected to be greater than the cap set by the budget. The fifth carbon budget (2028-2032) will be set by June 2016.
Figure 3: UK’s progress towards meeting Kyoto Protocol and carbon budget targets (MtCO2e)
Source: Table 9, Final UK greenhouse gas emissions national statistics 1990-2014 Excel data tables Note:
1. The chart shows all greenhouse gas emissions under carbon budgets coverage. These are slightly different to the emissions used to assess compliance against the Kyoto Protocol target.
2. The second Carbon Budget figures will not be finalised until end of budgetary period reporting in 2019.
4 Climate Change Act 2008
http://www.legislation.gov.uk/ukpga/2008/27/contents 5 Appendix 4: carbon budgets
https://www.gov.uk/government/publications/2010-to-2015-government-policy-greenhouse-gas-emissions/2010-to-2015-government-policy-greenhouse-gas-emissions 6 The geographical coverage of carbon budgets is based on the UK, excluding Crown Dependencies and Overseas Territories, and the
regulations do not currently include emissions from Nitrogen Trifluoride (NF3)

9
EU Effort Sharing Decision
The UK has annual greenhouse gas emissions targets under the EU Effort Sharing Decision (ESD) for the period 2013-2020. The ESD was agreed as part of the 2008 EU Climate and Energy package and came into force from January 2013. It sets out targets for EU Member States to either reduce or limit emissions by a certain percentage in the non-traded sector (i.e. covering most sectors not included in the EU Emissions Trading System), by 2020 from a 2005 baseline. The UK's target is to reduce emissions by 16 percent from 2005 levels, to be achieved through a declining target for emissions for each year from 2013-20207. Provisional figures show that the UK met its 2013 target under the ESD.
UK greenhouse gas emissions for 2014 under the Effort Sharing Decision are provisionally estimated to be 325.3 MtCO2e. This is 28.9 MtCO2e below the UK’s 2014 cap of 354.2 MtCO2e, meaning that the UK is provisionally estimated to have met its target.
ESD emissions estimates for 2013 and 2014 are provisional pending the completion of the 2016 EU review and compliance process.
7 Annual emission allocations, European Commission
http://ec.europa.eu/clima/policies/effort/framework/documentation_en.htm
10
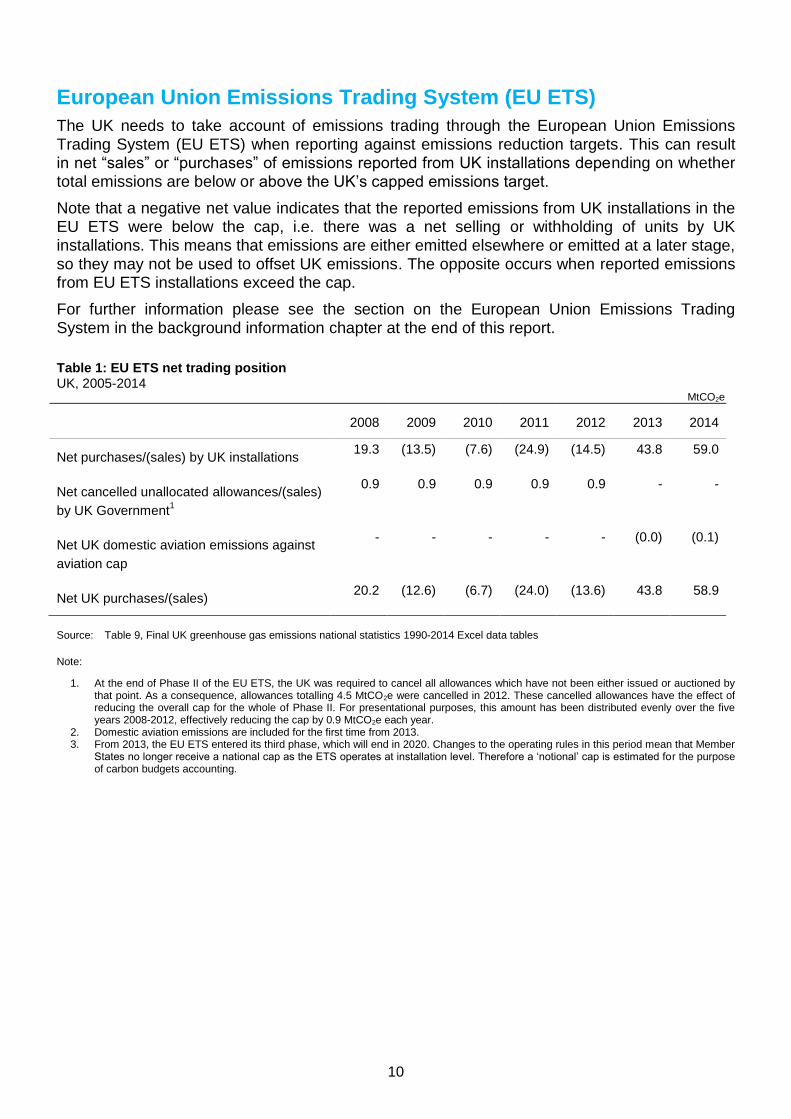
European Union Emissions Trading System (EU ETS)
The UK needs to take account of emissions trading through the European Union Emissions Trading System (EU ETS) when reporting against emissions reduction targets. This can result in net “sales” or “purchases” of emissions reported from UK installations depending on whether total emissions are below or above the UK’s capped emissions target.
Note that a negative net value indicates that the reported emissions from UK installations in the EU ETS were below the cap, i.e. there was a net selling or withholding of units by UK installations. This means that emissions are either emitted elsewhere or emitted at a later stage, so they may not be used to offset UK emissions. The opposite occurs when reported emissions from EU ETS installations exceed the cap.
For further information please see the section on the European Union Emissions Trading System in the background information chapter at the end of this report.
Table 1: EU ETS net trading position UK, 2005-2014
MtCO2e
2008 2009 2010 2011 2012 2013 2014
Net purchases/(sales) by UK installations 19.3 (13.5) (7.6) (24.9) (14.5) 43.8 59.0
Net cancelled unallocated allowances/(sales)
by UK Government1
0.9 0.9 0.9 0.9 0.9 - -
Net UK domestic aviation emissions against
aviation cap
- - - - - (0.0) (0.1)
Net UK purchases/(sales) 20.2 (12.6) (6.7) (24.0) (13.6) 43.8 58.9
Source: Table 9, Final UK greenhouse gas emissions national statistics 1990-2014 Excel data tables
Note:
1. At the end of Phase II of the EU ETS, the UK was required to cancel all allowances which have not been either issued or auctioned by that point. As a consequence, allowances totalling 4.5 MtCO2e were cancelled in 2012. These cancelled allowances have the effect of reducing the overall cap for the whole of Phase II. For presentational purposes, this amount has been distributed evenly over the five years 2008-2012, effectively reducing the cap by 0.9 MtCO2e each year.
2. Domestic aviation emissions are included for the first time from 2013. 3. From 2013, the EU ETS entered its third phase, which will end in 2020. Changes to the operating rules in this period mean that Member
States no longer receive a national cap as the ETS operates at installation level. Therefore a ‘notional’ cap is estimated for the purpose of carbon budgets accounting.

11
2014 Emissions
Greenhouse gas emissions are reported here by gas (Figure 4), and by the source sector (Figure 5) of the emissions.
When broken down by gas, UK emissions are dominated by carbon dioxide, which accounted for about 82 percent of the UK’s greenhouse gas emissions in 2014. Weighted by global warming potential, methane accounted for about 10 percent of UK emissions and nitrous oxide for about 4 percent of emissions in 2014. Fluorinated gases accounted for the remainder, around 3 percent. Looking at the breakdown by sector, in 2014, 31 percent of greenhouse gas emissions were from the energy supply sector, 23 percent from transport, 17 percent from business, 12 percent from the residential sector and 9 percent from agriculture. The rest was attributable to the remaining sectors; waste management, industrial process, and the public sector. The land use, land use change and forestry (LULUCF) sector acted as a net sink in 2014 so emissions were effectively negative.
Estimates of emissions have an inherent uncertainty due to uncertainty in the underlying data used to calculate the emissions, and due to uncertainty in the applicability, completeness and application of that data. Uncertainty analysis is conducted by modelling the uncertainty in the underlying emission factors, activity data, and other variables within models; or in the overall model output. Typically uncertainty is around 4 percent on total emissions. LULUCF emissions are the most uncertain followed by nitrous oxide emissions from agriculture soils and methane from agriculture. Estimates of uncertainties in 2014 emissions will be published on 31st March 2016.
Figure 4: Greenhouse gas emissions by gas, UK, 2014 (%)
12
Source: Table 1, Final UK greenhouse gas emissions national statistics 1990-2014 Excel data tables
Figure 5: Greenhouse gas emissions by source sector, UK, 2014 (MtCO2e)
Source: Table 3, Final UK greenhouse gas emissions national statistics 1990-2014 Excel data tables
Table 2: UK greenhouse gas emissions by gas and sector UK, 2014
MtCO2e
Carbon dioxide Methane Nitrous oxide Fluorinated
gases
Total
Energy Supply 155.6 7.3 1.0 0.0 163.8
Transport 116.6 0.1 1.1 0.0 117.9
Business 72.4 0.1 1.5 14.6 88.5
Residential 61.1 0.8 0.2 2.2 64.2
Agriculture 5.3 27.4 16.3 0.0 49.1
Waste Management 0.3 17.6 0.9 0.0 18.8
Industrial Process 12.3 0.1 0.3 0.3 13.0
Public 8.1 0.0 0.0 0.0 8.1
LULUCF -9.7 0.0 0.7 0.0 -9.0
Total 422.0 53.5 21.9 17.0 514.4
Source: Tables 3 to 7, Final UK greenhouse gas emissions national statistics 1990-2014 Excel data tables
13
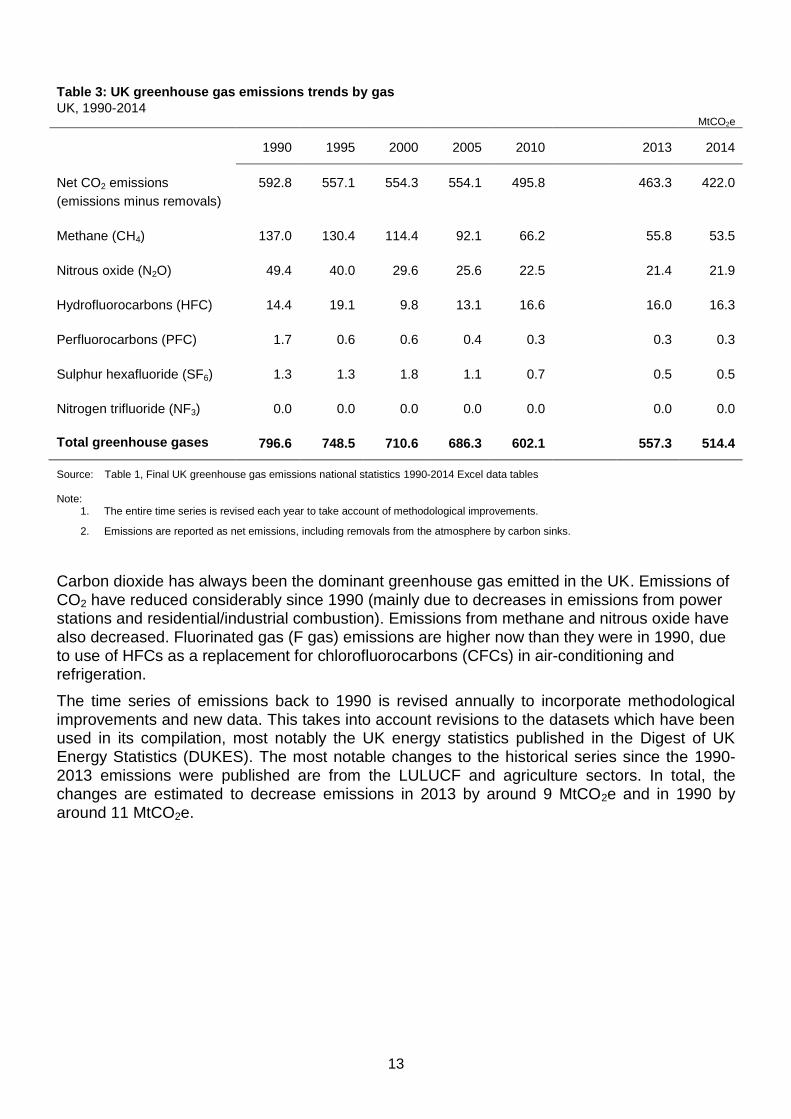
Table 3: UK greenhouse gas emissions trends by gas UK, 1990-2014
MtCO2e
1990 1995 2000 2005 2010 2013 2014
Net CO2 emissions
(emissions minus removals)
592.8 557.1 554.3 554.1 495.8 463.3 422.0
Methane (CH4) 137.0 130.4 114.4 92.1 66.2 55.8 53.5
Nitrous oxide (N2O) 49.4 40.0 29.6 25.6 22.5 21.4 21.9
Hydrofluorocarbons (HFC) 14.4 19.1 9.8 13.1 16.6 16.0 16.3
Perfluorocarbons (PFC) 1.7 0.6 0.6 0.4 0.3 0.3 0.3
Sulphur hexafluoride (SF6) 1.3 1.3 1.8 1.1 0.7 0.5 0.5
Nitrogen trifluoride (NF3) 0.0 0.0 0.0 0.0 0.0 0.0 0.0
Total greenhouse gases 796.6 748.5 710.6 686.3 602.1 557.3 514.4
Source: Table 1, Final UK greenhouse gas emissions national statistics 1990-2014 Excel data tables Note:
1. The entire time series is revised each year to take account of methodological improvements.
2. Emissions are reported as net emissions, including removals from the atmosphere by carbon sinks.
Carbon dioxide has always been the dominant greenhouse gas emitted in the UK. Emissions of CO2 have reduced considerably since 1990 (mainly due to decreases in emissions from power stations and residential/industrial combustion). Emissions from methane and nitrous oxide have also decreased. Fluorinated gas (F gas) emissions are higher now than they were in 1990, due to use of HFCs as a replacement for chlorofluorocarbons (CFCs) in air-conditioning and refrigeration.
The time series of emissions back to 1990 is revised annually to incorporate methodological improvements and new data. This takes into account revisions to the datasets which have been used in its compilation, most notably the UK energy statistics published in the Digest of UK Energy Statistics (DUKES). The most notable changes to the historical series since the 1990-2013 emissions were published are from the LULUCF and agriculture sectors. In total, the changes are estimated to decrease emissions in 2013 by around 9 MtCO2e and in 1990 by around 11 MtCO2e.

14
Emissions by sector
Table 4: Sources of greenhouse gas emissions UK, 1990-2014
MtCO2e
1990 1995 2000 2005 2010 2013 2014
Energy Supply 277.9 237.9 220.9 231.0 206.7 189.5 163.8
Transport 121.9 122.2 126.7 130.4 120.1 116.6 117.9
Business 115.4 113.4 116.8 109.9 94.9 90.9 88.5
Residential 80.1 81.7 88.7 85.7 87.6 77.3 64.2
Agriculture 58.7 58.1 54.6 50.9 48.3 48.1 49.1
Waste Management 68.8 71.0 66.5 52.1 29.9 21.1 18.8
Industrial Process 60.0 50.9 27.2 20.6 12.7 13.0 13.0
Public 13.5 13.3 12.1 11.2 9.7 9.5 8.1
LULUCF 0.3 -0.1 -2.9 -5.5 -7.8 -8.6 -9.0
Total 796.6 748.5 710.6 686.3 602.1 557.3 514.4
Source: Table 3, Final UK greenhouse gas emissions national statistics 1990-2014 Excel data tables
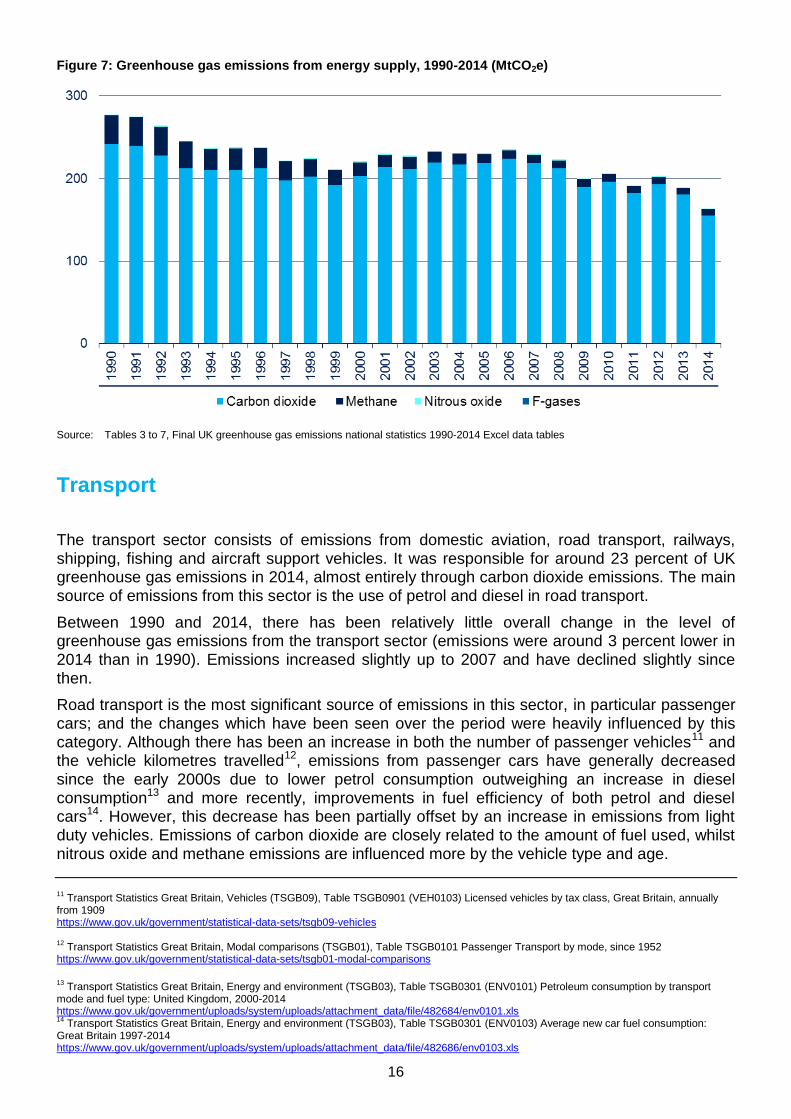
Energy supply
The energy supply sector consists of emissions from fuel combustion for electricity generation and other energy production sources. It was responsible for 31 percent of UK greenhouse gas emissions in 2014, with carbon dioxide being by far the most prominent gas for this sector. The main source of emissions from this sector is the use of coal and natural gas in electricity generation from power stations.
Between 1990 and 2014, there was a 41 percent reduction in greenhouse gas emissions from the energy supply sector. This decrease has resulted mainly from changes in the mix of fuels being used for electricity generation, including the growth of renewables; together with greater efficiency resulting from improvements in technology.
Since 1990 there has been a decline in the use of coal at power stations and an increase in the
use of gas, which has a lower carbon content. Coal use in generation reduced by 52 percent between 1990 and 20148. Final consumption of electricity was 9 percent higher in 2014 than it was in 1990, although it peaked in 2005 and has decreased since then9. Electricity generation in 2014 was 1 percent lower than in 1990, again it peaked in the early 2000s and has decreased since.10
8 Digest of United Kingdom Energy Statistics, Table 5.1.1 Fuel input for electricity generation, 1970 to 2014
9 Digest of United Kingdom Energy Statistics, Table 5.1.2 Fuel input for electricity generation, 1970 to 2014
10 Digest of United Kingdom Energy Statistics, Table 5.1.3 Electricity generated and supplied, 1970 to 2014
15
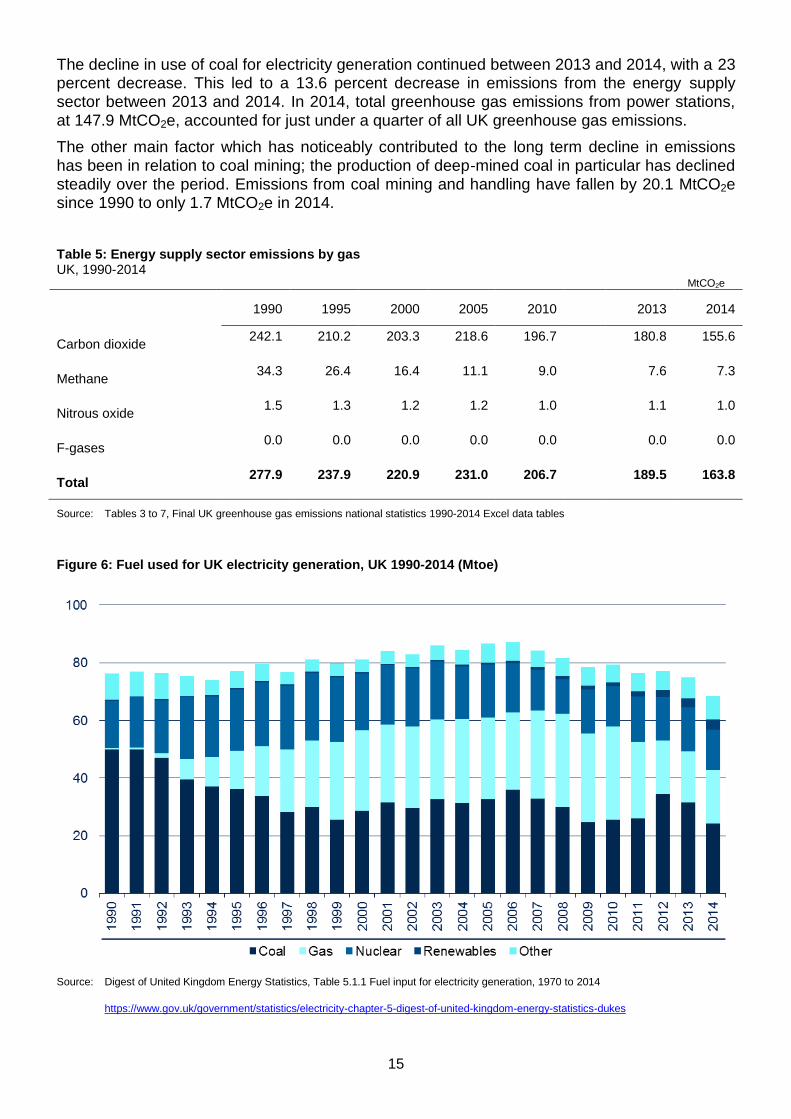
The decline in use of coal for electricity generation continued between 2013 and 2014, with a 23 percent decrease. This led to a 13.6 percent decrease in emissions from the energy supply sector between 2013 and 2014. In 2014, total greenhouse gas emissions from power stations, at 147.9 MtCO2e, accounted for just under a quarter of all UK greenhouse gas emissions.
The other main factor which has noticeably contributed to the long term decline in emissions has been in relation to coal mining; the production of deep-mined coal in particular has declined steadily over the period. Emissions from coal mining and handling have fallen by 20.1 MtCO2e since 1990 to only 1.7 MtCO2e in 2014.
Table 5: Energy supply sector emissions by gas UK, 1990-2014
MtCO2e
1990 1995 2000 2005 2010 2013 2014
Carbon dioxide 242.1 210.2 203.3 218.6 196.7 180.8 155.6
Methane 34.3 26.4 16.4 11.1 9.0 7.6 7.3
Nitrous oxide 1.5 1.3 1.2 1.2 1.0 1.1 1.0
F-gases 0.0 0.0 0.0 0.0 0.0 0.0 0.0
Total 277.9 237.9 220.9 231.0 206.7 189.5 163.8
Source: Tables 3 to 7, Final UK greenhouse gas emissions national statistics 1990-2014 Excel data tables
Figure 6: Fuel used for UK electricity generation, UK 1990-2014 (Mtoe)
Source: Digest of United Kingdom Energy Statistics, Table 5.1.1 Fuel input for electricity generation, 1970 to 2014
https://www.gov.uk/government/statistics/electricity-chapter-5-digest-of-united-kingdom-energy-statistics-dukes
16
Figure 7: Greenhouse gas emissions from energy supply, 1990-2014 (MtCO2e)
Source: Tables 3 to 7, Final UK greenhouse gas emissions national statistics 1990-2014 Excel data tables
Transport
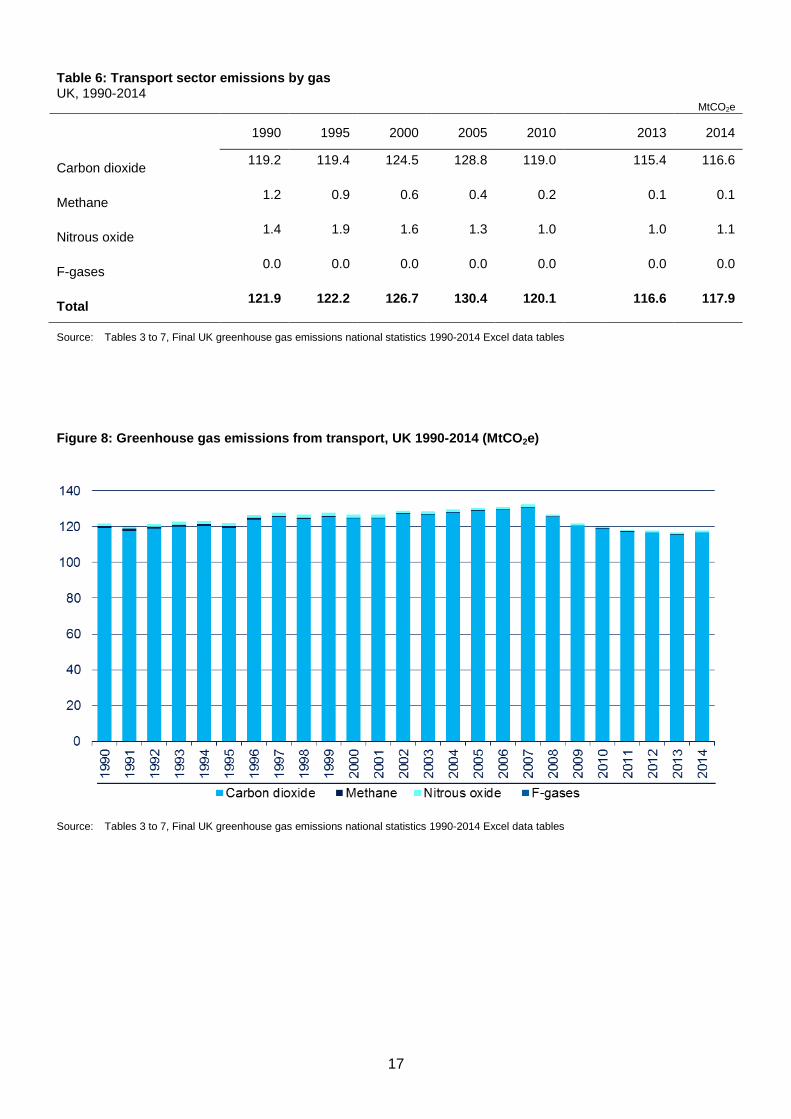
The transport sector consists of emissions from domestic aviation, road transport, railways, shipping, fishing and aircraft support vehicles. It was responsible for around 23 percent of UK greenhouse gas emissions in 2014, almost entirely through carbon dioxide emissions. The main source of emissions from this sector is the use of petrol and diesel in road transport.
Between 1990 and 2014, there has been relatively little overall change in the level of greenhouse gas emissions from the transport sector (emissions were around 3 percent lower in 2014 than in 1990). Emissions increased slightly up to 2007 and have declined slightly since then.
Road transport is the most significant source of emissions in this sector, in particular passenger cars; and the changes which have been seen over the period were heavily influenced by this category. Although there has been an increase in both the number of passenger vehicles11 and the vehicle kilometres travelled12, emissions from passenger cars have generally decreased since the early 2000s due to lower petrol consumption outweighing an increase in diesel consumption13 and more recently, improvements in fuel efficiency of both petrol and diesel cars14. However, this decrease has been partially offset by an increase in emissions from light duty vehicles. Emissions of carbon dioxide are closely related to the amount of fuel used, whilst nitrous oxide and methane emissions are influenced more by the vehicle type and age.
11
Transport Statistics Great Britain, Vehicles (TSGB09), Table TSGB0901 (VEH0103) Licensed vehicles by tax class, Great Britain, annually from 1909 https://www.gov.uk/government/statistical-data-sets/tsgb09-vehicles 12
Transport Statistics Great Britain, Modal comparisons (TSGB01), Table TSGB0101 Passenger Transport by mode, since 1952 https://www.gov.uk/government/statistical-data-sets/tsgb01-modal-comparisons
13
Transport Statistics Great Britain, Energy and environment (TSGB03), Table TSGB0301 (ENV0101) Petroleum consumption by transport mode and fuel type: United Kingdom, 2000-2014 https://www.gov.uk/government/uploads/system/uploads/attachment_data/file/482684/env0101.xls 14
Transport Statistics Great Britain, Energy and environment (TSGB03), Table TSGB0301 (ENV0103) Average new car fuel consumption: Great Britain 1997-2014 https://www.gov.uk/government/uploads/system/uploads/attachment_data/file/482686/env0103.xls
17
Table 6: Transport sector emissions by gas UK, 1990-2014
MtCO2e
1990 1995 2000 2005 2010 2013 2014
Carbon dioxide 119.2 119.4 124.5 128.8 119.0 115.4 116.6
Methane 1.2 0.9 0.6 0.4 0.2 0.1 0.1
Nitrous oxide 1.4 1.9 1.6 1.3 1.0 1.0 1.1
F-gases 0.0 0.0 0.0 0.0 0.0 0.0 0.0
Total 121.9 122.2 126.7 130.4 120.1 116.6 117.9
Source: Tables 3 to 7, Final UK greenhouse gas emissions national statistics 1990-2014 Excel data tables
Figure 8: Greenhouse gas emissions from transport, UK 1990-2014 (MtCO2e)
Source: Tables 3 to 7, Final UK greenhouse gas emissions national statistics 1990-2014 Excel data tables
18
Business
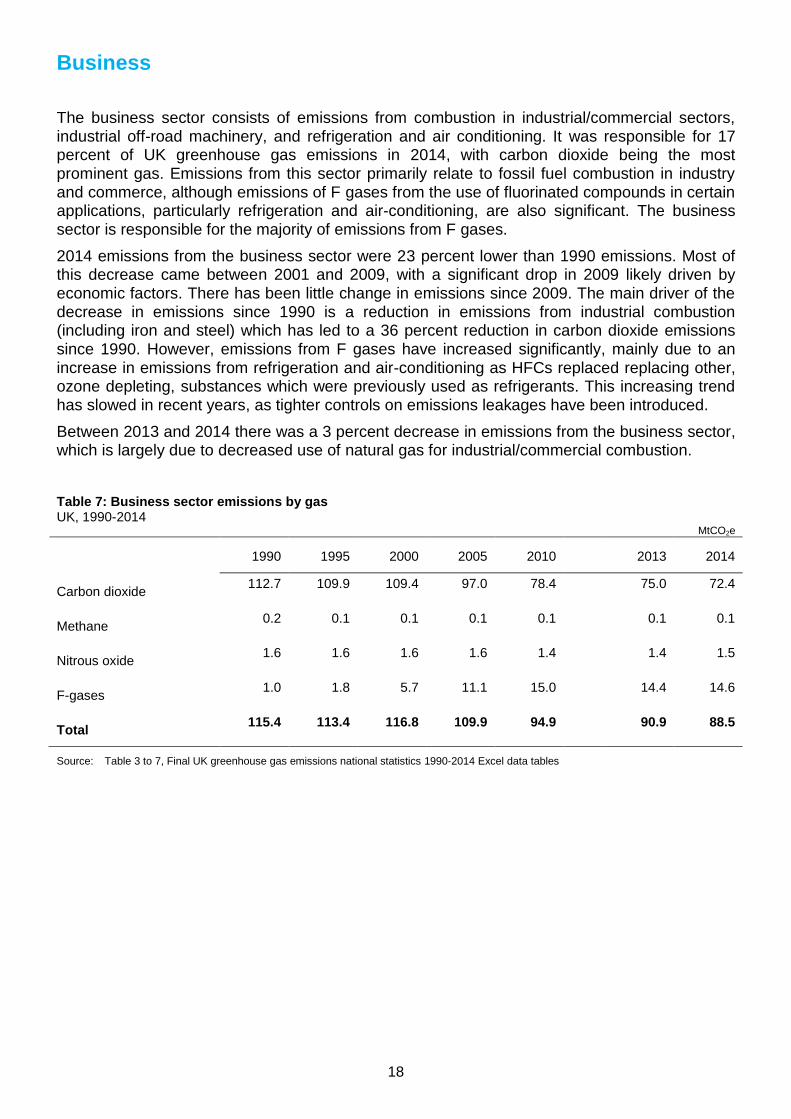
The business sector consists of emissions from combustion in industrial/commercial sectors, industrial off-road machinery, and refrigeration and air conditioning. It was responsible for 17 percent of UK greenhouse gas emissions in 2014, with carbon dioxide being the most prominent gas. Emissions from this sector primarily relate to fossil fuel combustion in industry and commerce, although emissions of F gases from the use of fluorinated compounds in certain applications, particularly refrigeration and air-conditioning, are also significant. The business sector is responsible for the majority of emissions from F gases.
2014 emissions from the business sector were 23 percent lower than 1990 emissions. Most of this decrease came between 2001 and 2009, with a significant drop in 2009 likely driven by economic factors. There has been little change in emissions since 2009. The main driver of the decrease in emissions since 1990 is a reduction in emissions from industrial combustion (including iron and steel) which has led to a 36 percent reduction in carbon dioxide emissions since 1990. However, emissions from F gases have increased significantly, mainly due to an
increase in emissions from refrigeration and air-conditioning as HFCs replaced replacing other, ozone depleting, substances which were previously used as refrigerants. This increasing trend has slowed in recent years, as tighter controls on emissions leakages have been introduced.
Between 2013 and 2014 there was a 3 percent decrease in emissions from the business sector, which is largely due to decreased use of natural gas for industrial/commercial combustion.
Table 7: Business sector emissions by gas UK, 1990-2014
MtCO2e
1990 1995 2000 2005 2010 2013 2014
Carbon dioxide 112.7 109.9 109.4 97.0 78.4 75.0 72.4
Methane 0.2 0.1 0.1 0.1 0.1 0.1 0.1
Nitrous oxide 1.6 1.6 1.6 1.6 1.4 1.4 1.5
F-gases 1.0 1.8 5.7 11.1 15.0 14.4 14.6
Total 115.4 113.4 116.8 109.9 94.9 90.9 88.5
Source: Table 3 to 7, Final UK greenhouse gas emissions national statistics 1990-2014 Excel data tables
19
Figure 9: Greenhouse gas emissions from business, UK 1990-2014 (MtCO2e)
Source: Tables 3 to 7, Final UK greenhouse gas emissions national statistics 1990-2014 Excel data tables
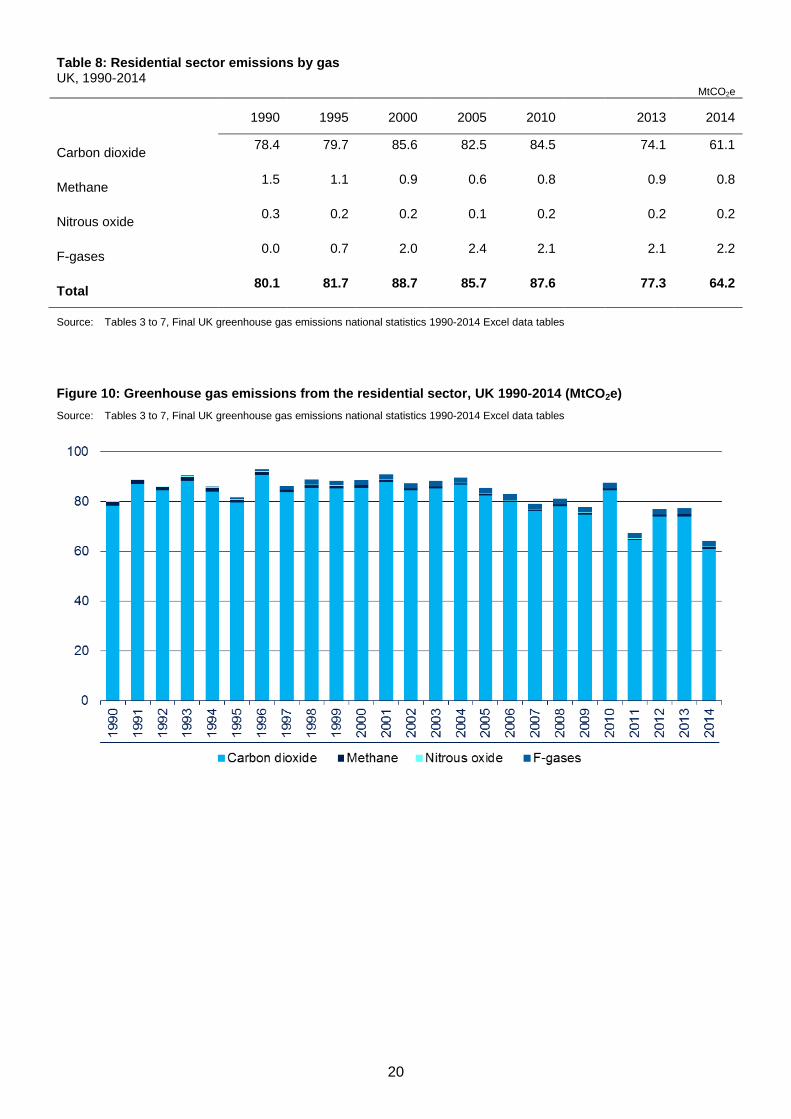
Residential
The residential sector consists of emissions from fuel combustion for heating and cooking, garden machinery, and fluorinated gases released from aerosols and metered dose inhalers. It was responsible for around 12 percent of UK greenhouse gas emissions in 2014, with carbon dioxide being the most prominent gas for this sector. The main source of emissions from this sector is the use of natural gas for heating and cooking. Emissions of F gases in this sector are related to the use of aerosols and metered dose inhalers.
It should be noted that since these figures are estimates of emissions by source, emissions related to residential electricity use, including electricity use for heating, are attributed to power stations; and are therefore included in the energy supply sector rather than the residential sector.
Between 1990 and 2014, there has been considerable variation in greenhouse gas emissions from year to year in the residential sector. In general, carbon dioxide emissions from this sector are particularly heavily influenced by external temperatures, with colder temperatures driving higher emissions. Temperature was the main driver of the 17 percent decrease in residential emissions between 2013 and 2014, with 2014 being 1.2 degrees Celsius warmer on average than 2013. Further information on the impact of external temperatures on emissions can be found later in this statistical release.
20
Table 8: Residential sector emissions by gas UK, 1990-2014
MtCO2e
1990 1995 2000 2005 2010 2013 2014
Carbon dioxide 78.4 79.7 85.6 82.5 84.5 74.1 61.1
Methane 1.5 1.1 0.9 0.6 0.8 0.9 0.8
Nitrous oxide 0.3 0.2 0.2 0.1 0.2 0.2 0.2
F-gases 0.0 0.7 2.0 2.4 2.1 2.1 2.2
Total 80.1 81.7 88.7 85.7 87.6 77.3 64.2
Source: Tables 3 to 7, Final UK greenhouse gas emissions national statistics 1990-2014 Excel data tables
Figure 10: Greenhouse gas emissions from the residential sector, UK 1990-2014 (MtCO2e)
Source: Tables 3 to 7, Final UK greenhouse gas emissions national statistics 1990-2014 Excel data tables
21
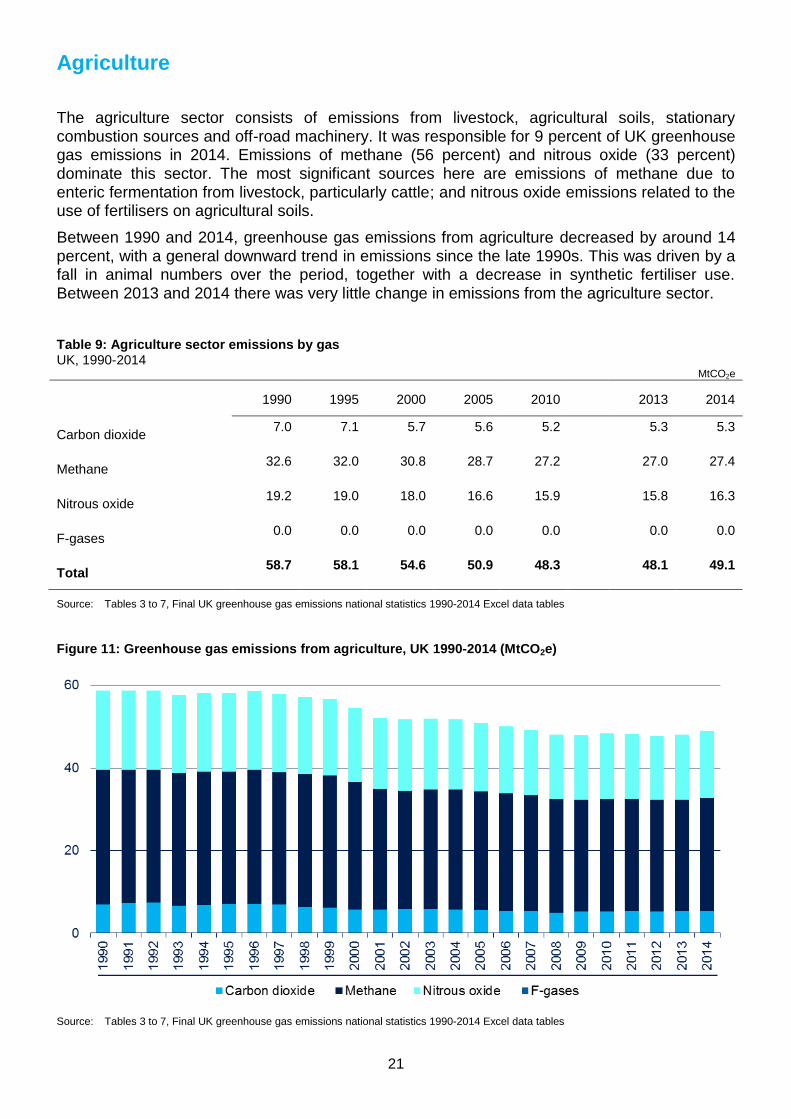
Agriculture
The agriculture sector consists of emissions from livestock, agricultural soils, stationary combustion sources and off-road machinery. It was responsible for 9 percent of UK greenhouse gas emissions in 2014. Emissions of methane (56 percent) and nitrous oxide (33 percent) dominate this sector. The most significant sources here are emissions of methane due to enteric fermentation from livestock, particularly cattle; and nitrous oxide emissions related to the use of fertilisers on agricultural soils.
Between 1990 and 2014, greenhouse gas emissions from agriculture decreased by around 14 percent, with a general downward trend in emissions since the late 1990s. This was driven by a fall in animal numbers over the period, together with a decrease in synthetic fertiliser use. Between 2013 and 2014 there was very little change in emissions from the agriculture sector.
Table 9: Agriculture sector emissions by gas UK, 1990-2014
MtCO2e
1990 1995 2000 2005 2010 2013 2014
Carbon dioxide 7.0 7.1 5.7 5.6 5.2 5.3 5.3
Methane 32.6 32.0 30.8 28.7 27.2 27.0 27.4
Nitrous oxide 19.2 19.0 18.0 16.6 15.9 15.8 16.3
F-gases 0.0 0.0 0.0 0.0 0.0 0.0 0.0
Total 58.7 58.1 54.6 50.9 48.3 48.1 49.1
Source: Tables 3 to 7, Final UK greenhouse gas emissions national statistics 1990-2014 Excel data tables
Figure 11: Greenhouse gas emissions from agriculture, UK 1990-2014 (MtCO2e)
Source: Tables 3 to 7, Final UK greenhouse gas emissions national statistics 1990-2014 Excel data tables
22
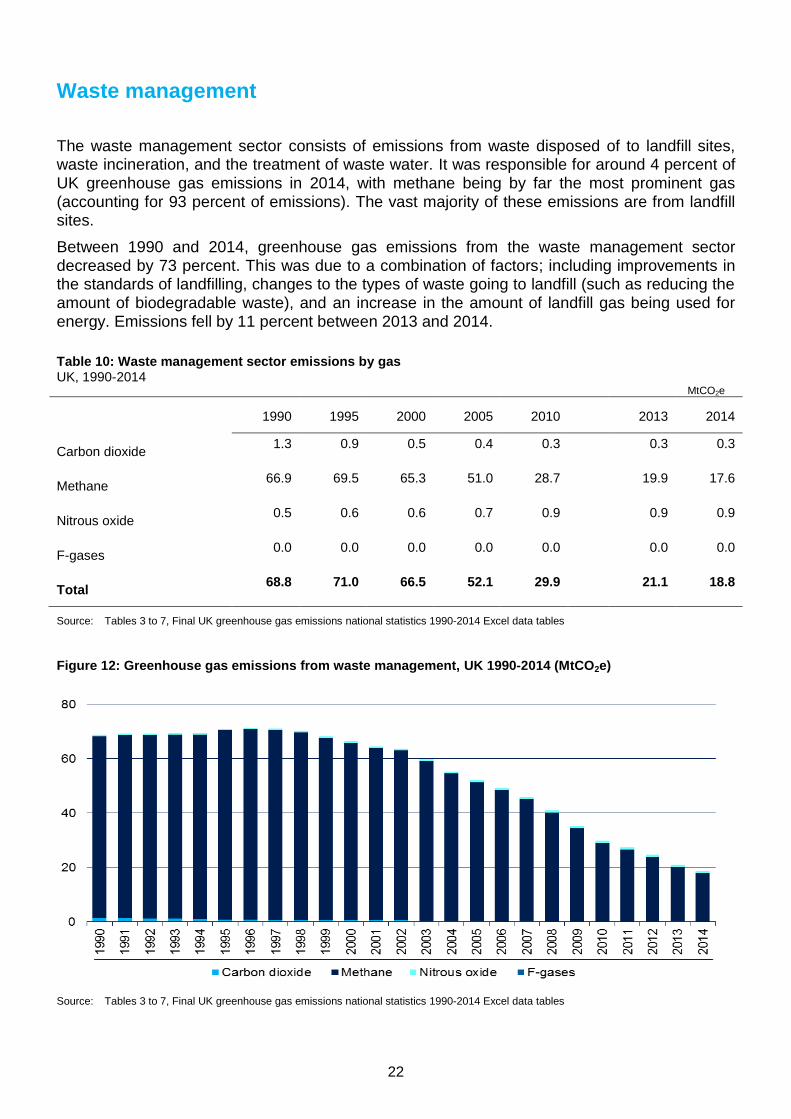
Waste management
The waste management sector consists of emissions from waste disposed of to landfill sites, waste incineration, and the treatment of waste water. It was responsible for around 4 percent of UK greenhouse gas emissions in 2014, with methane being by far the most prominent gas (accounting for 93 percent of emissions). The vast majority of these emissions are from landfill sites.
Between 1990 and 2014, greenhouse gas emissions from the waste management sector decreased by 73 percent. This was due to a combination of factors; including improvements in the standards of landfilling, changes to the types of waste going to landfill (such as reducing the amount of biodegradable waste), and an increase in the amount of landfill gas being used for energy. Emissions fell by 11 percent between 2013 and 2014.
Table 10: Waste management sector emissions by gas UK, 1990-2014
MtCO2e
1990 1995 2000 2005 2010 2013 2014
Carbon dioxide 1.3 0.9 0.5 0.4 0.3 0.3 0.3
Methane 66.9 69.5 65.3 51.0 28.7 19.9 17.6
Nitrous oxide 0.5 0.6 0.6 0.7 0.9 0.9 0.9
F-gases 0.0 0.0 0.0 0.0 0.0 0.0 0.0
Total 68.8 71.0 66.5 52.1 29.9 21.1 18.8
Source: Tables 3 to 7, Final UK greenhouse gas emissions national statistics 1990-2014 Excel data tables
Figure 12: Greenhouse gas emissions from waste management, UK 1990-2014 (MtCO2e)
Source: Tables 3 to 7, Final UK greenhouse gas emissions national statistics 1990-2014 Excel data tables
23
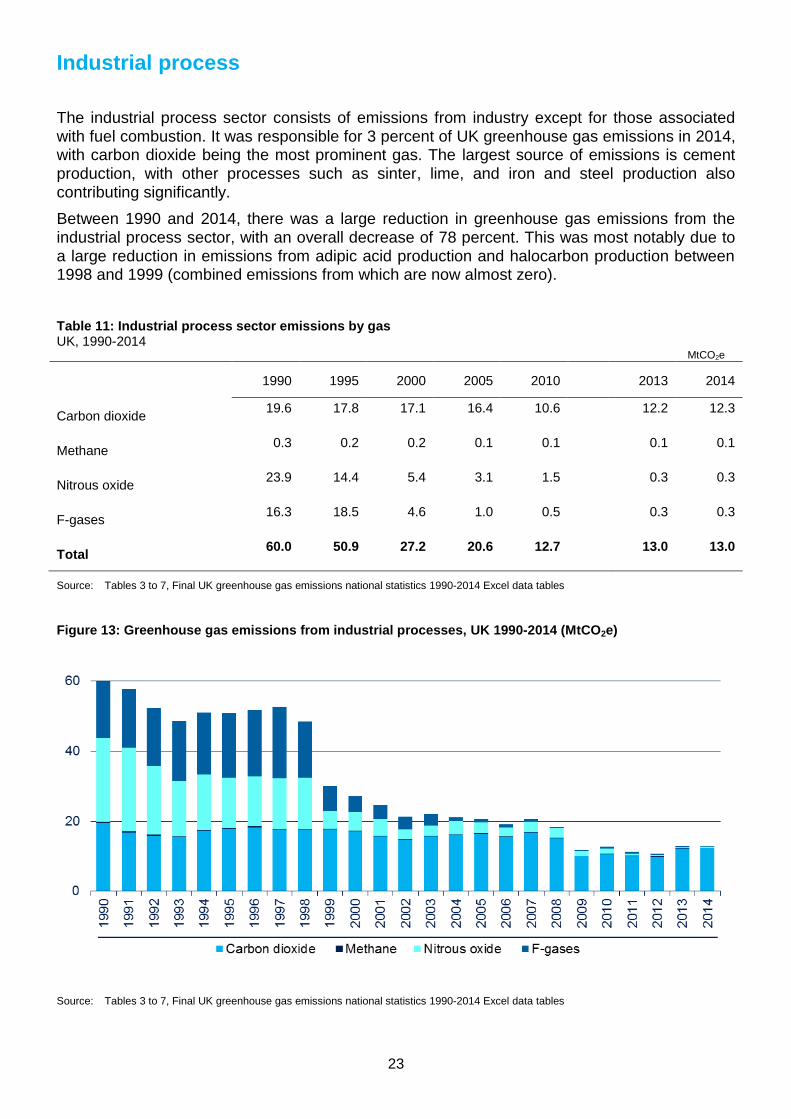
Industrial process
The industrial process sector consists of emissions from industry except for those associated with fuel combustion. It was responsible for 3 percent of UK greenhouse gas emissions in 2014, with carbon dioxide being the most prominent gas. The largest source of emissions is cement production, with other processes such as sinter, lime, and iron and steel production also contributing significantly.
Between 1990 and 2014, there was a large reduction in greenhouse gas emissions from the industrial process sector, with an overall decrease of 78 percent. This was most notably due to a large reduction in emissions from adipic acid production and halocarbon production between 1998 and 1999 (combined emissions from which are now almost zero).
Table 11: Industrial process sector emissions by gas UK, 1990-2014
MtCO2e
1990 1995 2000 2005 2010 2013 2014
Carbon dioxide 19.6 17.8 17.1 16.4 10.6 12.2 12.3
Methane 0.3 0.2 0.2 0.1 0.1 0.1 0.1
Nitrous oxide 23.9 14.4 5.4 3.1 1.5 0.3 0.3
F-gases 16.3 18.5 4.6 1.0 0.5 0.3 0.3
Total 60.0 50.9 27.2 20.6 12.7 13.0 13.0
Source: Tables 3 to 7, Final UK greenhouse gas emissions national statistics 1990-2014 Excel data tables
Figure 13: Greenhouse gas emissions from industrial processes, UK 1990-2014 (MtCO2e)
Source: Tables 3 to 7, Final UK greenhouse gas emissions national statistics 1990-2014 Excel data tables
24
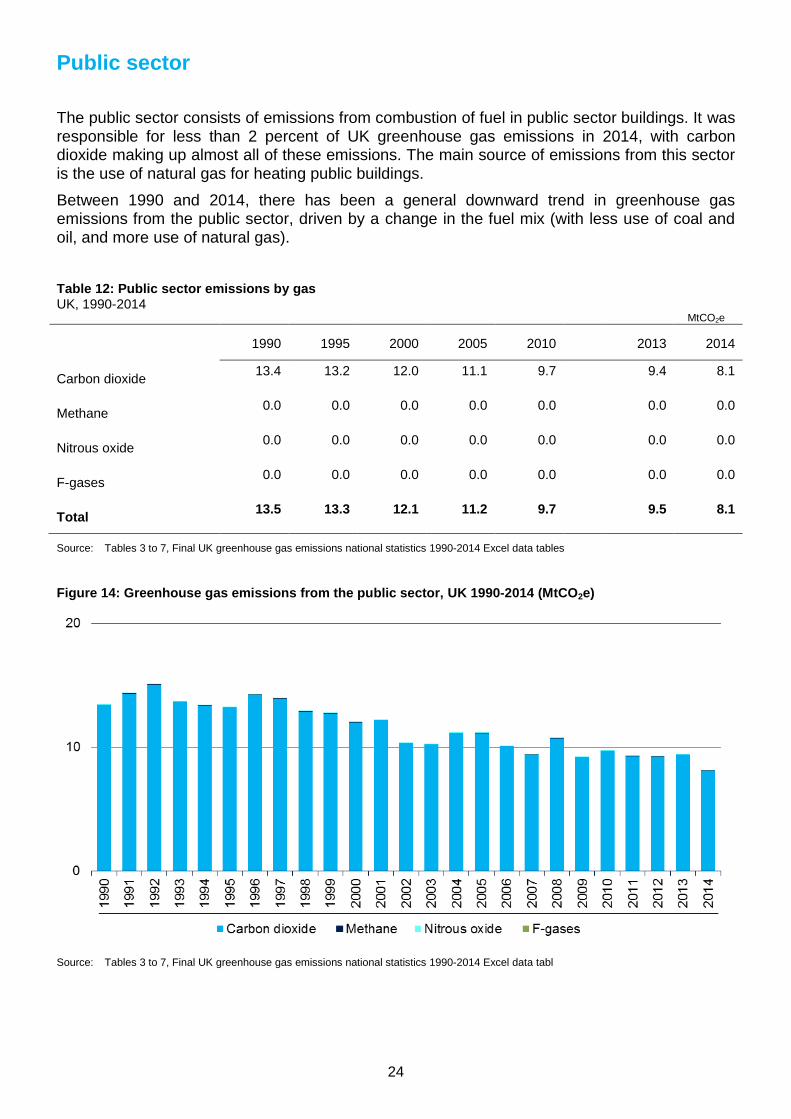
Public sector
The public sector consists of emissions from combustion of fuel in public sector buildings. It was responsible for less than 2 percent of UK greenhouse gas emissions in 2014, with carbon dioxide making up almost all of these emissions. The main source of emissions from this sector is the use of natural gas for heating public buildings.
Between 1990 and 2014, there has been a general downward trend in greenhouse gas emissions from the public sector, driven by a change in the fuel mix (with less use of coal and oil, and more use of natural gas).
Table 12: Public sector emissions by gas UK, 1990-2014
MtCO2e
1990 1995 2000 2005 2010 2013 2014
Carbon dioxide 13.4 13.2 12.0 11.1 9.7 9.4 8.1
Methane 0.0 0.0 0.0 0.0 0.0 0.0 0.0
Nitrous oxide 0.0 0.0 0.0 0.0 0.0 0.0 0.0
F-gases 0.0 0.0 0.0 0.0 0.0 0.0 0.0
Total 13.5 13.3 12.1 11.2 9.7 9.5 8.1
Source: Tables 3 to 7, Final UK greenhouse gas emissions national statistics 1990-2014 Excel data tables
Figure 14: Greenhouse gas emissions from the public sector, UK 1990-2014 (MtCO2e)
Source: Tables 3 to 7, Final UK greenhouse gas emissions national statistics 1990-2014 Excel data tabl
25
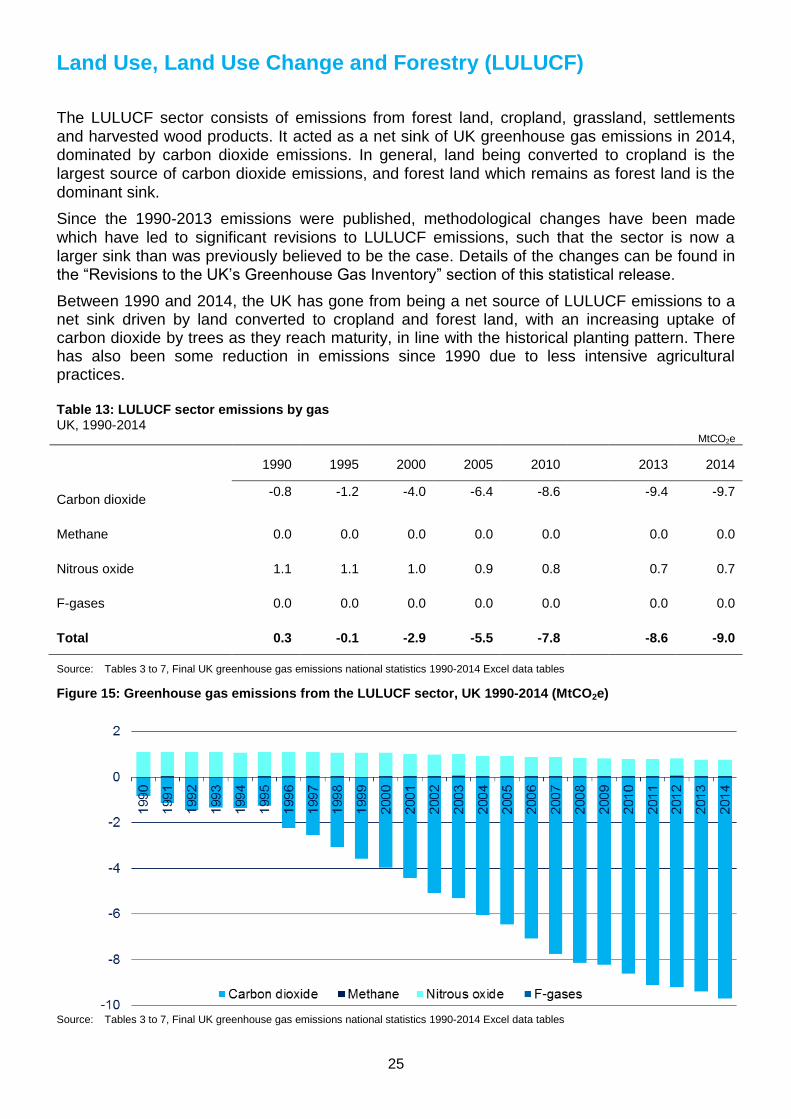
Land Use, Land Use Change and Forestry (LULUCF)
The LULUCF sector consists of emissions from forest land, cropland, grassland, settlements and harvested wood products. It acted as a net sink of UK greenhouse gas emissions in 2014, dominated by carbon dioxide emissions. In general, land being converted to cropland is the largest source of carbon dioxide emissions, and forest land which remains as forest land is the dominant sink.
Since the 1990-2013 emissions were published, methodological changes have been made which have led to significant revisions to LULUCF emissions, such that the sector is now a larger sink than was previously believed to be the case. Details of the changes can be found in the “Revisions to the UK’s Greenhouse Gas Inventory” section of this statistical release.
Between 1990 and 2014, the UK has gone from being a net source of LULUCF emissions to a net sink driven by land converted to cropland and forest land, with an increasing uptake of carbon dioxide by trees as they reach maturity, in line with the historical planting pattern. There has also been some reduction in emissions since 1990 due to less intensive agricultural practices. Table 13: LULUCF sector emissions by gas UK, 1990-2014
MtCO2e
1990 1995 2000 2005 2010 2013 2014
Carbon dioxide -0.8 -1.2 -4.0 -6.4 -8.6 -9.4 -9.7
Methane 0.0 0.0 0.0 0.0 0.0 0.0 0.0
Nitrous oxide 1.1 1.1 1.0 0.9 0.8 0.7 0.7
F-gases 0.0 0.0 0.0 0.0 0.0 0.0 0.0
Total 0.3 -0.1 -2.9 -5.5 -7.8 -8.6 -9.0
Source: Tables 3 to 7, Final UK greenhouse gas emissions national statistics 1990-2014 Excel data tables
Figure 15: Greenhouse gas emissions from the LULUCF sector, UK 1990-2014 (MtCO2e)
Source: Tables 3 to 7, Final UK greenhouse gas emissions national statistics 1990-2014 Excel data tables
26
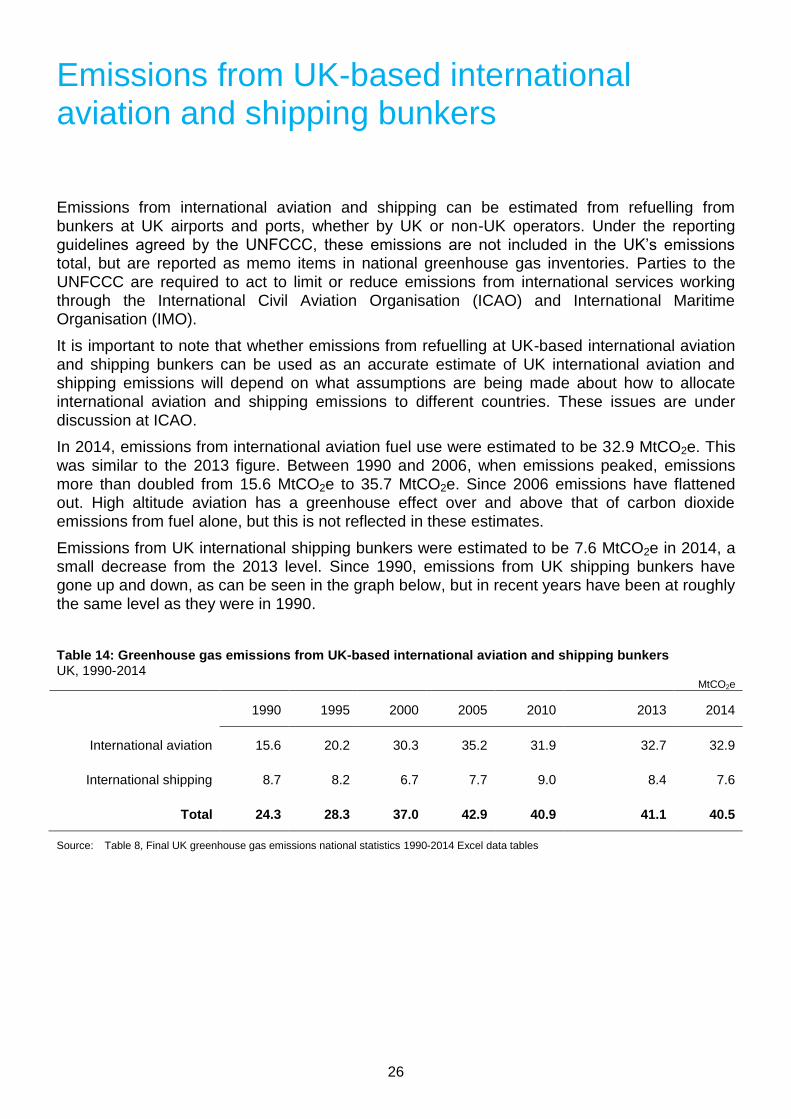
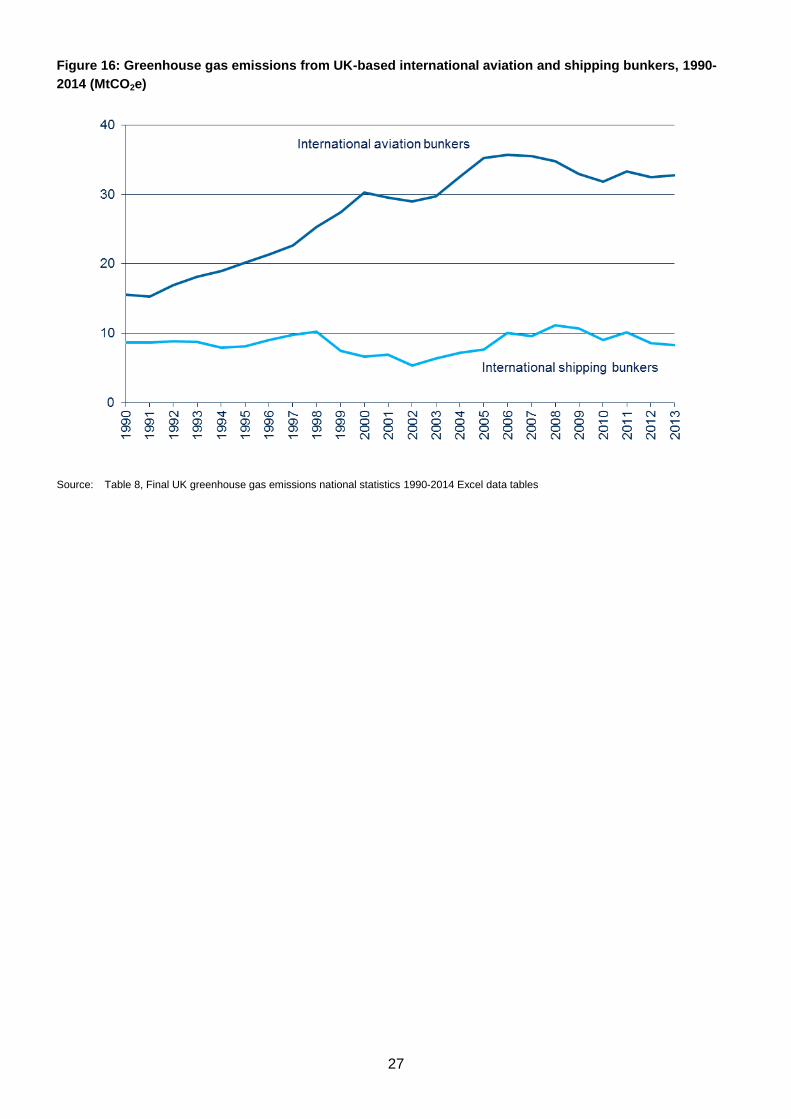
Emissions from UK-based international aviation and shipping bunkers
Emissions from international aviation and shipping can be estimated from refuelling from bunkers at UK airports and ports, whether by UK or non-UK operators. Under the reporting guidelines agreed by the UNFCCC, these emissions are not included in the UK’s emissions total, but are reported as memo items in national greenhouse gas inventories. Parties to the UNFCCC are required to act to limit or reduce emissions from international services working through the International Civil Aviation Organisation (ICAO) and International Maritime Organisation (IMO).
It is important to note that whether emissions from refuelling at UK-based international aviation and shipping bunkers can be used as an accurate estimate of UK international aviation and shipping emissions will depend on what assumptions are being made about how to allocate international aviation and shipping emissions to different countries. These issues are under discussion at ICAO.
In 2014, emissions from international aviation fuel use were estimated to be 32.9 MtCO2e. This was similar to the 2013 figure. Between 1990 and 2006, when emissions peaked, emissions more than doubled from 15.6 MtCO2e to 35.7 MtCO2e. Since 2006 emissions have flattened out. High altitude aviation has a greenhouse effect over and above that of carbon dioxide emissions from fuel alone, but this is not reflected in these estimates.
Emissions from UK international shipping bunkers were estimated to be 7.6 MtCO2e in 2014, a small decrease from the 2013 level. Since 1990, emissions from UK shipping bunkers have gone up and down, as can be seen in the graph below, but in recent years have been at roughly the same level as they were in 1990.
Table 14: Greenhouse gas emissions from UK-based international aviation and shipping bunkers UK, 1990-2014
MtCO2e
1990 1995 2000 2005 2010 2013 2014
International aviation 15.6 20.2 30.3 35.2 31.9 32.7 32.9
International shipping 8.7 8.2 6.7 7.7 9.0 8.4 7.6
Total 24.3 28.3 37.0 42.9 40.9 41.1 40.5
Source: Table 8, Final UK greenhouse gas emissions national statistics 1990-2014 Excel data tables
27
Figure 16: Greenhouse gas emissions from UK-based international aviation and shipping bunkers, 1990-
2014 (MtCO2e)
Source: Table 8, Final UK greenhouse gas emissions national statistics 1990-2014 Excel data tables
28
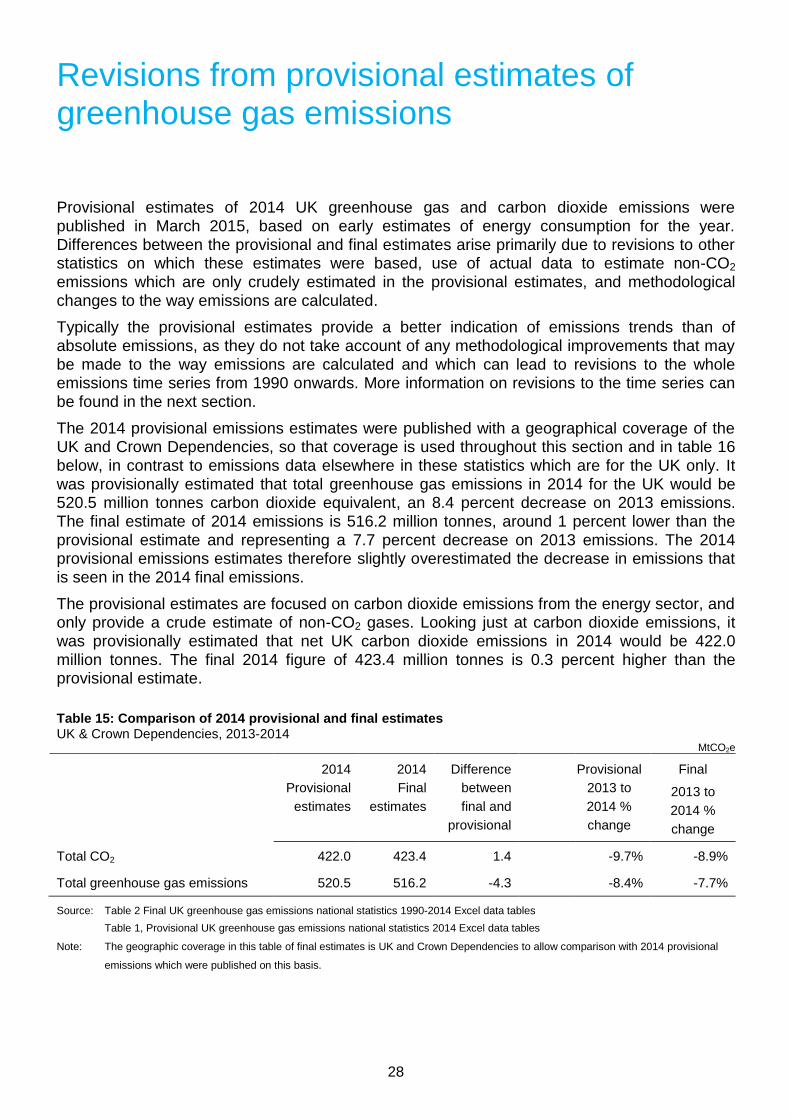
Revisions from provisional estimates of greenhouse gas emissions
Provisional estimates of 2014 UK greenhouse gas and carbon dioxide emissions were published in March 2015, based on early estimates of energy consumption for the year. Differences between the provisional and final estimates arise primarily due to revisions to other statistics on which these estimates were based, use of actual data to estimate non-CO2 emissions which are only crudely estimated in the provisional estimates, and methodological changes to the way emissions are calculated.
Typically the provisional estimates provide a better indication of emissions trends than of absolute emissions, as they do not take account of any methodological improvements that may be made to the way emissions are calculated and which can lead to revisions to the whole emissions time series from 1990 onwards. More information on revisions to the time series can be found in the next section.
The 2014 provisional emissions estimates were published with a geographical coverage of the UK and Crown Dependencies, so that coverage is used throughout this section and in table 16 below, in contrast to emissions data elsewhere in these statistics which are for the UK only. It was provisionally estimated that total greenhouse gas emissions in 2014 for the UK would be 520.5 million tonnes carbon dioxide equivalent, an 8.4 percent decrease on 2013 emissions. The final estimate of 2014 emissions is 516.2 million tonnes, around 1 percent lower than the provisional estimate and representing a 7.7 percent decrease on 2013 emissions. The 2014 provisional emissions estimates therefore slightly overestimated the decrease in emissions that is seen in the 2014 final emissions.
The provisional estimates are focused on carbon dioxide emissions from the energy sector, and only provide a crude estimate of non-CO2 gases. Looking just at carbon dioxide emissions, it was provisionally estimated that net UK carbon dioxide emissions in 2014 would be 422.0 million tonnes. The final 2014 figure of 423.4 million tonnes is 0.3 percent higher than the provisional estimate.
Table 15: Comparison of 2014 provisional and final estimates UK & Crown Dependencies, 2013-2014
MtCO2e
2014
Provisional
estimates
2014
Final
estimates
Difference
between
final and
provisional
Provisional
2013 to
2014 %
change
Final
2013 to
2014 %
change
Total CO2 422.0 423.4 1.4 -9.7% -8.9%
Total greenhouse gas emissions 520.5 516.2 -4.3 -8.4% -7.7%
Source: Table 2 Final UK greenhouse gas emissions national statistics 1990-2014 Excel data tables
Table 1, Provisional UK greenhouse gas emissions national statistics 2014 Excel data tables
Note: The geographic coverage in this table of final estimates is UK and Crown Dependencies to allow comparison with 2014 provisional
emissions which were published on this basis.
29
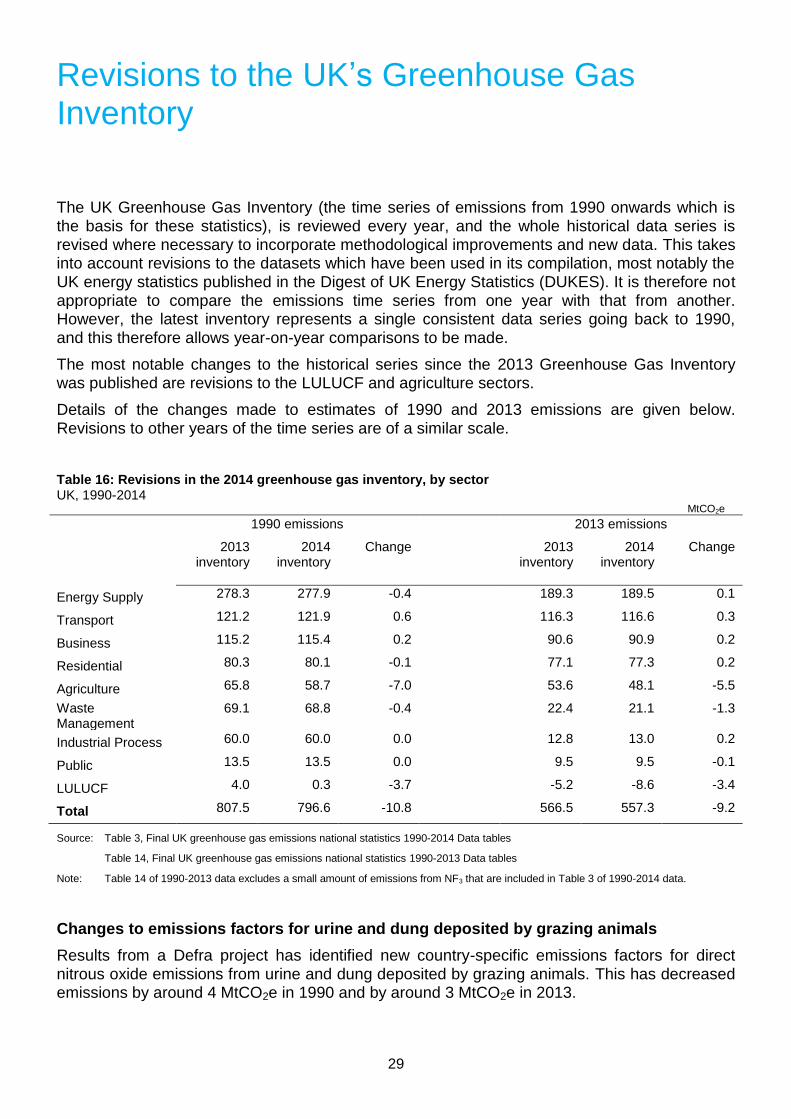
Revisions to the UK’s Greenhouse Gas Inventory
The UK Greenhouse Gas Inventory (the time series of emissions from 1990 onwards which is the basis for these statistics), is reviewed every year, and the whole historical data series is revised where necessary to incorporate methodological improvements and new data. This takes into account revisions to the datasets which have been used in its compilation, most notably the UK energy statistics published in the Digest of UK Energy Statistics (DUKES). It is therefore not appropriate to compare the emissions time series from one year with that from another. However, the latest inventory represents a single consistent data series going back to 1990, and this therefore allows year-on-year comparisons to be made.
The most notable changes to the historical series since the 2013 Greenhouse Gas Inventory was published are revisions to the LULUCF and agriculture sectors.
Details of the changes made to estimates of 1990 and 2013 emissions are given below. Revisions to other years of the time series are of a similar scale.
Table 16: Revisions in the 2014 greenhouse gas inventory, by sector UK, 1990-2014
MtCO2e 1990 emissions 2013 emissions
2013 inventory
2014 inventory
Change
2013 inventory
2014 inventory
Change
Energy Supply 278.3 277.9 -0.4 189.3 189.5 0.1
Transport 121.2 121.9 0.6 116.3 116.6 0.3
Business 115.2 115.4 0.2 90.6 90.9 0.2
Residential 80.3 80.1 -0.1 77.1 77.3 0.2
Agriculture 65.8 58.7 -7.0 53.6 48.1 -5.5
Waste Management
69.1 68.8 -0.4
22.4 21.1 -1.3
Industrial Process 60.0 60.0 0.0 12.8 13.0 0.2
Public 13.5 13.5 0.0 9.5 9.5 -0.1
LULUCF 4.0 0.3 -3.7 -5.2 -8.6 -3.4
Total 807.5 796.6 -10.8 566.5 557.3 -9.2
Source: Table 3, Final UK greenhouse gas emissions national statistics 1990-2014 Data tables
Table 14, Final UK greenhouse gas emissions national statistics 1990-2013 Data tables
Note: Table 14 of 1990-2013 data excludes a small amount of emissions from NF3 that are included in Table 3 of 1990-2014 data.
Changes to emissions factors for urine and dung deposited by grazing animals
Results from a Defra project has identified new country-specific emissions factors for direct nitrous oxide emissions from urine and dung deposited by grazing animals. This has decreased emissions by around 4 MtCO2e in 1990 and by around 3 MtCO2e in 2013.
30
Changes to estimates of emissions from grassland
There have been several specific changes in this area. The emission factor used for grassland drainage on drained organic soils was corrected which decreases emissions across the whole time series; previously the Intergovernmental Panel on Climate Change (IPCC) 2006 emission factor for cultivated organic soils was used. A new variable for grassland has been reported for the first time in the 2016 Inventory, which increases emissions estimates in 1990 and 2013 due to the change between shrubby and non-shrubby grasslands. The methodology and emissions factors for calculating emissions from controlled burning following deforestation were updated to follow the IPCC 2006 guidelines. The 2014 British Geological Society (BGS) Directory of Mines and Quarries included peat sites in Northern Ireland for the first time which has allowed peat extraction areas in Northern Ireland to be assessed using Google Earth as for other administrations rather than relying on literature estimates. More minor updates include the correction of the land use change soils model and changes to carbon stock change estimates. Overall these changes to emissions from grassland have decreased emissions by around 3 MtCO2e in both 1990 and 2013.
Changes to emissions factors for atmospheric deposition of nitrogen in agriculture
New country-specific emissions factors for indirect emissions from atmospheric deposition have been derived directly from the UK agriculture ammonia emissions inventory. This change harmonises the modelling in the UK nitrous oxide and ammonia emission inventories which was identified as an improvement in a previous independent review. These changes have decreased emissions by around 1 MtCO2e in both 1990 and 2013.
Changes to emissions factors for leaching and run-off from agricultural land
Following a Defra project, new country-specific emissions factors for indirect emissions from leaching and run-off have replaced default values. The changes to these emissions factors have decreased emissions by around 1 MtCO2e in both 1990 and 2013.
Other changes to emissions
There was a minor update to the methodology estimating landfill waste emissions in order to bring the method in line with the IPCC 2006 Guidelines. This has increased emissions by a small amount in 1990 and decreased emissions in 2013.
Methane and nitrous oxide emission factors in road transport and fuel consumption factors have been updated to COPERT 4v11 as they are more relevant to current road vehicle emissions estimates. Additionally, the approach taken for normalising fuel consumption to Digest of UK Energy Statistics (DUKES) totals for petrol and diesel has been revised. These changes have increased transport emissions by a small amount in both 1990 and 2013.
Various models have been reviewed and updated from the Industrial Processes sector which provide more detail for reporting, better reflect the current market situation and take into account the 2014 EU F gas regulation.
Overall impact on emissions
In total, the changes made to the methods and data for the 2016 inventory submission have led
to a decrease in 2013 emissions of around 9 MtCO2e and in 1990 of around 11 MtCO2e.
31
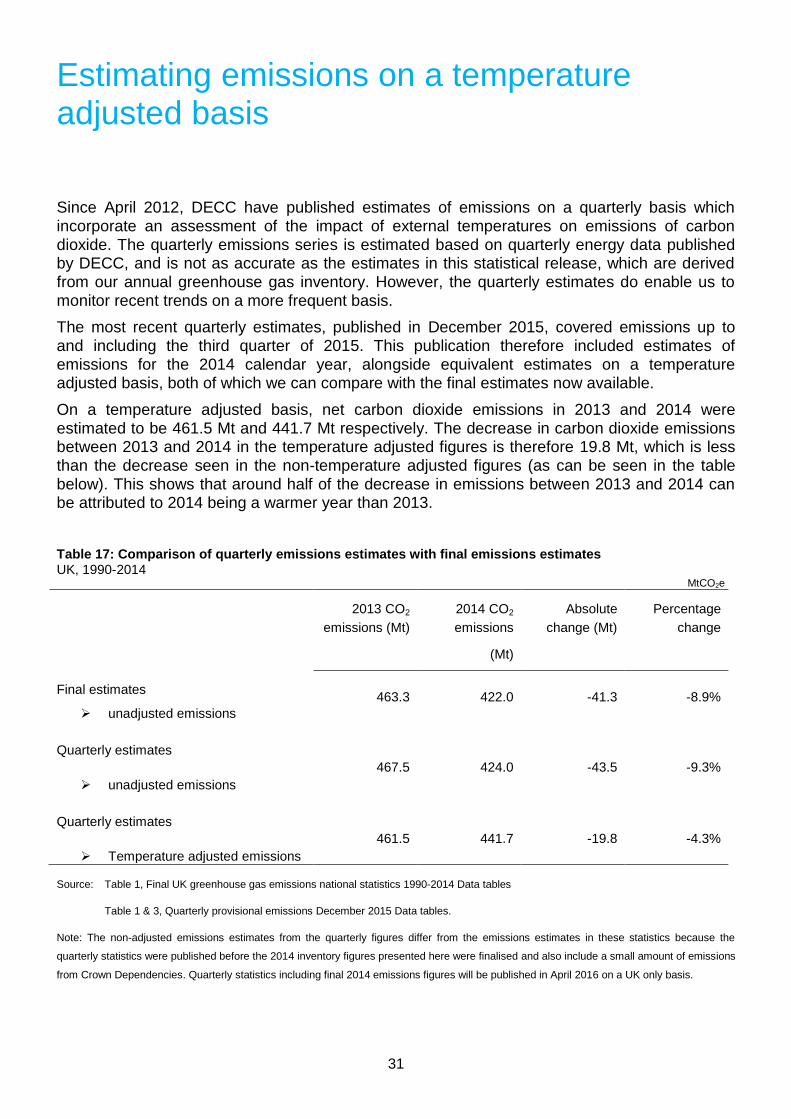
Estimating emissions on a temperature adjusted basis
Since April 2012, DECC have published estimates of emissions on a quarterly basis which incorporate an assessment of the impact of external temperatures on emissions of carbon dioxide. The quarterly emissions series is estimated based on quarterly energy data published by DECC, and is not as accurate as the estimates in this statistical release, which are derived from our annual greenhouse gas inventory. However, the quarterly estimates do enable us to monitor recent trends on a more frequent basis.
The most recent quarterly estimates, published in December 2015, covered emissions up to and including the third quarter of 2015. This publication therefore included estimates of emissions for the 2014 calendar year, alongside equivalent estimates on a temperature adjusted basis, both of which we can compare with the final estimates now available.
On a temperature adjusted basis, net carbon dioxide emissions in 2013 and 2014 were estimated to be 461.5 Mt and 441.7 Mt respectively. The decrease in carbon dioxide emissions between 2013 and 2014 in the temperature adjusted figures is therefore 19.8 Mt, which is less than the decrease seen in the non-temperature adjusted figures (as can be seen in the table below). This shows that around half of the decrease in emissions between 2013 and 2014 can be attributed to 2014 being a warmer year than 2013.
Table 17: Comparison of quarterly emissions estimates with final emissions estimates UK, 1990-2014
MtCO2e
2013 CO2
emissions (Mt)
2014 CO2
emissions
(Mt)
Absolute
change (Mt)
Percentage
change
Final estimates
unadjusted emissions
463.3 422.0 -41.3 -8.9%
Quarterly estimates
unadjusted emissions
467.5 424.0 -43.5 -9.3%
Quarterly estimates
Temperature adjusted emissions
461.5 441.7 -19.8 -4.3%
Source: Table 1, Final UK greenhouse gas emissions national statistics 1990-2014 Data tables
Table 1 & 3, Quarterly provisional emissions December 2015 Data tables.
Note: The non-adjusted emissions estimates from the quarterly figures differ from the emissions estimates in these statistics because the
quarterly statistics were published before the 2014 inventory figures presented here were finalised and also include a small amount of emissions
from Crown Dependencies. Quarterly statistics including final 2014 emissions figures will be published in April 2016 on a UK only basis.
32
Background Information
Coverage of emissions reporting
The emissions reported in this statistical release are defined as by source, meaning emissions are attributed to the sector that emits them directly. These high-level sectors are made up of a number of more detailed sectors, which follow the definitions set out by the Intergovernmental Panel on Climate Change (IPCC15), and which are used in international reporting tables which are submitted to the United Nations Framework Convention on Climate Change (UNFCCC) every year.
The basket of greenhouse gases covered by the Kyoto Protocol consists of seven gases: carbon dioxide, methane, nitrous oxide, hydrofluorocarbons, perfluorocarbons, sulphur hexafluoride and nitrogen trifluoride. The last four gases are collectively referred to as fluorinated gases or F gases. In accordance with international reporting and carbon trading protocols, each of these gases is weighted by its global warming potential (GWP), so that total greenhouse gas emissions can be reported on a consistent basis. The GWP for each gas is defined as its warming influence relative to that of carbon dioxide. Greenhouse gas emissions are then presented in carbon dioxide equivalent units.
Carbon dioxide is reported in terms of net emissions, which means total emissions minus total removals of carbon dioxide from the atmosphere by carbon sinks. Carbon sinks are defined by the UNFCCC as “any process, activity or mechanism which removes a greenhouse gas, an aerosol or a precursor of a greenhouse gas from the atmosphere”. The LULUCF sector is a net sink for the UK.
Unless otherwise stated, any figures included in this release represent emissions from within the UK (excluding its Crown Dependencies: Jersey, Guernsey, and the Isle of Man) and are expressed in millions of tonnes of carbon dioxide equivalent (MtCO2e).
Reporting of greenhouse gas emissions under the Kyoto Protocol is based on emissions in the UK, its Crown Dependencies, and those Overseas Territories (Bermuda, Cayman Islands, Falkland Islands, Gibraltar and Montserrat) that were party to the UK ratification of the Kyoto Protocol for the first commitment period. This includes emissions from all direct flights and shipping between the UK and these Territories. The Kyoto Protocol also uses a narrower definition of carbon sinks than that applied for domestic UK carbon dioxide reporting, which therefore results in a slightly different emissions total.
Reporting of greenhouse gas emissions for the UK’s Carbon Budgets only includes emissions within the UK, and excludes both Crown Dependencies and Overseas Territories.
References to the ‘UK Greenhouse Gas inventory’ refer to the consistent time series of emissions from 1990 to the most recent year which is updated annually and reported to the UN and the EU. The figures in these statistics are consistent with the UK’s greenhouse gas inventory for 2014, although the inventory reported to the UN includes emissions from certain overseas territories which are excluded from these statistics except where specifically stated.
15
IPCC, http://www.ipcc-nggip.iges.or.jp/public/index.html
33
Emissions Trading
Under the UNFCCC and Kyoto Protocol, three flexible mechanisms were established to provide for trading of national allowances and project-based credits by Governments and emitters. These are International Emissions Trading, the Clean Development Mechanism (CDM) and Joint Implementation (JI). In reporting emissions reductions against all of its targets, the UK needs to take account of emissions trading through these flexible mechanisms. At the present time, the scope of the UK’s emissions trading does not extend beyond the European Union Emissions Trading System (EU ETS), although it should be noted that EU ETS participants may also use credits generated under CDM and JI projects, subject to certain limits, in order to comply with their obligations.
The EU ETS operates as a cap and trade system, which means that, currently, any installation within the System in the EU is given an allocation of emissions allowances each year. If the installation’s actual emissions are above this initial allocation for the year in question, then the installation must either purchase allowances through the System, or bring forward some allowances from the following year’s allocation, so as to cover the deficit. Conversely, installations with a surplus of emissions compared with their cap are allowed to either sell allowances or carry them over into the following year’s allocation, thus providing a financial incentive to reduce emissions. As there is a finite limit of allowances in the System (i.e. the cap), any allowances purchased should come from installations which have reduced emissions.
The System is now in Phase III, which will cover the eight year period 2013-2020. Phase III has seen changes to some of the parameters of the system, but there has been no change to the ultimate cap and trade basis of the EU ETS. Final results of the net ETS position are currently available for each year of Phase I, which covered the three year period 2005-2007, and also for each year of Phase II, which covered the period 2008-2012. For UK carbon budget reporting purposes, a notional UK cap must be estimated for each year between 2013 and 2020.
Note that a negative net value indicates that the reported emissions from UK installations in the EU ETS were below the cap, i.e. there was a net selling or withholding of units by UK installations. This means that emissions are either emitted elsewhere or emitted at a later stage, so they may not be used to offset UK emissions. The opposite occurs when reported emissions from EU ETS installations exceed the cap.
In 2012, aviation was included in the EU ETS for the first time, and aircraft operators were required to report their annual emissions and surrender an equivalent number of allowances for all flights from, to and within the European Economic Area (EEA). However UK carbon budgets only cover domestic aviation (that is, aviation within the UK). Taking into account these changes in EU ETS, from 2013 onwards domestic aviation emissions are included in the traded sector for UK carbon budget reporting purposes. To do so requires the calculation of a separate notional cap for UK domestic aviation, covering flights within the UK only.
34
Future updates to emissions estimates
On Thursday 31st March 2016 DECC will publish a breakdown of 1990-2014 UK emissions by end-user sector and fuel type, to supplement the source sector breakdown published today.
On Thursday 31st March 2016 DECC will also publish provisional estimates of UK greenhouse gas emissions for 2015. This will coincide with the publication of Energy Trends statistics, which will include estimates of 2015 UK energy consumption.
Further information and feedback
Further information on UK greenhouse gas emissions statistics, including Excel tables with additional data on UK emissions, can be found on the Gov.uk website at:
https://www.gov.uk/government/organisations/department-of-energy-climate-change/series/uk-
greenhouse-gas-emissions
Notes for Editors
1. A full set of data tables can be accessed via the UK greenhouse gas emissions pages of the Gov.uk
website.
2. This Statistical Release and the related data tables are the first release of data from the National
Atmospheric Emissions Inventory (NAEI) for 1970-2014, produced for DECC and the Devolved
Administrations by Ricardo Energy & Environment. Additional results will be released as they
become available, including a full report to be published later in the year. For further information on
the UK Greenhouse Gas Inventory, see the NAEI web site.
3. Further information about the Kyoto Protocol can be found on the UNFCCC’s website.
4. Further details of the European Union Emissions Trading System can be found at the EU ETS
section of the Gov.uk website.
5. There are uncertainties associated with all estimates of greenhouse gas emissions. Although for any
given year considerable uncertainties may surround the emissions estimates for a pollutant, it is
important to note that trends over time are likely to be much more reliable. For more information on
these uncertainties see the uncertainties factsheet on the Gov.uk website.
6. Under the Climate Change Act, the Annual Statement of Emissions for 2014 must be laid before
Parliament and published no later than 31st March 2016. This will give details of the net UK carbon
account for 2014, which is used to determine compliance with the targets and budgets under the Act.
7. The latest UK energy statistics, including revisions to earlier years’ data, can be found in the 2015
Digest of UK Energy Statistics.
8. Detailed UK temperature data can be found on both the Met Office website and the Energy Statistics
section of the Gov.uk website.
9. When emissions are measured on this basis, UK emissions account for less than 2 percent of the
global total, based on a range of estimates produced by the UN, the IEA, the World Resources
Institute and the EIA, amongst others.
10. Similar results for non-greenhouse gas atmospheric pollutants were published by Defra in December
2015 Emissions of air pollutants in the UK, 1970 to 2014
A National Statistics publication
National Statistics are produced to high professional standards set out in the Official Statistics Code of Practice. They undergo regular quality assurance reviews to ensure they meet customer needs.
© Crown copyright 2016
Department of Energy & Climate Change
3 Whitehall Place
London SW1A 2AW
www.gov.uk/decc
URN 16D/006