2014 nyc real estate market review
TRANSCRIPT

Discussion
• Real Estate Market • Purchasing Overview• Mortgage Overview• Unraveling the Credit Mystery• 2015 is the Right Time
2

2014 Market Review
• Records were broken in 2014– Manhattan surpassed the previous sales volume
peak set in 2008– Manhattan surpassed the average sale and price
per square foot set in 2008
Year Average Sale Price
Average Price Per sf
2014 $1,718.530 1,279
2008 $1,591,823 1,251
3
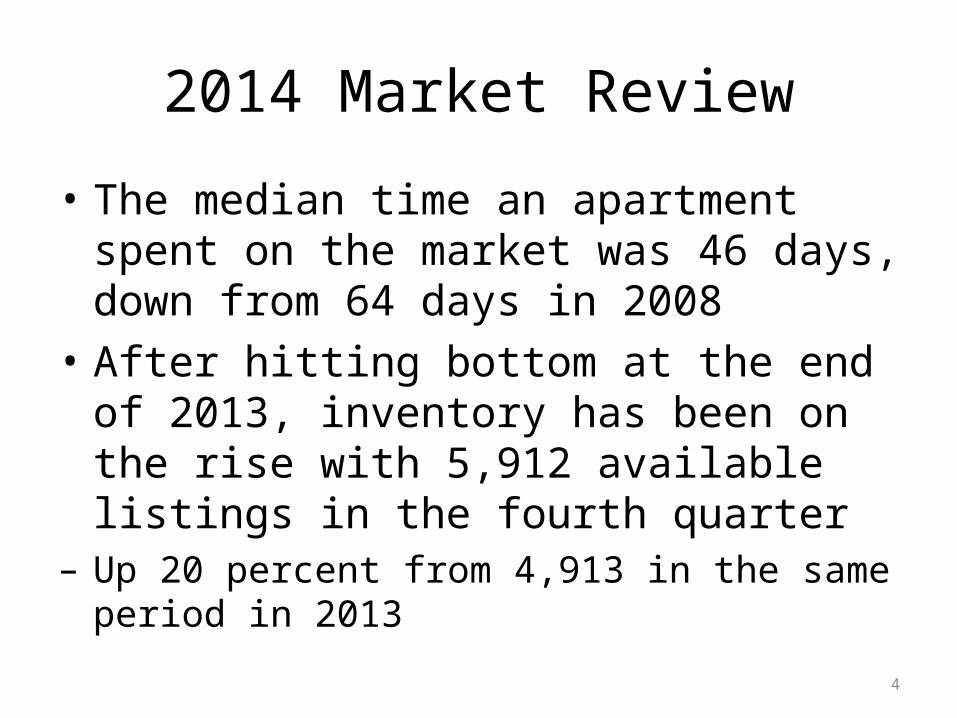
2014 Market Review
• The median time an apartment spent on the market was 46 days, down from 64 days in 2008
• After hitting bottom at the end of 2013, inventory has been on the rise with 5,912 available listings in the fourth quarter
– Up 20 percent from 4,913 in the same period in 2013
4
-21%
5%10%
18% 19% 19%
36%
-30%
-20%
-10%
0%
10%
20%
30%
40%
Per
cent
Cha
nge
2014
ver
sus
2013
Price Range ($)
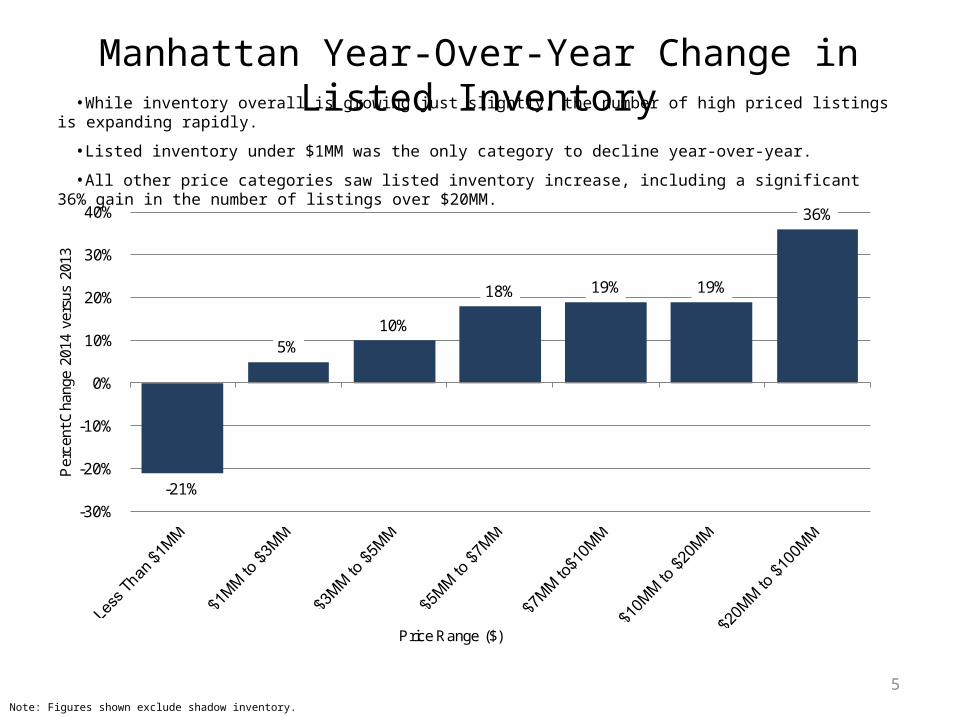
Manhattan Year-Over-Year Change in Listed Inventory•While inventory overall is growing just slightly, the number of high priced listings is expanding rapidly.
•Listed inventory under $1MM was the only category to decline year-over-year.
•All other price categories saw listed inventory increase, including a significant 36% gain in the number of listings over $20MM.
Note: Figures shown exclude shadow inventory.
5

6
Manhattan Average Price Per Square Foot• New development price per square foot increased 30% year-over-year, while resale condos and coops increased by
7% and 12%, respectively.
• Asking price of listed inventory far exceeds closed sales price. New development asking prices are 83% above recent closed sales.
7
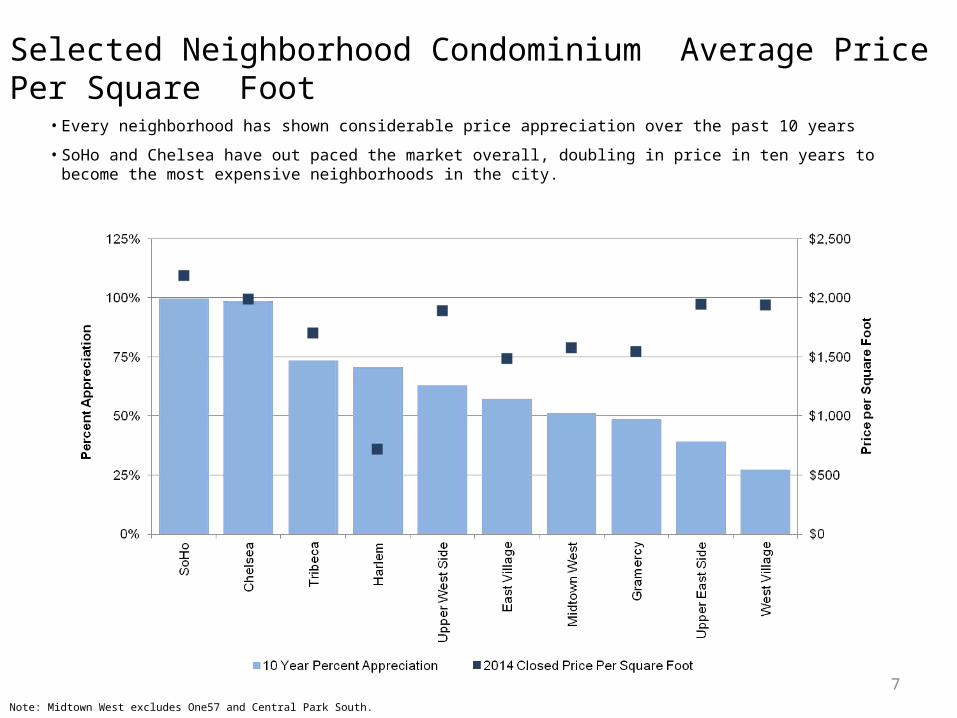
Selected Neighborhood Condominium Average Price Per Square Foot
• Every neighborhood has shown considerable price appreciation over the past 10 years
• SoHo and Chelsea have out paced the market overall, doubling in price in ten years to become the most expensive neighborhoods in the city.
Note: Midtown West excludes One57 and Central Park South.
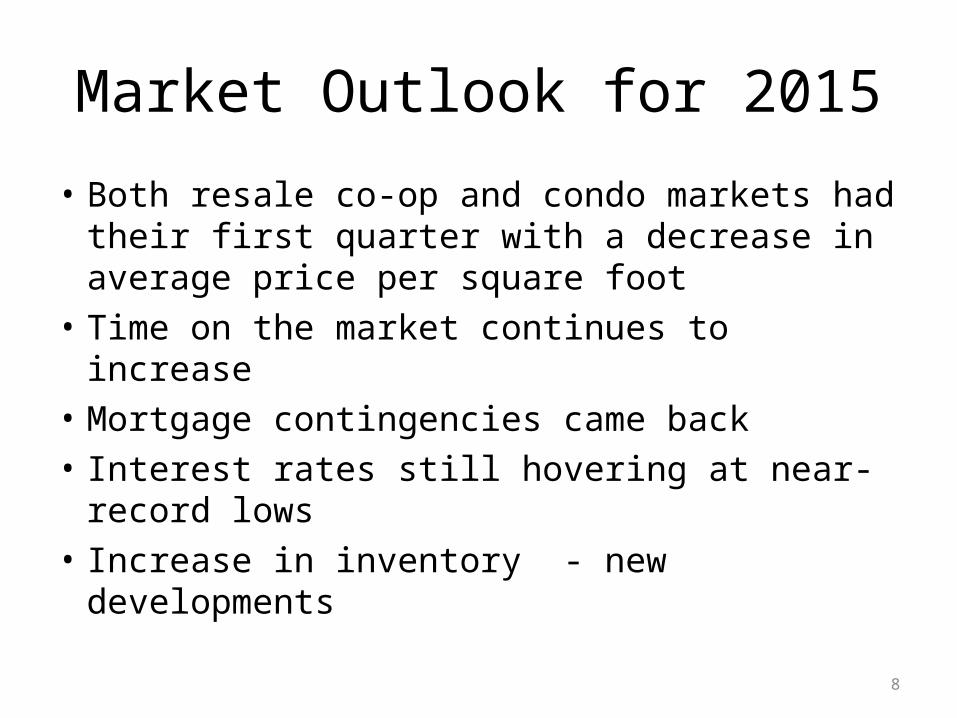
Market Outlook for 2015
• Both resale co-op and condo markets had their first quarter with a decrease in average price per square foot
• Time on the market continues to increase• Mortgage contingencies came back• Interest rates still hovering at near-record
lows• Increase in inventory - new developments
8
9
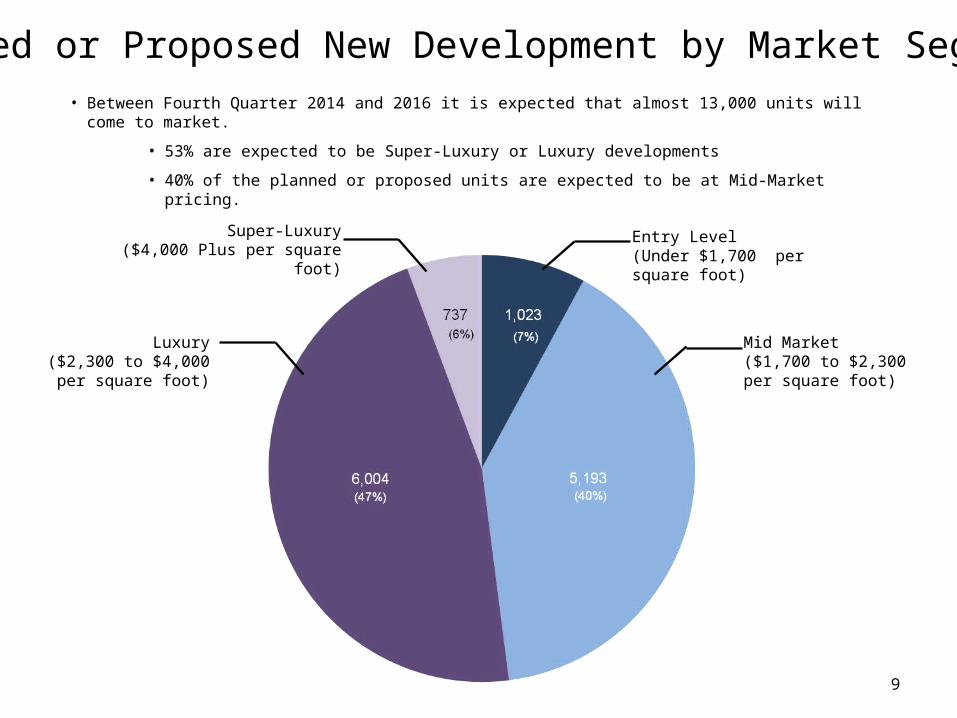
Planned or Proposed New Development by Market Segment• Between Fourth Quarter 2014 and 2016 it is expected that almost 13,000 units will come to market.
• 53% are expected to be Super-Luxury or Luxury developments
• 40% of the planned or proposed units are expected to be at Mid-Market pricing.
Mid Market($1,700 to $2,300 per square foot)
Luxury($2,300 to $4,000 per
square foot)
Entry Level(Under $1,700 per square foot)
Super-Luxury($4,000 Plus per square foot)

The Metro301 West 53rd Street262 Units
Barclay Square100 Barclay Street161 Units
432 West 5255 Units
360 Central Park West50 Units
498 West End Avenue45 Units
Woolworth Tower Residences2 Park Place35 Units
15 Renwick Street31 Units
520 Park Avenue31 Units
101 Tribeca101 Murray Street139 Units
Luxury Pipeline
Selected Upcoming New Developments
Entry Level and Mid-Market Pipeline
Jardim527 West 27th Street36 Units
10
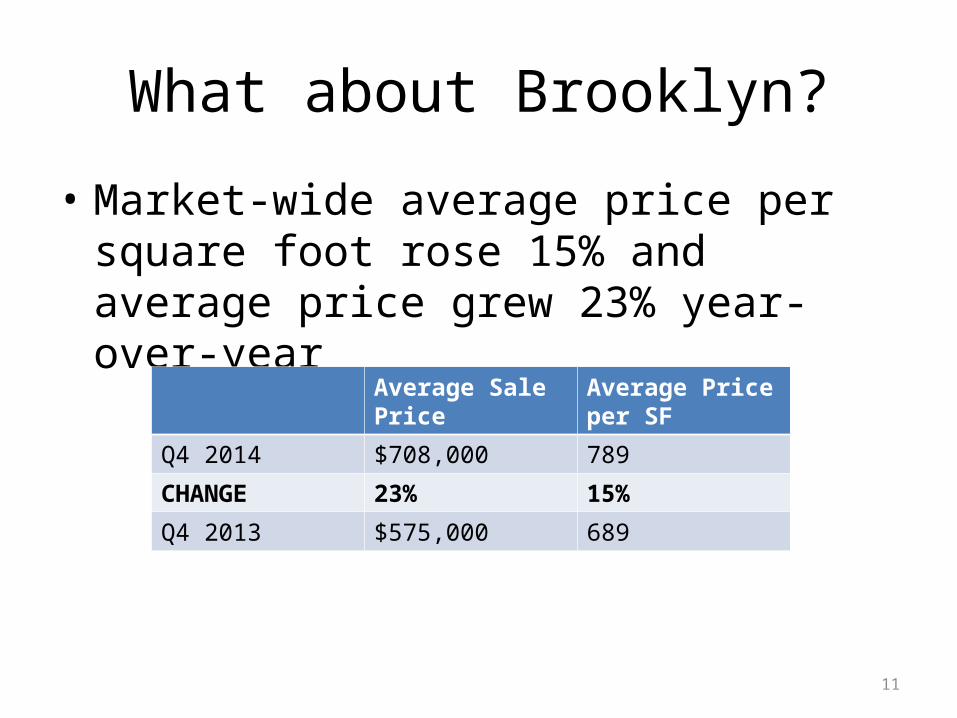
What about Brooklyn?
• Market-wide average price per square foot rose 15% and average price grew 23% year-over-year
Average Sale Price
Average Price per SF
Q4 2014 $708,000 789
CHANGE 23% 15%
Q4 2013 $575,000 689
11

Thank You
Please contact Tracy Sugar, Licensed Real Estate Agent, Corcoran
917-513-5205
12