2014 north carolina international trade report - … · 2014 north carolina international trade...
TRANSCRIPT

0
2014 North Carolina International Trade Report Produced June 2015

1 | 2014 North Carolina Trade Report
2014: A RECORD YEAR FOR NORTH CAROLINA EXPORTS
Collaboration is key to growing global trade
I am pleased to share the latest annual trade report for the state of North Carolina. The report breaks
down the details behind our success – state businesses exported a record $31 billion in merchandise
to international markets in 2014.
The 7 percent growth from 2013 in N.C.-made exports is more than twice the national average growth
of 2.8 percent over the same period. The increase builds upon years of rising exports, which have
contributed to the state’s economic and job growth. North Carolina exports have increased by more
than 40 percent over the past decade.
The Economic Development Partnership of North Carolina’s (EDPNC) international trade division is
committed to helping North Carolina companies enter foreign markets and grow exports. Our
international trade experts – headquartered in North Carolina and in offices in Canada, China, Japan,
Mexico and Europe – help businesses navigate entering and increase their presence in global markets.
The EDPNC has helped companies such as ImmunoReagents, a Raleigh-based supplier of antibodies
for the life science and research markets, grow their global sales by connecting them to major
international trade shows, foreign distributors for their products and more. Between 2011 and 2014, the
percentage of the company’s revenue attributable to international sales grew from 3 percent to 25
percent.
ImmunoReagents CEO Ann Black says reaching out to the EDPNC has provided her business contacts
in the state and internationally. “If I have a question about business or how business is done
somewhere, I go to them,” she says. “If they don’t know the answer, they know someone who does.”
Partner with us
The international trade division of the EDPNC looks forward to continued growth and expansion of
the state’s international markets. To learn more about collaborative opportunities, I invite you to
contact me directly.
Rick Hill, MBA
Director, International Trade
Economic Development Partnership of North Carolina
(919) 447-7757

2 | 2014 North Carolina Trade Report
Overview
WORKING WITH OUR PARTNERS
What North Carolina companies are saying about the EDPNC
The EDPNC works in close partnership with North Carolina companies. Several business executives
offer their perspective on working with the partnership to expand their global markets.
“Participating with [the EDPNC] at Nano Tech 2015 in Tokyo enabled us to further develop
customer and sales channel relationships within Japan, the most important market for our
company. The presence of so many companies that commercialize new materials allowed us
to position ourselves for the largest increase in year-over-year sales within the Japanese
market in our company's history.”
–David Nackashi, CEO of Protochips, developer of analytical tools for understanding nanoscale materials, Raleigh, N.C.
“We recently participated in the N.C. booth at the IFSEC show in New Delhi, India. Exhibiting
at the trade show generated a number of qualified leads with interest in our products, which
can potentially turn into sales orders. The potential in India and Southeast Asia is very
promising, and we really appreciate the Economic Development Partnership of North Carolina
giving us the opportunity to enter new markets and co-exhibit with the support and backing of
the state government… [EDPNC International Trade Manager] Kuldip Wasson’s personal
knowledge of the culture and business practices was extremely helpful throughout the trade
show.”
–Chris Carpenter, director of sales, Advanced Detection Technology, manufacturer of under-
vehicle inspection systems, Mooresville, N.C.
“We have found significant benefits through the EDPNC export promotion office, particularly in
Japan, where N.C. trade director Sumio Shibata has been one of the reasons for our success.
He is a real credit to his country and culture, and a very astute and focused businessman.
Without his help interpreting and traveling with us, we would have been lost in Japan.”
–Dyke Messinger, president, Power Curbers, Inc., maker of slipform concrete paving
equipment, Salisbury, N.C.
“We took a STEP grant [travel reimbursements administered by the EDPNC] to MEDICA, an
international meeting held in Dusseldorf, Germany, every November…. We were able to meet one
of our new distributors in Germany, we were able to travel to their facility. We are on two different
sides of the ocean. It’s an immense help to be able to meet people face to face. We were actually
able to go to their company, we were able to walk through how they were trying to sell our products
and what they needed from us to sell our products better.”
–Ann Black, founder and CEO of ImmunoReagents, supplier of antibodies for the life science
and research markets, Raleigh, N.C.

3 | 2014 North Carolina Trade Report
2014 NORTH CAROLINA ANNUAL TRADE REPORT
Record Exports: North Carolina exported more than $31 billion of goods in 2014 North Carolina reached another export milestone in 2014 as it exported more than $31 billion worth of goods
in 2014 – an increase of 6.7% in nominal terms (not taking into account inflation), or 7.4% in real terms.1 Exports
from the state have grown nearly 30% over the past five years, and more than 40% over the past decade.
Despite a strengthening U.S. dollar (which makes U.S.-produced goods more expensive) and a comparatively
week global economy, U.S. exports grew 2.8% in nominal terms in 2014, or 3.5% in real terms.
Industry Trends: Chemical leads, but Machinery and Transportation growing fast. Chemicals continue as North Carolina’s largest export product as it grew 4% to $5.7 billion in 2014. More than
40% of the Chemicals category is composed of Pharmaceuticals, which grew more than 20% in 2014, to $2.4
billion. Machinery was the state’s second-largest export product at $4.1 billion, although it fell approximately
3% in 2014. Transportation Equipment exports accelerated in 2014, growing nearly 25% to more than $4 billion.
That growth is led by Aerospace, where exports jumped nearly 70% to more than $2 billion. Computer and
Electronic exports grew 12% over the past year and continue to climb back from recession lows. Textile and
Fabric exports also posted a 7% gain in 2014, but have remained relatively flat over the past decade.
1 Please note that unless otherwise indicated, all the data has been adjusted into constant 2014 dollars using the U.S. Bureau of Economic
Analysis annual export price deflator.

4 | 2014 North Carolina Trade Report
OVERVIEW: Chemicals largest export, Canada largest market
Top Markets: More than $1 billion in exports to eight countries Three more countries (Germany, United Kingdom, and Saudi Arabia) entered the “billion-dollar club” for North
Carolina exports in 2014. Canada continues as the state’s largest export market, receiving $6.7 billion in North
Carolina exports (approximately 21% of the state’s total exports). As in 2013, Mexico, China and Japan ranked
second, third and fourth. Saudi Arabia rounded out the top five. Exports to Saudi Arabia increased considerably,
surpassing four of our European partners. These top five markets accounted for just under half of North
Carolina’s total exports in 2014.
Top 20 Export Markets
2014
RankExport Market
2014
Exports
1 Year %
Change
5 Year %
Change
Top General Export
Product (3-Digit NAICS)
Top Specific Export
Product (4-Digit NAICS)
1 Canada $6,736M 0.7% 32.9% Chemicals Pharmaceuticals
2 Mexico $3,012M 11.6% 84.8% Chemicals Basic Chemicals
3 China $2,661M -0.5% 32.7% Computer & Elec. Semiconductors, etc.
4 Japan $1,747M 5.2% 3.1% Chemicals Pharmaceuticals
5 Saudi Arabia $1,190M 50.2% 269.3% Transportation Eqp. Aerospace
6 France $1,143M 15.0% 9.6% Transportation Eqp. Aerospace
7 United Kingdom $1,028M 15.2% 28.4% Chemicals Aerospace
8 Germany $1,009M 1.7% 12.2% Chemicals Pharmaceuticals
9 Hong Kong $928M 20.7% 84.3% Computer & Elec. Semiconductors, etc.
10 Belgium $886M 11.5% 136.1% Machinery Industrial Machinery
11 Honduras $841M 11.4% 16.8% Textiles & Fabrics Fibers, Yarns, Threads
12 Netherlands $790M 11.1% -53.7% Chemicals Pharmaceuticals
13 Brazil $666M -9.8% 0.2% Chemicals Aerospace
14 South Korea $649M -5.2% 21.9% Chemicals Semiconductors, etc.
15 Australia $470M 2.1% -41.1% Chemicals Pharmaceuticals
16 India $422M -11.7% 101.4% Chemicals Pesticides/Fertilizers
17 Singapore $388M 13.9% 77.4% Metal Nonferrous Metal
18 Dominican Republic $340M 33.6% 21.2% Textiles & Fabrics Fibers, Yarns, Threads
19 Ireland $277M 7.0% 28.9% Computer & Elec. Computer Eqp.
20 Taiwan $273M -10.0% -7.6% Food Food - Other
Canada $6,736,419,150 Canada $1,218,687,055 Canada $1,169,101,968
Mexico $3,011,731,437 Mexico $658,301,290 Mexico $518,538,233
China $2,661,352,101 Japan $550,088,452 Belgium $400,727,418
Japan $1,747,159,635 Germany $342,916,801 China $198,285,331
Saudi Arabia $1,190,418,009 China $279,986,903 Saudi Arabia $151,260,247
All Countries $31,290,511,364 All Countries $5,718,758,067 All Countries $4,060,693,103
Canada $995,052,470 Hong Kong $630,937,059 Honduras $695,433,664
France $742,817,924 Canada $584,671,164 Mexico $317,895,177
Saudi Arabia $613,448,442 China $484,805,683 Dominican Republic $233,080,598
Mexico $259,684,636 Mexico $191,413,285 Canada $205,886,245
Kuwait $228,176,225 Japan $148,352,693 El Salvador $135,228,594
All Countries $4,018,023,285 All Countries $3,185,987,538 All Countries $2,013,897,454
* Totals are for all NC exports for that industry, not just the top five countries listed in each category.
TOTAL EXPORTS Chemicals Machinery
Transportation Equipment Computer & Electronics Textiles & Fabrics

5 | 2014 North Carolina Trade Report
#1 Canada TOP EXPORT MARKETS
Canada continues to be North Carolina’s largest trading destination Canada maintained its position as North Carolina’s largest export destination by a large margin in 2014, receiving
more than $6.7 billion in exports. 2014 export growth was roughly flat, and real merchandise exports climbed only
slightly to 0.7%. Growth in Chemicals and Electric Equipment exports were tempered by decreases in Machinery
and Transportation Equipment exports. A strengthening U.S. dollar, especially in the latter half of 2014, may have
played a role in moderating export growth to the North.
*Numbers are rounded and may not sum exactly
North Carolina State Rank – Exports to Canada
Region NC Rank - 2014 Region Export Growth
National #14 (#14 in 2013) -2.7% (NC +0.7%)
Southeast #3 (#3 in 2013) -0.3% (NC +0.7%)
Industry Notes
Chemicals remained North Carolina
largest export product to Canada at $1.2
billion, rising about 6.0% in 2014.
o Pharmaceuticals lead the growth
with a 19% increase in export
volume. This accounts for more than
half of all Chemical exports.
Electrical Equipment exports grew more
than 27% in 2014 – now at $619 million.
o Within what NAICS categorizes as
“Other,” the Harmonized System
shows a 64% jump in Insulated Wires
& Cables, to $217 million (HS 8544).
Machinery exports declined by
approximately 3% due to weakness in
Agricultural and Construction Machinery
exports.
Transportation exports were also down,
falling 8% on a decline in Motor Vehicle
exports.
U.S. merchandise exports to Canada fell
2.7% in 2014. Exports from the
Southeast fell a minimal 0.3%.
Country Notes
A strengthening U.S. dollar likely hampered U.S. and
North Carolina exports to Canada. The strengthening
dollar in the second half of 2014 caused exchange
rates to increase slightly.
Ontario and Quebec (and their manufacturing,
finance, and service sectors) currently produce more
than half of Canada’s GDP. However, the fall in
energy prices may negatively impact the economy in
the country’s western provinces – especially Alberta.
Canada’s GDP growth is expected to slightly lag U.S.
growth in 2015, rising 1.4-2.9% (vs. 2.5-3.4% for the
U.S.)
6 | 2014 North Carolina Trade Report
#2 Mexico TOP EXPORT MARKETS
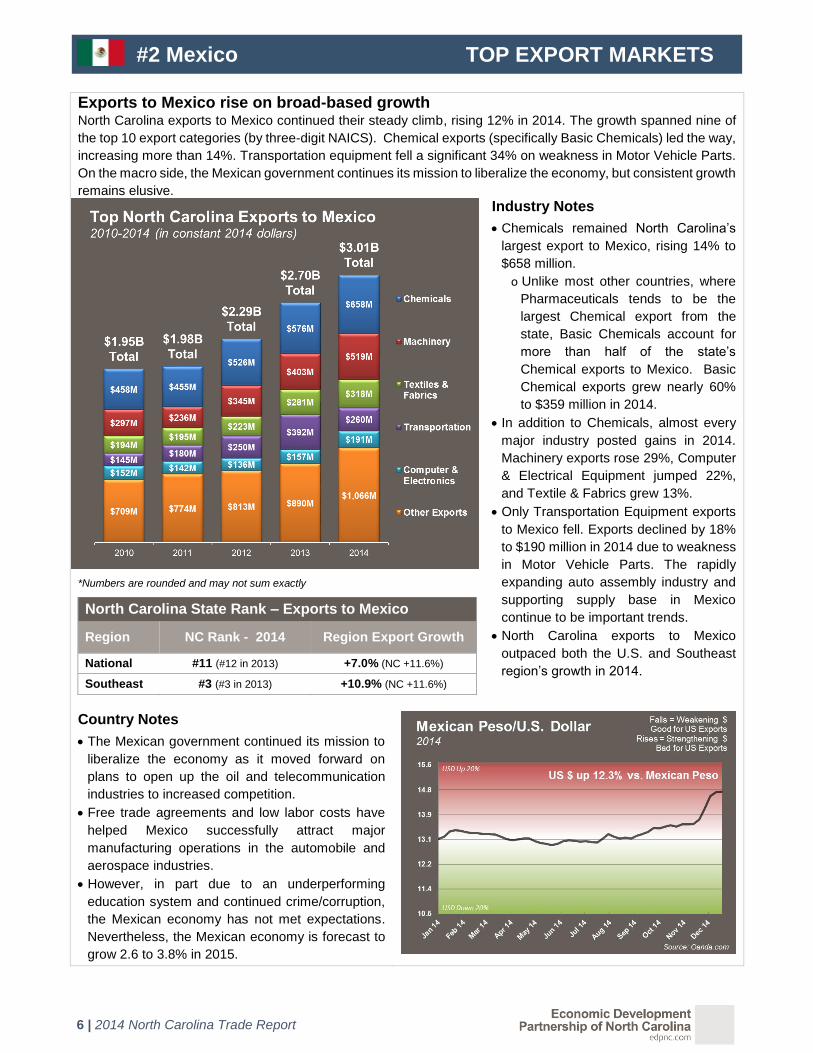
Exports to Mexico rise on broad-based growth North Carolina exports to Mexico continued their steady climb, rising 12% in 2014. The growth spanned nine of
the top 10 export categories (by three-digit NAICS). Chemical exports (specifically Basic Chemicals) led the way,
increasing more than 14%. Transportation equipment fell a significant 34% on weakness in Motor Vehicle Parts.
On the macro side, the Mexican government continues its mission to liberalize the economy, but consistent growth
remains elusive.
*Numbers are rounded and may not sum exactly
North Carolina State Rank – Exports to Mexico
Region NC Rank - 2014 Region Export Growth
National #11 (#12 in 2013) +7.0% (NC +11.6%)
Southeast #3 (#3 in 2013) +10.9% (NC +11.6%)
Industry Notes
Chemicals remained North Carolina’s
largest export to Mexico, rising 14% to
$658 million.
o Unlike most other countries, where
Pharmaceuticals tends to be the
largest Chemical export from the
state, Basic Chemicals account for
more than half of the state’s
Chemical exports to Mexico. Basic
Chemical exports grew nearly 60%
to $359 million in 2014.
In addition to Chemicals, almost every
major industry posted gains in 2014.
Machinery exports rose 29%, Computer
& Electrical Equipment jumped 22%,
and Textile & Fabrics grew 13%.
Only Transportation Equipment exports
to Mexico fell. Exports declined by 18%
to $190 million in 2014 due to weakness
in Motor Vehicle Parts. The rapidly
expanding auto assembly industry and
supporting supply base in Mexico
continue to be important trends.
North Carolina exports to Mexico
outpaced both the U.S. and Southeast
region’s growth in 2014.
Country Notes
The Mexican government continued its mission to
liberalize the economy as it moved forward on
plans to open up the oil and telecommunication
industries to increased competition.
Free trade agreements and low labor costs have
helped Mexico successfully attract major
manufacturing operations in the automobile and
aerospace industries.
However, in part due to an underperforming
education system and continued crime/corruption,
the Mexican economy has not met expectations.
Nevertheless, the Mexican economy is forecast to
grow 2.6 to 3.8% in 2015.
The dollar strengthened against the Mexican peso
in late 2014, putting pressure on U.S. exports.

7 | 2014 North Carolina Trade Report
#3 China TOP EXPORT MARKETS
N.C. exports to China remain stable over the past four years North Carolina merchandise exports to China fell ever so slightly in 2014, down just 0.5%. Computer & Electronic
and Paper exports increased, but Chemicals and Agricultural Products abated slightly. On the macro side, world
markets continue to keep a close eye on a potential slowdown in China’s breakneck economic growth. The USD
to CNY exchange rate remained stable for most of 2014.
*Numbers are rounded and may not sum exactly
North Carolina State Rank – Exports to China
Region NC Rank - 2014 Region Export Growth
National #13 (#13 in 2013) +2.6% (NC -0.5%)
Southeast #5 (#4 in 2013) +1.2% (NC -0.5%)
Industry Notes
Computer & Electronic goods were
North Carolina’s largest export to China
in 2014, growing 16% to $485 million.
o Semiconductors & Other Electronic
Equipment (e.g., circuit boards,
semiconductors and capacitors)
make up a majority of the Computer
and Electronics export category.
The subsector grew nearly 20%, to
$416 million.
Paper exports grew 23%, to $220 million
in 2014.
o Much of the growth stemmed from
Pulp, Paper, & Paperboard exports
growing 21%.
North Carolina food exports (mainly
pork) were steady from 2013 to 2014.
Chemicals posted a 5% fall in 2014.
o While Resins and Synthetic Rubber/
Fibers posted a 10% gain,
Pharmaceuticals and Basic
Chemicals posted losses of 18% and
25% respectively.
U.S. and Southeast regional exports
both outpaced North Carolina exports to
China in 2014, as they rose 2.6% and
1.2%, respectively.
Country Notes
While most countries would be elated by the levels
of economic growth China is forecasting for 2015
and beyond, the forecast 6.5 to 7.3% for 2015 is a
significant fall for a country that has grown
accustomed to double-digit growth.
In trade news, China continues to push its own
Asian free-trade agreement (the Asia Pacific Trade
Agreement) while the U.S., Japan and other
countries push for an agreement that currently
excludes China (the Trans-Pacific Partnership
trade agreement). Outcomes of these separate
negotiations will significantly impact U.S. trade with
China and Asia generally.

8 | 2014 North Carolina Trade Report
#4 Japan TOP EXPORT MARKETS
Export volume to Japan increases despite depreciating yen and weak macro conditions North Carolina exports to Japan grew to more than $1.7 billion, a 5% gain over 2013. Chemicals, Computers &
Electronic Equipment, and Electrical Equipment exports grew, offsetting the drop in Beverage & Tobacco and
Food exports. The Japanese yen depreciated considerably in 2014, by design as part of Japanese policymakers’
attempts to stimulate export growth and its economy overall, which put downward pressure on U.S. exports.
*Numbers are rounded and may not sum exactly
North Carolina State Rank – Exports to Japan
Region NC Rank - 2014 Region Export Growth
National #8 (#10 in 2013) +3.4% (NC +5.2%)
Southeast #2 (#3 in 2013) +1.2% (NC +5.2%)
Industry Notes
Chemical exports continued to be North
Carolina’s top export to Japan, rising
20% in 2014.
o While most Chemical subsectors fell
in 2014, Pharmaceutical exports
skyrocketed, growing 128%, or $228
million, in 2014. Pharmaceuticals
comprised almost three quarters of
all Chemical exports to Japan, up
from just a third in 2013.
Computer & Electronics increased by
44%, to $148 million. Electrical
Equipment grew fivefold from $20
million in 2013 to $111 million in 2014.
Consumer non-durable exports to Japan
fell in 2014, with Beverage & Tobacco
exports falling 3% and Food exports
falling 25%.
o A 2.3% fall in Tobacco Products
caused most of the decline in
Beverage & Tobacco exports.
o Decreased pork exports contributed
to the decline in Food exports.
Despite trade headwinds, North
Carolina outperformed both national and
regional exports to Japan.
Country Notes
Japan continues its Abenomics economic policies
to lift the nation out of years of economic
stagnation. On the trade side, various monetary
and fiscal stimuli dramatically weakened the yen
and made U.S. products more expensive in Japan.
In part due to a sales tax increase, Japanese GDP
fell significantly in 2Q and 3Q 2014 before posting
a 2.2% annualized growth number for 4Q 2014.
Japan’s 2015 GDP is forecast to rise only 0.4 to
1.6%.

9 | 2014 North Carolina Trade Report
#5 Saudi Arabia TOP EXPORT MARKETS
NC Aerospace and Military exports to Saudi Arabia rise more than 50% Exports to the Kingdom of Saudi Arabia have grown in recent years but took a major leap forward in 2014, rising
50% to $400 million. Increases in Aerospace exports led most of the growth. Under the Harmonized System, this
growth stems from Military Equipment exports.
*Numbers are rounded and may not sum exactly
North Carolina State Rank – Exports to Saudi Arabia
Region NC Rank - 2014 Region Export Growth
National #2 (#6 in 2013) -0.6% (NC +50.2%)
Southeast #1 (#1 in 2013) +17.0% (NC +50.2%)
Industry Notes
Under the NAICS categorization
system, more than half ($613 million) of
North Carolina exports to Saudi Arabia
is classified as Transportation
Equipment, with the majority of those
exports under the subcategories of
Aerospace Products and Non-Classified
Transportation Equipment.
Under the Harmonized System, the
majority of these exports are
categorized as Arms and Ammunition.
Exports in this category grew from only
$16 million in 2013 to almost $400
million in 2014.
o Similarly, Tanks and Armored
Vehicles exports grew 58%.
o More research is needed to
determine if North Carolina
companies producing transportation
equipment drove this export growth
and/or if the growth is connected to
the state’s military presence.
On the downside, Machinery exports fell
25% in 2014.
o A 46% fall in Engine & Turbine
exports led the broad-based decline
in Machinery exports.
Country Notes
Saudi Arabia continues to increase its military
spending. A recent report indicated that the
Kingdom boosted its defense expenditures by 17%
in 2014. The country has one of the largest military
budgets in the world (either the third- or fourth-
largest, depending on the reporting source).
Saudi Arabia pegs its currency, the riyal, to the U.S.
dollar, so there are rarely currency fluctuations that
impact international trade.

10 | 2014 North Carolina Trade Report
OUTLOOK AND NOTES
2015 Trade Outlook Like any macroeconomic indicator, International trade flows are affected by a variety of factors. Two main factors
are likely to act as headwinds for U.S. export prospects in 2015:
Strength of the U.S. dollar The U.S.
dollar has strengthened considerably
over the past year. The chart to the
right gives a simple summary of that
strengthening against a basket of
other currencies since mid-2014. The
U.S. economy will likely outperform
other major economies in the short
term. This projected performance,
combined with prospects of a near-
term U.S. interest rate hike, suggests
that the strength of and demand for
the U.S. dollar will continue to rise. A
strong dollar can dampen exports
because it makes U.S. products more
expensive relative to foreign goods.
Slower global economic growth Although it is difficult to predict economic trends, global growth has been
restrained over the last few quarters. The Eurozone continues to fight anemic growth, China faces a potential
slowdown, and Japan has been trapped in weak growth for years (although just recently posting relatively strong
1Q 2015 growth). Slow growth abroad limits the ability of U.S. and North Carolina firms to sell their products.
Despite these headwinds, North Carolina merchandise exports increased in the first two months of 2015 compared
to the same period in 2014. We will see if that trend continues as the year progresses.
Regional trade agreements are another major development to watch in the coming year(s). The U.S. continues
negotiations on the Trans-Pacific Partnership with its Latin American, Oceanic and Asian partners. Whether these
dealings will result in a new trade agreement and new trade opportunities depends heavily on both international
negotiations and U.S. domestic policies (e.g., authorization of fast-track trade authority) that may take months or
years to play out.
Notes The trade report highlights the state’s merchandise exports only, as statistics for service exports are not available at the state level. Export
statistics in this report are from WISERTrade which uses the U.S. Census Bureau’s Origin of Movement (OM) series. The OM series provide
export statistics based on the state from which the merchandise starts its journey to the port of export; that is, the data reflect the transportation
origin of exports. The transportation origin of exports is not always the same as the location where the goods were produced. More information
about export statistics can be found at the U.S. Census website: http://www.census.gov/foreign-trade/aip/elom.html
Unless otherwise noted, all trade statistics are reported in 2014 dollars using the U.S. Bureau of Economic Analysis’s export price deflators via
the St. Louis Federal Reserve’s FRED database, which allows for more appropriate comparisons across time.
Regional divisions are developed by the Bureau of Economic Analysis. The Southeast Region consists of 12 states: Alabama, Arkansas, Florida,
Georgia, Kentucky, Louisiana, Mississippi, North Carolina, South Carolina, Tennessee, Virginia and West Virginia.
Foreign exchange data was collected from Oanda.com using the weekly FX average, and the midpoint of the Bid/Ask. Data can be found at:
http://www.oanda.com/currency/historical-rates/
Country notes were gathered from various media sources including The Wall Street Journal, The Economist, and Bloomberg. Specific GDP
forecast data are from The Economist’s poll of Forecasters (April 11, 2015 edition).
For questions on this report, please do not hesitate to contact the International Trade team at EDPNC at 919-703-5348, or the Research team
at 919-447-7744.

20
Economic Development Partnership of North Carolina 15000 Weston Parkway Cary, NC 27513 edpnc.com