2014 maryland higher education commission data … · robert a. wilmot john w. yaeger danette g....
TRANSCRIPT
Data BookMaryland Higher Education CommissionData Book
2014
creating a state of
AchievementMHEC

Martin O’ Malley Anthony G. Brown Governor Lt. Governor
Maryland Higher Education Commision
Anwer Hasan, Chairman
Sandra L. Jimenez, Vice Chairman
Brandon G. Bell
Vivian S. Boyd
Ian MacFarlane
Edith J. Patterson
Joel Packer
Gregory A. Schuckman
Rizwan A. Siddigi
Robert A. Wilmot
John W. Yaeger
Danette G. HowardSecretary of Higher Education

Table of ContentsCOMPARATIVE HIGHER EDUCATION STATISTICS: MARYLAND AND THE NATION 1
sTuDEnTs
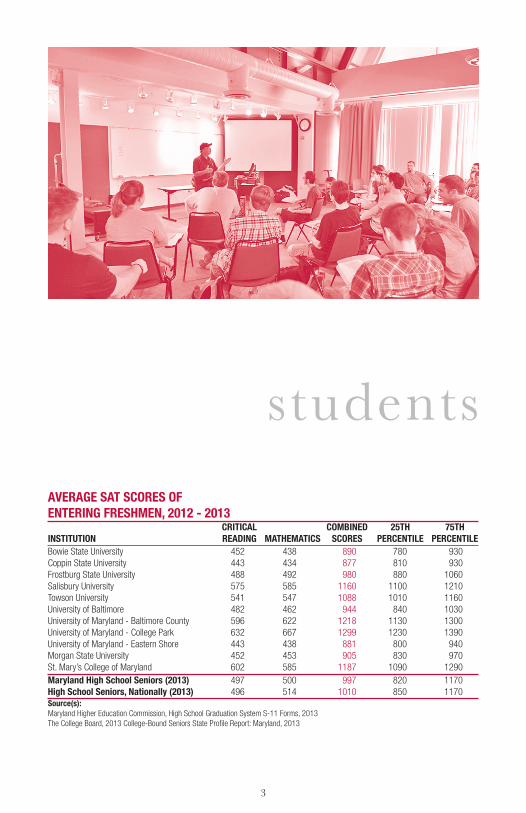
AVERAGE SAT SCORES OF ENTERING FRESHMEN, 2012 - 2013 3
UNDERGRADUATE ENROLLMENT, FALL 2012 4
GRADUATE AND PROFESSIONAL ENROLLMENT, FALL 2012 6
ENROLLMENT BY RACE AND BY GENDER, FALL 2012 8
REMEDIATION RATES OF MARYLAND HIGH SCHOOL GRADUATES ENROLLED AT MARYLAND PUBLIC INSTITUTIONS, 2010-2011 12
REMEDIATION RATES OF MARYLAND HIGH SCHOOL GRADUATES BY PLACE OF RESIDENCE, 2010-2011 13
PERCENTAGE PELL ENROLLMENT BY INSTITUTION, FALL 2011 14
rETEnTiOn & GrADuATiOn
RETENTION AND GRADUATION AT FOUR-YEAR PUBLIC INSTITUTIONS IN MARYLAND 15
FOUR-YEAR COMMUNITY COLLEGE GRADUATION AND TRANSFER RATES, ENTERING CLASS OF 2008 16
NUMBER OF COMMUNITY COLLEGE STUDENTS TRANSFERRING TO PUBLIC FOUR-YEAR INSTITUTIONS IN 2011-2012 16
DEGrEEs
DEGREES BY INSTITUTION, 2012-2013 18
DEGREES BY MAJOR PROGRAM: BACHELORS, MASTERS & DOCTORAL DEGREE PROGRAMS, 2012-2013 20
DEGREES BY MAJOR PROGRAM: CERTIFICATE AND ASSOCIATES DEGREE PROGRAMS, 2012-2013 20
DEGREES BY RACE/ETHNICITY AND BY GENDER, 2012-2013 21
fACulTy
FULL-TIME AND PART-TIME FACULTY, FALL 2012 22
AVERAGE SALARY OF FULL-TIME FACULTY, FALL 2012 23
FULL-TIME FACULTY BY RACE/ETHNICITY AND BY GENDER, FALL 2012 24
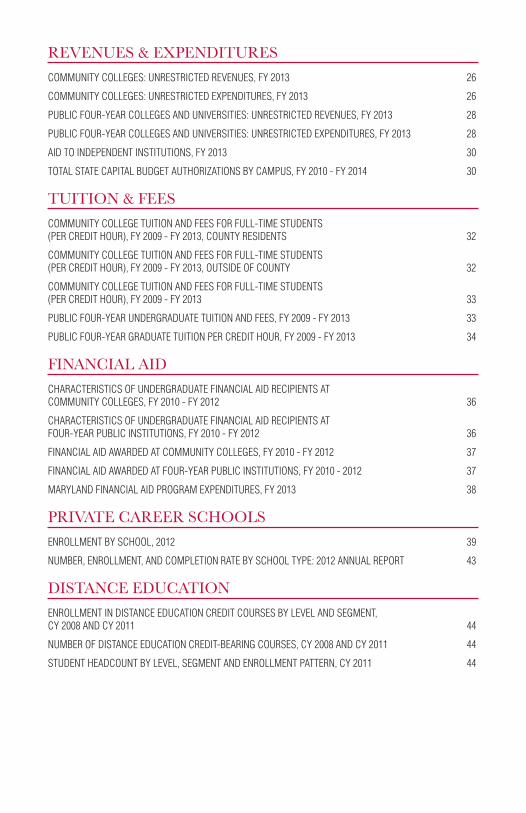
rEvEnuEs & ExpEnDiTurEs
COMMUNITY COLLEGES: UNRESTRICTED REVENUES, FY 2013 26
COMMUNITY COLLEGES: UNRESTRICTED EXPENDITURES, FY 2013 26
PUBLIC FOUR-YEAR COLLEGES AND UNIVERSITIES: UNRESTRICTED REVENUES, FY 2013 28
PUBLIC FOUR-YEAR COLLEGES AND UNIVERSITIES: UNRESTRICTED EXPENDITURES, FY 2013 28
AID TO INDEPENDENT INSTITUTIONS, FY 2013 30
TOTAL STATE CAPITAL BUDGET AUTHORIZATIONS BY CAMPUS, FY 2010 - FY 2014 30
TuiTiOn & fEEs
COMMUNITY COLLEGE TUITION AND FEES FOR FULL-TIME STUDENTS (PER CREDIT HOUR), FY 2009 - FY 2013, COUNTY RESIDENTS 32
COMMUNITY COLLEGE TUITION AND FEES FOR FULL-TIME STUDENTS (PER CREDIT HOUR), FY 2009 - FY 2013, OUTSIDE OF COUNTY 32
COMMUNITY COLLEGE TUITION AND FEES FOR FULL-TIME STUDENTS (PER CREDIT HOUR), FY 2009 - FY 2013 33
PUBLIC FOUR-YEAR UNDERGRADUATE TUITION AND FEES, FY 2009 - FY 2013 33
PUBLIC FOUR-YEAR GRADUATE TUITION PER CREDIT HOUR, FY 2009 - FY 2013 34
finAnCiAl AiD
CHARACTERISTICS OF UNDERGRADUATE FINANCIAL AID RECIPIENTS AT COMMUNITY COLLEGES, FY 2010 - FY 2012 36
CHARACTERISTICS OF UNDERGRADUATE FINANCIAL AID RECIPIENTS AT FOUR-YEAR PUBLIC INSTITUTIONS, FY 2010 - FY 2012 36
FINANCIAL AID AWARDED AT COMMUNITY COLLEGES, FY 2010 - FY 2012 37
FINANCIAL AID AWARDED AT FOUR-YEAR PUBLIC INSTITUTIONS, FY 2010 - 2012 37
MARYLAND FINANCIAL AID PROGRAM EXPENDITURES, FY 2013 38
privATE CArEEr sCHOOls
ENROLLMENT BY SCHOOL, 2012 39
NUMBER, ENROLLMENT, AND COMPLETION RATE BY SCHOOL TYPE: 2012 ANNUAL REPORT 43
DisTAnCE EDuCATiOn
ENROLLMENT IN DISTANCE EDUCATION CREDIT COURSES BY LEVEL AND SEGMENT, CY 2008 AND CY 2011 44
NUMBER OF DISTANCE EDUCATION CREDIT-BEARING COURSES, CY 2008 AND CY 2011 44
STUDENT HEADCOUNT BY LEVEL, SEGMENT AND ENROLLMENT PATTERN, CY 2011 44


1
COMPARATIVE HIGHER EDUCATION STATISTICS: MARYLAND AND THE NATION MARYLAND NATION
Educational Attainment (2012)At least Some College 62.5% 57.5%At least an Associate Degree 42.6% 36.2%At least a Bachelor’s Degree 36.4% 28.5%At least a Graduate or Professional Degree 16.4% 10.6%College freshmen who had graduated from high school in the same state (2010) 81.2% 81.4%
SAT Scores for High School Seniors (2013)Mean Mathematics Score 500 514Mean Critical Reading Score 497 496Mean Combined Math and Critical Reading 997 1010Mean Writing Score 486 488
Projected Change in the Number of High School GraduatesFY2013 to FY20221 3.9% 7.9%
Higher Education Enrollments (Fall 2012)% Undergraduate 80.8% 85.9%% Women 57.1% 56.8%
% African American 27.0% 13.2%% Hispanic 6.3% 14.5%% Asian 6.3% 5.4%% White 48.8% 53.7%% All Minorities 36.3% 36.5%% Foreign 4.7% 3.7%
Distribution of Campus Enrollments (Fall 2012)Public 2-year Institutions 39.7% 32.6%Public 4-year Institutions 39.3% 39.0%Private Institutions 21.1% 28.5%Projected Increase at Public Two-Year Campuses (Fall 12 to Fall 21)2 15.5% 12.2%Projected Increase at Public Four-Year Campuses (Fall 12 to Fall 21)2 18.7% 11.2%
Distribution of Degrees Conferred (2011-2012)Associates Degrees 22.2% 32.6%Bachelor’s Degrees 46.7% 39.0%Master’s Degrees 26.9% 28.5%Doctorate/First Professional Degrees 4.3% 4.6%
Average Tuition and Fees for Resident Undergraduates (2013-2014)Community Colleges $3,988 $3,264Four-Year Public Institutions $8,475 $8,893Independent Institutions $36,802 $30,094
State Funding for Higher EducationState Operating Expenses (% change 2011-2012 to 2012-2013) Up 0.2% Down 0.4%State Spending on Student Financial Aid (% change 2011-2012 to 2012-2013) Down 0.7% Up 0.7%Source(s): The Chronicle of Higher Education, Almanac Issue 2013-2014, August 2013 The College Board, State Profile Report: Maryland, September 2013 U.S. Department of Education, National Center for Education Statistics, Projections of Education Statistics to 2021, January 2013 The College Board, Trends in College Student Pricing, October 2013 Notes: (1) Projection is from the USDE Projections of Education Statistics. The estimate includes students attending public schools only. Figures for FY2013 and FY2022 are projections. (2) The Maryland projection is from the Maryland Higher Education Commission’s Enrollment Projections 2013-2022 Maryland Public Colleges and Universities report, June 2013, and includes the undergraduate headcount of students enrolling in the state’s public two-year and four-year institu-tions. The national projection is from the National Center for Education Statistics, Projections of Education Statistics to 2021Tables 23 and 24.

2
3
AVERAGE SAT SCORES OF ENTERING FRESHMEN, 2012 - 2013 CRITICAL COMbINED 25TH 75THINSTITUTION READING MATHEMATICS SCORES PERCENTILE PERCENTILEBowie State University 452 438 890 780 930 Coppin State University 443 434 877 810 930 Frostburg State University 488 492 980 880 1060 Salisbury University 575 585 1160 1100 1210 Towson University 541 547 1088 1010 1160 University of Baltimore 482 462 944 840 1030 University of Maryland - Baltimore County 596 622 1218 1130 1300 University of Maryland - College Park 632 667 1299 1230 1390 University of Maryland - Eastern Shore 443 438 881 800 940 Morgan State University 452 453 905 830 970 St. Mary’s College of Maryland 602 585 1187 1090 1290 Maryland High School Seniors (2013) 497 500 997 820 1170 High School Seniors, Nationally (2013) 496 514 1010 850 1170 Source(s): Maryland Higher Education Commission, High School Graduation System S-11 Forms, 2013 The College Board, 2013 College-Bound Seniors State Profile Report: Maryland, 2013
students

4
UNDERGRADUATE ENROLLMENT, Fall 2012 % MDINSTITUTION Total Full-Time Part-Time ResidentsCOMMUNITY COLLEGESAllegany College of Maryland 3,659 1,958 53.5% 1,701 46.5% 51.6%Anne Arundel Community College 17,649 5,097 28.9% 12,552 71.1% 97.9%Baltimore City Community College 5,474 1,803 32.9% 3,671 67.1% 87.8%Carroll Community College 4,103 1,614 39.3% 2,489 60.7% 98.1%Cecil Community College 2,711 1,130 41.7% 1,581 58.3% 89.9%Chesapeake College 2,660 920 34.6% 1,740 65.4% 98.6%College of Southern Maryland 9,210 3,405 37.0% 5,805 63.0% 99.0%Community College of Baltimore County 25,188 8,373 33.2% 16,815 66.8% 96.0%Frederick Community College 6,159 2,179 35.4% 3,980 64.6% 97.9%Garrett College 873 687 78.7% 186 21.3% 81.4%Hagerstown Community College 5,005 1,382 27.6% 3,623 72.4% 79.3%Harford Community College 7,226 2,830 39.2% 4,396 60.8% 97.6%Howard Community College 10,152 3,705 36.5% 6,447 63.5% 94.8%Montgomery College-All Campuses 27,453 9,888 36.0% 17,565 64.0% 86.8%Prince George’s Community College 13,824 4,059 29.4% 9,765 70.6% 95.5%Wor-Wic Community College 3,739 1,190 31.8% 2,549 68.2% 96.6%Sub-Total 145,085 50,220 34.6% 94,865 65.4% 92.6%
FOUR-YEAR PUbLIC SCHOOLSBowie State University 4,283 3,493 81.6% 790 18.4% 91.4%Coppin State University 3,127 2,442 78.1% 685 21.9% 85.3%Frostburg State University 4,631 4,253 91.8% 378 8.2% 91.7%Salisbury University 7,969 7,323 91.9% 646 8.1% 85.7%Towson University 17,988 15,852 88.1% 2,136 11.9% 82.3%University of Baltimore 3,426 2,012 58.7% 1,414 41.3% 96.1%University of Maryland - Baltimore 728 559 76.8% 169 23.2% 90.9%University of Maryland - Baltimore County 10,953 9,371 85.6% 1,582 14.4% 89.8%University of Maryland - College Park 26,538 24,486 92.3% 2,052 7.7% 72.7%University of Maryland - Eastern Shore 3,758 3,449 91.8% 309 8.2% 78.4%University of Maryland - University College 28,273 6,144 21.7% 22,129 78.3% 54.4%Morgan State University 6,591 5,794 87.9% 797 12.1% 78.2%St. Mary’s College of Maryland 1,901 1,837 96.6% 64 3.4% 85.8%Sub-Total 120,166 87,015 72.4% 33,151 27.6% 75.4%

5
STATE-AIDED INDEPENDENT SCHOOLSCapitol College 441 326 73.9% 115 26.1% 78.7%Goucher College 1,484 1,446 97.4% 38 2.6% 24.9%Hood College 1,434 1,281 89.3% 153 10.7% 77.1%Johns Hopkins University 6,023 5,866 97.4% 157 2.6% 14.4%Loyola University Maryland 3,917 3,875 98.9% 42 1.1% 17.9%Maryland Institute College of Art 1,941 1,809 93.2% 132 6.8% 24.4%McDaniel College 1,632 1,596 97.8% 36 2.2% 63.1%Mount St. Mary’s College 1,842 1,755 95.3% 87 4.7% 53.4%Notre Dame of Maryland University 1,227 530 43.2% 697 56.8% 93.6%Sojourner-Douglass College 1,237 835 67.5% 402 32.5% 93.1%St. John’s College 449 447 99.6% 2 0.4% 14.9%Stevenson University 3,904 3,227 82.7% 677 17.3% 84.7%Washington Adventist University 1,218 944 77.5% 274 22.5% 54.3%Washington College 1,506 1,469 97.5% 37 2.5% 48.8%Sub-Total 28,255 25,406 89.9% 2,849 10.1% 45.8%
OTHER PRIVATE SCHOOLSBinah Institute of Advanced Judaic Study 6 0 0.0% 6 100.0% 83.3%Harry Lundeberg School of Seamanship 159 70 44.0% 89 56.0% 3.1%Lincoln College of Technology 599 500 83.5% 99 16.5% 89.8%National Labor College 618 25 4.0% 593 96.0% 9.9%Ner Israel Rabbinical College 344 344 100.0% 0 0.0% 38.4%St.Mary’s Seminary and University 7 7 100.0% 0 0.0% 28.6%TESST College of Technology 1,160 979 84.4% 181 15.6% 96.8%Washington Bible College 215 129 60.0% 86 40.0% 80.9%Women’s Institute of Torah Seminary 146 110 75.3% 36 24.7% 74.7%Yeshiva College of the Nations Capital 45 45 100.0% 0 0.0% 57.8%Sub-Total 3,299 2,209 67.0% 1,090 33.0% 65.9%TOTAL - ALL CAMPUSES 296,805 164,850 55.5% 131,955 44.5% 80.9%Source: Maryland Higher Education Commission, Enrollment Information System, 2012
UNDERGRADUATE ENROLLMENT, Fall 2012 (continued) % MDINSTITUTION Total Full-Time Part-Time Residents

6
GRADUATE AND PROFESSIONAL ENROLLMENT, Fall 2012INSTITUTION Total Full-Time Part-TimeFOUR-YEAR PUbLIC SCHOOLSBowie State University 1,138 396 34.8% 742 65.2%Coppin State University 485 142 29.3% 343 70.7%Frostburg State University 790 264 33.4% 526 66.6%Salisbury University 688 288 41.9% 400 58.1%Towson University 3,972 1,200 30.2% 2,772 69.8%University of Baltimore 3,132 1,446 46.2% 1,686 53.8%University of Maryland - Baltimore 5,640 4,544 80.6% 1,096 19.4%University of Maryland - Baltimore County 2,684 1,134 42.3% 1,550 57.7%University of Maryland - College Park 10,709 7,788 72.7% 2,921 27.3%University of Maryland - Eastern Shore 696 441 63.4% 255 36.6%University of Maryland - University College 13,995 277 2.0% 13,718 98.0%Morgan State University 1,361 707 51.9% 654 48.1%St. Mary’s College of Maryland 32 30 93.8% 2 6.3%Sub-Total 45,322 18,657 41.2% 26,665 58.8%
STATE-AIDED INDEPENDENT SCHOOLSCapitol College 464 162 34.9% 302 65.1%Goucher College 767 185 24.1% 582 75.9%Hood College 988 113 11.4% 875 88.6%Johns Hopkins University 14,848 7,267 48.9% 7,581 51.1%Loyola University Maryland 2,061 676 32.8% 1,385 67.2%Maryland Institute College of Art 341 224 65.7% 117 34.3%McDaniel College 1,644 194 11.8% 1,450 88.2%Mount St. Mary’s College 508 255 50.2% 253 49.8%Notre Dame of Maryland University 1,637 308 18.8% 1,329 81.2%Sojourner-Douglass College 56 19 33.9% 37 66.1%St. John’s College 60 57 95.0% 3 5.0%Stevenson University 514 29 5.6% 485 94.4%Washington Adventist University 185 69 37.3% 116 62.7%Washington College 44 0 0.0% 44 100.0%Sub-Total 24,117 9,558 39.6% 14,559 60.4%
OTHER PRIVATE SCHOOLSNer Israel Rabbinical College 203 182 89.7% 21 10.3%St. Mary’s Seminary and University 200 78 39.0% 122 61.0%SANS Technology 81 0 0.0% 81 100.0%TAI Sophia Institute 511 256 50.1% 255 49.9%Washington Bible College 219 52 23.7% 167 76.3%Sub-Total 1,214 568 46.8% 646 53.2%TOTAL - ALL CAMPUSES 70,653 28,783 40.7% 41,870 59.3%Source: Maryland Higher Education Commission, Enrollment Information System, 2012

7

8
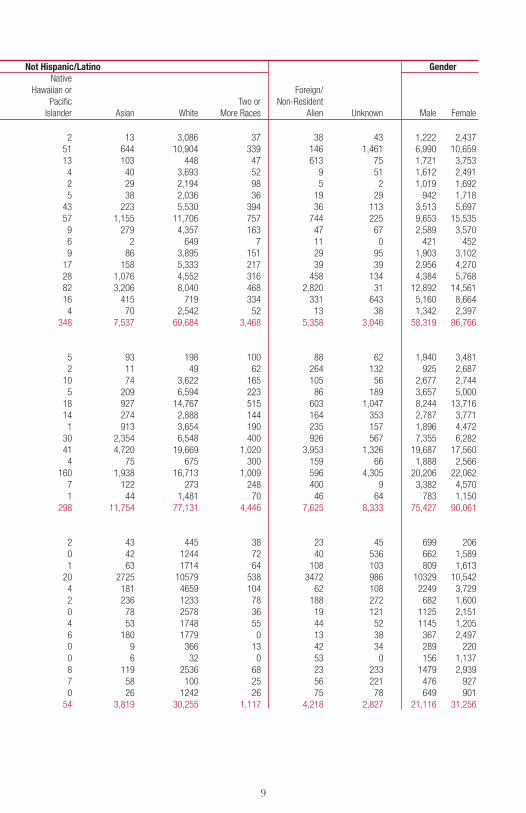
ENROLLMENT bY RACE AND bY GENDER, Fall 2012 Not Hispanic/Latino Gender American Native Hispanic/ Black/ Indian or Hawaiian or Foreign/ Total Latino, any African Alaska Pacific Two or Non-ResidentINSTITUTION Enrollment race American Native Islander Asian White More Races Alien Unknown Male FemaleCOMMUNITY COLLEGESAllegany College of Maryland 3,659 51 382 7 2 13 3,086 37 38 43 1,222 2,437 Anne Arundel Community College 17,649 870 3,144 90 51 644 10,904 339 146 1,461 6,990 10,659 Baltimore City Community College 5,474 81 4,087 7 13 103 448 47 613 75 1,721 3,753 Carroll Community College 4,103 104 142 8 4 40 3,693 52 9 51 1,612 2,491 Cecil College 2,711 104 262 15 2 29 2,194 98 5 2 1,019 1,692 Chesapeake College 2,660 99 390 8 5 38 2,036 36 19 29 942 1,718 College of Southern Maryland 9,210 491 2,328 52 43 223 5,530 394 36 113 3,513 5,697 Community College of Baltimore County 25,188 971 9,489 84 57 1,155 11,706 757 744 225 9,653 15,535 Frederick Community College 6,159 447 769 21 9 279 4,357 163 47 67 2,589 3,570 Garrett College 873 21 175 2 6 2 649 7 11 0 421 452 Hagerstown Community College 5,005 218 502 20 9 86 3,895 151 29 95 1,903 3,102 Harford Community College 7,226 317 1,081 25 17 158 5,333 217 39 39 2,956 4,270 Howard Community College 10,152 798 2,757 33 28 1,076 4,552 316 458 134 4,384 5,768 Montgomery College-All Campuses 27,453 5,316 7,413 77 82 3,206 8,040 468 2,820 31 12,892 14,561 Prince George’s Community College 13,824 1,025 10,311 30 16 415 719 334 331 643 5,160 8,664 Wor-Wic Community College 3,739 118 867 35 4 70 2,542 52 13 38 1,342 2,397 Sub-Total 145,085 11,031 44,099 514 348 7,537 69,684 3,468 5,358 3,046 58,319 86,766
FOUR-YEAR PUbLIC SCHOOLS Bowie State University 5,421 135 4,731 9 5 93 198 100 88 62 1,940 3,481 Coppin State University 3,612 51 3,039 2 2 11 49 62 264 132 925 2,687 Frostburg State University 5,421 183 1,200 6 10 74 3,622 165 105 56 2,677 2,744 Salisbury University 8,657 375 956 20 5 209 6,594 223 86 189 3,657 5,000 Towson University 21,960 934 3,096 53 18 927 14,767 515 603 1,047 8,244 13,716 University of Baltimore 6,558 287 2,412 22 14 274 2,888 144 164 353 2,787 3,771 University of Maryland - Baltimore 6,368 336 873 9 1 913 3,654 190 235 157 1,896 4,472 University of Maryland - Baltimore County 13,637 653 2,132 27 30 2,354 6,548 400 926 567 7,355 6,282 University of Maryland - College Park 37,247 2,493 3,972 53 41 4,720 19,669 1,020 3,953 1,326 19,687 17,560 University of Maryland - Eastern Shore 4,454 100 3,071 4 4 75 675 300 159 66 1,888 2,566 University of Maryland - University College 42,268 3,166 14,195 186 160 1,938 16,713 1,009 596 4,305 20,206 22,062 Morgan State University 7,952 194 6,677 22 7 122 273 248 400 9 3,382 4,570 St. Mary’s College of Maryland 1,933 92 135 0 1 44 1,481 70 46 64 783 1,150 Sub-Total 165,488 8,999 46,489 413 298 11,754 77,131 4,446 7,625 8,333 75,427 90,061
INDEPENDENT SCHOOLSCapitol College 905 49 252 8 2 43 445 38 23 45 699 206Goucher College 2,251 114 199 4 0 42 1244 72 40 536 662 1,589Hood College 2,422 137 230 2 1 63 1714 64 108 103 809 1,613Johns Hopkins University 20,871 1170 1337 44 20 2725 10579 538 3472 986 10329 10,542Loyola University Maryland 5,978 409 436 15 4 181 4659 104 62 108 2249 3,729Maryland Institute College of Art 2,282 148 116 9 2 236 1233 78 188 272 682 1,600McDaniel College 3,276 120 311 13 0 78 2578 36 19 121 1125 2,151Mount St. Mary’s College 2,350 182 206 6 4 53 1748 55 44 52 1145 1,205Notre Dame of Maryland University 2,864 130 695 23 6 180 1779 0 13 38 367 2,497St. John’s College 509 34 8 3 0 9 366 13 42 34 289 220Sojourner-Douglass College 1,293 7 1195 0 0 6 32 0 53 0 156 1,137Stevenson University 4,418 184 1232 15 8 119 2536 68 23 233 1479 2,939Washington Adventist University 1,403 123 798 15 7 58 100 25 56 221 476 927Washington College 1,550 57 45 1 0 26 1242 26 75 78 649 901Sub-Total 52,372 2,864 7,060 158 54 3,819 30,255 1,117 4,218 2,827 21,116 31,256
9
ENROLLMENT bY RACE AND bY GENDER, Fall 2012 Not Hispanic/Latino Gender American Native Hispanic/ Black/ Indian or Hawaiian or Foreign/ Total Latino, any African Alaska Pacific Two or Non-ResidentINSTITUTION Enrollment race American Native Islander Asian White More Races Alien Unknown Male FemaleCOMMUNITY COLLEGESAllegany College of Maryland 3,659 51 382 7 2 13 3,086 37 38 43 1,222 2,437 Anne Arundel Community College 17,649 870 3,144 90 51 644 10,904 339 146 1,461 6,990 10,659 Baltimore City Community College 5,474 81 4,087 7 13 103 448 47 613 75 1,721 3,753 Carroll Community College 4,103 104 142 8 4 40 3,693 52 9 51 1,612 2,491 Cecil College 2,711 104 262 15 2 29 2,194 98 5 2 1,019 1,692 Chesapeake College 2,660 99 390 8 5 38 2,036 36 19 29 942 1,718 College of Southern Maryland 9,210 491 2,328 52 43 223 5,530 394 36 113 3,513 5,697 Community College of Baltimore County 25,188 971 9,489 84 57 1,155 11,706 757 744 225 9,653 15,535 Frederick Community College 6,159 447 769 21 9 279 4,357 163 47 67 2,589 3,570 Garrett College 873 21 175 2 6 2 649 7 11 0 421 452 Hagerstown Community College 5,005 218 502 20 9 86 3,895 151 29 95 1,903 3,102 Harford Community College 7,226 317 1,081 25 17 158 5,333 217 39 39 2,956 4,270 Howard Community College 10,152 798 2,757 33 28 1,076 4,552 316 458 134 4,384 5,768 Montgomery College-All Campuses 27,453 5,316 7,413 77 82 3,206 8,040 468 2,820 31 12,892 14,561 Prince George’s Community College 13,824 1,025 10,311 30 16 415 719 334 331 643 5,160 8,664 Wor-Wic Community College 3,739 118 867 35 4 70 2,542 52 13 38 1,342 2,397 Sub-Total 145,085 11,031 44,099 514 348 7,537 69,684 3,468 5,358 3,046 58,319 86,766
FOUR-YEAR PUbLIC SCHOOLS Bowie State University 5,421 135 4,731 9 5 93 198 100 88 62 1,940 3,481 Coppin State University 3,612 51 3,039 2 2 11 49 62 264 132 925 2,687 Frostburg State University 5,421 183 1,200 6 10 74 3,622 165 105 56 2,677 2,744 Salisbury University 8,657 375 956 20 5 209 6,594 223 86 189 3,657 5,000 Towson University 21,960 934 3,096 53 18 927 14,767 515 603 1,047 8,244 13,716 University of Baltimore 6,558 287 2,412 22 14 274 2,888 144 164 353 2,787 3,771 University of Maryland - Baltimore 6,368 336 873 9 1 913 3,654 190 235 157 1,896 4,472 University of Maryland - Baltimore County 13,637 653 2,132 27 30 2,354 6,548 400 926 567 7,355 6,282 University of Maryland - College Park 37,247 2,493 3,972 53 41 4,720 19,669 1,020 3,953 1,326 19,687 17,560 University of Maryland - Eastern Shore 4,454 100 3,071 4 4 75 675 300 159 66 1,888 2,566 University of Maryland - University College 42,268 3,166 14,195 186 160 1,938 16,713 1,009 596 4,305 20,206 22,062 Morgan State University 7,952 194 6,677 22 7 122 273 248 400 9 3,382 4,570 St. Mary’s College of Maryland 1,933 92 135 0 1 44 1,481 70 46 64 783 1,150 Sub-Total 165,488 8,999 46,489 413 298 11,754 77,131 4,446 7,625 8,333 75,427 90,061
INDEPENDENT SCHOOLSCapitol College 905 49 252 8 2 43 445 38 23 45 699 206Goucher College 2,251 114 199 4 0 42 1244 72 40 536 662 1,589Hood College 2,422 137 230 2 1 63 1714 64 108 103 809 1,613Johns Hopkins University 20,871 1170 1337 44 20 2725 10579 538 3472 986 10329 10,542Loyola University Maryland 5,978 409 436 15 4 181 4659 104 62 108 2249 3,729Maryland Institute College of Art 2,282 148 116 9 2 236 1233 78 188 272 682 1,600McDaniel College 3,276 120 311 13 0 78 2578 36 19 121 1125 2,151Mount St. Mary’s College 2,350 182 206 6 4 53 1748 55 44 52 1145 1,205Notre Dame of Maryland University 2,864 130 695 23 6 180 1779 0 13 38 367 2,497St. John’s College 509 34 8 3 0 9 366 13 42 34 289 220Sojourner-Douglass College 1,293 7 1195 0 0 6 32 0 53 0 156 1,137Stevenson University 4,418 184 1232 15 8 119 2536 68 23 233 1479 2,939Washington Adventist University 1,403 123 798 15 7 58 100 25 56 221 476 927Washington College 1,550 57 45 1 0 26 1242 26 75 78 649 901Sub-Total 52,372 2,864 7,060 158 54 3,819 30,255 1,117 4,218 2,827 21,116 31,256

10
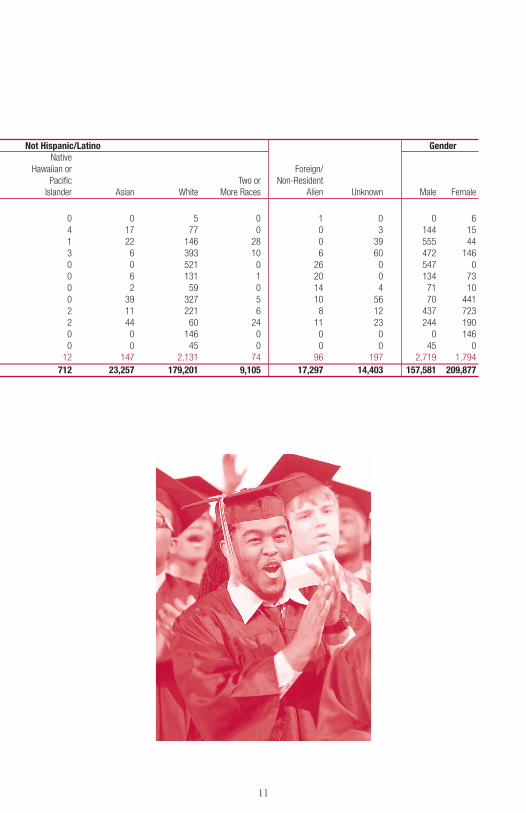
OTHER PRIVATE SCHOOLSBinah Institute of Advanced Judaic Study 6 0 0 0 0 0 5 0 1 0 0 6Harry Lundeberg School of Seamanship 159 15 40 3 4 17 77 0 0 3 144 15Lincoln College of Technology 599 62 298 3 1 22 146 28 0 39 555 44National Labor College 618 37 101 2 3 6 393 10 6 60 472 146Ner Israel Rabbinical College 547 0 0 0 0 0 521 0 26 0 547 0St. Mary’s Seminary and University 207 5 44 0 0 6 131 1 20 0 134 73SANS Technology Institute 81 1 1 0 0 2 59 0 14 4 71 10TAI Sophia Institute 511 13 59 2 0 39 327 5 10 56 70 441TESST College of Technology 1,160 72 825 3 2 11 221 6 8 12 437 723Washington Bible College 434 17 252 1 2 44 60 24 11 23 244 190Women’s Institute of Torah Seminary 146 0 0 0 0 0 146 0 0 0 0 146Yeshiva College of Nations Capital 45 0 0 0 0 0 45 0 0 0 45 0Sub-Total 4,513 222 1,620 14 12 147 2,131 74 96 197 2,719 1,794TOTAL - ALL CAMPUSES 367,458 23,116 99,268 1,099 712 23,257 179,201 9,105 17,297 14,403 157,581 209,877Note: (1) These categories conform to new federal race and ethnicity definitions. Figures for previous years are not always comparable.Source: Maryland Higher Education Commission, Enrollment Information System, 2012
ENROLLMENT bY RACE AND bY GENDER, Fall 2012 (continued) Not Hispanic/Latino Gender American Native Hispanic/ Black/ Indian or Hawaiian or Foreign/ Total Latino, any African Alaska Pacific Two or Non-ResidentINSTITUTION Enrollment race American Native Islander Asian White More Races Alien Unknown Male Female
11
OTHER PRIVATE SCHOOLSBinah Institute of Advanced Judaic Study 6 0 0 0 0 0 5 0 1 0 0 6Harry Lundeberg School of Seamanship 159 15 40 3 4 17 77 0 0 3 144 15Lincoln College of Technology 599 62 298 3 1 22 146 28 0 39 555 44National Labor College 618 37 101 2 3 6 393 10 6 60 472 146Ner Israel Rabbinical College 547 0 0 0 0 0 521 0 26 0 547 0St. Mary’s Seminary and University 207 5 44 0 0 6 131 1 20 0 134 73SANS Technology Institute 81 1 1 0 0 2 59 0 14 4 71 10TAI Sophia Institute 511 13 59 2 0 39 327 5 10 56 70 441TESST College of Technology 1,160 72 825 3 2 11 221 6 8 12 437 723Washington Bible College 434 17 252 1 2 44 60 24 11 23 244 190Women’s Institute of Torah Seminary 146 0 0 0 0 0 146 0 0 0 0 146Yeshiva College of Nations Capital 45 0 0 0 0 0 45 0 0 0 45 0Sub-Total 4,513 222 1,620 14 12 147 2,131 74 96 197 2,719 1,794TOTAL - ALL CAMPUSES 367,458 23,116 99,268 1,099 712 23,257 179,201 9,105 17,297 14,403 157,581 209,877Note: (1) These categories conform to new federal race and ethnicity definitions. Figures for previous years are not always comparable.Source: Maryland Higher Education Commission, Enrollment Information System, 2012
ENROLLMENT bY RACE AND bY GENDER, Fall 2012 (continued) Not Hispanic/Latino Gender American Native Hispanic/ Black/ Indian or Hawaiian or Foreign/ Total Latino, any African Alaska Pacific Two or Non-ResidentINSTITUTION Enrollment race American Native Islander Asian White More Races Alien Unknown Male Female

12
REMEDIATION RATES OF MARYLAND HIGH SCHOOL GRADUATES ENROLLED AT MARYLAND PUbLIC INSTITUTIONS, 2010-2011 Total # of No Remediation Remediation Students Needed Needed EnrolledAllegany College of Maryland 52 13.6% 329 86.4% 381 Anne Arundel Community College 1,002 35.2% 1,841 64.8% 2,843 Baltimore City Community College 22 3.5% 608 96.5% 630 Carroll Community College 156 18.4% 694 81.6% 850 Cecil Community College 81 22.6% 277 77.4% 358 Chesapeake College 169 28.0% 434 72.0% 603 College of Southern Maryland 744 50.7% 724 49.3% 1,468 Community College of Baltimore County 599 16.8% 2,956 83.2% 3,555 Frederick Community College 490 43.4% 640 56.6% 1,130 Garrett College 25 14.0% 153 86.0% 178 Hagerstown Community College 130 19.3% 543 80.7% 673 Harford Community College 558 41.1% 801 58.9% 1,359 Howard Community College 380 34.4% 724 65.6% 1,104 Montgomery College-All Campuses 1,223 33.8% 2,395 66.2% 3,618 Prince George’s Community College 282 19.7% 1,146 80.3% 1,428 Wor-Wic Community College 88 14.3% 528 85.7% 616 Sub-Total 6,001 28.9% 14,793 71.1% 20,794
Bowie State University 72 12.1% 524 87.9% 596 Coppin State University 70 24.1% 220 75.9% 290 Frostburg State University 751 80.5% 182 19.5% 933 Salisbury University 1,157 100.0% 0 0.0% 1,157 Towson University 1,223 80.0% 306 20.0% 1,529 University of Baltimore 82 100.0% 0 0.0% 82 University of Maryland - Baltimore County 1,033 86.1% 167 13.9% 1,200 University of Maryland - College Park 2,922 96.9% 95 3.1% 3,017 University of Maryland - Eastern Shore 190 29.6% 452 70.4% 642 Morgan State University 158 26.3% 443 73.7% 601 St. Mary’s College of Maryland 363 100.0% 0 0.0% 363 Sub-Total 8,021 77.1% 2,389 22.9% 10,410 TOTAL 14,022 44.9% 17,182 55.1% 31,204 Note: Salisbury University, University of Baltimore & St. Mary’s College of Maryland do not offer remedial courses. Source: Maryland Higher Education Commission, High School Graduate System, 2011

13
REMEDIATION RATES OF MARYLAND HIGH SCHOOL GRADUATES bY PLACE OF RESIDENCE, 2010-2011 Total # of No Remediation Remediation Students Needed Needed EnrolledAllegany County 160 43.5% 208 56.5% 368Anne Arundel County 1,506 47.3% 1,677 52.7% 3,183Baltimore County 1,724 41.3% 2,454 58.7% 4,178Calvert County 423 65.5% 223 34.5% 646Caroline County 61 36.7% 105 63.3% 166Carroll County 447 39.4% 688 60.6% 1,135Cecil County 182 37.6% 302 62.4% 484Charles County 474 49.2% 490 50.8% 964Dorchester County 49 32.7% 101 67.3% 150Frederick County 902 55.6% 721 44.4% 1,623Garrett County 48 27.4% 127 72.6% 175Harford County 840 50.2% 834 49.8% 1,674Howard County 1,255 62.8% 743 37.2% 1,998Kent County 18 34.6% 34 65.4% 52Montgomery County 3,024 55.8% 2,400 44.2% 5,424Prince George’s County 1,184 33.3% 2,375 66.7% 3,559Queen Anne’s County 160 53.5% 139 46.5% 299Saint Mary’s County 354 63.9% 200 36.1% 554Somerset County 35 37.2% 59 62.8% 94Talbot County 69 39.2% 107 60.8% 176Washington County 220 29.7% 521 70.3% 741Wicomico County 186 33.9% 362 66.1% 548Worcester County 116 39.6% 177 60.4% 293Baltimore City 492 23.9% 1,566 76.1% 2,058TOTAL 13,929 45.6% 16,613 54.4% 30,542Source: Maryland Higher Education Commission, High School Graduate System, 2011

14
PERCENTAGE PELL ENROLLMENT bY INSTITUTION, FALL 2011 TotalCOMMUNITY COLLEGES Allegany College of Maryland 44.2%Anne Arundel Community College 26.5%Baltimore City Community College 63.2%Carroll Community College 23.1%Cecil Community College 30.0%Chesapeake College 42.1%College of Southern Maryland 23.9%Community College of Baltimore County 44.5%Frederick Community College 22.1%Garrett College 60.0%Hagerstown Community College 39.1%Harford Community College 27.2%Howard Community College 26.5%Montgomery College-All Campuses 30.1%Prince George’s Community College 39.6%Wor-Wic Community College 51.7%All Community Colleges 35.1% FOUR-YEAR PUbLIC SCHOOLS Bowie State University 51.5%Coppin State University 63.7%Frostburg State University 35.9%Salisbury University 22.0%Towson University 24.7%University of Baltimore 47.4%University of Maryland - Baltimore 18.6%University of Maryland - Baltimore County 27.7%University of Maryland - College Park 18.7%University of Maryland - Eastern Shore 55.6%University of Maryland - University College 24.0%Morgan State University 57.8%St. Mary’s College of Maryland 15.1%All Public Four-Years 29.1%TOTAL - ALL PUbLIC CAMPUSES 32.4%Note: Includes students receiving Pell awards during FY 2012 who were enrolled during the fall semester of 2011. Source: Maryland Higher Education Commission, Enrollment Information System and Financial Aid Information System
15
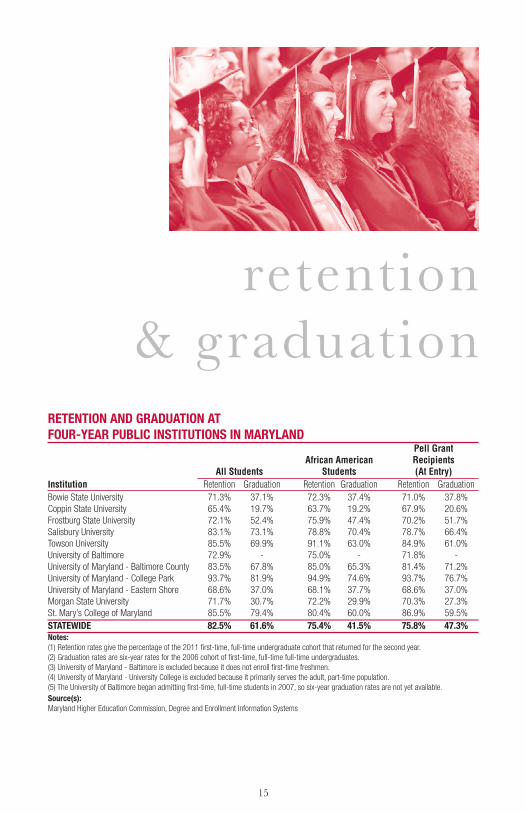
RETENTION AND GRADUATION AT FOUR-YEAR PUbLIC INSTITUTIONS IN MARYLAND Pell Grant African American Recipients All Students Students (At Entry)Institution Retention Graduation Retention Graduation Retention GraduationBowie State University 71.3% 37.1% 72.3% 37.4% 71.0% 37.8%Coppin State University 65.4% 19.7% 63.7% 19.2% 67.9% 20.6%Frostburg State University 72.1% 52.4% 75.9% 47.4% 70.2% 51.7%Salisbury University 83.1% 73.1% 78.8% 70.4% 78.7% 66.4%Towson University 85.5% 69.9% 91.1% 63.0% 84.9% 61.0%University of Baltimore 72.9% - 75.0% - 71.8% -University of Maryland - Baltimore County 83.5% 67.8% 85.0% 65.3% 81.4% 71.2%University of Maryland - College Park 93.7% 81.9% 94.9% 74.6% 93.7% 76.7%University of Maryland - Eastern Shore 68.6% 37.0% 68.1% 37.7% 68.6% 37.0%Morgan State University 71.7% 30.7% 72.2% 29.9% 70.3% 27.3%St. Mary’s College of Maryland 85.5% 79.4% 80.4% 60.0% 86.9% 59.5%STATEWIDE 82.5% 61.6% 75.4% 41.5% 75.8% 47.3%Notes: (1) Retention rates give the percentage of the 2011 first-time, full-time undergraduate cohort that returned for the second year. (2) Graduation rates are six-year rates for the 2006 cohort of first-time, full-time full-time undergraduates. (3) University of Maryland - Baltimore is excluded because it does not enroll first-time freshmen. (4) University of Maryland - University College is excluded because it primarily serves the adult, part-time population. (5) The University of Baltimore began admitting first-time, full-time students in 2007, so six-year graduation rates are not yet available.Source(s): Maryland Higher Education Commission, Degree and Enrollment Information Systems
retention & graduation
16
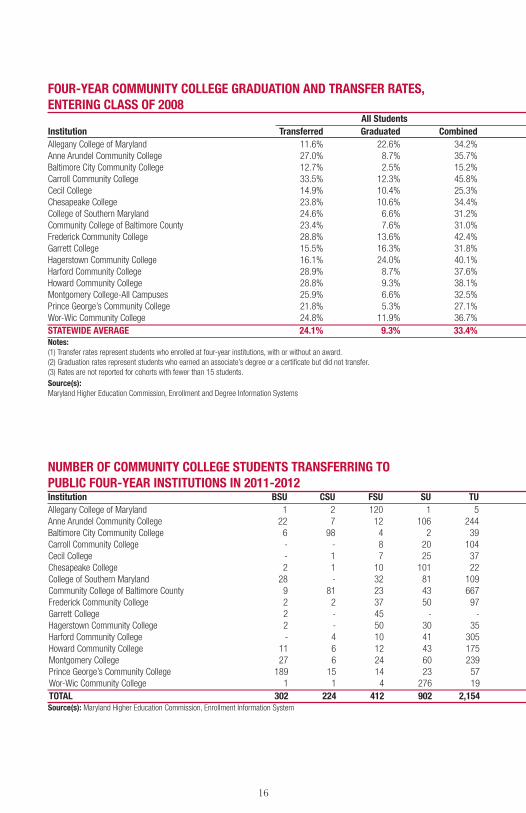
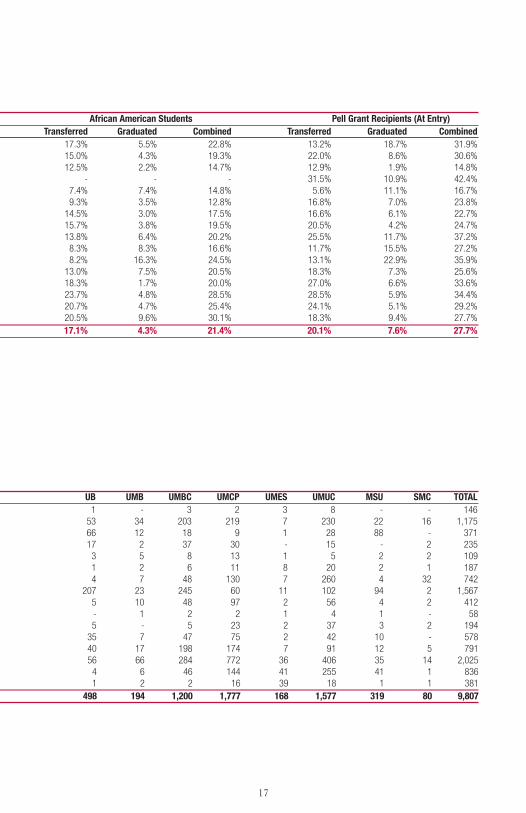
FOUR-YEAR COMMUNITY COLLEGE GRADUATION AND TRANSFER RATES, ENTERING CLASS OF 2008 All Students African American Students Pell Grant Recipients (At Entry)Institution Transferred Graduated Combined Transferred Graduated Combined Transferred Graduated CombinedAllegany College of Maryland 11.6% 22.6% 34.2% 17.3% 5.5% 22.8% 13.2% 18.7% 31.9%Anne Arundel Community College 27.0% 8.7% 35.7% 15.0% 4.3% 19.3% 22.0% 8.6% 30.6%Baltimore City Community College 12.7% 2.5% 15.2% 12.5% 2.2% 14.7% 12.9% 1.9% 14.8%Carroll Community College 33.5% 12.3% 45.8% - - - 31.5% 10.9% 42.4%Cecil College 14.9% 10.4% 25.3% 7.4% 7.4% 14.8% 5.6% 11.1% 16.7%Chesapeake College 23.8% 10.6% 34.4% 9.3% 3.5% 12.8% 16.8% 7.0% 23.8%College of Southern Maryland 24.6% 6.6% 31.2% 14.5% 3.0% 17.5% 16.6% 6.1% 22.7%Community College of Baltimore County 23.4% 7.6% 31.0% 15.7% 3.8% 19.5% 20.5% 4.2% 24.7%Frederick Community College 28.8% 13.6% 42.4% 13.8% 6.4% 20.2% 25.5% 11.7% 37.2%Garrett College 15.5% 16.3% 31.8% 8.3% 8.3% 16.6% 11.7% 15.5% 27.2%Hagerstown Community College 16.1% 24.0% 40.1% 8.2% 16.3% 24.5% 13.1% 22.9% 35.9%Harford Community College 28.9% 8.7% 37.6% 13.0% 7.5% 20.5% 18.3% 7.3% 25.6%Howard Community College 28.8% 9.3% 38.1% 18.3% 1.7% 20.0% 27.0% 6.6% 33.6%Montgomery College-All Campuses 25.9% 6.6% 32.5% 23.7% 4.8% 28.5% 28.5% 5.9% 34.4%Prince George’s Community College 21.8% 5.3% 27.1% 20.7% 4.7% 25.4% 24.1% 5.1% 29.2%Wor-Wic Community College 24.8% 11.9% 36.7% 20.5% 9.6% 30.1% 18.3% 9.4% 27.7%STATEWIDE AVERAGE 24.1% 9.3% 33.4% 17.1% 4.3% 21.4% 20.1% 7.6% 27.7%Notes: (1) Transfer rates represent students who enrolled at four-year institutions, with or without an award. (2) Graduation rates represent students who earned an associate’s degree or a certificate but did not transfer. (3) Rates are not reported for cohorts with fewer than 15 students. Source(s): Maryland Higher Education Commission, Enrollment and Degree Information Systems
NUMbER OF COMMUNITY COLLEGE STUDENTS TRANSFERRING TO PUbLIC FOUR-YEAR INSTITUTIONS IN 2011-2012Institution bSU CSU FSU SU TU Ub UMb UMbC UMCP UMES UMUC MSU SMC TOTALAllegany College of Maryland 1 2 120 1 5 1 - 3 2 3 8 - - 146Anne Arundel Community College 22 7 12 106 244 53 34 203 219 7 230 22 16 1,175Baltimore City Community College 6 98 4 2 39 66 12 18 9 1 28 88 - 371Carroll Community College - - 8 20 104 17 2 37 30 - 15 - 2 235Cecil College - 1 7 25 37 3 5 8 13 1 5 2 2 109Chesapeake College 2 1 10 101 22 1 2 6 11 8 20 2 1 187College of Southern Maryland 28 - 32 81 109 4 7 48 130 7 260 4 32 742Community College of Baltimore County 9 81 23 43 667 207 23 245 60 11 102 94 2 1,567Frederick Community College 2 2 37 50 97 5 10 48 97 2 56 4 2 412Garrett College 2 - 45 - - - 1 2 2 1 4 1 - 58Hagerstown Community College 2 - 50 30 35 5 - 5 23 2 37 3 2 194Harford Community College - 4 10 41 305 35 7 47 75 2 42 10 - 578Howard Community College 11 6 12 43 175 40 17 198 174 7 91 12 5 791Montgomery College 27 6 24 60 239 56 66 284 772 36 406 35 14 2,025Prince George’s Community College 189 15 14 23 57 4 6 46 144 41 255 41 1 836Wor-Wic Community College 1 1 4 276 19 1 2 2 16 39 18 1 1 381TOTAL 302 224 412 902 2,154 498 194 1,200 1,777 168 1,577 319 80 9,807Source(s): Maryland Higher Education Commission, Enrollment Information System
17
FOUR-YEAR COMMUNITY COLLEGE GRADUATION AND TRANSFER RATES, ENTERING CLASS OF 2008 All Students African American Students Pell Grant Recipients (At Entry)Institution Transferred Graduated Combined Transferred Graduated Combined Transferred Graduated CombinedAllegany College of Maryland 11.6% 22.6% 34.2% 17.3% 5.5% 22.8% 13.2% 18.7% 31.9%Anne Arundel Community College 27.0% 8.7% 35.7% 15.0% 4.3% 19.3% 22.0% 8.6% 30.6%Baltimore City Community College 12.7% 2.5% 15.2% 12.5% 2.2% 14.7% 12.9% 1.9% 14.8%Carroll Community College 33.5% 12.3% 45.8% - - - 31.5% 10.9% 42.4%Cecil College 14.9% 10.4% 25.3% 7.4% 7.4% 14.8% 5.6% 11.1% 16.7%Chesapeake College 23.8% 10.6% 34.4% 9.3% 3.5% 12.8% 16.8% 7.0% 23.8%College of Southern Maryland 24.6% 6.6% 31.2% 14.5% 3.0% 17.5% 16.6% 6.1% 22.7%Community College of Baltimore County 23.4% 7.6% 31.0% 15.7% 3.8% 19.5% 20.5% 4.2% 24.7%Frederick Community College 28.8% 13.6% 42.4% 13.8% 6.4% 20.2% 25.5% 11.7% 37.2%Garrett College 15.5% 16.3% 31.8% 8.3% 8.3% 16.6% 11.7% 15.5% 27.2%Hagerstown Community College 16.1% 24.0% 40.1% 8.2% 16.3% 24.5% 13.1% 22.9% 35.9%Harford Community College 28.9% 8.7% 37.6% 13.0% 7.5% 20.5% 18.3% 7.3% 25.6%Howard Community College 28.8% 9.3% 38.1% 18.3% 1.7% 20.0% 27.0% 6.6% 33.6%Montgomery College-All Campuses 25.9% 6.6% 32.5% 23.7% 4.8% 28.5% 28.5% 5.9% 34.4%Prince George’s Community College 21.8% 5.3% 27.1% 20.7% 4.7% 25.4% 24.1% 5.1% 29.2%Wor-Wic Community College 24.8% 11.9% 36.7% 20.5% 9.6% 30.1% 18.3% 9.4% 27.7%STATEWIDE AVERAGE 24.1% 9.3% 33.4% 17.1% 4.3% 21.4% 20.1% 7.6% 27.7%Notes: (1) Transfer rates represent students who enrolled at four-year institutions, with or without an award. (2) Graduation rates represent students who earned an associate’s degree or a certificate but did not transfer. (3) Rates are not reported for cohorts with fewer than 15 students. Source(s): Maryland Higher Education Commission, Enrollment and Degree Information Systems
NUMbER OF COMMUNITY COLLEGE STUDENTS TRANSFERRING TO PUbLIC FOUR-YEAR INSTITUTIONS IN 2011-2012Institution bSU CSU FSU SU TU Ub UMb UMbC UMCP UMES UMUC MSU SMC TOTALAllegany College of Maryland 1 2 120 1 5 1 - 3 2 3 8 - - 146Anne Arundel Community College 22 7 12 106 244 53 34 203 219 7 230 22 16 1,175Baltimore City Community College 6 98 4 2 39 66 12 18 9 1 28 88 - 371Carroll Community College - - 8 20 104 17 2 37 30 - 15 - 2 235Cecil College - 1 7 25 37 3 5 8 13 1 5 2 2 109Chesapeake College 2 1 10 101 22 1 2 6 11 8 20 2 1 187College of Southern Maryland 28 - 32 81 109 4 7 48 130 7 260 4 32 742Community College of Baltimore County 9 81 23 43 667 207 23 245 60 11 102 94 2 1,567Frederick Community College 2 2 37 50 97 5 10 48 97 2 56 4 2 412Garrett College 2 - 45 - - - 1 2 2 1 4 1 - 58Hagerstown Community College 2 - 50 30 35 5 - 5 23 2 37 3 2 194Harford Community College - 4 10 41 305 35 7 47 75 2 42 10 - 578Howard Community College 11 6 12 43 175 40 17 198 174 7 91 12 5 791Montgomery College 27 6 24 60 239 56 66 284 772 36 406 35 14 2,025Prince George’s Community College 189 15 14 23 57 4 6 46 144 41 255 41 1 836Wor-Wic Community College 1 1 4 276 19 1 2 2 16 39 18 1 1 381TOTAL 302 224 412 902 2,154 498 194 1,200 1,777 168 1,577 319 80 9,807Source(s): Maryland Higher Education Commission, Enrollment Information System
18
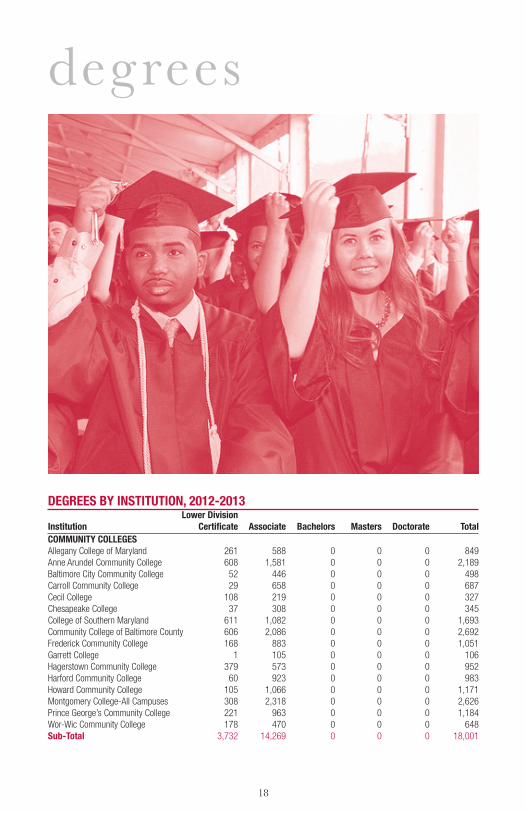
DEGREES bY INSTITUTION, 2012-2013 Lower Division Institution Certificate Associate bachelors Masters Doctorate TotalCOMMUNITY COLLEGESAllegany College of Maryland 261 588 0 0 0 849Anne Arundel Community College 608 1,581 0 0 0 2,189Baltimore City Community College 52 446 0 0 0 498Carroll Community College 29 658 0 0 0 687Cecil College 108 219 0 0 0 327Chesapeake College 37 308 0 0 0 345College of Southern Maryland 611 1,082 0 0 0 1,693Community College of Baltimore County 606 2,086 0 0 0 2,692Frederick Community College 168 883 0 0 0 1,051Garrett College 1 105 0 0 0 106Hagerstown Community College 379 573 0 0 0 952Harford Community College 60 923 0 0 0 983Howard Community College 105 1,066 0 0 0 1,171Montgomery College-All Campuses 308 2,318 0 0 0 2,626Prince George’s Community College 221 963 0 0 0 1,184Wor-Wic Community College 178 470 0 0 0 648Sub-Total 3,732 14,269 0 0 0 18,001
degrees

19
DEGREES bY INSTITUTION, 2012-2013 (continued) Lower Division Institution Certificate Associate bachelors Masters Doctorate TotalFOUR-YEAR PUbLIC INSTITUTIONSBowie State University 0 0 739 267 10 1,016Coppin State University 0 0 409 72 0 481Frostburg State University 0 0 969 235 0 1,204Salisbury University 0 0 1,872 281 0 2,153Towson University 0 0 4,147 1,161 31 5,339University of Baltimore 0 0 670 527 316 1,513University of Maryland - Baltimore 0 0 337 795 889 2,021University of Maryland - Baltimore County 0 0 2,230 528 95 2,853University of Maryland - College Park 14 0 7,192 2,661 713 10,580University of Maryland - Eastern Shore 0 0 514 50 101 665University of Maryland - University College 0 472 4,159 3,918 80 8,629Morgan State University 0 0 976 267 33 1,276St. Mary’s College of Maryland 0 0 450 28 0 478Sub-Total 14 472 24,664 10,790 2,268 38,208
STATE-AIDED INDEPENDENT INSTITUTIONSCapitol College 0 0 55 117 9 181Goucher College 0 0 311 134 0 445Hood College 0 0 317 212 0 529Johns Hopkins University 0 0 1,691 4,439 662 6,792Loyola University Maryland 0 0 848 706 20 1,574Maryland Institute College of Art 1 0 431 129 0 561McDaniel College 0 0 352 488 0 840Mount St. Mary’s College 0 0 413 185 0 598National Labor College 0 0 70 0 0 70Notre Dame of Maryland University 0 0 360 358 56 774Sojourner-Douglass College 0 0 192 17 0 209St. John’s College 0 0 97 30 0 127Stevenson University 0 0 705 151 0 856Washington Adventist University 0 18 271 100 0 389Washington College 0 0 311 12 0 323Sub-Total 1 18 6,424 7,078 747 14,268
OTHER PRIVATE INSTITUTIONSHarry Lundeberg School of Seamanship 2 0 0 0 0 2Lincoln College of Technology 469 33 0 0 0 502Ner Israel Rabbinical College 0 0 43 23 12 78TAI Sophia Institute 0 0 0 109 0 109SANS Technology Institute 0 0 0 5 0 5St. Mary’s Seminary and University 0 0 1 31 0 32TESST College of Technology 847 78 0 0 0 925Women’s Institute of Torah Seminary 0 0 69 0 0 69Yeshiva College of Nations Capital 0 0 9 0 0 9Sub-Total 1,318 111 122 168 12 1,731TOTAL- ALL CAMPUSES 5,065 14,870 31,210 18,036 3,027 72,208Source: Maryland Higher Education Commission Degree Information System, 2013

20
DEGREES bY MAJOR PROGRAM: CERTIFICATE AND ASSOCIATES DEGREE PROGRAMS, 2012-2013 Lower Division Major Certificates Associate Total
TRANSFER MAJORSArts & Sciences 47 1,813 1,860Biological & Physical Sciences 0 1 1Humanities & Social Sciences 1 122 123Engineering 0 219 219General Studies 347 5,392 5,739Teacher Education, General 0 141 141Early Childhood Education (AAT) 0 108 108Elementary Education / Generic Special Education (AAT) 0 213 213Secondary Education - Physics (AAT) 0 1 1Secondary Education - Chemistry (AAT) 0 1 1Secondary Education - Mathematics (AAT) 0 8 8Secondary Education - Spanish (AAT) 0 11 11Secondary Education - English (AAT) 0 9 9Business Administration 0 1,278 1,278Computer Science 0 129 129Other / Interdisciplinary 0 10 10Sub-Total 395 9,456 9,851
APPLIED MAJORSBusiness & Commerce Technologies 1,058 971 2,029Data Processing Technologies 433 562 995Health Services & Paramedical Technologies 1,694 2,771 4,465Mechanical & Engineering Technologies 864 363 1,227Natural Science Technologies 119 87 206Public Service Technologies 502 660 1,162Sub-Total 4,670 5,414 10,084TOTAL 5,065 14,870 19,935Source(s): Maryland Higher Education Commission, Degree Information System, 2013
DEGREES bY RACE/ETHNICITY AND bY GENDER, 2012-2013 Lower Division Certificate Associate Sub-Total bachelors Masters Doctorate Sub-Total TOTALHispanic/Latino, any race 225 4.4% 923 6.2% 1,148 5.8% 1,609 5.2% 703 3.9% 109 3.6% 2,421 4.6% 3,569 4.9%Not Hispanic/Latino: Black/African American 1,620 32.0% 3,162 21.3% 4,782 24.0% 6,432 20.6% 3,487 19.3% 279 9.2% 10,198 19.5% 14,980 20.7% American Indian or Alaska Native 22 0.4% 56 0.4% 78 0.4% 70 0.2% 43 0.2% 5 0.2% 118 0.2% 196 0.3% Native Hawaiian or Pacific Islander 4 0.1% 47 0.3% 51 0.3% 40 0.1% 24 0.1% 1 0.0% 65 0.1% 116 0.2% Asian 185 3.7% 813 5.5% 998 5.0% 2,556 8.2% 1,180 6.5% 349 11.5% 4,085 7.8% 5,083 7.0% White 2,632 52.0% 8,599 57.8% 11,231 56.3% 17,683 56.7% 9,102 50.5% 1,649 54.5% 28,434 54.4% 39,665 54.9% Two or More Races 80 1.6% 263 1.8% 343 1.7% 659 2.1% 286 1.6% 51 1.7% 996 1.9% 1,339 1.9%Foreign/Non-Resident Alien 117 2.3% 645 4.3% 762 3.8% 847 2.7% 2,119 11.7% 462 15.3% 3,428 6.6% 4,190 5.8%Unknown 180 3.6% 362 2.4% 542 2.7% 1,314 4.2% 1,092 6.1% 122 4.0% 2,528 4.8% 3,070 4.3%TOTAL 5,065 100.0% 14,870 100.0% 19,935 100.0% 31,210 100.0% 18,036 100.0% 3,027 100.0% 52,273 100.0% 72,208 100.0%
Men 2,136 42.2% 5,798 39.0% 7,934 39.8% 13,403 42.9% 7,427 41.2% 1,432 47.3% 22,262 42.6% 30,196 41.8%Women 2,929 57.8% 9,072 61.0% 12,001 60.2% 17,807 57.1% 10,609 58.8% 1,595 52.7% 30,011 57.4% 42,012 58.2%TOTAL 5,065 100.0% 14,870 100.0% 19,935 100.0% 31,210 100.0% 18,036 100.0% 3,027 100.0% 52,273 100.0% 72,208 100.0%Source(s): Maryland Higher Education Commission, Degree Information System, 2013

21
DEGREES bY RACE/ETHNICITY AND bY GENDER, 2012-2013 Lower Division Certificate Associate Sub-Total bachelors Masters Doctorate Sub-Total TOTALHispanic/Latino, any race 225 4.4% 923 6.2% 1,148 5.8% 1,609 5.2% 703 3.9% 109 3.6% 2,421 4.6% 3,569 4.9%Not Hispanic/Latino: Black/African American 1,620 32.0% 3,162 21.3% 4,782 24.0% 6,432 20.6% 3,487 19.3% 279 9.2% 10,198 19.5% 14,980 20.7% American Indian or Alaska Native 22 0.4% 56 0.4% 78 0.4% 70 0.2% 43 0.2% 5 0.2% 118 0.2% 196 0.3% Native Hawaiian or Pacific Islander 4 0.1% 47 0.3% 51 0.3% 40 0.1% 24 0.1% 1 0.0% 65 0.1% 116 0.2% Asian 185 3.7% 813 5.5% 998 5.0% 2,556 8.2% 1,180 6.5% 349 11.5% 4,085 7.8% 5,083 7.0% White 2,632 52.0% 8,599 57.8% 11,231 56.3% 17,683 56.7% 9,102 50.5% 1,649 54.5% 28,434 54.4% 39,665 54.9% Two or More Races 80 1.6% 263 1.8% 343 1.7% 659 2.1% 286 1.6% 51 1.7% 996 1.9% 1,339 1.9%Foreign/Non-Resident Alien 117 2.3% 645 4.3% 762 3.8% 847 2.7% 2,119 11.7% 462 15.3% 3,428 6.6% 4,190 5.8%Unknown 180 3.6% 362 2.4% 542 2.7% 1,314 4.2% 1,092 6.1% 122 4.0% 2,528 4.8% 3,070 4.3%TOTAL 5,065 100.0% 14,870 100.0% 19,935 100.0% 31,210 100.0% 18,036 100.0% 3,027 100.0% 52,273 100.0% 72,208 100.0%
Men 2,136 42.2% 5,798 39.0% 7,934 39.8% 13,403 42.9% 7,427 41.2% 1,432 47.3% 22,262 42.6% 30,196 41.8%Women 2,929 57.8% 9,072 61.0% 12,001 60.2% 17,807 57.1% 10,609 58.8% 1,595 52.7% 30,011 57.4% 42,012 58.2%TOTAL 5,065 100.0% 14,870 100.0% 19,935 100.0% 31,210 100.0% 18,036 100.0% 3,027 100.0% 52,273 100.0% 72,208 100.0%Source(s): Maryland Higher Education Commission, Degree Information System, 2013
DEGREES bY MAJOR PROGRAM: bACHELORS, MASTERS & DOCTORAL DEGREE PROGRAMS, 2012-2013Major bachelors Masters Doctorate TotalAgriculture 354 53 22 429Architecture 113 89 4 206Area Studies 197 13 8 218Biological Science 2,126 671 300 3,097 Business 5,233 5,240 107 10,580 Communications 1,783 191 18 1,992 Computer Science 2,088 1,648 73 3,809Education 2,294 3,058 149 5,501Engineering 1,500 1,112 236 2,848Fine Arts 1,519 380 51 1,950Health 2,537 1,702 994 5,233Home Economics 264 5 2 271Languages 302 14 22 338Law 178 64 597 839Letters 1,240 194 38 1,472Library Science 0 145 2 147Mathematics 390 149 40 579Physical Science 451 219 118 788Psychology 2,152 543 61 2,756Public Affairs 945 808 14 1,767Social Science 4,468 1,257 133 5,858Theology 60 102 12 174Interdisciplinary 1,016 379 26 1,421TOTAL 31,210 18,036 3,027 52,273Source(s): Maryland Higher Education Commission, Degree Information System, 2013

22
FULL-TIME AND PART-TIME FACULTY, Fall 2012Institution Full-Time Part-Time TotalCOMMUNITY COLLEGESAllegany College of Maryland 108 35.2% 199 64.8% 307 Anne Arundel Community College 261 27.2% 700 72.8% 961 Baltimore City Community College 117 40.2% 174 59.8% 291 Carroll Community College 77 26.3% 216 73.7% 293 Cecil College 47 23.6% 152 76.4% 199 Chesapeake College 55 45.5% 66 54.5% 121 College of Southern Maryland 125 23.5% 407 76.5% 532 Community College of Baltimore County 427 31.0% 952 69.0% 1,379 Frederick Community College 98 19.0% 417 81.0% 515 Garrett College 23 30.3% 53 69.7% 76 Hagerstown Community College 80 30.2% 185 69.8% 265 Harford Community College 106 27.0% 287 73.0% 393 Howard Community College 177 24.2% 553 75.8% 730 Montgomery College-All Campuses 543 34.6% 1,026 65.4% 1,569 Prince George’s Community College 238 25.4% 699 74.6% 937 Wor-Wic Community College 68 35.1% 126 64.9% 194 Sub-Total 2,550 29.1% 6,212 70.9% 8,762
FOUR-YEAR PUbLIC INSTITUTIONSBowie State University 216 52.9% 192 47.1% 408 Coppin State University 156 50.6% 152 49.4% 308 Frostburg State University 245 64.8% 133 35.2% 378 Salisbury University 403 61.1% 257 38.9% 660 Towson University 848 51.6% 795 48.4% 1,643 University of Baltimore 197 48.9% 206 51.1% 403 University of Maryland - Baltimore 451 40.6% 659 59.4% 1,110 University of Maryland - Baltimore County 502 64.2% 280 35.8% 782 University of Maryland - College Park 1,677 70.6% 698 29.4% 2,375 University of Maryland - Eastern Shore 217 62.9% 128 37.1% 345 University of Maryland - University College 218 8.0% 2,494 92.0% 2,712 Morgan State University 441 69.6% 193 30.4% 634 St. Mary’s College of Maryland 150 73.5% 54 26.5% 204 Sub-Total 5,721 47.8% 6,241 52.2% 11,962 TOTAL - ALL CAMPUSES 8,271 39.9% 12,453 60.1% 20,724 Notes: Figures include instructional faculty, excluding pre-clinical and clinical medicine faculty at UMB and continuing education faculty.Source: Maryland Higher Education Commission, Employee Data System, 2012
faculty

23
AVERAGE SALARY OF FULL-TIME FACULTY, Fall 2012 Associate Assistant CAMPUS INSTITUTION Professor Professor Professor Instructor Lecturer AVERAGECOMMUNITY COLLEGESAllegany College of Maryland $64,226 $52,036 $48,699 $43,171 - $53,957 Anne Arundel Community College 80,332 65,456 57,705 52,516 - 67,349 Baltimore City Community College 76,111 63,774 55,160 47,414 - 59,981 Carroll Community College 66,704 63,259 50,528 43,554 - 55,377 Cecil College 72,837 60,212 49,684 43,294 - 58,683 Chesapeake College 74,489 68,136 58,292 53,247 $46,798 63,032 College of Southern Maryland 85,572 68,276 65,591 - - 79,703 Community College of Baltimore County 89,524 71,036 61,434 55,653 - 67,186 Frederick Community College 87,002 72,325 60,302 - - 69,374 Garrett College 70,809 60,134 54,682 - - 64,054 Hagerstown Community College 75,816 58,343 55,284 49,546 - 56,417 Harford Community College 83,331 67,849 52,560 - - 67,441 Howard Community College 88,484 71,138 60,434 54,950 55,035 70,154 Montgomery College 84,392 66,814 59,598 56,327 - 74,714 Prince George’s Community College 72,611 60,229 53,523 50,681 - 63,820 Wor-Wic Community College 82,417 67,926 54,859 45,912 - 59,092 Community College Average $79,882 $64,976 $57,402 $51,554 $52,289 $65,085
FOUR-YEAR PUbLIC INSTITUTIONSBowie State University $89,315 $71,203 $62,479 $60,789 $53,961 $67,005 Coppin State University 88,138 67,222 63,665 60,867 40,612 65,492 Frostburg State University 81,659 65,399 58,869 62,667 37,613 64,854 Salisbury University 85,929 68,502 62,719 62,910 44,707 65,979 Towson University 90,396 72,395 62,557 53,197 39,764 66,137 University of Baltimore 129,610 96,852 77,085 55,000 70,649 98,771 University of Maryland - Baltimore 160,916 117,894 98,977 73,801 - 116,158 University of Maryland - Baltimore County 119,547 78,736 68,061 57,498 51,913 84,189 University of Maryland - College Park 152,026 102,371 87,346 67,956 64,171 112,635 University of Maryland - Eastern Shore 92,065 74,759 70,869 59,072 50,709 69,869 University of Maryland - University College 72,997 59,490 43,685 - - 68,078 Morgan State University 112,234 81,786 69,467 44,723 45,110 69,304 St. Mary’s College of Maryland 91,982 65,887 57,175 45,000 40,000 70,163 Four-Year Public Average $121,529 $85,381 $73,072 $65,433 $51,100 $86,903 Notes: Figures include instructional faculty, excluding pre-clinical and clinical medicine faculty at UMB and continuing education faculty.Source: Maryland Higher Education Commission, Employee Data System, 2012

24
FULL-TIME FACULTY bY RACE/ETHNICITY AND bY GENDER, Fall 2012 Not Hispanic/Latino Gender American Native Hispanic/ Black/ Indian or Hawaiian or Foreign/ Latino, any African Alaska Pacific Two or Non-ResidentINSTITUTION race American Native Islander Asian White More Races Alien Male FemaleCOMMUNITY COLLEGESAllegany College of Maryland 1 1 0 0 0 106 0 0 42 66 Anne Arundel Community College 5 24 0 1 10 218 3 0 102 159 Baltimore City Community College 1 58 0 0 5 42 0 11 51 66 Carroll Community College 1 1 0 0 1 73 1 0 21 56 Cecil College 1 2 0 0 2 42 0 0 16 31 Chesapeake College 1 2 0 0 0 50 1 1 21 34 College of Southern Maryland 5 15 1 0 2 99 3 0 57 68 Community College of Baltimore County 11 61 2 0 15 318 10 10 175 252 Frederick Community College 2 9 0 0 3 84 0 0 42 56 Garrett College 0 0 0 0 2 21 0 0 14 9 Hagerstown Community College 1 3 0 0 0 73 3 0 28 52 Harford Community College 2 5 0 0 2 95 0 2 49 57 Howard Community College 3 22 0 0 12 126 1 13 59 118 Montgomery College-All Campuses 17 68 6 0 30 369 1 52 223 320 Prince George’s Community College 4 70 0 0 12 145 4 3 90 148 Wor-Wic Community College 0 2 0 0 1 64 1 0 24 44 Sub-Total 55 343 9 1 97 1,925 28 92 1,014 1,536
FOUR-YEAR PUbLIC SCHOOLSBowie State University 9 157 0 0 10 34 2 4 107 109 Coppin State University 2 114 0 0 15 22 3 0 76 80 Frostburg State University 6 7 0 0 13 210 3 6 144 101 Salisbury University 8 25 0 0 24 338 3 5 209 194 Towson University 19 44 1 2 71 686 17 8 379 469 University of Baltimore 5 20 0 0 18 149 5 0 115 82 University of Maryland - Baltimore 10 54 2 0 46 326 4 9 171 280 University of Maryland - Baltimore County 17 29 1 2 60 373 1 19 282 220 University of Maryland - College Park 76 83 2 0 206 1,161 91 58 1,081 596 University of Maryland - Eastern Shore 6 75 3 0 26 90 4 13 126 91 University of Maryland - University College 5 16 3 0 18 150 19 7 113 105 Morgan State University 3 188 3 1 23 73 95 55 263 178 St. Mary’s College of Maryland 4 5 0 0 8 121 6 6 80 70 Sub-Total 170 817 15 5 538 3,733 253 190 3,146 2,575TOTAL - ALL CAMPUSES 225 1,160 24 6 635 5,658 281 282 4,160 4,111Notes: Figures include instructional faculty, excluding pre-clinical and clinical medicine faculty at UMB and continuing education faculty.Source: Maryland Higher Education Commission, Employee Data System, 2012

25
FULL-TIME FACULTY bY RACE/ETHNICITY AND bY GENDER, Fall 2012 Not Hispanic/Latino Gender American Native Hispanic/ Black/ Indian or Hawaiian or Foreign/ Latino, any African Alaska Pacific Two or Non-ResidentINSTITUTION race American Native Islander Asian White More Races Alien Male FemaleCOMMUNITY COLLEGESAllegany College of Maryland 1 1 0 0 0 106 0 0 42 66 Anne Arundel Community College 5 24 0 1 10 218 3 0 102 159 Baltimore City Community College 1 58 0 0 5 42 0 11 51 66 Carroll Community College 1 1 0 0 1 73 1 0 21 56 Cecil College 1 2 0 0 2 42 0 0 16 31 Chesapeake College 1 2 0 0 0 50 1 1 21 34 College of Southern Maryland 5 15 1 0 2 99 3 0 57 68 Community College of Baltimore County 11 61 2 0 15 318 10 10 175 252 Frederick Community College 2 9 0 0 3 84 0 0 42 56 Garrett College 0 0 0 0 2 21 0 0 14 9 Hagerstown Community College 1 3 0 0 0 73 3 0 28 52 Harford Community College 2 5 0 0 2 95 0 2 49 57 Howard Community College 3 22 0 0 12 126 1 13 59 118 Montgomery College-All Campuses 17 68 6 0 30 369 1 52 223 320 Prince George’s Community College 4 70 0 0 12 145 4 3 90 148 Wor-Wic Community College 0 2 0 0 1 64 1 0 24 44 Sub-Total 55 343 9 1 97 1,925 28 92 1,014 1,536
FOUR-YEAR PUbLIC SCHOOLSBowie State University 9 157 0 0 10 34 2 4 107 109 Coppin State University 2 114 0 0 15 22 3 0 76 80 Frostburg State University 6 7 0 0 13 210 3 6 144 101 Salisbury University 8 25 0 0 24 338 3 5 209 194 Towson University 19 44 1 2 71 686 17 8 379 469 University of Baltimore 5 20 0 0 18 149 5 0 115 82 University of Maryland - Baltimore 10 54 2 0 46 326 4 9 171 280 University of Maryland - Baltimore County 17 29 1 2 60 373 1 19 282 220 University of Maryland - College Park 76 83 2 0 206 1,161 91 58 1,081 596 University of Maryland - Eastern Shore 6 75 3 0 26 90 4 13 126 91 University of Maryland - University College 5 16 3 0 18 150 19 7 113 105 Morgan State University 3 188 3 1 23 73 95 55 263 178 St. Mary’s College of Maryland 4 5 0 0 8 121 6 6 80 70 Sub-Total 170 817 15 5 538 3,733 253 190 3,146 2,575TOTAL - ALL CAMPUSES 225 1,160 24 6 635 5,658 281 282 4,160 4,111Notes: Figures include instructional faculty, excluding pre-clinical and clinical medicine faculty at UMB and continuing education faculty.Source: Maryland Higher Education Commission, Employee Data System, 2012
26
revenues & expenditures
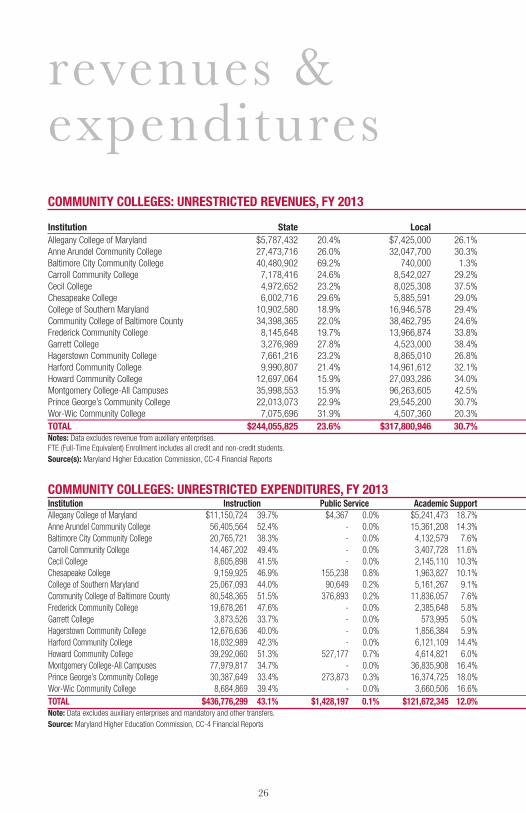
COMMUNITY COLLEGES: UNRESTRICTED EXPENDITURES, FY 2013Institution Instruction Public Service Academic Support Student Services Institutional Support Operation & Maintenance Scholarships & Fellowships TotalAllegany College of Maryland $11,150,724 39.7% $4,367 0.0% $5,241,473 18.7% $2,306,484 8.2% $5,721,993 20.4% $2,993,576 10.7% $633,964 2.3% $28,052,581Anne Arundel Community College 56,405,564 52.4% - 0.0% 15,361,208 14.3% 8,290,459 7.7% 16,136,948 15.0% 11,363,185 10.6% - 0.0% $107,557,364Baltimore City Community College 20,765,721 38.3% - 0.0% 4,132,579 7.6% 6,913,625 12.8% 12,658,787 23.3% 9,666,008 17.8% 84,245 0.2% $54,220,965Carroll Community College 14,467,202 49.4% - 0.0% 3,407,728 11.6% 2,445,678 8.3% 5,695,165 19.4% 3,290,581 11.2% - 0.0% $29,306,354Cecil College 8,605,898 41.5% - 0.0% 2,145,110 10.3% 2,620,090 12.6% 4,158,018 20.1% 2,835,540 13.7% 370,487 1.8% $20,735,143Chesapeake College 9,159,925 46.9% 155,238 0.8% 1,963,827 10.1% 1,884,710 9.7% 3,943,566 20.2% 2,327,129 11.9% 90,618 0.5% $19,525,013College of Southern Maryland 25,067,093 44.0% 90,649 0.2% 5,161,267 9.1% 4,521,705 7.9% 16,542,077 29.1% 5,411,926 9.5% 146,529 0.3% $56,941,246Community College of Baltimore County 80,548,365 51.5% 376,893 0.2% 11,836,057 7.6% 15,178,545 9.7% 33,315,788 21.3% 14,449,542 9.2% 728,745 0.5% $156,433,935Frederick Community College 19,678,261 47.6% - 0.0% 2,385,648 5.8% 5,613,867 13.6% 8,385,635 20.3% 5,057,145 12.2% 232,457 0.6% $41,353,013Garrett College 3,873,526 33.7% - 0.0% 573,995 5.0% 2,268,944 19.8% 2,750,989 24.0% 1,877,377 16.4% 134,577 1.2% $11,479,408Hagerstown Community College 12,676,636 40.0% - 0.0% 1,856,384 5.9% 3,677,199 11.6% 7,821,031 24.7% 5,692,047 17.9% - 0.0% $31,723,297Harford Community College 18,032,989 42.3% - 0.0% 6,121,109 14.4% 4,915,732 11.5% 8,152,357 19.1% 4,451,472 10.4% 935,360 2.2% $42,609,019Howard Community College 39,292,060 51.3% 527,177 0.7% 4,614,821 6.0% 7,835,376 10.2% 13,650,652 17.8% 8,578,090 11.2% 2,047,348 2.7% $76,545,524Montgomery College-All Campuses 77,979,817 34.7% - 0.0% 36,835,908 16.4% 25,373,790 11.3% 48,292,467 21.5% 33,083,083 14.7% 3,244,179 1.4% $224,809,244Prince George’s Community College 30,387,649 33.4% 273,873 0.3% 16,374,725 18.0% 8,324,454 9.1% 26,497,958 29.1% 8,480,788 9.3% 766,676 0.8% $91,106,123Wor-Wic Community College 8,684,869 39.4% - 0.0% 3,660,506 16.6% 1,652,199 7.5% 4,452,657 20.2% 3,369,359 15.3% 214,747 1.0% $22,034,337TOTAL $436,776,299 43.1% $1,428,197 0.1% $121,672,345 12.0% $103,822,857 10.2% $218,176,088 21.5% $122,926,848 12.1% $9,629,932 1.1% $1,014,432,566Note: Data excludes auxiliary enterprises and mandatory and other transfers.Source: Maryland Higher Education Commission, CC-4 Financial Reports
COMMUNITY COLLEGES: UNRESTRICTED REVENUES, FY 2013 FTE Institution State Local Tuition and Fees Other Total EnrollmentAllegany College of Maryland $5,787,432 20.4% $7,425,000 26.1% $14,758,493 52.0% $431,166 1.5% $28,402,091 3,004 Anne Arundel Community College 27,473,716 26.0% 32,047,700 30.3% 44,621,848 42.2% 1,549,394 1.5% $105,692,658 14,285 Baltimore City Community College 40,480,902 69.2% 740,000 1.3% 14,388,766 24.6% 2,918,709 5.0% $58,528,377 6,353 Carroll Community College 7,178,416 24.6% 8,542,027 29.2% 12,852,097 44.0% 639,507 2.2% $29,212,047 3,386 Cecil College 4,972,652 23.2% 8,025,308 37.5% 8,219,317 38.4% 210,716 1.0% $21,427,993 2,388 Chesapeake College 6,002,716 29.6% 5,885,591 29.0% 7,173,127 35.3% 1,241,731 6.1% $20,303,165 2,401 College of Southern Maryland 10,902,580 18.9% 16,946,578 29.4% 28,989,253 50.3% 728,823 1.4% $57,621,234 6,678 Community College of Baltimore County 34,398,365 22.0% 38,462,795 24.6% 82,164,617 52.5% 1,409,445 0.9% $156,435,222 19,822 Frederick Community College 8,145,648 19.7% 13,966,874 33.8% 17,722,763 42.9% 1,502,796 3.6% $41,338,081 4,548 Garrett College 3,276,989 27.8% 4,523,000 38.4% 3,914,102 33.2% 74,940 0.6% $11,789,031 914 Hagerstown Community College 7,661,216 23.2% 8,865,010 26.8% 16,043,879 48.6% 462,396 1.4% $33,032,501 4,039 Harford Community College 9,990,807 21.4% 14,961,612 32.1% 17,805,162 38.2% 3,902,155 8.4% $46,659,736 5,505 Howard Community College 12,697,064 15.9% 27,093,286 34.0% 38,039,480 47.8% 1,788,795 2.2% $79,618,625 8,275 Montgomery College-All Campuses 35,998,553 15.9% 96,263,605 42.5% 92,471,360 40.8% 1,744,544 0.8% $226,478,062 22,317 Prince George’s Community College 22,013,073 22.9% 29,545,200 30.7% 42,189,765 43.9% 2,372,827 2.5% $96,120,865 13,160 Wor-Wic Community College 7,075,696 31.9% 4,507,360 20.3% 10,114,005 45.5% 507,256 2.3% $22,204,317 2,998 TOTAL $244,055,825 23.6% $317,800,946 30.7% $451,468,034 43.6% $21,539,200 2.1% $1,034,864,005 120,073 Notes: Data excludes revenue from auxiliary enterprises. FTE (Full-Time Equivalent) Enrollment includes all credit and non-credit students.Source(s): Maryland Higher Education Commission, CC-4 Financial Reports

27
revenues & expenditures
COMMUNITY COLLEGES: UNRESTRICTED EXPENDITURES, FY 2013Institution Instruction Public Service Academic Support Student Services Institutional Support Operation & Maintenance Scholarships & Fellowships TotalAllegany College of Maryland $11,150,724 39.7% $4,367 0.0% $5,241,473 18.7% $2,306,484 8.2% $5,721,993 20.4% $2,993,576 10.7% $633,964 2.3% $28,052,581Anne Arundel Community College 56,405,564 52.4% - 0.0% 15,361,208 14.3% 8,290,459 7.7% 16,136,948 15.0% 11,363,185 10.6% - 0.0% $107,557,364Baltimore City Community College 20,765,721 38.3% - 0.0% 4,132,579 7.6% 6,913,625 12.8% 12,658,787 23.3% 9,666,008 17.8% 84,245 0.2% $54,220,965Carroll Community College 14,467,202 49.4% - 0.0% 3,407,728 11.6% 2,445,678 8.3% 5,695,165 19.4% 3,290,581 11.2% - 0.0% $29,306,354Cecil College 8,605,898 41.5% - 0.0% 2,145,110 10.3% 2,620,090 12.6% 4,158,018 20.1% 2,835,540 13.7% 370,487 1.8% $20,735,143Chesapeake College 9,159,925 46.9% 155,238 0.8% 1,963,827 10.1% 1,884,710 9.7% 3,943,566 20.2% 2,327,129 11.9% 90,618 0.5% $19,525,013College of Southern Maryland 25,067,093 44.0% 90,649 0.2% 5,161,267 9.1% 4,521,705 7.9% 16,542,077 29.1% 5,411,926 9.5% 146,529 0.3% $56,941,246Community College of Baltimore County 80,548,365 51.5% 376,893 0.2% 11,836,057 7.6% 15,178,545 9.7% 33,315,788 21.3% 14,449,542 9.2% 728,745 0.5% $156,433,935Frederick Community College 19,678,261 47.6% - 0.0% 2,385,648 5.8% 5,613,867 13.6% 8,385,635 20.3% 5,057,145 12.2% 232,457 0.6% $41,353,013Garrett College 3,873,526 33.7% - 0.0% 573,995 5.0% 2,268,944 19.8% 2,750,989 24.0% 1,877,377 16.4% 134,577 1.2% $11,479,408Hagerstown Community College 12,676,636 40.0% - 0.0% 1,856,384 5.9% 3,677,199 11.6% 7,821,031 24.7% 5,692,047 17.9% - 0.0% $31,723,297Harford Community College 18,032,989 42.3% - 0.0% 6,121,109 14.4% 4,915,732 11.5% 8,152,357 19.1% 4,451,472 10.4% 935,360 2.2% $42,609,019Howard Community College 39,292,060 51.3% 527,177 0.7% 4,614,821 6.0% 7,835,376 10.2% 13,650,652 17.8% 8,578,090 11.2% 2,047,348 2.7% $76,545,524Montgomery College-All Campuses 77,979,817 34.7% - 0.0% 36,835,908 16.4% 25,373,790 11.3% 48,292,467 21.5% 33,083,083 14.7% 3,244,179 1.4% $224,809,244Prince George’s Community College 30,387,649 33.4% 273,873 0.3% 16,374,725 18.0% 8,324,454 9.1% 26,497,958 29.1% 8,480,788 9.3% 766,676 0.8% $91,106,123Wor-Wic Community College 8,684,869 39.4% - 0.0% 3,660,506 16.6% 1,652,199 7.5% 4,452,657 20.2% 3,369,359 15.3% 214,747 1.0% $22,034,337TOTAL $436,776,299 43.1% $1,428,197 0.1% $121,672,345 12.0% $103,822,857 10.2% $218,176,088 21.5% $122,926,848 12.1% $9,629,932 1.1% $1,014,432,566Note: Data excludes auxiliary enterprises and mandatory and other transfers.Source: Maryland Higher Education Commission, CC-4 Financial Reports
COMMUNITY COLLEGES: UNRESTRICTED REVENUES, FY 2013 FTE Institution State Local Tuition and Fees Other Total EnrollmentAllegany College of Maryland $5,787,432 20.4% $7,425,000 26.1% $14,758,493 52.0% $431,166 1.5% $28,402,091 3,004 Anne Arundel Community College 27,473,716 26.0% 32,047,700 30.3% 44,621,848 42.2% 1,549,394 1.5% $105,692,658 14,285 Baltimore City Community College 40,480,902 69.2% 740,000 1.3% 14,388,766 24.6% 2,918,709 5.0% $58,528,377 6,353 Carroll Community College 7,178,416 24.6% 8,542,027 29.2% 12,852,097 44.0% 639,507 2.2% $29,212,047 3,386 Cecil College 4,972,652 23.2% 8,025,308 37.5% 8,219,317 38.4% 210,716 1.0% $21,427,993 2,388 Chesapeake College 6,002,716 29.6% 5,885,591 29.0% 7,173,127 35.3% 1,241,731 6.1% $20,303,165 2,401 College of Southern Maryland 10,902,580 18.9% 16,946,578 29.4% 28,989,253 50.3% 728,823 1.4% $57,621,234 6,678 Community College of Baltimore County 34,398,365 22.0% 38,462,795 24.6% 82,164,617 52.5% 1,409,445 0.9% $156,435,222 19,822 Frederick Community College 8,145,648 19.7% 13,966,874 33.8% 17,722,763 42.9% 1,502,796 3.6% $41,338,081 4,548 Garrett College 3,276,989 27.8% 4,523,000 38.4% 3,914,102 33.2% 74,940 0.6% $11,789,031 914 Hagerstown Community College 7,661,216 23.2% 8,865,010 26.8% 16,043,879 48.6% 462,396 1.4% $33,032,501 4,039 Harford Community College 9,990,807 21.4% 14,961,612 32.1% 17,805,162 38.2% 3,902,155 8.4% $46,659,736 5,505 Howard Community College 12,697,064 15.9% 27,093,286 34.0% 38,039,480 47.8% 1,788,795 2.2% $79,618,625 8,275 Montgomery College-All Campuses 35,998,553 15.9% 96,263,605 42.5% 92,471,360 40.8% 1,744,544 0.8% $226,478,062 22,317 Prince George’s Community College 22,013,073 22.9% 29,545,200 30.7% 42,189,765 43.9% 2,372,827 2.5% $96,120,865 13,160 Wor-Wic Community College 7,075,696 31.9% 4,507,360 20.3% 10,114,005 45.5% 507,256 2.3% $22,204,317 2,998 TOTAL $244,055,825 23.6% $317,800,946 30.7% $451,468,034 43.6% $21,539,200 2.1% $1,034,864,005 120,073 Notes: Data excludes revenue from auxiliary enterprises. FTE (Full-Time Equivalent) Enrollment includes all credit and non-credit students.Source(s): Maryland Higher Education Commission, CC-4 Financial Reports

28
PUbLIC FOUR-YEAR COLLEGES AND UNIVERSITIES: UNRESTRICTED EXPENDITURES, FY 2013Institution Instruction Research Public Service Academic Support Student Services Institutional Support Operation & Maintenance Scholarships & Fellowships TotalBowie State University $25,540,973 37.3% - 0.0% $83,985 0.1% $8,111,262 11.8% $4,731,049 6.9% $12,387,440 18.1% $12,916,553 18.8% $4,756,333 6.9% 68,527,595 Coppin State University 18,073,162 32.1% - 0.0% 278,460 0.5% 6,470,023 11.5% 4,698,118 8.3% 12,983,041 23.0% 11,121,961 19.7% 2,716,875 4.8% 56,341,640 Frostburg State University 28,990,830 40.5% (8,441) -0.0% 344,621 0.5% 9,182,792 12.8% 4,930,568 6.9% 10,005,274 14.0% 12,132,299 16.9% 6,067,549 8.5% 71,645,492 Salisbury University 47,728,585 46.8% 502,950 0.5% 1,360,938 1.3% 8,887,855 8.7% 5,713,917 5.6% 14,402,693 14.1% 17,496,585 17.2% 5,818,293 5.7% 101,911,816 Towson University 102,866,188 38.8% 1,012,497 0.4% 3,424,276 1.3% 38,657,919 14.6% 16,112,110 6.1% 30,270,091 11.4% 42,506,020 16.0% 30,013,195 11.3% 264,862,296 University of Baltimore 35,571,045 36.6% 695,151 0.7% - 0.0% 12,417,208 12.8% 8,995,400 9.3% 21,607,897 22.2% 9,390,493 9.7% 8,492,307 8.7% 97,169,501 University of Maryland - Baltimore 192,429,031 40.4% 84,346,049 17.8% 3,471,536 0.7% 47,169,036 9.9% 4,092,741 0.9% 66,137,671 13.9% 68,088,503 14.3% 10,719,355 2.2% 476,753,922 University of Maryland - Baltimore County 98,296,919 42.7% 15,396,472 6.7% 3,825,180 1.7% 19,877,797 8.6% 14,317,427 6.2% 35,107,461 15.3% 24,626,887 10.7% 18,600,590 8.1% 230,048,733 Univ. of Maryland - College Park 414,732,432 39.2% 108,950,477 10.3% 32,313,623 3.1% 148,655,008 14.1% 46,855,604 4.4% 106,662,465 10.1% 141,687,374 13.4% 58,003,234 5.5% 1,057,860,217 Univ. of Maryland - Eastern Shore 27,892,462 41.4% 1,279,436 1.9% 3,607 0.0% 7,186,026 10.7% 2,759,877 4.1% 9,756,188 14.5% 12,346,487 18.3% 6,223,319 9.2% 67,447,402 Univ. of Maryland - University College 100,887,807 27.9% 365,337 0.1% 11,135,583 3.1% 62,616,002 17.3% 76,216,881 21.1% 48,857,472 13.5% 51,249,464 14.2% 9,847,312 2.7% 361,175,858 Morgan State University 49,655,846 35.8% 885,078 0.6% 144,440 0.1% 19,592,269 14.1% 6,160,312 4.4% 29,876,638 21.5% 17,971,154 12.9% 14,563,708 10.5% 138,849,445 St. Mary’s College of Maryland 21,015,420 40.8% - 0.0% 139,113 0.3% 2,186,929 4.3% 5,700,509 11.1% 11,405,745 22.2% 4,924,416 9.6% 6,074,729 11.8% 51,446,863 TOTAL $1,163,680,700 38.2% $213,725,006 7.0% $56,525,362 1.9% $391,010,128 12.8% $201,284,513 6.6% $409,460,076 13.5% $426,458,196 14.0% $181,896,799 6.0% $3,044,040,780Notes: Data excludes auxiliary and hospital expenditures.Source(s): Governor’s FY 2015 Budget Book and institutional budget requests
PUbLIC FOUR-YEAR COLLEGES AND UNIVERSITIES: UNRESTRICTED REVENUES, FY 2013 FTE Institution State Federal Tuition and Fees Other Total EnrollmentBowie State University $36,151,470 52.1% $239,647 0.3% $33,142,405 47.8% ($166,096) -0.2% $69,367,426 4,308 Coppin State University 38,156,848 71.4% 224,347 0.4% 15,464,911 28.9% (387,818) -0.7% $53,458,288 2,773 Frostburg State University 33,609,841 49.5% - 0.0% 33,696,662 49.6% 635,372 0.9% $67,941,875 4,573 Salisbury University 40,332,476 38.9% - 0.0% 62,963,025 60.8% 331,281 0.3% $103,626,782 7,862 Towson University 91,765,414 34.8% 918,459 0.3% 166,231,916 63.0% 4,778,012 1.8% $263,693,801 18,147 University of Baltimore 30,607,104 31.7% 46,176 0.0% 65,964,999 68.4% (210,704) -0.2% $476,453,922 4,792 University of Maryland - Baltimore 186,371,689 36.0% 54,264,284 10.5% 117,059,108 22.6% 159,749,711 30.9% $517,444,792 6,518 University of Maryland - Baltimore County 96,765,384 44.1% 7,263,720 3.3% 110,598,249 50.4% 4,933,863 2.2% $219,561,216 11,082 Univ. of Maryland - College Park 416,537,349 39.4% 65,159,678 6.2% 476,418,718 45.1% 99,327,729 9.4% $1,057,443,474 31,331 Univ. of Maryland - Eastern Shore 32,375,937 47.6% 739,254 1.1% 32,373,538 47.6% 2,585,846 3.8% $68,074,575 4,131 Univ. of Maryland - University College 34,145,041 9.4% 125,074 0.0% 326,684,691 90.2% 1,167,505 0.3% $362,122,311 23,997 Morgan State University 73,998,316 54.7% 2,768,594 2.0% 54,063,499 39.9% 4,563,116 3.4% $135,393,525 1,961 St. Mary’s College of Maryland 17,999,036 42.3% - 0.0% 29,128,386 68.5% (4,618,523) -10.9% $42,508,899 6,859 TOTAL $1,128,815,905 36.9% $131,749,233 4.3% $1,523,790,107 49.8% $272,688,694 8.9% $3,043,749,778 128,334 Note: Other includes State and local grants and contracts, private gifts, grants and contracts, sale of educational activities, other sources and transfers to and from fund balance. FTE (Full-Time Equivalent) Enrollment includes all credit and non-credit students.Source(s): Governor’s FY 2015 Budget Book and institutional budget requests

29
PUbLIC FOUR-YEAR COLLEGES AND UNIVERSITIES: UNRESTRICTED EXPENDITURES, FY 2013Institution Instruction Research Public Service Academic Support Student Services Institutional Support Operation & Maintenance Scholarships & Fellowships TotalBowie State University $25,540,973 37.3% - 0.0% $83,985 0.1% $8,111,262 11.8% $4,731,049 6.9% $12,387,440 18.1% $12,916,553 18.8% $4,756,333 6.9% 68,527,595 Coppin State University 18,073,162 32.1% - 0.0% 278,460 0.5% 6,470,023 11.5% 4,698,118 8.3% 12,983,041 23.0% 11,121,961 19.7% 2,716,875 4.8% 56,341,640 Frostburg State University 28,990,830 40.5% (8,441) -0.0% 344,621 0.5% 9,182,792 12.8% 4,930,568 6.9% 10,005,274 14.0% 12,132,299 16.9% 6,067,549 8.5% 71,645,492 Salisbury University 47,728,585 46.8% 502,950 0.5% 1,360,938 1.3% 8,887,855 8.7% 5,713,917 5.6% 14,402,693 14.1% 17,496,585 17.2% 5,818,293 5.7% 101,911,816 Towson University 102,866,188 38.8% 1,012,497 0.4% 3,424,276 1.3% 38,657,919 14.6% 16,112,110 6.1% 30,270,091 11.4% 42,506,020 16.0% 30,013,195 11.3% 264,862,296 University of Baltimore 35,571,045 36.6% 695,151 0.7% - 0.0% 12,417,208 12.8% 8,995,400 9.3% 21,607,897 22.2% 9,390,493 9.7% 8,492,307 8.7% 97,169,501 University of Maryland - Baltimore 192,429,031 40.4% 84,346,049 17.8% 3,471,536 0.7% 47,169,036 9.9% 4,092,741 0.9% 66,137,671 13.9% 68,088,503 14.3% 10,719,355 2.2% 476,753,922 University of Maryland - Baltimore County 98,296,919 42.7% 15,396,472 6.7% 3,825,180 1.7% 19,877,797 8.6% 14,317,427 6.2% 35,107,461 15.3% 24,626,887 10.7% 18,600,590 8.1% 230,048,733 Univ. of Maryland - College Park 414,732,432 39.2% 108,950,477 10.3% 32,313,623 3.1% 148,655,008 14.1% 46,855,604 4.4% 106,662,465 10.1% 141,687,374 13.4% 58,003,234 5.5% 1,057,860,217 Univ. of Maryland - Eastern Shore 27,892,462 41.4% 1,279,436 1.9% 3,607 0.0% 7,186,026 10.7% 2,759,877 4.1% 9,756,188 14.5% 12,346,487 18.3% 6,223,319 9.2% 67,447,402 Univ. of Maryland - University College 100,887,807 27.9% 365,337 0.1% 11,135,583 3.1% 62,616,002 17.3% 76,216,881 21.1% 48,857,472 13.5% 51,249,464 14.2% 9,847,312 2.7% 361,175,858 Morgan State University 49,655,846 35.8% 885,078 0.6% 144,440 0.1% 19,592,269 14.1% 6,160,312 4.4% 29,876,638 21.5% 17,971,154 12.9% 14,563,708 10.5% 138,849,445 St. Mary’s College of Maryland 21,015,420 40.8% - 0.0% 139,113 0.3% 2,186,929 4.3% 5,700,509 11.1% 11,405,745 22.2% 4,924,416 9.6% 6,074,729 11.8% 51,446,863 TOTAL $1,163,680,700 38.2% $213,725,006 7.0% $56,525,362 1.9% $391,010,128 12.8% $201,284,513 6.6% $409,460,076 13.5% $426,458,196 14.0% $181,896,799 6.0% $3,044,040,780Notes: Data excludes auxiliary and hospital expenditures.Source(s): Governor’s FY 2015 Budget Book and institutional budget requests
PUbLIC FOUR-YEAR COLLEGES AND UNIVERSITIES: UNRESTRICTED REVENUES, FY 2013 FTE Institution State Federal Tuition and Fees Other Total EnrollmentBowie State University $36,151,470 52.1% $239,647 0.3% $33,142,405 47.8% ($166,096) -0.2% $69,367,426 4,308 Coppin State University 38,156,848 71.4% 224,347 0.4% 15,464,911 28.9% (387,818) -0.7% $53,458,288 2,773 Frostburg State University 33,609,841 49.5% - 0.0% 33,696,662 49.6% 635,372 0.9% $67,941,875 4,573 Salisbury University 40,332,476 38.9% - 0.0% 62,963,025 60.8% 331,281 0.3% $103,626,782 7,862 Towson University 91,765,414 34.8% 918,459 0.3% 166,231,916 63.0% 4,778,012 1.8% $263,693,801 18,147 University of Baltimore 30,607,104 31.7% 46,176 0.0% 65,964,999 68.4% (210,704) -0.2% $476,453,922 4,792 University of Maryland - Baltimore 186,371,689 36.0% 54,264,284 10.5% 117,059,108 22.6% 159,749,711 30.9% $517,444,792 6,518 University of Maryland - Baltimore County 96,765,384 44.1% 7,263,720 3.3% 110,598,249 50.4% 4,933,863 2.2% $219,561,216 11,082 Univ. of Maryland - College Park 416,537,349 39.4% 65,159,678 6.2% 476,418,718 45.1% 99,327,729 9.4% $1,057,443,474 31,331 Univ. of Maryland - Eastern Shore 32,375,937 47.6% 739,254 1.1% 32,373,538 47.6% 2,585,846 3.8% $68,074,575 4,131 Univ. of Maryland - University College 34,145,041 9.4% 125,074 0.0% 326,684,691 90.2% 1,167,505 0.3% $362,122,311 23,997 Morgan State University 73,998,316 54.7% 2,768,594 2.0% 54,063,499 39.9% 4,563,116 3.4% $135,393,525 1,961 St. Mary’s College of Maryland 17,999,036 42.3% - 0.0% 29,128,386 68.5% (4,618,523) -10.9% $42,508,899 6,859 TOTAL $1,128,815,905 36.9% $131,749,233 4.3% $1,523,790,107 49.8% $272,688,694 8.9% $3,043,749,778 128,334 Note: Other includes State and local grants and contracts, private gifts, grants and contracts, sale of educational activities, other sources and transfers to and from fund balance. FTE (Full-Time Equivalent) Enrollment includes all credit and non-credit students.Source(s): Governor’s FY 2015 Budget Book and institutional budget requests
30
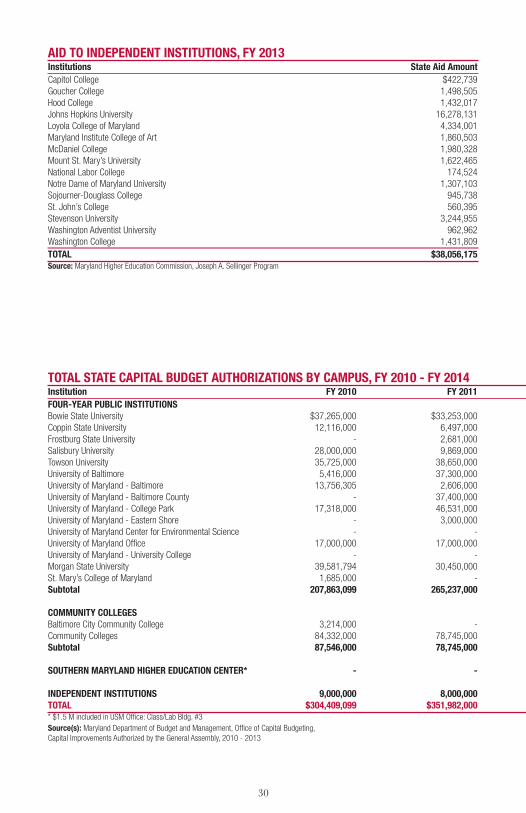
AID TO INDEPENDENT INSTITUTIONS, FY 2013Institutions State Aid AmountCapitol College $422,739 Goucher College 1,498,505 Hood College 1,432,017 Johns Hopkins University 16,278,131 Loyola College of Maryland 4,334,001 Maryland Institute College of Art 1,860,503 McDaniel College 1,980,328 Mount St. Mary’s University 1,622,465 National Labor College 174,524 Notre Dame of Maryland University 1,307,103 Sojourner-Douglass College 945,738 St. John’s College 560,395 Stevenson University 3,244,955 Washington Adventist University 962,962 Washington College 1,431,809 TOTAL $38,056,175Source: Maryland Higher Education Commission, Joseph A. Sellinger Program
TOTAL STATE CAPITAL bUDGET AUTHORIZATIONS bY CAMPUS, FY 2010 - FY 2014 Institution FY 2010 FY 2011 FY2012 FY 2013 FY 2014 TotalFOUR-YEAR PUbLIC INSTITUTIONSBowie State University $37,265,000 $33,253,000 $2,957,000 $5,266,000 $6,000,000 $84,741,000 Coppin State University 12,116,000 6,497,000 - 28,775,000 56,198,000 103,586,000 Frostburg State University - 2,681,000 10,054,000 44,550,000 9,843,000 67,128,000 Salisbury University 28,000,000 9,869,000 1,500,000 1,900,000 7,472,000 48,741,000 Towson University 35,725,000 38,650,000 1,200,000 11,700,000 11,512,000 98,787,000 University of Baltimore 5,416,000 37,300,000 41,493,000 4,037,000 1,000,000 89,246,000 University of Maryland - Baltimore 13,756,305 2,606,000 4,000,000 4,672,000 16,570,000 41,604,305 University of Maryland - Baltimore County - 37,400,000 41,200,000 34,225,000 38,068,000 150,893,000 University of Maryland - College Park 17,318,000 46,531,000 35,100,000 43,035,000 30,705,000 172,689,000 University of Maryland - Eastern Shore - 3,000,000 3,600,000 - 22,695,000 29,295,000 University of Maryland Center for Environmental Science - - - - 2,350,000 2,350,000 University of Maryland Office 17,000,000 17,000,000 17,000,000 10,000,000 23,500,000 84,500,000 University of Maryland - University College - - - - - Morgan State University 39,581,794 30,450,000 6,371,000 29,685,000 54,661,000 160,748,794 St. Mary’s College of Maryland 1,685,000 - - 310,000 4,580,000 6,575,000 Subtotal 207,863,099 265,237,000 164,475,000 218,155,000 285,154,000 1,140,884,099
COMMUNITY COLLEGESBaltimore City Community College 3,214,000 - 2,250,000 6,686,000 - 12,150,000 Community Colleges 84,332,000 78,745,000 60,341,000 37,629,000 52,035,000 313,082,000 Subtotal 87,546,000 78,745,000 62,591,000 44,315,000 52,035,000 325,232,000
SOUTHERN MARYLAND HIGHER EDUCATION CENTER* - - 935,000 - - 935,000
INDEPENDENT INSTITUTIONS 9,000,000 8,000,000 10,000,000 8,000,000 22,500,000 57,500,000 TOTAL $304,409,099 $351,982,000 $238,001,000 $270,470,000 $359,689,000 $1,524,551,099 * $1.5 M included in USM Office: Class/Lab Bldg. #3Source(s): Maryland Department of Budget and Management, Office of Capital Budgeting, Capital Improvements Authorized by the General Assembly, 2010 - 2013

31
TOTAL STATE CAPITAL bUDGET AUTHORIZATIONS bY CAMPUS, FY 2010 - FY 2014 Institution FY 2010 FY 2011 FY2012 FY 2013 FY 2014 TotalFOUR-YEAR PUbLIC INSTITUTIONSBowie State University $37,265,000 $33,253,000 $2,957,000 $5,266,000 $6,000,000 $84,741,000 Coppin State University 12,116,000 6,497,000 - 28,775,000 56,198,000 103,586,000 Frostburg State University - 2,681,000 10,054,000 44,550,000 9,843,000 67,128,000 Salisbury University 28,000,000 9,869,000 1,500,000 1,900,000 7,472,000 48,741,000 Towson University 35,725,000 38,650,000 1,200,000 11,700,000 11,512,000 98,787,000 University of Baltimore 5,416,000 37,300,000 41,493,000 4,037,000 1,000,000 89,246,000 University of Maryland - Baltimore 13,756,305 2,606,000 4,000,000 4,672,000 16,570,000 41,604,305 University of Maryland - Baltimore County - 37,400,000 41,200,000 34,225,000 38,068,000 150,893,000 University of Maryland - College Park 17,318,000 46,531,000 35,100,000 43,035,000 30,705,000 172,689,000 University of Maryland - Eastern Shore - 3,000,000 3,600,000 - 22,695,000 29,295,000 University of Maryland Center for Environmental Science - - - - 2,350,000 2,350,000 University of Maryland Office 17,000,000 17,000,000 17,000,000 10,000,000 23,500,000 84,500,000 University of Maryland - University College - - - - - Morgan State University 39,581,794 30,450,000 6,371,000 29,685,000 54,661,000 160,748,794 St. Mary’s College of Maryland 1,685,000 - - 310,000 4,580,000 6,575,000 Subtotal 207,863,099 265,237,000 164,475,000 218,155,000 285,154,000 1,140,884,099
COMMUNITY COLLEGESBaltimore City Community College 3,214,000 - 2,250,000 6,686,000 - 12,150,000 Community Colleges 84,332,000 78,745,000 60,341,000 37,629,000 52,035,000 313,082,000 Subtotal 87,546,000 78,745,000 62,591,000 44,315,000 52,035,000 325,232,000
SOUTHERN MARYLAND HIGHER EDUCATION CENTER* - - 935,000 - - 935,000
INDEPENDENT INSTITUTIONS 9,000,000 8,000,000 10,000,000 8,000,000 22,500,000 57,500,000 TOTAL $304,409,099 $351,982,000 $238,001,000 $270,470,000 $359,689,000 $1,524,551,099 * $1.5 M included in USM Office: Class/Lab Bldg. #3Source(s): Maryland Department of Budget and Management, Office of Capital Budgeting, Capital Improvements Authorized by the General Assembly, 2010 - 2013

32
COMMUNITY COLLEGE TUITION AND FEES FOR FULL-TIME STUDENTS (PER CREDIT HOUR), FY 2009 - FY 2013MARYLAND RESIDENTS, COUNTY RESIDENTS 1-Year 5-Year Institution FY 2009 FY 2010 FY 2011 FY 2012 FY 2013 Change ChangeAllegany College of Maryland $107 $105 $114 $114 $113 -0.9% 5.6%Anne Arundel Community College 95 97 100 105 121 15.6% 27.7%Baltimore City Community College 103 105 101 100 104 4.0% 1.0%Carroll Community College 114 119 121 123 130 6.0% 14.4%Cecil College 93 93 98 98 103 5.1% 10.8%Chesapeake College 109 109 117 136 132 -2.9% 21.1%College of Southern Maryland 121 123 129 132 137 3.4% 12.8%Community College of Baltimore County 104 103 113 125 131 4.8% 26.0%Frederick Community College 123 133 121 128 131 2.3% 6.5%Garrett College 98 106 110 114 114 0.0% 16.3%Hagerstown Community College 106 107 111 115 119 3.2% 11.9%Harford Community College 85 86 92 92 98 6.0% 14.7%Howard Community College 133 133 135 139 145 4.2% 8.8%Montgomery College-All Campuses 133 136 142 146 148 1.4% 11.3%Prince George’s Community College 124 123 134 134 140 4.5% 12.9%Wor-Wic Community College 82 87 97 99 101 1.9% 23.0%AVERAGE $108 $110 $115 $119 $123 3.5% 13.6%Source(s): Governor’s FY 2015 Budget Book and institutional requests
COMMUNITY COLLEGE TUITION AND FEES FOR FULL-TIME STUDENTS (PER CREDIT HOUR), FY 2009 - FY 2013MARYLAND RESIDENTS, OUTSIDE OF COUNTY 1-Year 5-Year Institution FY 2009 FY 2010 FY 2011 FY 2012 FY 2013 Change Change Allegany College of Maryland $190 $190 $202 $202 $204 1.0% 7.4% Anne Arundel Community College 174 178 181 188 210 11.9% 20.9% Baltimore City Community College 103 105 101 100 100 0.0% -2.9% Carroll Community College 165 172 175 178 189 6.1% 14.7% Cecil College 183 183 188 188 193 2.7% 5.5% Chesapeake College 177 177 185 214 201 -6.1% 13.6% College of Southern Maryland 210 214 225 228 236 3.8% 12.5% Community College of Baltimore County 188 196 204 225 236 4.9% 25.5% Frederick Community College 231 245 290 252 259 2.8% 12.1% Garrett College 216 236 236 240 240 0.0% 11.1% Hagerstown Community College 161 162 167 173 179 3.3% 11.0% Harford Community College 162 163 174 174 185 6.3% 14.2% Howard Community College 216 216 218 222 228 2.6% 5.4% Montgomery College-All Campuses 258 265 277 284 289 1.8% 12.0% Prince George’s Community College 195 195 205 205 214 4.4% 9.7% Wor-Wic Community College 201 203 205 211 217 2.7% 7.8% AVERAGE $189 $194 $202 $205 $211 2.9% 11.5% Source(s): Governor’s FY 2015 Budget Book and institutional requests
tuition & fees
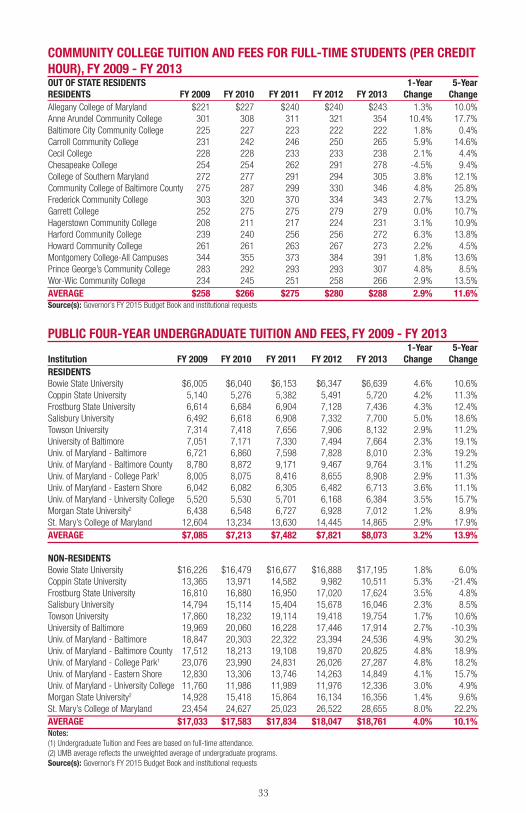
33
COMMUNITY COLLEGE TUITION AND FEES FOR FULL-TIME STUDENTS (PER CREDIT HOUR), FY 2009 - FY 2013OUT OF STATE RESIDENTS 1-Year 5-Year RESIDENTS FY 2009 FY 2010 FY 2011 FY 2012 FY 2013 Change Change Allegany College of Maryland $221 $227 $240 $240 $243 1.3% 10.0% Anne Arundel Community College 301 308 311 321 354 10.4% 17.7% Baltimore City Community College 225 227 223 222 222 1.8% 0.4% Carroll Community College 231 242 246 250 265 5.9% 14.6% Cecil College 228 228 233 233 238 2.1% 4.4% Chesapeake College 254 254 262 291 278 -4.5% 9.4% College of Southern Maryland 272 277 291 294 305 3.8% 12.1% Community College of Baltimore County 275 287 299 330 346 4.8% 25.8% Frederick Community College 303 320 370 334 343 2.7% 13.2% Garrett College 252 275 275 279 279 0.0% 10.7% Hagerstown Community College 208 211 217 224 231 3.1% 10.9% Harford Community College 239 240 256 256 272 6.3% 13.8% Howard Community College 261 261 263 267 273 2.2% 4.5% Montgomery College-All Campuses 344 355 373 384 391 1.8% 13.6% Prince George’s Community College 283 292 293 293 307 4.8% 8.5% Wor-Wic Community College 234 245 251 258 266 2.9% 13.5% AVERAGE $258 $266 $275 $280 $288 2.9% 11.6% Source(s): Governor’s FY 2015 Budget Book and institutional requests
PUbLIC FOUR-YEAR UNDERGRADUATE TUITION AND FEES, FY 2009 - FY 2013 1-Year 5-Year Institution FY 2009 FY 2010 FY 2011 FY 2012 FY 2013 Change ChangeRESIDENTS Bowie State University $6,005 $6,040 $6,153 $6,347 $6,639 4.6% 10.6%Coppin State University 5,140 5,276 5,382 5,491 5,720 4.2% 11.3%Frostburg State University 6,614 6,684 6,904 7,128 7,436 4.3% 12.4%Salisbury University 6,492 6,618 6,908 7,332 7,700 5.0% 18.6%Towson University 7,314 7,418 7,656 7,906 8,132 2.9% 11.2%University of Baltimore 7,051 7,171 7,330 7,494 7,664 2.3% 19.1%Univ. of Maryland - Baltimore 6,721 6,860 7,598 7,828 8,010 2.3% 19.2%Univ. of Maryland - Baltimore County 8,780 8,872 9,171 9,467 9,764 3.1% 11.2%Univ. of Maryland - College Park1 8,005 8,075 8,416 8,655 8,908 2.9% 11.3%Univ. of Maryland - Eastern Shore 6,042 6,082 6,305 6,482 6,713 3.6% 11.1%Univ. of Maryland - University College 5,520 5,530 5,701 6,168 6,384 3.5% 15.7%Morgan State University2 6,438 6,548 6,727 6,928 7,012 1.2% 8.9%St. Mary’s College of Maryland 12,604 13,234 13,630 14,445 14,865 2.9% 17.9%AVERAGE $7,085 $7,213 $7,482 $7,821 $8,073 3.2% 13.9% NON-RESIDENTS Bowie State University $16,226 $16,479 $16,677 $16,888 $17,195 1.8% 6.0%Coppin State University 13,365 13,971 14,582 9,982 10,511 5.3% -21.4%Frostburg State University 16,810 16,880 16,950 17,020 17,624 3.5% 4.8%Salisbury University 14,794 15,114 15,404 15,678 16,046 2.3% 8.5%Towson University 17,860 18,232 19,114 19,418 19,754 1.7% 10.6%University of Baltimore 19,969 20,060 16,228 17,446 17,914 2.7% -10.3%Univ. of Maryland - Baltimore 18,847 20,303 22,322 23,394 24,536 4.9% 30.2%Univ. of Maryland - Baltimore County 17,512 18,213 19,108 19,870 20,825 4.8% 18.9%Univ. of Maryland - College Park1 23,076 23,990 24,831 26,026 27,287 4.8% 18.2%Univ. of Maryland - Eastern Shore 12,830 13,306 13,746 14,263 14,849 4.1% 15.7%Univ. of Maryland - University College 11,760 11,986 11,989 11,976 12,336 3.0% 4.9%Morgan State University2 14,928 15,418 15,864 16,134 16,356 1.4% 9.6%St. Mary’s College of Maryland 23,454 24,627 25,023 26,522 28,655 8.0% 22.2%AVERAGE $17,033 $17,583 $17,834 $18,047 $18,761 4.0% 10.1%Notes: (1) Undergraduate Tuition and Fees are based on full-time attendance. (2) UMB average reflects the unweighted average of undergraduate programs. Source(s): Governor’s FY 2015 Budget Book and institutional requests
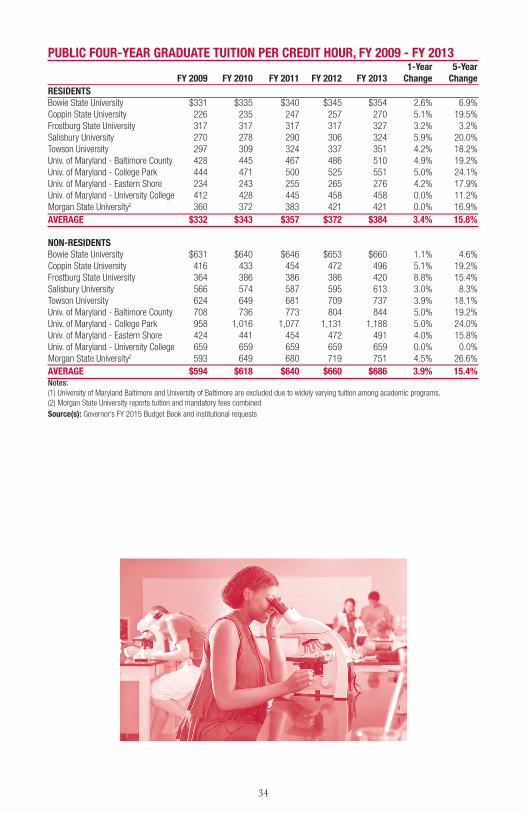
34
PUbLIC FOUR-YEAR GRADUATE TUITION PER CREDIT HOUR, FY 2009 - FY 2013 1-Year 5-Year FY 2009 FY 2010 FY 2011 FY 2012 FY 2013 Change Change RESIDENTS Bowie State University $331 $335 $340 $345 $354 2.6% 6.9%Coppin State University 226 235 247 257 270 5.1% 19.5%Frostburg State University 317 317 317 317 327 3.2% 3.2%Salisbury University 270 278 290 306 324 5.9% 20.0%Towson University 297 309 324 337 351 4.2% 18.2%Univ. of Maryland - Baltimore County 428 445 467 486 510 4.9% 19.2%Univ. of Maryland - College Park 444 471 500 525 551 5.0% 24.1%Univ. of Maryland - Eastern Shore 234 243 255 265 276 4.2% 17.9%Univ. of Maryland - University College 412 428 445 458 458 0.0% 11.2%Morgan State University2 360 372 383 421 421 0.0% 16.9%AVERAGE $332 $343 $357 $372 $384 3.4% 15.8% NON-RESIDENTS Bowie State University $631 $640 $646 $653 $660 1.1% 4.6%Coppin State University 416 433 454 472 496 5.1% 19.2%Frostburg State University 364 386 386 386 420 8.8% 15.4%Salisbury University 566 574 587 595 613 3.0% 8.3%Towson University 624 649 681 709 737 3.9% 18.1%Univ. of Maryland - Baltimore County 708 736 773 804 844 5.0% 19.2%Univ. of Maryland - College Park 958 1,016 1,077 1,131 1,188 5.0% 24.0%Univ. of Maryland - Eastern Shore 424 441 454 472 491 4.0% 15.8%Univ. of Maryland - University College 659 659 659 659 659 0.0% 0.0%Morgan State University2 593 649 680 719 751 4.5% 26.6%AVERAGE $594 $618 $640 $660 $686 3.9% 15.4%Notes: (1) University of Maryland Baltimore and University of Baltimore are excluded due to widely varying tuition among academic programs. (2) Morgan State University reports tuition and mandatory fees combinedSource(s): Governor’s FY 2015 Budget Book and institutional requests

35
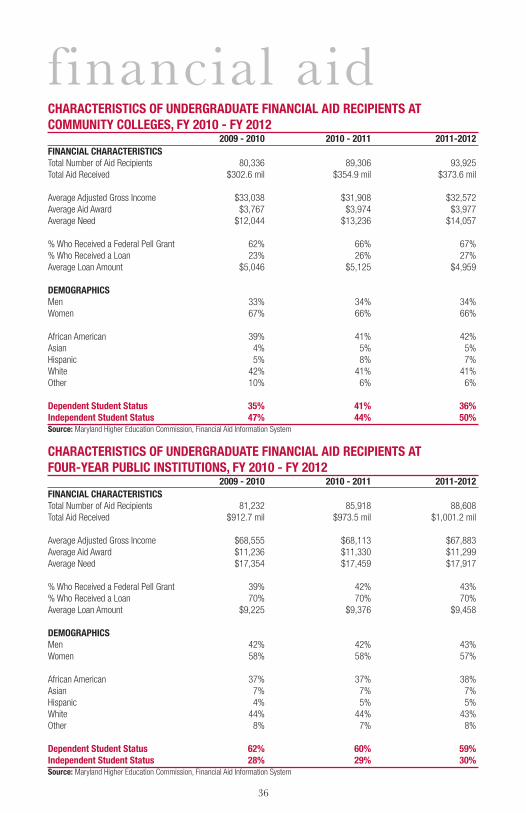
36
CHARACTERISTICS OF UNDERGRADUATE FINANCIAL AID RECIPIENTS AT COMMUNITY COLLEGES, FY 2010 - FY 2012 2009 - 2010 2010 - 2011 2011-2012FINANCIAL CHARACTERISTICSTotal Number of Aid Recipients 80,336 89,306 93,925Total Aid Received $302.6 mil $354.9 mil $373.6 mil
Average Adjusted Gross Income $33,038 $31,908 $32,572Average Aid Award $3,767 $3,974 $3,977Average Need $12,044 $13,236 $14,057
% Who Received a Federal Pell Grant 62% 66% 67%% Who Received a Loan 23% 26% 27%Average Loan Amount $5,046 $5,125 $4,959
DEMOGRAPHICSMen 33% 34% 34%Women 67% 66% 66%
African American 39% 41% 42%Asian 4% 5% 5%Hispanic 5% 8% 7%White 42% 41% 41%Other 10% 6% 6%
Dependent Student Status 35% 41% 36%Independent Student Status 47% 44% 50%Source: Maryland Higher Education Commission, Financial Aid Information System
CHARACTERISTICS OF UNDERGRADUATE FINANCIAL AID RECIPIENTS AT FOUR-YEAR PUbLIC INSTITUTIONS, FY 2010 - FY 2012 2009 - 2010 2010 - 2011 2011-2012 FINANCIAL CHARACTERISTICS Total Number of Aid Recipients 81,232 85,918 88,608 Total Aid Received $912.7 mil $973.5 mil $1,001.2 mil Average Adjusted Gross Income $68,555 $68,113 $67,883 Average Aid Award $11,236 $11,330 $11,299 Average Need $17,354 $17,459 $17,917 % Who Received a Federal Pell Grant 39% 42% 43% % Who Received a Loan 70% 70% 70% Average Loan Amount $9,225 $9,376 $9,458 DEMOGRAPHICS Men 42% 42% 43% Women 58% 58% 57% African American 37% 37% 38% Asian 7% 7% 7% Hispanic 4% 5% 5% White 44% 44% 43% Other 8% 7% 8% Dependent Student Status 62% 60% 59% Independent Student Status 28% 29% 30% Source: Maryland Higher Education Commission, Financial Aid Information System
financial aid
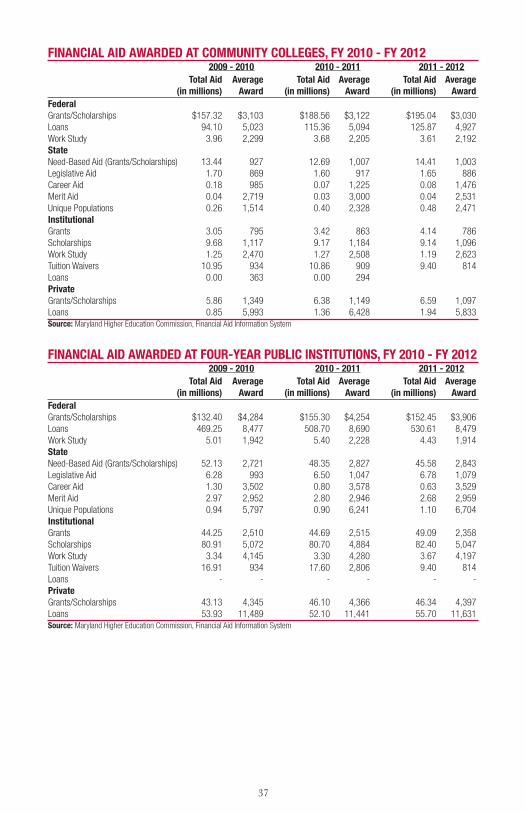
37
FINANCIAL AID AWARDED AT COMMUNITY COLLEGES, FY 2010 - FY 2012 2009 - 2010 2010 - 2011 2011 - 2012 Total Aid Average Total Aid Average Total Aid Average (in millions) Award (in millions) Award (in millions) AwardFederal Grants/Scholarships $157.32 $3,103 $188.56 $3,122 $195.04 $3,030 Loans 94.10 5,023 115.36 5,094 125.87 4,927 Work Study 3.96 2,299 3.68 2,205 3.61 2,192 State Need-Based Aid (Grants/Scholarships) 13.44 927 12.69 1,007 14.41 1,003 Legislative Aid 1.70 869 1.60 917 1.65 886 Career Aid 0.18 985 0.07 1,225 0.08 1,476 Merit Aid 0.04 2,719 0.03 3,000 0.04 2,531 Unique Populations 0.26 1,514 0.40 2,328 0.48 2,471 Institutional Grants 3.05 795 3.42 863 4.14 786 Scholarships 9.68 1,117 9.17 1,184 9.14 1,096 Work Study 1.25 2,470 1.27 2,508 1.19 2,623 Tuition Waivers 10.95 934 10.86 909 9.40 814 Loans 0.00 363 0.00 294 PrivateGrants/Scholarships 5.86 1,349 6.38 1,149 6.59 1,097 Loans 0.85 5,993 1.36 6,428 1.94 5,833 Source: Maryland Higher Education Commission, Financial Aid Information System
FINANCIAL AID AWARDED AT FOUR-YEAR PUbLIC INSTITUTIONS, FY 2010 - FY 2012 2009 - 2010 2010 - 2011 2011 - 2012 Total Aid Average Total Aid Average Total Aid Average (in millions) Award (in millions) Award (in millions) AwardFederalGrants/Scholarships $132.40 $4,284 $155.30 $4,254 $152.45 $3,906 Loans 469.25 8,477 508.70 8,690 530.61 8,479 Work Study 5.01 1,942 5.40 2,228 4.43 1,914 StateNeed-Based Aid (Grants/Scholarships) 52.13 2,721 48.35 2,827 45.58 2,843 Legislative Aid 6.28 993 6.50 1,047 6.78 1,079 Career Aid 1.30 3,502 0.80 3,578 0.63 3,529 Merit Aid 2.97 2,952 2.80 2,946 2.68 2,959 Unique Populations 0.94 5,797 0.90 6,241 1.10 6,704 InstitutionalGrants 44.25 2,510 44.69 2,515 49.09 2,358 Scholarships 80.91 5,072 80.70 4,884 82.40 5,047 Work Study 3.34 4,145 3.30 4,280 3.67 4,197 Tuition Waivers 16.91 934 17.60 2,806 9.40 814 Loans - - - - - - PrivateGrants/Scholarships 43.13 4,345 46.10 4,366 46.34 4,397 Loans 53.93 11,489 52.10 11,441 55.70 11,631 Source: Maryland Higher Education Commission, Financial Aid Information System

38
MARYLAND FINANCIAL AID PROGRAM EXPENDITURES, FY 2013 Dollars Number of Average Awarded Awards Award Charles W. Riley Fire Reimbursement Program $307,798 109 $2,824 Conroy Memorial 332,527 73 4,555 Delegate Scholarship 5,172,281 9,437 548 Distinguished Scholar Award 2,275,500 772 2,948 GEAR UP Scholarship 14,600 17 859 Graduate and Professional 912,342 381 2,395 Graduate Nurse Faculty Scholarship & Living Expenses Grant3 2,579,197 300 8,597 Howard P. Rawlings Campus-Based Educational Assistance Grant 1,929,200 1,169 1,650 Howard P. Rawlings Educational Assistance Grant 54,203,850 25,697 2,109 Howard P. Rawlings Guaranteed Access Grant 14,936,100 1,316 11,350 Loan Assistance Repayment Program 761,700 124 5,872 Loan Assistance Repayment Program - Dental Care 71,220 3 23,740 Maryland LARP for Physicians 400,000 16 25,000 Part-Time Grant 3,373,255 5,707 591 Senatorial Scholarship 6,952,759 8,197 848 Tolbert 173,750 348 499 Veterans of the Afghanistan and Iraq Conflicts Scholarship 781,268 127 6,152 Workforce Shortage Student Assistance Grant 1,137,250 379 3,001 GRAND TOTAL $96,314,597 $54,172 $1,778 Notes: (1) Figures reflect institutional submissions as of January 13, 2014 (2) Figures reflect actual awards made to students in FY 2013. May reflect some funds carried forward from the previous year. (3) Includes Living Expenses Grant funds, which were disbursed directly to recipients.Source: Maryland Higher Education Commission, Maryland College Aid Processing System
private career schools
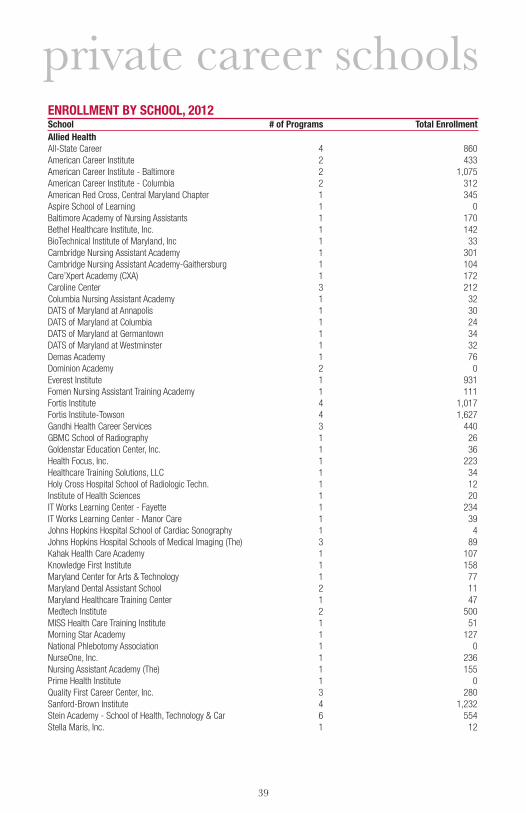
39
ENROLLMENT bY SCHOOL, 2012School # of Programs Total EnrollmentAllied HealthAll-State Career 4 860American Career Institute 2 433American Career Institute - Baltimore 2 1,075American Career Institute - Columbia 2 312American Red Cross, Central Maryland Chapter 1 345Aspire School of Learning 1 0Baltimore Academy of Nursing Assistants 1 170Bethel Healthcare Institute, Inc. 1 142BioTechnical Institute of Maryland, Inc 1 33Cambridge Nursing Assistant Academy 1 301Cambridge Nursing Assistant Academy-Gaithersburg 1 104Care’Xpert Academy (CXA) 1 172Caroline Center 3 212Columbia Nursing Assistant Academy 1 32DATS of Maryland at Annapolis 1 30DATS of Maryland at Columbia 1 24DATS of Maryland at Germantown 1 34DATS of Maryland at Westminster 1 32Demas Academy 1 76Dominion Academy 2 0Everest Institute 1 931Fomen Nursing Assistant Training Academy 1 111Fortis Institute 4 1,017Fortis Institute-Towson 4 1,627Gandhi Health Career Services 3 440GBMC School of Radiography 1 26Goldenstar Education Center, Inc. 1 36Health Focus, Inc. 1 223Healthcare Training Solutions, LLC 1 34Holy Cross Hospital School of Radiologic Techn. 1 12Institute of Health Sciences 1 20IT Works Learning Center - Fayette 1 234IT Works Learning Center - Manor Care 1 39Johns Hopkins Hospital School of Cardiac Sonography 1 4Johns Hopkins Hospital Schools of Medical Imaging (The) 3 89Kahak Health Care Academy 1 107Knowledge First Institute 1 158Maryland Center for Arts & Technology 1 77Maryland Dental Assistant School 2 11Maryland Healthcare Training Center 1 47Medtech Institute 2 500MISS Health Care Training Institute 1 51Morning Star Academy 1 127National Phlebotomy Association 1 0NurseOne, Inc. 1 236Nursing Assistant Academy (The) 1 155Prime Health Institute 1 0Quality First Career Center, Inc. 3 280Sanford-Brown Institute 4 1,232Stein Academy - School of Health, Technology & Car 6 554Stella Maris, Inc. 1 12
private career schools
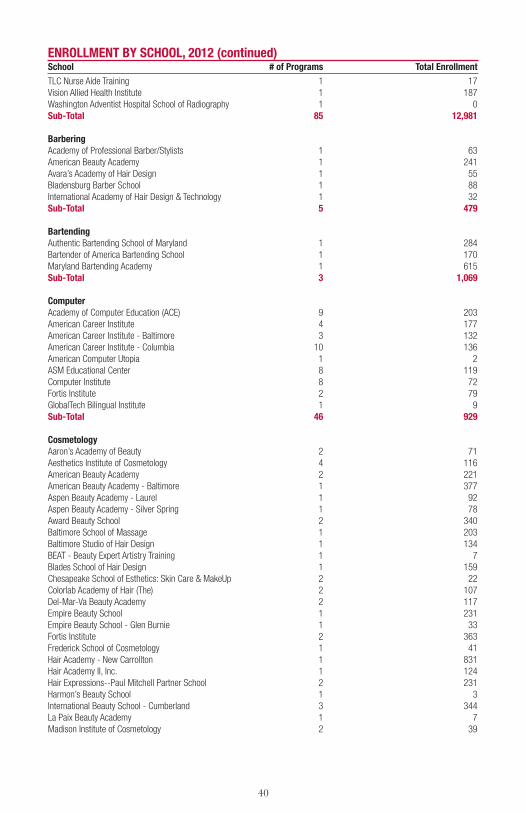
40
ENROLLMENT bY SCHOOL, 2012 (continued)School # of Programs Total EnrollmentTLC Nurse Aide Training 1 17Vision Allied Health Institute 1 187Washington Adventist Hospital School of Radiography 1 0Sub-Total 85 12,981
barberingAcademy of Professional Barber/Stylists 1 63American Beauty Academy 1 241Avara’s Academy of Hair Design 1 55Bladensburg Barber School 1 88International Academy of Hair Design & Technology 1 32Sub-Total 5 479
bartendingAuthentic Bartending School of Maryland 1 284Bartender of America Bartending School 1 170Maryland Bartending Academy 1 615Sub-Total 3 1,069
ComputerAcademy of Computer Education (ACE) 9 203American Career Institute 4 177American Career Institute - Baltimore 3 132American Career Institute - Columbia 10 136American Computer Utopia 1 2ASM Educational Center 8 119Computer Institute 8 72Fortis Institute 2 79GlobalTech Bilingual Institute 1 9Sub-Total 46 929
CosmetologyAaron’s Academy of Beauty 2 71Aesthetics Institute of Cosmetology 4 116American Beauty Academy 2 221American Beauty Academy - Baltimore 1 377Aspen Beauty Academy - Laurel 1 92Aspen Beauty Academy - Silver Spring 1 78Award Beauty School 2 340Baltimore School of Massage 1 203Baltimore Studio of Hair Design 1 134BEAT - Beauty Expert Artistry Training 1 7Blades School of Hair Design 1 159Chesapeake School of Esthetics: Skin Care & MakeUp 2 22Colorlab Academy of Hair (The) 2 107Del-Mar-Va Beauty Academy 2 117Empire Beauty School 1 231Empire Beauty School - Glen Burnie 1 33Fortis Institute 2 363Frederick School of Cosmetology 1 41Hair Academy - New Carrollton 1 831Hair Academy II, Inc. 1 124Hair Expressions--Paul Mitchell Partner School 2 231Harmon’s Beauty School 1 3International Beauty School - Cumberland 3 344La Paix Beauty Academy 1 7Madison Institute of Cosmetology 2 39

41
Maryland Beauty Academy 1 50Maryland Beauty Academy - Essex 2 92Montgomery Beauty School 1 284Regency Beauty Institute 1 197Robert Paul Academy of Cosmetology Arts & Sciences 2 159THE TEMPLE: A Paul Mitchell Partner School 1 271Von Lee International School of Aesthetics 2 192Sub-Total 49 5,536
MassageBaltimore School of Massage 1 765Central Maryland School of Massage 1 62Columbia Institute 1 19Fortis Institute-Towson 1 81Holistic Massage Training Institute 1 41Sub-Total 5 968
MontessoriInstitute for Advanced Montessori Studies 4 93Maryland Center for Montessori Studies 1 18Montgomery Montessori Institute 2 20Sub-Total 7 131
Mortgage OriginatorTrainingPro (Advanced Education Systems LLC, dba) 1 0Sub-Total 1 0
Real Estate1st Realty Academy 1 0About Real Estate Academy 1 0Academy of Real Estate 1 28Baldus Institute of Real Estate 1 0Bennett Academy of Real Estate 1 31Carruthers Academy of Real Estate, LLC 2 81CE Shop (The) 1 1Champion Institute of Real Estate 2 95Charismatic Real Estate Services 1 0Chesapeake Residential School of Real Estate 1 0Coldwell Banker Residential Brokerage School of RE 1 240D&D Real Estate & Business Training Academy, Inc. 1 0Deep Creek School of Real Estate 1 6Diana School of Real Estate 1 1Dias Real Estate Academy 1 0Diplomat Real Estate Center 1 0Don Gurney Academy of Real Estate 1 0Ed Smith Real Estate School 1 49Elite Learning Academy 1 6Frederick Academy of Real Estate 1 118GBBR® School of Real Estate (The) 1 70Kelley Academy of Real Estate 1 0Kirks Institute for Advanced Real Estate Studies 1 3Lawyers Advantage Career School 1 0Long & Foster Institute of Real Estate 1 2,154Mackintosh School of Real Estate 1 0National Academy of Professional Development 1 8New Millennium Real Estate School 1 80O’Brien Institute of Real Estate 1 19
ENROLLMENT bY SCHOOL, 2012 (continued)School # of Programs Total Enrollment

42
Professional Development Institute (The) 1 82Real Estate Empower 1 1Real Estate Institute (The) 1 6Southern Maryland Association of REALTORS Real Estate Academy 1 9Weichert Real Estate School 1 0Sub-Total 36 3,088
RecordingOmega Studios’ School of Applied Recording Arts (The) 14 159Sheffield Institute for the Recording Arts (The) 4 134Sub-Total 18 293
TaxH&R Block Eastern Enterprises, Inc. 1 687Jackson Hewitt Tax School - Eldersburg 2 0Jackson Hewitt Tax School - Elkton 2 0Jackson Hewitt Tax School - Hagerstown 3 57Jackson Hewitt Tax School - Salisbury 1 3Jackson Hewitt Tax School - Severn 2 0Joseph Mitzel Tax School 3 6Liberty Tax Service Tax School - Abingdon 1 5Liberty Tax Service Tax School - Baltimore II 2 37Liberty Tax Service Tax School - Perry Hall 2 14Liberty Tax Service Tax School - Salisbury 2 16Liberty Tax Service Tax School - Silver Spring 2 6Saunders Tax School 1 29Sub-Total 24 860
TravelBennett School of Travel 1 3Maryland School of Travel 1 0Sub-Total 2 3
Truck Driving/MechanicsAll-State Career 4 1,724North American Trade Schools 7 931Pittsburgh Institute of Aeronautics 1 43Southern MD Tri-County Community Action Com. 1 19Sub-Total 13 2,717
OtherAccounting and Bookkeeping Center, Inc. (The) 2 132Baltimore School of Dog Grooming 1 8Broadcasting Institute of Maryland 1 54Delta School of Trades 6 18Drycleaning and Laundry Institute 1 17L’Academie de Cuisine - Gaithersburg 4 222Maritime Institute of Technology & Graduate Studies (MITAGS) 3 27Maryland Institute of Criminal Justice 1 25Washington School of Photography 1 120Sub-Total 20 623GRAND TOTAL 314 29,677Note:Represents all enrollments for all programs July 1, 2011 through June 30, 2012Source: Maryland Higher Education Commission, Private Career School Annual Reports, 2012
ENROLLMENT bY SCHOOL, 2012 (continued)School # of Programs Total Enrollment
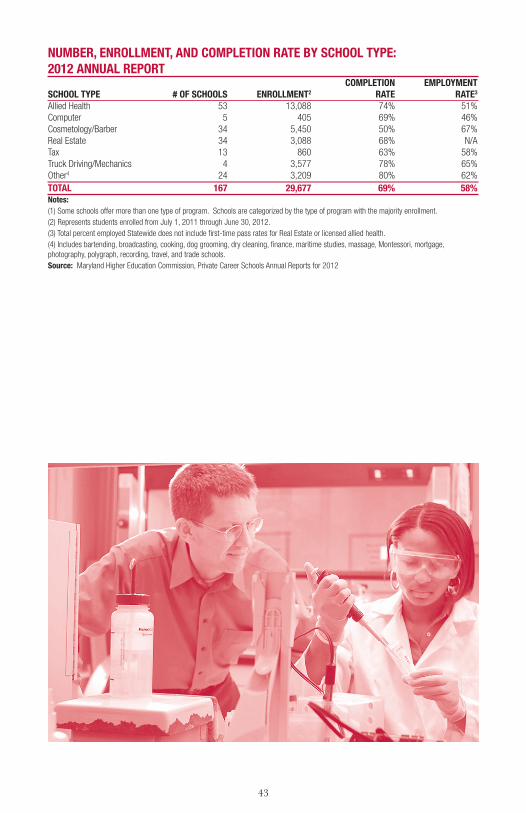
43
NUMbER, ENROLLMENT, AND COMPLETION RATE bY SCHOOL TYPE: 2012 ANNUAL REPORT COMPLETION EMPLOYMENT SCHOOL TYPE # OF SCHOOLS ENROLLMENT2 RATE RATE3
Allied Health 53 13,088 74% 51%Computer 5 405 69% 46%Cosmetology/Barber 34 5,450 50% 67%Real Estate 34 3,088 68% N/ATax 13 860 63% 58%Truck Driving/Mechanics 4 3,577 78% 65%Other4 24 3,209 80% 62%TOTAL 167 29,677 69% 58%Notes: (1) Some schools offer more than one type of program. Schools are categorized by the type of program with the majority enrollment.(2) Represents students enrolled from July 1, 2011 through June 30, 2012.(3) Total percent employed Statewide does not include first-time pass rates for Real Estate or licensed allied health.(4) Includes bartending, broadcasting, cooking, dog grooming, dry cleaning, finance, maritime studies, massage, Montessori, mortgage, photography, polygraph, recording, travel, and trade schools.Source: Maryland Higher Education Commission, Private Career Schools Annual Reports for 2012

44
ENROLLMENT IN DISTANCE EDUCATION CREDIT COURSES bY LEVEL AND SEGMENT, CY 2008 AND CY 2011 CY 2008 CY 2011 % Change Undergraduate Graduate Undergraduate Graduate Undergraduate GraduateCommunity Colleges 93,241 - 147,091 - 57.8% -Four Year Publics 124,979 55,350 198,908 73,226 59.2% 32.3% UMUC 103,843 43,988 149,841 50,774 44.3% 15.4%Independent Institutions 2,791 7,669 9,116 13,764 226.6% 79.5%Total 221,011 63,019 355,115 86,990 60.7% 38.0%Source: Maryland Higher Education Commission, Distance Education Survey 2011
NUMbER OF DISTANCE EDUCATION CREDIT-bEARING COURSES, CY 2008 AND CY 2011 CY 2008 CY 2011 % Change Undergraduate Graduate Undergraduate Graduate Undergraduate GraduateCommunity Colleges 1,891 - 2,606 - 37.8% -Four Year Publics 981 877 1,529 1,166 55.9% 33.0% UMUC 467 259 641 274 37.3% 5.8%Independent Institutions 179 367 348 659 94.4% 79.6%Total 3,051 1,244 4,483 1,825 46.9% 46.7%Source: Maryland Higher Education Commission, Distance Education Survey 2011
STUDENT HEADCOUNT bY LEVEL, SEGMENT AND ENROLLMENT PATTERN, CY 2011 Mixed - both Traditional Distance Distance and Only % Only % Traditional %UNDERGRADUATECommunity Colleges 194,251 71.5% 21,104 7.8% 56,453 20.8%4-Yr Public Institutions UMUC 2,210 4.7% 38,785 83.1% 5,661 12.1% Other 4-Yr Publics 95,304 78.5% 1,272 1.0% 24,856 20.5% All 4-Yr Publics 97,514 58.0% 40,057 23.8% 30,517 18.2%Independents 37,929 90.0% 1174 2.8% 3,065 7.3%Undergrad Total - All Segments 329,694 68.4% 62,335 12.9% 90,035 18.7%GRADUATE4-Yr Public Institutions UMUC 244 1.1% 20,971 95.6% 728 3.3% Other 4-Yr Publics 30,657 80.3% 2,661 7.0% 4,842 12.7% All 4-Yr Publics 30,901 51.4% 23,632 39.3% 5,570 9.3%Independents 38,537 81.2% 7,484 15.8% 1,431 3.0%Grad Total - All Segments 69,438 64.6% 31,116 28.9% 7,001 6.5%Note: Each student is counted only once.Source: Maryland Higher Education Commission, Distance Education Survey 2011
distance education


Maryland Higher Education Commission 6 North Liberty Street, 10th Floor
Baltimore, MD 21201
410.767.3301 800.974.0203
TTY: 800.735.2258 www.mhec.state.md.us
Martin O’ Malley, Governor • Anthony G. Brown, Lt. Governor • Danette G. Howard, Secretary of Higher Education
MHEC