2014 manufacturing industry outlook - cica · industryoutlook!–!manufacturing! 2! employment&...
TRANSCRIPT

ISSN 2201-3660
Industry Outlook Manufacturing

Table of Contents Employment .................................................................................................................................. 2
Sectoral Employment ......................................................................................................................... 3
Geographic Distribution ..................................................................................................................... 4
Workforce Characteristics .............................................................................................................. 6
Workforce Age Profile ........................................................................................................................ 6
Gender and Full Time/Part Time Status ............................................................................................. 7
Educational Qualifications ................................................................................................................. 8
Main Employing Occupations ............................................................................................................ 9
Earnings ........................................................................................................................................... 10
Future Employment Prospects ...................................................................................................... 11
Recruitment Difficulty ................................................................................................................... 12
Skill Shortages ............................................................................................................................... 13

Industry Outlook – Manufacturing
2
Employment Manufacturing is the fourth largest employing industry in Australia, employing 945,900 people (or 8.2 per cent of the total workforce) as at February 2014. Although the Manufacturing industry remains a large employing industry, the last decade has seen the continuation of an ongoing decline in its share of employment in Australia. Employment in the Manufacturing industry has declined by 74,200 (or 7.3 per cent) over the 10 years to February 2014, one of only three industries to experience a fall in employment over the period (the other two being Agriculture, Forestry and Fishing and Information Media and Telecommunications).
A high Australian dollar, subdued global growth, competitive pressures and lower consumer confidence have seen employment in the industry fall by 61,300 (or 6.1 per cent) over the five years to February 2014, despite a small increase of 16,400 workers (or 1.8 per cent) over the past year.
Figure 1: Manufacturing industry employment level, February 1994 to February 2014 (’000)
Source: ABS, Labour Force, Australia, Detailed, Quarterly, cat. no. 6291.0.55.003, trend.

Industry Outlook – Manufacturing
3
Sectoral Employment
Against the backdrop of declining employment for the industry as a whole, 10 of the 15 Manufacturing sectors recorded a decline in employment over the five years to February 2014. The largest employment declines were recorded for Textile, Leather, Clothing and Footwear Manufacturing (down by 10,400 or 21.1 per cent), followed by Pulp, Paper and Converted Paper Product Manufacturing (9100 or 43.2 per cent), Fabricated Metal Product Manufacturing (9000 or 12.4 per cent) and Printing (including the Reproduction of Recorded Media) (8900 or 17.8 per cent). Transport Equipment Manufacturing, which includes Motor Vehicle and Motor Vehicle Part Manufacturing, declined by 5100 (or 5.9 per cent).
Sectors which recorded employment gains over the same period include Wood Product Manufacturing (up by 12,400 or 29.6 per cent), Beverage and Tobacco Product Manufacturing (11,700 or 39.7 per cent) and Machinery and Equipment Manufacturing (10,000 or 8.5 per cent). The large increase for Wood Product Manufacturing should be viewed with scepticism, given its longer term decline, and due to extreme volatility in the data over the past year. Growth in Beverage and Tobacco Manufacturing reflects longer term growth in the Beverage Manufacturing subsector, and growth in Machinery and Equipment Manufacturing was driven by growth in the Specialised Machinery and Equipment Manufacturing subsector (which includes manufacture of mining, construction and agricultural machinery). Food Product Manufacturing (3800 or 2.0 per cent) and Basic Chemical and Chemical Product Manufacturing (3200 or 7.4 per cent) also recorded employment gains over the five year to February 2014.
Figure 2: Employment level and five year change to February 2014, by industry sector ('000)
Source: ABS, Labour Force, Australia, Detailed, Quarterly, cat. no. 6291.0.55.003, Department of Employment trend.

Industry Outlook – Manufacturing
4
Geographic Distribution The distribution of Manufacturing employment across the States and Territories is generally in line with that of total employment. Victoria and New South Wales employed the largest proportion of the Manufacturing workforce in February 2014 (approximately 275,000 or 29 per cent each), with Queensland employing a further 188,200 workers (or 20 per cent).
South Australia and Victoria have the largest proportions of their workforces employed in Manufacturing, accounting for 10.7 and 9.6 per cent of employment in those states respectively, compared with 8.2 per cent of employment nationally.
As shown in Figure 3, over the five years to February 2014 employment in Manufacturing has declined in most states and territories, in line with the national trend, with the exception of Queensland (up by 5000 or 2.7 per cent) and the Northern Territory (up by 100 or 2.9 per cent). The largest falls were recorded in Victoria (down by 30,700 or 10.1 per cent), New South Wales (23,400 or 7.9 per cent) and Western Australia (7500 or 7.5 per cent).
Manufacturing growth in Queensland was largely driven by increases in Fabricated Metal Product Manufacturing and Machinery and Equipment Manufacturing.
The Manufacturing decline in Victoria was driven by losses in Fabricated Metal Product Manufacturing and Textile, Leather, Clothing and Footwear Manufacturing. The fall in New South Wales was driven by losses in Textile, Leather, Clothing and Footwear Manufacturing and Printing (including the Reproduction of Recorded Media), while the fall in Western Australia was driven by losses in Machinery and Equipment Manufacturing.
Figure 3: Five year Manufacturing industry employment change by State (‘000)
Source: ABS, Labour Force, Australia, Detailed, Quarterly, cat. no. 6291.0.55.003, Department of Employment trend.

Industry Outlook – Manufacturing
5
At the regional level, around 60 per cent of all ABS Labour Force Regions1 recorded a decline in Manufacturing employment over the five years to February 2014. The largest decline over the period was recorded in Adelaide – North (down by 8500), followed by Sydney – South West (8200) and Melbourne – South East (7900). By contrast, the largest increases in Manufacturing employment were recorded in Sydney – Northern Beaches (up by 5600), New England and North West (4200) and Bendigo (3400).
Figure 4: Five year Manufacturing industry employment growth by region (‘000)
Source: ABS, Labour Force, Australia, Detailed, Quarterly, cat. no. 6291.0.55.003, four quarter average of original data.
The Labour Force Regions with a large proportion of their employment in Manufacturing in February 2014 included Melbourne – South East (15.3 per cent of the region’s employment), South Australia – South East (13.8 per cent), Ipswich (in Queensland, 13.7 per cent) and Barossa – Yorke – Mid North (in South Australia, 13.5 per cent). Despite the weakness in the industry across the nation, this shows that the Manufacturing industry remains a large employer in many regions.
1 The regions used in this analysis are those used in the ABS Labour Force Survey, which are defined at the Statistical Area 4 level in the Australian Statistical Geography Standard.

Industry Outlook – Manufacturing
6
Workforce Characteristics
Workforce Age Profile The Manufacturing workforce is, on average, slightly older than the workforce as a whole, with 39.7 per cent of Manufacturing workers aged between 45-‐64 years, compared with 35.6 per cent across all industries. The median age of workers in the industry was 42 years in 2013, compared with 40 years across all industries. The age profile of the Manufacturing workforce has become older, with the median age rising from 40 years in 2009 to 42 years in 2013.
Figure 5: Employed persons by age, February 2014 (% share of employment)
Source: ABS, Labour Force, Australia, Detailed, Quarterly, cat. no. 6291.0.55.003, four quarter average of original data.

Industry Outlook – Manufacturing
7
Gender and Full Time/Part Time Status Males account for the majority of employment in Manufacturing (73.1 per cent, compared with 54.3 per cent for employment as a whole). A large proportion of jobs in the industry are also full time (84.8 per cent, compared with 69.9 per cent across all industries), although the share of part time workers in the industry has increased over the past decade, from 12.2 per cent in February 2004, to 15.2 per cent in February 2014.
Figure 6: Full time/part time workers as % of employed total, by gender, February 2014
Source: ABS, Labour Force, Australia, Detailed, Quarterly, cat. no. 6291.0.55.003, four quarter average of original data.
The gender split, as well as the proportion of workers employed full time and part time, vary by sector within the industry. For instance, 90.0 per cent of people employed in Primary Metal and Metal Product Manufacturing are male, compared with 38.7 per cent in Textile, Leather, Clothing and Footwear Manufacturing. The Transport Equipment Manufacturing sector had the highest proportion of full time employment of any Manufacturing sector (94.4 per cent), followed by Petroleum and Coal Product Manufacturing (93.4 per cent) and Primary Metal and Metal Product Manufacturing (92.6 per cent). By contrast, the Textile, Leather, Clothing and Footwear Manufacturing sector had the second lowest proportion of its workers employed full time (75.5 per cent), behind only Food Product Manufacturing (72.3 per cent).

Industry Outlook – Manufacturing
8
Educational Qualifications Overall, Manufacturing workers have lower levels of educational attainment than the workforce as a whole. Indeed, 27.7 per cent of Manufacturing workers have not attained a Year 12 or higher qualification (compared with 21.0 per cent of all workers), while just 17.1 per cent have attained a Bachelor Degree or higher (compared with 28.4 per cent for employment as a whole). That said, 27.5 per cent of workers in the Manufacturing industry hold a Certificate III or IV qualification (compared with 20.7 per cent of workers across all industries), reflecting the importance of Trades skills to the industry.
Figure 7: Highest educational attainment -‐ share of employment (%)
Source: ABS Survey of Education and Work, 2013.
4.3
16.7
19.4
20.7
10.5
19.4
9.0
7.4
20.3
18.7
27.5
9.0
13.1
4.0
0 5 10 15 20 25 30
Below Year 10
Year 10 and 11
Year 12
Certificate III & IV
Advanced Diploma & Diploma
Bachelor Degree
Postgraduate Qualification
Manufacturing All Industries

Industry Outlook – Manufacturing
9
Main Employing Occupations The Manufacturing industry employs workers across a range of skill levels. Structural Steel and Welding Trades Workers (45,200) and Metal Fitters and Machinists (37,000) are the two largest employing occupations in Manufacturing, reflecting the importance of Trades to the industry. The third largest employing occupation in this industry is Production Managers (37,000), a higher skilled occupation.
A number of lower skilled occupations are also large employers in the industry, including Food and Drink Factory Workers (28,400), Packers (23,700) and Product Assemblers (23,300). While employment in some of Manufacturing’s large Trade occupations (such as Metal Fitters and Machinists) is spread across different industries, employment in some of its lower skilled occupations (such as Food and Drink Factory Workers and Product Assemblers) is highly concentrated in Manufacturing, which suggests there are limited opportunities for workers in these occupations outside the industry.
Figure 8: Main employing occupations in the Manufacturing industry (‘000)
Source: ABS Labour Force Survey, custom request data, 2013.

Industry Outlook – Manufacturing
10
Earnings In 2012, the median weekly earnings of full time employees in Manufacturing was $1066, below the all industries median of $1153. Median full time weekly earnings within the industry ranged from $1727 for Petroleum and Coal Product Manufacturing down to $884 for Textile, Leather, Clothing and Footwear Manufacturing.
Figure 9: Manufacturing industry sectors -‐ median weekly earnings (full time and before tax)
Source: ABS Employee Earnings, Benefits and Trade Union Membership, custom request data, August 2012.
$884
$900
$950
$988
$990
$1,000
$1,004
$1,066
$1,125
$1,140
$1,153
$1,157
$1,175
$1,200
$1,275
$1,404
$1,727
0 200 400 600 800 1000 1200 1400 1600 1800 2000
Textile, Leather, Clothing, Footwear Mfg
Wood Product Manufacturing
Printing (incl Recorded Media)
Food Product Manufacturing
Furniture and Other Manufacturing
Fabricated Metal Product Manufacturing
Polymer, Rubber Product Manufacturing
Manufacturing
Beverage, Tobacco Manufacturing
Machinery and Equipment Manufacturing
ALL INDUSTRIES
Transport Equipment Manufacturing
Non-‐Metallic Mineral Manufacturing
Primary Metal, Metal Product Manufacturing
Pulp, Paper, Converted Paper Mfg
Basic Chemical, Chemical Manufacturing
Petroleum and Coal Product Manufacturing

Industry Outlook – Manufacturing
11
Future Employment Prospects Over the five years to November 2018, employment in Manufacturing is projected to fall by 40,300 (or 4.3 per cent). This decline is expected to be primarily driven by a projected fall of 27,600 (or 33.7 per cent) in Transport Equipment Manufacturing (which includes Motor Vehicle and Motor Vehicle Part Manufacturing), following the announced plant closures by Ford, Holden and Toyota.
Reflecting the overall weakness of the industry, declines in employment are projected for 11 of the other 15 Manufacturing sectors, with notable growth projected only in Food Product Manufacturing (up by 6900, or 3.8 per cent).
Figure 10: Projected employment growth (‘000) by industry sector -‐ five years to November 2018
Source: Department of Employment, 2014 Projections to November 2018.

Industry Outlook – Manufacturing
12
Recruitment Difficulty2 The results of the Department of Employment’s surveys of employers’ recruitment experiences conducted in various regions show that recruitment activity in the Manufacturing industry remained soft in the year to March 2014. Some 52 per cent of surveyed employers had recruited, considerably lower than the average across all industries (60 per cent). Additionally, one third of all employers decreased staff, substantially higher than across all industries (22 per cent).
Although the proportion of vacancies unfilled in the Manufacturing industry was 4.3 per cent, similar to all industries (4.1 per cent), the average number of vacancies per 100 staff was considerably lower (11 compared with 16). Competition among applicants for vacancies in the industry was high, with an average of 12.7 applicants per vacancy (compared with 10.6 across all industries).
Despite these relatively soft recruitment conditions overall, employers surveyed in the Manufacturing industry frequently reported that vacancies were difficult to fill for a range of large employing occupations in the year prior to the survey (Figure 11).
Figure 11: Occupations difficult to fill in the Manufacturing industry by skill level
Higher skills/qualification Cabinetmakers Bakers and Pastrycooks
Sheetmetal Trades Workers Production Managers
Lower skills/qualification Sales Representatives Insulation and Home Improvement Installers
Engineering Production Workers Sewing Machinists
Some 31 per cent of employers surveyed in the Manufacturing industry expected to recruit in the year following the survey, a lower proportion than across all industries (38 per cent).
There was some variation within the Manufacturing industry, with strong recruitment in the Food Product Manufacturing sector, where a large proportion (73 per cent) of employers recruited in the year preceding the survey. Similarly, the average of 16 vacancies per 100 staff in this sector was high (compared with 11 for the industry as a whole) and a larger proportion of employers experienced recruitment difficulty (47 per cent) compared with the industry as a whole (42 per cent). This suggests that while recruitment activity for the industry overall remains subdued, for some parts of the industry, in particular Food Product Manufacturing, recruitment is strong and should provide opportunities for job seekers.
2 Over the 12 months to March 2014, the Department of Employment surveyed almost 8,900 employers across 22 regions, of which 1228 were in the Manufacturing industry. The surveyed areas were predominantly in regional New South Wales, Victoria and Queensland, including Geelong and North Western Melbourne. More information about the Department of Employment’s regional surveys of employers is available at: http://employment.gov.au/regional-‐reports-‐employers-‐recruitment-‐experiences.

Industry Outlook – Manufacturing
13
Skill Shortages The Manufacturing industry employs a diverse range of occupations, but in terms of those which require significant years of training and have relatively large numbers employed in this sector, trades are particularly notable. This is consistent with the educational profile for the Manufacturing workforce, which shows that more than twice as many workers in this industry hold a highest qualification of a Certificate III or IV compared with a Bachelor Degree. The professions of accountant and engineer, though, feature in the largest employing occupations.
Skill shortages are not a key issue for occupations in the Manufacturing sector on the whole. With softer labour market conditions in 2013, there are few occupations in shortage nationally, and applicants often face relatively strong competition for available vacancies for many skilled jobs.
• The exceptions are food trades such as bakers and pastrycooks, sheetmetal trades and automotive trades such as motor mechanics, for which shortages are evident.
The table below shows those skilled occupations which had employment of at least 5000 in Manufacturing in 2013 and for which the department has recently assessed the labour market as part of its ongoing skill shortage research. The focus of the research is occupations rather than industries, and the ratings are for the occupation across all industries.
• Manufacturing accounts for a relatively high proportion of the workforce in Victoria and South Australia. Accordingly, skill shortages information is provided for those states in the tables below.
Industry Outlook – Manufacturing
14
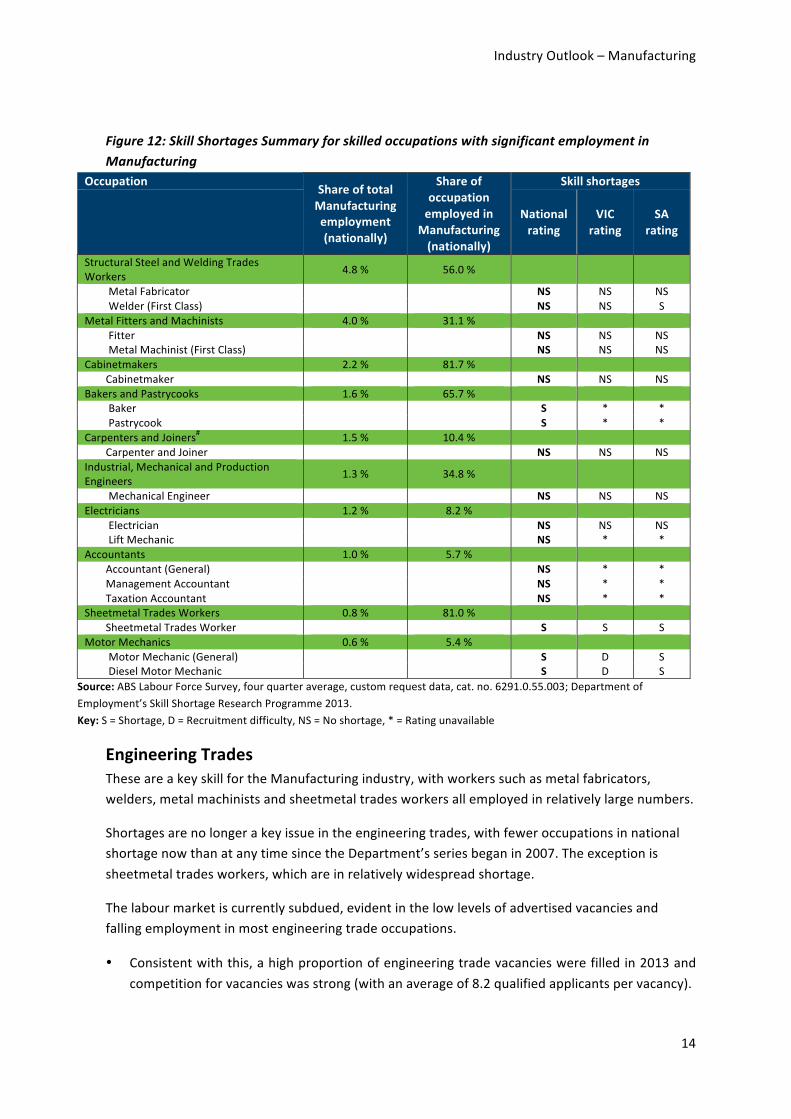
Figure 12: Skill Shortages Summary for skilled occupations with significant employment in Manufacturing
Occupation Share of total Manufacturing employment (nationally)
Share of occupation employed in
Manufacturing (nationally)
Skill shortages
National rating
VIC rating
SA rating
Structural Steel and Welding Trades Workers 4.8 % 56.0 %
Metal Fabricator NS NS NS Welder (First Class) NS NS S
Metal Fitters and Machinists 4.0 % 31.1 % Fitter NS NS NS Metal Machinist (First Class) NS NS NS
Cabinetmakers 2.2 % 81.7 % Cabinetmaker NS NS NS
Bakers and Pastrycooks 1.6 % 65.7 % Baker S * * Pastrycook S * *
Carpenters and Joiners# 1.5 % 10.4 % Carpenter and Joiner NS NS NS
Industrial, Mechanical and Production Engineers 1.3 % 34.8 %
Mechanical Engineer NS NS NS Electricians 1.2 % 8.2 %
Electrician NS NS NS Lift Mechanic NS * *
Accountants 1.0 % 5.7 % Accountant (General) NS * * Management Accountant NS * * Taxation Accountant NS * *
Sheetmetal Trades Workers 0.8 % 81.0 % Sheetmetal Trades Worker S S S
Motor Mechanics 0.6 % 5.4 % Motor Mechanic (General) S D S Diesel Motor Mechanic S D S
Source: ABS Labour Force Survey, four quarter average, custom request data, cat. no. 6291.0.55.003; Department of Employment’s Skill Shortage Research Programme 2013. Key: S = Shortage, D = Recruitment difficulty, NS = No shortage, * = Rating unavailable
Engineering Trades These are a key skill for the Manufacturing industry, with workers such as metal fabricators, welders, metal machinists and sheetmetal trades workers all employed in relatively large numbers.
Shortages are no longer a key issue in the engineering trades, with fewer occupations in national shortage now than at any time since the Department’s series began in 2007. The exception is sheetmetal trades workers, which are in relatively widespread shortage.
The labour market is currently subdued, evident in the low levels of advertised vacancies and falling employment in most engineering trade occupations.
• Consistent with this, a high proportion of engineering trade vacancies were filled in 2013 and competition for vacancies was strong (with an average of 8.2 qualified applicants per vacancy).

Industry Outlook – Manufacturing
15
• Apprentice and trainee commencements and completions also fell over the year to 2012-‐13. With soft labour market conditions, commencements may fall further in the short-‐term which could constrain supply.
Construction Trades The labour market for construction trades has been soft in recent years, with subdued building activity dampening demand for these workers. Shortages have not been a feature of this labour market since 2008, although over the past six months there have been signs of increased activity in dwelling construction and a consequent tightening in the labour market for some construction trades.
• The vast majority of cabinetmakers are employed in Manufacturing. Widespread shortages for cabinetmakers have not been evident since 2011, although employers in New South Wales, Queensland and the Northern Territory experienced some difficulties recruiting skilled and experienced workers in 2013.
• The labour market for carpenters and joiners has been particularly flat and significant shortages have not been apparent since 2008.
• Employers seeking electricians recruited with ease in 2013, attracting large numbers of licensed applicants.
Food Trades Around two thirds of bakers and pastrycooks are employed in Manufacturing. Shortages of these workers have been persistent for the past decade and, in 2013, this labour market continued to be tight, with employers attracting relatively small fields of applicants and filling a low proportion of their vacancies.
Automotive Trades The only automotive trade with significant employment in Manufacturing is motor mechanic. Shortages of motor mechanics have been persistent for a number of years, due to factors including low pay and high staff turnover. Just 5 per cent of motor mechanics are employed in Manufacturing, and most of these are in automotive manufacturing. There will be some structural change within the occupation, as demand for mechanics from this industry falls with the withdrawal of car manufacturers from Australia.
Professionals Around 10 per cent of workers in Manufacturing are professionals, with accountants and mechanical engineers being the largest in terms of employment size.
• Manufacturing competes with a diverse range of industries for accountants, but shortages have not been evident for a number of years and research undertaken by the Department suggests that employers generally attract multiple qualified applicants regardless of sector.
• While the labour market for mechanical engineers has historically been tight, conditions eased markedly in 2013 and widespread shortages are not evident. That said, employers often seek

Industry Outlook – Manufacturing
16
mechanical engineers who have very specific experience in a particular manufacturing environment and some experience difficulty recruiting specialist professionals.
Labour Market Research and Analysis Branch
Department of Employment
May 2014