2014 isec slides
TRANSCRIPT

Spatial occupancy models for
metapopulation viability
analysis
Richard Chandler, Erin Muths, Brent Sigafus, Cecil Schwalbe,
Christopher Jarchow, and Blake Hossack

Motivating example
Chandler et al. � Spatial occupancy models 2 / 13

Motivating questions
(1) What is extinction risk over the next 100
years?
(2) How do hydrology and connectivity a�ect
extinction risk?
(3) What is the best strategy for increasing
viability?
Chandler et al. � Spatial occupancy models 3 / 13

Motivating questions
(1) What is extinction risk over the next 100
years?
(2) How do hydrology and connectivity a�ect
extinction risk?
(3) What is the best strategy for increasing
viability?
Chandler et al. � Spatial occupancy models 3 / 13

Motivating questions
(1) What is extinction risk over the next 100
years?
(2) How do hydrology and connectivity a�ect
extinction risk?
(3) What is the best strategy for increasing
viability?
Chandler et al. � Spatial occupancy models 3 / 13

Motivating data
Year
2007 2008 . . . 2013
Site 1 2 3 1 2 3 . . . 1 2 3
1 0 1 1 0 0 0 . . . 1 0 1
2 0 0 0 0 0 0 . . . 0 0 0
3 � � � 1 1 0 . . . 0 0 1...
......
......
......
......
......
41 0 1 1 0 1 0 . . . 0 0 0
42 � � � � � � . . . � � �...
......
......
......
......
......
273 � � � � � � . . . � � �
Plus, coordinates and covariates for each site
Chandler et al. � Spatial occupancy models 4 / 13

Metapopulation theory
Basic elements
• Dispersal-based colonization function
• Rescue e�ect• Correlated extinction
Missing elements
• Observation model
MacKenzie et al. (2003) occupancy modelsprovided the latter, but not the former
Chandler et al. � Spatial occupancy models 5 / 13

Metapopulation theory
Basic elements
• Dispersal-based colonization function
• Rescue e�ect• Correlated extinction
Missing elements
• Observation model
MacKenzie et al. (2003) occupancy modelsprovided the latter, but not the former
Chandler et al. � Spatial occupancy models 5 / 13

Metapopulation theory
Basic elements
• Dispersal-based colonization function
• Rescue e�ect• Correlated extinction
Missing elements
• Observation model
MacKenzie et al. (2003) occupancy modelsprovided the latter, but not the former
Chandler et al. � Spatial occupancy models 5 / 13

Standard dynamic occupancy model
Initial occupancy
zi,1 ∼ Bern(ψ)
Colonization and extinction
zi,k ∼ Bern(µi,k)
µi,k = (1− zi,k)γ + zi,k(1− ε)
Detection
yi,j,k ∼ Bern(zi,k × p)
Useful, but doesn't allow formetapopulation extinction
Chandler et al. � Spatial occupancy models 6 / 13

Standard dynamic occupancy model
Initial occupancy
zi,1 ∼ Bern(ψ)
Colonization and extinction
zi,k ∼ Bern(µi,k)
µi,k = (1− zi,k)γ + zi,k(1− ε)
Detection
yi,j,k ∼ Bern(zi,k × p)
Useful, but doesn't allow formetapopulation extinction
Chandler et al. � Spatial occupancy models 6 / 13

A spatial occupancy model
Probability that site i is colonized by ≥ 1 individual from site m
γ(xi,xm) = γ0 exp(−‖xi − xm‖2/(2σ2))zm,k−1
Probability that site i is colonized by ≥ 1 individual from any site
γi,k−1 = 1−
{M∏
m=1
1− γ(xi,xm)
}Hence:
• Metapopulation extinction is possible
• Useful for PVA, connectivity planning
Chandler et al. � Spatial occupancy models 7 / 13

A spatial occupancy model
Probability that site i is colonized by ≥ 1 individual from site m
γ(xi,xm) = γ0 exp(−‖xi − xm‖2/(2σ2))zm,k−1
Probability that site i is colonized by ≥ 1 individual from any site
γi,k−1 = 1−
{M∏
m=1
1− γ(xi,xm)
}
Hence:
• Metapopulation extinction is possible
• Useful for PVA, connectivity planning
Chandler et al. � Spatial occupancy models 7 / 13

A spatial occupancy model
Probability that site i is colonized by ≥ 1 individual from site m
γ(xi,xm) = γ0 exp(−‖xi − xm‖2/(2σ2))zm,k−1
Probability that site i is colonized by ≥ 1 individual from any site
γi,k−1 = 1−
{M∏
m=1
1− γ(xi,xm)
}Hence:
• Metapopulation extinction is possible
• Useful for PVA, connectivity planning
Chandler et al. � Spatial occupancy models 7 / 13
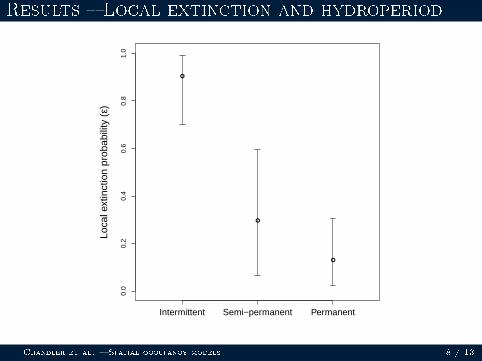
Results � Local extinction and hydroperiod
●
●
●
0.0
0.2
0.4
0.6
0.8
1.0
Loca
l ext
inct
ion
prob
abili
ty (
ε)
Intermittent Semi−permanent Permanent
Chandler et al. � Spatial occupancy models 8 / 13

Results � Colonization and connectivity
2008 2009 2010
2011 2012 2013
2014 2015 2016
2017 2018 2019
2020 2021 2022
0.00
0.05
0.10
0.15
0.20
0.25
0.30
0.35
Chandler et al. � Spatial occupancy models 9 / 13

Results � Colonization and connectivity
2008 2009 2010
2011 2012 2013
2014 2015 2016
2017 2018 2019
2020 2021 2022
0.00
0.05
0.10
0.15
0.20
0.25
0.30
0.35
Chandler et al. � Spatial occupancy models 9 / 13

Results � Proportion of sites occupied
●
●
●●
● ● ● ● ● ● ● ● ● ● ● ●
2010 2015 2020
0.0
0.2
0.4
0.6
0.8
1.0
Year
Pro
port
ion
of s
ites
occu
pied
2020 2040 2060 2080 21000.
00.
10.
20.
30.
40.
50.
6
Year
Ext
inct
ion
risk
Chandler et al. � Spatial occupancy models 10 / 13

Extinction risk after new reintroductions
0.00
0.05
0.10
0.15
0.20
0.25
0.30
0.35
10 km
●
●●
●
●
●
●
●●
●
●
●
●
●
●●
●
●
●
●
●
●
●
●
●
●●
●
●
●
●
●
●
●
●
●
● ●
●
●
●
●
●
●
●
●
●
●●●
●●
●
●
●
●
●●
●
●
●●
●
●
●
●
●
●
●
●●●
●
●●●
●●
●●
●
●●●
● ●●●●
●
●
●●
●●
●●
●
●
●
●
●●
●
●
●
●●●
●
●●
●●● ●
●
●
●
●●● ●●
●
●
●●
● ●
●
●
●●
●
● ●●●●
●
●
●
●
●
●●
●
●
●
●
●●
●
●
●
●
●
●●
●
●
●
●
●
●
●●
●
●
●
●●
●
●
●
●
●
●
●
●
●
●
●
●
●
●
●
●
●
●
●
●
●
●
●
●
●
●
●
●
●●
●
●
●
●
●
●
●
●●
●
●
●
●
●
●
●
●
●●
●
●
●
●
●
●
●
●
●
●
●
●
●
●
●
●●
●
●
●
●
●
●
●
●
●
●
●
●●
●
●
●
●
●●
●
●
●
●
●
●●
●
●
●
●
●
●●
●
2020 2040 2060 2080 2100
0.0
0.1
0.2
0.3
0.4
0.5
0.6
Year
Ext
inct
ion
risk
Chandler et al. � Spatial occupancy models 11 / 13

Extinction risk after new reintroductions
0.00
0.05
0.10
0.15
0.20
0.25
0.30
0.35
10 km
●
●●
●
●
●
●
●●
●
●
●
●
●
●●
●
●
●
●
●
●
●
●
●
●●
●
●
●
●
●
●
●
●
●
● ●
●
●
●
●
●
●
●
●
●
●●●
●●
●
●
●
●
●●
●
●
●●
●
●
●
●
●
●
●
●●●
●
●●●
●●
●●
●
●●●
● ●●●●
●
●
●●
●●
●●
●
●
●
●
●●
●
●
●
●●●
●
●●
●●● ●
●
●
●
●●● ●●
●
●
●●
● ●
●
●
●●
●
● ●●●●
●
●
●
●
●
●●
●
●
●
●
●●
●
●
●
●
●
●●
●
●
●
●
●
●
●●
●
●
●
●●
●
●
●
●
●
●
●
●
●
●
●
●
●
●
●
●
●
●
●
●
●
●
●
●
●
●
●
●
●●
●
●
●
●
●
●
●
●●
●
●
●
●
●
●
●
●
●●
●
●
●
●
●
●
●
●
●
●
●
●
●
●
●
●●
●
●
●
●
●
●
●
●
●
●
●
●●
●
●
●
●
●●
●
●
●
●
●
●●
●
●
●
●
●
●●
●
●
●
2020 2040 2060 2080 2100
0.0
0.1
0.2
0.3
0.4
0.5
0.6
Year
Ext
inct
ion
risk
Chandler et al. � Spatial occupancy models 11 / 13

Extinction risk after new reintroductions
0.00
0.05
0.10
0.15
0.20
0.25
0.30
0.35
10 km
●
●●
●
●
●
●
●●
●
●
●
●
●
●●
●
●
●
●
●
●
●
●
●
●●
●
●
●
●
●
●
●
●
●
● ●
●
●
●
●
●
●
●
●
●
●●●
●●
●
●
●
●
●●
●
●
●●
●
●
●
●
●
●
●
●●●
●
●●●
●●
●●
●
●●●
● ●●●●
●
●
●●
●●
●●
●
●
●
●
●●
●
●
●
●●●
●
●●
●●● ●
●
●
●
●●● ●●
●
●
●●
● ●
●
●
●●
●
● ●●●●
●
●
●
●
●
●●
●
●
●
●
●●
●
●
●
●
●
●●
●
●
●
●
●
●
●●
●
●
●
●●
●
●
●
●
●
●
●
●
●
●
●
●
●
●
●
●
●
●
●
●
●
●
●
●
●
●
●
●
●●
●
●
●
●
●
●
●
●●
●
●
●
●
●
●
●
●
●●
●
●
●
●
●
●
●
●
●
●
●
●
●
●
●
●●
●
●
●
●
●
●
●
●
●
●
●
●●
●
●
●
●
●●
●
●
●
●
●
●●
●
●
●
●
●
●●
●
●●
2020 2040 2060 2080 2100
0.0
0.1
0.2
0.3
0.4
0.5
0.6
Year
Ext
inct
ion
risk
Chandler et al. � Spatial occupancy models 11 / 13

Future directions
• Abundance-based formulation
• Landscape resistance to movement
• Undiscovered sites
Chandler et al. � Spatial occupancy models 12 / 13

Future directions
• Abundance-based formulation
• Landscape resistance to movement
• Undiscovered sites
Chandler et al. � Spatial occupancy models 12 / 13

Future directions
• Abundance-based formulation
• Landscape resistance to movement
• Undiscovered sites
Chandler et al. � Spatial occupancy models 12 / 13

Thanks