2014 integrated resource plan - green mountain power · integrated resource plan | 2014 “as an...
TRANSCRIPT

Integrated Resource Plan | 2014
2014 Integrated Resource Plan
i
Integrated Resource Plan | 2014
“As an integrated energy service company, our employees intend to make GMP the best small company in America by delivering low-cost, low-carbon and incredibly reliable energy services.”
Introduction
Founded in 1893 as the Vergennes Electric Company, Green Mountain Power (GMP) has grown into Vermont’s largest electric distribution company. With over 260,000 customers in 202 towns, GMP has a service territory that spans 7,500 square miles, has 15 service centers and delivers about 77% of all the electricity that is consumed in the state each year. As an integrated energy service company, our employees intend to make GMP the best small company in America by delivering low-cost, low-carbon and incredibly reliable energy services.
The GMP electric system includes about 12,000 miles of distribution and transmission lines, 202 substations, and 329,580 poles. Our generation fleet includes 32 hydroelectric facilities, four wind facilities, six peaking facilities, and a growing number (10 currently) of solar power facilities. In fiscal 2013, GMP invested $115 million to build, maintain, and improve the reliability of the electric grid for our customers. In addition, GMP’s economic contribution to the state includes property tax payments of $20.9 million, $6.2 million per year in gross revenue taxes, and $62.6 million per year in payroll.
IRP Requirements
As a regulated electric company under 30 V.S.A §218c, GMP is required to “prepare and implement a least-cost integrated plan for the provision of energy services to its Vermont customers” every three years. Specifically, a “least-cost integrated plan” is defined as:
“. . . a plan for meeting the public's need for energy services, after safety concerns are addressed, at the lowest present value life cycle cost, including environmental and economic costs, through a strategy combining investments and expenditures on energy supply, transmission and distribution capacity, transmission and distribution efficiency, and comprehensive energy efficiency programs.”
The IRP meets these requirements in two ways. First, we discuss how GMP plans to combine its vision to become an integrated energy service company with specific strategies and prospective investments that will meet our customers’ need for energy services at low cost. Second, we outline a power supply strategy that realizes Vermont’s energy policy goals while managing cost volatility and regional rate competitiveness.
ii

Integrated Resource Plan | 2014
Organization of this Report
The 2014 IRP is organized into the following eight chapters plus 10 technical appendices.
Chapter 1: Executive Summary reviews the entire plan in brief and presents its conclusions.
Chapter 2: The Demand for Electricity describes the 20-year forecast of GMP’s electricity sales and loads. It discusses the primary demographic, economic, climatological and technological trends that drive the forecast.
Chapter 3: The Supply of Electricity describes the resources that make up GMP’s current portfolio of generation assets. It discusses potential new resources that GMP analyzed in the portfolio evaluation, and how GMP thinks about a range of other generation technologies.
Chapter 4: The Transmission & Delivery of Electricity describes the transmission and distribution (T&D) projects that GMP has undertaken since the last IRP in 2011, and discusses the current and future projects that GMP is planning for the upcoming three-year period.
Chapter 5: Innovation describes GMP’s vision to transform its electric grid in the coming decades to respond to our customers’ need and preference for higher levels of service, convenience and control. It discusses GMP’s customer-facing and information technology initiatives that are underway and are planned for the next three-year period.
Chapter 6: Regional Market Context describes key power market issues that are facing the New England region, and how they may affect GMP’s portfolio strategy and evaluation. Examples of the issues that are discussed in this chapter include:
• The state of New England’s energy market in the context of constrained winter gas supplies; • Developments in the New England capacity market, including erosion of the regional surplus
of installed capacity, evolving market rules, and the likelihood that future capacity market prices will meaningfully exceed those observed in recent years; and
• The state of New England’s renewable policies, and the outlook for REC markets.
Chapter 7: Resource Plan and Portfolio Evaluation describes how the 2014 IRP estimates power supply and transmission costs. It also discusses the evaluation of hypothetical future resource portfolios, and identifies types of resources that appear appropriate for GMP to explore in the next several years.
Chapter 8: Integration & Implementation Plan describes GMP’s ongoing efforts to more tightly integrate the planning and operational elements of its business, and how it plans to implement the conclusions from this IRP.
iii

Integrated Resource Plan | 2014
The two primary strategic directions within the 2014 IRP are to enable and/or invest in: 1. Integrated Innovation Programs 2. Cost-effective renewable and distributed generation.
1. Executive Summary
GMP strives to deliver low-cost, low-carbon, incredibly reliable energy services to its customers. In the 2011 IRP, this led to a focus on supporting the development of new utility-scale, renewable generation (through direct GMP ownership or contracts) and other stable-priced, low-emission power sources. This strategy continues to apply in 2014 as GMP continues to develop cost-effective new renewable projects.
In this IRP GMP expands on this theme, and articulates its vision to create a future where the Vermont power grid can accomodate more cost-effective renewable and distributed generation (DG) over time. Although the penetration of DG technology is still emerging, we believe that the trend toward greater amounts of cost-effective renewable and distributed generation is in the best interest of our customers and the environment.
Another common element from 2011 is GMP’s ongoing effort to create a smarter grid. GMP has completed its 2011 Smart Grid Initiative, which consisted of a combination of new meters, upgraded switching equipment and state-of-the-art software systems. As technology continues to empower our customers to make more choices about their energy use, we continue to refine, enable and build out our vision of becoming an integrated energy services company. As Chapter 5 explains, GMP’s Innovation programs create value for our customers with empowering, cost-saving opportunities such as Cow Power, Net Metered Solar, the Heat Pump Lease Program, and our eHomes Initiative.
The Innovation vision also includes investing in and modernizing the grid to increase its intelligence and efficiency. GMP believes that the grid’s ability to accommodate more renewable energy, distributed generation and intelligent customer devices will not only create value for individual customers, but will also decrease dependence on (and the cost of) the regional transmission grid over time.
These are the two primary strategic directions within the 2014 IRP; to enable and/or invest in:
1. Integrated Innovation Programs - That result in cost-savings to customers and a more efficient, intelligent grid.
2. Cost-effective renewable and distributed generation.
Page | 1-1
Integrated Resource Plan | 2014
“…this IRP analyzes how to comply with several different environmental policy futures, and explicitly estimates the carbon cost and emissions profile of the portfolio.”
“To the extent that new [pipeline] infrastructure in New England is not built by 2020, this issue represents an upside cost risk to the power supply portfolio.”
1.1 Other Themes from the 2011 IRP: Environmental Policy & Gas Supply
Two other themes from the 2011 IRP remain at the forefront of GMP’s thinking today. First, environmental policy at the state, regional and federal level continues to mature. For instance, Vermont’s renewable policy continues to evolve, and even though Vermont is exempt from the EPA’s Clean Power Plan (111d), these regulations will impact electric generators and market prices in our region. Specifically, some additional price for greenhouse gas emissions will likely be internalized into the electricity market. As a result, this IRP analyzes how to comply with several different environmental policy futures, and explicitly estimates the carbon cost and emissions profile of the portfolio.
The second recurring theme from the 2011 IRP that remains a key focus is natural gas supply. The ongoing national boom in shale gas production means that natural gas is expected to be both abundant and relatively low-cost over the 20-year planning horizon of this IRP. However, New England has not benefited from these low natural gas prices over the past several winter
seasons due to a lack of pipeline delivery capacity. As Chapters 6 & 7 explain, we assume that by 2020, new pipeline delivery capacity will be built in New England to alleviate the winter price spikes. To the extent that new [pipeline] infrastructure in New England is not built by 2020, this issue represents an upside cost risk to the power supply portfolio.
1.2 Evolving Focus for the 2014 IRP
In addition to these recurring themes from 2011, there are eight other areas of either new or renewed emphasis in the 2014 IRP.
Page | 1-2
Integrated Resource Plan | 2014
“…we project that GMP could meet its share of the 2017 SPEED goal by acquiring 25 MW of new solar PV capacity and 80 MW of new wind capacity.”
1. Vermont’s Renewable Goals & The Resource Plan Chapter
One goal of the Resource Plan and Portfolio Evaluation in Chapter 7 (the Resource Plan) is to discuss options for meeting Vermont’s 2017 SPEED1 goal and Total Renewables Goal (55% of sales). GMP has made substantial progress toward its share of the SPEED goal, although its presently committed new renewable sources are not sufficient to meet the goal. As a result, we are exploring several types of potential new renewable sources that would contribute to meeting the SPEED goal, including utility-scale and distributed sources. For a sense of scale, we project that GMP could meet its share of the 2017 SPEED goal by acquiring an illustrative 25 MW of new solar PV capacity and 80 MW of new wind capacity. Similarly, we project that we will need some additional resources to meet Vermont’s 2017 Total Renewables Goal, and we expect to meet some of that goal by acquiring renewable attributes, also known as Renewable Energy Certificates or RECs, from existing renewable plants in the region.
In 2032, the Total Renewable Target reaches 75%, and this is a second focus of the Resource Plan. This goal can be met by acquiring a plausible combination of new renewables (including wind and solar power) and existing hydroelectric sources. However, if these sources are all procured via long-term, fixed price commitments, the resulting power portfolio would feature a high degree of intermittent power and limited flexibility to benefit if future power market prices turn out relatively low. Our analysis also indicates that if federal subsidies for renewable energy expire as scheduled, the direct cost of acquiring these new renewable resources could increase significantly by the end of the current decade, offsetting potential longer-term technology gains for these technologies. In addition, market prices for RECs become one of the primary variables that affect the projected cost of the portfolio in 2032.
2. Carbon Regulation and Societal Costs
Vermont’s Title 30 explicitly requires utilities to estimate societal costs as part of the IRP process. Therefore, in addition to estimating the direct costs of the power supply portfolio, we have also estimated the external cost of carbon in each of the hypothetical portfolios that are analyzed in Chapter 7, the Resource Plan and Portfolio Evaluation. This analysis indicates that
1 The Sustainably Priced Energy Enterprise Development (SPEED) program goal was established by 30 V.S.A. § 8005 and § 8001, and supports qualifying new renewable generation in amounts equal to 20 percent of electricity sales.
Page | 1-3

Integrated Resource Plan | 2014
“…this IRP anticipates a higher, wider range of capacity prices as compared to those anticipated in the 2011 IRP, making capacity prices one of the major cost drivers in the 2014 Resource Plan.”
the societal costs of carbon emissions are substantial, and that they can change the outcome of the portfolio evaluation compared to evaluating direct costs alone. As a result, we illustrate a preferred portfolio that represents a balance between minimizing societal costs and minimizing the direct costs to our customers.
3. Energy Efficiency Trends
As an explicit requirement of an IRP in Title 30 and a cornerstone of Vermont’s energy policy, energy efficiency is an integral part of the 2014 IRP. GMP collaborated with both Efficiency Vermont (EVT) and the Vermont System Planning Committee (VSPC) to include the most up-to-date forecast of energy efficiency savings in the IRP’s sales and load forecasts. We also consulted with several EVT experts on the market for heat pumps and electric vehicles, and included the impacts of both of these emerging trends in the load forecast.
4. Capacity Markets & Pay-for-Performance Requirements
Since the inception of the Forward Capacity Market (FCM) in June 2010, the price of capacity has been set by administrative price floors that are relatively low ($2.95 to $4.50/kw-mo). This past February, the eighth Forward Capacity Auction (FCA) produced a clearing price (to be paid by load) of $7.025/kw-mo., an increase of 123% over the clearing price in FCA7. Absent the administrative pricing mechanism that was triggered in FCA8, the clearing price would have been $15/kw-mo.
Capacity prices in the FCM are now being determined within a substantially different framework than in the recent past. During 2013 and 2014, ISO-NE worked with its stakeholders to gain FERC approval for a sloped demand curve, along with a Pay for Performance (PFP) mechanism to ensure that generators who receive capacity payments are available at critical times. Both of these changes are expected to be implemented for FCA9, and are explained in more detail as part of Chapter 6, Regional Market Context.
As a result of the retirement of substantial capacity resources in New England, this IRP anticipates a higher, wider range of capacity prices as compared to those anticipated in the 2011 IRP, making capacity prices one of the major cost drivers in the 2014 Resource Plan.
Page | 1-4
Integrated Resource Plan | 2014
“These two electrification trends grow large enough to affect resource planning in the second 10 years of the planning horizon. However, neither trend is expected to produce substantial load growth in the near term.”
5. Electrification Trends: Heat Pumps and Electric Vehicles
Since the 2011 IRP, two ongoing technology trends have progressed to the point where they are explicitly incorporated into the IRP. First, cold-climate heat pump technology is beginning to penetrate GMP’s service territory. This technology enables building owners to realize substantial cost savings compared to using heating oil and propane for winter heating needs. Heat pumps also have summertime benefits because they are more energy efficient than window-mounted air conditioners.
This past year, the Vermont Legislature enabled Efficiency Vermont (EVT) to offer rebates to customers who install EnergySTAR-qualified heat pump equipment. In addition, GMP is offering its customers a heat pump lease program to defray the installation costs and save customers money in the first year of installation. The combination of these two programs with an already cost-effective technology should result in rapid adoption rates2 throughout the service territory. As a result, GMP worked closely with EVT and Itron to include the best available information on the heat pump penetration trend in the load forecast for this IRP.
The other technology that is beginning to trend upward is electric vehicles (EVs). Unlike heat pumps, EV technology is not yet always cost-effective at current gasoline and electricity prices. However, customers are beginning to adopt EVs in perceptible numbers, and GMP has been a leader in installing EV charging stations in its service territory to support the growing market. EV penetration is included the IRP using VTran’s Electric Vehicle Charging Plan, which includes three different outlooks for the pace of EV penetration. Using these outlooks, an estimate of
new electric load was added to the IRP’s load forecast, and is included as a variable in the Resource Plan.
These two electrification trends grow large enough to affect resource planning in the second 10 years of the planning horizon. However, neither trend is expected to produce substantial load growth in the near term.
2 Efficiency Vermont’s outlook for heat pump adoption anticipates 20% annual growth rates in heat pump sales.
Page | 1-5

Integrated Resource Plan | 2014
“These results indicate that the 15% net-metering cap will be reached in 2021, if not sooner.”
“…the results indicate that about 2,700 MW of renewable capacity would be needed to meet 90% of GMP’s projected energy requirements in 2050.”
6. CEP Goal: 90% of Total Energy from Renewable Resources by 2050
Although the 2050 Comprehensive Energy Plan (CEP) goal is outside the scope of the 20-year time horizon for this IRP, the next 20 years will begin to set the trajectory toward achieving it. As a result, this IRP frames the amount of renewable electric energy that would be required to meet it. In Chapter 2, we estimate how much new electricity demand would be created by a 90% switch to EVs and heat pumps, and how much renewable energy would be needed to meet the demand. Assuming for illustration that an equal amount of energy is produced by hydro, solar and wind resources, the results indicate that about 2,700 MW of renewable capacity would be needed to meet 90% of GMP’s projected energy requirements in 2050.
7. Net-Metering, Solar Power, and Distributed Generation
Since Vermont's original net-metering law was enacted in 1998, it has been updated several times, most recently by Act 99 in 2014. Act 99 included a number of important changes, but for the purposes of the IRP, the most important change was that the cap on the cumulative installed capacity of net-metered systems increased from 4% of the utility’s peak demand to 15%. For GMP, the new cap represents about 115 MW of net-metered capacity.
Since the net-metering cap was increased in May 2014, GMP has received 16 net-metered applications for 500 kW solar systems. This represents 8 MW of new development, and if these projects were all permitted and built, they would represent almost a one third increase in the installed base of net metered capacity within GMP’s service territory. In addition, a number of solar developers have indicated their intention to develop several hundred new group net-metering projects within the service territory in the coming two to three years.
It is too soon to determine if these development plans will materialize into completed projects. However, GMP directed Itron to continue using their “simple payback” model to forecast the
production from rooftop net-metered systems, and then we developed an internal consensus forecast of the number of group net-metered systems that will be built. These results indicate that the 15% net-metering cap will be reached by 2021, if not sooner.
Page | 1-6

Integrated Resource Plan | 2014
“Partnering with forward-looking energy service providers is among the quickest ways to bring innovative, cost-saving opportunities to our customers, and is a mainstay of our approach to serving our customers.”
8. Partnering to Serve Our Customers
Partnering with forward-looking energy service providers is among the quickest ways to bring innovative, cost-saving opportunities to our customers, and is a mainstay of our approach to serving our customers. The latest example is GMP’s partnership with NRG Energy, Inc. (NRG), which will offer a series of new clean energy products and services to help our customers manage their energy use, increase their comfort and save money. This partnership is part of our efforts to establish Rutland as the Energy City of the Future, with rapid adoption statewide to follow, helping position Vermont as a leader in the movement toward cost-effective sustainable energy solutions.
In 2014, GMP has built a number of partnerships while strengthening existing relationships, and we will continue to develop new ones as new technology and new partnership opportunities emerge. In addition to NRG, the other partnerships that were formed in 2014 include the following.
• Stafford Hill: To build the Stafford Hill Solar Farm, we partnered with the US Department of Energy, the State of Vermont, the City of Rutland, Stafford Technical Center, Rutland High School, groSolar, DynaPower, the American Red Cross, the Vermont Clean Energy Development Fund, the Vermont Energy Investment Corporation (VEIC) and the Vermont Public Service Department.
• On-Bill Energy Improvement Loan: In partnership with NeighborWorks of Western Vermont, GMP customers have access to a home energy improvement loan for energy efficiency improvements that can be repaid as part of their monthly energy bill.
• Residential Peak Energy Savings Pilot Program: In partnership with VEIC/EVT and OPower, 35,000 GMP customers participated in a first-of-its-kind pilot program that empowered them to take energy-savings actions on hot summer days when the grid is least efficient.
Page | 1-7
Integrated Resource Plan | 2014
“Looking to the future, we intend to take full advantage of our advanced metering infrastructure and the emerging smart grid technologies to improve system functionality and reliability.”
1.3 The State of GMP’s Transmission & Distribution (T&D) Infrastructure
GMP practices a comprehensive system planning process to meet the reliability needs of its customers while capturing cost-effective transmission and distribution system efficiency opportunities.
To meet the reliability needs of our customers, we have invested in substantial capital upgrades since our last IRP filing. These investments have resulted in major upgrades to eight substations and four subtransmission lines, the construction of one new substation, and the construction of one new interconnection to the Vermont Electric Power Company (VELCO) high-voltage supply system. Investments in distribution system upgrades are made annually to improve reliability to customers, capture efficiency opportunities and serve new load. Looking forward, we have numerous transmission and distribution projects in the study and planning stages. These projects are designed to update aged equipment, enhance safety and efficiency and improve reliability.
To ensure that we attain all cost-effective efficiency on the delivery system, GMP routinely implements measures including power factor correction, circuit balancing, circuit reconfiguration, voltage conversion, least-cost transformer acquisition, and conservation voltage regulation. GMP also engages in a number of ongoing operations maintenance programs to enhance system reliability. These include vegetation management, pole inspections, aerial patrols and infrared inspections. Analysis of outages occurs on weekly, monthly and annual bases. We take special pride in our ability to plan for weather events and perform storm-related restorations expeditiously.
Looking to the future, we intend to take full advantage of our advanced metering infrastructure and the emerging smart grid technologies to improve system functionality and reliability. Through our Innovation programs, we plan to enhance the control of the system by our operators, quickly detect the location of system problems, restore power to interrupted customers, increase system efficiency and integrate distributed renewable resources into the system.
Page | 1-8

Integrated Resource Plan | 2014
1.4 The State of GMP’s Power Supply Portfolio
In the past five years, GMP’s supply portfolio has gone through many changes. Two contracts that had previously made up almost three-quarters of our portfolio have either expired or will begin a fast ramp down by the end of 2015. In 2012, the Vermont Yankee PPA, which covered about 40% of our annual energy needs, expired. By 2016, GMP’s purchase under the current Hydro-Quebec-Vermont Joint Owners (HQ/VJO) PPA, which covered about 33% of our energy needs in 2014, will also expire.
As a result of these expirations, GMP’s projected need for new supply sources was substantial. In the last several years, GMP has taken major steps to fill part of that gap, and in the process, we have also diversified our portfolio. Some of the most significant additions to our supply portfolio since the 2011 IRP include:
• Kingdom Community Wind, a 63-MW owned wind project that came online in late 2012 and is located in Lowell, Vermont. 8 MW of output is sold to the Vermont Electric Cooperative under a long-term contract.
• Granite Reliable Wind PPA, an 82-MW long-term PPA beginning in 2012 for energy, capacity and RECs from a wind plant in New Hampshire.
• NextEra PPA, a long-term purchase backed by the Seabrook nuclear plant, starting at modest volumes (15 MW of energy) in 2012, and increasing to 60 MW of energy and 85 MW of capacity in 2016. Deliveries under this contract are slated to ramp down by 10 MW increments in 2021 and again in 2028.
• HQUS PPA starting in 2012 with modest volumes, and by 2017 providing 173 MW of on-peak (“7x16”) energy from the HQ system, which will consist overwhelmingly of hydro power.
• Increasing SPEED Standard Offer volumes over time, which are categorized as premium renewables.
The following figure shows GMP’s projected energy sources in fiscal 2017. This includes resources that are owned by GMP, under contract, or “System Contracts” that will be entered into to manage GMP’s open position. Importantly, this depiction of the portfolio is before the sale of RECs. In keeping with current practice, GMP does expect to sell RECs from the “Premium Renewables” and “Other Renewables” categories. For the purpose of describing the mix of power sources that serves GMP customers in a particular year, to the extent that such REC sales
Page | 1-9

Integrated Resource Plan | 2014
are implemented in that year, the associated portions of the portfolio will be reported based on the residual New England system mix. By 2017, almost all of the HQVJO PPA will have expired, and the new HQUS and NextEra PPAs will have reached their full volumes. By design, GMP’s portfolio has shifted in recent years from being dominated by just a few resources to a more diverse resource mix that is increasingly reliant on renewable sources, and not fully committed to long-term purchases.
Figure 1.4.1 GMP’s Projected Energy Sources Fiscal 2017 – Before REC Sales3
It is important to note that this Figure depicts GMP’s portfolio of committed supply sources. It is meant to show the mix of sources that will offset purchases in the ISO-NE energy market. The chart does not depict the mix of sources that can be claimed to serve GMP customers. The supply mix in any given year must also reflect the ownership of renewable attributes or RECs, and can be markedly different if GMP sells RECs from some of these sources. The mix would also change if GMP chose to buy RECs from other sources. As discussed in Chapter 7, the renewable energy policy choices that Vermont makes in the coming years will have important effects on the fuel mix and emission profile of electricity supply that ultimately serves GMP customers.
*“Other Renewables” include existing biomass, hydroelectric, wind and “excess” net-metered renewable resources.
Page | 1-10
Integrated Resource Plan | 2014
The Remaining Gap
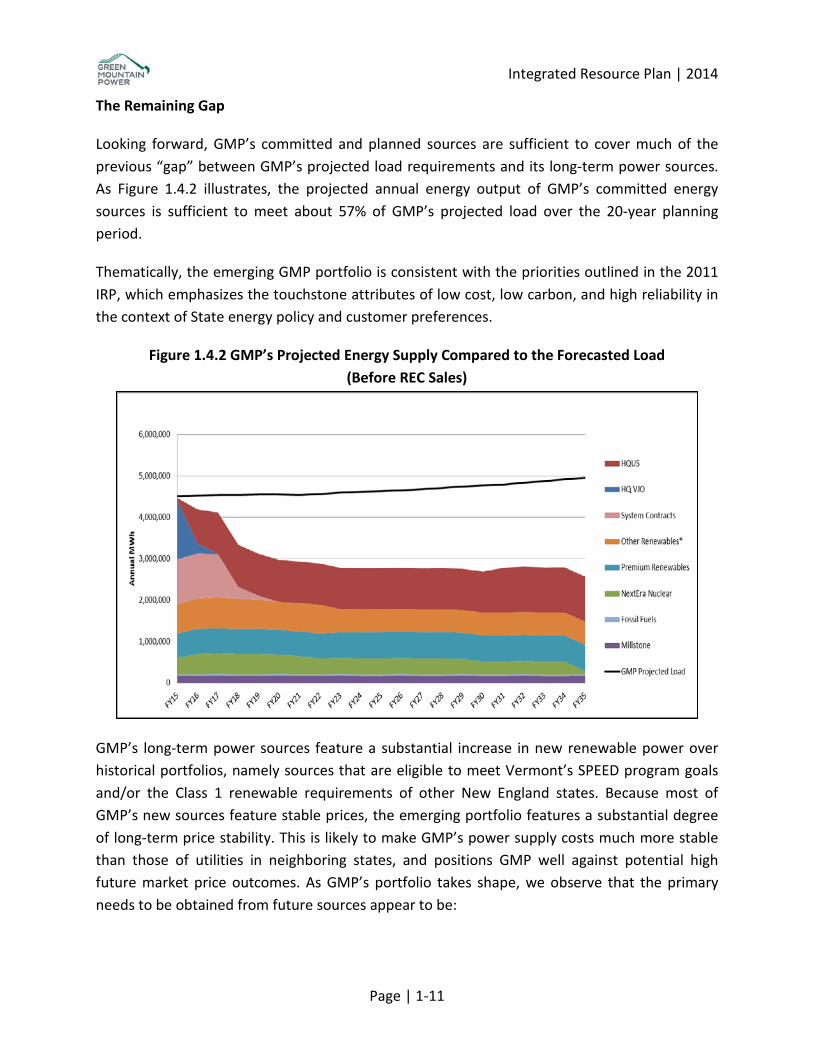
Looking forward, GMP’s committed and planned sources are sufficient to cover much of the previous “gap” between GMP’s projected load requirements and its long-term power sources. As Figure 1.4.2 illustrates, the projected annual energy output of GMP’s committed energy sources is sufficient to meet about 57% of GMP’s projected load over the 20-year planning period.
Thematically, the emerging GMP portfolio is consistent with the priorities outlined in the 2011 IRP, which emphasizes the touchstone attributes of low cost, low carbon, and high reliability in the context of State energy policy and customer preferences.
Figure 1.4.2 GMP’s Projected Energy Supply Compared to the Forecasted Load (Before REC Sales)
GMP’s long-term power sources feature a substantial increase in new renewable power over historical portfolios, namely sources that are eligible to meet Vermont’s SPEED program goals and/or the Class 1 renewable requirements of other New England states. Because most of GMP’s new sources feature stable prices, the emerging portfolio features a substantial degree of long-term price stability. This is likely to make GMP’s power supply costs much more stable than those of utilities in neighboring states, and positions GMP well against potential high future market price outcomes. As GMP’s portfolio takes shape, we observe that the primary needs to be obtained from future sources appear to be:
Page | 1-11

Integrated Resource Plan | 2014
• Operable Capacity: Additional “operable” (dispatchable) capacity sources are desired to reduce cost exposure in ISO-NE’s Forward Capacity Market, and to manage increasing penetration of renewables and distributed generation.
• Low Carbon and Renewable Energy: Additional existing renewable and low-emissions power sources are desired to maintain a low-emission profile and to meet the total renewables goals.
We note that large hydro and existing biomass plants have the potential to address both of these needs, and on a scale appropriate to GMP’s portfolio. Utility scale wind and solar can also help to meet these goals when complemented by operable capacity, including thermal peaking resources.
1.5 Portfolio Analysis & Evaluation
The portfolio analysis considered a range of different resources, and the following table lists the top 10 resources that were considered. Five of these resources were selected to model explicitly in the Resource Plan, including renewable (new solar and new wind), existing hydroelectric, combined cycle, peaking (combustion turbine) power, and RECs from existing renewables.4 Four of the remaining resources on the list were considered either too expensive at this time (biomass, offshore wind) or too emergent (grid-scale storage, regional imports, and Innovation) to model explicitly in the portfolio analysis. Finally, while GMP has an established hedging program that uses layered forward purchases of energy and capacity to manage the variability of power costs in the short term (less than 5 years), these kinds of purchases were not modeled because their pricing would reflect the future market environment at the time, and thus would not meaningfully affect the long-term performance of the portfolio.
4 We limited the number of resources for modeling simplicity; in actual practice GMP will consider resources outside this list.
Page | 1-12
Integrated Resource Plan | 2014
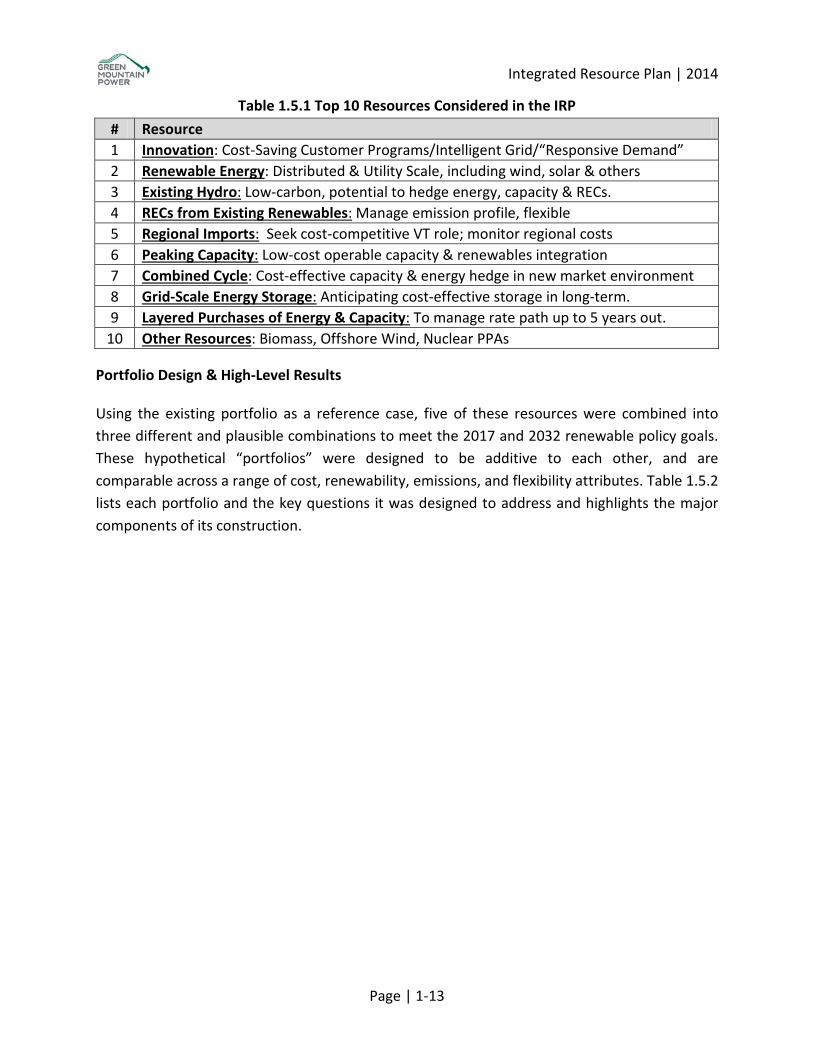
Table 1.5.1 Top 10 Resources Considered in the IRP # Resource 1 Innovation: Cost-Saving Customer Programs/Intelligent Grid/“Responsive Demand” 2 Renewable Energy: Distributed & Utility Scale, including wind, solar & others 3 Existing Hydro: Low-carbon, potential to hedge energy, capacity & RECs. 4 RECs from Existing Renewables: Manage emission profile, flexible 5 Regional Imports: Seek cost-competitive VT role; monitor regional costs 6 Peaking Capacity: Low-cost operable capacity & renewables integration 7 Combined Cycle: Cost-effective capacity & energy hedge in new market environment 8 Grid-Scale Energy Storage: Anticipating cost-effective storage in long-term. 9 Layered Purchases of Energy & Capacity: To manage rate path up to 5 years out.
10 Other Resources: Biomass, Offshore Wind, Nuclear PPAs
Portfolio Design & High-Level Results
Using the existing portfolio as a reference case, five of these resources were combined into three different and plausible combinations to meet the 2017 and 2032 renewable policy goals. These hypothetical “portfolios” were designed to be additive to each other, and are comparable across a range of cost, renewability, emissions, and flexibility attributes. Table 1.5.2 lists each portfolio and the key questions it was designed to address and highlights the major components of its construction.
Page | 1-13

Integrated Resource Plan | 2014
Table 1.5.2 Summary of Portfolio Design
# Resource Acquisition Strategy Assumptions 0 Reference Case:
• What is the cost of GMP portfolio of committed resources under future market conditions?
• No new PPAs or generation are added to the portfolio. • The SPEED Goal & Total Renewables Targets (TRT) are left
unmet. • No forward hedging transactions are assumed.
1 Meet 2017 & 2032 Renewables Goals and Targets: • How much capacity is needed to meet the SPEED
Goal? • What is the cost of meeting the SPEED Goal?
• Modify the Reference Case by adding enough new renewables to meet the SPEED Goal.
• Add 80 MW of large wind, and 25 MW of large solar. • Purchase low-price RECs to meet the TRT. • Post 2017 resource acquisition is frozen.
2 Meet 2032 Renewables Goal with Owned Generation • How much new capacity is needed to meet the 2032
TRT? • What is the cost of meeting the TRT with owned
and/or PPA-based resources?
• Modify #1 by adding a plausible mix of new & existing renewables to meet the 75% 2032 TRT.
• Add 150 MW new wind, 155 MW of new solar and 275 MW of large, existing hydro.
• Continue to sell premium RECs, and purchase low-price RECs to replace them to meet the TRT.
3 Meet 2032 TRT with Low Priced RECs and Add Conventional Generation • What is the cost of conventional thermal generation,
and how does it affect the portfolio cost compared to high penetrations of renewable energy?
• What role could thermal generation play in a portfolio of increasing renewable generation?
• Modify #1 by adding 100 MW of combined and 100 MW of combustion turbine capacity.
• Continue to sell premium RECs, and purchase low-price RECs to replace them to meet the TRTs.
• Do not add any new renewable development, which isolates the role of thermal generation in the portfolio.
P Environmental Policy Cases • What is the cost of purchasing low-priced RECs to
meet the TRTs? • What is the first-year (2018) cost of a Vermont RPS?
• Modify the Reference Case to meet the TRTs with the purchase of low-priced RECs.
• Modify the Reference Case to retire new renewable RECs be retained for RPS compliance at three different percentages.
Page | 1-14
Integrated Resource Plan | 2014
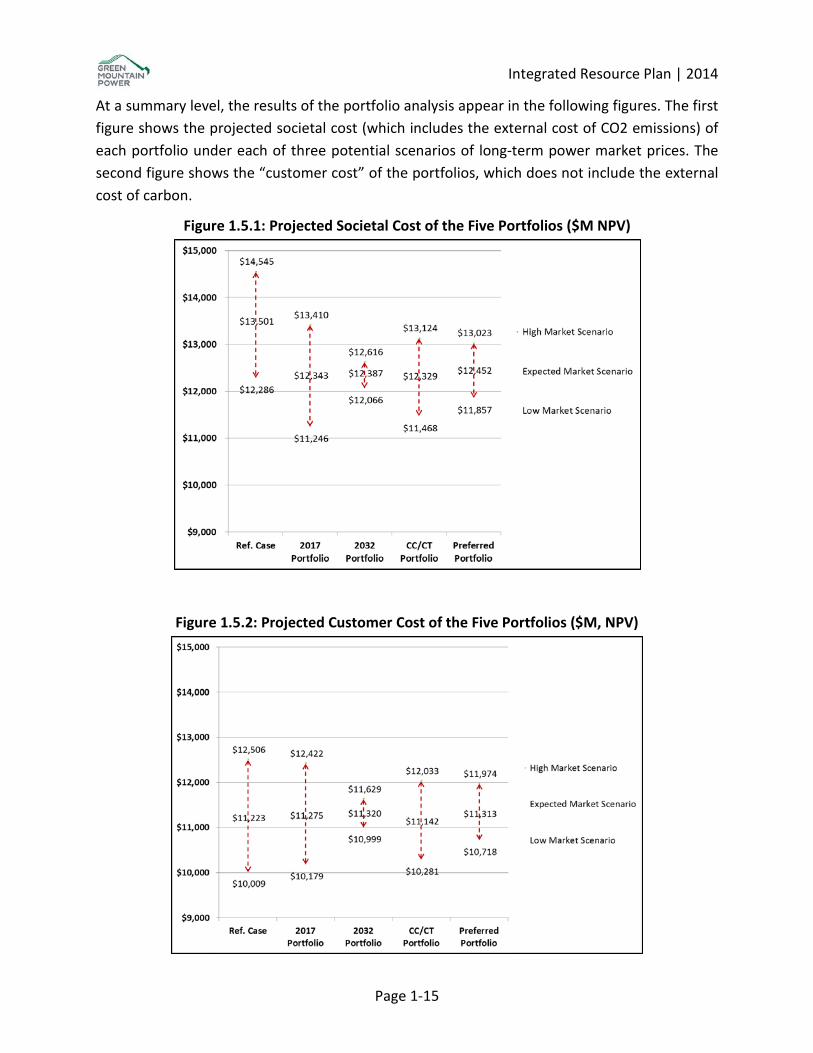
At a summary level, the results of the portfolio analysis appear in the following figures. The first figure shows the projected societal cost (which includes the external cost of CO2 emissions) of each portfolio under each of three potential scenarios of long-term power market prices. The second figure shows the “customer cost” of the portfolios, which does not include the external cost of carbon.
Figure 1.5.1: Projected Societal Cost of the Five Portfolios ($M NPV)
Figure 1.5.2: Projected Customer Cost of the Five Portfolios ($M, NPV)
Page 1-15

Integrated Resource Plan | 2014
Environmental Policy Case Results
The results of the policy scenarios appear in Table 1.5.3. The lowest-cost approach to meeting Vermont’s Total Renewable goals is to purchase low-priced RECs from existing renewable resources such as hydro and biomass. The price of these RECs was modeled between a range of $3 and $13/MWH. This is well below the price of premium or “new” RECs, which were modeled between a range of $10 and $40/MWH.
Table 1.5.3: Customer Cost Estimates of Different Renewable Policy Scenarios
Policy Scenario 2018 Cost ($M) NPV ($M)
Purchase Low-Price RECs for TR Goal $0.75 $143
“Std. Offer” RPS = 2% + 0.5%/Yr $2.90 $97
“Budgeted” RPS = 5-7% $8.20 $154
“Maximum” RPS = 20% $30 $454
If a Renewable Portfolio Standard (RPS) is adopted in Vermont, the costs of compliance will rise in direct proportion to the level of RECs that must be retained for compliance. The lowest cost RPS that this IRP quantifies is an illustrative RPS for new renewable resources in which the RECs from the Standard Offer program are retired. After the Standard Offer program is completed, then the RPS is assumed to increase by 0.5% per year through 2035 when it reached 8.5% of retail sales. The “budgeted” RPS represents a higher initial RPS requirement of 5% that rises immediately by 1% per year until it reaches 7% in 2020. Finally, the “maximum” RPS envisions an RPS that transforms the 2017 SPEED program goal of 20% renewable energy generation into a mandatory RPS (requiring retirement of premium/new RECs) in the same amount. This is the highest-cost outcome, and would add an estimated $30 million to GMP’s net power costs (equivalent to roughly 5 percent of retail rate pressure) in 2018.
Page | 1-16

Integrated Resource Plan | 2014
Illustrative, Preferred Portfolio
Based on the knowledge incorporated in and observations from the Resource Plan, GMP constructed a hypothetical portfolio that balances five attributes. The makeup of this portfolio appears in the following table, and an explanation of those five attributes follows.
Table 1.5.4: Components of the Illustrative Preferred Portfolio Resource Acquisition Strategy Portfolio Components
Balance low-cost and low-carbon with three attributes
that limit risk: diversity, flexibility and reliability.
Same as the 2017 portfolio plus: Low-carbon energy: 75 MW wind, 155 MW PV/DG Low-cost, operable capacity: 100 MW hydro, 100 MW CT Low-cost RECs meet remainder of Total Renewables goals Includes an RPS = Std. Offer program + 0.5%/yr. 8.5% total
• Low-Cost: This portfolio adds cost-competitive new renewables and existing hydro. Societal costs are 8% lower and customer costs are 1% higher than the Reference Case. It enables low-price RECs to fulfill some of the total renewable goals, and increases the committed long-term resource percentage over time to limit the effects of power market escalation.
• Low-Carbon: Carbon emissions decline from 70% of the regional system mix to 30% in 2035. Power from new & existing renewables plus nuclear power enables this outcome. Low-priced RECs meet part of the Total Renewable Targets, and an RPS equal to the SPEED Standard Offer program plus 0.5%/year (reaching 8.5% in 2035) retires a meaningful percentage of new RECs.
• Diversity: Wind increases to about 20% of the portfolio’s energy, with solar PV increasing to about 12% of the portfolio’s energy. Hydro remains the cornerstone of the energy portfolio at 45%.
• Flexibility: The long-term committed resource percentage rises to a range of 75% to 85%. This hedges inflation while preserving some flexibility to respond to alternative outcomes of electricity demand or cost and availability of supply options. Note that a significant degree of flexibility and market price exposure will return near the end of the planning horizon, when some major GMP supply sources expire from 2030 to 2035.
• Reliability: More hydro and peaking capacity provides operable capacity that enables renewables integration until economic grid-scale storage is a reality.
Page | 1-17
Integrated Resource Plan | 2014
The specific outputs of the preferred portfolio are summarized in the following bullets.
• Average Power & Transmission Costs (Nominal $/MWH) o Nominal costs rise from $0.08 to $0.15/kWh reflecting power cost drivers. o Projected average costs remain lower than a projected regional market
benchmark through the planning horizon.
• Long-Term Committed Resource Percentage o The percentage of long-term resources grows to a range of 75% to 85% over
time; this fraction seems reasonable considering that major resources expire between 2030 and 2035.
• Renewable Policy & Retirement Percentage o Vermont’s renewable energy goals are met using a mix of long-term renewable
commitments and meaningful percentages of low-price REC purchases. o Includes an RPS equal to the size of the SPEED standard offer program plus
0.5%/year, which results in 8.5% new renewables in 2035.
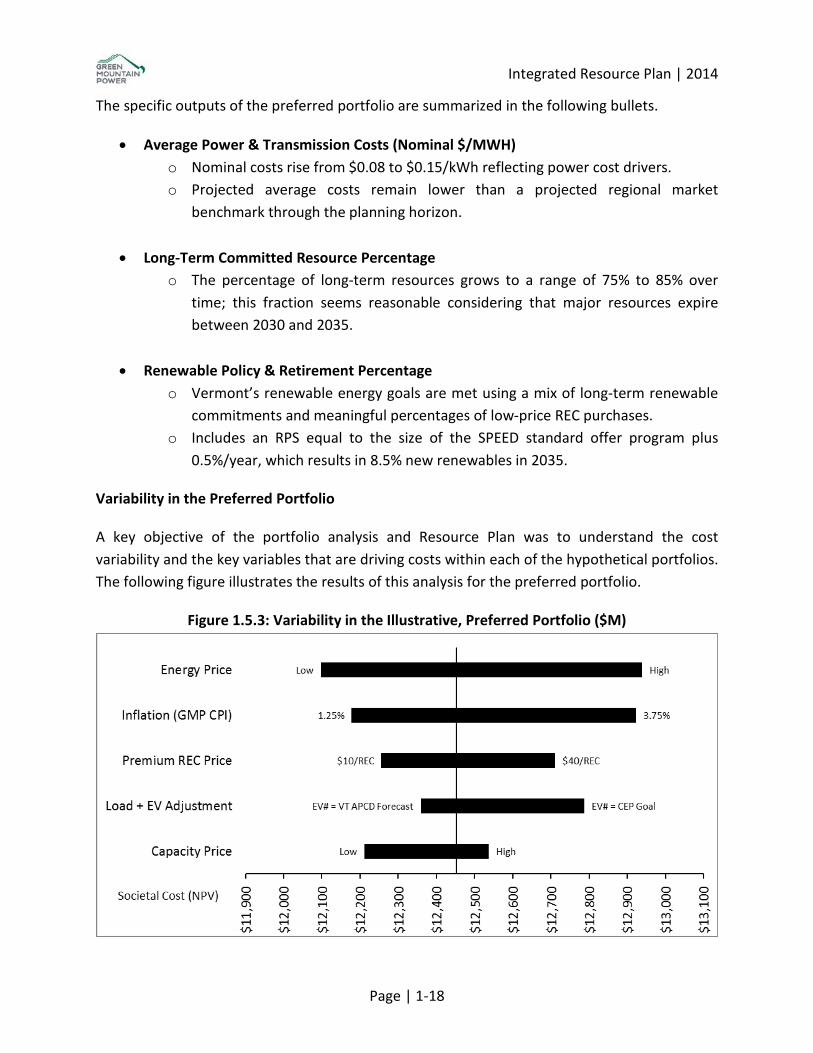
Variability in the Preferred Portfolio
A key objective of the portfolio analysis and Resource Plan was to understand the cost variability and the key variables that are driving costs within each of the hypothetical portfolios. The following figure illustrates the results of this analysis for the preferred portfolio.
Figure 1.5.3: Variability in the Illustrative, Preferred Portfolio ($M)
Page | 1-18
Integrated Resource Plan | 2014
The future market price of energy and the rate of general inflation are the top two cost drivers in the societal cost equation. Not surprisingly, the future market price of RECs is the third-most-important variable because of the increasing level of new renewable power in the preferred portfolio over time. The fourth-most-important variable to the societal cost equation is the rate of load growth resulting from electric vehicle penetration, which can drive up the NPV of this portfolio by several hundred million dollars if EV penetration follows a growth path toward the 2050 CEP goal. Finally, variability associated with future capacity market prices is significant, but muted somewhat because this illustrative portfolio includes 100 MW of future hydro and 100 MW of future peaking capacity.
1.6 Findings & Observations
The Demand for Electricity
• Electricity Sales are projected to continue growing at a 0.45% annual growth rate, which is within historical norms over the past 20+ years. This result means that the expected rates of load growth resulting from economic, population, heat pump and electric vehicle growth are almost (but not quite) offset by the growth in energy efficiency and net-metering. The balance of these trends will continue to be examined as the underlying trends continue to unfold over time. However, the results of the load forecast do not yet indicate a long-term decrease in electricity loads at this time.
Vermont’s Renewable Energy Policy
• Vermont’s Renewable Energy Policy will be a significant determinant of GMP’s costs in both the short and long-term. The current Vermont SPEED policy that requires Vermont utilities to sell RECs to out-of-state load serving entities may change, and the known alternatives increase costs by requiring the utilities to retain RECs. The highest cost outcomes would result from adopting a double-digit (illustrated at 20%) RPS similar in design to neighboring states like Massachusetts and Connecticut. More moderate-cost outcomes could result from either adopting a single-digit RPS or adopting policies that are measured by CO2 emissions instead of the percentage of renewable energy. Such requirements could be met in part by owning existing low-emissions resources or by purchasing non-premium environmental attributes (RECs) from around the region.
Regional Market Context
• Energy Costs & Limited Winter Gas Supply: Limited winter supplies of natural gas will likely continue to be a source of upward pressure on the region’s electricity prices until a major improvement to the region’s infrastructure is made. The price forecasts in the
Page | 1-19
Integrated Resource Plan | 2014
IRP assume that an expansion to the regional natural gas pipeline network is made by 2020, and to the extent that this investment is delayed, GMP expects upward cost pressure during the winter months.
• Capacity Costs & the Forward Capacity Market have emerged as a source of cost pressure and significant volatility. In the absence of administrative price caps and floors that have resulted in stable prices over the past 10 years, GMP is expecting a wider distribution of price outcomes from the Forward Capacity Market. We are also mindful of the impact that ISO-NE’s Pay-for-Performance program may have on the portfolio, and are monitoring these costs as well.
• REC Prices & Renewable Policy In Other States can have a significant impact on GMP’s costs. As renewable policies change, the price and eligibility of RECs can change as well. Because GMP is currently an active seller in New England REC markets, REC prices are a significant and potentially increasing variable affecting the net cost of GMP’s portfolio.
Externalized Carbon & the Societal Cost of the Portfolio
• The Societal Cost of GMP’s portfolio is estimated using the marginal abatement cost of carbon which is assumed to cost $100/ton. This equates to an adder of $30 to $50/MWh for a combined cycle power plant, which is similar to the magnitude of the fuel cost for these plants. This dynamic creates an economic advantage for renewable energy compared to thermal generation, and because the IRP evaluates cost performance primarily on a societal cost basis, portfolios with higher levels of renewable generation tend to result in the least (societal) cost outcomes.
The Illustrative, Preferred Portfolio
• The Preferred Portfolio represents a balance between three attributes. 1. Lowest Cost: A diverse portfolio that strikes a balance between direct and societal
costs. 2. Low Carbon: A diverse portfolio that includes substantial cost-competitive
renewables and distributed generation, complemented by a more limited amount of thermal capacity to manage capacity market exposure.
3. Reliable: A diverse and stable portfolio that minimizes the short- to medium-term price risk to our customers, while maintaining enough flexibility to maintain retail rate competitiveness if future regional market prices turn out relatively low.
Page | 1-20
Integrated Resource Plan | 2014
Innovation and T&D Infrastructure
• In order to realize GMP’s vision of a more intelligent and efficient grid that can accommodate cost-effective renewables and distributed generation, ongoing investment in the company’s operating systems (IT and SCADA primarily) and planning capabilities is required.
The Role of Conventional Generation in the Preferred Portfolio
• Natural gas generators are expected to remain the marginal cost resource in New England for both energy and capacity over the planning horizon. Gas-fired capacity could warrant consideration as a hedge against volatile capacity market prices, and to manage portfolio cost variability associated with high levels of intermittent renewable generation, at least until cost-competitive energy storage becomes a reality on a large scale.
1.7 Integration and Implementation Plan
As an increasingly integrated energy services company, GMP is partnering with other companies, non-profits, and our policy makers to offer our customers an expanding array of choices. Reliable, low-cost, and low-carbon energy service is the foundation. Innovative, cost-saving customer programs combined with more renewable and distributed energy resources is the destination, and the following table summarizes the activities that GMP is planning to pursue as a result of the 2014 integrated planning process.
Page | 1-21

Integrated Resource Plan | 2014
Table 1.7.1 Implementation Plan Functional Area Activity
Energy Innovation
Develop an integrated array of cost-saving customer programs that meet a range of customer energy service needs for HVAC, hot water, home automation, and transportation.
• Offer ductless mini-split heat pump leases to the entire customer base. • Offer grid-enabled and/or heat pump water heater leases to the entire customer base. • Offer smart home and electric vehicle charging programs to the entire customer base.
Generation
Increase long-term ownership of cost-effective renewable energy sources such as hydro, solar and wind.
• Complete construction of the Stafford Hill project. • Construct and/or acquire new wind and solar generation to fulfill the 2017 SPEED goal. • Acquire existing renewable generation as opportunities arise, to help fulfill Vermont’s Total Renewable Goals.
Government Affairs
Advocate for cost-competitive and customer-focused renewables policies that:
• Continue to encourage investment in cost-competitive new renewable energy projects. • Enable full and fair participation in regional REC markets. • Create flexibility to fulfill renewable policy goals with both new and existing resources.
Power Supply
Maintain a low-cost, low-carbon and reliable power supply.
• Develop, sign and seek regulatory approval for new long-term PPAs to fulfill the 2017 SPEED goal. • Arrange market purchases of RECs to help fulfill the 2017 Total Renewables Targets. • Hedge GMP’s forecasted energy requirements for up to five years in advance, using layered market purchases. • Seek bilateral capacity purchases to hedge forecasted capacity requirements three years in advance of the operating
year, using layered capacity market purchases of up to five years with opportunistic longer-term purchases.
Transmission & Distribution
Plan for a more efficient and intelligent grid that enables greater customer participation, distributed resources and renewable generation.
• Prepare the grid for greater penetration of distributed resources by piloting energy storage, controlled EV charging, sensing and measurement equipment, advanced analytics and controls, power electronics, and telecommunications technologies.
• Maximize use of the AMI and NMS to identify opportunities where efficiency and distributed resources can address system constraints during the planning process.
Page 1-22

Integrated Resource Plan | 2014
Acknowledgements
Green Mountain Power would like to acknowledge the contributions of the individuals and organizations who contributed to the 2014 Integrated Resource Plan (IRP).
• Itron Inc.: Eric Fox, Oleg Moskatov and Mike Russo, who provided the expertise and analysis for the 20-year sales and load forecast.
• La Capra Associates: John Athas, Mary Neal and Marc Montalvo, who provided advice, analysis, and guidance on how to develop the IRP, as well as the market intelligence for the Regional Market Context chapter.
• Vermont Public Service Department: Asa Hopkins, TJ Poor, Sean Foley, John Woodward, Gina Stair and Ron Berhns, who participated in the IRP’s development throughout 2014.
• VEIC: Karen Glitman, Stephanie Morse, Jake Marin, Carole Hakstian, who provided insight into energy-efficient technologies (electric vehicles and heat pumps) and their impact on the automotive and HVAC5 markets.
• GMP Staff: This IRP is the result of a multi-department collaboration, and would not have been possible without the combined efforts of the Engineering, Energy Innovation Center, Finance, Generation, Regulatory, Government Affairs and Power Supply teams.
5 Heating, Ventilation and Air Conditioning
Page 1-23