2014 fraser river stock assessment and fishery summary ... post-season fraser cn co and... · 1...
TRANSCRIPT

1
2014 Fraser River Stock Assessment and Fishery Summary
Chinook, Coho and Chum

2
Background and Stock Assessment

3
Fraser River Chinook - BackgroundDiverse group of populations, exhibiting a wide range of life histories, geography, and run timing
Chinook enter the Fraser River from March thru October
Spawning occurs throughout the Fraser, from just above the tidal limits in the Lower Fraser to the upper tributaries of the Stuart basin
Juveniles exhibit both stream and ocean life history types
Currently managed as five Management Units– Fraser Spring 4(2) Chinook– Fraser Spring 5(2) Chinook– Fraser Summer 5(2) Chinook– Fraser Summer 4(1) Chinook– Fraser Fall Chinook

4
2014 Fraser River Stock Assessment Chinook
In-season Assessment– Spring and Summer 5(2) Chinook are assessed in-season with an abundance model
based on catch from the Albion Test Fishery
– catch for the 6 week time period that generates the in-season estimate was the fourth lowest since 1995 (Chinook catch from 8” net was 13 fish)
– the four years of lowest catch for this same time period have occurred in the last four years
– the 2014 in-season estimate of terminal run size (provided on June 16th) was 47,550
– this estimate resulted in Zone 2 management for 2014 (Zone 1 < 45K; Zone 2 = 45 to 85K; Zone 3 > 85K)

5
2014 Fraser River Stock Assessment - Chinook

6
2014 Fraser River Stock Assessment Chinook
Post-season Assessment– spawner abundance is estimated using a number of methods– mark-recapture studies – Nicola, Harrison, Lower and Mid Shuswap,
Chilko – electronic counters – Bonaparte and Deadman– fence counts at Salmon River (Salmon Arm) – remaining assessments are through visual surveys (aerial, foot or float)

7
2014 Fraser River Stock Assessment - ChinookFraser Spring 42 Chinook
– aggregate escapement improved considerably at ~9,300– great improvement over record low 2010 parental brood of 5,200 – Nicola escapement estimate = ~6,900 (visual)
Fraser Spring 52 Chinook– aggregate exceeded parental brood levels, and well above last year (17,000)– aggregate escapement is ~33,500– Lower Chilcotin, Cottonwood and Westroad improved considerably
Fraser Summer 52 Chinook– aggregate escapement likely just above parental brood levels (20,500)– mixed signals for this group – Chilko did well, but Clearwater did not– aggregate escapement is ~21,500– Chilko (~10,200) and Clearwater (~2,200)
Values presented are preliminary. Data entry and validation are still in progress. Estimates represent the sum of all systems surveyed with no expansion for those
spawning areas which are not surveyed.

8
2014 Fraser River Stock Assessment - Chinook
Fraser Summer 41 Chinook (late South Thompson)– escapement decreased from last year - similar to decline seen in 2012– aggregate escapement of 86,000 is about 55% of 2010 parental brood– declines largest in South Thompson (~38,000) and Little River (~3,400)
Lower Fraser Fall Chinook (Harrison and Chilliwack)– very limited information is available, but returns are tracking below forecast for
both Harrison and Chilliwack – escapement goal range for Harrison is 75,100 to 98,500 – pre-season forecast for Harrison escapement of less than 75,000 – preliminary escapement estimates are unavailable at this time– terminal abundance estimates available this spring

9
Escapement - Fraser Spring 42 Chinook
Base Period Doubling Goal

10
Escapement - Fraser Spring 52 Chinook
Base Period Doubling Goal

11
Escapement - Fraser Summer 52 Chinook
Base Period Doubling Goal

12
Escapement - Fraser Summer 41 Chinook
Base Period Doubling Goal

13
Escapement - Fraser Fall Chinook
Escapement Goal Range

14
Fraser River Coho - BackgroundCoho populations spawn throughout the Fraser watershed
– many spawning sites in Lower Fraser River
– Interior Fraser coho return to the Upper Fraser and Thompson Rivers
Stream-type life history
Most return as three year olds
Coho enter the Lower Fraser River from late August to December– peak migration period for Interior Fraser coho from early September to early
October
Interior Fraser coho populations have declined dramatically from peak abundances observed in the 1980’s. While spawning escapements have improved somewhat in recent years, overall returns remain well below levels observed prior this decline.

15
2014 Fraser River Stock Assessment Coho
Interior Fraser coho - very preliminary escapement estimate between 15,000 and 20,000
- decrease from 2011 parental brood escapement of ~25,500
- 2013 aggregate escapement was 58,360
Lower Fraser coho- escapement assessments are still underway
- estimates are expected late February
- work continues to identify a suite of systems to use for tracking annual abundance

16
Escapement - Interior Fraser River Coho(2014 estimate is preliminary)
Short Term Conservation Strategy Recovery Objective (Decker et al, 2014)
17
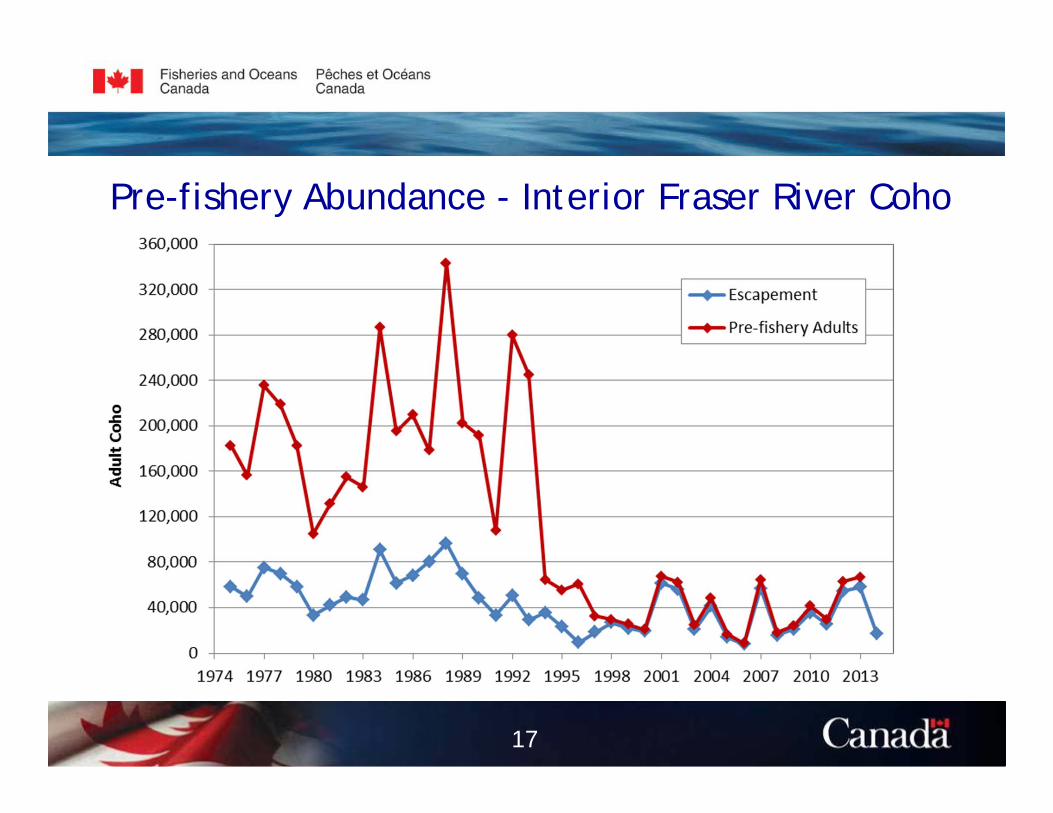
Pre-fishery Abundance - Interior Fraser River Coho

18
Fraser River Chum - BackgroundLargest chum population in British Columbia
- two Conservation Units (Lower Fraser and Fraser Canyon)- managed as one management unit
Escapement goal is 800,000
Return to Fraser from September through November- recent year peak migration mid/late-October
Major spawning areas are below Hope - Harrison/Weaver/Chehalis, Chilliwack/Vedder, Stave
Enhancement- Weaver spawning channels, Inch Creek, Chilliwack, and Chehalis hatcheries- production relatively consistent over the last 10 years- proportion of fed fry decreased in the last decade, but has been increased in
recent years

19
2014 Fraser River Stock Assessment Chum
Managed based on in-season information derived from the Albion test fishery
2014 in-season assessment– Albion test fishing catch was not as strong early in the run as it has been for the last
two years. Catch picked up significantly in early October.– October 15th preliminary run size estimate of 1.01 million– October 19th run size estimate was 1.329 million, with a peak date of October 16th
Post-season assessment (escapement) – 2013 terminal return of approx. 1.3 million fish– 2013 escapement of over 1.0 million chum– 2014 escapement assessments are still underway – no preliminary estimates available

20
Run Size – Fraser River Chum
Escapement GoalEscapement Goal
21
2014 Fraser River Fishery Summary

22
Please note that the term “Lower Fraser” is meant to include the Fraser River mainstem below Sawmill Creek
and tributaries to the Lower Fraser River, where applicable.

23
2014 Fraser River Fisheries - CommercialDirected sockeye and chum fisheries in-river if a commercial TAC is identified
– constraints due to co-migrating stocks of concern
Area E Fraser River Sockeye Fishery– nine openings between Aug 11 and Sept 23– harvest of over 1.6 million sockeye– retained bycatch of 6,512 Chinook, 17 coho, and 1,645 chum– 7,761 Chinook, 1,752 coho, 87 chum and 70 steelhead were released
Area E Fraser River Chum Fishery– 8 hr opening on Oct 23rd; 10 hr opening on Oct 28th
– harvest of 62,143 chum – retained bycatch of 1 Chinook, 50 coho and 1 steelhead– 111 Chinook, 2,088 coho, and 31 steelhead were released

24
2014 Fraser River FisheriesCommercial and Demonstration Fisheries
Area B Sockeye in Area 29– open Sept 16 to Sept 27– harvested 1.285 million sockeye– retained bycatch of 20 Chinook, 30 coho, and 292 chum– 84 Chinook, 92 coho, 16 chum and 2 steelhead were released
Area E Demonstration fisheries– no demonstration fisheries occurred in 2014
Area B Chum Demonstration fishery in Area 29– fishery opened Oct 29th
– limited participation– harvested 25 chum with 8 coho released

25
2014 Fraser River CatchCommercial and Demonstration
rel kept rel kept rel keptArea E
Sockeye directed 7,761 6,512 1,752 17 87 1,645Chum directed 111 1 2,088 50 25 62,143
Area BSockeye directed (Area 29) 84 20 92 30 16 292Chum directed (Area 29) 0 0 8 0 4 25
All Fisheries 7,956 6,533 3,940 97 132 64,105
Chinook Coho Chum

26
2014 Fraser River Fisheries - RecreationalChinook management actions in Region 2 (Lower Mainland)
– closed until July 15th to avoid Spring 4(2) Chinook
– opened for Chinook retention from July 16 to July 27, 1 per day• Mouth to Mission size limit of 30 to 77 cm
• Mission to Alexandra maximum size limit of 77 cm
– July 28 to August 31, 4 per day, only 1 over 50 cm.
– September 1 to December 31st, 4 per day, only 1 over 62 cm

27
2014 Fraser River Fisheries - RecreationalChinook management actions in Region 3 (Thompson-Nicola)
Fisheries in Region 3 generally target a specific stock group and are short duration opportunities designed to avoid impacts on non-target stocks. Areas not specifically mentioned are closed to fishing for salmon year-round.
Fisheries targeting Sp/Sum 5(2) stocks– Clearwater and North Thompson Rivers catch and release last 2 weeks of July, then 1 Chinook
per day until Aug 21 (monthly limit of 2) – Fraser River at Bridge River open Sunday through Thursday from June 17 to July 3; 1 per day– Fraser River at Lillooet open August 15 to Sept 29; 4 per day, 1 > 50 cm (sockeye directed)
Fisheries targeting Summer 4(1) stocks – Fraser River jack fishery July 16 to Sept 16; 4 per day, none > 50 cm– Thompson River July 16 to Aug 21; 4 per day, none > 50 cm– Kamloops Lake Aug 22 to Oct 20 4 per day, 1 > 50 cm (sockeye directed)– South Thompson River Aug 16 to Sept 22, 4 per day, 2 > 50 cm

28
2014 Fraser River Fisheries - RecreationalChinook management actions in Region 5A and 7 (Cariboo/Peace)All fisheries in these Regions target Spring or Summer 5(2) Chinook
One Chinook per day, none > 77 cm in the following areas and times:– Bowron River: July 15 to Aug 15– Cariboo and Chilko Rivers: July 25 to Aug 16– Nechako River: Aug 15 to Aug 27– Quesnel River: July 15 to Sept 1
Chinook management actions in Region 8 (Okanagan)These fisheries target Summer 4(1) Chinook with some measures in place to avoid Bessette Spring 4(2) stocks. Areas not specifically mentioned are closed to fishing for salmon year round.
– Mabel Lake and Lower Shuswap River opened to Chinook Jul 25 to Sept 12 with daily and size limits to avoid Bessette stocks in place through Aug 15
– Middle Shuswap River opened to Chinook Jul 25 to Aug 15 with daily and size limits and area closures to avoid Bessette stocks

29
2014 Fraser River Fisheries - RecreationalCoho management actions
– Mouth to Sawmill Creek - no fishing for coho (bait ban) during “Coho Window Closure” from early September to early October
– Sawmill Creek to Lytton – No fishing for salmon Sept 16 to Dec 31– Lytton to Williams Lake – No fishing for salmon Oct 6 to Dec 31– Upstream of Williams Lake – No fishing for salmon Oct 13 to Dec 31
Chum management actions– July 16 to December 31 – 2 per day (Mission to Sawmill Cr); 4 per day (below
Mission)

2014 Fraser River CatchRecreational
rel kept rel kept rel keptLower Fraser 9,321 10,933 2,334 2,165 3,562 1,479BC Interior 567 2,295 7 0 0 0Totals 9,888 13,228 2,341 2,165 3,562 1,479
Chinook Coho Chum
Kept coho reported in the Lower Fraser are from fisheries in the Nicomen Slough and Chilliwack/Vedder Rivers.
30

31
2014 Fraser River FisheriesFirst Nations Food, Social and Ceremonial
Chinook-directed fisheriesLower Fraser
– open every weekend for most groups from May 17 through July 20– managed to reduced hours to maintain effort consistent with Zone 2 management
Mid Fraser– limited Chinook 8-inch mesh in a few areas starting late April and directed Chinook
with selective gear began June– Chinook fisheries with sockeye non-retention occurred from July 1 to 29
Thompson River Upstream of Bonaparte – licensed July 15 for Chinook/sockeye
Upper Fraser – directed Chinook fisheries began June 1 with selective gear including angling and dip
net– sockeye non-retention fisheries occurred during the Early Stuart closure with selective
gear, including 8” mesh gillnets

32
2014 Fraser River FisheriesFirst Nations Food, Social and Ceremonial
Sockeye-directed fisheriesLower Fraser
– dry rack fisheries July 25 to 31– FSC openings weekends from July 26 to Aug 23 (non-signatories continued until Sept 14)
Mid Fraser– sockeye/Chinook fisheries took place from July 30 to October 20
Upper Fraser– Deadman to Hixon: directed sockeye fishing with dipnets initiated Aug 4– Upstream of Hixon: directed gillnet fishing initiated Aug 8– limited retention in July in terminal areas with access to only Early Stuart
Coho-directed fisheries- No coho-directed fisheries in 2014
Chum-directed fisheries (Lower Fraser only)– FSC openings on weekends from Oct 4 to Nov 9

33
2014 Fraser River FisheriesFirst Nations Economic Opportunity and Demo
Lower Fraser River Economic Opportunity Fisheries – targeted sockeye and chum salmon in 2014
Sockeye-directed fisheries occurred between Aug 12 and Sept 26– 529,000 sockeye retained– bycatch of 6,498 Chinook, 6 coho, 130 chum and 4 steelhead– 479 Chinook, 788 coho, 785 chum and 18 steelhead released
Chum-directed fisheries occurred between Oct 21 and Nov 5– 93,600 chum retained– bycatch of 27 coho– 426 Chinook, 4,036 coho, and 33 steelhead released

34
2014 Fraser River FisheriesFirst Nations Economic Opportunity and Demo
Mid and Upper Fraser Demonstration fisheries
Secwepemc Fisheries Commission– South Thompson 4(1) Chinook on Kamloops Lake and Little Shuswap Lake– Chinook allocation was 5,200; harvest was 1,549, mostly taken as bycatch in
Kamloops Lake sockeye fishery– bycatch mortalities of 145 kept coho (600 released coho) from Kamloops Lake
fishery; no bycatch in Little Shuswap Lake
Upper Fraser Fisheries Conservation Alliance– dip net fishery targeted sockeye on Fraser River mainstem in Siska Canyon– bycatch in this fishery was 78 released coho, and 11 released Chinook

2014 Fraser River Catch - First Nations
Nearly all kept coho in the Lower Fraser FSC fishery occurred after October 5th, 2014. Coho retention was permitted in all FSC fisheries in 2014.
35
rel kept rel kept rel kept rel keptFSC
Lower Fraser 61 19,180 144 4,120 27 39,214 89 13BC Interior 16 2,811 NA NA 0 0 NA NAFSC Total 77 21,991 144 4,120 27 39,214 89 13
Economic OpportunityLower Fraser 912 7,098 4,856 36 915 98,576 51 4BC Interior 902 2,024 703 182 0 0 NA NAEc Opp Total 1,814 9,122 5,559 218 915 98,576 51 4
ESSRLower Fraser 0 10,073 0 19,295 0 18,881 0 0BC Interior 0 0 0 0 0 0 0 0ESSR Total 0 10,073 0 19,295 0 18,881 0 0
All CatchLower Fraser 973 36,351 5,000 23,451 942 156,671 140 17BC Interior 918 4,835 703 182 0 0 NA NAAll Catch Total 1,891 41,186 5,703 23,633 942 156,671 140 17
Chinook Coho Chum Steelhead

Interior Fraser Coho
36

37
2014 Coho Management Approach• CSAS scientific review to assess stock status and implications of exploitation rates
on recovery objectives completed.
• Current productivity still well below that in relatively high productivity period of 1978-1993; still in the low productivity period.
• Based on the results of the simulations, exploitation rates exceeding 30% suggested there is lower than a 50% probability of achieving the short term conservation objective of 20,000 spawners (3-year geometric mean).
• IFMP objective: The objective for Interior Fraser River coho (including Thompson River coho) is to limit the Canadian exploitation rate to 16% or less for the 2014 season only.
• 2014 forecast return for the Interior Fraser coho aggregate was 49,472 (CI of 31,477 to 77,754).
• Taking into account the 2014 ER limit, forecast, and abundance of wild spawners in recent years, the projected 3-year geometric mean (2012-2014) escapement was expected to meet or exceed the longer term recovery objective (i.e. 40,000 coho), even for returns at low end of the 2014 forecast range.

38
2014 Coho AssessmentPre-season and In-season Assessment of fishery impacts:
• Interior Fraser coho fishing mortality is estimated pre-season and in-season using a series of models that integrate assumptions about anticipated coho encounters, fishing effort levels, estimates of proportion of Interior Fraser River coho stocks within the total encounters based on past data, and average release mortality rates.
• There are two primary models used domestically:
• Marine fisheries - Spreadsheet Model
• Fraser River fisheries - Decay Model
• The final in-season IFR coho exploitation rate is 10.9%
First Nations 3.0%FSC 1.7%
EO and Demo. 1.3%Commercial 4.1%Recreational 3.4%Test Fishery 0.4%
In-season Total 10.9%

39
2014 Coho Post Season Assessment
• Near final post season exploitation rate estimates will be completed in March 2015
• The post season exploitation rate estimate is developed from the same models mentioned previously but using any actual information on encounter rates (kept and released) and fishing effort collected during the fishing season.
• Timelines for the availability of data required:
• Catch- February
• Escapement- February
• DNA analysis: Independent exploitation rate for marine fisheries- February
• Based on preliminary estimates of IFR coho spawner abundance (approx. 15K-20K), the 3-year geometric mean (2012-2014) spawner abundance is in the range of 36K to 40K. For comparison, the conservation strategy recovery objectives are 20K (short term) and 40K (long term).

40
The End