2014 energy benchmarking report - minneapolis
TRANSCRIPT
February 2016
2014 Energy Benchmarking Report
Cit
y of
Min
neap
olis


ACKNOWLEDGEMENTSCollecting the data for this report relied on the time and expertise of staff from various city departments and partnership with other public agencies and nonprofit organizations. Here we acknowledge those who provided assistance and expertise in gathering, completing, and assessing the accuracy of building energy and water data for the benchmarking ordinance.
Center for Energy and the Environment
Jenny Edwards
Neal Ray
Ashley Robertson
Katie Jones Schmitt
Lester Shen
Judy Thommes
Hennepin County
Leah Hiniker
Minneapolis Finance & Property Services
Brian Millberg
Minneapolis Health Department
Patrick Hanlon
Nadia Khan
Jenni Lansing
Minneapolis Park & Recreation Board
Jennifer Ringold
Minneapolis Public Schools
David Opoien
Minneapolis Sustainability
Gayle Prest
Brendon Slotterback
Minnesota Pollution Control Agency
Laura Millberg
More information on the Commercial Building Rating and Disclosure Policy available at: www.ci.minneapolis.mn.us/environment/energy/
Please email any questions about this report to: [email protected]
Downtown Minneapolis and the Stone Arch Bridge by Kent Landerholm licensed under CC BY 2.0

5
Tab
le o
f Con
tent
s
TABLE OF CONTENTS
Executive Summary................................................................................... 6
Background on Minneapolis Benchmarking Policy..................................... 8
Building Characteristics............................................................................. 11
Minneapolis Benchmarking Results...........................................................
National Benchmarking Results Comparison.............................................
Driving Efficiency Actions with Benchmarking Data...................................
End Notes.................................................................................................
23
25
15
22
AppendicesAppendix A: Results for Individual Private Buildings ≥100,000 ft2...................................Appendix B: Results for Individual Public Buildings.........................................................Appendix C: Glossary of Terms........................................................................................
262734

6
Exec
utiv
e Su
mm
ary
EXECUTIVE SUMMARY
A central strategy for meeting the City of Minneapolis climate action goals is to drive high building performance in the commercial market through energy and water benchmarking and disclosure. This third annual report summarizes the data collection activities, benchmarking results, and analysis for the city’s largest public and private commercial buildings based on building data submissions through August 31, 2015.
Commercial and industrial energy use represents 47% of greenhouse gas emissions in Minneapolis. Energy use is a significant source of greenhouse gas emissions, and also the largest controllable operational cost in buildings. The crucial first step in addressing and managing energy use is understanding building energy performance. In 2013, Minneapolis adopted the commercial building benchmarking and disclosure policy (ordinance 47.190) requiring public buildings greater than 25,000 square feet, and private commercial buildings 50,000 square feet and above, to report energy and water performance data to the City annually via the Environmental Pollution Agency’s ENERGY STAR Portfolio Manager. This policy was among a set of strategies laid out in the Minneapolis Climate Action Plan for improving energy efficiency and reducing greenhouse gas emissions.
Building energy disclosure is intended to increase both building owner and public awareness of building energy performance and then, through increased transparency, the market will spur action to increase efficiency. Greater energy efficiency provides tremendous benefits for Minneapolis building owners, occupants, and the community, including lowered energy costs, increased property values, enhanced building comfort, and reduced air pollution.
Key Findings Data Quantity and Quality Improved. Training and outreach strategies were effective as the private building response rate reached 90% by the 2015 disclosure deadline of August 31. Responses for the largest private buildings (100,000+ ft2) reached 100% by the end of 2015. In addition, data quality improved by 16% in the largest private buildings as benchmarking staff established and promoted clear energy use thresholds to determine compliance. This helped the percentage of compliant buildings jump from 75% in 2013 to 91% in 2014. Data quality was also high for first-time reporting buildings as 84% of buildings sized between 50,000 and 100,000 ft2 had sufficient data quality to be compliant.
Public Schools Renewed Focus. In the three years the Minneapolis Public School district has participated in the City’s benchmarking program, there has been a renewed focus on whole building energy performance monitoring. This has resulted in notable improvements to the accuracy of their 57 buildings. The district is also seeking to highlight success by investigating ENERGY
Total Buildings Analyzed
429
% of City’s Total Commercial Area
50%
Median ENERGY STAR Score
74
Response Rate
90+%
Figure 1. Community-wide greenhouse gas emission inventory, 2014

7
Exec
utiv
e Su
mm
ary
STAR certification for eligible school buildings and sharing results of their achievements.
Benchmarked Buildings’ Footprint Identified. In total, 17% of city-wide greenhouse gas emissions are represented by the 429 buildings analyzed in this report. Efficiency improvements in this small number of buildings could substantially reduce city-wide emissions.
Energy Performance Trended Positive. In general, the Minneapolis large commercial building stock performs better than the national average, and there are indications that energy efficiency has improved over the program time period. A median ENERGY STAR score of 74 shows that almost half of the scores are above the ENERGY STAR certification-qualifying threshold of 75. Looking at trends in public buildings, preliminary three-year analysis showed a 7% reduction in total weather-normalized energy use intensity. Greatest Savings Opportunities Identified in Offices, Hospitals, and Worship Facilities. Offices have the greatest aggregate potential for total energy and greenhouse gas emissions savings. Representing nearly 40% of benchmarked square footage and 35% of total energy consumed, improvements by each office building could have a significant impact. Hospitals, medical offices, and worship facilities have the largest opportunity for individual improvement. The median ENERGY STAR score for these properties of 44, 46, and 45 respectively fall below the national median of 50, thereby indicating a large potential for energy savings. Hospitals in particular could provide substantial emissions reductions as they consume the second highest percentage of 12% of total energy by property type.
Looking AheadMotivating Efficiency Improvements through Recognition. Minneapolis competes on a global scale to attract business, and increasingly companies are adding sustainable spaces with high energy efficiency and correspondingly low operating costs to their criteria. To make high-performing buildings more visible and motivate others to improve performance, the benchmarking team, through funding from the Minnesota Pollution Control Agency, is providing grants for buildings to receive nationally-recognized ENERGY STAR certification. Advancing the Minneapolis Building Energy Challenge. The Minneapolis Building Energy Challenge provides a platform for buildings to compete on a city level to reduce their greenhouse gas emissions 15% by 2020. By accepting the challenge to reduce emissions
through energy efficiency measures, a median 120,000 ft2 building would cut nearly 1,000 metric tons of greenhouse gas emissions measured in carbon dioxide equivalence (CO2e) and $52,000 in energy costs. If all buildings joined the challenge, the city would see reductions of almost 120,000 metric tons of CO2e and save more than $24 million in energy costs annually.
Leveraging the Clean Energy Partnership. The partnership between the City and its two utilities, Xcel Energy and CenterPoint Energy, provides a unique approach to help the City reach its Climate Action Plan and Energy Vision for 2040 goals, which include reducing energy costs and greenhouse gas emissions. Through their collaborative relationship, Xcel Energy developed the Xcel Benchmarking Tool facilitating automatic electric data transfers, the utilities share data on participation in their conservation programs and the City shares building stock information. The partnership also provides unique opportunities to leverage the utilities’ expertise in utilizing existing and piloting new conservation programs with buildings identified from the benchmarking data. Facilitating Greater Market Uptake of Transparent Building Performance Data. Benchmarking and disclosure makes previously unknown building performance transparent, thereby allowing owners and managers to compare their building to peer buildings and compete in the marketplace using new metrics. The City is exploring ways of making benchmarking information more accessible to and usable by building owners and managers through digital mapping and other means.
Completing the Benchmarking Policy Phase-in. 2016 will bring the phase-in process of the bench-marking policy to an end with the final group of buildings set to publicly disclose data by the end of the summer. This will mark the start of full building performance transparency for large com-mercial buildings – an important piece of market information to drive energy efficiency in the city.
$52,000Savings
15% CO2Reduction
Figure 2. Potential savings from a median building achieving the building energy challenge
8
Bac
kgro
und
on
th
e M
inn
eap
olis
Bui
ldin
g B
ench
mar
kin
g P
olic
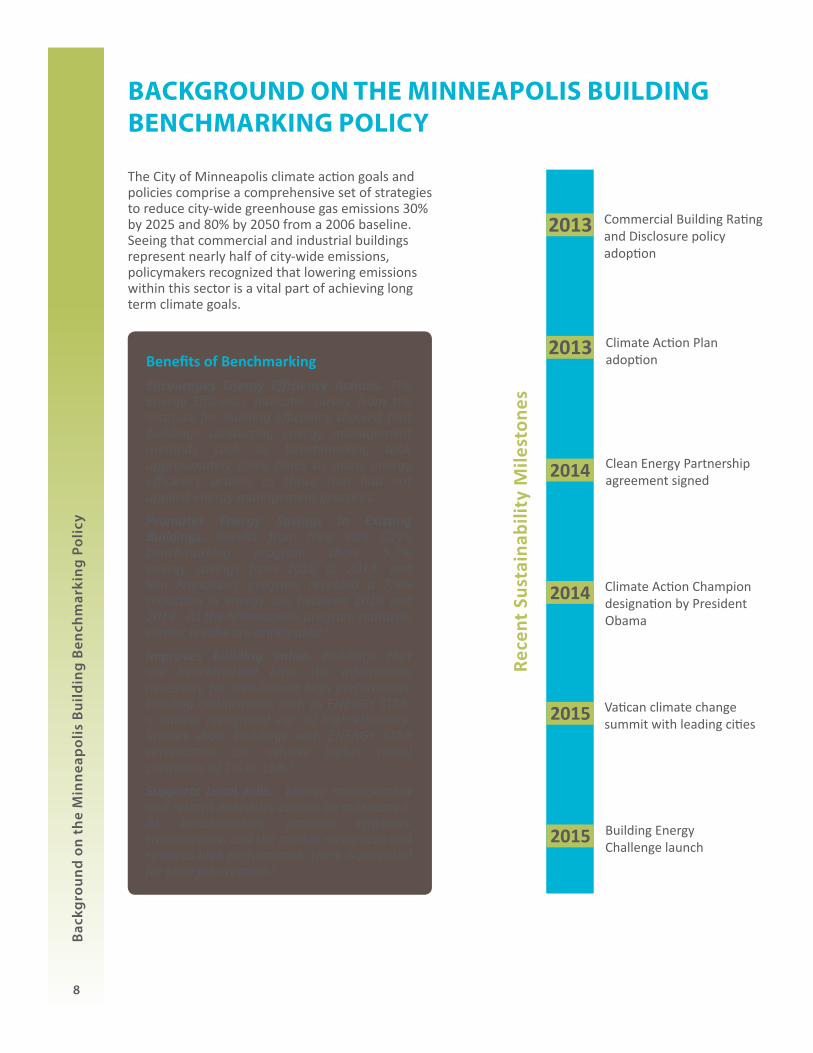
yBACKGROUND ON THE MINNEAPOLIS BUILDING BENCHMARKING POLICY
The City of Minneapolis climate action goals and policies comprise a comprehensive set of strategies to reduce city-wide greenhouse gas emissions 30% by 2025 and 80% by 2050 from a 2006 baseline. Seeing that commercial and industrial buildings represent nearly half of city-wide emissions, policymakers recognized that lowering emissions within this sector is a vital part of achieving long term climate goals.
Benefits of BenchmarkingEncourages Energy Efficiency Actions. The Energy Efficiency Indicator survey from the Institute for Building Efficiency showed that buildings conducting energy management methods such as benchmarking took approximately three times as many energy efficiency actions as those that had not applied energy management practices.1
Promotes Energy Savings in Existing Buildings. Results from New York City’s benchmarking program show 5.7% energy savings from 2010 to 2013, and San Francisco’s program revealed a 7.9% reduction in energy use between 2010 and 2014. As the Minneapolis program matures, similar results are anticipated.2
Improves building value. Buildings that are benchmarked have the information necessary for well-known high performance building certifications such as ENERGY STAR, a market recognized sign of high efficiency. Studies show buildings with ENERGY STAR certification can achieve higher rental premiums of 2% to 13%.3
Supports Local Jobs. Energy management and retrofit industries cannot be outsourced. As benchmarking provides efficiency transparency, and the market recognizes and rewards high performance, there is potential for local job creation.4
Rece
nt S
usta
inab
ility
Mile
ston
es
Commercial Building Rating and Disclosure policy adoption
Climate Action Plan adoption
Clean Energy Partnership agreement signed
Climate Action Champion designation by President Obama
Vatican climate change summit with leading cities
Building Energy Challenge launch

9
Bac
kgro
und
on
th
e M
inn
eap
olis
Bui
ldin
g B
ench
mar
kin
g P
olic
y
The Minneapolis Climate Action Plan adopted in 2013 includes a goal to reduce the energy use of commercial and industrial buildings 20% by 2025, and mandatory commercial building energy benchmarking is a foundational strategy to achieve those energy efficiency targets. The Minneapolis commercial building benchmarking policy is covered by ordinance 47.190, which was adopted unanimously by the Minneapolis City Council in 2013. Private and public commercial buildings must annually benchmark their energy and water use and report this information to the City. Minneapolis was the first city in the Midwest to adopt a benchmarking and disclosure policy, and the 7th nationally, placing the City squarely in the vanguard among cities and states nationally.
The purpose of the ordinance is to use market forces – not performance or design mandates – to motivate building owners and managers to invest in energy and water efficiency improvements. Importantly, Minneapolis’ policy includes public disclosure of annual benchmarking results. This is intended to increase building owner, tenant, and public awareness of building energy and water use, allow building managers to see how they compare across the population, and drive targeted utility and energy service provider outreach to buildings with the largest opportunity for energy and water savings.
Figure 3. U.S. building benchmarking and transparency policies

What is compliance?Buildings comply with the benchmarking ordinance by submitting either an approved exemption or data submission. Data submissions must be of high quality to be valuable in motivating energy actions among building managers. Though an audit is an effective method used by other benchmarking cities for data verification, this requirement is not part of the Minneapolis policy. Instead, buildings must pass basic data quality standards by including the following:
• Electricity > 0 • EUI > 25 kBtu/ft2 and < 400 ft2
• Heating fuel > 0 • Area < +/- 25% of tax assessor value
• Water > 0 • Building and Property IDs
Buildings that pass basic data checks are deemed compliant. Submissions that fail these checks are deemed partially compliant and are not included in report analysis. Buildings not in compliance by year two receive citations and fines.
10
Bac
kgro
und
on
th
e M
inn
eap
olis
Bui
ldin
g B
ench
mar
kin
g P
olic
yPolicy OverviewOrdinance 47.190 requires private commercial buildings 50,000 square feet and larger, and public buildings 25,000 square feet and larger, to be benchmarked, and the information reported to the City. The ordinance applies only to commercial buildings that are more than 50% occupied during a reporting year. New construction with certificate of occupancy issued less than two years prior are exempt, as are multifamily buildings, industrial buildings, and buildings that are experiencing qualifying financial distress Although not required, the City of Minneapolis sought partnerships with Hennepin County, the Minneapolis Park & Recreation Board, and the Minneapolis Public Schools, of which all voluntarily submitted benchmarking results for many of their buildings.
The ordinance phased in benchmarking and disclosure over a four-year period, starting in 2013 with public buildings. After public buildings, the largest commercial buildings in the city (sized 100,000 ft2 and above) made their initial submissions in 2014 for calendar year 2013 performance. Medium-sized commercial buildings (50,000-100,000 ft2) followed suit in 2015 for calendar year 2014 performance. Data
Building Category 2013 2014 2015 2016Public over 25,000 ft²
Private over 100,000 ft²Private 50,000-99,999 ft² indicates years in which buildings are required to benchmark and report
indicates years in which benchmarking data is publicly disclosed
Figure 4. Benchmarking and disclosure phase-in schedule
are not publicly disclosed until the second year of reporting for each of the two private building groups. By 2016, the policy phase-in for public and private buildings will be complete, and benchmarking and disclosure will continue for all building categories each year thereafter.
Benchmarked data is reported to the City via the Environmental Protection Agency’s ENERGY STAR Portfolio Manager software platform. This software analyzes whole property performance using simple metrics such as energy use intensity, a measure of energy use normalized over the building area, and the ENERGY STAR score, a 1 to 100 performance rating from low to high efficiency.

37%
53%
7%
7%
6%
7%
7%
6%
2%
4%
1%
4%
5%
3%
6%
2%
5%
2% 22%
11%
0%
10%
20%
30%
40%
50%
60%
70%
80%
90%
100%
% of Total Building Count % of Total Building Area
Other
Hospital
Retail School Worship
Property less than 3%
Parking
Hotel
Mixed Use
Office
11
Bui
ldin
g C
har
acte
rist
ics
BUILDING CHARACTERISTICS
The 429 buildings analyzed in this report include 180 private buildings greater than 100,000 ft2
in size, 78 private buildings between 50,000 and 99,999 ft2, and 258 private buildings and 169 pubic buildings, which are owned by the City of Minneapolis, Hennepin County, Minneapolis Public Schools, and Minneapolis Park and Recreation Board.
Among both types of buildings, offices make up the greatest percentage of buildings in the report at 25%, and also represent the largest building type by area at 39% of the benchmarked buildings by property type. The second most common property type is K-12 Schools. However, by square footage parking ramps represent the second largest property type by total area.
Only 57% of buildings could receive an ENERGY STAR score, since scores are only available for 21 out of the more than 80 property types on record in Portfolio Manager.
Building Age. Benchmarked buildings were built between the years 1881 and 2012. The median build year is 1972 with the majority having been built in the later part of the 20th century.
Figure 6. Property type composition of benchmarked buildings by count and building area
Figure 5. Count of buildings with compliant submissions

12
Bui
ldin
g C
har
acte
rist
ics
Building Location. Geographically, the majority of benchmarked buildings are concentrated downtown, the City’s commercial core. The bulk of those are private buildings greater than 100,000 ft2. Medium-sized private buildings (50,000-99,999 ft2 in area) are common in neighborhoods in and close to downtown. Since many neighborhoods contain a park, a school, or both, public buildings are more evenly dispersed throughout the city.
Figure 7. Map of benchmarked buildings by category
13
Bui
ldin
g C
har
acte
rist
ics
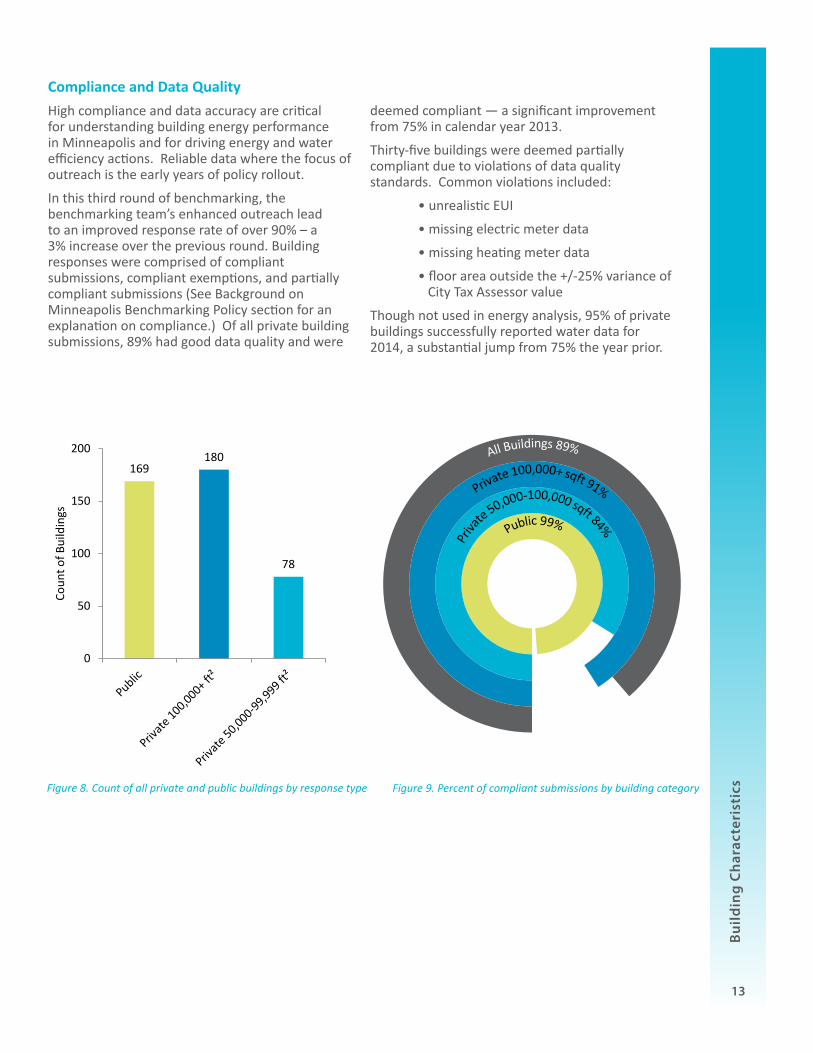
Compliance and Data QualityHigh compliance and data accuracy are critical for understanding building energy performance in Minneapolis and for driving energy and water efficiency actions. Reliable data where the focus of outreach is the early years of policy rollout.
In this third round of benchmarking, the benchmarking team’s enhanced outreach lead to an improved response rate of over 90% – a 3% increase over the previous round. Building responses were comprised of compliant submissions, compliant exemptions, and partially compliant submissions (See Background on Minneapolis Benchmarking Policy section for an explanation on compliance.) Of all private building submissions, 89% had good data quality and were
deemed compliant — a significant improvement from 75% in calendar year 2013.
Thirty-five buildings were deemed partially compliant due to violations of data quality standards. Common violations included:
• unrealistic EUI
• missing electric meter data
• missing heating meter data
• floor area outside the +/-25% variance of City Tax Assessor value
Though not used in energy analysis, 95% of private buildings successfully reported water data for 2014, a substantial jump from 75% the year prior.
All BuildingsPrivate 100,000+ sqft
Private 50,000-100,000 sqftPublic
Figure 9. Percent of compliant submissions by building category
169180
78
0
50
100
150
200
Coun
t of B
uild
ings
Figure 8. Count of all private and public buildings by response type

Helpline calls 425
Helpline emails 630
Workshops 2
GoToMeetings 41
14
Bui
ldin
g C
har
acte
rist
ics
Outreach and TrainingSuccess of the benchmarking program depends on building owners’ and managers’ awareness of the ordinance and of the process to benchmark building energy. To that end, the City of Minneapolis partnered with the Center for Energy and Environment (CEE) on outreach and training to drive high data quality. Taking lessons from previous reporting rounds, the benchmarking program team strove to improve participation and data quality by streamlining communication, expanding outreach modes, and simplifying the helpline process. More specifically, attention was directed to enhance websites, develop newsletters and scorecards, publish data quality standards, and provide online meeting screen sharing to augment helpline assistance. Building owners received three mailed notices in the first half of 2015, informing them of the June 1st reporting deadline as well as directing them to training resources. In addition, the outreach team developed news material for community distribution and worked with Minneapolis Building Operators and Managers Association, Lake Street Council, and other neighborhood business associations to include announcements in their communications. Buildings benchmarking for the second time (≥100,000ft2 in size) also received email notices of the deadline and available training.The team conducted two 2-hour in-depth training workshops in the months prior to the deadline, offered online user guides, and operated a helpline for email and phone questions. When answering technical questions, CEE often used GoToMeeting, an online, screen-sharing platform, which provided a more efficient and effective communication mode. Buildings requiring additional assistance were directed to RETAP (Retired Technical Assistance Program, administered by the Minnesota Pollution Control Agency), which assisted 50 buildings in total.Future outreach and training will continue to emphasize data quality standards, and the team will continue to refine its data cleansing processes. An expected source for data improvements is Xcel Energy’s new benchmarking portal, which provides streamlined methods for automatic electric data collection into Portfolio Manager.
15
Min
nea
pol
is B
ench
mar
kin
g R
esul
ts
MINNEAPOLIS BENCHMARKING RESULTS
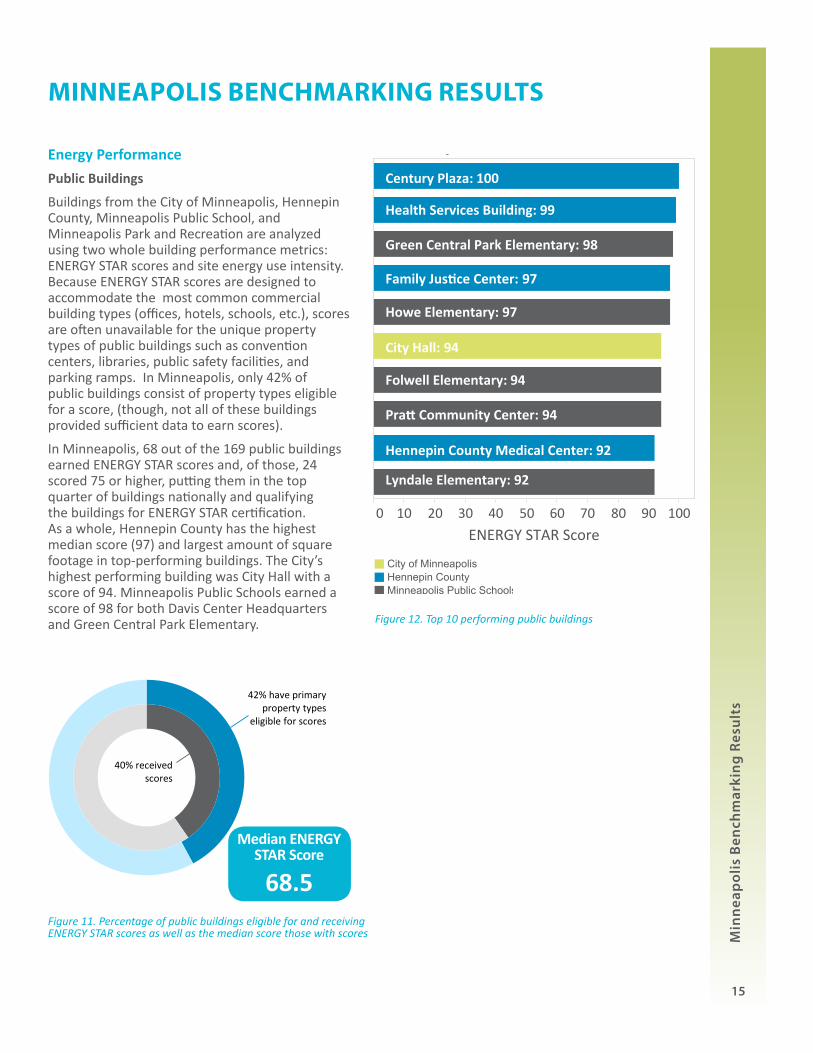
Energy PerformancePublic Buildings
Buildings from the City of Minneapolis, Hennepin County, Minneapolis Public School, and Minneapolis Park and Recreation are analyzed using two whole building performance metrics: ENERGY STAR scores and site energy use intensity. Because ENERGY STAR scores are designed to accommodate the most common commercial building types (offices, hotels, schools, etc.), scores are often unavailable for the unique property types of public buildings such as convention centers, libraries, public safety facilities, and parking ramps. In Minneapolis, only 42% of public buildings consist of property types eligible for a score, (though, not all of these buildings provided sufficient data to earn scores).
In Minneapolis, 68 out of the 169 public buildings earned ENERGY STAR scores and, of those, 24 scored 75 or higher, putting them in the top quarter of buildings nationally and qualifying the buildings for ENERGY STAR certification. As a whole, Hennepin County has the highest median score (97) and largest amount of square footage in top-performing buildings. The City’s highest performing building was City Hall with a score of 94. Minneapolis Public Schools earned a score of 98 for both Davis Center Headquarters and Green Central Park Elementary.
0 10 20 30 40 50 60 70 80 90 100ENERGY STAR Score
Lyndale Elementary: 92
Pratt Community Center: 94
Folwell Elementary: 94
Howe Elementary: 97
Green Central Park Elementary: 98
Hennepin County Medical Center: 92
Family Justice Center: 97
Health Services Building: 99
Century Plaza: 100
City Hall: 94
PublicTop10City of MinneapolisHennepin CountyMinneapolis Public Schools
Sum of ENERGY STAR Score for each PropertyName. Color shows details about Property Data Ad-ministrator. Details are shown for Property Name. Thedata is filtered on Category and ENERGY STARScore. The Category filter keeps Public. The ENERGYSTAR Score filter ranges from 90 to 100. The view isfiltered on Property Name, which excludes Davis Cen-ter (District Headquarters).
Figure 12. Top 10 performing public buildings
42% have primaryproperty types
eligible for scores
40% received scores
Median ENERGY STAR Score
68.5Figure 11. Percentage of public buildings eligible for and receiving ENERGY STAR scores as well as the median score those with scores

Recommissioning Leads to Great Savings at Hennepin CountyJust as a healthy person eats right and exercises, facilities staff at Hennepin County strive to operate their buildings as efficiently as possible. Periodically though, even a healthy person needs a check-up to make sure all systems are running optimally and address any hidden issues. A building check-up, called retrocommissioning, is precisely what Hennepin County did at the aptly-named 1800 Chicago building.
For existing buildings, retrocomissioning seeks to “retune” the building to match the space uses and needs of today’s occupants so as to improve performance. During the assessment at 1800 Chicago, Hennepin County’s team found many opportunities for boosting efficiency that summed to big energy savings: leaky steam traps were replaced, boiler controls managing temperature, pumps, and run-time were updated, and the building automation system was upgraded, among other adjustments. As a result of these changes, the building reduced its annual weather-normalized energy use 36% from 2012 to 2014.
Just as a person’s lifestyle change can impact their health, changes in building use, scheduling, and equipment longevity impact building performance. Hennepin County’s retrocommissioning of 1800 Chicago shows just how advantageous a checkup can be.
Organization Hennepin County
Address 1800 Chicago Ave
Primary property type Office
kBtu reduction 4,493,016
% savings 36%
2014 Site weather-normalized EUI 79.3
2014 ENERGY STAR score 87
16
Min
nea
pol
is B
ench
mar
kin
g R
esul
ts

17
Min
nea
pol
is B
ench
mar
kin
g R
esul
ts
Minneapolis Public Schools have 56 properties with scores, and also the greatest range in performance, from Jordan Park School with a score of 8 to Green Central Park Elementary and the Davis Center with scores of 98. The median score at Minneapolis Public Schools is 68. No Minneapolis Park and Recreation Board buildings were eligible to receive scores.
Results for public building site energy use intensity (EUI), shown below, include all 169 public buildings. Public building site EUIs range widely from 7 kBtu/ft2 to 340 kBtu/ft2. As expected, the lowest energy users on a square foot basis are parking garages and ramps, as they are typically not heated or cooled. Low users with conditioned spaces include Century Plaza (34 kBtu/ft2), Lyndale Elementary (47 kBtu/ft2), and City Hall (65.7 kBtu/sf2). On the other end, the highest energy users per square foot are the City’s water treatment and distribution campus, the County’s Forensic Sciences Building, and Hennepin County Medical Center (247 and 182 kBtu/ ft2 respectively), the Minneapolis Park and Recreation Board’s Parade Ice - North and South (232 and 202 kBtu/ ft2 respectively), and Minneapolis Public School’s Hiawatha Elementary (226 kBtu/ft2).
Figure 13. Cumulative public building property type area by ENERGY STAR score of 68 public buildings
Figure 14. Cumulative public building property type area by energy use intensity (kBtu/ft2) of 169 public buildings
18
Min
nea
pol
is B
ench
mar
kin
g R
esul
ts
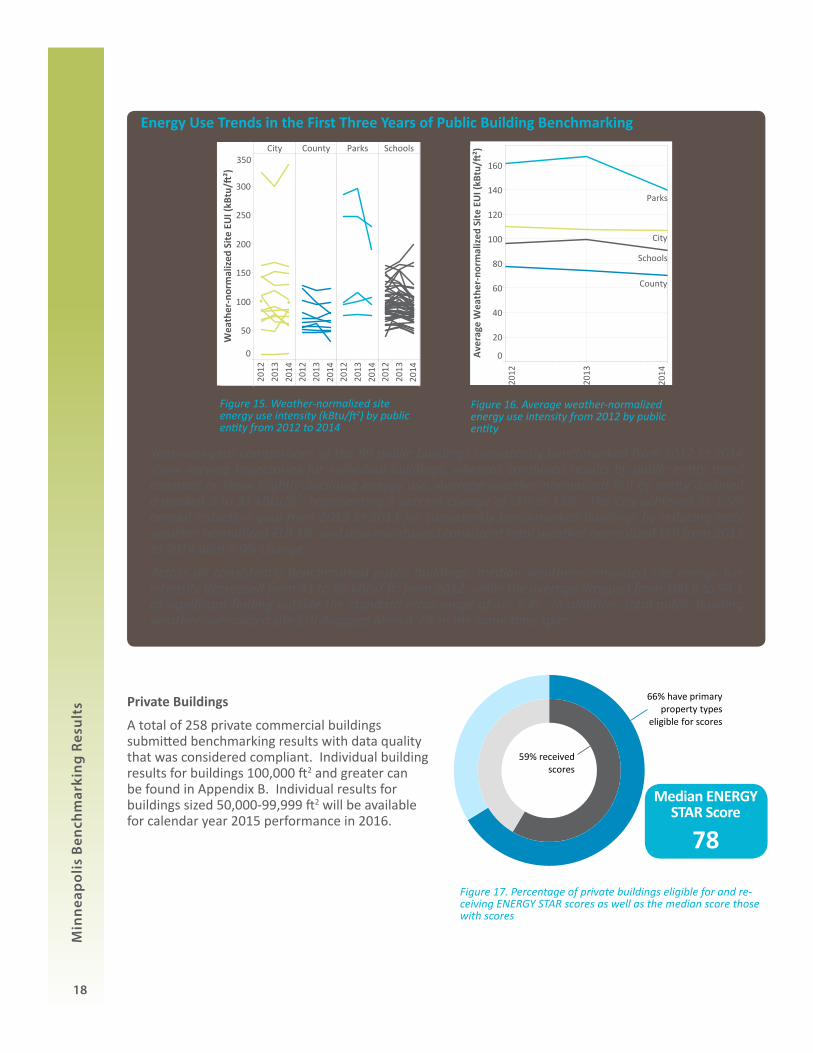
Energy Use Trends in the First Three Years of Public Building Benchmarking
2012
2013
2014
0
20
40
60
80
100
120
140
160
Aver
age
Wea
ther
-nor
mal
ized
Site
EUI
(kBt
u/�²
)
Parks
City
Schools
County
City County Parks Schools
2012
2013
2014
2012
2013
2014
2012
2013
2014
2012
2013
2014
0
50
100
150
200
250
300
350
Wea
ther
-nor
mal
ized
Site
EUI
(kBt
u/�²
)
Figure 15. Weather-normalized site energy use intensity (kBtu/ft2) by public entity from 2012 to 2014
2012
2 013
2014
0
20
40
60
80
100
120
140
160
Aver
age
Wea
ther
-nor
mal
ized
Site
EUI
(kBt
u/�²
)
Parks
City
Schools
County
City County Parks Schools
2012
2013
2014
2012
2013
2014
2012
2013
2014
2012
2013
2014
0
50
100
150
200
250
300
350
Wea
ther
-nor
mal
ized
Site
EUI
(kBt
u/�²
)
Figure 16. Average weather-normalized energy use intensity from 2012 by public entity
Private Buildings
A total of 258 private commercial buildings submitted benchmarking results with data quality that was considered compliant. Individual building results for buildings 100,000 ft2 and greater can be found in Appendix B. Individual results for buildings sized 50,000-99,999 ft2 will be available for calendar year 2015 performance in 2016.
66% have primaryproperty types
eligible for scores
59% received scores
Median ENERGY STAR Score
78
Year-over-year comparisons of the 99 public buildings consistently benchmarked from 2012 to 2014 show varying trajectories for individual buildings, whereas combined results by public entity trend constant or show slightly declining energy use. Average weather-normalized EUI by entity declined a modest 3 to 21 kBtu/ft2, representing a percent change of 3% to 13%. The City achieved its 1.5% annual reduction goal from 2012 to 2013 for consistently benchmarked buildings by reducing total weather normalized EUI 3%, and also maintained consistent total weather normalized EUI from 2013 to 2014 with a 0% change.
Across all consistently benchmarked public buildings, median weather-normalized site energy use intensity decreased from 91 to 86 kBtu/ ft2 from 2012, while the average dropped from 100.6 to 94.1 (a significant finding outside the standard error range of +/- 5.4). In addition, total public building weather-normalized site EUI dropped almost 7% in the same time span.
Figure 17. Percentage of private buildings eligible for and re-ceiving ENERGY STAR scores as well as the median score those with scores
19
Min
nea
pol
is B
ench
mar
kin
g R
esul
ts
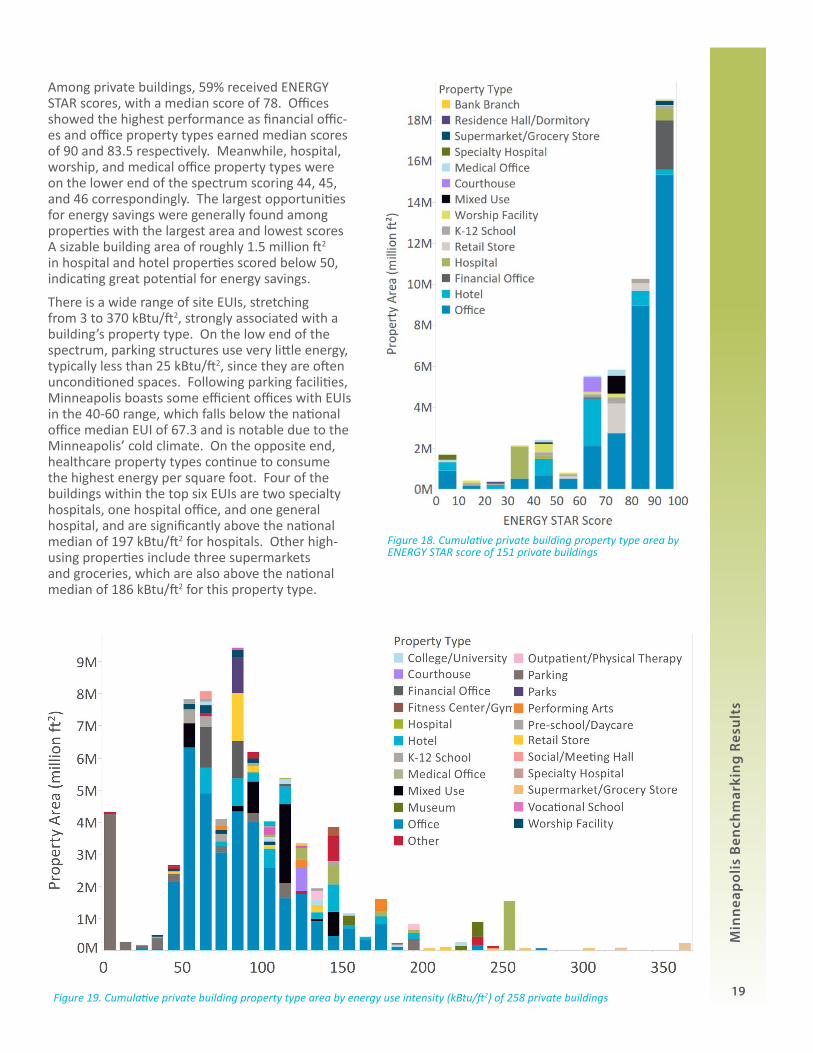
Among private buildings, 59% received ENERGY STAR scores, with a median score of 78. Offices showed the highest performance as financial offic-es and office property types earned median scores of 90 and 83.5 respectively. Meanwhile, hospital, worship, and medical office property types were on the lower end of the spectrum scoring 44, 45, and 46 correspondingly. The largest opportunities for energy savings were generally found among properties with the largest area and lowest scores A sizable building area of roughly 1.5 million ft2 in hospital and hotel properties scored below 50, indicating great potential for energy savings.
There is a wide range of site EUIs, stretching from 3 to 370 kBtu/ft2, strongly associated with a building’s property type. On the low end of the spectrum, parking structures use very little energy, typically less than 25 kBtu/ft2, since they are often unconditioned spaces. Following parking facilities, Minneapolis boasts some efficient offices with EUIs in the 40-60 range, which falls below the national office median EUI of 67.3 and is notable due to the Minneapolis’ cold climate. On the opposite end, healthcare property types continue to consume the highest energy per square foot. Four of the buildings within the top six EUIs are two specialty hospitals, one hospital office, and one general hospital, and are significantly above the national median of 197 kBtu/ft2 for hospitals. Other high-using properties include three supermarkets and groceries, which are also above the national median of 186 kBtu/ft2 for this property type.
Figure 19. Cumulative private building property type area by energy use intensity (kBtu/ft2) of 258 private buildings
Figure 18. Cumulative private building property type area by ENERGY STAR score of 151 private buildings

20
Min
nea
pol
is B
ench
mar
kin
g R
esul
ts
Energy Use Trends in the First Two Years of Private Building BenchmarkingPrivate commercial buildings greater than 100,000 ft2 have now reported for two years, thereby providing a first opportunity to explore the performance trends of the largest private buildings in Minneapolis. Median ENERGY STAR scores dipped slightly from 82 to 80, while median site EUI and weather-normalized Site EUIs rose from 89 to 91 and 86 to 88 kBtu/ft2 respectively. Overall, trend line analysis of weather normalized EUI indicates steady performance from 2013 to 2014, thereby providing a consistent baseline before the effect of performance transparency is underway.
Since the reporting date lags the performance year, building owners and managers had little opportunity to react to the benchmarking results and improve performance in calendar year 2014. In addition, since disclosure did not begin until August 2015, building owners had not yet experienced the full roll-out of the benchmarking policy. The full market cycle of understanding benchmarking results and then planning, making decisions, and investing in efficiency projects will require time.
Other FindingsYear Built
The 2014 data show no clear relationship between a building’s age and how well it performs. The finding is consistent across all buildings as well as within specific property types such as offices. It is furthermore comparable with analysis from 2013 and with other benchmarking cities. Asset quality and condition are often associated with age, but the relationship is not entirely causal. These factors, along with an asset’s current operation, may influence energy performance more heavily than age alone.
Figure 21. Energy performance by year Built in office buildings
2013 2014
Median ENERGY STAR Score 82 80
Median Site EUI (kBtu/ft2) 89 91
Median Weather Normalized Site EUI (kBtu/ft2) 86 88
1880
1890
1900
1910
1920
1930
1940
1950
1960
1970
1980
1990
2000
2010
0
20
40
60
80
100
Med
ian
Site
EUI
(kBt
u/�²
)
0
20
40
60
80
100
Med
ian
ENER
GY S
TAR
Scor
e
Median ENERGY STAR ScoreMedian Site EUI (kBtu/�²)Figure 20. Median site EUI and ENERGY STAR score by decade
built in all buildings
1880
1890
1900
1910
1920
1930
1940
1950
1960
1970
1980
1990
2000
2010
0
20
40
60
80
100
Med
ian
Site
EUI
(kBt
u/�²
)
0
20
40
60
80
100
Med
ian
ENER
GY S
TAR
Scor
e
Median ENERGY STAR ScoreMedian Site EUI (kBtu/�²)

21
Min
nea
pol
is B
ench
mar
kin
g R
esul
ts
Fuel Types Serving Minneapolis Buildings
Minneapolis buildings are served by electricity, natural gas, and a district energy system in downtown that supplies steam and chilled water to many buildings. In addition, some institutional campuses run their own steam systems. The proportion of a given property’s energy use provided by these fuels, called the fuel mix, affects the energy costs and associated greenhouse gas emissions. As building managers look for energy savings opportunities, the fuel mix can inform which projects may be most effective at lowering utility spend and energy consumption.
Water Use
For buildings with usable data, median water use varied significantly by property type, where buildings with bathing and showering facilities have the highest water use per square foot. Minneapolis water intensity medians are below the national value for hospitals, medical facilities, and offices, and are higher than national medians in K-12 schools, retail stores, and worship facilities. Water use for Minneapolis Public Schools and the Minneapolis Park and Recreation Board were not analyzed due to a likely unit error and a lack of data respectively.
0 5 10 15 20 25 30 35 40 45 50
College/UniversityFitness Center/Health Club/Gym
HospitalHotel
K-12 SchoolMedical Office
Mixed UseOffice
ParkingRepair Services
Retail StoreWorship Facility
Minneapolis Water UseNational Water Use
Figure 23. Median water consumption normalized by area for most common property types (types with more than five buildings) and compared to national median values where available5
Figure 22. Average fuel type mix consumed of total site energy by the most common property type
0% 50% 100%
Worship Facility
Water Treatement
Retail Store
Repair Services
Parks
Parking
Other
Office
Mixed Use
Medical Office
K-12 School
Hotel
Hospital
Fitness Center/Gym
College/University
% Fuel Type Consumption
Prop
erty
Typ
e
Chilled Water Electricity Natural Gas Steam

22
Nat
ion
al B
ench
mar
kin
g R
esul
ts C
omp
aris
onNATIONAL BENCHMARKING RESULTS COMPARISON
Measured against seven cities6 with benchmarking ordinances, Minneapolis has by far the most intense heating season, which often demands higher energy consumption. However, energy metrics show that Minneapolis offices, hotels, and K-12 schools are relatively efficient in their climate with median site EUIs and ENERGY STAR scores similar to, and in some cases better than, those in other benchmarking cities.
SanFrancisco
Seattle PhiladelphiaWashingtonDC
New YorkCity
Chicago Boston Minneapolis0
10
20
30
40
50
60
70
80
90
Site
EUI
(kbt
u/�^
2)
0
1,000
2,000
3,000
4,000
5,000
6,000
7,000
8,000
9,000
Degr
ee D
ays
87
75
64
7875 73
79 84
CDD, DDsCDD, Metric
HDD, DDsHDD, Metric
Cooling degree days
Heating degree days
Median ENERGY STAR score Median Site EUI
Figure 24. Eight city comparison of energy performance and climate metrics of office buildings6,7
Offices
SanFrancisco
Seattle Philadelphia WashingtonDC
New YorkCity
Chicago Boston Minneapolis0
10
20
30
40
50
60
70
80
90
100
110
120
130
Site
EUI
(kbt
u/�^
2)0
1,000
2,000
3,000
4,000
5,000
6,000
7,000
8,000
9,000
Degr
ee D
ays
62
53
41 4238 37
44
66
DDType, Measure NamesCDD, DDsCDD, Metric
HDD, DDsHDD, Metric
Hotels
Figure 25. Eight city comparison of energy performance and climate metrics of hotels8
Seattle Philadelphia New YorkCity
Chicago Boston Minneapolis0
10
20
30
40
50
60
70
80
90
100
Site
EUI
(kbt
u/�^
2)
0
1,000
2,000
3,000
4,000
5,000
6,000
7,000
8,000
9,000
10,000
Degr
ee D
ays
92
83
66
53
54
53
CDD, DDsCDD, Metric
HDD, DDsHDD, Metric
K-12 Schools
Figure 26. Six city comparison of energy performance and climate metrics of K-12 schools8
Cooling degree days
Heating degree days
Median ENERGY STAR score Median Site EUI
Cooling degree days
Heating degree days
Median ENERGY STAR score Median Site EUI
23
Dri
vin
g E
ffic
ien
cy A
ctio
ns
wit
h B
ench
mar
kin
g D
ata
23
DRIVING ENERGY EFFICIENCY ACTIONS WITH BENCHMARKING DATA
The Minneapolis energy benchmarking program is focused on greater market visibility of building energy performance and, to that end, it is striving to make the information more available and easier to digest for building owners, managers, tenants, and the general public.
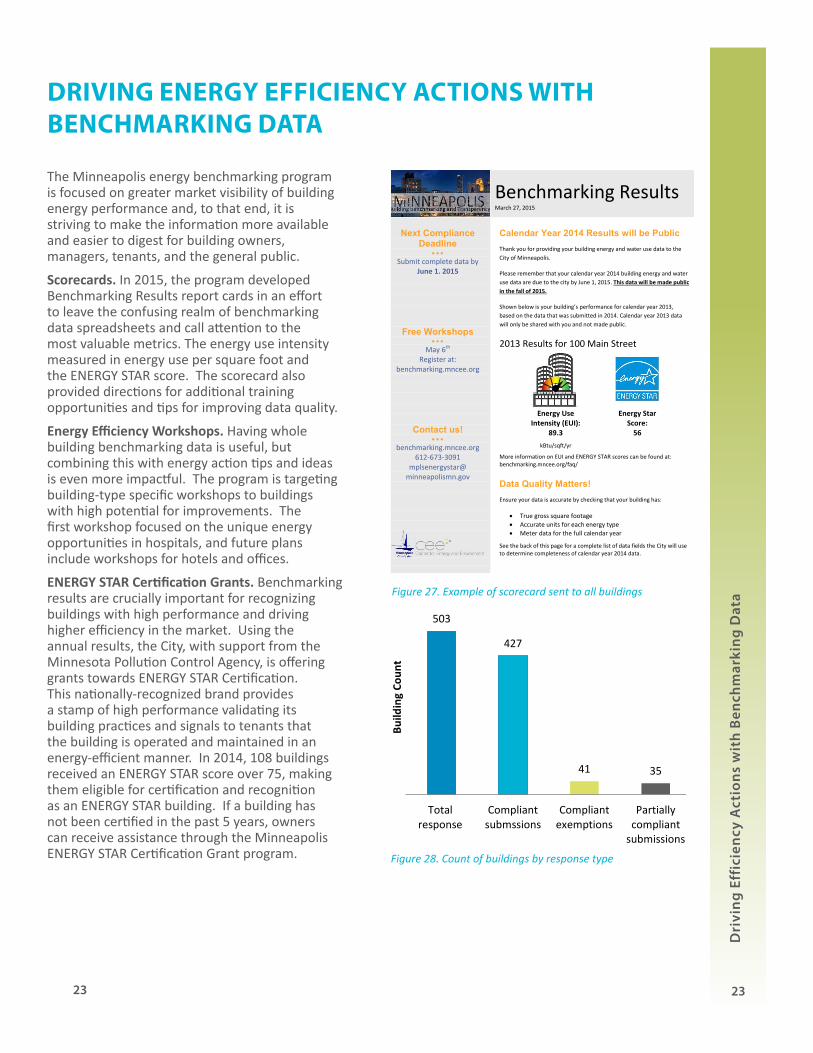
Scorecards. In 2015, the program developed Benchmarking Results report cards in an effort to leave the confusing realm of benchmarking data spreadsheets and call attention to the most valuable metrics. The energy use intensity measured in energy use per square foot and the ENERGY STAR score. The scorecard also provided directions for additional training opportunities and tips for improving data quality.
Energy Efficiency Workshops. Having whole building benchmarking data is useful, but combining this with energy action tips and ideas is even more impactful. The program is targeting building-type specific workshops to buildings with high potential for improvements. The first workshop focused on the unique energy opportunities in hospitals, and future plans include workshops for hotels and offices.
ENERGY STAR Certification Grants. Benchmarking results are crucially important for recognizing buildings with high performance and driving higher efficiency in the market. Using the annual results, the City, with support from the Minnesota Pollution Control Agency, is offering grants towards ENERGY STAR Certification. This nationally-recognized brand provides a stamp of high performance validating its building practices and signals to tenants that the building is operated and maintained in an energy-efficient manner. In 2014, 108 buildings received an ENERGY STAR score over 75, making them eligible for certification and recognition as an ENERGY STAR building. If a building has not been certified in the past 5 years, owners can receive assistance through the Minneapolis ENERGY STAR Certification Grant program.
Next Compliance Deadline
Submit complete data by
June 1. 2015
Free Workshops
May 6th
Register at: benchmarking.mncee.org
Contact us!
benchmarking.mncee.org 612-673-3091
mplsenergystar@ minneapolismn.gov
Calendar Year 2014 Results will be Public Thank you for providing your building energy and water use data to the City of Minneapolis.
Please remember that your calendar year 2014 building energy and water use data are due to the city by June 1, 2015. This data will be made public in the fall of 2015.
Shown below is your building’s performance for calendar year 2013, based on the data that was submitted in 2014. Calendar year 2013 data will only be shared with you and not made public.
2013 Results for 100 Main Street
Energy Use Intensity (EUI):
Energy Star Score:
89.3 56 kBtu/sqft/yr
More information on EUI and ENERGY STAR scores can be found at: benchmarking.mncee.org/faq/
Data Quality Matters! Ensure your data is accurate by checking that your building has:
True gross square footage Accurate units for each energy type Meter data for the full calendar year
See the back of this page for a complete list of data fields the City will use to determine completeness of calendar year 2014 data.
Benchmarking Results March 27, 2015
Figure 27. Example of scorecard sent to all buildings
503
427
41 35
Totalresponse
Compliantsubmssions
Compliantexemptions
Partiallycompliant
submissions
Build
ing
Coun
t
Figure 28. Count of buildings by response type

24
Dri
vin
g E
ffic
ien
cy A
ctio
ns
wit
h B
ench
mar
kin
g D
ata
Minneapolis Building Energy Challenge. Beyond communicating results, the program seeks to motivate buildings to improve energy efficiency. Launched in October 2015, the Minneapolis Building Energy Challenge asks individual buildings to reduce greenhouse gas emissions 15% by 2020 – numbers that support the City’s Climate Action Plan. Private and public commercial buildings from schools to malls to office buildings have signed up to accept the challenge and their success stories are celebrated in City communications. At the kick-off event at City Hall, the benchmarking team sought to show that high building energy efficiency is possible across any building type. Accordingly, the benchmarking team identified six high performing buildings from the benchmarking data and awarded them for their performance. All of the award winners had undergone significant energy efficiency work and served as great examples to inspire others.
However, recognition is impossible without public disclosure. As mid-size private buildings become the final building category to disclose benchmarking results in 2016, more opportunities will be available for comparing all large commercial buildings in the city, identifying buildings with large savings opportunities, and showcasing high performers. Going forward, the Minneapolis energy benchmarking program will continue developing methods to increase building performance transparency so that building managers may make informed decisions about the best energy, water, and cost saving opportunities in their buildings.
High Performing Building Award Winners:
• DeLaSalle High School • 33 South Sixth • Doubletree Hotel • Minnehaha Academy South
• Broadway Place West • Residence Inn City Center
Figure 30. Councilmember Elizabeth Glidden, Broadway Place West’s Matt O’Brien and Max Currie, Mayor Betsy Hodges, and Xcel Energy Regional Vice President Laura McCarten. Broadway Place West won the Building Energy Performance Award for lowest EUI (42 kbtu/ft/yr) for the business category
Figure 31. Broadway Place West, winner of the Building Energy Performance Award for lowest energy use intensity (42 kbtu/ft/yr) for the business category
Figure 29. Building Energy Challenge 15% greenhouse gas reduction goal from 2014 through 2020

25
END NOTES
1 Institute for Building Efficiency. (2012, June). 2012 Energy Efficiency Indicator: Global Results. Retrieved Jan. 2016, from Institute for Building Efficiency: http://www.institutebe.com/InstituteBE/media/Library/Resources/Energy%20Efficiency%20Indicator/2012-EEI-Global-Results-Executive-Summary.pdf2 US DOE. “New York City Benchmarking and Transparency Policy Impact Evaluation Report.” US Department of Energy. May 2015. http://energy.gov/sites/prod/files/2015/05/f22/DOE%20New%20York%20City%20Benchmarking%20snd%20Transparency%20Policy%20Impact%20Evaluation....pdf (accessed Jan 2016)3 SF Environment, ULI Greenprint Center. “San Francisco Existing Commercial Buildings Performance Report.” ULI.org. 2015. http://uli.org/wp-content/uploads/ULI-Documents/SFenergybenchmarkingreport.pdf (accessed Jan. 2016).4 IMT, Appraisal Institute, DC Dept of Energy & Environment. “High Performance Buildings and Property Value.” Institute for Market Transformation. Sept. 2015. http://www.imt.org/uploads/resources/files/LenderGuide_FINAL.pdf (accessed Nov. 2015).5 US EPA. (2012, June). Data Trends: Water Use Tracking. Retrieved January 1016, from ENERGY STAR Portfolio Manager: http://www.energystar.gov/ia/business/downloads/datatrends/DataTrends_Water_20121002.pdf?2003-40fb6 City of Boston Energy Reporting and Disclosure Ordinance: http://berdo.greenovateboston.org/#Analysis
2015 Chicago Energy Benchmarking Report: http://www.cityofchicago.org/city/en/progs/env/building-energy-benchmarking---transparency.html
New York City 2015 LL84 Energy and Water Data Disclosure (Data for Calendar Year 2014): http://www.nyc.gov/html/gbee/downloads/excel/2015_nyc_cy2014__ll84_disclosure_data.xlsx
Philadelphia Energy Benchmarking Report 2014: http://50.87.248.194/~phillbui/wp-content/uploads/2015/09/MOS_BnchMrkRprt_R5fin_FINAL.pdf
San Francisco Existing Commercial Buildings Performance Report 2010-2014: http://sfenvironment.org/download/san-francisco-existing-commercial-buildings-performance-report-20102014
Seattle Building Energy Benchmarking Analysis Report 2013 Data: http://www.seattle.gov/Documents/Departments/OSE/EBR-2013-report.pdf
Washington DC 2013 Private Building Benchmarking Dataset: http://doee.dc.gov/node/9703127 All data is from reporting year 2014 except for Seattle and Washington DC, which is from reporting year 2013.8 New York City K-12 school data includes private sector data only.9 All data is from reporting year 2014 except for Seattle and Washington DC, which is from reporting year 2013.
Photos Cited
Page 16. Google. (2014, Sept.). Google Maps. Retrieved from https://www.google.com/maps/place/1800+chicago/@44.9647726,-93.2625515,3a,75y,270.75h,90t/data=!3m7!1e1!3m4!1sBxKwmSVjJh5fuA1SsUwIeQ!2e0!7i13312!8i6656!4b1!4m2!3m1!1s0x0:0x93ba67354e16f56e!6m1!1e1
Page 24. LoopNet. (n.d.). Retrieved from 1300 Godward St. NE: http://www.loopnet.com/Listing/15098679/1300-Godward-St-NE-Minneapolis-MN/

26
APPENDIX A: GLOSSARY OF TERMS
ENERGY STAR Score
The 1-100 ENERGY STAR score was developed by the Environmental Protection Agency (EPA) and provides a metric for comparison with other similar buildings across the country. The score accounts for differences in climate, occupancy, and operating hours. A score of 50 represents median energy performance, while a score of 75 or better indicates a building is a top performer. The higher the score, the more efficient the building.
Energy Benchmarking
The process of comparing a building’s energy performance against a standard, to itself over time, and to similar proper-ties. ENERGY STAR Portfolio Manager was the software used to benchmark buildings in this report.
Energy Use Intensity (EUI)
The metric used for comparing buildings in Energy Star, EUI expresses a building’s energy use relative to its size. In this report it is expressed as kBtu/ft², and is calculated by taking the total energy consumed in a year (in kBtu, thousand brit-ish thermal units) and dividing it by the floor area of the building (in ft², square feet). The lower the kBtu/ft2, the lower the energy consumption.
Site EUI
Site EUI represents the amount of heat and electricity consumed by a building as reflected in utility bills. This is a rel-evant metric for facility managers to understand how a building’s energy use has changed over time. However, site EUI does not account for the environmental impacts of transmission and delivery of energy. Site energy sources for public buildings in this report include electricity, natural gas, chilled water, and steam.
Source EUI
Source EUI represents the total amount of raw fuel that is required to operate the building. Because it incorporates all transmission, delivery, and production losses, source EUI values are always greater than site EUI values.
Total GHG Emissions (MtCO2e)
The metric used in this report for greenhouse gas emissions represents a million metric tons of carbon dioxide equiva-lents. Equivalent CO2 (CO2e) is a universal standard measurement for greenhouse gasses such as and their ability to trap heat in the atmosphere. These greenhouse gasses include carbon dioxide, methane, nitrous oxide, and chloroflouro-carbons. Greenhouse gas emissions for buildings are calculated using the ENERGY STAR Portfolio Manager Methodology for Greenhouse Gas Inventory and Tracking Calculations.
Weather normalization
Energy use is adjusted to account year-to-year weather differences, allowing for comparison of a building to itself over time. Through this procedure, the energy in a given year is adjusted to express the energy that would have been con-sumed under 30-year average weather conditions.

27Appendices
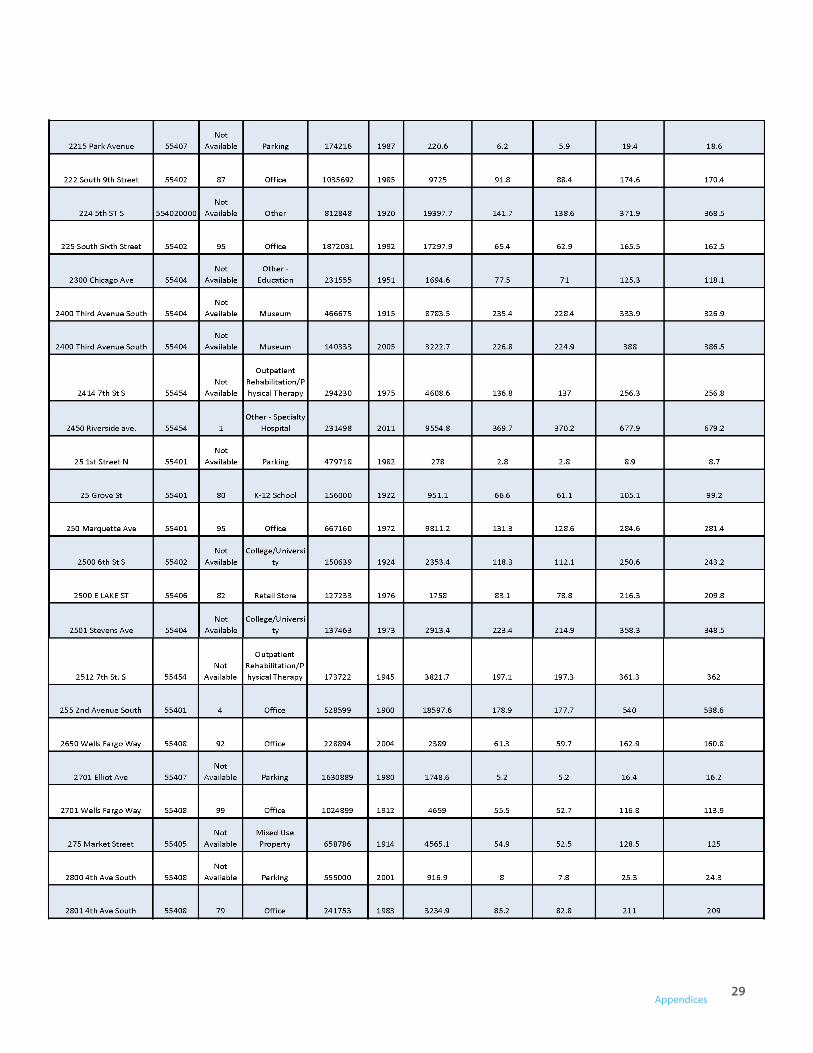
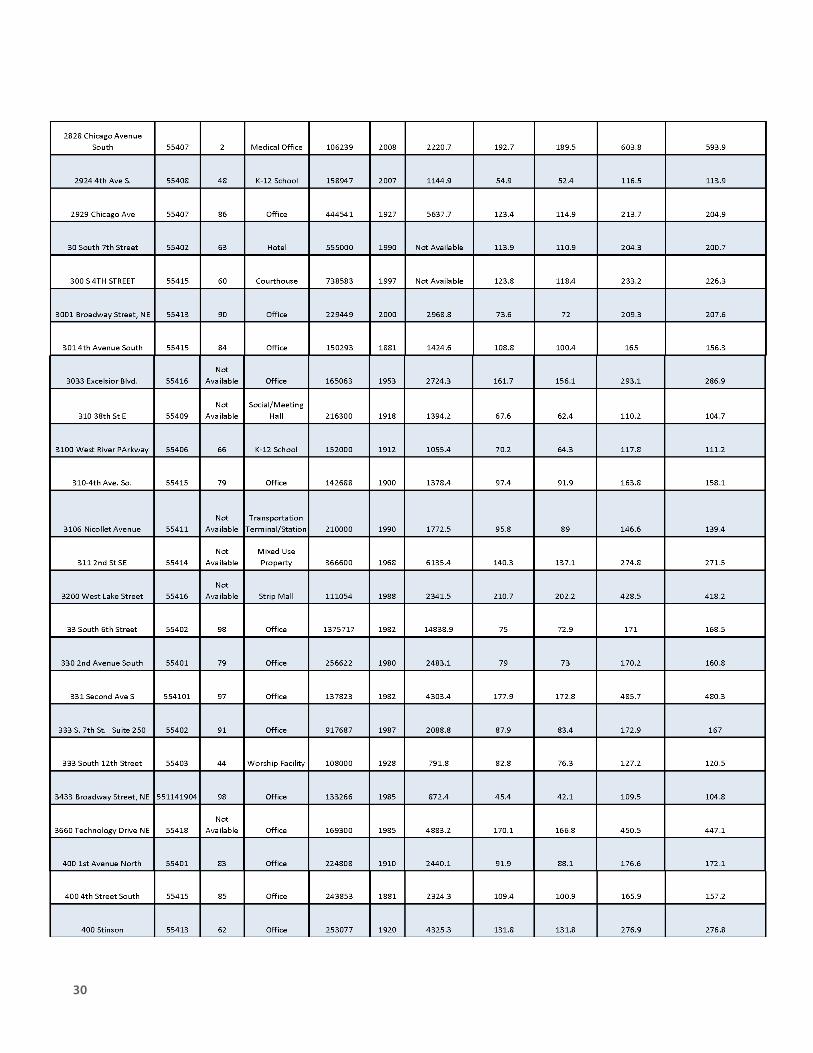
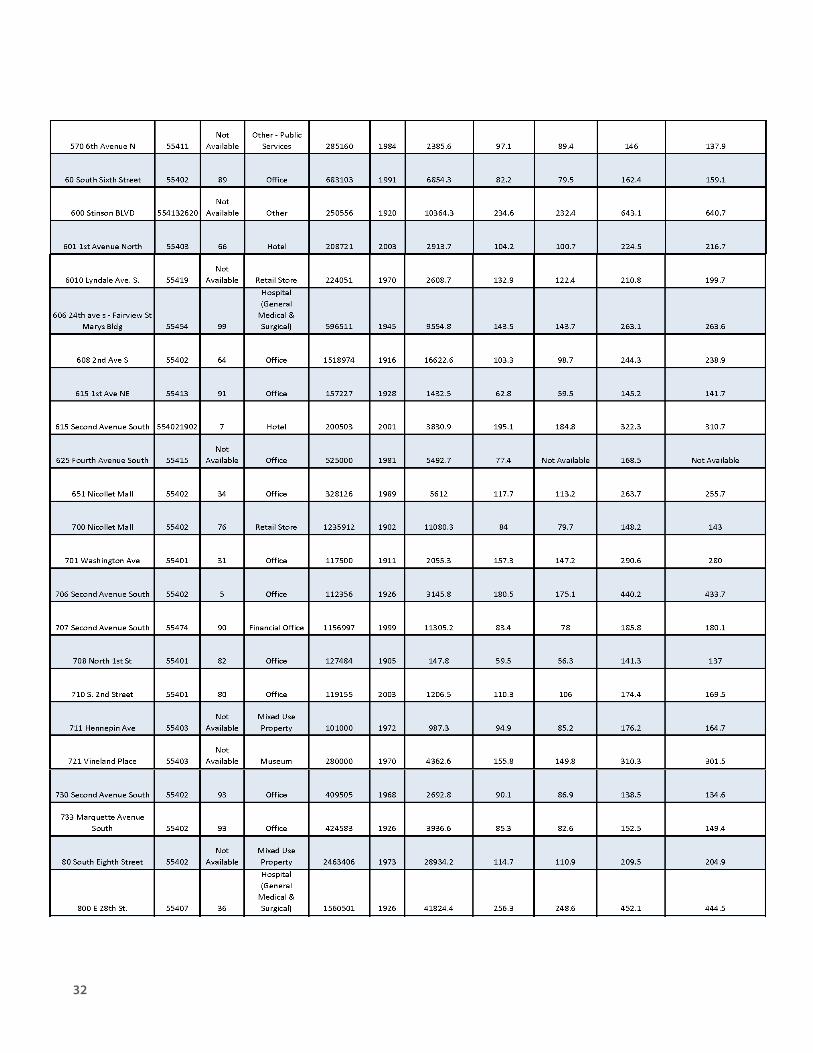
APPENDIX B: RESULTS FOR INDIVIDUAL PRIVATE BUILDINGS ≥ 100,000 FT2

28
29Appendices
30

31Appendices
32

33Appendices

34
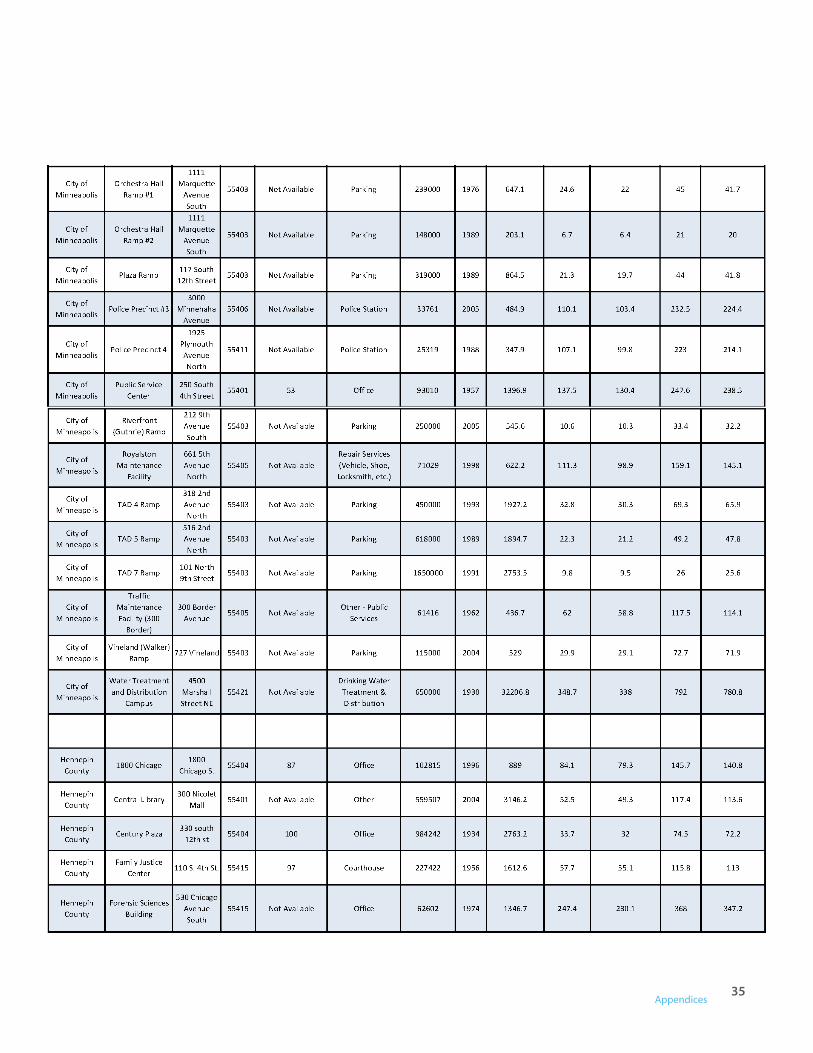
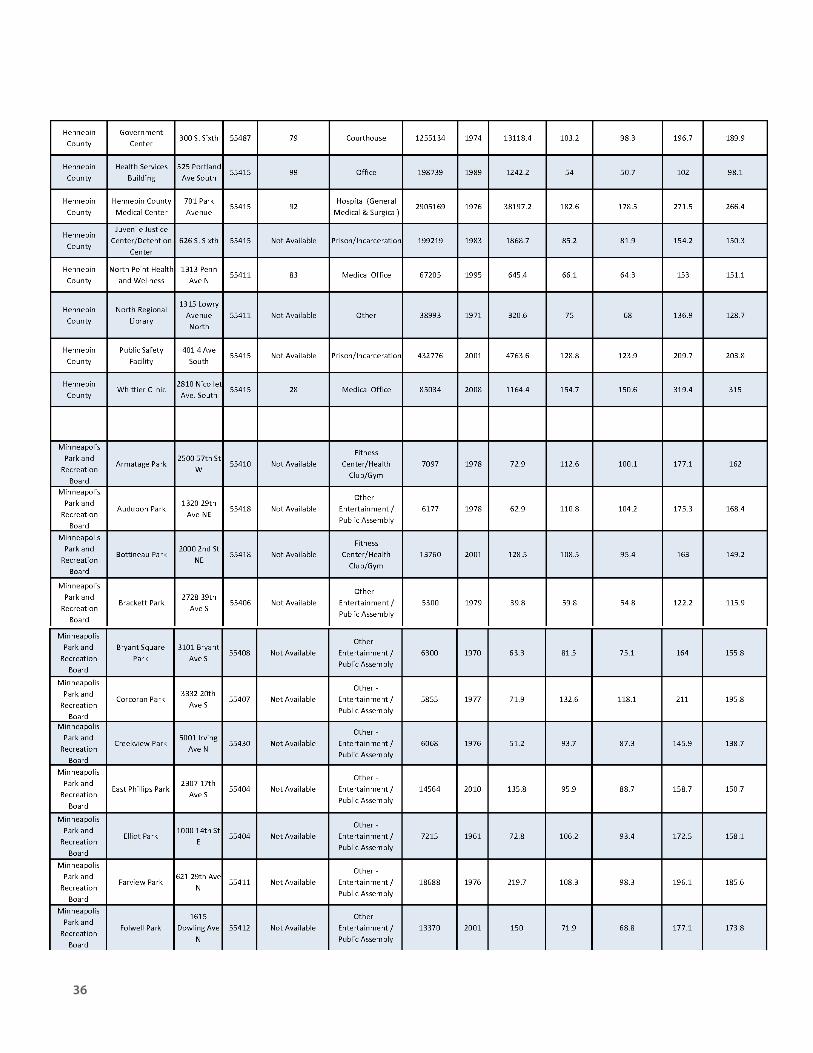
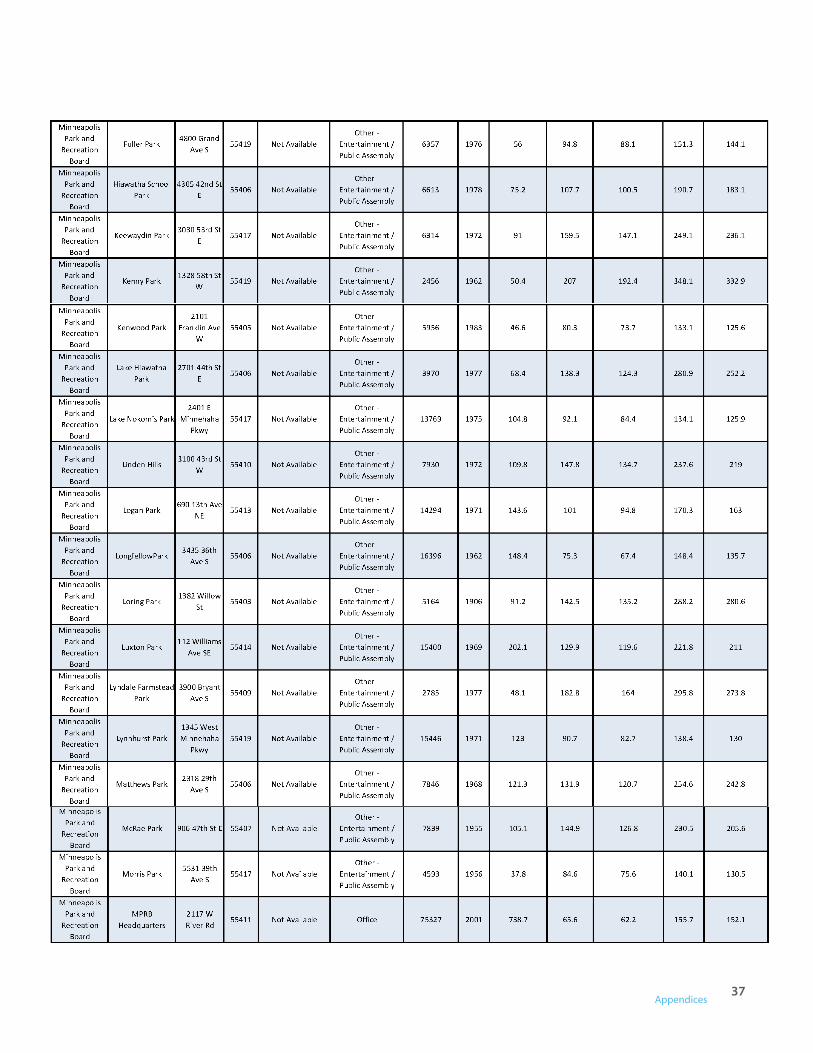
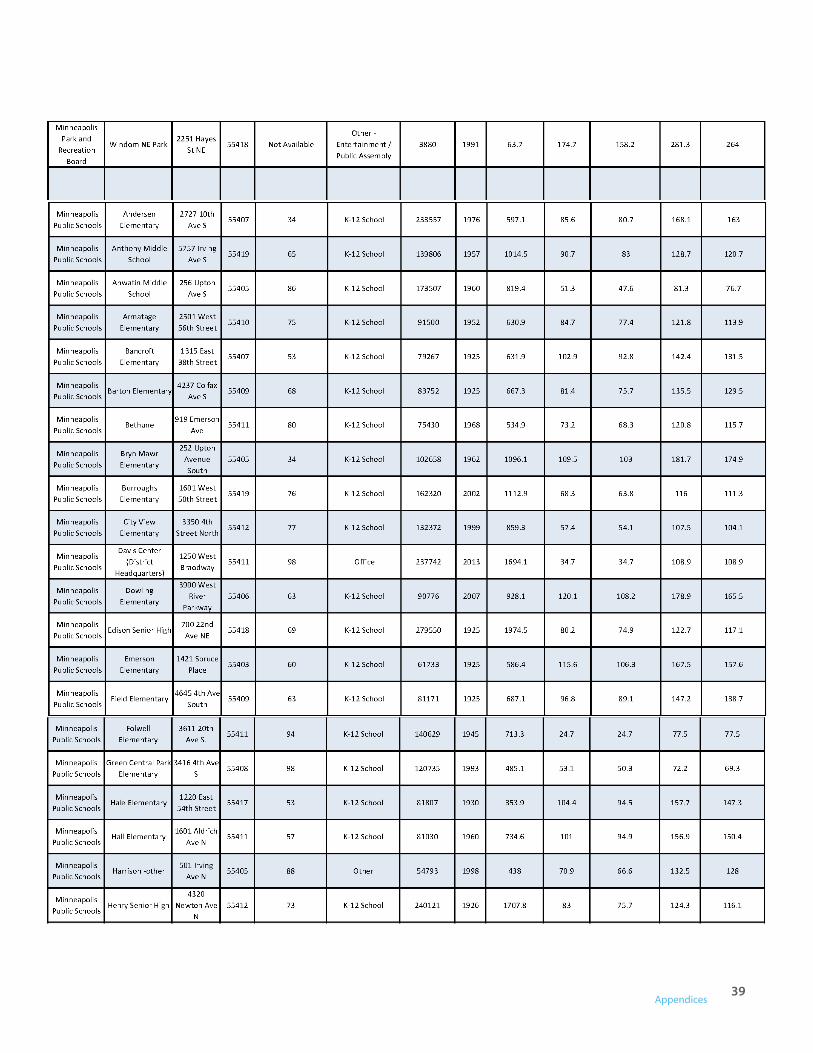
APPENDIX C: RESULTS FOR INDIVIDUAL PUBLIC BUILDINGS
35Appendices
36
37Appendices

38
39Appendices

40

41Appendices

42