2014 e-payment fraud landscape in nigeria · pdf file2014 e-payment fraud ... there is a huge...
TRANSCRIPT

2014 E-PAYMENT FRAUD LANDSCAPE
IN NIGERIA
2014
A summary and analysis of reported e-payment frauds.
TABLE OF CONTENTS
NIBSS 2015 www.nibss-plc.com.ng
Contents
Overview _________________________________________________________________________________________________ 1
2014 Transactions at a Glance __________________________________________________________________________ 2
2014 Fraud at a Glance __________________________________________________________________________________ 5
Returned Cheques 2014 ________________________________________________________________________________ 11
Fraud Trends ____________________________________________________________________________________________ 13
Fraud Outlook for 2015 ________________________________________________________________________________ 16
Table of Figures
Figure 1 2014 NIBSS Transactions Volume and Value ..............................................................................................
Figure 2 Transactions by year 2013 against 2014 .................................................................................................. 3
Figure 3 Electronic Transactions vs Non-Electronic Transaction ...................................................................... 4
Figure 4 Transaction Growth Monthly ......................................................................................................................... 4
Figure 5 Attempted Fraud vs Actual Loss ................................................................................................................... 5
Figure 6 Fraud by Channels 2014 .................................................................................................................................. 6
Figure 7 Fraud by Channels 2013 .................................................................................................................................. 7
Figure 8 Fraud reported by month 2014 ..................................................................................................................... 8
Figure 9 Fraud reported by month 2013 ..................................................................................................................... 8
Figure 10 Quarter by Quarter Fraud Value and Volume 2014 ............................................................................ 9
Figure 11 Returned Cheques against Presented Cheques Volume and Value .............................................. 11

OVERVIEW
Page 1 NIBSS 2015 www.nibss-plc.com.ng
Overview
Globally fraud is on the rise as well as its sophistication. In Nigeria, over the years most of
these incidents have gone unreported. However, in 2013 under the directive of the CBN
(Central Bank of Nigeria), NIBSS (Nigeria Interbank Settlement System Plc) developed the
Anti-Fraud Portal with a view of getting the Banks to report their e-payment frauds as it
occurs. In this report, the InfoSec (Information System Security) department of NIBSS
shows the analysis of the reported frauds to detect and show the trends of e-payment
frauds in Nigeria.
This report is focused on informing and helping the public understand payment fraud
issues. The aggregated data will also inform consumers and businesses on how fraud
occurs using various channels, as well as aid financial institutions with more effective fraud
trend monitoring and preventive measures to combat the fraud.
Fraud in the Nigerian payments system and also on a global scale has been on the increase
over the past few years as technological advances impact on the way we pay. Internet
banking, the ever increasing use of the ATMs and other electronic platforms have one way
or the other accelerated the growth of fraudulent activities. Cheques and over-the-counter
fraud has given more room to a sophisticated and more concise electronic type of fraud.
In Nigeria, Internet banking and ATM scored as the lead channels for perpetuating e-fraud
in 2014.
N.B: Internet banking and ATM scored as the lead channels for perpetuating fraud in 2014
as it recorded the highest value lost to fraudulent activities.

2014 TRANSACTIONS AT A GLANCE
Page 2 NIBSS 2015 www.nibss-plc.com.ng
2014 Transactions at a Glance
TRANSACTION VOLUME AND VALUE
Across all payment channels in the financial industry; including electronic and non-electronic
based platform, Nigeria has experienced a massive rise in the volume and value of transactions
processed yearly.
Year End Volume Value
2013 74,059,575 34,191,968,951,140
2014 113,421,933 43,857,678,478,941
% Change 53% Increase 28% Increase
Table 1 Total transaction volume and value processed by the NCS (Nigeria Central Switch)
In the year 2014, the Central Switch (NIBSS) alone processed over 100million transactions in terms
of volume with a corresponding value of over NGN 40 Trillion (over USD 208 Billion). Furthermore,
the volume of transactions grew by over 50% between 2013 and 2014 with its value also growing
by 28%.
TRANSACTION BY PRODUCTS
NIP (NIBSS Instant Payment), which is an instant account2account payment platform accounted
for most of the transactions in the year in terms of value and volume followed closely by NEFT
(NIBSS Electronic Funds Transfer), which is a clearing house based payment platform. It is
important to note that though POS had a significant volume it accounted for little in terms of value
as POS transactions are largely used for small scale transactions.
21.70%
37.51%
26.63%
14.17%
2014 Volume
POS
NIP
NEFT
1.02%
48.22%
33.14%
17.61%
2014 Value
Figure 1 2014 NIBSS Transactions Volume and Value

2014 TRANSACTIONS AT A GLANCE
Page 3 NIBSS 2015 www.nibss-plc.com.ng
In comparison to 2013, the Central Switch experienced a massive increase in Instant Payment and
POS transactions in terms of volume and value. Cheques and clearing baseed transactions
witnessed little increase. This might be attributed to the fact that there is massive shift from
clearing based transfers which occurs in cycles of about 4 hours to instant payments.
Figure 2 Transactions by year 2013 against 2014
Volume 2013 Volume 2014 Value 2013 Value 2014
POS 11,258,846 24,607,497 229,903,237,909 447,459,739,698
Instant Payments 17,967,646 42,540,034 11,674,496,434,771 21,148,614,937,311
EFTs 30,134,545 30,203,908 14,218,018,800,813 14,536,388,062,398
CHEQUE 14,698,538 16,070,494 8,069,550,477,646 7,725,215,739,533
TOTAL 74,059,575 113,421,933 34,191,968,951,139 43,857,678,478,940 Table 2 Transaction volume and value (2013 & 2014) processed by NCS categorized by Payment types
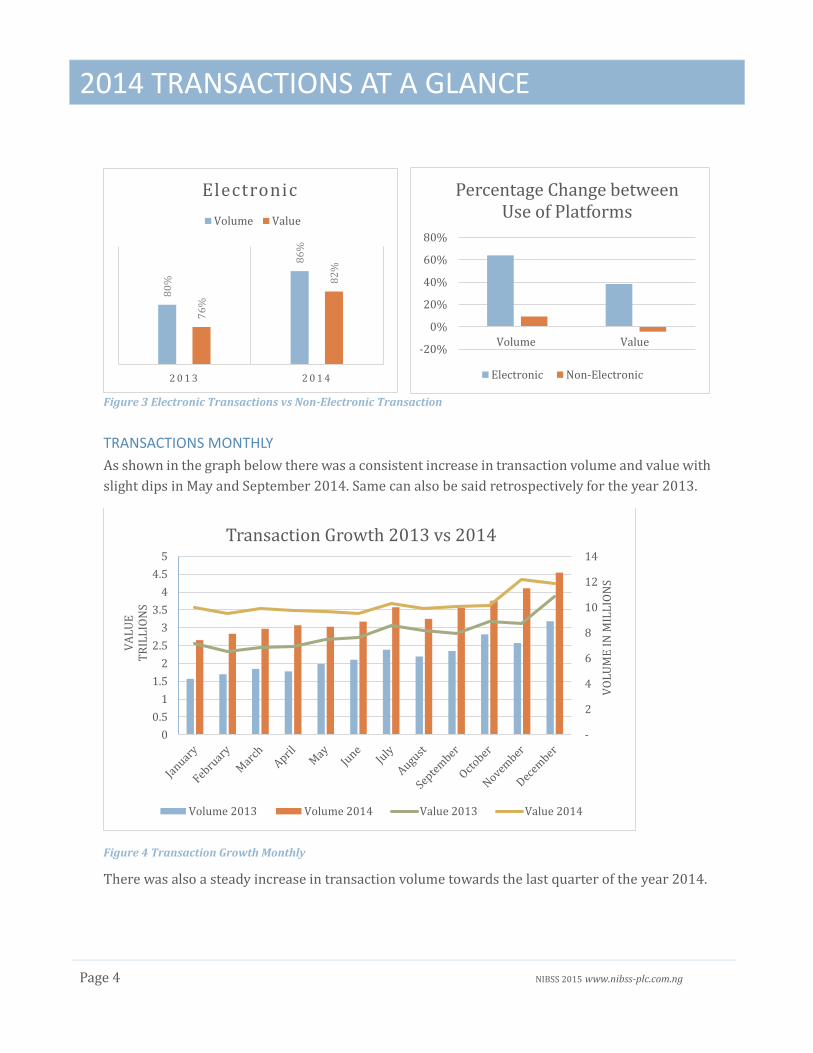
ELECTRONIC PAYMENTS LEAD THE WAY
According to spooled data, analysis showed that the general public make more use of their cards
across electronic platforms which includes ATMs, Internet Banking, Mobile Banking, ecommerce
amongst others. The increased use of electronic platforms for payments has played a significant
role in the increased number of transaction volume and value in the past few years. In the year
2014, transactions processed by the Central Switch through electronic platforms (i.e non-cheques)
accounted for 86% of the overall transactions in terms of volume and 82% in terms of value which
is an increase over the year 2013 by 6% in both transaction volume and value.
As the trend shows, more people are adopting the use of electronic payments systems i.e. going the
cashless direction.
05
1015202530354045
POS InstantPayment
EFTs Cheque
MIL
LIO
NS
Volume 2013 Volume 2014
0
5
10
15
20
25
POS InstantPayment
EFTs ChequeT
RIL
LIO
NS
Value 2013 Value 2014
2014 TRANSACTIONS AT A GLANCE
Page 4 NIBSS 2015 www.nibss-plc.com.ng
Figure 3 Electronic Transactions vs Non-Electronic Transaction
TRANSACTIONS MONTHLY
As shown in the graph below there was a consistent increase in transaction volume and value with
slight dips in May and September 2014. Same can also be said retrospectively for the year 2013.
Figure 4 Transaction Growth Monthly
There was also a steady increase in transaction volume towards the last quarter of the year 2014.
-20%
0%
20%
40%
60%
80%
Volume Value
Percentage Change between Use of Platforms
Electronic Non-Electronic
-
2
4
6
8
10
12
14
0
0.5
1
1.5
2
2.5
3
3.5
4
4.5
5
VO
LU
ME
IN
MIL
LIO
NS
VA
LU
ET
RIL
LIO
NS
Transaction Growth 2013 vs 2014
Volume 2013 Volume 2014 Value 2013 Value 2014
80
%
86
%
76
%
82
%
2 0 1 3 2 0 1 4
Electronic
Volume Value

2014 FRAUD AT A GLANCE
Page 5 NIBSS 2015 www.nibss-plc.com.ng
2014 Fraud at a Glance
FRAUD BY VOLUME AND VALUE
Technology is great, except for all the security risks involved in its usage. Companies must keep
pace with technology to grow their businesses, but they also face greater threats associated with
increased use of these technologies. Organizations’ reputations can be dented faster than ever
thanks to the viral nature of social media. There is a huge rise in Across the Counter fraud and
internet banking fraud as the nation grows in use of mobile banking, ATMs, e-Commerce, POS,
cloud computing and social media.
Year End Fraud Volume
Reported Attempted Fraud
Value Reported Actual Loss Value
Reported
2013 822 19,148,787,069 485,194,350
2014 1,461 7,750,152,748 6,215,987,323
Table 3 Total fraud volume, attempted fraud value and actual loss value across all channels on the NCS
The above table depicts that more fraud occurred in 2014 and more loss was recorded in terms of
value compared to the attempted fraud value.
Figure 5 Attempted Fraud vs Actual Loss
0
2
4
6
8
10
12
14
16
Fraud Volume
Hu
nd
red
s
2013 2014
0
5
10
15
20
25
Attempted FraudValue
Actual Loss Value
Bil
lio
ns
2013 2014

2014 FRAUD AT A GLANCE
Page 6 NIBSS 2015 www.nibss-plc.com.ng
FRAUD BY CHANNELS
In the year 2014, ATM machines were the major victims of fraudulent activities in terms of volume
as it experienced the highest number of fraudulent transactions. However, as shown in the chart
below, internet banking actually accounted for a loss of about NGN 3.2 billion to fraudulent
transactions in terms of value.
Figure 6 Fraud by Channels 2014
Payment Channels
Attempted Volume
Across Counter 153
Internet Banking 287
e-commerce 114
POS 166
Cheques 11
Web 218
ATM 491
Mobile 21
Total 1,461
Table 4 2014 Fraud Volume by Channels
-
100
200
300
400
500
600
-
50
100
150
200
250
300
350
VO
LU
ME
VA
LU
E
TE
NS
OF
MIL
LIO
NS
2014 Fraud By Channel
Volume Attempted Value

2014 FRAUD AT A GLANCE
Page 7 NIBSS 2015 www.nibss-plc.com.ng
As for 2013, there were quite a substantial amount fraudulent transactions in terms of volume on Internet banking and Web based transactions. Also, Across the Counter accounted for almost NGN16 billion of the attempted fraud which is the bulk of fraud witnessed in 2013.
Figure 7 Fraud by Channels 2013
FRAUD BY PLATFORM
In this report, NIBSS has categorized the various channels into Electronic and Non-Electronic
platforms. The tables below show a list of all the identified payment channels and fraud
volume for 2014 on those channels as identified by NIBBS existing in the Nigerian financial
industry. Further categorizing them into electronic and non-electronic platforms:
NB: Web: Purchases made on the
internet but not on merchant’s
site
E-Commerce: Purchases made on
the internet on the merchant’s
site
Table 5 Reported fraud volume by channels categorized into Electronic and Non-Electronic platforms.
- 20 40 60 80
100 120 140 160 180
0
50
100
150
200
250
300
350
VA
LU
ET
EN
S O
F M
ILL
ION
S
VO
LU
ME
2013 Fraud By Channels
Volume Attempted Value
Electronic Platforms Volume
Internet Banking 287
e-commerce 114
POS 166
Web 218
ATM 491
Mobile 21
Total 1,297
Non-Electronic Platforms
Volume
Across Counter 153
Cheques 11
Total 164
Channel Attempted
Volume
Across Counter
73
ATM 147
Cheques 15
eCommerce 78
Internet Banking
287
Mobile 8
POS 2
Web 212
Total 822
Table 5 2013 Fraud Volume by Channels

2014 FRAUD AT A GLANCE
Page 8 NIBSS 2015 www.nibss-plc.com.ng
FRAUD BY MONTH
The chart below depicts the rise in fraud events for the year 2014 showing the last quarter of the year as the period with the highest volume fraudulent activity up to 11 million NGN. This might be as a result to the high rate of transaction during this period.
Figure 8 Fraud reported by month 2014
Similar to 2014, 2013 also had November as its peak in terms of value with the most frauds
occurring in July.
Figure 9 Fraud reported by month 2013
0
50
100
150
200
250
300
0
50
100
150
200
250
VA
LU
E
TE
NS
OF
MIL
LIO
NS
VO
LU
ME
2014 Fraud by Month
Volume Value
0
20
40
60
80
100
120
140
160
180
-
20
40
60
80
100
120
140
160
180
VO
LU
ME
VA
LU
ET
EN
S O
F M
ILL
ION
S
2013 Fraud by Month
Value Volume
2014 FRAUD AT A GLANCE
Page 9 NIBSS 2015 www.nibss-plc.com.ng
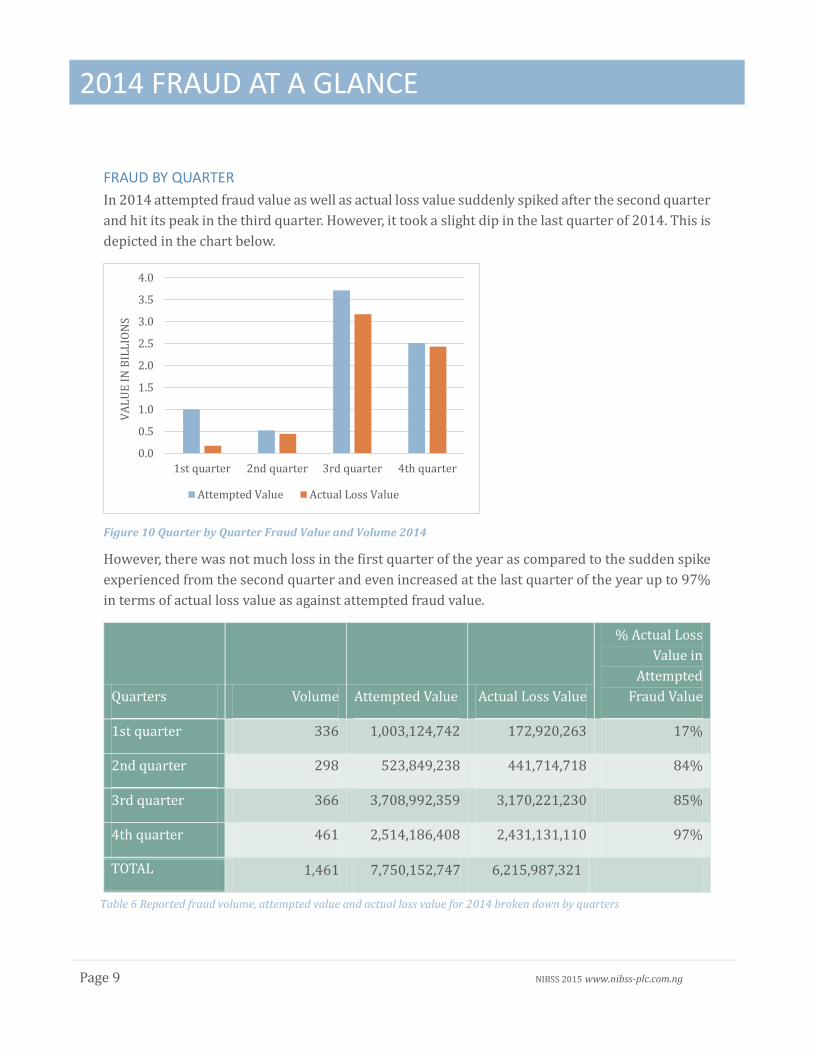
FRAUD BY QUARTER
In 2014 attempted fraud value as well as actual loss value suddenly spiked after the second quarter
and hit its peak in the third quarter. However, it took a slight dip in the last quarter of 2014. This is
depicted in the chart below.
Figure 10 Quarter by Quarter Fraud Value and Volume 2014
However, there was not much loss in the first quarter of the year as compared to the sudden spike
experienced from the second quarter and even increased at the last quarter of the year up to 97%
in terms of actual loss value as against attempted fraud value.
Quarters Volume Attempted Value Actual Loss Value
% Actual Loss
Value in
Attempted
Fraud Value
1st quarter 336 1,003,124,742 172,920,263 17%
2nd quarter 298 523,849,238 441,714,718 84%
3rd quarter 366 3,708,992,359 3,170,221,230 85%
4th quarter 461 2,514,186,408 2,431,131,110 97%
TOTAL 1,461 7,750,152,747 6,215,987,321
0.0
0.5
1.0
1.5
2.0
2.5
3.0
3.5
4.0
1st quarter 2nd quarter 3rd quarter 4th quarter
VA
LU
E I
N B
ILL
ION
S
Attempted Value Actual Loss Value
Table 6 Reported fraud volume, attempted value and actual loss value for 2014 broken down by quarters

2014 FRAUD AT A GLANCE
Page 10 NIBSS 2015 www.nibss-plc.com.ng
SUSPECT APPREHENSION RATE
In 2014, as part of the investigation process, a number of suspects and criminals were apprehended
after fraud had been report. Although, the figures shows that more work needs to be done to
improve apprehension rate. However, the low number is due to some constraints like the law/legal
context that isn’t clearly defined when it comes to financial and cyber-crimes carried out using
electronic platforms. A major issue is the collaboration of the law enforcement agents and the
financial industry.
Apprehended Volume Value
YES 41 899,263,953
NO 1420 6,850,888,796
Table 7 Number of apprehended suspects as against the total fraud volume and value reported

RETURNED CHEQUES 2014
Page 11 NIBSS 2015 www.nibss-plc.com.ng
Returned Cheques 2014
The chart below shows 2014 cheque transactions. Cheque volume as well as value increased over
the months in the year. Returned cheques increased in both volume and value when compared to
2013.
Figure 11 Returned Cheques against Presented Cheques Volume and Value
0
2
4
6
8
10
12
14
16
18
Volume
MIL
LIO
NS
Cheque Volume
Presented Returned Accepted
-
1
2
3
4
5
6
7
8
TR
ILL
ION
S
Cheque Value
Presented Returned Accepted

RETURNED CHEQUES 2014
Page 12 NIBSS 2015 www.nibss-plc.com.ng
Month
Cheque Presentme-nt Volume
Cheque Returned Volume
% Return Rate(Vol)
Cheque Presentment Value
Cheque Return Value
% Return Rate(Val)
14-Jan 1,235,071 39,942 3.23% 634,346,591,980 28,634,266,684 4.51%
14-Feb 1,142,608 36,744 3.22% 620,617,590,664 27,098,278,144 4.37%
14-Mar 1,136,109 40,696 3.58% 639,105,966,874 29,454,994,304 4.61%
14-Apr 1,134,526 45,751 4.03% 618,875,998,640 29,799,713,539 4.82%
14-May 1,198,645 42,727 3.56% 603,581,587,487 28,960,773,036 4.80%
15-Jun 1,297,381 43,306 3.34% 594,145,267,272 29,832,506,506 5.02%
15-Jul 1,484,390 49,828 3.36% 598,737,249,909 33,868,086,338 5.66%
15-Aug 1,476,465 42,627 2.89% 577,436,511,115 29,589,026,135 5.12%
15-Sep 1,348,320 42,835 3.18% 595,489,695,422 30,181,916,649 5.07%
15-Oct 1,372,534 51,046 3.72% 576,832,562,705 31,887,330,113 5.53%
15-Nov 1,401,839 51,928 3.70% 643,734,510,254 36,848,833,011 5.72%
15-Dec 1,286,236 68,940 5.36% 644,845,309,289 41,311,173,463 6.41%
Total 15,514,124 556,370 3.59% 7,347,748,841,612 377,466,897,921 5.14%
Table 8 Percentage Return Rate

FRAUD TRENDS
Page 13 NIBSS 2015 www.nibss-plc.com.ng
Fraud Trends
TRENDS BY VOLUME AND VALUE
Taking polls from our last two years fraud data, there was a significant rise of up to 78% in the
volume of fraudulent cases in 2014. Although the value of the attempted fraudulent transactions
reduced, there was a huge increase in the moneys that were actually lost to fraudsters. Further
analysis showed that the percentage of Actual Loss Value as against Attempted Fraud value
increased by up to 77% from 3% to 80% within one calendar year. This helps to emphasize the
need for more security measures in handling payment cards as individuals, and improved security
practices as corporate bodies to help minimize fraud rates.
TRENDS BY CHANNELS
There was a paradigm shift between 2013 and 2014 in terms of fraud volume and value by
channels. POS, ATMs, Mobile banking and Across the Counter witnessed the highest rise in terms
of transaction volume in the year 2014. Although Across the Counter witnessed over a 100%
increase in fraud volume, the other channels are electronically based.
Channel Volume 2013 Volume 2014 % Change
POS 2 166 8200%
ATM 147 491 234%
Mobile 8 21 163%
Across Counter 73 153 110%
eCommerce 78 114 46%
Web 212 218 3%
Internet Banking 287 287 0%
Cheques 15 11 -27%
Total 807 1461
Table 10 Fraud volume trend by channels in terms of percentage change between 2013 and 2014
Year End Fraud Volume Attempted
Fraud Value Actual Loss
Value
% Actual Loss Value in
Attempted Fraud Value
2013 855 19,148,787,069 485,194,350 3%
2014 1,461 7,750,152,748 6,215,987,323 80%
% Change 78% -60% 1181% 77%
Table 9 Total fraud trend in terms of percentage change between 2013 and 2014

FRAUD TRENDS
Page 14 NIBSS 2015 www.nibss-plc.com.ng
The current trend that was witnessed in 2014 in terms of actual loss value to fraud was consistently
on the rise across all the channels except Cheques. From the table below, it shows that 2014 was a
less secure year in terms of success rate at intercepting/preventing fraudulent transactions.
Channel Actual Loss Amount
2013 Actual Loss Amount
2014 % Change
ATM 54,999,829 2,688,669,292 4789%
POS 5,851,443 157,610,831 2594%
Across Counter 13,851,780 140,813,927 917%
Web 109,298,898 1,031,239,284 844%
Internet Banking 271,762,696 2,120,881,512 680%
ecommerce 13,948,390 58,994,920 323%
Mobile 6,787,544 13,328,957 96%
Cheques 8,693,770 4,448,600 -49%
Total 485,194,350 6,215,987,323
Table 11 Fraud actual loss amount trend by channels in terms of percentage change between 2013 and 2014

FRAUD TRENDS
Page 15 NIBSS 2015 www.nibss-plc.com.ng
FRAUD RATE
2014 was quite alarming in terms of fraud as it recorded very high volume and value of fraudulent
transactions in Nigeria (Note that we suspect that the actual volumes and values are usually way
higher than reported). However, fraudulent transactions (attempted fraud value) as a percentage
of the total transactions value for 2014 was less than 1%. This generally shows that transactions
are highly secure but the success rate at which attempted fraudulent transactions are successful is
equally high up to 80% in 2014 as against 3% in 2013.
Year End Attempted
Fraud Value Actual Loss
Value % Change
2013 19,148,787,069 485,194,350 3%
2014 7,750,152,748 6,215,987,323 80%
Table 12 Actual loss value as a percentage of attempted fraud value in 2013 and 2014
Transaction Volume Fraud Volume Fraud Rate
187,481,508 2,283 0.001%
Table 13 Total 2013 & 2014 Fraud Volume as a percentage of total 2013 & 2014 Transaction Volume on NCS
NB: The fraud figures are what is reported across the industry, while the transaction figures are only the ones that were processed by the Nigerian Central Switch.
Transaction Value Attempted Fraud
Value Fraud Rate
78,049,647,430,082 26,898,939,817 0.034%
Table 14 Total 2013 & 2014 Attempted Fraud Value as a percentage of total 2013 & 2014 Transaction Value on NCS

FRAUD OUTLOOK FOR 2015
Page 16 NIBSS 2015 www.nibss-plc.com.ng
Fraud Outlook for 2015
The advent of the fraud scene in 2014 which was a rollercoaster ride for all holders of critical
intellectual and financial property all over the world and in Nigeria, 2015 must not be
underestimated. Here at NIBSS, we give a concise look towards the future on possible trends and
events that might potentially occur in the fraud scene in Nigeria.
Culled from Deloitte’s Nigeria Cyber Security Outlook 2015 bulletin, some of the following have
been identified as major highlights that we might experience as 2015 unfolds.
POTENTIAL FRAUD TRENDS
Phishing and Insider threat would most likely be on the rise as the fuel and crude oil prices
continue to deteriorate. We would most likely experience a rise in the number of disgruntled
employees and also from outside of the job market. Hence, an increase in the number of targeted
phishing attacks to acquire sensitive data.
Socially and Politically motivated cyber-attacks as the elections are held. Unhappy citizens and
other groups might use this as a medium to target websites and IT infrastructure of government
bodies and agencies as a means to make their voices heard. Already, the Nigeria Army website have
been allegedly reported hacked. AIT, a foremost television station in Nigeria has alleged that its poll
website was hacked too. The aftermath of the elections may escalate such hacking activities.
POTENTIAL MITIGATIONS
There is the introduction of the biometrics project which is also known as Bank Verification
Number. It is a number used for proper customer identification, and can be used as verification at
the point of Banking operations. It refers to identification of an individual based on physiological
attributes- fingerprint and facial features. This centralized biometric system was launched by CBN
in collaboration with all Nigerian banks. This initiative is expected to solve the age long problem
of proper identity in the banking sector. We believe that once the BVN is made mandatory, e-
payment and Bank frauds would reduce by about 60%. It is being hoped that the BVN would be
made mandatory before the end of 2015.
From 2014, the Federal Government of Nigeria, CBN and major players in the financial industry
took steps to better improve security measures in the country. In terms of legal aspect to improve
prosecution, the National Assembly in collaboration with the Senate passed a Cybercrime Bill. This
bill spells out punishment for e-crimes that were hitherto not deemed as crimes before. We believe
this would serve as deterrents to fraudsters. However, if the bill is not signed into law by the

FRAUD OUTLOOK FOR 2015
Page 17 NIBSS 2015 www.nibss-plc.com.ng
president before the expiration of the tenure on May 29th 2015, the Cyber-crime bill would have to
start its process all over again from the beginning.
CBN passed a mandate for all financial institutions to adopt worldwide acceptable standard to
improve Information Security with the likes of ISO 27001 and COBIT 5. Also, they mandated all
card processing and handling companies to adopt PCI/DSS. Going forward this would help reduce
fraud in the payment card industry.
As 2015 continues to unfold, the Nigerian financial industry has gone a step ahead to introduce an
industry-wide, central Anti-Fraud solution, Heimdall to further combat against the fraud rates that
has been ever growing. Heimdall will tackle the currently rising inter-bank fraud rate in the system
as it will monitor inter-bank transactions real-time 24/7, help in the report of fraud as it occurs
thus curbing the viral spread of fraudulent transaction in the days ahead. Going forward, we might
also witness a rise in the prosecution of cyber related crimes and more accountability on senior
level executives of institutions when security breaches occur.
A more sustained and targeted bank-users education would be required in 2015 to ensure bank
customers are not defrauded through social engineering methods.