2014 canbio report on the status of bioenergy in · pdf file2014 canbio report on the status...
TRANSCRIPT

A
2014 CanBio RepoRt on the StatuS of BioeneRgy in Canada
2014 CanBio RepoRt on the StatuS of BioeneRgy in CanadadeCemBeR 2014
by Kendal BradburnRenewed Energies [email protected] behalf of CanBio

2014 CAnBio REpoRt on thE StAtuS of BioEnERgy in CAnAdA
deCemBeR 2014
by Kendal BradburnRenewed Energies [email protected] behalf of CanBio
this report was produced with support from natural Resources Canada. its contents do not necessarily reflect the opinions of the government of Canada.
the forest products association of Canada provided support in consideration of the Canadian Bioenergy association.

i
2014 CanBio RepoRt on the StatuS of BioeneRgy in Canada
ContentSexeCutive SummaRy . . . . . . . . . . . . . . . . . . . . . . . . . . . . . . . . . . . . . 1
1.0 intRoduCtion . . . . . . . . . . . . . . . . . . . . . . . . . . . . . . . . . . . . . .5
2.0 poliCy . . . . . . . . . . . . . . . . . . . . . . . . . . . . . . . . . . . . . . . . . . . . .72.1 federal initiatives . . . . . . . . . . . . . . . . . . . . . . . . . . . . . . . . . . 8
2 .1 .1 Renewable Heat and Power . . . . . . . . . . . . . . . . . . . . . . . . . 82 .1 .2 Renewable Fuels . . . . . . . . . . . . . . . . . . . . . . . . . . . . . . . 10
2.2 provincial initiatives . . . . . . . . . . . . . . . . . . . . . . . . . . . . . . . . . 12British Columbia . . . . . . . . . . . . . . . . . . . . . . . . . . . . . . . . . . . 12Quebec . . . . . . . . . . . . . . . . . . . . . . . . . . . . . . . . . . . . . . . . . 13Ontario . . . . . . . . . . . . . . . . . . . . . . . . . . . . . . . . . . . . . . . . . 14Manitoba . . . . . . . . . . . . . . . . . . . . . . . . . . . . . . . . . . . . . . . . 15Alberta . . . . . . . . . . . . . . . . . . . . . . . . . . . . . . . . . . . . . . . . . . 15
2.3 international biofuel developments . . . . . . . . . . . . . . . . . . . . . . . 16
3.0 uSeRS of BiomaSS/BioeneRgy pRoduCeRS . . . . . . . . . . . 173.1 Cogeneration — industrial heat and power producers (pp’s & ipp’s) . . 18
3 .1 .1 Cogeneration Pulp & Paper . . . . . . . . . . . . . . . . . . . . . . . . 183 .1 .2 Cogeneration Independent Heat & Power Producers . . . . . . . . 21
4.0 BiogaS . . . . . . . . . . . . . . . . . . . . . . . . . . . . . . . . . . . . . . . . . . . .254.1 feedstocks . . . . . . . . . . . . . . . . . . . . . . . . . . . . . . . . . . . . . . 29
4.2 employment . . . . . . . . . . . . . . . . . . . . . . . . . . . . . . . . . . . . . . 29
5.0 Community heating in Canada . . . . . . . . . . . . . . . . . . . . . 315.1 provincial Leaders — policies driving growth in biomass heat . . . . 35
5 .1 .1 British Columbia . . . . . . . . . . . . . . . . . . . . . . . . . . . . . . . 375 .1 .2 Northwest Territories . . . . . . . . . . . . . . . . . . . . . . . . . . . . 385 .1 .3 Quebec . . . . . . . . . . . . . . . . . . . . . . . . . . . . . . . . . . . . . 405 .1 .4 Prince Edward Island . . . . . . . . . . . . . . . . . . . . . . . . . . . . 41
6.0 Wood pelletS . . . . . . . . . . . . . . . . . . . . . . . . . . . . . . . . . . . . 436.1 Canada and Beyond . . . . . . . . . . . . . . . . . . . . . . . . . . . . . . . . 44
6.2 pellet exports . . . . . . . . . . . . . . . . . . . . . . . . . . . . . . . . . . . . 49
6.3 pellet feedstocks . . . . . . . . . . . . . . . . . . . . . . . . . . . . . . . . . . 51
6.4 employment . . . . . . . . . . . . . . . . . . . . . . . . . . . . . . . . . . . . . . 54

ii
2014 CanBio RepoRt on the StatuS of BioeneRgy in Canada
ContentS (Continued)
7.0 toRRefied Wood (pelletS) . . . . . . . . . . . . . . . . . . . . . . . . .57
8.0 gReenhouSeS . . . . . . . . . . . . . . . . . . . . . . . . . . . . . . . . . . . . 59
9.0 liquid BiofuelS . . . . . . . . . . . . . . . . . . . . . . . . . . . . . . . . . . 639.1 ethanol . . . . . . . . . . . . . . . . . . . . . . . . . . . . . . . . . . . . . . . . . 65
9.2 Biodiesel . . . . . . . . . . . . . . . . . . . . . . . . . . . . . . . . . . . . . . . . 69
9.3 pyrolysis oil . . . . . . . . . . . . . . . . . . . . . . . . . . . . . . . . . . . . . . 729 .3 .1 Description . . . . . . . . . . . . . . . . . . . . . . . . . . . . . . . . . . . 729 .3 .2 Current Markets . . . . . . . . . . . . . . . . . . . . . . . . . . . . . . . . 739 .3 .3 Industrial Production . . . . . . . . . . . . . . . . . . . . . . . . . . . . . 73
10.0 tRade . . . . . . . . . . . . . . . . . . . . . . . . . . . . . . . . . . . . . . . . . . . . .7510.1 Wood pellets . . . . . . . . . . . . . . . . . . . . . . . . . . . . . . . . . . . . . 76
10.2 ethanol . . . . . . . . . . . . . . . . . . . . . . . . . . . . . . . . . . . . . . . . . 77
10.3 Biodiesel . . . . . . . . . . . . . . . . . . . . . . . . . . . . . . . . . . . . . . . . 78
11.o Supply ChainS (pelletS) . . . . . . . . . . . . . . . . . . . . . . . . . . 79
12.0 feedStoCkS . . . . . . . . . . . . . . . . . . . . . . . . . . . . . . . . . . . . . . . 8112.1 p&p . . . . . . . . . . . . . . . . . . . . . . . . . . . . . . . . . . . . . . . . . . . . 82
12.2 ipp’s . . . . . . . . . . . . . . . . . . . . . . . . . . . . . . . . . . . . . . . . . . . 82
12.3 Biogas . . . . . . . . . . . . . . . . . . . . . . . . . . . . . . . . . . . . . . . . . 83
12.4 Community heating . . . . . . . . . . . . . . . . . . . . . . . . . . . . . . . . 84
12.5 pellets . . . . . . . . . . . . . . . . . . . . . . . . . . . . . . . . . . . . . . . . . . 84
12.6 ethanol . . . . . . . . . . . . . . . . . . . . . . . . . . . . . . . . . . . . . . . . . 85
12.7 Biodiesel . . . . . . . . . . . . . . . . . . . . . . . . . . . . . . . . . . . . . . . . 85
13.0 diSCuSSion . . . . . . . . . . . . . . . . . . . . . . . . . . . . . . . . . . . . . . . .87
liSt of figuReS
figure 3.1 · energy use from Biomass · p19
figure 6.1 · pellet export destination 2013 · p50
figure 6.2 · Sawmill Lumber production, 2003–2012 · p52
figure 6.3 · Source of feedstock for BC Wood pellets, 2013 · p53
figure 9.1 · 1st generation ethanol Capacity · p66
figure 10.1 · Canada exports vs. Capacity · p76

iii
2014 CanBio RepoRt on the StatuS of BioeneRgy in Canada
liSt of taBleS
table 2.1 · federal policies to Support Renewable heat and power · p9
table 2.2 · federal policies to Support Renewable fuels · p11
table 3.1 · number of pulp and paper mills with Cogen · p18
table 3.2 · new Renewable energy Capacity due to ppgtp · p20
table 3.3 · power production by feedstock · p21
table 3.4 · 2013 Bioenergy Capacity by ipps · p21
table 3.5 · Capacity of future ipp plants · p22
table 3.6 · 2013 power generation Capacity by fuel (mWe) · p22
table 3.7 · employment by ipps · p23
table 4.1 · Biogas Systems in operation in Canada 2013 · p26
table 4.2 · Biogas Systems in development in Canada 2013 · p28
table 5.1 · Community heat installations in operation by province · p32
table 5.2 · number of Buildings Connected to Bio-heat Systems · p33
table 5.3 · Community heating plant Capacities (kW) · p34
table 5.4 · feedstock of heating plants · p35
table 5.5 · provincial programs Supporting Bioheat development in Canada · p36
table 6.1 · european demand for Wood pellets · p44
table 6.2 · Canada Wood pellet Capacity (tonnes) · p45
table 6.3 · pellet Capacity by province (tonnes) · p45
table 6.4 · average Size of plant 2013 · p46
table 6.5 · pellet production by province (tonnes) · p47
table 6.6 · 2013 Capacity utilization by province (tonnes) · p48
table 6.7 · 2013 pellet exports · p49
table 6.8 · pellet exports by province · p51
table 6.9 · pellet feedstocks by province (tonnes) · p54
table 6.10 · direct Jobs in pellet plants by province 2013 · p55
table 9.1 · provincial Renewable fuel Standards · p64
table 9.2 · 1st generation ethanol Capacity and production in 2013 · p66
table 9.3 · 2nd generation ethanol Capacity · p68
table 9.4 · Consumption of diesel in Canada · p69
table 9.5 · Biodiesel Capacity 2011–13 · p70
table 9.6 · Canada Biodiesel Capacity & production by Region 2013 · p71
table 9.7 · estimated Biodiesel Consumption · p72
table 10.1 · Canadian pellet exports · p77
table 10.2 · ethanol imports · p78
table 10.3 · Biodiesel exports · p78
table 12.1 · pulp and paper Cogen feedstock · p82
table 12.2 · ipp feedstock · p83
table 12.3 · Biogas feedstocks · p84
table 12.4 · Biodiesel feedstocks · p85

iv
2014 CanBio RepoRt on the StatuS of BioeneRgy in Canada
nRCan natural Resources CanadaeC environment CanadaCfS Canadian forest SectornRC national Research Council
CanadaaafC agriculture & agri·food CanadagnWt government of the northwest
territoriesiea international energy agencyeu european unionSdtC Sustainable development
technology Canadaopg ontario power generationCanBio previously known as
Canadian Bioenergy associationCRfa Canadian Renewable fuels
associationBa Biogas association WW2Rh Wood Waste 2 Rural heatBCBn BC Bioenergy networkaea arctic energy allianceage arctic green energyCRe Conseil régionale de
l’environnmente
ppgtp pulp & paper green transformation program
peRd program of energy Research & development
Bopi Biofuels opportunities for producers initiative
afi aboriginal forestry initiativeecoaBC ecoagricultural Biofuels Capital
initiative fip farm innovation programCaap Canadian agricultural
adaptation programfit feed-in-tariffsmicrofit micro feed-in-tariff RfS Renewable fuel StandardsRed Renewable energy directivegphh growing power hairy hilladm archer daniels midlandglB great Lakes BiodieselR&d Research and developmente5 5% ethanol in gasolineB2 2% Biodiesel in diesel fuel
Rng Renewable natural gasCo2 Carbon dioxide So2 Sulfur dioxidenox nitrogen oxide
BC British ColumbiaaB albertaSk SaskatchewanmB manitobaon ontarioqC Quebec nS nova ScotianB new Brunswickpei prince edward island nl newfoundland & LabradornWt northwest territoriesuS united States
p&p pulp and paperipp independent power producersChp Combined heat & power mSW municipal Solid WastempB mountain pine Beetleghg greenhouse gas emissionsgh greenhousesad anaerobic digestionn/a not available
mWe megawatt electricmWth megawatt thermalmt million tonnesBl Billion litresml million litresmmly million liters per yeartpa tonnes per annumtpd tonnes per daymm3 million meters cubedm3 meters cubedt/m3 tons per meters cubedkWh kilowatt hourBdt Bone dry tonnesgWh gigawatt hoursgJ/t gigajoule/tonnekm kilometers
liSt of aBBReviationS:

1
2014 CanBio RepoRt on the StatuS of BioeneRgy in Canada
exeCutive SummaRyCanada is in the privileged position of having substantial biomass
from wood, forest debris, crop residues, municipal waste, and waste
materials from renewable resources. these carbon-based materials
are fueling a growing bioenergy industry in Canada that is creating
new jobs at every skill level and replacing many jobs lost in small
communities formerly dependent on traditional forest products.

2
2014 CanBio RepoRt on the StatuS of BioeneRgy in Canada
in 2013, CanBio, with the financial support of natural Resources Canada
(nRCan), commissioned a nationwide survey of Canadian bioenergy facilities
to understand the growth and structure of the bioenergy industry, and its
socio-economic benefits. the survey, carried out by kendal Bradburn of
Renewed energies, was targeted chiefly at production facilities including
ethanol, biodiesel, pellets, bio-heat, bio-power, biogas, and cogeneration.
this survey builds on the results of past surveys in 2011–12.
• poliCy: Both federal and provincial governments have implemented various policies and initiatives to promote bioenergy. British Columbia (BC), Quebec, prince edward island (pei) and the northwest territories (nWt) have implemented initiatives aimed at increasing biomass heat in communities. ontario policy initiatives positioned it as a leader in biogas to power, while federal programs have played a large role in the development of bio-fuels.
• pEllEtS: installed capacity grew by 1.3 million tonnes (mt) or 61% in 2010–12, but uncertain markets led to the closure of three plants in 2013. the pellet industry leader is BC, with 61% of Canadian pellet capacity and the six largest plants. Competitive plants and efficient supply chains have resulted in an 85% rate of capacity utilization. Quebec, the second largest producer with small local markets and plants, has been operating at 63% capacity.
• Community hEAt: until 2000, only five biomass heat projects existed in Canada. By 2013 the number of systems had grown to 109, led by BC and the nWt. Both regions leveraged effective government initiatives and local champions. the idea is catching on elsewhere in Canada as well. for example, ontario had only three systems operating in 2012, but that grew to 11 by 2013. nationwide 33 bio-heat systems are under construction.
• hEAt And powER fRom CogEnERAtion: thirty nine biomass cogeneration plants at pulp and paper (p&p) mills operated in Canada in 2013, generating 1,579 mW electric (mWe). in 2009, the government of Canada created the $1B pulp and paper green transformation program (ppgtp) that resulted in mills producing an additional 195 mWe of power. there are 23 operating independent power producers (ipps) with another two plants at the commissioning stage and seven under construction.
• Bio-EthAnol: Capacity in 1st generation ethanol made from corn and grain increased significantly from 411 million litres (ml) in 2005 to 1,735 ml in 2008. growth slowed between 2009–11 after the end of government support programs and debate about the environmental benefits of 1st generation ethanol. By 2013, capacity reached 1,826 ml from 14 plants. Second generation ethanol from lingo-cellulosic feedstocks is now transitioning from the research and development (R&d) stage to commercial development. four pilots and four commercial demonstration plants are now operating or coming on stream. in 2014–16, new 2nd generation ethanol plants will startup in edmonton, alberta and varennes, Quebec.

3
2014 CanBio RepoRt on the StatuS of BioeneRgy in Canada
• BiodiESEl: Capacity grew from 2009 through 2012 to 235 ml. the industry lost three plants because of a fire and the rising cost of feedstocks. however biodiesel is again experiencing a resurgence with the start-up of Canada’s largest plant in 2013 and three plants either commissioned or under construction. Capacity is expected to grow to 760 ml in 2014.
• BiogAS: By 2013, ontario had become the leader in Canada for operational anaerobic digestion installations on farms with 37 of Canada’s 77 operating biogas facilities. Quebec is second with 14 plants, but with several large facilities, has twice as much capacity as ontario, at 63 mW.
• gREEnhouSES: there are 52 known greenhouse growers with biomass energy systems, 37 using biomass for energy, and six in the planning stages. While many greenhouses in BC use natural gas, in 2013 at least 20 used biomass for heat. in ontario, at least 14 growers are using biomass, with five anticipated to come online in 2014. greenhouse growers using biomass also exist in alberta, Quebec, manitoba, new Brunswick and nova Scotia.
• toRREfiEd wood: there has been considerable interest in torrefaction, the treatment of biomass with high heat, and in the potential for torrefied pellets as a “superior” version of wood pellets. the technology has not yet established itself in the market. While no significant production exists, two commercial demonstration plants are being built.
• pyRolySiS oil: Canada was an early innovator in the development of pyrolysis oil. one company is now expanding to commercial scale and it has a joint venture to develop pyrolysis oil as an intermediate to drop-in fuels.
While the industry is growing and our understanding of the most appropriate applications for Canadian biomass residual or waste streams increasing, continued support at research, industry, and government levels is necessary to encourage further innovation, supportive policy environments, and growth of the sector.

4
2014 CanBio RepoRt on the StatuS of BioeneRgy in Canada

5
2014 CanBio RepoRt on the StatuS of BioeneRgy in Canada
1.0 intRoduCtion
this annual report has its origins in a collaboration between CanBio
and Climate Change Solutions, an ottawa consulting firm, which
provided Canadian bioenergy development input for the international
Energy Agency Bioenergy task on Bio-trade (2006, 2008, and 2009).

6
2014 CanBio RepoRt on the StatuS of BioeneRgy in Canada
Starting in 2010, CanBio undertook national surveys of the industry
to better understand the growth and structure of Canada’s bioenergy
industry and determine its socio-economic benefits. With the support of
nRCan, this survey is the most comprehensive thus far, covering ethanol,
biodiesel, pellets, bio-heat, bio-power, biogas, and cogeneration sectors.
to maintain confidentiality, all sensitive information has been aggregated
at the regional level.
Biomass is a vast sustainable resource comprised of a variety of organic feedstocks, including forest mill and harvest residues, agricultural residues, and municipal solid waste, that are increasingly utilized to fuel energy production. the opportunities for transformation of biomass to energy and bio-products are numerous and have great potential to contribute to energy needs in the forest, agricultural and transportation sectors as well as in residential heating. Collaborations between government and industry are working to develop biofuels (2nd generation and pyrolysis), biogas (gasification & anaerobic digestion), biomass resources (biomass densification, biomass to gas, and catalytic conversion), and combined heat and power.1
Bioenergy has been part of the Canadian energy scene for more than 25 years, primarily in the pulp and paper sector. Canada was built on the forest industry, which is now a $58 Billion industry that accounts for 11% of Canada’s manufacturing gdp. about 200 communities depend on forest-related activities and about 235,000 people are employed in the sector. many Canadian pulp and paper plants shut down over the last 20 years after a steep downturn in the industry. the industry needed to look for new opportunities for both cost reduction and growth.
early bioenergy development was chiefly about renewable heat and power produced in cogeneration facilities built by pulp companies or independent power producers. Beginning in 2000, the wood pellet industry began to grow significantly to supply regulation driven offshore markets, primarily in europe. a number of ethanol and biodiesel plants were built to help achieve domestic targets for renewable transportation fuels.
1 NRCan. (2013) Bioenergy Systems. Retrieved from: https://www.nrcan.gc.ca/energy/renewable-electricity/bioenergy-systems/7311

7
2014 CanBio RepoRt on the StatuS of BioeneRgy in Canada
2.0 poLiCy

8
2014 CanBio RepoRt on the StatuS of BioeneRgy in Canada
2.1 fedeRal initiativeS federal and provincial governments are helping the bioenergy industry based on sustainably managed renewable resources with initiatives and programs targeting R&d and innovation, greenhouse gas (ghg) reductions, energy efficiency, and tax incentives. programs support the development of biotechnologies at the R&d stage, and also help move demonstration projects through to commercialization. federal departments have numerous initiatives and programs aimed at supporting the development of biomass into bio-heat, power and bio-fuels from agricultural waste products, municipal solid waste, and forestry sectors, as well as other value-added bio-products such as chemicals. the following sections highlight some of the programs that have made key contributions to the development of bioenergy in Canada.
2.1.1 ReneWaBle heat and poWeRWhile government policies and incentives were initially focused on biofuels, there has been increased focus on policy development supporting bio-heat and power. through the nRCan program of energy Research and development (peRd), research work is being done on the development of tools and knowledge for an in-depth understanding of the availability of Canada’s renewable resources, including biomass from forestry, agriculture and municipal sources, as well as for developing improvements in biomass conversion technologies. nRCan has been working with external proponents on responsibly developing renewable energy demonstration projects involving bio-refinery processes to convert wood fibre into pulp and paper products and biochemical and energy products such as heat, power and transportation fuels. through the development of strategic frameworks and partnerships, nRCan, among other departments, is supporting sector transformation through innovation and market diversification.

9
2014 CanBio RepoRt on the StatuS of BioeneRgy in Canada
tABlE 2.1
federal policies to Support Renewable heat and power from forest, agriculture and municipal Sectors
oRgAnizAtion(S) initiAtivE dESCRiption implEmEntEd
natural Resources Canada (nRCan)/ Canadian forest Sector (CfS)
Pulp & Paper Green Transformation Program (PPGTP)
$1 billion in funding support to improve the environmental performance of CDN pulp & paper mills while helping to improve the economic sustainability of paper mills
2009–2013
Investments in Forest Industry Transformation (IFIT)
$100 million aimed at first-in-kind technologies in the area of bioenergy as well as biomaterials and biochemical. Renewed with another $90.4 million in 2014
2010–ongoing
Aboriginal Forestry Initiative (AFI)
Focused on fostering Aboriginal participation in transformation of Canada’s forest sector. Bioenergy is a priority area and $2 million has been provided for 5 projects in remote & northern Aboriginal communities
2011
nRCan/office of Energy Research & development
Program of Energy Research & Development (PERD)
Supports R&D that develops sustainable biomass supply chains, improves feedstock logistics, & advances biomass conversion
2013–2015
PERD Supports R&D that optimizes the biomass feedstock supply including sustainability considerations, advances biomass processing technologies, & develops advanced liquid biofuels
2015–2019
ecoEnergy Innovation Initiative
Support a suite of demo projects focused on clean energy & efficiency: modular combined heat and power (CHP) systems using local woody biomass & waste, energy via anaerobic digestion, & biomass gasification
2011
Clean Energy Fund—Smaller-Scale Demonstration
Funds smaller-scale demo projects including high efficiency high-solid anaerobic digestion system from organics; 5-bioenergy systems (biogas, bio-oil, waste heat, syngas, & biocarbon); biomass gasification with integrated internal combustion system, CHP suited for multiple industrial & community applications
2009

10
2014 CanBio RepoRt on the StatuS of BioeneRgy in Canada
oRgAnizAtion(S) initiAtivE dESCRiption implEmEntEd
Aboriginal Affairs & northern development (AAndC)
ecoEnergy for Aboriginal & Northern Communities Program
To reduce GHG emissions from electricity and heat generation in Aboriginal & northern communities by supporting the development & implementation of renewable energy projects. (bioenergy utilizing direct combustion of woody biomass)
2011
First Nation Infrastructure Fund
Provided $234 million between 2007–2013 in support of on-reserve public infrastructure, including energy systems
2007–2013
national Research Council Canada (nRC)
Bioenergy Systems for Viable Stationary Applications Program
The NRC bioenergy program will channel a critical mass of expertise into projects to optimize biofuel production and upgrading, resolve biofuel-power plant compatibility issues, & lower the capital and operating costs for bioenergy systems and components
2013
2.1.2 ReneWaBle fuelSin 2006, environment Canada (eC) issued a notice of intent for the impending biofuel regulation and renewable fuel standard (RfS). the federal Renewable fuel Regulations, finalized and established in September 2010, specified that an annual average renewable content of 5% bio-ethanol was required in the gasoline pool as of december 15th 2010. a 2% requirement for renewable content in diesel fuel and heating oil began on July 1st 2011, with a compliance period ending december 31st 2012. eC is responsible for overseeing the regulations related to the RfS and also plays an important role conducting science and research related to air quality, vehicle emissions and climate change.
in addition to the RfS, the federal government furthered its commitment to developing renewable fuels and other valuable co-products through a variety of programs and grants working with industry in research, technology and feedstock development, as well as demonstration projects. Several of the federal programs have now expired.

11
2014 CanBio RepoRt on the StatuS of BioeneRgy in Canada
tABlE 2.2
federal policies to Support Renewable fuels
oRgAnizAtion initiAtivE dESCRiption StARt/End
natural Resources Canada (nRCan)
ecoEnergy for Biofuels
Financial Support: $1.5 billion, operating incentive to facilities that produce renewable alternatives to gasoline & diesel
2008–2017
Ethanol Expansion Program
Financial contributions with repayment terms towards the construction of new or expansion ethanol fuel production facilities.
2003–2007
National Renewable Diesel Demonstration Initiative
Supported projects that demonstrate how renewable diesel will perform under Canadian conditions. Contributions were made to projects designed to demonstrate cold weather operation, long term storage, impacts on engines & equipment & distribution of the fuel.
2008–2010
Agriculture & Agri-food Canada (AAfC)
Biofuels Opportunities for Producers Initiative (BOPI)
Designed to help farmers & rural communities hire experts to help develop business proposals to expand biofuels production capacity by agricultural producers
2006–2008
Agricultural Bioproducts Innovation Program
Funded networks promoting R&D, technology transfer & commercialization in areas such as biofuels, other forms of bioenergy, industrial chemicals, biomaterials, & health products
2006–2011
ecoAgricultural Biofuels Capital Initiative (ecoABC)
Financial Support: $159 million (up to $25 million per project) to build or expand transportation biofuel production facilities
2003–2012
AAFC Growing Forward 2’s Programs
Financial Support: $3 billion — focused on research & innovation, competitiveness & market development, adaptability & industry capacity
2013–2018

12
2014 CanBio RepoRt on the StatuS of BioeneRgy in Canada
oRgAnizAtion initiAtivE dESCRiption StARt/End
Sustainable development technology Canada
SD Tech FundTM Financial Support: Over $500 million towards late-stage development & pilot, pre-commercial clean tech, like advanced renewable fuels, heat and power
2002–2015
Sustainable development technology Canada
Next Gen Biofuels FundTM
Financial Support: $500 million towards bridging the gap between technology & market development. Aimed at 1st-of-kind commercial scale demo facilities for advanced renewable fuels & co-products
2007–2017
2.2 pRovinCial initiativeSprovinces have also undertaken measures to encourage investment in bioenergy capacity to reduce reliance on fossil fuels, support renewable energy standards where they exist and create value-added opportunities. Several provinces have mandated renewable fuel content and announced infrastructure grants. Key provincial initiatives are summarized below:
BRitiSh ColumBia:• the mountain pine beetle (mpB) infestation had killed 51% of lodgepole pine
volumes in British Columbia’s interior by 2010. the provincial government raised the annual allowable cut (aaC) from a 50 mm3 to 80 mm3 in 2010 to harvest this dead pine for wood products and bioenergy before it decayed or burned in natural fires.2
• in the 1990’s sawmills were required to incinerate unused mill residue, thus wasting the biomass and emitting dangerous particulate matter. the closure of beehive burners was legislated in 1995, but life extensions left many still running. all remaining beehive burners must be closed as of december 31, 2016.3
2 BC Ministry of Forests, Lands & Natural Resources. Mountain Pine Beetle Epidemic presentation 2012. Retrieved from: http://www.leg.bc.ca/cmt/39thparl/session-4/timber/presentations/mofLnRo_mountain_pine_Beetle_Current_Status_and_projections_2012Jun4.pdf
3 Government of BC. (2013) Wood Residue Burner and Incinerator Regulation. Retrieved from: http://www.bclaws.ca/Recon/document/id/freeside/51_519_95

13
2014 CanBio RepoRt on the StatuS of BioeneRgy in Canada
• the BC Bioenergy network was set up in 2008 to deploy near-term bioenergy technology capital for pilot and demonstration plants, and to support education and advocacy for the sector. By the end of 2013 it will have spent $16.1 million to advance bioenergy developments in BC.
other initiatives include the introduction of the 2008 carbon tax, which imposed a price on the use of carbon-based fuels (e.g. gasoline, diesel, propane, natural gas and coal); the carbon neutral public sector policy, which required all public sector organizations to measure, reduce and offset ghg emissions from buildings, vehicles and paper use; and the innovative clean energy (ice) fund, which approved over $77 million for 62 projects developing clean energy and technologies in the province.
queBeC:• the Quebec government took an approach unique in Canada. Rather than
keep wood allocation decisions at the upper echelons of government, Quebec allowed regional economic development groups, or CRe’s (Conseil régionale de l’environnmente) to examine local bioenergy proposals and allocate wood where it would best help communities. CRes are comprised of mayors, economic development organizations, and local stakeholders.
• in 2008, the Quebec government allocated $150 million to promote the conversion of municipal and institutional heavy oil heating to biomass through direct grants.
• in 2013, the Quebec government introduced a cap and trade system for ghg emissions. Businesses operating in Quebec that emit more than 25,000 tonnes or more of Co2 equivalent each year are subject to the cap and trade system. these businesses require emission allowances to operate. each emission allowance is equal to one tonne of C02 equivalent and is issued exclusively by the Quebec government. for the first compliance period of 2013–2014, only industrial and electricity sectors are subject to the system. the second and third compliance periods (2015–2017 and 2018–2020) includes fossil fuel distributors. the cap and trade system is also open to other individuals and entities that would like to participate in the carbon market. in 2011, the Quebec government established a program under hydro Quebec for the purchase of 150 mW, later amended to 300 mW of electricity produced in Quebec from cogeneration plants burning residual forest biomass.

14
2014 CanBio RepoRt on the StatuS of BioeneRgy in Canada
ontaRio:• ontario learned from european experience that feed-in-tariffs (fit) were the
most effective incentive for renewable energy. however the fit programs were much better subscribed in the wind and solar power sectors than in bioenergy. the ontario power authority Standard offer program in 2007 yielded 262 power contracts: 69 for wind, 158 for solar, and only four for biomass heat and power. under a second program in 2009, 184 projects were approved: 77 solar, 48 wind, and two biomass.4 the 2009 green energy and economy act led to the creation of a two-year fit program starting october 2011, where 99% of contracts executed were for solar. the fit programs did not take into consideration that one of the great benefits of bioenergy is renewable heat. the process of allocating provincial wood resources also held up many potential bio-energy projects.
• a major policy success was for on-farm biogas where ontario is a leader. the farm innovation program (fip), the Canadian agricultural adaptation program (Caap), and the ontario fit/microfit programs, made funding and tax incentives available for initial planning, building, and implementing of farm biogas projects.
• in august 2007, the ontario government introduced the environmental protection act: ontario Regulation 496/07 Cessation of Coal use. the regulation required that the ontario power generation (opg) phase out the use of coal to produce electricity after december 31, 2014. this regulation was fulfilled on april 8, 2014, when ontario stopped burning coal at its thunder Bay generating Station. in august 2014, the opg completed its conversion of the atikokan generating Station, which now burns wood pellets for peak load power production. the opg is currently converting the thunder Bay generating Station to burn torrefied pellets, an advanced biomass fuel that exhibits coal like properties and has similar heat content to coal. in September, 2014 the opg signed a supply agreement with arbaflame, a norwegian company.
4 OPA. (2014) FIT Program Updates, 2014. Retrieved from: http://fit.powerauthority.on.ca/program-updates/past-updates/bi-weekly-fit-and-microfit-program-reports-version-1

15
2014 CanBio RepoRt on the StatuS of BioeneRgy in Canada
manitoBa:• in 2011, manitoba announced an emissions tax on coal in anticipation of a pending
ban on coal heating, thereby giving many small coal users time to make the switch to alternatives. as of January 1st 2014, manitoba’s Conservation and Water Stewardship introduced north america’s first petroleum coke and coal heating ban with a grace period up to July 1st, 2017 given approved conversion plans are filed by June 30th, 2014.5 fines will be charged to those who do not comply or implement the submitted conversion plans. the ban is designed to reduce the ghg emissions associated with burning coal.
• manitoba has introduced the $400,000 Biomass energy Support program to help users of coal and biomass processors make the transition from coal towards bio-based energy systems and supply chains. this program will help the development of a renewable industry, create jobs and use the three to five million tonnes of biomass available annually in manitoba.6
alBeRta• in 2006, the alberta government introduced the nine point Bioenergy plan
that included a variety of policy measures that encouraged the development of biofuels and bioenergy infrastructure; facilitated the establishment of bio-industrial networks; established micro-generation standards for bioenergy; improved taxation and investments instruments for the bioenergy sector; and established the renewable fuel standard,
• in 2008, the alberta government implemented the Climate Change Strategy and introduced the Specified gas emitters Regulation. this regulation targets the ghg emissions of large industrial emitters, whose emissions intensities exceed 100 kt Co2e annually. these large emitters are given the following three options: make improvements to their operations to secure emissions reductions, purchase offsets or emissions performance credits or pay into the Climate Change emissions management fund at a rate of $15 per tonne for any emissions exceeding the target. the fund is earmarked for the development of new technologies for reducing ghg emissions and has collected $398 million since 2008. the fund has allocated $213 million to 51 clean technology projects.
5 Government of Manitoba. News release, Ban Designed to Cut Greenhouse-gas Emissions, December 23, 2013. Retrieved from: http://news.gov.mb.ca/news/index.html?archive=&item=20070
6 Government of Manitoba. (2013) Manitoba Biomass Energy Support Program Q&A Report, Retrieved from: http://www.gov.mb.ca/agriculture/innovation-and-research/biomass-energy-support-program.html

16
2014 CanBio RepoRt on the StatuS of BioeneRgy in Canada
2.3 inteRnational Biofuel developmentSeuropean union (eu) leaders enacted a climate and energy package in 2009 committing europe to become an energy-efficient, low carbon economy via the legally-binding “20-20-20” targets for 2020:7
• a 20% reduction in eu ghg emissions from 1990 levels;
• a 20% share of eu energy consumption produced from renewable resources;
• a 20% improvement in the eu’s energy efficiency.
however the targets are being adjusted because of the slow recovery from the recent economic downturn and the different paths to renewable energy being chosen by various eu countries. the legally binding obligation to reduce emissions 20% by 2020 is now being negotiated by eu leaders. a main piece of the framework is the target to reduce domestic ghg emissions by 40% below 1990 levels by 2030. the commission also proposes to increase the share of renewable energy to at least 27% of energy consumption by 2030.
Specific to biofuels, the eu Renewable energy directive (Red) adopted in 2009, made a commitment to source 10% of transport fuel from renewable sources by 2020. the european Commission then revealed proposals to change its biofuels policy to limit the amount of food crop-based biofuels and bio-liquids that can be counted towards the 10% target. the eu has proposed a 5%8 cap on first-generation biofuels but member states are in disagreement over what the cap should eventually be. negotiations continue, but the eu intends to develop second-generation biofuels made from non-food feedstock, such as waste materials or algae to meet the 10% target.
7 EU. (2013) European Commission 2020 Climate & Energy Package. Retrieved from: http://ec.europa.eu/clima/policies/package/
8 EU. (2013) European Commission, RE Targets by 2020. Retrieved from: http://ec.europa.eu/energy/renewables/targets_en.htm

17
2014 CanBio RepoRt on the StatuS of BioeneRgy in Canada
3.0 uSeRS of BiomaSS/BioeneRgy pRoduCeRS

18
2014 CanBio RepoRt on the StatuS of BioeneRgy in Canada
3.1 CogeneRation — induStRial heat and poWeR pRoduCeRS (pp’S & ipp’S)
3.1.1 CogeneRation pulp & papeR the 2013 Canadian Bioenergy data Survey showed 39 p&p mills operated cogeneration facilities. thirty-six reported power-generating capacity, totaling 1,579 mW, with 46% of this generation is in BC.
tABlE 3.1
number of pulp and paper mills with Cogen
mwE % opERAting REpoRting
BC 726.5 46.0% 14 14
AB 275.0 17.4% 4 4
nB 147.7 9.4% 6 5
on 184.0 11.7% 6 4
QC 144.0 9.1% 5 5
SK 40.0 2.5% 1 1
mB 22.0 1.4% 1 1
nS 25.0 1.6% 1 1
nf 15.0 0.9% 1 1
total 1,579.2 100% 39 36
Source: 2013 Canadian Bioenergy Data Survey.
the pulp and paper sector is one of Canada’s most energy-intensive sectors, with energy typically accounting for more than 25% of total production costs. to reduce costs in an increasingly competitive world, the sector turned to on-site mill residues, pulping liquor, and residues from nearby sawmills to generate the combined heat and power (Chp) needed for operations. other manufacturers also began using biomass over fossil fuels as a cleaner, more economic option for heat and power production. however after a 2005 peak, there was a decline in biomass produced energy. a long-term structural weakening in the paper sector in general and the

19
2014 CanBio RepoRt on the StatuS of BioeneRgy in Canada
newsprint sector in particular reduced domestic demand for pulp. in addition, with increased globalization of the pulp and paper industry, many Canadian mills became uncompetitive and were forced to shut down, thereby necessitating the shutdown of adjacent cogeneration facilities as well.
in 2004–06 the uS housing industry became super-heated and the demand for Canadian lumber peaked, with the availability of mill residue reaching an all-time high of approximately 21.2 million bone dry tonnes (Bdt).9 the 2007 uS housing market collapsed, touching off a worldwide financial crisis, and the demand for Canadian lumber declined rapidly, reducing mill residue availability in 2010 to only 50% of what it was in 2005. the resulting decline in energy produced from biomass is illustrated below.
figuRE 3.1
energy use from Biomass10
9 Statistics Canada. Canadian Sawmill Data, 2013. Retrieved from: http://cansim2.statcan.ca/cgi-win/cnsmcgi.pgm?Lang=e&Sp_action=Result&Sp_id=3416&Sp_typ=2&Sp_Sort=-0
10 OEE. (2013) Comprehensive Energy Use Database, Retrieved from: http://oee.nrcan.gc.ca/corporate/statistics/neud/dpa/showtable.cfm?type=Cp§or=egen&juris=ca&rn=1&page=4&Cfid=29285441&CftoKen=d1f50966c5498ff6-64197223-d655-9180-4f0209d76eB1dB7e
Total Industrial P&P Other Manufacturing
Ene
rgy
pro
duc
ed f
rom
Wo
od
& P
ulp
ing
liq
our
(P
J)
ENERGY USE IN THE CANADIAN INDUSTRIAL SECTOR: PRODUCED FROM WOOD WASTE & PULPING LIQUOR
0
100
200
300
400
500
600
700
1990 1995 2000 2005 2010
Year

20
2014 CanBio RepoRt on the StatuS of BioeneRgy in Canada
despite the decline, about 5,380 gigawatt hours (gWh) of electricity was generated using woody biomass and spent pulping liquor as fuel in 2010, representing about 1% of the electricity produced in Canada.11 in addition to sourcing almost 60% of their energy needs from by-products including hog fuel, sludge, and spent pulping liquor,12 the sector has found a solution to disposing a majority of their waste products. By pursuing efficiency gains in energy generation, pulp and paper manufacturers have reduced their energy use by 1% p.a. since 1990.13 as of Q3, 2012 11 pulp and paper mills in Canada met or exceeded their internal electricity demand by self-generation.14 though biomass is increasingly being used for community heat, the majority of wood-derived fuels are used by the industrial sector.
in 2009, the federal government announced the pulp and paper green transformation program, a $1 billion fund to improve the environmental performance of Canada’s pulp and paper mills and renew the industry’s position in the global marketplace. in total, 24 companies received credits based on black liquor production, and 98 project proposals were approved in 38 communities nationwide.15 funding ranged from $80 000 to over $100 million per project. projects undertaken included boiler and turbine upgrades, installation of energy-efficient motors and emission-control equipment and renewable energy production. the program helped to support more than 14,000 jobs and resulted in 195 mW of new renewable energy capacity.
tABlE 3.2
new Renewable energy Capacity due to ppgtp
2010 2011 2012 2013 2014 pEnding totAl
new Capacity 27.4 19.0 66.0 51.5 2.0 29.1 195.0
Source: 2013 Canadian Bioenergy Data Survey.
of 39 cogeneration plants, 34 reported feedstock data. overall, 857 mW, or 59% was produced from pulping liquor, 325 mW from wood waste, and 165 mW from hog fuel. in all 39 plants, 92% is biomass-based capacity and 8% is from fossil fuels.
11 Ibid12 NRCan. (2006). Benchmarking Energy Use in Canadian Pulp and Paper Mills. Retrieved from:
http://www.nrcan.gc.ca/sites/oee.nrcan.gc.ca/files/pdf/industrial/technical-info/benchmarking/pulp-paper/pdf/benchmark-pulp-paper-e.pdf
13 NRCan, (2006). Benchmarking Energy Use in Canadian Pulp and Paper Mills.14 Fisher International. FisherSolve, Norwalk, CT, (2012). Annual Power Usage. Retrieved from:
http://www.fisheri.com/15 NRCan. (2012) Pulp & Paper Green Transformation Program, Report on Results. Retrieved from:
http://cfs.nrcan.gc.ca/pubwarehouse/pdfs/34045.pdf

21
2014 CanBio RepoRt on the StatuS of BioeneRgy in Canada
tABlE 3.3
power production by feedstock
hog fuEl
pulping liQuoR
wood wAStE
nAtuRAl gAS
hEAvy fuEl oil totAl
Capacity 165.3 857.0 324.9 107.7 7.3 1,462.2
percentage of total capacity
11.3% 58.6% 22.2% 7.4% 0.5%
Source: 2013 Canadian Bioenergy Data Survey.
3.1.2 CogeneRation independent heat & poWeR pRoduCeRS:Large heat and power is not only found at pulp and companies. in Canada there are 23 ipps, including eight in BC. of these, four have an adjacent industrial operation that purchases heat enabling the ipps to produce both heat and power at a higher efficiency than if they produced only power. Combined capacity is 540 mWe and 148 mWth for a total of 688mW.
tABlE 3.4
2013 Bioenergy Capacity by ipp’s
mwe mwth mw #
BC 138.3 147.8 286.1 8
AB 78.5 0.0 78.5 4
on 191.2 0.0 191.2 4
QC 70.6 0.0 70.6 5
nS 61.2 0.0 61.2 2
total 539.8 147.8 687.6 23
Source: 2013 Canadian Bioenergy Data Survey.

22
2014 CanBio RepoRt on the StatuS of BioeneRgy in Canada
two more plants with a combined capacity 241 mWe are in the commissioning stage, seven are under construction, and three more are planned.
tABlE 3.5
Capacity of future ipp plants
mwe #
Commissioning 241 2
under Construction 135 7
planned 92 3
total 468 12
Source: 2013 Canadian Bioenergy Data Survey.
ipps that use biomass draw on a combination of wood waste and hog fuel, sourced onsite and from local sawmills. a few plants also use natural gas to ensure sufficient fuel to run the power generation facility. in 2013, ontario ipps generated 70.7 mWe from biomass and 120.5 mWe from natural gas.
tABlE 3.6
2013 power generation Capacity by fuel (mWe)
BiomASS n.gAS totAl
BC 138.3 138.3
AB 78.5 78.5
on 70.7 120.5 191.2
QC 70.6 70.6
nS 61.2 61.2
total 419.3 120.5 539.8
% 78% 22% 100%
Source: 2013 Canadian Bioenergy Data Survey.

23
2014 CanBio RepoRt on the StatuS of BioeneRgy in Canada
in 2013, 16 of the 23 operating ipp cogeneration plants reported a total of 510 workers or an average of 32 employees per plant. that may appear low, but cogeneration plants are often in small communities where that number of jobs is significant. the majority of plants either received biomass feedstock onsite or from local sawmills. however, with mill residues now increasingly scarce in some localities, some plants are sourcing feedstock from a wider area requiring more indirect employees such as truck drivers. three plants reported employment of 80, or an average of 27 per plant. three plants reported indirect employment at an average of three persons per plant.
tABlE 3.7
employment by ipps
plAntS fEEdStoCK indiRECt
Employment 510 80 9
# plants 16 3 3
Average 32 27 3
Source: 2013 Canadian Bioenergy Data Survey.

24
2014 CanBio RepoRt on the StatuS of BioeneRgy in Canada

25
2014 CanBio RepoRt on the StatuS of BioeneRgy in Canada
the biological process of breaking down organic material in an
oxygen-free environment is referred to as anaerobic digestion (Ad).
this process produces a combination of methane and carbon dioxide
called biogas, and other nutrient-rich byproducts.16 furthermore,
the key element resulting from this process is methane that if
compressed, can be used as a replacement renewable natural
gas (Rng) to fuel motor vehicles.
4.0 BiogaS

26
2014 CanBio RepoRt on the StatuS of BioeneRgy in Canada
16
Biogas systems can create energy from a variety of waste streams, including onsite organic farm waste and industrial, commercial, and institutional waste streams from food processing plants, slaughterhouses, schools and hospitals. the primary feedstock in farm-based biogas systems is manure but many other materials may be digested including energy crops (corn silage, hay and grasses), other agricultural inputs, oils and greases from urban centers, and beef and potato renderings. all regions of Canada have significant agricultural activity and institutional waste streams that could be utilized to generate energy and revenue while reducing waste, and to extend landfill capacity and lifetime, among other environmental benefits. according to the ontario Biogas association (Ba), there are multiple applications and benefits for biogas, such as:17
• fueling combustion engines to run a generator, producing electricity and heat (Chp)
• upgrading to Rng for injection into the natural gas grid, delivering “green” renewable energy through existing infrastructure
• Compressing biogas-sourced Rng for use as a transportation fuel, or as a direct replacement of fossil-sourced natural gas in household heating, or industrial, commercial and institutional processes.
data on biogas installations is not widely publicized or available. the biogas category was new to the 2012 data Survey, which identified 43 biogas systems in operation in Canada. the 2013 data Survey identified 77 biogas systems, some of which were newly started.
tABlE 4.1
Biogas Systems in operation in Canada 2013
16 OMAFRA. (2013) Bioenergy: Biogas (Anaerobic Digestion). Retrieved from: http://www.omafra.gov.on.ca/english/engineer/ge_bib/biogas.htm#1
17 Biogas Association (2013) About Biogas. Retrieved from: http://www.biogasassociation.ca/bioexp/index.php/infopage/about_biogas
Source: 2013 Canadian Bioenergy Data Survey.
REgion opERAting CApACity (Kw)
BC 7 2,400
AB 10 9,075
SK 3 4,030
mB 2 70
on 37 27,223
REgion opERAting CApACity (Kw)
QC 14 63,096
nB 3 1,500
pEi 1 1,200
nfl 0 0
total: 77 108,594

27
2014 CanBio RepoRt on the StatuS of BioeneRgy in Canada
ontario is the clear leader in on-farm ad installations with 37 operational biogas facilities. Quebec has 14 and alberta 10. Quebec has fewer than half the installations as ontario, but the total capacity of 63 mW doubles that in ontario because of the output of five large Quebec plants.
ontario’s development was driven by various provincial incentive programs including the ontario Biogas Systems financial assistance program that invested $11.2 million into 27 biogas systems. also implemented were fip, Caap, and ontario fit/microfit programs, whereby funding and tax incentives became available for initial planning, building, and implementing on farm biogas projects.
however, ontario’s microfit program did not prove successful in supporting bioenergy growth. a march 2014 program update showed no successful applicants in biogas, biomass and landfill focused projects and the number of bioenergy applications is declining. for the fit program, 57 biogas applications were under review as of January 2014. to promote greater growth in the biogas sector, necessary changes to the fit programs are needed. this could include a more streamlined renewable environmental approval process, and priority access to the grid since biogas generates reliable, flexible and dispatchable power.
in Quebec, the provincial government implemented a regulation in 2005 aimed at minimizing the environmental impact of biogas in landfills, and requiring those that bury more than 50,000 tonnes of waste annually to capture or properly dispose of the biogas. the Quebec government created the Biogas programme committing $38 million over six years in financial support to projects focused on the capture or disposal of biogas to reduce ghg emissions. alberta leads the west with ten known operational biogas installations, while BC is catching up with three biogas projects in development.
there are now 51 known biogas projects that are currently in development, either under construction, in the feasibility stage or proposed. ontario, with 44 of the projects, clearly exhibits a strong commitment to biogas heat and power development on farms.

28
2014 CanBio RepoRt on the StatuS of BioeneRgy in Canada
tABlE 4.2
Biogas Systems in development in Canada 2013
REgion opERAting
CommiSSioning & ConStRuCtion
StAgEfEASiBility
StAgE pRopoSEd
BC 7 3 0 2
AB 10 0 3 1
SK 3 0 0 0
mB 2 0 0 0
on 37 6 28 16
QC 14 3 0 0
nB 3 0 0 0
pEi 1 0 0 0
nfl 0 1 1 0
total: 77 13 32 19
Source: 2013 Canadian Bioenergy Data Survey.
in BC, biogas development was limited because of regulatory challenges and low natural gas prices. the ministry of environment in BC had an on-farm ad Waste discharge authorization that put a limit of 25% on the allowable volume of non-agricultural feedstocks that an on-farm anaerobic digestion system can use. this type of regulation significantly impacts economic viability and restricts biogas project development to sites with an ideal combination of farm size, access to desirable feedstocks and good proximity to interconnection sites. a higher electricity tariff and funding are needed to help make biogas projects economical for farm developments in BC.
Biogas in alberta has started to gain attention in the agriculture industry due to its energy potential and environmental benefits. the alberta Bioenergy producer Credit program offers incentives for commercial bioenergy production that should increase the number of biogas systems.

29
2014 CanBio RepoRt on the StatuS of BioeneRgy in Canada
Renewable energy plans in atlantic Canada are emerging and two regional solid waste projects are being developed in new Brunswick. Laforge, the first on-farm anaerobic digestion system, became operational in 2011. nova Scotia introduced a feed-in tariff program in 2010 and to-date has approved 85 projects, including six biomass projects and two biogas projects (on-farm & landfill).18
4.1 feedStoCkS: the primary feedstock in farm-based biogas systems is manure, but many other materials may be used including energy crops (corn silage, hay and grasses), other agricultural inputs, oils and greases from urban centers, and institutional waste streams from food processing plants, slaughterhouses, schools and hospitals. the methane captured from the process can run a generator producing electricity and heat, be upgraded to Rng for injection into the natural gas grid, or be compressed for use as a transportation fuel or to replace natural gas in household heating, industrial, commercial and institutional processes.
the three largest systems by far, with combined capacity of 44.9 mW, are in Quebec. however these facilities did not report the source of their feedstock. overall, there are 18 other large systems over 1 mW with combined capacity of 48.5 mW, with eight of these systems not reporting the source of their feedstock. of the remaining 10 large systems, three used mSW as a feedstock and the rest used a variety of agricultural wastes including manure.
according to the ontario Ba, there are 3,000 food-processing plants, 140 slaughterhouses, and numerous schools, cafeterias, and hospitals that generate and separate organics that could supply organic wastes to between 400 to 500 anaerobic digesters.19
4.2 employmentthe 2013 data Survey did not retrieve information on employment in the biogas sector. however the Biogas association (Ba) commissioned a Canadian Biogas Study released in 2013 highlighting the sectors job potential.
18 Government of Nova Scotia. (2014) Report on the Review of the Community Feed-In-Tariff Program, March 2014. Retrieved from: http://energy.novascotia.ca/sites/default/files/a_comfit_review_report_march_2014.pdf
19 Biogas Association. (2013) FIT Program Two-Year Review. Retrieved from: http://www.biogasassociation.ca/bioexp/images/uploads/documents/2012/singleposts/apao_Briefing_note_fit_program.pdf

30
2014 CanBio RepoRt on the StatuS of BioeneRgy in Canada
the Ba study findings related to employment in the biogas sector:20
• Biogas can create 2,500 technical, manufacturing and construction/trades jobs in ontario
• Biogas can generate $1 to $1.5 billion dollars of investment in rural economic development, as proven in germany with its similar agricultural base
• Realizing the full potential of biogas development would lead to up to 1,800 separate construction projects with a capital investment of $7 billion and an economic spin-off of $21 billion to the Canadian economy.
• Construction projects would create 16,700 construction jobs for a period of one year and 2,650 on-going long-term operational jobs.
finally, the biogas sector could positively affect and support over 100 new and expanded companies, including biogas system designers and developers, equipment suppliers, and laboratories.
20 Biogas Association. (2013) Canadian Biogas Study 2013. Retrieved from: http://www.biogasassociation.ca/bioexp/images/uploads/documents/2013/resources/Canadian_Biogas_Study_Summary.pdf

31
2014 CanBio RepoRt on the StatuS of BioeneRgy in Canada
5.0 Community heating in Canadafuel wood is a local, economical, and renewable energy resource
that is used in more than three million Canadian homes as a source
of heat.22 the rising cost of fossil fuel in the last 10–20 years and
a growing awareness of biomass energy gave rise to the use of
efficient multi-building biomass boilers, particularly in areas not
connected to a natural gas pipeline.

32
2014 CanBio RepoRt on the StatuS of BioeneRgy in Canada
21
over the last three years, the survey discovered that the most notable growth in bioenergy installations in Canada has been in bio-heat. Before 2000, there were only five community bio-heat systems in Canada; a municipal building heating system in Charlottetown; a hospital in montague, pei; a nova Scotia agricultural College; the Cree first nation plant in oujebougamou, Quebec, and opeongo forestry in Renfrew, ontario. until 2006, there was only a smattering of bio-heat developments, yet in the last five to six years there has been a proliferation of development, primarily in BC, the nWt and in Quebec.
the 2013 survey revealed 74 installations operating in 2012 which further grew to 109 in 2013. another 33 were under construction or being commissioned, 15 were in feasibility studies, and 41 planned. BC and the nWt are clear leaders with 30 and 29 installations respectively. ontario and Quebec have 11 operating, but Quebec is on the verge of serious growth based on the number under construction or in planning. a new initiative in pei is spurring development, with nine systems operating and 14 under construction. When those projects under construction are complete, Canada will have 142 operating systems compared with the five systems that existed in 2000.
tABlE 5.1
Community heat installations in operation by province
2000 2011 2012 2013 u.ConStR. fEASiBility plAnnEd
BC 22 22 30 4 20
AB 3 3 3
SK 2 2 2
mB 0 0 0 1
on 1 3 3 11 1
QC 1 10 10 11 5 15 18
nB 7 7 8
nS 1 0 1 3
pEi 2 3 3 9 14
nl 0 0 0 0 1
nwt 19 20 29 8 2
yK 1 3 3
total 5 70 74 109 33 15 41
Source: 2013 Canadian Bioenergy Data Survey.
21 NRCan. Forest Communities Program, 2013. Retrieved from: https://www.nrcan.gc.ca/forests/federal-programs/13135
33
2014 CanBio RepoRt on the StatuS of BioeneRgy in Canada
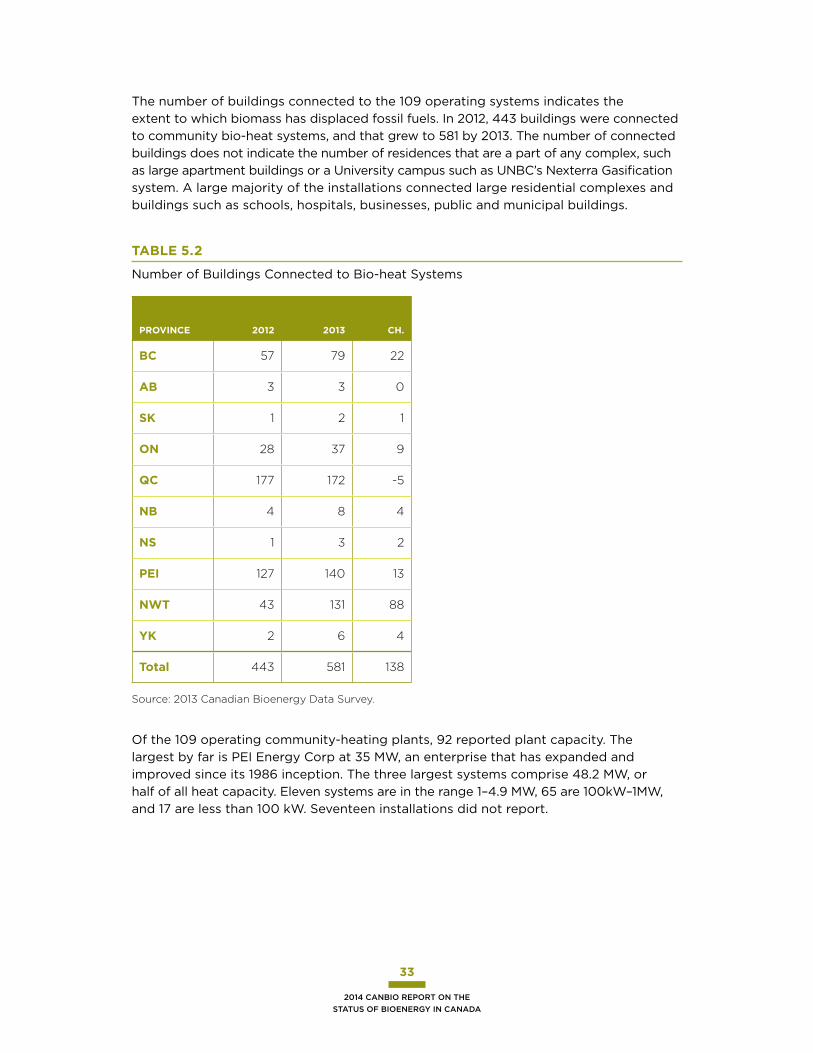
the number of buildings connected to the 109 operating systems indicates the extent to which biomass has displaced fossil fuels. in 2012, 443 buildings were connected to community bio-heat systems, and that grew to 581 by 2013. the number of connected buildings does not indicate the number of residences that are a part of any complex, such as large apartment buildings or a university campus such as unBC’s nexterra gasification system. a large majority of the installations connected large residential complexes and buildings such as schools, hospitals, businesses, public and municipal buildings.
tABlE 5.2
number of Buildings Connected to Bio-heat Systems
pRovinCE 2012 2013 Ch.
BC 57 79 22
AB 3 3 0
SK 1 2 1
on 28 37 9
QC 177 172 -5
nB 4 8 4
nS 1 3 2
pEi 127 140 13
nwt 43 131 88
yK 2 6 4
total 443 581 138
Source: 2013 Canadian Bioenergy Data Survey.
of the 109 operating community-heating plants, 92 reported plant capacity. the largest by far is pei energy Corp at 35 mW, an enterprise that has expanded and improved since its 1986 inception. the three largest systems comprise 48.2 mW, or half of all heat capacity. eleven systems are in the range 1–4.9 mW, 65 are 100kW–1mW, and 17 are less than 100 kW. Seventeen installations did not report.

34
2014 CanBio RepoRt on the StatuS of BioeneRgy in Canada
tABlE 5.3
Community heating plant Capacities (kW)
# CApACity Kw
pEi Energy Corp. PEI 1 35,000
Cf matapedia — CSSS mont Joli QC 1 8,200
la Cité verte QC 1 5,000
large >5mw 3 48,200
medium 1–4.9 mw 11 21,504
Small 100 kw–1 mw 65 26,916
very Small (< 100 kw) 13 477
not Reported 17 0
total 109 97,097
Source: 2013 Canadian Bioenergy Data Survey.
heating plants use various raw materials. in the nWt, wood pellets feed almost all of the systems. in BC, 15 use wood pellets while 20 use either wood waste or hog fuel. Quebec did not report, but it is known that some of the heat plants use harvest residues.

35
2014 CanBio RepoRt on the StatuS of BioeneRgy in Canada
tABlE 5.4
feedstock of heating plants
CoRd wood hog fuEl mSw
willow ChipS
wood pEllEtS
wood wAStE
not AvAilABlE
AB 2 1 1
BC 12 2 15 8 4
nB 1 1
nS 2 1
nwt 1 25
on 9 ?
pEi 7 1 1
QC 1 1 18
SK 2 1
yK 1 1
total 1 34 4 2 44 12 23
Source: 2013 Canadian Bioenergy Data Survey.
in Canada, there are many remote and semi-remote aboriginal communities that use fuel oil for heat. these communities are surrounded by wood resources and are obvious candidates for biomass heat especially from wood chip boilers. however pellet boilers may not be ideal because there is no nearby source of pellets and many of these communities lack rail and road access.
5.1 pRovinCial leadeRS — poliCieS dRiving gRoWth in BiomaSS heatprovincial governments are promoting biomass heat development by developing and implementing supportive policies and programs focused around a greater utilization of biomass for energy. By doing so, provinces are reducing their dependence on fossil fuels and reducing ghg emissions from energy production while developing a local, renewable industry.

36
2014 CanBio RepoRt on the StatuS of BioeneRgy in Canada
tABlE 5.5
provincial programs Supporting Bioheat development in Canada
pRovinCEinitiAtivE/pRogRAm oBJECtivES/dESCRiption implEmEntEd
British Columbia
BC Bioenergy Strategy (Agri/Forestry/Energy)
$25M into Bioenergy Network, for investment & innovation in bioenergy projects & technologies. Develop minimum of 10 community energy projects that convert local biomass into energy by 2020.
2008
Innovative Clean Energy Fund
encouraging the development of new sources of clean energy and technologies to help support local economies. Since 2008 $77 million approved for 62 projects
2008–2013
Wood Waste 2 Rural Heat
helps rural communities turn wood waste into heat for buildings and homes is being expanded throughout the Interior of BC
Provincial Wood Stove Exchange Program
New & updated bylaws for residential wood combustion were enacted (CSA/EPA certified). Program support to communities to promote the exchange of old wood stoves for cleaner alternatives.
2007–2012
northwest territories
GHG Strategy Objectives: NWT Housing Corporation Energy Conservation Initiatives — wood burning stoves offered with home ownership packages; Biomass Wood pellet boiler pilot project; Research on wood pellet heat.
2007–2011
NWT Biomass Energy Strategy
Objectives: increase the use of biomass fuels in all segments of the NWT space heating market; Achieve measurable life cycle GHG emission reductions by using biomass to offset fossil fuels; Create long-term economic benefits & employment opportunities in the supply & distribution of biomass products & services
2010/ 2012–15
Energy Efficiency Incentive Program
Rebate program designed to help homeowners and consumers perform energy and water saving home improvements, including wood pellet and wood stoves.
2011–
Alternative Energy Technology Program — Community Renewable Energy Fund
Funding of up to one-half of the project cost (max of $50,000/yr.) to help community-based installations of alternative energy systems or the conversion of an existing conventional energy system.
2011–

37
2014 CanBio RepoRt on the StatuS of BioeneRgy in Canada
pRovinCEinitiAtivE/pRogRAm oBJECtivES/dESCRiption implEmEntEd
Quebec Developing the value of forest biomass — Action Plan/Forest Biomass Allocation Program
Promote the use of 1.5M AMT of forest biomass (22.6% of available volume per year): Objectives: 1. Make biomass available from public forests; 2. Encourage the replacement of fossil fuels; 3. Support investment & innovation; 4. Stimulate demand for forest biomass/Biomass allocation via regionally specific bidding processes.
2008–2013
prince Edward island
PEI Energy Strategy
To develop the Province’s abundant biomass resources & achieve a 50% increase in biomass use leading to 10 MW of new electrical generation capacity for Island utilities.
2008
Community Economic Development Investment Fund
PEI Launched Tax Credit programme — CEDBs were developed as a tax credit program to encourage residents of P.E.I. to support entrepreneurship in communities to take an active role in economic development.
2012
5.1.1 BRitiSh ColumBiain BC, bio-heat installations grew from 22 in 2012 to 30 the next year. the BC Bioenergy network was established in 2008 as part of a bioenergy strategy. Since its inception, it has been a facilitator for deploying near-term bioenergy technology capital at pilot and full-scale demonstration phases, as well as providing support for bioenergy capacity development, education and advocacy for the sector. to-date the network supported 17 capital and 12 capacity building projects, encompassing a number of biomass technologies and applications including several heat related projects.22 another notable organization supporting bioenergy in BC is the Wood Waste 2 Rural heat (WW2Rh), previously known as Community futures north Cariboo green heat initiative. WW2Rh provides project support towards the development of the bioenergy heat sector by providing market and industry development assistance, pre-feasibility study assistance, professional education and training. as a result of supportive policies in BC and despite the low cost of natural gas, there are 30 new community heat projects in operation, four under construction and another 20 in various planning stages.
22 Personal communications with BCBN, December 2013.

38
2014 CanBio RepoRt on the StatuS of BioeneRgy in Canada
wood wAStE 2 RuRAl hEAt
in 2013, WW2Rh expanded its reach throughout BC’s interior. the program set out to invest $240,000 over two years thanks to provincial support, and partnership with the Columbia Basin trust, the Southern interior Beetle action Coalition, the omineca Beetle action Coalition and the Cariboo-Chilcotin Beetle action Coalition. WW2Rh’s bioenergy program will work with local governments, first nations and not-for-profit organizations to increase the use of local wood waste in efficient and cost-effective heating projects that will result in the development of 9 projects in 7 regions.
5.1.2 noRthWeSt teRRitoRieS:in the nWt, heating accounts for nearly a quarter of all energy consumed. the extremely cold winter climate is a major contributor to high costs of living and poses a barrier to economic growth. With no large-scale distribution of natural gas, and imported diesel oil being the principal fuel source for most communities, the growing pellet market in the nWt is beginning to shift the energy landscape. in 2007, cordwood was the most common type of biomass used to produce energy, accounting for 6% of the total energy demand for space heating. Since then, the use of cordwood has remained stable but the consumption of wood pellets has grown considerably, now accounting for 5% of total space heating needs.23 Where cordwood was almost entirely used for home heating, wood pellets are dispersed throughout residential, commercial and institutional segments of the market and are concentrated in those communities that are connected to an all-season road system. a recent government estimate of nWt wood pellet consumption is 15,000 tonnes per annum.
the 2010 nWt Biomass energy Strategy introduced programs that supported the proliferation of biomass development and community-led biomass projects. the nWt is now a leader in the deployment and use of biomass technologies and was recently deemed as the pellet boiler capital of Canada. there are 29 community heat installations scattered throughout nWt. the total of about 230 pellet boilers in operation indicates there are many single dwellings with pellet boilers. Biomass community heating is being implemented at both the residential and institutional scale. for example, commercial residential operations are using biomass to heat their rental units. inukshuk housing Co-op generates 300 kW of bioheat for 56 apartments.
the territory’s largest landlord, northern property Reit, with more than 1,000 rentals including apartments and multi-bedroom homes, has a number of large pellet boilers heating apartment buildings. it also intends to convert more of its buildings to pellet heat. Similarly, the territorial government has been working on converting its buildings to pellet boilers. in 2011, the city signed a memorandum of understanding with Corix utilities for a $60.4 million community energy project that would heat 39 downtown
23 GNWT. NWT Biomass Energy Strategy 2012–2015. Retrieved from: http://www.enr.gov.nt.ca/_live/documents/content/Biomass_energy_Strategy_2012-2015.pdf

39
2014 CanBio RepoRt on the StatuS of BioeneRgy in Canada
SAvingS By thE govERnmEnt of thE nwt
five years ago the territorial government realized that heating with biomass pellets could reduce costs up to 50%. a public Works and Services (2012–2013) annual Report on energy Conservation projects revealed that:
• in 2012–2013 alone the nWt reduced its consumption of fossil fuels for space heating by over 2.5 million litres.
• in 2012–2013, wood pellets accounted for 11% of total energy consumed, directly contributing to reduction of imported heating oil.
• By the end of 2013-2014, through the government of nWt’s energy investments, total reduction in fossil fuel consumption for space heating in buildings is expected to exceed 13.5 million litres with corresponding decreases in ghg emissions of over 36,000 tonnes.
• the government of nWt’s investment in energy improvements and alternative energy such as biomass for space heating have generated savings of more than $3.3 million since 2011.
Source: http://www.assembly.gov.nt.ca/sites/default/files/13-05-06td_92-174.pdf
buildings involving a mix of pellet boilers and geothermal heat from a redundant gold mine. over the next few years the nWt housing Corporation, with 2,300 public housing units, will work with the lead government of the nWt agency arctic energy alliance (aea) and other government departments to assess the potential of expanding the use of biomass heat in public housing. a report by the aea suggested, “If every public building within Yellowknife was heated by wood pellets, the demand would be 200,000 tonnes per year. A further 1.5 million litres of heating oil could be displaced in government buildings throughout the NWT.”24
another organization that has made significant contributions to the development of bioheat in the nWt is arctic green energy (age). it was the first company to bring in advanced european boilers to the nWt market and has been part of developing biomass heating solutions and energy supply contracts for their northern clients. age is a major installer of pellet boilers in yellowknife and also offers bulk delivery of pellets, bringing in three B-trains of 129 tonnes25 of bulk pellets per week to yellowknife from La Crete in alberta. in 2013, retailer Canadian tire doubled its bagged pellet sales and pellets from the trebio plant in Quebec are being sold at the local Walmart. the growing demand for pellets in yellowknife is helping to develop a
24 Arctic Energy Alliance. NWT Wood Pellet Study, September 2009. Retrieved from: http://aea.nt.ca/research/research-2
25 AGA. Inuvik Wood Pellet Infrastructure Study, 2012. Retrieved from: http://aea.nt.ca/blog/2013/03/inuvik-biomass-infrastructure-study

40
2014 CanBio RepoRt on the StatuS of BioeneRgy in Canada
local market for Canadian pellet producers and aiding those manufacturers that may be struggling because of their distance to major markets. much of the demand for pellets in the nWt is met by pellet mills in alberta and British Columbia: La Crete, pinnacle and premium pellet. there are currently plans to build a pellet mill in the South Slave Lake region, supplied by local fiber.
the nWt 2013 energy action plan reported that it intends to expand use of biomass in the nWt in 2013–16. it will commit a total of $8.8 million to strategic biomass investments, funding for biomass projects and biomass promotion, community engagement and project evaluation. this includes $1.4 million from the federal government in 2013–14 and $0.9 million by the government of nWt to maintain sustainable forest resources and encourage commercial development in the forest sector.26 as part of this work, the nWt government and its partners are also seeking to provide economic opportunities for aboriginal communities by expanding activity level within the forest sector. over the next few years, substantial growth in biomass heating in both the residential and large-scale industrial sectors throughout nWt can be expected. in addition, the use of biomass (e.g. pellets) for Chp projects in smaller, remote and primarily aboriginal communities that rely on diesel generators can reduce their reliance on heavy fuel oil and achieve even greater energy savings.
5.1.3 queBeCthere are 11 known community bioenergy projects in operation in Quebec and another 28 in various stages of planning and development in 2012. this leaves Quebec with great potential for growth in this sector. one of the first biomass community-heating systems in Canada was built in 1991 in a Cree first nations Community, oujé-Bougoumou. the system delivers heat through a system of heating pipes and energy transfer stations to 140 homes and 20 public buildings in the community. the system has led to a 200 tonne reduction in Co2 emissions. in 2011, Quebec built one of the largest bio-heat systems in Canada, La Cité verte in Quebec City, that was also the first large system in the middle of a major urban center. the “green City” is a 5mW green community in the heart of Quebec City generating bioenergy for a residential complex with 840 units.
the Québec federation of forestry Cooperatives provided the latest update on Quebec biomass projects under development for the 2012 Canadian Bioenergy data Survey. in January of 2013, the Coopérative forestière de La matapédia reported that 11 of its community projects had been accepted, seven projects were under consideration by the proponent for the office of energy efficiency and innovation, and two projects were waiting on funding for feasibility studies.27
26 GNWT. Energy Strategy, 2013. Retrieved from: http://www.iti.gov.nt.ca/sites/default/files/nwt_energy_action_plan_december2013.pdf
27 Coopérative forestière de La Matapédia. Bois Énergie Matapédia Laboratoire rural 2008–2013 présentation. Retrieved from: http://cldnb.com/upload/cldnb/editor/asset/Sm3/Journee_ruralite_Cooperative_forestiere_matapedia_2013-04-26.pdf

41
2014 CanBio RepoRt on the StatuS of BioeneRgy in Canada
Quebec has three different initiatives aimed at maintaining the value of its forests: a forest Biomass action plan (2008), the forest Biomass allocation program (2008–13), and a forest Sector Strategy (2012–17). each is focused on diversifying the forest industry and exploiting market opportunities to substitute forest biomass for fossil fuels. in 2008, Quebec took an innovative approach to wood allocation that was unique in Canada, allowing 17 regional economic development Boards, the CRes, to examine bioenergy proposals and recommended five-year wood allocation contracts. Several regions moved quickly to garner forest biomass for small community heating systems.
5.1.4 pRinCe edWaRd iSlandWith nine community-heating projects in 2013, pei has been a pioneer in the use of biomass to generate thermal energy to heat municipal buildings. in 2000, Charlottetown housed one of the three oldest biomass energy systems in existence in Canada. the current system in Charlottetown evolved from earlier projects. the Kings County memorial hospital in montague installed a Swede Stoker woodchip heating system that produces 110 kW and provides heat to the hospital and local senior’s home. the system uses 1,600 tonnes of whole-tree chips per year, with a fuel oil back-up system. the district energy system consists of a high efficiency wood boiler and cogeneration equipment installed in 1997 that provides hot water and heat to 125 downtown buildings and generates 1,200 kW of electricity used internally and sold to the power grid. the annual wood fuel used is 62,000 tonnes.
Bio-heat has been a priority for pei since 2008, when a report entitled “Biomass Heat on PEI: A Pathway Forward” recommended the government of pei move towards increasing bio-heat on the island and suggested that biomass energy would be a positive catalyst to reduce reliance on expensive heating oil and develop the island economy and communities while having numerous environmental benefits. in response, the province developed an energy strategy to reduce dependence on fossil fuels and called for a 20% biomass component to the pei energy mix by 2018. at the time, 10% of the energy used in pei was generated through biomass (including fuel wood, sawmill residue and municipal waste).28 in pei, financial incentives such as tax exemptions and low interest loans for wood heating systems are being used to help increase the market for wood and wood pellets. environmental impacts are being mitigated through the development of guidelines for biomass harvesting, which outlines acceptable harvest practices for bioenergy projects with public involvement.
in 2009, Wellington-based atlantic Bioheat, a bioenergy company, led a successful bio-heat furnace pilot demonstration project, which encouraged the pei government to announce the replacement of more than 30 oil furnaces over the next five years. this resulted in a request for proposals for 22 schools, four manors, three hospitals, and the provincial correctional center. Contracts were awarded to two of the island’s leaders in biomass heating and boiler installers. atlantic Bio-heat was awarded a contract for two schools, a hospital and the young offenders facility while Wood4heating
28 Government of PEI. PEI Energy Strategy, 2008. Retrieved from: http://www.gov.pe.ca/photos/original/env_snergystr.pdf

42
2014 CanBio RepoRt on the StatuS of BioeneRgy in Canada
was awarded a contract for seven schools, a hospital, two seniors’ homes, and the provincial Correctional Centre in Charlottetown. furthermore, atlantic Bio-heat formed a pei Bio heat investment fund that will employ a community-oriented model of financing to encourage islanders to invest and cultivate pei’s green economy. Such developments in pei are paving the way for the expansion of biomass heat that will provide opportunities for economic development and job creation while taking steps to reducing ghg emissions.

43
2014 CanBio RepoRt on the StatuS of BioeneRgy in Canada
6.0 Wood peLLetS

44
2014 CanBio RepoRt on the StatuS of BioeneRgy in Canada
6.1 Canada and Beyondthe eu is currently the world’s largest pellet market, although small pellet markets in Japan and Korea are expected to surge on new renewable energy targets. driven by renewable energy policies, the eu demand for pellets grew from 13 mt in 2011, to an estimated 14.3 mt in 2012, to a projected 16 mt in 2013. the united States department of agriculture projects eu demand for wood pellets as 17.1 mt in 2014 while international energy consulting firm pöyry projects demand of 35 mt for the whole of europe by 2020. despite growing eu pellet production from germany and Sweden, the eu will increasingly depend on imports, as domestic production cannot keep up with demand.
tABlE 6.1
european demand for Wood pellets29
Eu wood pEllEt ConSumption (000 t)AB
2011 2012E 2013E 2014E 2020C
productiona 9,620 10,000 10,150 10,300
net importsb 3,158 4,400 5,880 6,840
to inventory 222 -100 -30 -40
Consumptiona 13,000 14,300 16,000 17,100 35,000
(a)The European Biomass Association (AEBIOM), (b)USDA Foreign Agricultural Service, (c)Pöyry
Spurred by growing pellet markets worldwide, Canadian pellet producers increased the number of plants from 33 in 2010 to 39 in 2012. this increased capacity by almost 1.3 mt to reach 3.4 mt by 2012. although long-term pellet demand is expected to remain strong, short-term disruptions can affect the market for Canadian exports. for example, in 2013 gdf Suez, a french power producer, decided not to convert its Rugeley power station in the uK from coal to biomass. there were delays in eon’s ironbridge project and delays by the dutch government on new biomass policy. With international developments such as these and a slow-growing domestic market, Canadian capacity actually fell in 2013, as three smaller plants closed due to market conditions for a net loss of 82,000 tonnes.
29 a,b,c Retrieved from: Poyry Austria Presentation Jan 2012.

45
2014 CanBio RepoRt on the StatuS of BioeneRgy in Canada
tABlE 6.2
Canada Wood pellet Capacity (tonnes)
2010 2011 2012 2013
Capacity 2,089,499 2,987,640 3,372,000 3,290,000
Change 898,141 384,360 -82,000
plants 33 39 39 37
Source: 2013 Canadian Bioenergy Data Survey.
Canadian pellet business is dominated by BC, with over 2 mt in capacity in 2013, 61% of Canada’s overall capacity. Quebec is second with 625,000 tonnes capacity, while new Brunswick ranks third at 202,000 tonnes. ontario was not on the pellet map in 2011, but with the opening of Canadian Biofuel’s plant, ontario has increased its presence. Rentech anticipates having its 450,000 tonne plant in Wawa ontario in production by the fall of 2014 with its first delivery to drax, a large utility in the uK from the port of Quebec. the port has undergone significant infrastructure improvements in 2013 to ensure the necessary storage and loading facilities are in place for efficient delivery to partners. the port in Quebec City is the largest bulk pellet terminal in eastern Canada. Rentech will also start-up a 125,000 tonne plant in atikokan, ontario. manitoba and Saskatchewan came on the pellet map in 2012 and 2013, while newfoundland put one plant on hold in 2013.
tABlE 6.3
pellet Capacity by province (tonnes)
2011 2012 2013 #
BC 1,882,640 2,097,000 2,017,000 61.3%
QC 600,000 625,000 625,000 19.0%
nB 142,000 182,000 202,000 6.1%
nS 150,000 160,000 168,000 5.1%
AB 135,000 145,000 150,000 4.6%
on 15,000 95,000 80,000 2.9%
SK 0 0 15,000 0.5%
nl 63,000 63,000 13,000 0.4%
mB 0 5,000 5,000 0.2%
total 2,987,640 3,372,000 3,290,000
Source: 2013 Canadian Bioenergy Data Survey.
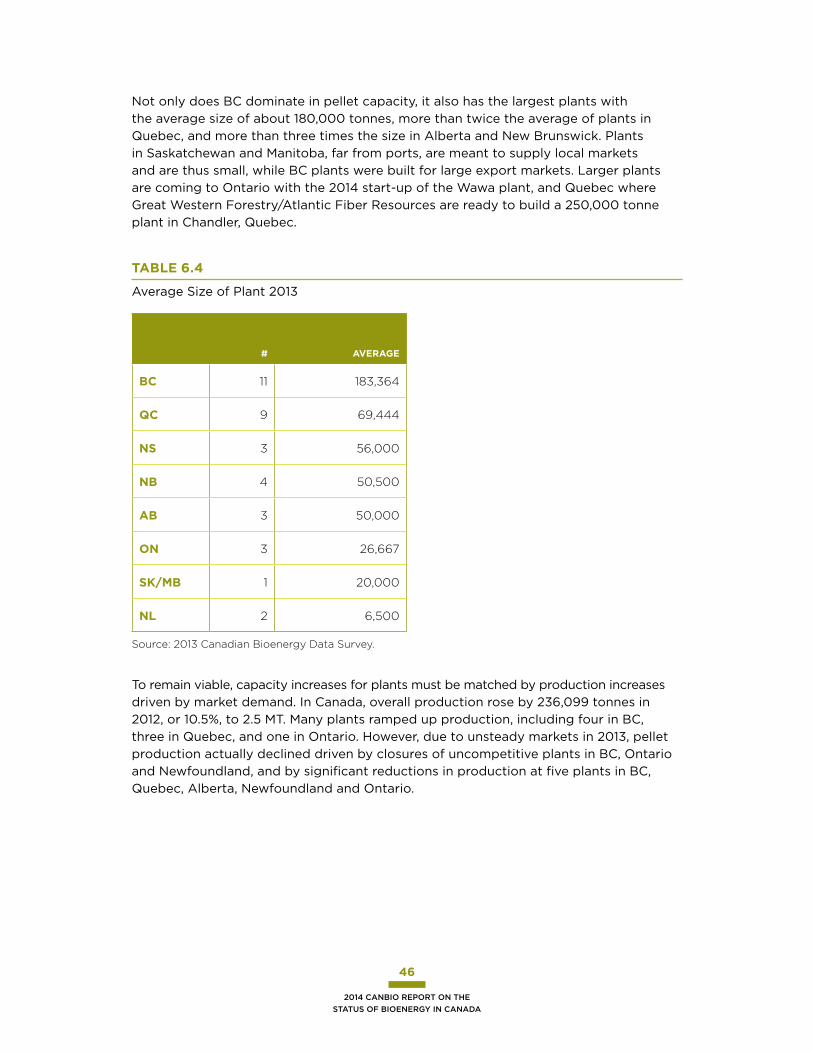
46
2014 CanBio RepoRt on the StatuS of BioeneRgy in Canada
not only does BC dominate in pellet capacity, it also has the largest plants with the average size of about 180,000 tonnes, more than twice the average of plants in Quebec, and more than three times the size in alberta and new Brunswick. plants in Saskatchewan and manitoba, far from ports, are meant to supply local markets and are thus small, while BC plants were built for large export markets. Larger plants are coming to ontario with the 2014 start-up of the Wawa plant, and Quebec where great Western forestry/atlantic fiber Resources are ready to build a 250,000 tonne plant in Chandler, Quebec.
tABlE 6.4
average Size of plant 2013
# AvERAgE
BC 11 183,364
QC 9 69,444
nS 3 56,000
nB 4 50,500
AB 3 50,000
on 3 26,667
SK/mB 1 20,000
nl 2 6,500
Source: 2013 Canadian Bioenergy Data Survey.
to remain viable, capacity increases for plants must be matched by production increases driven by market demand. in Canada, overall production rose by 236,099 tonnes in 2012, or 10.5%, to 2.5 mt. many plants ramped up production, including four in BC, three in Quebec, and one in ontario. however, due to unsteady markets in 2013, pellet production actually declined driven by closures of uncompetitive plants in BC, ontario and newfoundland, and by significant reductions in production at five plants in BC, Quebec, alberta, newfoundland and ontario.

47
2014 CanBio RepoRt on the StatuS of BioeneRgy in Canada
tABlE 6.5
pellet production by province (tonnes)
2011 2012 2013
BC 1,702,740 1,751,506 1,713,900
QC 273,729 382,000 391,000
nB 138,000 141,000 159,000
nS 25,000 25,062 60,011
AB 78,000 88,000 83,000
on 16,000 77,000 44,000
SK 0 0 2,000
nl 14,000 14,000 500
mB 0 5,000 0
total 2,247,469 2,483,568 2,453,411
Change 236,099 -30,157
Source: 2013 Canadian Bioenergy Data Survey.
Capacity utilization is an indicator of pellet plant health measured by production as a percent of capacity. BC has the highest capacity utilization at 85% because of world-class pellet plant and well-established, efficient infrastructure including tailored ports and rail to accommodate pellet handling. new Brunswick plants, near ocean ports, are making inroads into european markets and have the second highest capacity utilization at 78.7%.

48
2014 CanBio RepoRt on the StatuS of BioeneRgy in Canada
tABlE 6.6
2013 Capacity utilization by province (tonnes)
CApACity pRoduCtion %
BC 2,017,000 1,713,900 85.0%
QC 625,000 391,000 62.6%
nB 202,000 159,000 78.7%
nS 168,000 60,011 35.7%
AB 150,000 83,000 55.3%
on 80,000 44,000 55.0%
SK 15,000 2,000 13.3%
nl 13,000 500 3.8%
mB 5,000 0 0.0%
total 3,275,000 2,453,411 74.9%
Source: 2013 Canadian Bioenergy Data Survey.
Quebec lost most of its new england market to large pellet plants in the uS South. With a growing but limited local market, Quebec plants struggle to achieve the competitiveness needed to sustain themselves in eu industrial markets. Quebec capacity utilization was 63% by the end of 2013, but plants are successfully entering high-end markets in italy. interior provinces alberta, ontario and Saskatchewan have lower capacity utilization. nova Scotia capacity utilization appears low, but it will improve with the Scotia atlantic plant coming on stream. nationally, plants are at 75% capacity utilization.

49
2014 CanBio RepoRt on the StatuS of BioeneRgy in Canada
6.2 pellet expoRtSin Canada, the domestic pellet market is small, but growing. Canadian pellet producers are currently building capacity to supply large offshore markets. in 2013, 94% of pellet producers reported on whether or not they exported. Canada exported close to two mt, or 86%, of production. in BC, world scale plants produce primarily industrial grade pellets for offshore markets, with 96% of production exported. there is growing demand from european residential heating markets. Similarly, new Brunswick focuses on exports, with 78% of production going offshore. the domestic market in Quebec uses only 122,350 tonnes of the province’s 625,000 tonnes capacity. the rest is available for foreign markets but less than half of that is actually exported, because of soft markets and a lack of cost competitiveness. Similarly ontario has been unable to export is available capacity because of immature supply chains30. this will change with Rentech’s Wawa plant, which reorganized its supply chain from atikokan/Wawa to Quebec for efficiency and cost effectiveness.
tABlE 6.7
2013 pellet exports
domEStiC ExpoRtS % ExpoRtS
BC 56,368 1,549,532 96%
QC 122,350 233,650 66%
nB 34,200 124,800 78%
AB 48,500 34,500 42%
nS 31,511 28,500 47%
on 17,000 27,000 61%
SK 2,000 0 0%
nl 500 0 0%
total 312,429 1,997,982 86%
Source: 2013 Canadian Bioenergy Data Survey.
30 IEA Task 40. Low Cost Long Distance Biomass Supply Chains 2013. Retrieved from: http://www.bioenergytrade.org/downloads/t40-low-cost-long-distance-biomass-supply-chains.pdf

50
2014 CanBio RepoRt on the StatuS of BioeneRgy in Canada
not all survey participants reported the country of export, but approximately 200,000 tonnes of pellets were destined for the consumer bag market in italy, where prices are much higher than the european utility market but the quality of the pellet must be correspondingly better as well. in 2013, 1.6 mt of pellets were reportedly exported to europe, mostly to the utility market in the uK. however, with the eu market being supplied increasingly by the u.S. South, BC has grown its market in asia amounting to an estimated 155,683 tonnes exported in 2013. the uS market for Canadian pellets was 108,700 tonnes in 2013.
figuRE 6.1
pellet export destination 2013
Source: 2013 Canadian Bioenergy Data Survey.
With large, world-class pellet plants and streamlined supply chains, BC exports the bulk of its production to european utilities, with a substantial amount now going to asia. more than half of alberta’s exports are to the uS with some going to europe and asia, but alberta firms mostly supply the domestic market. ontario’s four current operational plants are too small and inefficient and the supply chains are not yet sufficiently optimized to compete in the european bulk market, but they have turned successfully to italy, supplying 61% of production to the residential heating market. Quebec also appears to be targeting its eu exports for the bag market in italy, but also participates successfully in the uS. new Brunswick plants report 22% going to domestic buyers, with the remainder going to europe, but not all plants specified whether they were in the italian market. Canadian pellet producers must continue to follow any certification restrictions that could restrict these markets in the future.
1,629,359
155,683 201,150108,700
Italy — Bag
Europe — Bulk
Asia
US

51
2014 CanBio RepoRt on the StatuS of BioeneRgy in Canada
tABlE 6.8
pellet exports by province
Eu-BulK itAly-BAg ASiA uS domEStiC
BC 82% 3% 9% 2% 5%
AB 10% 0% 10% 22% 58%
SK 0% 0% 0% 0% 100%
on 0% 61% 0% 0% 39%
QC 19% 30% 0% 14% 38%
nB 75% 0% 0% 3% 22%
nS 47% 0% 0% 0% 53%
nl 0% 0% 0% 0% 100%
Source: 2013 Canadian Bioenergy Data Survey.
for Canadian pellet producers, the uK is currently the largest market due to government support of biomass heat and power. previously Canada had exported large amounts of pellets to the netherlands, Belgium and Sweden. the demand for Canadian biomass should continue to increase with england’s most recent developments involving a 10mt rise in demand from the drax and eggborough power stations. if Canada’s pellet producers want to compete with the uS Southeast, they must increase capacity to develop economies of scale and develop cost-efficient supply chains.
6.3 pellet feedStoCkSover the last decade, Canadian sawmills have suffered considerably following the financial crisis in the uS, a worldwide economic downturn, a collapse in uS housing starts, and subsequent decline in the demand for Canadian lumber. Canadian lumber production peaked in 2004 as a result of an over-heated uS housing market supported by sub-prime mortgages, and production had fallen 50% by 2009. Small and inefficient sawmills were forced to shut down, many permanently. this development also reduced the volume of mill residues such as sawdust and shavings that had been used as feedstock for pellets. BC, with the most to lose, began looking to asian markets to sell lumber and their lumber production increased accordingly, also increasing mill residue availability. Since 2009, there has been a slow but steady resurgence in the uS housing market. in 2012, Canada produced 54.5 million m3 of softwood lumber, up 5% from 2011. BC and Quebec are the top softwood producing provinces.

52
2014 CanBio RepoRt on the StatuS of BioeneRgy in Canada
figuRE 6.2
Sawmill Lumber production, 2003–201231
Note(s): The category all other provinces” refers to Newfoundland and Labrador, Prince Edward Island, Nova Scotia, New Brunswick, Manitoba and Saskatchewan combined. While there was lumber production in 2012 for Ontario and “all other provinces”, the data are not publishable because of confidentiality.
although, this increase in lumber production is expected to continue thanks to the improvements in housing markets and demand from China, this growth does not necessarily imply sufficient new surpluses of mill residues for pellet manufacturers. this is especially true in ontario and Quebec where the lumber business has not recovered to the same extent as in BC. also, available mill residues are increasingly utilized by existing sawmill operators and are traditionally utilized in the pulp and paper sector to produce onsite energy, or sold to ipps, board manufacturers, farmers for animal bedding, and landscapers for garden beds. in BC, the imminent shut down and phase out of all remaining wood residue burners in the province by the end of december 2016 is providing incentive for the use of these wood residues for biofuel and energy production. more importantly, in BC the pellet industry has gone to the forest itself to secure needed fibre from harvest residues. British Columbia has an advantage in
31 Statistics Canada. Manufacturing at a glance: The Canadian lumber industry, 2003 to 2012. Retrieved from: http://www.statcan.gc.ca/daily-quotidien/131112/dq131112a-eng.htm
Canada All other provinces Québec
Mill
ions
of
cub
ic m
etre
s
0
100
200
300
400
500
600
700
800
900
2003 2004 2005 2006 2007 2008 2009 2010 2011 2012
Year
Ontario Alberta British Columbia

53
2014 CanBio RepoRt on the StatuS of BioeneRgy in Canada
that 25–40% of each tree harvested is left at the roadside as harvest residue due to the damage caused by mountain pine beetle, leaving a considerable amount of whitewood which could be utilized for pellet production for feedstock. BC has an advantage over eastern provinces in that mpB damaged wood causes unwanted bark to fall off of harvest residue wood leaving better quality whitewood feedstock.
the participation of Canadian pellet manufacturers in the survey has led to a better understanding of the type of feedstocks used, how much, the origin and how far they are travelling to supply their production and demand. in BC, 59% of feedstock is still residue from mills, but 22% is chipped logs and 9% is harvest residue from the forest.
nationwide, mill residues account for 79% of feedstocks used in pellet production and harvest residues made up 5%. only BC uses harvest residues. in eastern Canada harvest residues are only 10–12% of each tree and contain considerable bark, not the best feedstock for pellets. Both new Brunswick and ontario have been forced to use expensive logs and chips to fill feedstock needs.
figuRE 6.3
Source of feedstock for BC Wood pellets, 2013
Source: 2013 Canadian Bioenergy Data Survey.
Bush Residual
Mill Residues
Hog Fuel
Logs (Pulp, MPB, Other SW)
Waste Wood
Chips
59%
22%
9%
9%
1% 1%

54
2014 CanBio RepoRt on the StatuS of BioeneRgy in Canada
tABlE 6.9
pellet feedstocks by province (tonnes)
hARvESt RESiduES
mill RESiduES hog fuEl logS
wood wAStE ChipS totAl
BC 173,750 1,185,500 174,000 435,750 22,000 0 1,991,000
AB 0 50,500 0 0 0 12,500 63,000
SK 0 2,000 0 0 0 0 2,000
on 0 943,000 0 0 2,000 0 945,000
QC 0 386,000 0 0 0 0 386,000
nB 0 159,000 0 10,000 0 0 169,000
nl 0 500 0 0 0 0 500
nS 0 280,011 0 0 0 0 280,011
total 173,750 3,006,511 174,000 445,750 24,000 12,500 3,836,511
% 5% 78% 5% 12% 1% 0.3% 100%
Source: 2013 Canadian Bioenergy Data Survey.
6.4. employment out of the 39 operating plants, 38 reported actual direct full-time employment, totaling 620. there are eight plants under construction that will contribute an additional 200 direct jobs, thus resulting in a total of 820 overall once these plants are completed.

55
2014 CanBio RepoRt on the StatuS of BioeneRgy in Canada
tABlE 6.10
direct Jobs in pellet plants by province 2013
pRovinCE opERAtionAl u. ConStRuCtion
BC 315 37
AB 19
mB 2
SK 4
on 43
QC 136 44
nB 50 20
nS 49 99
pEi N/A N/A
nl N/A N/A
total 620 200
Source: 2013 Canadian Bioenergy Data Survey.
the actual socio-economic benefit of the above jobs is substantial. these jobs are not in cities where the 50–60 jobs per plant would be negligible but in small forest communities. many of them suffered from the decline in the forest products industry in recent years and the job impact of the plant is often sufficient to ensure ongoing survival of the community.

56
2014 CanBio RepoRt on the StatuS of BioeneRgy in Canada

57
2014 CanBio RepoRt on the StatuS of BioeneRgy in Canada
7.0 toRRefied Wood (peLLetS)there are several technologies that produce advanced biomass fuels
with coal like properties. Steam explosion and torrefaction are the two
main processes to create a wood fuel with increased energy density,
improved material handling properties and hydrophobicity. in Canada,
the most development work has been done in torrefaction, which is a
controlled carbonization process.

58
2014 CanBio RepoRt on the StatuS of BioeneRgy in Canada
Biomass is heated with minimal to low oxygen to a temperature of approximately 250–350°C so that all moisture is removed, similar to roasting coffee beans, resulting in a black char-like substance. there are significant advantages to torrefaction in comparison to conventional wood pellets as the process results in a greater energy content per unit volume and mass.32
there is increasing interest in torrefied biomass due to its multiple benefits—it is up to 40% more energy dense than non-torrefied biomass, it is hydrophobic and thus can be stored and handled in outdoor conditions, it can result in lower transportation costs, and it is comparable with coal in its heating value, grindability, and bulk energy density. When used in a combustion application, torrefied biomass is referred to as bio-coal, or torrefied pellets if densified. these characteristics have significant advantages in the supply chain making logistics simpler and more cost effective. further, it has various applications for heat and power involving small to medium scale biomass plants and pellet burners. it can also be co-fired with coal in pulverized coal fired power plants and cement kilns in the coke and steel industry and in gasification processes that would normally operate on pulverized coal.
AIREX Energy is a Quebec based company that is a world leader in the manufacturing of bio-coal production equipment. Airex has operated a pilot plant in Laval using the CarbonFX process since March 2011. In February 2013 Airex announced that it had received $2.7 million in funding support from the Government of Canada and SDTC for the construction of a 2 tonnes per hour biomass torrefaction demonstration plant near Montreal
Several initiatives have been ongoing at the R&d and commercialization stages involving research institutes, universities, and industry to assess the torrefied product durability to withstand large-scale handling and the risks associated with dust. in Canada, much research work has been done at the university of British Columbia, at CanmeteneRgy in the innovation in energy technology Sector of nRCan, and at the montreal-based Centre for energy advancement through technological innovation. Studies have also been commissioned by the Wood pellet association of Canada, nRCan and the BC Bioenergy network to gain a better understanding of the role torrefaction could play in the production and use of advanced solid biofuel throughout various Canadian sectors. the leading global companies working on the development and commercialization of advanced biomass fuels are Zilkha in the united States, arbaflame in norway, topell in the netherlands and andritz in austria.
the market for torrefied products has not developed as quickly as anticipated in europe. By 2011, producers claimed they were “production ready” but this turned out to be an overstatement. Some european power plants undertook test burns of torrefied pellets—some test burns went well but others were unsuccessful as some torrefied pellets did not act like coal as promised. furthermore, power plants wanted to run tests of 10,000 tonnes before supplying off-take agreements, but no torrefied wood plant could produce quantities close to that. faced with pending renewable energy targets, many european power producers chose to make the infrastructure investments necessary to combust wood pellets instead of going with a product that is not yet produced at commercial levels. industry expert pöyry has suggested that a torrefied wood market in europe is a couple of years away, and asia may be the better prospect for early markets.
32 IEA. Bioenergy Task 32 Report; Status Overview of Torrefaction Technology, 2012. Retrieved from: http://www.ieabcc.nl/publications/iea_Bioenergy_t32_torrefaction_review.pdf
Biomass is heated with minimal to low oxygen to a temperature of
approximately 250–350°C so that all moisture is removed, similar to roasting
coffee beans, resulting in a black char-like substance. there are significant
advantages to torrefaction in comparison to conventional wood pellets as the
process results in a greater energy content per unit volume and mass.33

59
2014 CanBio RepoRt on the StatuS of BioeneRgy in Canada
the 2012–2013 data surveys sought information from provincial organizations
and industry professionals, but data was often difficult to obtain because of
member confidentiality, and in many cases was simply not known or tracked.
government databases on energy use by greenhouses have not been updated
and recent public and private reports are dated. one exception is a 2013
report by the government of Alberta titled, The Economics of Production
and Marketing of Greenhouse Crops in Alberta.
8.0 gReenhouSeSthe 2012–2013 data surveys sought information from provincial organizations
and industry professionals, but data was often difficult to obtain because of
member confidentiality, and in many cases was simply not known or tracked.
government databases on energy use by greenhouses have not been updated
and recent public and private reports are dated. one exception is a 2013
report by the government of Alberta titled, The Economics of Production
and Marketing of Greenhouse Crops in Alberta.

60
2014 CanBio RepoRt on the StatuS of BioeneRgy in Canada
the lack of available data on greenhouses has made it difficult to accurately report on the status of bioenergy systems in greenhouses. Successive data surveys have uncovered data on 52 operating greenhouses with biomass energy systems, 37 of which are currently using biomass for energy, and six that are in planning stages. While many greenhouses in BC use natural gas, 14 were known to use biomass in 2008. that grew to 20 by 2013. in ontario, 14 growers are known to be using biomass, with five anticipated to come online by 2014. alberta was reported to have nine growers using wood for fuel. there are three each in Quebec and manitoba and one in new Brunswick and nova Scotia.
the use of biomass for heat in greenhouses can be an economical solution for reducing fuel costs by replacing oil and natural gas with a renewable and local fuel source. Biomass heat and power is an increasingly attractive option for greenhouse growers as increasing oil prices, carbon taxes, and emissions targets are becoming more prominent considerations across Canada. however, this industry is influenced by specific regional characteristics, such as regulations, accessibility, availability and the cost of alternative energies such as oil or natural gas.
a 2006 report by Resource efficient agricultural production analyzed agri-fuel potential for the Canadian greenhouse industry. the report stated that 2,545 Canadian greenhouses could reduce annual fuel costs between 33%–60% by switching to agricultural and woody biomass fuels, saving greenhouse producers up to $200 million annually.33 in Canada, approximately 90% of the total greenhouse area and sales exist in three regions: British Columbia, ontario and Quebec.
BRitiSh ColumBiain 2012, the BC greenhouse growers association reported that in the early 2000s, many of BC’s greenhouses installed biomass boilers, as there was a considerable availability of feedstock such as wood pellets, sawdust and hog fuel.34 more recently, a BC carbon tax added to the cost of non-renewables such as oil and natural gas. however, the BC government provided rebates on natural gas for greenhouse growers until 2012 due to the added benefit of natural gas contributing to greenhouse productivity. Carbon dioxide (Co2) is easily captured from natural gas and can be released back into the greenhouses to improve yields, whereas Co2 is not easily recovered from biomass. as such, some growers prefer to burn natural gas during the summer. Some greenhouses use propane for Co2 production. however, there is emerging technology that will extract the Co2 from flue gases of biomass boilers. if this technology becomes affordable, the use of biomass could become a more viable option.
33 REAP Bioheat Report. Biomass Resource Options: Creating a BIOHEAT Supply for the Canadian Greenhouse Industry, July 2006. Retrieved from: http://www.reap-canada.com/online_library/feedstock_biomass/Biomass%20Resource%20options%20Creating%20a%20Bioheat%20Supply%20...%20(Bailey%20et%20al.,%202006).pdf
34 Personal communications, BC Greenhouse Growers Association, L. Delli Santi. September 2012.

61
2014 CanBio RepoRt on the StatuS of BioeneRgy in Canada
natural gas, where available, remains the more attractive option for BC greenhouses. in the province, greenhouses are a half-billion-dollar-a-year industry and in 2012, the provincial government provided high-tech greenhouse vegetable and floriculture growers with $7.6 million in carbon tax relief. in 2013, a permanent carbon tax relief grant program was announced in recognition of the impact of the carbon tax on the natural gas and propane that commercial growers use for heating and Co2 production. the grant program was set at 80% of the carbon tax paid on natural gas and propane, thus giving less incentive to switch from natural gas to biomass. the BC government reported that the industry employs approximately 6,700 people in 550 greenhouses, and that the carbon tax represents 1–2% of gh operating costs.35 the price of natural gas fell through 2013, and several growers may have switched back to natural gas, though at least ten of the known 20 growers were still using biomass for heat.36
alBeRtain alberta, there are 328 growers with a total greenhouse area of 1.3 million m2, yet there was little known movement toward bioenergy systems in 2012. a survey completed by the government of alberta in august of 2013 revealed that natural gas burners heat approximately 80% of the greenhouses in southern alberta, while greenhouses in northern alberta are equipped with natural gas boilers and hot water pipes for heating. over the last four to six years, almost a dozen greenhouse operations have either completely switched to using coal or added coal fired furnaces to reduce natural gas costs.37 the 2013 survey referenced the government of alberta’s 2010 report on the Profile of the Greenhouse Industry in Alberta, which reported that 2% (nine operations) used wood for fuel.38 Switching to biofuels, biogas, and biomass sources may be possible if these become widely available and more cost effective, as capital costs remain high.
ontaRioaccording to the ontario greenhouse vegetable growers (ogvg) there are 223 vegetable and 400 flower operations, making ontario the largest greenhouse producer in Canada. the ogvg established an energy and environment Committee to focus on energy issues and pursue developing alternative sources to reduce energy expenses, which are greater than 40% of production costs. many greenhouses located in southwestern ontario use natural gas for heating. up to 25 growers use biomass, but this number
35 Government of British Columbia. (2014) Ministry of Agriculture, news release Permanent carbon tax relief for BC’s greenhouse growers, April 2013. Retrieved from: http://www.agf.gov.bc.ca/ministry/agScpolicy/2013agRi0024-000766.pdf
36 Confidential personal communications, Nov 2013.37 Government of Alberta. Report on The Economics of Production and Marketing of Greenhouse Crops
in Alberta, August 2013. Retrieved from: http://www1.agric.gov.ab.ca/$department/deptdocs.nsf/all/agdex4369/$file/821-59.pdf?openelement
38 Government of Alberta, 2013 Report. Retrieved from: http://www1.agric.gov.ab.ca/$department/deptdocs.nsf/all/agdex4369/$file/821-59.pdf?openelement

62
2014 CanBio RepoRt on the StatuS of BioeneRgy in Canada
varies by year depending on conventional fuel costs and whether long-term biomass supply contracts have been established.39 Smaller greenhouses in remote areas are likely to use biomass, including crop milling residues, switchgrass and wood pellets. Resource efficient agricultural production Canada in 2006 reported that ontario producers could reduce annual fuels costs 41–64% from natural gas and heating oil costs if they switched to biomass heating.40
queBeCin Quebec, Le Syndicat des producteurs en Serre du Quebec partnered with the ministry of agriculture, fisheries and food, and the greenhouse Research Centre with funding sourced from the energy efficiency agency to establish and showcase a project on wood heating in a Quebec greenhouse.41 a result of this project was the installation of a biomass heating system in Saint-Joachim-de-Courval at Les Serres verrier’s where there are 12 year-round vegetable greenhouses. another operating system is in Sainte-Clotilde-de-Chateauguay, where Les Serres Lefort inc. uses wood chips in their system to heat a 6.5-hectare hot water distribution system.
39 Personal communications, Dr. S. Khosla, OMFRA. September 2012.40 REAP 2006, Bioheat Report. Retrieved from: http://www.reap-canada.com/online_library/
feedstock_biomass/Biomass%20Resource%20options%20Creating%20a%20Bioheat%20Supply%20...%20(Bailey%20et%20al.,%202006).pdf
41 Le Syndicat des producteurs en Serre du Québec. (2014) Vitrine Biomasse. Retrieved from: http://www.spsq.info/vitrine-biomasse,4,41

63
2014 CanBio RepoRt on the StatuS of BioeneRgy in Canada
9.0 LiQuid BiofueLS
in 2006, the federal government announced its intent to develop
renewable fuel regulations requiring annual renewable content of 5%
ethanol by volume in all gasoline for ground transportation by 2010,
and 2% biodiesel for ground transportation and heating by 2012.
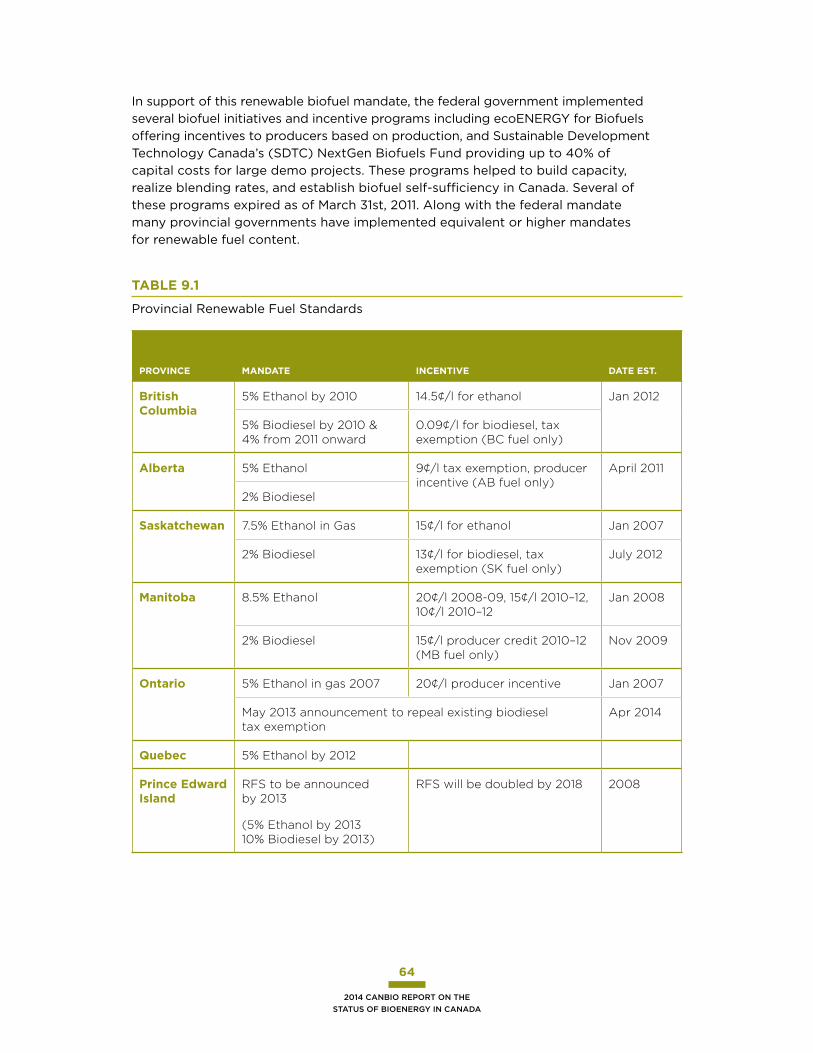
64
2014 CanBio RepoRt on the StatuS of BioeneRgy in Canada
in support of this renewable biofuel mandate, the federal government implemented several biofuel initiatives and incentive programs including ecoeneRgy for Biofuels offering incentives to producers based on production, and Sustainable development technology Canada’s (SdtC) nextgen Biofuels fund providing up to 40% of capital costs for large demo projects. these programs helped to build capacity, realize blending rates, and establish biofuel self-sufficiency in Canada. Several of these programs expired as of march 31st, 2011. along with the federal mandate many provincial governments have implemented equivalent or higher mandates for renewable fuel content.
tABlE 9.1
provincial Renewable fuel Standards
pRovinCE mAndAtE inCEntivE dAtE ESt.
British Columbia
5% Ethanol by 2010 14.5¢/l for ethanol Jan 2012
5% Biodiesel by 2010 & 4% from 2011 onward
0.09¢/l for biodiesel, tax exemption (BC fuel only)
Alberta 5% Ethanol 9¢/l tax exemption, producer incentive (AB fuel only)
April 2011
2% Biodiesel
Saskatchewan 7.5% Ethanol in Gas 15¢/l for ethanol Jan 2007
2% Biodiesel 13¢/l for biodiesel, tax exemption (SK fuel only)
July 2012
manitoba 8.5% Ethanol 20¢/l 2008-09, 15¢/l 2010–12, 10¢/l 2010–12
Jan 2008
2% Biodiesel 15¢/l producer credit 2010–12 (MB fuel only)
Nov 2009
ontario 5% Ethanol in gas 2007 20¢/l producer incentive Jan 2007
May 2013 announcement to repeal existing biodiesel tax exemption
Apr 2014
Quebec 5% Ethanol by 2012
prince Edward island
RFS to be announced by 2013
(5% Ethanol by 2013 10% Biodiesel by 2013)
RFS will be doubled by 2018 2008

65
2014 CanBio RepoRt on the StatuS of BioeneRgy in Canada
however, varying provincial incentives have created inconsistencies in the threshold levels, timeframes and feedstocks that could possibly create barriers and hinder intra-provincial biofuel trade. four provinces instituted biofuel mandates in anticipation of the federal announcement in 2010. eight ethanol plants were already in operation by 2007 and five facilities came online in 2008, but only two new plants have come online every other year since.
in december 2010, the Canadian Renewable fuels association reported that across the country, Canada blended an average of 5% ethanol into the gasoline pool. as of July, 2011, Canada blended an average of 2% renewable content into the distillate pool.42 the Canadian Bioenergy data Study of 2011 had considerable success reaching 90% of producers of both ethanol and biodiesel. the following sections will discuss how this sector has evolved over the last three years and the emerging trends ahead.
9.1 ethanolethanol production capacity increased from 411 ml in 2005 to 1,735 ml in 2008, with five new plants coming on stream in 2008. the 2009–11 period was characterized by only small increases in capacity, partly due to government programs ending, and partly increased questioning of the environmental benefits of 1st generation ethanol. for example, growing grain as a feedstock to produce ethanol relies heavily on synthetic fertilizers and chemicals. this uses large quantities of fossil fuels in their production,43 and clouds the net energy balance of ethanol use. in 2012, expansions at greenfield ethanol Johnstown and Suncor St. Clair boosted Canadian capacity to 1,880 ml p.a. in 2013, capacity dropped partly due to amaizeingly green going into receivership. one of the drivers for closure was the high cost of corn. the company now has a new owner who is focusing on the primary business of fertilizer. Capacity of 1st generation ethanol will grow by 190 ml in 2014 when two plants currently being commissioned come on stream—CR fuels and growing power hairy hill, both in alberta.
42 CRFA. (2013) Industry Information. Retrieved from: http://www.greenfuels.org/en/industry-information.aspx
43 Saskatchewan Eco Network. (2013) Environmental Sustainability. Retrieved from: http://econet.ca/issues/ethanol/environmental.html

66
2014 CanBio RepoRt on the StatuS of BioeneRgy in Canada
figuRE 9.1
1st generation ethanol Capacity
Source: 2013 Canadian Bioenergy Data Survey.
in Canada, there were 14 operating 1st generation ethanol plants in 2013, and 12 reported production for the survey. most plants were running at full capacity. actual capacity in 2013 was 1,826 ml. Suncor had production of 413 ml in 2012.
tABlE 9.2
1st generation ethanol Capacity and production in 2013
plAntS CApACity pRoduCtion
AB 1 45 45
SK 5 344 330
mB 1 140 148
on (less Suncor) 5 742 721
Subtotal 12 1,271 1244
on Suncor 1 400 N/A
QC 1 155 N/A
total 14 1826
Source: 2013 Canadian Bioenergy Data Survey.
0
500236 281 281
411
8651020
1735 1760 17601880 1880 1826
2116
1000
1500
2000
2500
1989–98 20042003 2005 2006 2007 2008 2009 201220112010 2013 2014

67
2014 CanBio RepoRt on the StatuS of BioeneRgy in Canada
EnERKEm
in 2003, enerkem began with a lab and pilot plant testing 25 different feedstocks to produce methanol and ethanol in Sherbrooke Quebec. their five ml demonstration plant in Westbury Quebec employs a syngas module that uses treated wood as feedstock from a nearby sawmill that recycles used telephone poles. the Westbury facility was commissioned and has been producing syngas since 2009, bio-methanol since 2011, and ethanol by 2012. enerkem’s most recent joint ventures with the City of edmonton and greenfield Specialty alcohols are unveiling the great potential for the continual advancement of biofuel production in Canada. a 35 ml waste to biofuels facility in edmonton was commissioned in 2013. it is scheduled to produce methanol in early 2014 and will follow with ethanol by early 2015. a second 35 mL cellulosic ethanol plant in varennes Quebec, a joint venture between enerkem and greenfield ethanol, is currently under development and will be in production by 2016.
Since 2011, ethanol capacity has been influenced by the industry’s struggle to deal with the food versus fuel debate and high corn prices. in 2012, the eu proposed the use of food-based biofuels be limited to 5% as part of the 10% renewable energy target of the Renewable energy directive. Such issues are motivating new producers to switch to non-food cellulosic and lingo-cellulosic feedstocks. there has been a noticeable shift in interest in Canada to utilize more advanced 2nd generation or cellulosic biomass options including forest biomass and other lingo-cellulosic materials. however, many of the advanced cellulosic technologies are largely in pre-commercial phases, in particular woody biomass based applications.
Canadian companies like Lignol and enerkem, have been developing bio-refining technologies to produce liquid fuels from a wide variety of (non-food grade) cellulosic biomass feedstocks since 2009: Lignol ceased operations of its Burnaby BC pilot in late 2014 due to difficulties in raising necessary financing for its first full scale commercial plant. enerkem, a municipal waste based application has a pilot in Sherbrooke and a demo plant in Westbury, Quebec. in 2013, three new facilities started up: atlantec Bioenergy started a pilot in pei; Woodland Biofuels started a pilot in Sarnia ontario, and ferme oliviere Lapin started a demo in St alexia Quebec. the first commercial scale 2nd generation ethanol plants will begin operations in 2014—enerkem’s plant in edmonton and the enerkem/greenfield partnership in varennes Quebec.

68
2014 CanBio RepoRt on the StatuS of BioeneRgy in Canada
tABlE 9.3
2nd generation ethanol Capacity
2011 2012 2013 2014–16
pilot (ml) 1.5 1.5 2.8 2.8
Commercial/demo (ml) 5 5 17 93
# pilots 2 2 4 4
# Commercial/demo 1 1 2 4
Source: 2013 Canadian Bioenergy Data Survey.
another R&d ethanol facility to have come online over the last year is atlantec Bioenergy in Cornwall pei. this facility was part of a SdtC project in 2011 in support of the R&d of technology to produce ethanol from energy (sugar) beets. the 300,000 litre per year plant was commissioned in 2012–2013, produced approximately 60,000 litres and is expected to ramp up to full production in 2014. aside from sugar beets being a non-food product, using sugar beets over corn to produce ethanol is beneficial since the starch in the corn must be treated and heated to convert it into sugar before being fermented. With sugar beets the sugar is extracted and goes straight to fermentation, making the energy footprint extremely low compared to corn. atlantec Bioenergy grows 50 acres of sugar beets in pei to satisfy its R&d and production needs.
another trend emerging within the ethanol sector is the integration of power capacity because of cost savings involved in self-generating and the revenue potential in selling green power. four of Canada’s ethanol companies want to maximize the use of local feedstocks and process waste residues on site to generate power for internal operations as a way to save energy costs and sell to the local utility.
to stimulate bioenergy development in alberta, the government committed to a nine point Bioenergy plan in 2006 that included three grant programs: the Bioenergy producer Credit program, the Biorefining Commercialization and market development program, and the Bioenergy infrastructure development program. two of these programs have provided funding support to several ethanol companies including permolex and enerkem alberta Biofuels that are currently in commissioning phases. in 2012, the sector had five other proposed 1st generation ethanol plants that did not proceed—four in alberta and one in Saskatchewan.
employment numbers were collected by the survey for all ethanol producers across Canada. a total of 876 workers are directly associated with the production of ethanol, or an average of 38 full-time employees per plant. this does not include numerous other jobs associated with the ethanol and feedstock and supply chain.

69
2014 CanBio RepoRt on the StatuS of BioeneRgy in Canada
9.2 BiodieSelBiodiesel is made from a variety of feedstocks. in Canada, canola is largely used among western producers in alberta and Saskatchewan, while recycled cooking oils, tallow (animal fats) and yellow greases (rendered oils) are mainly used in ontario and Quebec. the proposed facilities in alberta also plan to use canola as their primary feedstock. although canola may be abundant in Canada, it is a high-cost feedstock for biodiesel because it is priced as food oil, which competes in international markets, while reused oils and rendered fats are priced at industrial use levels. Rothsay Biodiesel, a rendering company with six processing plants across Canada, collects widely available edible and inedible animal by-products and oils from restaurants, grocery stores, butcher shops, farms, and grocery stores, thus allowing them to recycle over 700 million kilograms of waste materials each year.
in 2012, Canada consumed 28.1 billion litres (Bl) of diesel fuel of which 43%, was in ontario and Quebec. the mandate requiring 2% renewable fuel content in diesel fuel and heating oil started up in 2011. By 2012 the renewable mandate would require 563 ml of biodiesel. newfoundland and Labrador and other atlantic provinces along with Quebec (60on) were given exemptions from the first reporting period to give time to install biodiesel blending infrastructure. a $159 million ecoaBC initiative providing up to $25 million per project towards building or expanding biofuel production facilities was extended to September of 2012, while the temporary exemptions were also extended to June 30th, 2013.
tABlE 9.4
Consumption of diesel in Canada44
2009 2010 2011 2012
on & QC 11,169 11,751 12,423 12,017
prairies 9,596 10,738 11,297 10,448
BC & north 3,106 3,444 3,493 3,550
Atlantic 2,139 2,434 2,817 2,121
total 26,010 28,368 30,030 28,137
2%- Biodiesel 567 601 563
44 CAPP. Statistical Handbook: Canadian Demand for Motor Gasoline, 2012. Retrieved from: http://www.capp.ca/library/statistics/handbook/pages/statisticaltables.aspx?sectionno=6

70
2014 CanBio RepoRt on the StatuS of BioeneRgy in Canada
in 2011, there were ten biodiesel plants in operation in Canada with a total capacity of 235 ml. eastman Bio-fuels shut down in 2012 and a fire at Speedway international resulted in permanent closure of the plant. in 2013, the sector saw a 174% increase in production capacity owing to two new biodiesel facilities coming online. archer daniels midland in alberta became the largest biodiesel plant in the country with 265 ml of capacity, now capable of producing 41% of the biodiesel produced in Canada. great Lakes Biodiesel in ontario added 170 ml of capacity. once fully up and running, these two new facilities are capable of producing up to 68% of all biodiesel produced in Canada.
tABlE 9.5
Biodiesel Capacity 2011–13
2011 2012 2013
Capacity 235 235 644
production 97 149 149
Plants 10 8 10
Source: 2013 Canadian Bioenergy Data Survey.
it has not been easy for biodiesel producers. four companies attempting to get into the biodiesel business over the last three years have shut down, repurposed their business due to economic reasons or refocused on other markets such as canola oil. the total production is 149 ml, most of which was in ontario and Quebec. the single Saskatchewan plant is running at full capacity, while Quebec plants combined are running at 90% capacity utilization. With archer daniels midland and great Lakes Biodiesel coming on stream and total capacity reaching 644.3 ml, domestic biodiesel production has almost built up enough capacity to meet the current federal biodiesel mandate. however, by the end of 2014 the temporary biofuel exemptions for eastern Canada and Quebec will be lifted, so there should be an increase in domestic demand for biodiesel.

71
2014 CanBio RepoRt on the StatuS of BioeneRgy in Canada
tABlE 9.6
Canada Biodiesel Capacity & production by Region 2013
pRovinCEinStAllEd
CApACity (mml/y)pRoduCtion
(mml/y)CApACity
utilizAtion (%)
AB 265 0 0%
BC 51 11 22%
SK 20 20 100%
on 247 63 26%
QC 61.3 55 90%
total 644.3 149 23%
Source: 2013 Canadian Bioenergy Data Survey.
in 2012–13, there were ten proposed biodiesel plants; seven in alberta, two in ontario, and one in Quebec, totaling 1,357 ml if all were built. one of the proposed plants reported a capacity close to that of archer daniels midland, and two others were to have capacities of 300 ml and higher. Similar to the number of proposed ethanol plants, many of the proposed biodiesel facilities were granted funding through alberta’s Bioenergy producer Credit program aimed at encouraging investment in bioenergy production capacity in alberta to help meet required mandates and reduce reliance on fossil fuels. however in october of 2011 funding for this program had run out resulting in one alberta company halting its plans, making it unclear as to when these proposed facilities will move forward.
the united States department of agriculture global agricultural information network (gain) produced a report in July 2013 that estimated that Canada’s consumption of biodiesel at 713 ml would increase to 721 ml in 2014. With current biodiesel capacity at 644 ml in Canada and with eastern Canadian provinces including Quebec no longer being exempted from the renewable fuels mandate, Canada’s biodiesel capacity would still not meet provincial and federal mandates and Canada would continue to rely on imported biodiesel to ensure compliance.
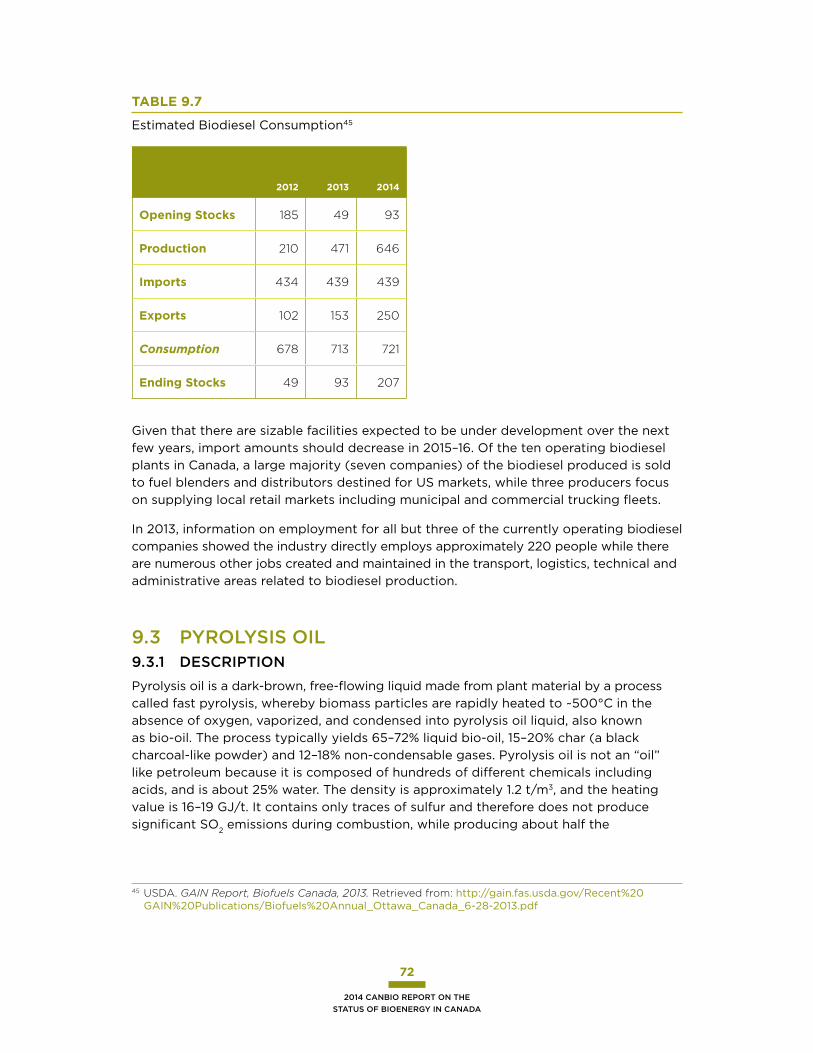
72
2014 CanBio RepoRt on the StatuS of BioeneRgy in Canada
tABlE 9.7
estimated Biodiesel Consumption45
2012 2013 2014
opening Stocks 185 49 93
production 210 471 646
imports 434 439 439
Exports 102 153 250
Consumption 678 713 721
Ending Stocks 49 93 207
given that there are sizable facilities expected to be under development over the next few years, import amounts should decrease in 2015–16. of the ten operating biodiesel plants in Canada, a large majority (seven companies) of the biodiesel produced is sold to fuel blenders and distributors destined for uS markets, while three producers focus on supplying local retail markets including municipal and commercial trucking fleets.
in 2013, information on employment for all but three of the currently operating biodiesel companies showed the industry directly employs approximately 220 people while there are numerous other jobs created and maintained in the transport, logistics, technical and administrative areas related to biodiesel production.
9.3 pyRolySiS oil9.3.1 deSCRiptionpyrolysis oil is a dark-brown, free-flowing liquid made from plant material by a process called fast pyrolysis, whereby biomass particles are rapidly heated to ~500°C in the absence of oxygen, vaporized, and condensed into pyrolysis oil liquid, also known as bio-oil. the process typically yields 65–72% liquid bio-oil, 15–20% char (a black charcoal-like powder) and 12–18% non-condensable gases. pyrolysis oil is not an “oil” like petroleum because it is composed of hundreds of different chemicals including acids, and is about 25% water. the density is approximately 1.2 t/m3, and the heating value is 16–19 gJ/t. it contains only traces of sulfur and therefore does not produce significant So2 emissions during combustion, while producing about half the
45 USDA. GAIN Report, Biofuels Canada, 2013. Retrieved from: http://gain.fas.usda.gov/Recent%20gain%20publications/Biofuels%20annual_ottawa_Canada_6-28-2013.pdf

73
2014 CanBio RepoRt on the StatuS of BioeneRgy in Canada
nox emissions in comparison with fossil fuels.46 pyrolysis oil can be stored, pumped and transported similar to petroleum products. however, pyrolysis oil has a ph of two to three, about the same acidity as household vinegar. the acidic and corrosive nature of pyrolysis oil means that modifications are required for storage and transportation. Storage vessels and piping should be stainless steel, pvC, teflon or similar corrosion-resistant materials.
9.3.2 CuRRent maRketSSince the 1990’s, pyrolysis oil has been used to extract food flavouring (liquid smoke) for the food industry with residues combusted in boilers to produce heat. potential applications could include replacing heavy fuel oil, light fuel oil or natural gas in pulp mill limekilns, large power plants and district heating plants, as well as heating in greenhouses and sawmill dry kilns. however, there is no proven technology to handle and combust pyrolysis oil solely on its own and hence commercial applications have largely been stalled. there are indications that pyrolysis oil can be co-fired in a type of dual fuel arrangement, but these applications remain in the early stages. until a commercial application for pyrolysis oil for heat or preferable heat and power is proven, production of pyrolysis oil will be limited.
9.3.3 induStRial pRoduCtionensysn operates a fast pyrolysis plant, which was commissioned in 2007, next to a flooring production facility located approximately 90 kilometres north-west of ottawa, ontario. ensyn produces commercial quantities of bio-liquids at this facility and testing is carried out on different feedstocks and reactor configurations. the principal Rapid thermal processing (Rtp) unit at Renfrew has a nominal processing capacity of 75 dry tonnes per day (150 tonnes per day of green material). however, it routinely operates at capacities in excess of its nominal design rate, with a maximum demonstrated processing capacity of 100 dry tonnes per day. the actual capacity depends on the biomass feedstock being converted. the facility incorporates the principal Rtp unit as well as smaller testing facilities, liquid fuel handling facilities and chemical processing units.
manitoba hydro, the major energy utility serving manitoba, will work in conjunction with the utility’s host site customers to showcase five pathways for converting raw biomass into useful energy: pyrolysis oil, syngas, waste heat, biogas and biocarbon. the demonstration project involved the production and use of pyrolysis oil as a replacement for heavy fuel oil in a large scale combined heat and power system at the tolko Kraft paper mill in the pas, manitoba. the mill relies on a combination of hog fuel, waste oil, and bunker C fuel oil to fuel a power boiler for the production of high pressure steam for process heat and electricity. the equipment and services for this project were provided by ensyn technologies Ltd., based in ottawa.
46 IEA Task 40. Low Cost Long Distance Biomass Supply Chains 2013. Retrieved from: http://www.bioenergytrade.org/downloads/t40-low-cost-long-distance-biomass-supply-chains.pdf

74
2014 CanBio RepoRt on the StatuS of BioeneRgy in Canada
the demonstration successfully fired over 60,000 liters of bio-oil in 2010 with stable combustion with extensive emissions monitoring showing improved boiler performance. a second demonstration is planned for a grain drying operation where bio-oil will replace propane.
pyrovac in 1998 completed its vacuum-assisted pyrolysis plant (84 t/d feed, mainly bark) in Jonquière, Quebec and operated for approximately 2000 hours before being mothballed. Recently the plant has been sold to the uSa-based company three dimensional timberlands . the plant will be moved to gold Beach, oregon where its initial focus will be to produce biochar. dr, Christian Roy, developer of the pyrovac technology, will act as a consultant on the new plant commissioning and operation.

75
2014 CanBio RepoRt on the StatuS of BioeneRgy in Canada
10.0 tRadeCanada has the 11th largest economy in the world, but is only 35th
in population. this small domestic market dictates the need to rely
on trade for economic growth. pellets, ethanol, biodiesel, torrefied
wood and pyrolysis oil are tradable, while bio-heat and cogeneration
are generally not.

76
2014 CanBio RepoRt on the StatuS of BioeneRgy in Canada
10.1 Wood pelletSCanada exported almost two million tonnes of wood pellets in 2013, or 86% of production. domestic sales were 312,429 tonnes. many plants are operating at below capacity with total unused capacity in 2013 at 980,000 tonnes. Some plants in ontario, Quebec and new Brunswick are entering new markets where they can be competitive while other plants remain uncompetitive.
figuRE 10.1
Canada exports vs. Capacity
Source: 2013 Canadian Bioenergy Data Survey.
BC dominates, exporting 1.55 million tonnes or 96% of production primarily to the industrial heat and power market in europe, with a small amount now going to Japan.
Domestic
Export
Unused Capacity
1,997,982
979,589
312,429

77
2014 CanBio RepoRt on the StatuS of BioeneRgy in Canada
tABlE 10.1
Canadian pellet exports
CApACity domEStiC ExpoRtS % ExpoRtS AvAilABlE
BC 2,017,000 56,368 1,549,532 96% 411,100
QC 625,000 122,350 233,650 66% 269,000
nB 202,000 34,200 124,800 78% 43,000
AB 150,000 48,500 34,500 42% 67,000
nS 168,000 31,511 28,500 47% 107,989
on 95,000 17,000 27,000 61% 51,000
SK 15,000 2,000 0 0% 13,000
nl 13,000 500 0 0% 12,500
mB 5,000 0 5,000
Can 3,290,000 312,429 1,997,982 86% 979,589
Source: 2013 Canadian Bioenergy Data Survey.
not all plants reported export destinations, but the survey found that at least 200,000 tonnes are now sold from eastern Canada into the bag market in italy, and 106,000 tonnes are sold from Western Canada into Japan. the uS market is now rebounding. Currently, 109,000 tonnes make their way to the uS, primarily from alberta and Quebec.
10.2 ethanol in the past the only exports of ethanol were cross-border trades to save east-West transportation costs. the 2013 survey participants reported no exports. the fapRi 2012 database estimated net imports of 545 ml in 2013 and projected 574 ml in 2014.

78
2014 CanBio RepoRt on the StatuS of BioeneRgy in Canada
tABlE 10.2
ethanol imports47
2010 2011 2012 2013 2014f
production 1,200 1,350 1,452 1,527 1,547
Consumption 1,690 1,950 2,013 2,072 2,120
net imports 490 600 561 545 574
10.3 BiodieSeleffective capacity without the just-opened archer daniels midland plant was 379 ml in 2013 but production was only 149 ml. the survey revealed that 110 ml was exported, 28 ml was used domestically, and 11 ml was unknown.
tABlE 10.3
Biodiesel exports
2013 ml
Exports 109.6
domestic 28.4
unknown 11.0
production 149.0
Source: 2013 Canadian Bioenergy Data Survey.
47 FAPRI. (2013) FAPRI ISU-2012 World Agricultural Outlook. Retrieved from: http://www.fapri.iastate.edu/outlook/2012/

79
2014 CanBio RepoRt on the StatuS of BioeneRgy in Canada
11.o SuppLy ChainS (peLLetS)Efficient supply chains often determine the economic viability
or feasibility of on-site bioenergy, which depends on low-cost,
regular, assured delivery of feedstock. Exportable products such
as pellets depend on appropriate storage, handling and shipping
of finished product.
80
2014 CanBio RepoRt on the StatuS of BioeneRgy in Canada
to address these issues, fibreco, a vancouver terminal, invested in storage and handling equipment for pellets. there is now covered storage for 40,000 tonnes of pellets as well as covered conveyors for loading. fibreco also commingles pellets from several plants, all having the same certified quality. an empty handymax ship can dock, fill up, and head to european customers. fibreco took over all vancouver pellet exports. in northern BC, pinnacle pellet, Canada’s largest pellet producer, decided to invest in its supply chains. it bought 300 rail cars to assure the rolling stock necessary to move pellets, and the just completed Westview pellet terminal, near Ridley (prince Rupert), has the storage, handing and loading needed for a 70,000 panamax ship.
despite improvements, the east still has supply chain difficulties. in ontario, atikokan pellets had a business plan to produce 135,000 tonnes pellets—45,000 tonnes would supply the opg generating station and the rest would be shipped to european customers. however the business model did not work with a 2,200 km rail supply chain and poor St. Lawrence port facilities.
Quebec had several small pellet plants and each separately arranged shipping and handling of small volumes, resulting in unnecessarily high costs. Subsequently Rentech developed a plan to build a 350,000 tonne pellet plant in Wawa ontario, and signed an off-take agreement with one purchaser, drax, the largest power generator in the uK. With the off-take agreement and the promise of significant pellet volumes, Rentech convinced the port of Quebec to build a new pellet terminal with 75,000 tonnes storage, designed to move 400,000 tonnes per year. Rentech also bought sufficient rail cars meant for grain in a collapsed business deal to reduce the cost of rail over 1,800 km. With an efficient long distance ontario-to-St. Lawrence supply chain, Rentech was able to acquire the atikokan plant and make it work. Supply chain innovation is happening, but the new Quebec pellet terminal is only for Rentech. other Quebec and ontario producers must do likewise: achieve equality in pellet standards, comingle pellets, arrange better ground supply chains, co-invest in better port handling, and collectively arrange shipping.
in new Brunswick, two pellet producers move 120,000 tonnes of pellets through the port of Belledune. Costs have been high because the shared movable loader is inefficient, and each plant had its own small storage. Recently, the port of Belledune expanded storage capability, but differences in the quality of pellets prevents mingling and resulting cost savings. newfoundland and Labrador had three pellet plants. two are now shut down largely because they have no efficient port facilities to keep transportation costs down.

81
2014 CanBio RepoRt on the StatuS of BioeneRgy in Canada
12.0 feedStoCKS

82
2014 CanBio RepoRt on the StatuS of BioeneRgy in Canada
12.1 p&p as indicated in Section 3.1.1, the federal ppgtp was fundamental in pulp and paper mills adding 195 mW of cogeneration capacity in 2010–2014. thirty four out of 39 pulp and paper plants with cogeneration capabilities reported their feedstock sources for a combined capacity of 1,462 mW. overall, 12 cogeneration plants use only spent pulping liquor to generate power, while seven used primarily pulping liquor and some other feedstock. fourteen mills used only hog fuel and wood waste in cogeneration operations, mainly on site. three plants used a significant proportion of natural gas as a feedstock, while five plants used oil and gas as auxiliary fuels in the event of lack of available biomass.
tABlE 12.1
pulp and paper Cogen feedstock
hog fuElpulping liQuoR
wood wAStE
nAtuRAl gAS
hEAvy fuEl oil totAl
Capacity 165.3 857.0 324.9 107.7 7.3 1,462.2
% of Cap 11.3% 58.6% 22.2% 7.4% 0.5%
Source: 2013 Canadian Bioenergy Data Survey.
12.2 ipp’S ipps fueled by biomass use a combination of wood waste and hog fuel, mainly from local sawmills, with some material from on-site sawmills we well. in ontario, there are two ipps that use natural gas for about 63% of their energy production. Canada-wide, ipps produce 78% of their energy from biomass.

83
2014 CanBio RepoRt on the StatuS of BioeneRgy in Canada
tABlE 12.2
ipp feedstock
BiomASS n.gAS totAl
BC 138.3 138.3
AB 78.5 78.5
on 70.7 120.5 191.2
QC 70.6 70.6
nS 61.2 61.2
total 419.3 120.5 539.8
% 78% 22%
Source: 2013 Canadian Bioenergy Data Survey.
12.3 BiogaS of 68 biogas systems reporting feedstocks in the survey, 28 used manure as a feedstock, almost all on site; eight systems use organic food waste, primarily from offsite sources; 17 systems use agricultural wastes excluding manure such as corn silage, hay and grasses primarily on site; seven use off site cooking oils and greases from urban centers; and seven use municipal solid waste (mSW) from landfills or offsite sources.

84
2014 CanBio RepoRt on the StatuS of BioeneRgy in Canada
tABlE 12.3
Biogas feedstocks
fEEdStoCK lAndfillon
SitEoff SitE totAl
organics (food waste)
0 3 5 8
organics (Agr. waste ex manure)
0 10 7 17
manure 0 25 3 28
mSw 3 1 3 7
Cooking oils 0 0 7 7
pulp mill Effluent 0 1 0 1
total 3 40 25 68
Source: 2013 Canadian Bioenergy Data Survey.
12.4 Community heating for community heating systems, wood pellets feed 25 of 26 systems in nWt. in BC, 15 systems use wood pellets while 20 use either wood waste or hog fuel. in ontario and pei almost all use hog fuel. Quebec did not report, but some of the heat plants are known to use harvest residues and pellets, while four plants use mSW as fuel.
12.5 pelletS historically pellets were made from sawdust and shavings acquired at relatively low cost from local sawmills. the uS housing crisis led to a 50% decline in sawmill production in Canada and a corresponding decline in mill residues available for manufacturing pellets. this shortage hit BC particularly hard as it had built up a sizable pellet industry. to compensate, BC pellet manufactures turned to harvest residues for a portion of their feedstock. mill residues are normally devoid of bark, making it an excellent feedstock for pellets, while harvest residues are more expensive, but require the removal of a considerable amount of bark. however, in BC not only was 25–40% of each harvested tree left at the roadside as harvest residue, but the damage caused by mountain pine beetle caused bark to fall off the harvest residues while being trucked to the pellet plant.

85
2014 CanBio RepoRt on the StatuS of BioeneRgy in Canada
the survey showed that nationally most pellet plants still use mill residues for 100% of their feedstock. BC plants used 60% mill residues, 22% logs, 9% harvest residues, 9% hog fuel and 1% chips. new Brunswick plants used 94% mill residue and 6% logs, while ontario plants used a small amount of chips.
12.6 ethanol in the prairies, five plants use exclusively wheat with one plant using a small amount of barley while two plants use a mix of wheat and corn. in ontario, three plants use wheat exclusively and three only use corn. in Quebec the one 1st generation ethanol plant uses exclusively corn.
in the 2nd generation ethanol plants two use various feedstocks, two use wood waste, and one uses energy beets. enerkem’s edmonton plant will use mSW.
12.7 BiodieSelBiodiesel is made from a variety of feedstocks. in Canada, canola is largely used among western producers in alberta and Saskatchewan, while recycled cooking oils, tallow and yellow greases are mainly used in ontario and Quebec. the proposed facilities in alberta also plan to use canola as their primary feedstock. as for biodiesel, 52 ml are made from tallow, fats and oils, 20 ml from canola, and 12 ml from yellow grease, some of it imported from the uS. in eastern Canada, 65 ml are made from multi-feedstock from surrounding farms.
tABlE 12.4
Biodiesel feedstocks
fEEdStoCK ml
Multi-feedstock 65
Tallow, fats, oils 52
Canola 20
Yellow Grease 12
Total 149
Source: 2013 Canadian Bioenergy Data Survey.

86
2014 CanBio RepoRt on the StatuS of BioeneRgy in Canada

87
2014 CanBio RepoRt on the StatuS of BioeneRgy in Canada
13.0 diSCuSSion
European countries do not have large amounts of biomass, yet they
have become leaders in bioenergy. this is largely because they want
to increase energy self-sufficiency in the absence of abundant oil or
gas reserves, and also to reduce the impacts of climate change.

88
2014 CanBio RepoRt on the StatuS of BioeneRgy in Canada
Canada is blessed with both oil and gas resources, so the economics of bioenergy options can vary significantly, even across regions. Canada is also a small market country and economic growth has depended on trade and competitiveness on a global scale. thus, Canada’s bioenergy beginnings were spawned in using biomass to reduce costs in pulp and paper mills and using waste mill residues to manufacture pellets for export.
Rising world energy prices allowed Canadians firms to consider all the different types of biomass domestically, and the different uses. the 2011-13 Bioenergy Surveys and data Studies revealed how Canada’s bioenergy industry, with its various types of biomass, grew in many different directions, from simple use of biomass for building heat, to being leaders in the development of products such as pyrolysis oil and lingo-cellulosic ethanol. many opportunities remain for growth in bio-heat, bio-power, and the export or domestic use of pellets, torrefied wood and other products. the industry is now trying to further diversify from energy products to higher-value bio-chemicals. in doing so, industry is helping to replace many jobs lost in small communities once dependent on traditional forest products.
the survey noted great improvements in one of Canada’s most energy-intensive sectors, pulp and paper, with significant investments made through the federal ppgtp in upgrading equipment, improving energy efficiencies, emission controls and increasing energy produced from renewable sources. in 2010–14 alone pulp and paper mills increased renewable energy by 166 mW, or 12%.
the Canadian wood pellet industry has grown to become the second largest exporter of pellets in the world, and is poised to expand in both eastern and Western Canada and make inroads into asia. pellet demand is driven by foreign policies, and there are risks especially in europe where the relative importance of renewable energy targets versus economic growth is in debate. Canadian producers are under pressure from growing competition, from the uS Southeast in particular, which recently overtook Canada as the biggest supplier of pellets to europe. Canadian producers are responding by developing new highly-efficient supply chains to improve competitiveness. pinnacle pellet is building a new pellet terminal in BC with the rail siding, storage, and loading facilities to fill a panamax ship and Rentech is opening up northern ontario as a pellet source by buying rail cars to minimize costs and building a pellet terminal in Quebec. other Quebec and ontario producers must work to achieve equality in pellet standards to reduce costs, co-invest in better port facilities, and collectively arrange shipping to reduce export costs.
With pellet producers expanding on the basis of exports, the expectation is that despite widespread availability of low-cost natural gas the domestic market will grow in areas not connected to gas infrastructure. and so it has. the number of community heat installations has increased greatly, partially due to supportive provincial policies, positive economics from fossil fuel savings, but more so because of local champions (individuals & organizations) that put together all the pieces to make it happen. the most notable growth has been in BC, Quebec, nWt, and pei, and driving organizations include arctic green energy and the arctic energy alliance, Wood Waste 2 Rural heat and the BC Bioenergy network. in an innovative approach in pei, Wood4heat and the pei Bio heat initiative have offered to help with such decisions as determining boiler size, securing biomass supply, choosing the best boiler and buildings for connection,

89
2014 CanBio RepoRt on the StatuS of BioeneRgy in Canada
and equipment installations in exchange for an agreement to buy heat and save money. a similar trend needs to take place in remote and semi-remote communities where power is still generated by expensive fossil fuels, such as ontario’s off-grid and aboriginal communities. abundant wood resources surround these communities and champions are needed to use the right technology to produce renewable bio-heat and power.
there is a need to identify and provide greater support to emerging bio-economy clusters such as Bio-mile in drayton valley alberta and Sarnia, ontario. to date, the federal, provincial and territorial governments have implemented an array of successful policies and initiatives to promote bioenergy, including initiatives in BC and nWt that resulted in development of community biomass heat; ontario policy initiatives that led to leadership in biogas to power; and federal programs that played a large role in the development of bio-fuels. Continued support is taking shape through cross-sector and industry government partnerships meant to broaden industry scope beyond energy and toward development of a greater bio-economy. the forest products association of Canada (fpaC) started with the development of the Bio-pathways partnership network, encompassing over 250 organizations focused on exploring new business opportunities in the chemical, pharmaceutical, auto, aerospace and plastics industries. in 2013, nine industry groups formed the Bio-economy network (Ben): CanBio, CRfa, fpaC, fpinnovations, CropLife Canada, Chemistry industry association of Canada, automotive parts manufacturers’ association, BioteCanada and Sustainable Chemistry alliance. these nine industry groups representing 800 member companies believe in using Canada’s abundant renewable forest and agricultural resources to develop the bio-economy to support jobs and future economic growth.
the 2013 bioenergy data survey and study provided an extensive review of the bioenergy industry to date and highlighted areas that could be covered in future reviews. future surveys should expand to include bio-chemicals and bio-pharmaceuticals to assess what barriers still exist and how to overcome them.
in summary, Canada still has large volumes of available biomass, and though the industry has grown considerably, many opportunities remain. this includes community bio-heat, small power, biogas, and torrefied wood, advanced fuels and specialty chemicals, and pyrolysis oil for industrial processes. Supply chain innovations also mean that Canada can regain leadership in biomass exports and continue to provide jobs in small communities. Continued development will be the necessary building block to the future development of high-value products such as bio-chemicals and bio-pharmaceuticals.

90
2014 CanBio RepoRt on the StatuS of BioeneRgy in Canada