2014 annual report for activities under the endangered ... · appendix b university of idaho 2014...
TRANSCRIPT

2014 Annual Report for Activities under the Endangered Species Act Biological Opinion (For the period October 31, 2013 to December 31, 2014)
Lewiston Orchards Project, Lewiston Idaho Submitted to the National Marine Fisheries Service Boise, Idaho
U.S. Department of the Interior Bureau of Reclamation Pacific Northwest Region Snake River Area Office Boise, Idaho April 2015

U.S. DEPARTMENT OF THE INTERIOR
PROTECTING AMERICA’S GREAT OUTDOORS AND POWERING OUR FUTURE
The U.S. Department of the Interior protects America’s natural resources and heritage, honors our cultures and tribal communities, and supplies the energy to power our future.
MISSION OF THE BUREAU OF RECLAMATION
The mission of the Bureau of Reclamation is to manage, develop, and protect water and related resources in an environmentally and economically sound manner in the interest of the American public.
Front cover photograph – Sweetwater Creek looking upstream from the Sweetwater Diversion on the Lewiston Orchards Project
2014 Annual Report for Activities under the Endangered Species Act Biological Opinion (For the period October 31, 2013 to December 31, 2014)
Lewiston Orchards Project, Lewiston Idaho Submitted to the National Marine Fisheries Service Boise, Idaho
U.S. Department of the Interior Bureau of Reclamation Pacific Northwest Region Snake River Area Office Boise, Idaho April 2015


Acronyms and Abbreviations
2010 Opinion National Marine Fisheries Service 2010 Biological Opinion
cfs cubic feet per second
EPA Environmental Protection Agency
ESA Endangered Species Act
ESU Evolutionarily significant units
LOID Lewiston Orchards Irrigation District
LOP Lewiston Orchards Project
NMFS National Oceanic and Atmospheric Administration National Marine Fisheries Service
Reclamation U.S. Bureau of Reclamation
RPM Reasonable and prudent measures
Tribe Nez Perce Tribe
USGS U.S. Geological Survey


CONTENTS
Acronyms and Abbreviations
1. Introduction .............................................................................................. 1
2. RPM 1: Flow Management ........................................................................ 2
2.1 Minimum Bypass Streamflow Requirements in Sweetwater and Webb Creeks ......................................................................................... 2
2.2 Sweetwater Creek.................................................................................. 4
2.3 Webb Creek .......................................................................................... 6
2.4 Ramping Rates ...................................................................................... 7
2.5 Gravel Management Activities ................................................................. 8
3. RPM 2: Connectivity Monitoring ............................................................... 9
4. RPM 3: Streamflow Monitoring ................................................................ 9
5. RPM 4: Monitoring Critical Uncertainties ............................................... 11
5.1 O. mykiss Density Monitoring ................................................................ 11
5.2 O. mykiss Adult Returns ........................................................................ 14
5.3 Temperature Monitoring ........................................................................ 15
6. RPM 5: Optimal Streamflow Allocation .................................................. 36
7. Literature Cited ....................................................................................... 37
Appendices
Appendix A Sweetwater and Webb Creek Flow Tables (This is an excel data file for data sharing and is included as a CD at the back of this report)
Appendix B University of Idaho 2014 Report “The Ecology of Oncorhynchus mykiss in the Lapwai B asin, Density and Growth Monitoring”
Appendix C Nez Perce Tribe 2014 Lapwai Creek PIT Tag Detection Summary
List of Figures
Figure 1. Mean daily streamflow (cfs) measured past the Sweetwater Diversion Dam and bypass flow targets for the first half of the irrigation season (March 1 through May 31, 2014). .................................... 5
2014 Annual Report – Lewiston Orchards i
CONTENTS (CONTINUED)
Figure 2. Mean daily streamflow (cfs) measured past the Sweetwater Diversion Dam for the second half of the irrigation season (June 1 through October 31, 2014). ................................................................... 6
Figure 3. Mean daily streamflow (cfs) measured past the Webb Creek Diversion Dam for the 2014 irrigation season. ............................................ 7
Figure 4. Mean daily streamflows (cfs) measured near the mouth of Sweetwater Creek (USGS gage 13342340) during water year 2014. .................................................................................................... 10
Figure 5. Mean daily streamflow (cfs) measured near the mouth of Webb Creek (USGS gage 13342295) during water year 2014. ............................. 10
Figure 6. Map of the Lapwai Basin showing the six long-term monitoring sites. ..................................................................................................... 13
Figure 7. Total O. mykiss densities at 6 monitoring sites during August 2010 through 2014. Site codes are: LSX (lower Sweetwater), MLX (Lapwai below Mission), ULU ( upper Lapwai), UMU ( upper Mission), UWM ( upper Webb), USU ( upper Sweetwater). .......................... 14
Figure 8. Maximum daily stream temperature (oC) and mean daily flow (cfs) measured near the outflow from Soldiers Meadows Reservoir during 2014. ........................................................................... 17
Figure 9. Daily stream temperature variation (oC) measured near the outflow from Soldiers Meadows Reservoir (daily maximum – daily minimum). ..................................................................................... 18
Figure 10. Mean and maximum daily stream temperature ( oC) measured upstream from the Webb Creek Diversion. ............................................... 19
Figure 11. Daily stream temperature variation (oC) measured upstream from the Webb Creek Diversion............................................................... 19
Figure 12. Maximum daily stream temperature (oC) measured near the mouth of Webb Creek and at the Webb Creek Diversion pool. ................... 20
Figure 13. Minimum – maximum daily stream temperature variation (oC) measured near the mouth of Webb Creek. ............................................... 21
Figure 14. Mean and maximum daily stream temperature ( oC) measured near the mouth of the West Fork of Sweetwater Creek. ............................ 22
Figure 15. Daily stream temperature variation (oC) measured near the mouth of the West Fork of Sweetwater Creek. ......................................... 22
2014 Annual Report – Lewiston Orchards ii

CONTENTS (CONTINUED)
Figure 16. Mean and maximum daily stream temperature (oC) measured near the mouth of the East Fork of Sweetwater Creek. ............................. 23
Figure 17. Mean daily stream temperature (°C) measured near the mouth of the East Fork of Sweetwater Creek, upstream from the Webb Creek Diversion, and at the mouth of the West Fork of Sweetwater Creek.................................................................................. 24
Figure 18. Mean and maximum daily stream temperature (oC) measured near the Sweetwater Creek Diversion. ..................................................... 25
Figure 19. Mean and maximum daily stream temperature (oC) measured upstream from the Webb Creek confluence with Sweetwater Creek.................................................................................................... 26
Figure 20. Mean daily stream temperature (°C) measured upstream from the Webb Creek confluence with Sweetwater Creek compared to mean daily temperatures just downstream of the Sweetwater Creek Diversion. .................................................................................... 27
Figure 21. Mean and maximum daily stream temperature (°C) measured downstream from the Webb Creek confluence with Sweetwater Creek.................................................................................................... 27
Figure 22. Correlation of mean daily stream temperature (°C) measured upstream and downstream from the Webb Creek confluence with Sweetwater Creek. ......................................................................... 28
Figure 23. Mean daily stream temperature (°C) measured upstream from the Webb Creek confluence with Sweetwater Creek compared to mean daily temperatures just downstream of the Webb Creek confluence. ........................................................................................... 29
Figure 24. Mean and maximum daily stream temperature (oC) measured near the Sweetwater Creek mouth. ......................................................... 30
Figure 25. Mean daily stream temperature (°C) measured upstream from the Webb Creek confluence with Sweetwater Creek compared to mean daily temperatures measured near the mouth of Sweetwater Creek.................................................................................. 30
Figure 26. Daily maximum stream temperature (oC) measured near the mouth of Webb Creek compared to daily maximum temperatures measured near the mouth of Sweetwater Creek. ................. 31
2014 Annual Report – Lewiston Orchards iii

CONTENTS (CONTINUED)
Figure 27. Mean and maximum daily stream temperature (°C) of Lapwai Creek measured upstream from the Sweetwater Creek Lapwai Creek Confluence. .................................................................................. 32
Figure 28. Maximum daily stream temperature (°C) relationship between Lapwai Creek and the maximum daily stream temperature of Sweetwater Creek mouth during 2009 to 2014......................................... 33
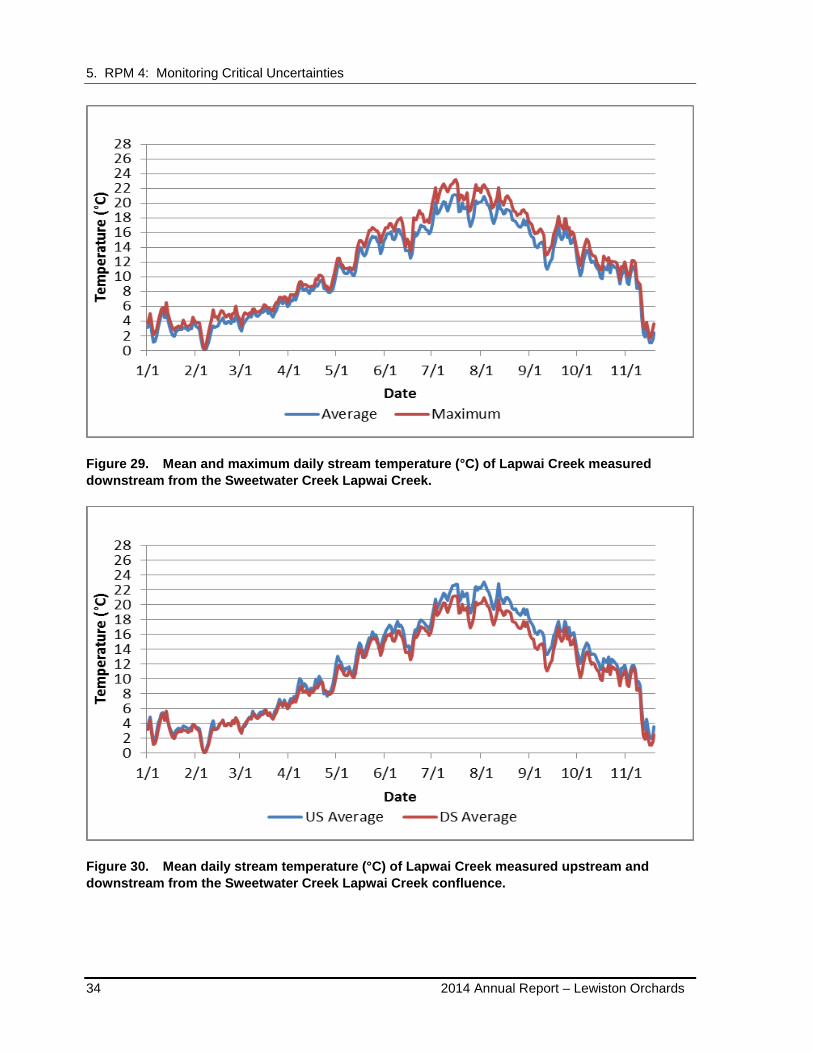
Figure 29. Mean and maximum daily stream temperature (°C) of Lapwai Creek measured downstream from the Sweetwater Creek Lapwai Creek. ........................................................................................ 34
Figure 30. Mean daily stream temperature (°C) of Lapwai Creek measured upstream and downstream from the Sweetwater Creek Lapwai Creek confluence. .................................................................................. 34
Figure 31. Mean daily stream temperature (°C) of Lapwai Creek measured downstream from the Sweetwater Creek Lapwai Creek confluence and near the Tom Beal Creek confluence. ............................... 35
Figure 32. Mean daily stream temperature (°C) of Lapwai Creek measured near the Tom Beal Creek confluence and the mouth of Lapwai Creek. ................................................................................................... 35
Figure 33. Mean daily stream temperature (°C) of Lapwai Creek measured downstream from the Sweetwater Creek Lapwai Creek confluence and the mouth of Lapwai Creek.............................................. 36
List of Tables
Table 1. Instream flow minimum releases (cfs) for Sweetwater and Webb Creeks at their respective diversion dam sites (NMFS 2010). .....................................................................................................2
Table 2. Increments of additional juvenile rearing flow as a function of combined storage for June 1 through September 15 (NMFS 2010). .....................................................................................................3
Table 3. Total flows required in Sweetwater and Webb Creeks with the additional volume and mediated flows. ......................................................3
Table 4. Mean monthly streamflow (cfs) measured from daily average data at the USGS monitoring gages at the mouth of Sweetwater and Webb Creeks during water year 2014. ................................................9
2014 Annual Report – Lewiston Orchards iv

1. INTRODUCTION
On April 15, 2010, the National Oceanic and Atmospheric Administration National Marine Fisheries Service (NMFS) issued a 2010 Biological Opinion (2010 Opinion) under the Endangered Species Act (ESA) to the U.S. Bureau of Reclamation (Reclamation) for the operation and maintenance of the Lewiston Orchards Project (LOP). This report is submitted to comply with Reasonable and Prudent Measure (RPM) 6, requiring Reclamation to report to the NMFS annually on activities related to implementing the 2010 Opinion.
This 2010 Opinion requires that Reclamation provide minimum flows below the diversion dams as described in the proposed action. Reclamation may be required to provide additional flows from June through mid-September, based upon combined storage as of June 1 in Soldiers Meadow Reservoir and Reservoir A.
As a result of court-sponsored mediation in January 2011, Reclamation agreed to provide 90 acre-feet of LOP water annually in 2011, 2012, 2013, and 2014 to supplement instream flows in both Sweetwater and Webb Creek. The 90 acre-feet is timed to be released during normal operation periods in accordance with the direction of the Nez Perce Tribe (Tribe).
This annual report covers the LOP operation and maintenance activities from October 31, 2013 to December 31, 2014 for published streamflows, irrigation operations, and fisheries monitoring. The Lewiston Orchard Irrigation District (LOID) operated the surface water collection system from March 4, 2013 until October 31, 2014.
To enhance the project’s ability to consistently meet minimum flow requirements, Reclamation and the LOID continue to operate and maintain water measurement and gate automation equipment at the headgates to Sweetwater Canal and Webb Creek Diversion Dam. The gate automation equipment continually self-adjusts to maintain minimum streamflow past the diversion dam. Gate automation greatly improves LOP’s ability to maintain flow targets and minimize daily variability related to operations.
No injuries or mortalities of ESA-listed steelhead, associated with operations, were observed during the 2014 reporting period.
2014 Annual Report – Lewiston Orchards 1
2. RPM 1: Flow Management
2. RPM 1: FLOW MANAGEMENT
2.1 Minimum Bypass Streamflow Requirements in Sweetwater and Webb Creeks
2.1.1 Background
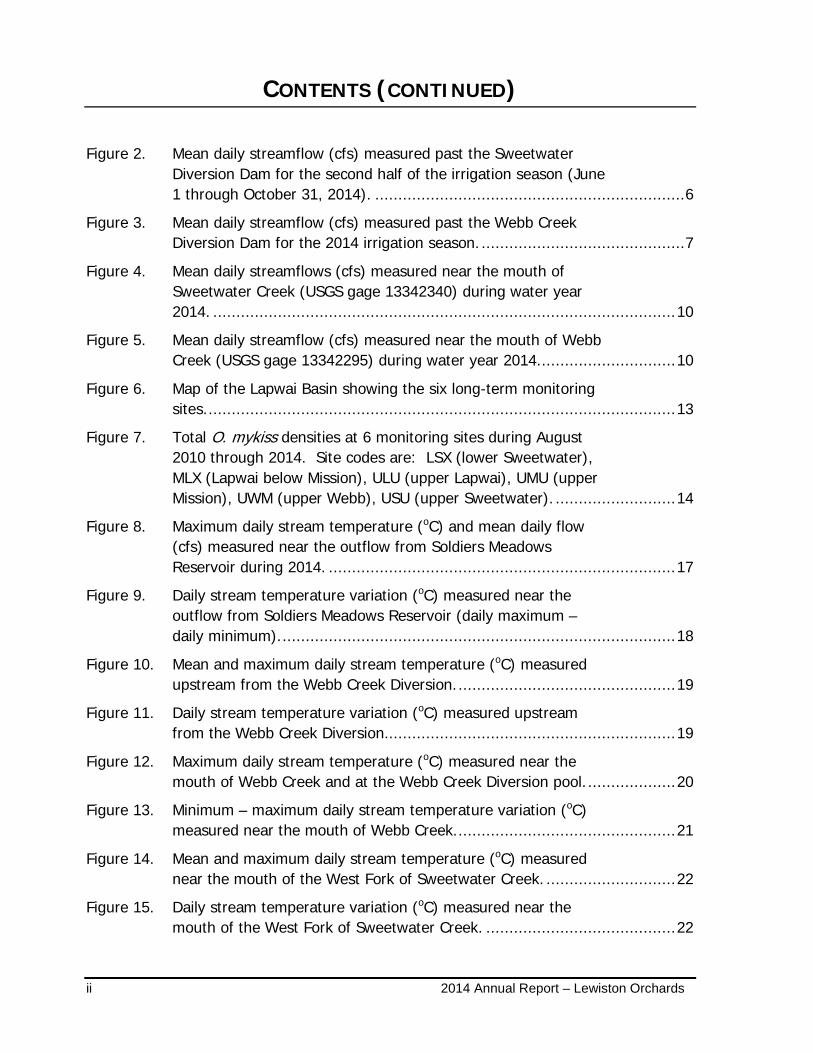
RPM 1 of the 2010 Opinion, require LOP operations to bypass flows in Sweetwater and Webb Creek based on the life stage of steelhead. The minimum daily bypass flows for Sweetwater and Webb Creek are shown in Table 1.
Table 1. Instream flow minimum releases (cfs) for Sweetwater and Webb Creeks at their respective diversion dam sites (NMFS 2010).
Life Stage Spawning Juvenile Rearing
Month Feb Mar Apr May Jun Jul Aug Sep 1-15
Sep 16-30
Oct Nov Dec Jan
Sweetwater Creek 7.8/Ib 7.8/I 7.8 3.0 2.5 2.5 2.5 2.5 2.5 2.5 Ia
Webb Creek
4.0/Ib 4.0/I 4.0 1.5 1.0 1.0 1.0 1.0 1.0 1.0 Ia
a During November, December, and January, all inflow (I) at Sweetwater and Webb Creeks Diversion Dams will be bypassed. b During February and March, either the specified streamflow will be provided or all inflow (I) to the Sweetwater and Webb Creek Diversion Dams will be bypassed, whichever is less.
The instream flow regime in Table 1 addresses all months of the year; these flows will be used to support spawning conditions during February through April and juvenile rearing conditions from May through January. The LOP will not operate the Sweetwater and Webb Diversion Dams during November, December, and January; therefore, all instream flow reaching the dams will be bypassed during those months. During February and March, if the inflows to either Sweetwater or Webb Creek Diversion Dams are below the specified minimum flow, the LOID will bypass all inflow (I) to that diversion dam until it reaches the specified targets before beginning any diversions. In October the specified minimum flows will be passed when the diversion dams are in operation. When the diversion dams are turned off for the season, all inflow will be bypassed. For Webb Creek, the “I” flow is composed of all runoff from the watershed upstream of the diversion and below Soldiers Meadow Dam. For Sweetwater Creek, the “I” flow is composed of all runoff from the watershed upstream of the dam, except for any diversions occurring at the West Fork diversion which are being conveyed to Lake Waha (NMFS 2010).
2014 Annual Report – Lewiston Orchards 2

2. RPM 1: Flow Management
In addition, Reclamation may supply additional flows into Sweetwater and Webb Creek for June through mid-September, based on the combined storage in Soldiers Meadow Reservoir and Reservoir A, as assessed on June 1. The additional increments allocated for Sweetwater and Webb Creek, and the storage conditions under which they would occur, are shown in Table 2.
Table 2. Increments of additional juvenile rearing flow as a function of combined storage for June 1 through September 15 (NMFS 2010).
Combined Storage (acre-feet) <3,800 3,900 4,000 4,100 4,200 >4,250
Sweetwater Creek (cfs) +0 +0.5 +0.9 +1.0 +1.0 +1.0
Webb Creek (cfs) +0 +0 +0 +0.3 +0.8 +1.0
Total Flow (cfs) 3.50 4.00 4.40 4.80 5.30 5.50
Also in 2014, the Tribe negotiated an addition 90 acre-feet of water to be supplied at their discretion in Sweetwater and Webb Creek to assist in juvenile rearing flows. Table 3 shows the total flows and timing required in Sweetwater and Webb Creek including the minimum flows, the additional incremental flows, and the negotiated 90 acre-feet flows for 2014.
Table 3. Total flows required in Sweetwater and Webb Creeks with the additional volume and mediated flows.
The proposed action states that Reclamation will monitor daily mean streamflows whenever the LOID is diverting water. Currently, 1-hour averages are posted for Sweetwater and Webb Creek onto Reclamation’s public Hydromet page. The 2010 Opinion describes the minimum flows as a mean daily average, with criteria that flows be adjusted when they fall more than 20 percent below the target as monitored on an hourly basis.
In past water years, Reclamation and LOID installed gate automation and water measurement equipment at the Sweetwater Diversion Dam and Webb Creek Diversion Dam to improve the ability to measure and maintain the target minimum streamflows. Although the gate automation equipment substantially improved the project’s ability to meet instream flow
2014 Annual Report – Lewiston Orchards 3

2. RPM 1: Flow Management
requirements, occasional operational problems occur with the mechanical and electrical equipment. Operation or technical limitations may occur when equipment malfunctions or debris catches at the structures or around the gates. Debris can physically prevent the gate from adjusting and/or cause inaccurate measurement due to backwatering near the gauging equipment that sends information to the gate controls.
2.1.2 Data Collection
The streamflow data are collected at 1-hour intervals below the weirs at Sweetwater and Webb Creek Diversion Dams. The automated data loggers record the bypass streamflow released over the compound weirs installed on the top of the diversion dams and the 4-foot weir located in the sluiceways. The data logger is located on the diversion dam. Reclamation posts data from these measurement points at http://www.pn.usbr.gov/hydromet.
All data collected during the irrigation season is provisional and could contain recording errors. The U.S. Geological Survey (USGS) and Reclamation reconcile the data at the end of irrigation season and post the data on the Hydromet at the end of the calendar year. The reconciled data is the official record.
2.2 Sweetwater Creek
2.2.1 Bypass Streamflow Results for Spring Spawning Period March 1 through May 31
It is important to note that the minimum flows are provided under the terms of the 2010 Opinion, which describes the minimum flows as a mean daily average, with criteria that flows be adjusted when they fall more than 20 percent below the target. This criteria recognizes that some fluctuations are expected while meeting the target minimum flows. As seen in Figure 1, there was a large spike in late March and mid-April due to high runoff. There were also some mechanical problems in mid-March where the flows were not recorded on Hydromet. Other flow fluctuations can be seen in Appendix A. This appendix notes the target bypass flow rates and the corresponding hourly rate in Sweetwater Creek. If the target flow was not reached in a particular hour, a short explanation of the missed target flow is noted.
2014 Annual Report – Lewiston Orchards 4

2. RPM 1: Flow Management
0
10
20
30
40
50
60
70
Mean Daily average into Sweetwater Cr.
Target Bypass Flow
Figure 1. Mean daily streamflow (cfs) measured past the Sweetwater Diversion Dam and bypass flow targets for the first half of the irrigation season (March 1 through May 31, 2014).
2.2.2 Bypass Streamflow Results for Juvenile Rearing Period June 1 through October 31
Minimum streamflows for juvenile rearing in Sweetwater Creek are 2.5 cfs. Additional juvenile rearing flows are made available based on combined reservoir volumes of Soldiers Meadows and Reservoir A as of June 1 (Table 2). On June 1, the combined storage of Soldiers Meadows and Reservoir A were greater than 4,250 acre-feet thus establishing an additional 1.0 cfs for juvenile rearing flows, in Sweetwater Creek between June 1 and September 15. From September 16 through the remaining irrigation season the average daily flow target was 2.5 cfs. The additional 90 acre-feet of water was released into Sweetwater Creek according to Tribal direction from June through September. The minimum flows, additional volume flows, and mediated flows for 2014 are summarized in Table 3. The combined flows resulted in minimum flow targets for June at 3.8 cfs; July through August at 4.0 cfs; September 1 through 15 at 3.8 cfs; September 16 through end-of-irrigation season at 2.5 cfs.
Figure 2 compares mean daily streamflow to the target bypass flow for juvenile rearing. Around September 18, 2014 there was a mechanical malfunction. LOID crews were dispatched to adjust the potentiometer and restore target flows into Sweetwater Creek. LOID crews were able to address the issue immediately. Surface water diversions from Sweetwater Creek Diversion Dam were turned off October 31, 2013.
2014 Annual Report – Lewiston Orchards 5

0
0.5
1
1.5
2
2.5
3
3.5
4
4.5
Mean Daily average into Sweetwater Cr.
Target Bypass Flow
Mechanical failure
small drop in flows, still within
20% of target flow
6/1/2014 7/1/2014 8/1/2014 9/1/2014 10/1/2014
2. RPM 1: Flow Management
Figure 2. Mean daily streamflow (cfs) measured past the Sweetwater Diversion Dam for the second half of the irrigation season (June 1 through October 31, 2014).
2.3 Webb Creek
2.3.1 Minimum Bypass Streamflow Requirements in Webb Creek
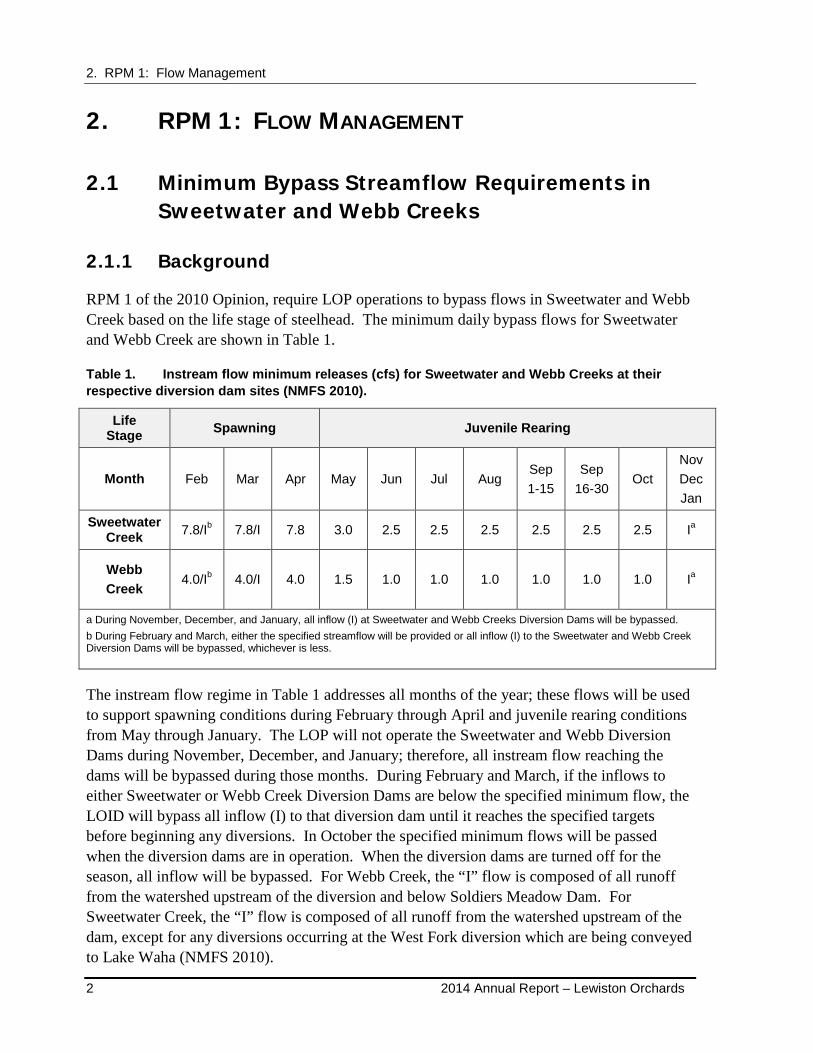
The Webb Creek diversion was operated from March 4, 2014, until October 31, 2014. Measured streamflows, in relation to the bypass flow targets, are shown in Figure 3.
2014 Annual Report – Lewiston Orchards 6
Mean Daily average into Webb Cr.
Malfunctioning Potentiometer. Faulty readings
70
60
50
40
30
20
10
0 3/1/2014 4/1/2014 5/1/2014 6/1/2014 7/1/2014 8/1/2014 9/1/2014 10/1/2014
Figure 3. Mean daily streamflow (cfs) measured past the Webb Creek Diversion Dam for the 2014 irrigation season.
2. RPM 1: Flow Management
Minimum flows plus the additional incremental flows resulted in minimum flow targets for 2014 of 4.0 cfs in February, March, and April; 1.5 cfs in May; 2.0 cfs June 1 through September 15, and 1.0 cfs the remaining irrigation season. No tribal negotiated flows were designated for Webb Creek in 2014.
Other flow fluctuations can be seen in Appendix A. This appendix notes the target bypass flow rates and the corresponding hourly rate in Webb Creek. If the target flow was not reached in a particular hour, a short explanation of the missed target flow is noted.
2.4 Ramping Rates
Ramping flows were incorporated into the proposed action and described in Reclamation’s Biological Assessment for the Operation of the Lewiston Orchards Project (Reclamation 2009, pages 4 through 11). Ramping will occur during the start of the irrigation period; the down-ramping from spawning flows to juvenile rearing flows on May 1; the end of the irrigation season; and any other time during the irrigation season for scheduled operation or maintenance purposes. The following ramping rates were identified to simulate natural conditions of the stream as much as possible. When the streamflow is high (>70 cfs), the maximum gate adjustment will take 10 cfs from the stream per day. When the streamflow is moderate (20 to
2014 Annual Report – Lewiston Orchards 7

2. RPM 1: Flow Management
70 cfs), the maximum gate adjustment will take 5 cfs from the stream per day. When the streamflow is <20 cfs, the maximum gate adjustment will take 1 cfs from the stream per day.
There is some confusion regarding ramping related to the daily fluctuations of streamflow in Sweetwater and Webb Creeks when gate changes are not being made at the facilities. Ramping is a requirement directly associated with gate changes (see excerpt from 2009 BA below). Other fluctuations in streamflow occur naturally from climatic and precipitation conditions and these fluctuations in streamflow would be natural hydrologic conditions in the stream.
Proposed Action (Reclamation 2009, pages 4 through 11)
“Ramping of stream flows is intended to make gradual changes during gate operations that avoid stranding fish in dewatered or pooled areas when stream flows are reduced (diversion gates opened) or flushing fish downstream when increasing stream flows (diversion gates closed). These gradual alterations instream flow are intended to allow fish that are rearing in the streams sufficient time to adjust to changes instream habitat. Stream flow ramping will be implemented at the Sweetwater and Webb diversion headgates during the following periods: initial opening of the headgates at the start of the irrigation season; down-ramping from spawning flows to juvenile rearing flows on May 1; during the end of the irrigation season when the headgates are closed; and any other time that the headgates are opened or closed during the irrigation season for operation or maintenance purposes.”
In 2014, there are instances where streamflows fluctuate but are not associated with gate changes, and therefore, are not subject to ramping criteria. Some instances occur naturally as the system fluctuates during spring runoff and hydrologic events; other instances are caused by mechanical failures and are noted in Appendix A.
2.5 Gravel Management Activities
Maintenance of the Sweetwater Creek Diversion Dam requires periodic removal of sediment that accumulates behind the dam, typically conducted every 4 to 6 years. Sediment was removed from the Sweetwater diversion dam pool during 2011 and was reported in the 2011 Annual Report (Reclamation 2012). Sediment removal activities were not conducted during 2012, 2013, or 2014.
2014 Annual Report – Lewiston Orchards 8
3. RPM 2: Connectivity Monitoring
3. RPM 2: CONNECTIVITY MONITORING
On July 14, 2010, Reclamation submitted its connectivity monitoring plan to NMFS as required by Term and Condition 2 of the 2010 Opinion (Reclamation 2010b). Measurements in Sweetwater Creek were discontinued after 2012 with no connectivity issues identified. To better understand channel connectivity conditions in Webb Creek, walk-through surveys were conducted in 2012 and 2013 on the lower 3.3 km of Webb Creek between the upper University of Idaho sampling site (UWU) and the mouth. The connectivity survey on Webb Creek was reported in Reclamation’s 2012 and 2013 Annual Reports submitted in the springs of 2013 and 2014, respectively. No additional connectivity monitoring was conducted in 2014.
4. RPM 3: STREAMFLOW MONITORING
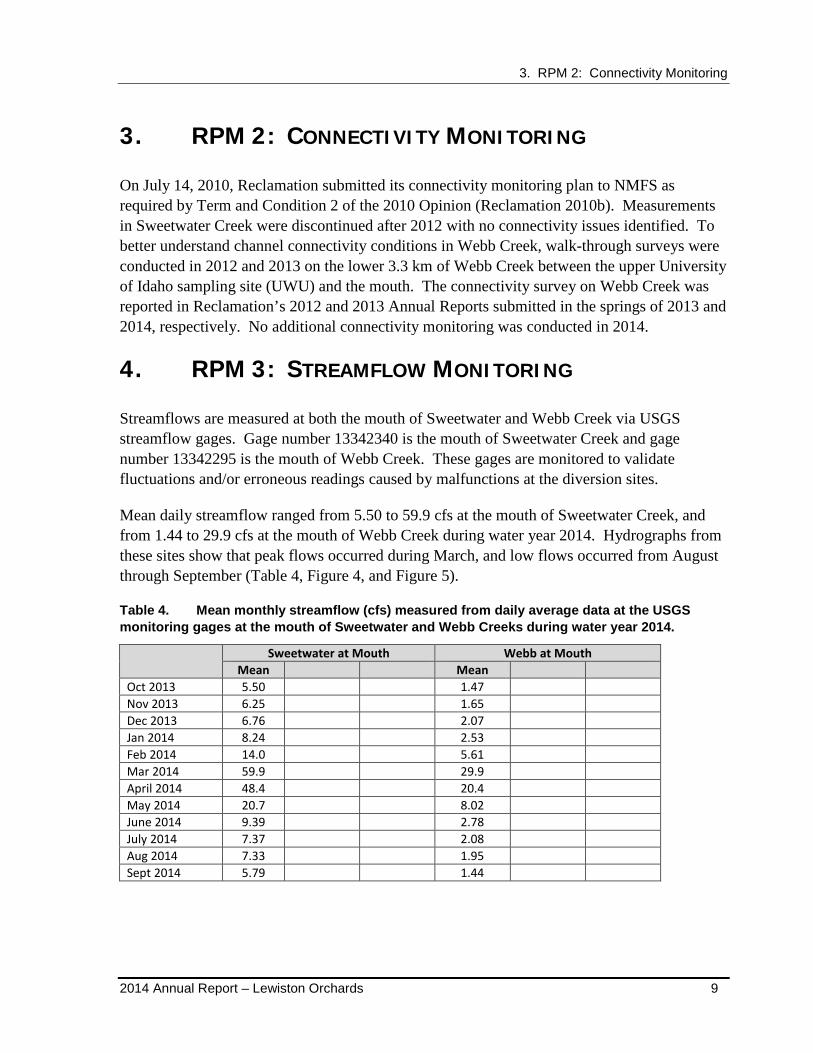
Streamflows are measured at both the mouth of Sweetwater and Webb Creek via USGS streamflow gages. Gage number 13342340 is the mouth of Sweetwater Creek and gage number 13342295 is the mouth of Webb Creek. These gages are monitored to validate fluctuations and/or erroneous readings caused by malfunctions at the diversion sites.
Mean daily streamflow ranged from 5.50 to 59.9 cfs at the mouth of Sweetwater Creek, and from 1.44 to 29.9 cfs at the mouth of Webb Creek during water year 2014. Hydrographs from these sites show that peak flows occurred during March, and low flows occurred from August through September (Table 4, Figure 4, and Figure 5).
Table 4. Mean monthly streamflow (cfs) measured from daily average data at the USGS monitoring gages at the mouth of Sweetwater and Webb Creeks during water year 2014.
Sweetwater at Mouth Webb at Mouth Mean Mean
Oct 2013 5.50 1.47 Nov 2013 6.25 1.65 Dec 2013 6.76 2.07 Jan 2014 8.24 2.53 Feb 2014 14.0 5.61 Mar 2014 59.9 29.9 April 2014 48.4 20.4 May 2014 20.7 8.02 June 2014 9.39 2.78 July 2014 7.37 2.08 Aug 2014 7.33 1.95 Sept 2014 5.79 1.44
2014 Annual Report – Lewiston Orchards 9

4. RPM 3: Streamflow Monitoring
Figure 4. Mean daily streamflows (cfs) measured near the mouth of Sweetwater Creek (USGS gage 13342340) during water year 2014.
Figure 5. Mean daily streamflow (cfs) measured near the mouth of Webb Creek (USGS gage 13342295) during water year 2014.
2014 Annual Report – Lewiston Orchards 10

5. RPM 4: Monitoring Critical Uncertainties
Both graphs show the large variability in streamflows, even when LOID is not operating the diversion structures. The spring runoff and corresponding peak occurs in early March followed by the descending arm of the hydrograph in May. Flows continue on a downward trend through October.
5. RPM 4: MONITORING CRITICAL UNCERTAINTIES
RPM 4 requires Reclamation to monitor listed steelhead in areas of the Lapwai Basin impacted by the project, and also requires Reclamation to address several critical uncertainties in relation to the project effects and the listed steelhead. As a result, Reclamation has collected information to address the critical uncertainties either directly, or through partnerships with the State of Idaho, the Tribe, and/or the UI.
Reclamation completed the monitoring plan for Steelhead Densities and Critical Uncertainties on January 27, 2011 (Reclamation 2011). This steelhead monitoring project was started under RPM 3 of the 2006 Opinion and continues as RPM 4 in the 2010 Opinion. The RPM required Reclamation to monitor steelhead densities in the action area and to answer critical uncertainties regarding the effects of the action.
Reclamation had a multi-year agreement (Agreement Number R12AC11005) with the University of Idaho to research and monitor the effects of streamflow on the growth and survival of juvenile steelhead and address several of the critical uncertainties identified in the Opinion. That agreement ends May 31, 2015. A new agreement (Agreement Number R14AC00042) with the UI, which goes through May 31, 2019, has been put in place to continue the steelhead density monitoring described in the monitoring plan for Steelhead Densities and Critical Uncertainties. The data collected during 2014 is summarized in an annual report (Appendix B; Kennedy et al. 2014). During these surveys, a total of 933 steelhead were captured during electroshocking. Total incidental mortality rate among all sites and visits during sampling season was 1.3 percent.
PIT tag reading stations are being used to record the movement of tagged individuals. All systems use multiple antenna arrays (2 or 3) to determine direction of movement and detection efficiency. During 2014, PIT tag interrogation stations were operating at Lapwai, Sweetwater, Mission, and Webb. The Webb Creek PIT station is the only site that experienced downtime during 2014. Webb Creek lost power on November 9, 2014, and it was restored on November 20, 2014. The other stations did not experience any considerable downtime in 2014.
5.1 O. mykiss Density Monitoring
Monitoring of juvenile O. mykiss densities in 2014 was scaled back as the objectives transition from monitoring critical uncertainties to long-term density monitoring. Due to low steelhead
2014 Annual Report – Lewiston Orchards 11
5. RPM 4: Monitoring Critical Uncertainties
abundance, poor access, inadequate reach representation, and other physical issues resulting in little or poor-quality data, monitoring was discontinued at two of the original six sites where sampling initiated in 2008. Reclamation and the University of Idaho exchanged these two original long-term density monitoring sites with two of the sites developed by the University in 2010. NMFS, UI, and Reclamation agreed on the six long-term monitoring sites that will be used until 2020 during a conference call on March 25, 2014.
Four of the original six sites remain, which include: ULU, UMU, UWM and LSX (Figure 6). The other two original sites, LLL and USM were replaced by sites that have been monitored by the University of Idaho since 2010. The LLL site experiences annual channel shifts due to spring high flows. This leads to shifts in steelhead densities that are linked more towards inter-annual changes in structural habitat conditions rather than temperature and flow conditions. Sampling at LLL is further complicated by the presence of spawning Coho in the fall. The USM site was inundated behind a beaver dam in spring of 2010. Portions of the pool above the beaver dam were filled in with gravel in the spring of 2011, further complicating the site and reducing the viability of this site for meaningful long-term monitoring. The beaver dam no longer exists; however, due to the extreme habitat changes that have occurred since the original sampling in 2008, the University of Idaho and Reclamation have determined this site will no longer provide relevant, statistically viable data for inclusion into the overall monitoring framework.
Reclamation replaced LLL and USM with MLX and USU, respectively. MLX is more stable from year to year than LLL and has a lower likelihood of being influenced by spawning Coho. USU is also more stable than USM and is more representative of the available habitat within Sweetwater Creek. Even though LLL and USM were part of the original six sampling sites, habitat modifications described above limit the number of years of data that would be comparable to future sampling. Long-term density monitoring at MLX and USU will provide more meaningful data with regards to the critical uncertainties identified in Term and Condition #4 and will provide statistically valid data, allowing for long-term trend analysis. The density monitoring from 2014 through 2020 includes three sites located in Webb and Sweetwater Creeks (USU, UWM, LSX) that are influenced by the LOP water operations and three sites (MLX, UMU, ULU) that are not influenced by the project.
2014 Annual Report – Lewiston Orchards 12

-------Lapwai Basin .
Lewiston Orchards Project
0 PIT Tag Interrogation Station
O Long Term Monitoring Sites
0 OS 1
5. RPM 4: Monitoring Critical Uncertainties
Figure 6. Map of the Lapwai Basin showing the six long-term monitoring sites.
2014 Annual Report – Lewiston Orchards 13

5. RPM 4: Monitoring Critical Uncertainties
Densities are based on abundance values estimated through 3-pass depletion instream reaches 100 m in length. Reach-scale area is calculated from several measurements of reach width made within the study area at each sampling event. Stream area generally decreases from July to September, though this change has little influence on density estimates compared to change in fish abundance. The total densities estimated during August for young of year (0+) combined with older fish (1+) are shown in Figure 7 for 2010 through 2014.
Figure 7. Total O. mykiss densities at 6 monitoring sites during August 2010 through 2014. Site codes are: LSX (lower Sweetwater), MLX (Lapwai below Mission), ULU (upper Lapwai), UMU (upper Mission), UWM (upper Webb), and USU (upper Sweetwater).
5.2 O. mykiss Adult Returns
In 2012, Reclamation entered into agreements with LOID and the Tribe to operate, maintain, and manage four PIT tag arrays in the Lapwai Basin to collect fish-movement data within the basin. The operation and maintenance of the four arrays provide tributary-scale data for populations in the Snake River evolutionarily significant units (ESUs); including the Lower Clearwater population. Data collected about escapement into this basin would be very informative in relation to the status of listed O. mykiss in the Snake River ESUs as well as the
2014 Annual Report – Lewiston Orchards 14

5. RPM 4: Monitoring Critical Uncertainties
role and potential of Lapwai Creek at the spawning aggregate, local population, and larger ESU-level scales.
The 2014 adult PIT tag detections at the four Lapwai Basin instream arrays are summarized in an annual report to Reclamation from the Nez Perce Tribe Department of Fisheries Resource Management (Appendix C).
5.3 Temperature Monitoring
5.3.1 Introduction
The year 2014 was the sixth year for temperature monitoring in the Sweetwater and Webb Creek Drainages of the Lapwai Watershed. Temperature monitoring will continue to track and develop the understanding of temperature shifts, or lack thereof, as a result of discharge changes in the watersheds. In the 5 years preceding, no discernable temperature trend could be established due to changes in operations. The most pronounced changes noted in these years were water year changes driven by climactic variables such as day time temperature or annual precipitation.
Temperature is a water quality factor integral to the life cycle of fish and other aquatic species. Different temperature regimes also result in different aquatic community compositions. Water temperature dictates whether a warm, cool, or coldwater aquatic community is present. The temperature of stream water usually varies on seasonal and daily time scales, and differs by location according to climate, elevation, extent of streamside vegetation, and the relative importance of groundwater inputs. Other factors affecting stream temperatures include solar radiation, cloud cover, evaporation, humidity, air temperature, wind, inflow of tributaries, and width-to-depth ratio. Anthropogenic factors include riparian zone alteration, channel alteration, and flow alteration.
Diurnal temperature fluctuations are common in small streams, especially if stream-side shade is lacking, due to day versus night changes in air temperature and absorption of solar radiation during the day. Aquatic species are restricted in distribution to a certain temperature range, and many respond more to the magnitude of temperature variation and amount of time spent at a particular temperature rather than an average value. Although species have adapted to cooler and warmer extremes of most natural waters, few cold water taxa are able to tolerate very high temperatures. Reduced oxygen solubility at high water temperatures can compound the stress on fish caused by marginal dissolved oxygen concentrations. Indirect effects of elevated stream temperatures could include: reduced growth and feeding, greater susceptibility to disease, increased metabolic costs, etc. However, most stream environments often have cold water refugia (such as areas with groundwater or spring inflows) that biota may utilize to reduce some of these effects.
2014 Annual Report – Lewiston Orchards 15

5. RPM 4: Monitoring Critical Uncertainties
Water quality criteria for temperature primarily focus on time of year and consider maximum temperature thresholds (either instantaneous or averaged) above which the water body is considered impaired. Alterations to the thermal regime of a water body may influence incubation time and growth rates of anadromous fish and other aquatic organisms in either a positive or negative manner. The Lewiston Orchards impoundments and diversions themselves do not act as heat sources, but rather they act to change the temperature regime within the drainages.
5.3.2 Monitoring
In 2008, Reclamation, as required by Term and Condition 4 of the 2010 Opinion, established 17 monitoring stations throughout the Sweetwater, Webb, and lower portions of Lapwai Creek drainages. Water temperature monitoring has been conducted at most of these locations since that time. An additional temperature logger was installed at the Webb Canal Hydromet station in spring of 2014.
The current water quality temperature monitoring in the LOP includes data loggers or Hydromet stations deployed at 13 of the monitoring locations to assess the changes in temperature that occur as water moves from the impoundments and springs in the headwaters to the lower reaches of Sweetwater Creek and into Lapwai Creek. In 2014, Reclamation had data loggers deployed at the following locations:
• Lapwai Creek (four loggers deployed) – downstream from the confluence of Sweetwater Creek, upstream from the confluence of Sweetwater Creek, near the confluence of Tom Beal Creek, and near mouth of Lapwai Creek
• Webb Creek (four loggers deployed, one Hydromet location) – Soldiers Meadows outflow (logger and Hydromet), Webb Creek Diversion pool, near Webb Creek mouth, and the Webb Creek Canal Hydromet station (logger, Hydromet only collects flow).
• Lower Sweetwater Creek (three loggers deployed) – upstream from confluence of Webb Creek, downstream from confluence of Webb Creek, near Sweetwater Creek mouth
• Upper Sweetwater Creek (three loggers deployed) – East Fork Sweetwater Creek, West Fork Sweetwater Creek, and below the Sweetwater Creek Diversion Dam
The data loggers collect water temperature (degrees Celsius) data every 15 to 60 minutes. Reclamation or LOID staff downloads the data from the monitoring loggers every few months. Occasionally loggers are lost, dewatered or buried due to flow events, channel re-configuration, or vandalism. Periodic downloads minimizes data lost due to these events. The data loggers used by Reclamation arrive from the factory pre-calibrated.
2014 Annual Report – Lewiston Orchards 16

5. RPM 4: Monitoring Critical Uncertainties
5.3.2.1 Data Summary
This document summarizes stream temperatures at the Reclamation-maintained locations throughout the three watersheds from January through December of 2014. Missing dates are noted for each location. Summary statistics for the available site data are presented below.
Webb Creek
Reclamation collected temperature data from the Webb Creek system at four locations.
The first of these was just below the outfall from Soldiers Meadows Reservoir (Figure 8). Hydromet collects temperature data at 15-minute intervals at this location. Data is available year round at this location. In the available data set Webb Creek never exceeds 19°C daily average nor does it exceed the 22°C instantaneous maximum water quality criteria. In comparison with the Environmental Protection Agency (EPA) suggested temperature guidance of 16°C Seven Day Average Daily Maximum (7DADM), the outflow from the reservoir approaches 16°C on August 12, and remains elevated through to September 4. The maximum 7DADM (17.52°C) was reached on August 22. This maximum is consistent with data collected throughout the study and seems to be representative of the reservoir discharge.
Figure 8. Maximum daily stream temperature (oC) and mean daily flow (cfs) measured near the outflow from Soldiers Meadows Reservoir during 2014.
2014 Annual Report – Lewiston Orchards 17

5. RPM 4: Monitoring Critical Uncertainties
Daily average temperature variations during reservoir operations portion of the data set (June, July, August, and September) show daily variation was below 1°C (Figure 9). This is likely due to the modulating effect from the reservoir discharge, and likely corresponded to the temperature of the hypolimnion of the reservoir.
Figure 9. Daily stream temperature variation (oC) measured near the outflow from Soldiers Meadows Reservoir (daily maximum – daily minimum).
The second Reclamation data collection location was from the pool above the Webb Creek diversion. Throughout the data collection period, daily maximum temperatures never rose above 22°C, and daily average temperatures remained below 19°C. The warming effect of reservoir seepage during the winter period has dissipated by the time the water reaches the Webb Creek pool. This is clearly indicated by the daily maximum temperatures less than 1°C for much of the winter (Figure 10).
2014 Annual Report – Lewiston Orchards 18

5. RPM 4: Monitoring Critical Uncertainties
Figure 10. Mean and maximum daily stream temperature (oC) measured upstream from the Webb Creek Diversion.
Daily variation upstream from the Webb Creek diversion, during reservoir operations (July, August, and September), averaged 3.23°C. Seasonally daily temperature variation decreases through the summer to winter and falls below 1°C by early November of each year (Figure 11).
Figure 11. Daily stream temperature variation (oC) measured upstream from the Webb Creek Diversion.
2014 Annual Report – Lewiston Orchards 19

5. RPM 4: Monitoring Critical Uncertainties
Reclamation collected data at a third location on Webb Creek at the mouth of the system (Figure 12). Seasonally, the Webb Creek system at the mouth reaches wintertime minimums in late February, and is often less than 0.1°C. The system gradually warms through the spring to early summer with a summer time average temperature of approximately 17.4°C. Summertime maximum temperatures average 19.96°C and reach the warmest temperature of approximately 22 to 27°C near the end of August. However, in 2014, summer maximums occurred on and around July 15. Daily average temperature exceeds 22°C for 20 days from July 3 through August 12. Also observed in this data set, temperatures at the mouth are warmer in comparison with the temperatures from the pool above the Webb Creek diversion. The Webb Creek mouth site was approximately 3°C warmer than the Webb Creek diversion site.
Figure 12. Maximum daily stream temperature (oC) measured near the mouth of Webb Creek and at the Webb Creek Diversion pool.
In addition, daily average variation at the Webb Mouth site was very high (Figure 13). Daily average temperature variation ranged from near 1°C in the winter up to nearly 8°C in July. This data also illustrate the annual difference between years. From the data set it appears that 2010 and 2013 were much warmer than the remainder of the years. These high daily variations are very indicative of thermal loading from atmospheric sources.
2014 Annual Report – Lewiston Orchards 20

5. RPM 4: Monitoring Critical Uncertainties
Figure 13. Minimum – maximum daily stream temperature variation (oC) measured near the mouth of Webb Creek.
Beginning in June of 2014 Reclamation began collecting water temperature at the Hydromet location on the Webb Creek canal. Water temperature does not change noticeably between the diversion temperature monitoring and the canal monitoring location. On average the canal is only 0.17°C warmer than the temperatures measured at the diversion.
5.3.2.2 Sweetwater Creek
Reclamation collected temperature data in seven locations in the Sweetwater Creek system.
The first data collection location in the Sweetwater drainage is in the headwaters at the mouth of the West Fork Sweetwater Creek (Figure 14). This location contains a partial data set for 2014. Data collection began June 13 and ended November 19, 2014. Typically, the West Fork has winter maximums ranging from 1 to 8°C trending upward through the spring to warm summer maximums averaging near 14°C (Figure 15). During 2014, maximum stream temperatures peaked at 19.17°C in July. This site did not exceed state water quality standards for cold-water aquatic life.
2014 Annual Report – Lewiston Orchards 21

5. RPM 4: Monitoring Critical Uncertainties
Figure 14. Mean and maximum daily stream temperature (oC) measured near the mouth of the West Fork of Sweetwater Creek.
Figure 15. Daily stream temperature variation (oC) measured near the mouth of the West Fork of Sweetwater Creek.
2014 Annual Report – Lewiston Orchards 22

5. RPM 4: Monitoring Critical Uncertainties
In the East Fork of Sweetwater Creek (East Fork), the other tributary stream, the only data gap is from a logger that was lost during 2011 high flows and was replaced in July of that year. Summer maximum temperatures normally occur in August. The stream has warmed slightly over the past 2 years of data collection similar to what has been shown in the West Fork data set.
The East Fork exhibits cold winter maximums averaging less than 1 to 2°C trending upward through the spring to warm summer maximums near 22°C (Figure 16). In some cases, flows diminish to the point the logger records ambient air temperatures. Daily temperature variation during the summer averaged approximately 4°C. This site also rarely exceeds state water quality standards for cold-water aquatic life when the system carries sufficient flow to record temperature. The peak daily maximum temperature in 2014 was 20.75°C.
Figure 16. Mean and maximum daily stream temperature (oC) measured near the mouth of the East Fork of Sweetwater Creek.
The East Fork exhibits a slightly different temperature regime in comparison with the West Fork. It is slightly warmer in the summer and much cooler during the winter (Figure 17). Some of these differences can be explained by the operation of the Lake Waha pumps, which cools the West Fork during the late summer. In addition, the East Fork carries water delivered from the Webb Creek system during reservoir operations. The influence of the 21 Ranch Springs (Big Springs) a natural spring system that is linked to Lake Waha, may also explain some of the seasonal difference between the West Fork and East Forks. Spring-fed systems are warmer during the winter due to the relatively constant temperature discharged. The East Fork is also a smaller system than the West Fork, which can result in lower wintertime
2014 Annual Report – Lewiston Orchards 23
5. RPM 4: Monitoring Critical Uncertainties
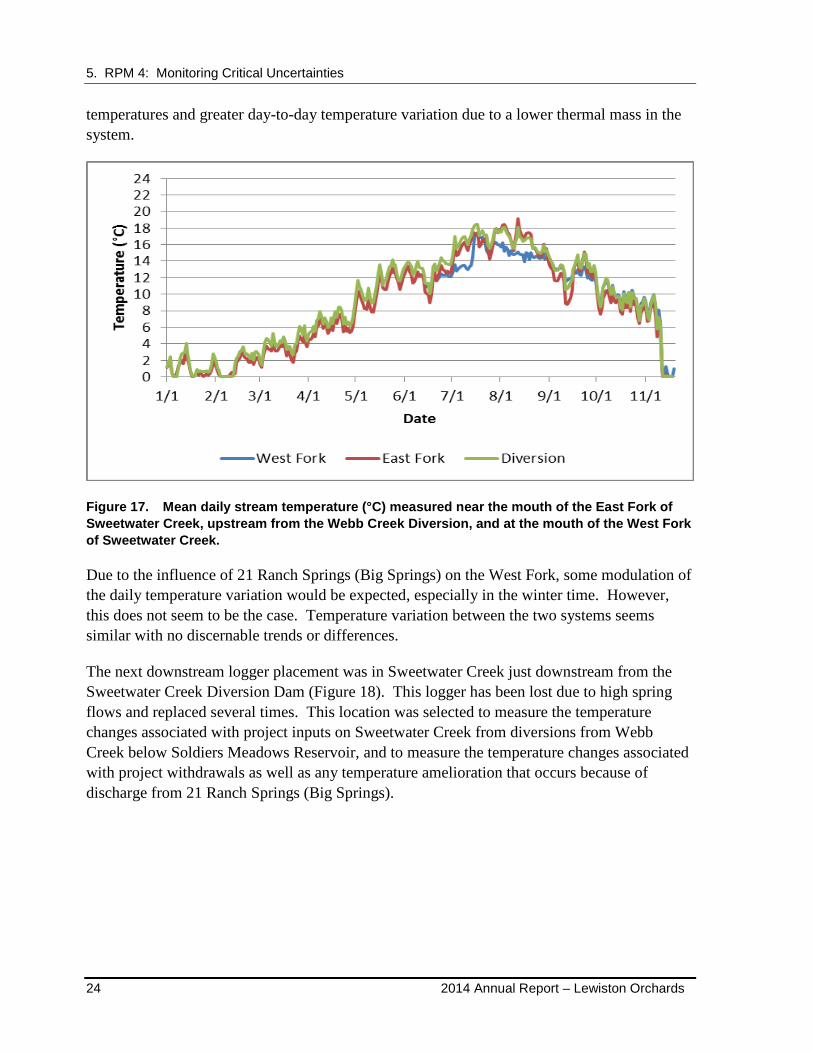
temperatures and greater day-to-day temperature variation due to a lower thermal mass in the system.
Figure 17. Mean daily stream temperature (°C) measured near the mouth of the East Fork of Sweetwater Creek, upstream from the Webb Creek Diversion, and at the mouth of the West Fork of Sweetwater Creek.
Due to the influence of 21 Ranch Springs (Big Springs) on the West Fork, some modulation of the daily temperature variation would be expected, especially in the winter time. However, this does not seem to be the case. Temperature variation between the two systems seems similar with no discernable trends or differences.
The next downstream logger placement was in Sweetwater Creek just downstream from the Sweetwater Creek Diversion Dam (Figure 18). This logger has been lost due to high spring flows and replaced several times. This location was selected to measure the temperature changes associated with project inputs on Sweetwater Creek from diversions from Webb Creek below Soldiers Meadows Reservoir, and to measure the temperature changes associated with project withdrawals as well as any temperature amelioration that occurs because of discharge from 21 Ranch Springs (Big Springs).
2014 Annual Report – Lewiston Orchards 24

5. RPM 4: Monitoring Critical Uncertainties
Figure 18. Mean and maximum daily stream temperature (oC) measured near the Sweetwater Creek Diversion.
This location is situated below 21 Ranch Springs (Big Springs), which is linked to Lake Waha. As the Lake Waha Reservoir is typically in storage mode during the winter and no diversion into Sweetwater is occurring, there is a slight warming occurring in the winter that is likely to be the result of Big Springs’ temperature amelioration. The year 2014 appears to be cooler than the proceeding years, with no periods of temperatures exceeding state water quality standards for daily average or daily maximum in 2014.
Summer time maximum temperatures near the Sweetwater Creek Diversion average 19.55, 18.57, and 15.13°C in July, August, and September, respectively. This maximum temperature is slightly warmer than the upstream reaches.
The next data logger on Sweetwater Creek system is upstream from the confluence with Webb Creek (Figure 19). In past years, this logger has recorded some of the highest temps in the whole Sweetwater Creek basin, as reported in Reclamation’s 2009 BA for the LOP. These high temperatures are likely due to lack of shade, channel alteration and water withdrawals. Inflows downstream of this point help to improve (or offset) some high temperatures.
2014 Annual Report – Lewiston Orchards 25

5. RPM 4: Monitoring Critical Uncertainties
The warmest of the data set was in 2013. Stream temperatures exceeded 24°C in early July. The stream at this location was above the state water quality standards for 8 days each in 2013 and 2012, but for only 2 days in 2014.
Figure 19. Mean and maximum daily stream temperature (oC) measured upstream from the Webb Creek confluence with Sweetwater Creek.
It appears that there is some heat gain occurring between these two sites. Heat gain in August and September, from the upper location to the lower location averages approximately 1.27°C, while in November through February; there is an average change of approximately 0.28°C from the upstream location to the downstream location (Figure 20).
2014 Annual Report – Lewiston Orchards 26

5. RPM 4: Monitoring Critical Uncertainties
Figure 20. Mean daily stream temperature (°C) measured upstream from the Webb Creek confluence with Sweetwater Creek compared to mean daily temperatures just downstream of the Sweetwater Creek Diversion.
The third logger location on the mainstem Sweetwater Creek system was just below the confluence with Webb Creek (Figure 21). The data from this location provides an understanding of how Sweetwater Creek thermal regime is changed by the addition of Webb Creek water.
Figure 21. Mean and maximum daily stream temperature (°C) measured downstream from the Webb Creek confluence with Sweetwater Creek.
2014 Annual Report – Lewiston Orchards 27

5. RPM 4: Monitoring Critical Uncertainties
Some heat gain occurs between these two sites. Heat gain is more pronounced in the summer, from the upper location to the lower location, and average approximately 1°C. While in November through February, the downstream location average 0.5°C warmer than the upstream location. This slight warming is likely due to the effect of the smaller warmer tributary, Webb Creek, entering the Sweetwater system.
In recent years this difference has become statistically significant. An analysis of variance indicates that the variance between the two locations is significantly different (p ≈0.0004), while the slope and intercept of the regression analysis (as shown in Figure 22) remain nearly 1 and 0, respectively. The average annual temperature downstream from Webb Creek is 10.09°C, while the average annual temperature from the upstream location is 9.92°C.
Figure 22. Correlation of mean daily stream temperature (°C) measured upstream and downstream from the Webb Creek confluence with Sweetwater Creek.
The final logger location on the mainstem Sweetwater Creek system was at the mouth of Sweetwater Creek before it meets with Lapwai Creek (Figure 23). The data from this location provides an understanding of how Sweetwater Creek thermal regime is changed by the addition of Webb Creek water, and shows the potential differences between the Sweetwater system and the Lapwai system. Data for 2014 was collected from January 1 through June 10. The logger was not able to be downloaded in the field and is being sent back to the manufacturer to attempt to download there.
2014 Annual Report – Lewiston Orchards 28
5. RPM 4: Monitoring Critical Uncertainties
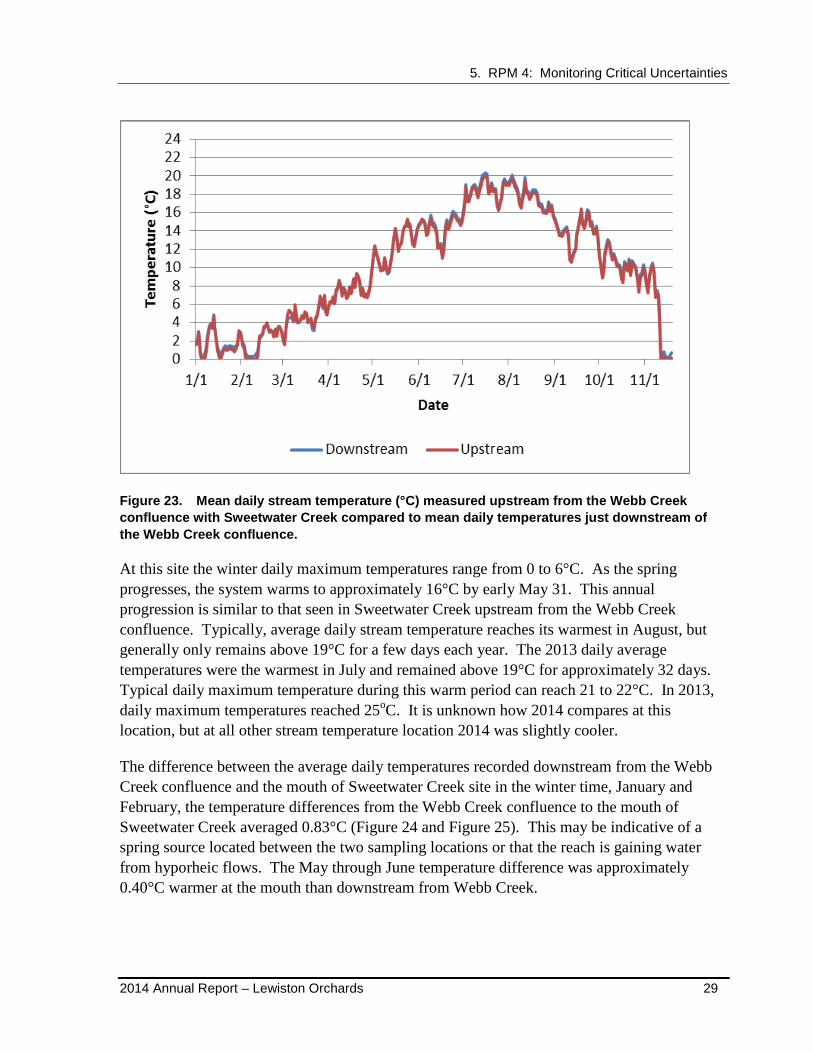
Figure 23. Mean daily stream temperature (°C) measured upstream from the Webb Creek confluence with Sweetwater Creek compared to mean daily temperatures just downstream of the Webb Creek confluence.
At this site the winter daily maximum temperatures range from 0 to 6°C. As the spring progresses, the system warms to approximately 16°C by early May 31. This annual progression is similar to that seen in Sweetwater Creek upstream from the Webb Creek confluence. Typically, average daily stream temperature reaches its warmest in August, but generally only remains above 19°C for a few days each year. The 2013 daily average temperatures were the warmest in July and remained above 19°C for approximately 32 days. Typical daily maximum temperature during this warm period can reach 21 to 22°C. In 2013, daily maximum temperatures reached 25oC. It is unknown how 2014 compares at this location, but at all other stream temperature location 2014 was slightly cooler.
The difference between the average daily temperatures recorded downstream from the Webb Creek confluence and the mouth of Sweetwater Creek site in the winter time, January and February, the temperature differences from the Webb Creek confluence to the mouth of Sweetwater Creek averaged 0.83°C (Figure 24 and Figure 25). This may be indicative of a spring source located between the two sampling locations or that the reach is gaining water from hyporheic flows. The May through June temperature difference was approximately 0.40°C warmer at the mouth than downstream from Webb Creek.
2014 Annual Report – Lewiston Orchards 29

5. RPM 4: Monitoring Critical Uncertainties
Figure 24. Mean and maximum daily stream temperature (oC) measured near the Sweetwater Creek mouth.
Figure 25. Mean daily stream temperature (°C) measured upstream from the Webb Creek confluence with Sweetwater Creek compared to mean daily temperatures measured near the mouth of Sweetwater Creek.
2014 Annual Report – Lewiston Orchards 30

5. RPM 4: Monitoring Critical Uncertainties
In previous years, the summer time difference between the daily maximum temperatures recorded at the Sweetwater Creek Mouth location and the Webb Creek mouth location averaged -1.09 °C, indicating that Sweetwater Creek was much cooler than Webb Creek (Figure 26). The wintertime difference between the two systems is very small (-0.006°C). Both metrics indicate that on average Sweetwater Creek is cooler than Webb Creek. The difference between the two systems in the summer is the result of increased solar loading coupled with the water transfers between watersheds and the cooling effects of Big Springs. Additionally, it appears that all monitoring locations are responding with similar between-day temperature changes as seen in the temperature peaks in July. These changes are of similar magnitude at all Sweetwater Creek locations. This gives a clear indication that the locations are responding to solar loading similarly and that groundwater and other factors such as shade are similar between the monitoring locations in the two watersheds.
Figure 26. Daily maximum stream temperature (oC) measured near the mouth of Webb Creek compared to daily maximum temperatures measured near the mouth of Sweetwater Creek.
Lapw ai Creek
Reclamation also collected temperature data at four locations in Lapwai Creek. The first of these was just above the Sweetwater Creek confluence (Figure 27 and Figure 28). Typically, this segment begins to warm steadily throughout the late winter and reaches the warmest period in early August. In this data set Lapwai Creek above Sweetwater Creek often exceeds the State of Idaho water quality standard 19°C daily average, and can exceed 22°C instantaneous maximum standard for several weeks each year. Daily variation during this period was also very high and averaged approximately 4.00°C in 2014. This high daily
2014 Annual Report – Lewiston Orchards 31

5. RPM 4: Monitoring Critical Uncertainties
variation is likely due to a general lack of shade throughout the upper reaches of Lapwai Creek, and is similar to the high variation seen in Webb Creek that is likely due to low shade coupled with low flow volume in that system. In comparison with the temperature regime seen in Sweetwater Creek, this Lapwai site is approximately 1.37°C warmer on average. This relationship is consistent through the period of record. The high correlation between the two temperature data sets indicates that water temperatures in the two streams are likely influenced by similar environmental variables.
Figure 27. Mean and maximum daily stream temperature (°C) of Lapwai Creek measured upstream from the Sweetwater Creek Lapwai Creek Confluence.
2014 Annual Report – Lewiston Orchards 32

5. RPM 4: Monitoring Critical Uncertainties
Figure 28. Maximum daily stream temperature (°C) relationship between Lapwai Creek and the maximum daily stream temperature of Sweetwater Creek mouth during 2009 to 2014.
The second Reclamation data collection location on Lapwai Creek was downstream from the Sweetwater Creek confluence, which allows for comparison with the effects from Sweetwater Creek (Figure 29). In this data set, Lapwai Creek below Sweetwater Creek exceeds 19°C daily average and the 22°C instantaneous maximum for several days each year. In 2014, the downstream location was 0.92°C cooler on average than the upstream location. The following graphs show the slow increase in temperatures from downstream from the confluence of Sweetwater Creek to the mouth of Lapwai Creek (Figure 29 through 33).
2014 Annual Report – Lewiston Orchards 33
5. RPM 4: Monitoring Critical Uncertainties
Figure 29. Mean and maximum daily stream temperature (°C) of Lapwai Creek measured downstream from the Sweetwater Creek Lapwai Creek.
Figure 30. Mean daily stream temperature (°C) of Lapwai Creek measured upstream and downstream from the Sweetwater Creek Lapwai Creek confluence.
2014 Annual Report – Lewiston Orchards 34

5. RPM 4: Monitoring Critical Uncertainties
Figure 31. Mean daily stream temperature (°C) of Lapwai Creek measured downstream from the Sweetwater Creek Lapwai Creek confluence and near the Tom Beal Creek confluence.
Figure 32. Mean daily stream temperature (°C) of Lapwai Creek measured near the Tom Beal Creek confluence and the mouth of Lapwai Creek.
2014 Annual Report – Lewiston Orchards 35

6. RPM 5: Optimal Streamflow Allocation
Figure 33. Mean daily stream temperature (°C) of Lapwai Creek measured downstream from the Sweetwater Creek Lapwai Creek confluence and the mouth of Lapwai Creek.
6. RPM 5: OPTIMAL STREAMFLOW ALLOCATION
Reclamation’s proposed action and streamflow allocations are based on the best available scientific data and were developed cooperatively with NMFS and the Tribe. Term and Condition 5 of the 2010 Opinion requires Reclamation to submit a completed study and report to NMFS by April 15, 2014, related to optimizing streamflow allocations between Webb and Sweetwater Creeks. On April 11, 2014, Reclamation submitted a request to NMFS requesting a 1-year extension in this requirement. Reclamation is reaching the end of a multi-year agreement with the University of Idaho to collect habitat, density, and movement information within the Lapwai Creek system. At the request of the UI, due dates for the final reports from the University were extended to May 30, 2014. This information is currently being utilized to prepare the final flow recommendation report to NMFS. Since the extension date of the final reports is past the original flow allocation due date, Reclamation requested the extension to provide Reclamation operations and biologist staff time to review the final University of Idaho reports, final data, and Reclamation operational data to identify an optimal flow allocation operation. The monitoring and research of these identified critical uncertainties will be used to assess the proposed bypass streamflows on the growth and survival of listed steelhead relative to other areas in the Lapwai Basin. Reclamation’s Flow Allocation report is currently in draft form and is expected to be submitted to NMFS shortly after this report.
2014 Annual Report – Lewiston Orchards 36

7. Literature Cited
7. LITERATURE CITED
Parenthetical Reference Bibliographic Citation
Kennedy et al. 2014 Kennedy, B.P., K.M. Myrvold, R. Hartson, and E. Benson. 2014. Lewiston Orchards Project: Sweetwater Basin flow fish study. Progress report prepared by the University of Idaho, Moscow, Idaho. Submitted to the Bureau of Reclamation, Snake River Area Office, Boise, Idaho.
NMFS 2010 NMFS 2010 National Marine Fisheries Service. 2010. Endangered Species Act Section 7 Formal Consultation 2010 Opinion and Magnusen-Stevens Fishery Conservation and Management Act Essential Fish Habitat Consultation for the Operation and Maintenance of the Lewiston Orchard Project. NMFS Consultation number 2009/06062. Submitted to the U.S. Bureau of Reclamation, Boise, Idaho.
Reclamation 2009 U.S. Bureau of Reclamation. 2009. Biological Assessment for Operation of the Lewiston Orchards Project, Idaho. Snake River Area Office. Boise, Idaho. October.
Reclamation 2010a U.S. Bureau of Reclamation. 2010a. Lewiston Orchard Project 2009 Annual Report for activities under the Endangered Species Act 2010 Opinion. Submitted to the National Marine Fisheries Service, Boise, Idaho.
Reclamation 2010b U.S. Bureau of Reclamation. 2010b. Lewiston Orchards Project Connectivity Monitoring Plan. Submitted to the National Marine Fisheries Service, Boise, Idaho.
Reclamation 2011 U.S. Bureau of Reclamation. 2011. Monitoring Plan for Steelhead Densities and Critical Uncertainties for the Lewiston Orchards Project 2010 Opinion. Submitted to the National Marine Fisheries Service, Boise, Idaho.
Reclamation 2012 U.S. Bureau of Reclamation. 2012. 2011 Annual Report on Monitoring and Implementation Activities Associated with the USFWS 2005 Biological Opinion for Operation and Maintenance of the Bureau of Reclamation Lewiston Orchards Project. Snake River Area Office, Boise, Idaho.
2014 Annual Report – Lewiston Orchards 37

7. Literature Cited
2014 Annual Report – Lewiston Orchards 38

APPENDICES


APPENDIX A
SWEETWATER AND WEBB CREEK FLOW TABLES
(This is an excel data file for data sharing and is included as a CD at
the back of this report)


APPENDIX B
UNIVERSITY OF IDAHO 2014 REPORT
“THE ECOLOGY OF ONCORHYNCHUS MYKISS IN THE
LAPWAI BASIN: DENSITY AND GROWTH MONITORING


The ecology of Oncorhynchus mykiss in the Lapwai Basin: Density and growth monitoring
Continuation of the Lewiston Orchards Project: Sweetwater Basin Fish & Flow Study
Period of Study: July 1, 2014 – May 31, 2019
Progress report (July 2014 – December 2014) prepared for:
Bureau of Reclamation
USBR Snake River Area Office
Boise, Idaho
Prepared by:
Brian P. Kennedy
with
Emily Benson, project manager; Jeff Caisman, M.S. student; and Knut Marius Myrvold, post-doctoral researcher
Department of Fish and Wildlife Resources and Water Resources Graduate Program
College of Natural Resources
University of Idaho
Kennedy 2014 – Report
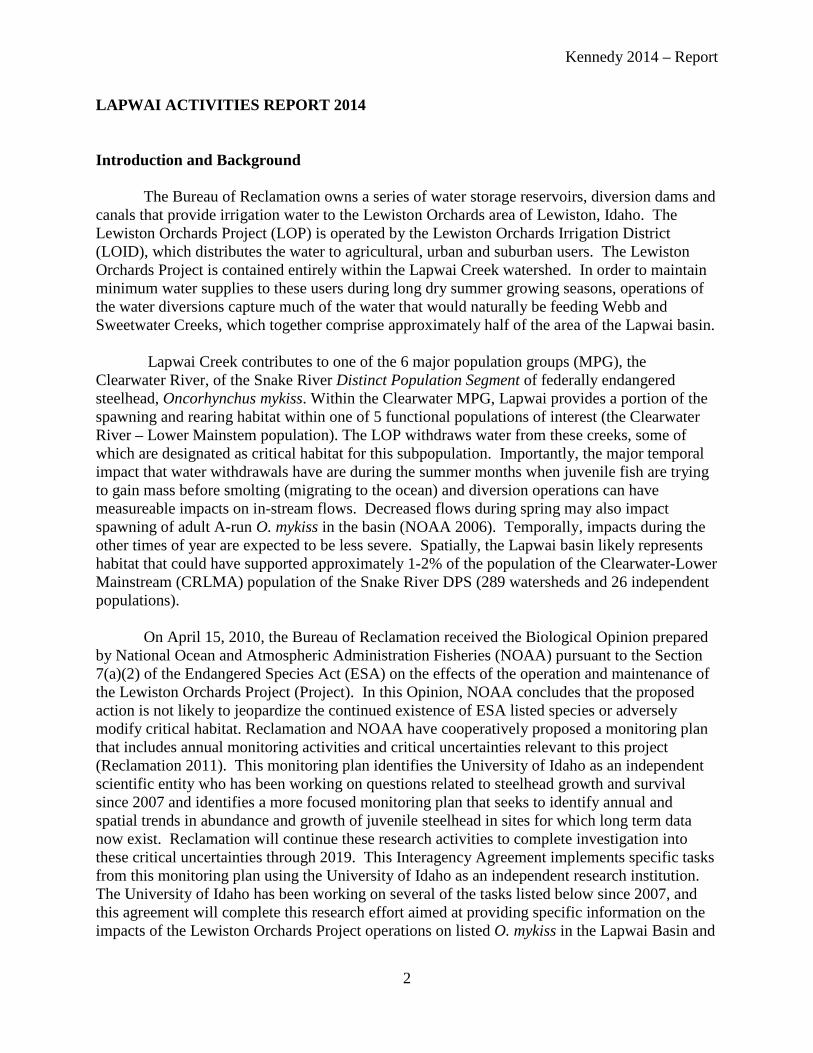
LAPWAI ACTIVITIES REPORT 2014
Introduction and Background
The Bureau of Reclamation owns a series of water storage reservoirs, diversion dams and canals that provide irrigation water to the Lewiston Orchards area of Lewiston, Idaho. The Lewiston Orchards Project (LOP) is operated by the Lewiston Orchards Irrigation District (LOID), which distributes the water to agricultural, urban and suburban users. The Lewiston Orchards Project is contained entirely within the Lapwai Creek watershed. In order to maintain minimum water supplies to these users during long dry summer growing seasons, operations of the water diversions capture much of the water that would naturally be feeding Webb and Sweetwater Creeks, which together comprise approximately half of the area of the Lapwai basin.
Lapwai Creek contributes to one of the 6 major population groups (MPG), the Clearwater River, of the Snake River Distinct Population Segment of federally endangered steelhead, Oncorhynchus mykiss. Within the Clearwater MPG, Lapwai provides a portion of the spawning and rearing habitat within one of 5 functional populations of interest (the Clearwater River – Lower Mainstem population). The LOP withdraws water from these creeks, some of which are designated as critical habitat for this subpopulation. Importantly, the major temporal impact that water withdrawals have are during the summer months when juvenile fish are trying to gain mass before smolting (migrating to the ocean) and diversion operations can have measureable impacts on in-stream flows. Decreased flows during spring may also impact spawning of adult A-run O. mykiss in the basin (NOAA 2006). Temporally, impacts during the other times of year are expected to be less severe. Spatially, the Lapwai basin likely represents habitat that could have supported approximately 1-2% of the population of the Clearwater-Lower Mainstream (CRLMA) population of the Snake River DPS (289 watersheds and 26 independent populations).
On April 15, 2010, the Bureau of Reclamation received the Biological Opinion prepared by National Ocean and Atmospheric Administration Fisheries (NOAA) pursuant to the Section 7(a)(2) of the Endangered Species Act (ESA) on the effects of the operation and maintenance of the Lewiston Orchards Project (Project). In this Opinion, NOAA concludes that the proposed action is not likely to jeopardize the continued existence of ESA listed species or adversely modify critical habitat. Reclamation and NOAA have cooperatively proposed a monitoring plan that includes annual monitoring activities and critical uncertainties relevant to this project (Reclamation 2011). This monitoring plan identifies the University of Idaho as an independent scientific entity who has been working on questions related to steelhead growth and survival since 2007 and identifies a more focused monitoring plan that seeks to identify annual and spatial trends in abundance and growth of juvenile steelhead in sites for which long term data now exist. Reclamation will continue these research activities to complete investigation into these critical uncertainties through 2019. This Interagency Agreement implements specific tasks from this monitoring plan using the University of Idaho as an independent research institution. The University of Idaho has been working on several of the tasks listed below since 2007, and this agreement will complete this research effort aimed at providing specific information on the impacts of the Lewiston Orchards Project operations on listed O. mykiss in the Lapwai Basin and
2

Kennedy 2014 – Report
understanding the status and role of the Lapwai Basin in relation to the Snake River ESU and Lower Clearwater Local Population.
Understanding the effects of hydrologic changes on fish populations requires an integrative approach that addresses 1) how the growth potential of individual fish is affected, 2) how changes in growth and growth potential influence survival of individuals and, ultimately, how processes for the individual scale up to population level dynamics, and 3) how population dynamics are influenced by altered connections among subpopulations. These changes can be a direct result of hydrologic change (Lopes et al. 2004) or an indirect effect through altered temperatures, productivity or trophic relationships (Almodovar and Nicola 1999, Horne et al. 2004, Hartson and Kennedy 2014, Myrvold and Kennedy 2014). Our monitoring efforts will continue to address how environmental conditions in the Lapwai system influence density, growth, and survival of juvenile O. mykiss and are designed to identify mechanistic relationships between fish performance and habitat. Herein, we report on the data collection and results from our seventh field season in the Lapwai basin.
Six of the possible 16 sites monitored in 2010 - 2013 were selected for continued abundance measurements of O. mykiss in 2014 - 2019 in order to quantify spatial and temporal variation among sites. The 16 original sites were intended to identify variables related to growth and production representing the elevation, geologic and ecological gradients across the Lapwai Basin. The six continued-monitoring sites were selected such that all sites provide enough production for a robust statistical design, and such that both impacted and “unimpacted” sites in the basin are represented. Unimpacted in this context is meant to simply refer to those sites that are not directly affected by BOR projects; impacts from land use, roads and other local disturbances are realized and documented.
As outlined in the monitoring plan for this project, beginning in 2014, the University of Idaho has begun (and will continue) ongoing research on the following tasks, in accordance with the timeline detailed in Table 1:
Task 1.1: Capture, PIT tag, and collect data on juvenile O. mykiss (i.e., length, weight, condition factor) at six established monitoring sites during the juvenile growing season (July September) 2014 - 2019.
Task 1.2: Cooperatively collect and edit stream temperature data with Reclamation, Snake River Area Office and LOID efforts.
Task 1.3: Use data collected in task 1.1 to compare observed juvenile O. mykiss densities across years sampled at six established monitoring sites from 2008 through 2013 (and more sites if available, i.e. between 2010 and 2013).
3
Kennedy 2014 – Report
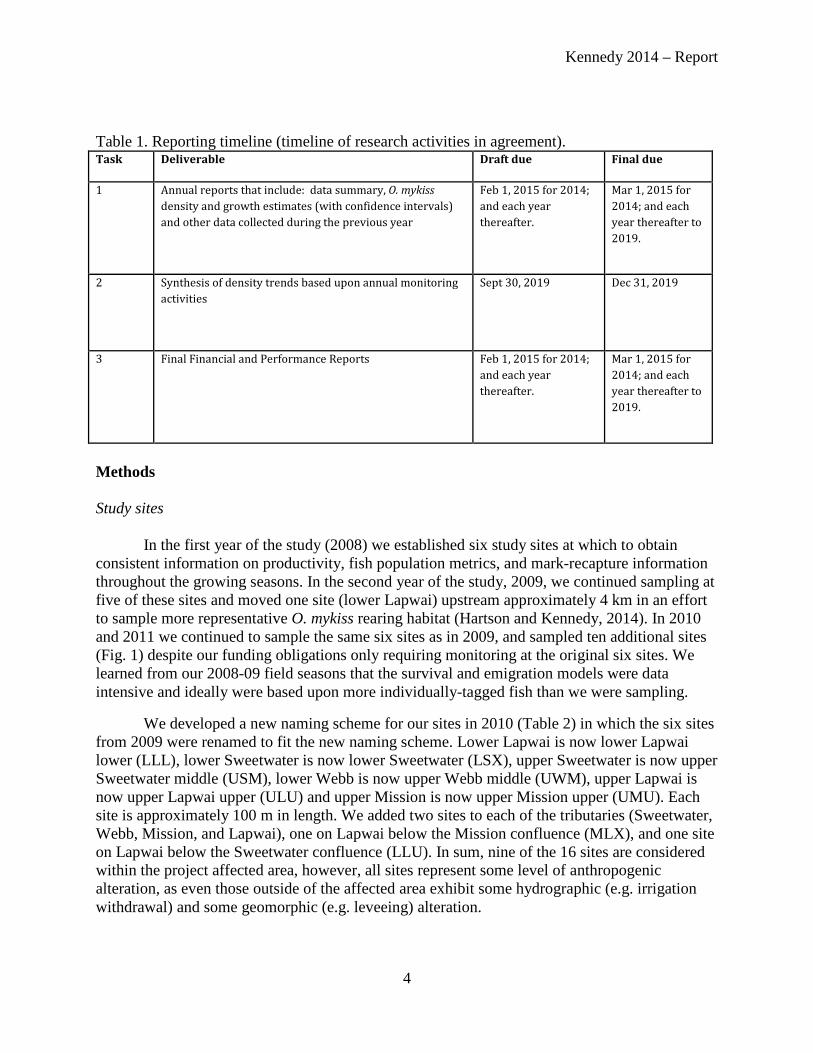
Table 1. Reporting timeline (timeline of research activities in agreement). Task Deliverable Draft due Final due
1 Annual reports that include: data summary, O. mykiss density and growth estimates (with confidence intervals)and other data collected during the previous year
Feb 1, 2015 for 2014; and each yearthereafter.
Mar 1, 2015 for 2014; and each year thereafter to2019.
2 Synthesis of density trends based upon annual monitoring activities
Sept 30, 2019 Dec 31, 2019
3 Final Financial and Performance Reports Feb 1, 2015 for 2014; and each yearthereafter.
Mar 1, 2015 for 2014; and each year thereafter to2019.
Methods
Study sites
In the first year of the study (2008) we established six study sites at which to obtain consistent information on productivity, fish population metrics, and mark-recapture information throughout the growing seasons. In the second year of the study, 2009, we continued sampling at five of these sites and moved one site (lower Lapwai) upstream approximately 4 km in an effort to sample more representative O. mykiss rearing habitat (Hartson and Kennedy, 2014). In 2010 and 2011 we continued to sample the same six sites as in 2009, and sampled ten additional sites (Fig. 1) despite our funding obligations only requiring monitoring at the original six sites. We learned from our 2008-09 field seasons that the survival and emigration models were data intensive and ideally were based upon more individually-tagged fish than we were sampling.
We developed a new naming scheme for our sites in 2010 (Table 2) in which the six sites from 2009 were renamed to fit the new naming scheme. Lower Lapwai is now lower Lapwai lower (LLL), lower Sweetwater is now lower Sweetwater (LSX), upper Sweetwater is now upper Sweetwater middle (USM), lower Webb is now upper Webb middle (UWM), upper Lapwai is now upper Lapwai upper (ULU) and upper Mission is now upper Mission upper (UMU). Each site is approximately 100 m in length. We added two sites to each of the tributaries (Sweetwater, Webb, Mission, and Lapwai), one on Lapwai below the Mission confluence (MLX), and one site on Lapwai below the Sweetwater confluence (LLU). In sum, nine of the 16 sites are considered within the project affected area, however, all sites represent some level of anthropogenic alteration, as even those outside of the affected area exhibit some hydrographic (e.g. irrigation withdrawal) and some geomorphic (e.g. leveeing) alteration.
4

Kennedy 2014 – Report
In 2012 and 2013 we scaled back our sampling efforts in response to reduced field support. We sampled nine of the 16 sites that were sampled in 2010 and 2011; five are considered within the project affected area (LLU, LSX, USM, USU, and UWM), while four are not within the project affected area (MLX, ULU, UMM, and UMU). The nine sites we sampled spanned the environmental conditions in the basin, and the temporal detail was similar to previous years.
As the density and growth monitoring phase of the project began in 2014, we scaled back our sampling efforts to focus on six of the 16 sites that were sampled in 2010 and 2011: LSX, USU, UWM, MLX, ULU, and UMU (Table 2; Fig. 1). Sites were sampled three times over the field season. These six sites reflect the variety of environmental conditions within the basin, represent all four main tributaries, and four of them have been sampled consistently since the beginning of our fieldwork in the Lapwai basin in 2008. Half of the sites fall within the project affected area (LSX, USU, and UWM); the other half do not (MLX, ULU, and UMU).
Study design
We visited each site once every five weeks between late July and early October 2014, resulting in three visits to each site despite our funding obligations only requiring two monitoring visits at each site; three visits allowed us to estimate growth rates over two periods. The dates for the visits are shown in Table 2. At each visit we collected data on: 1) the fish community and individual steelhead in particular, 2) the energy resources in the streams, and 3) a suite of physical environment factors.
Benthic invertebrate samples were collected using a Surber sampler (250 um mesh) at the six sites on the first and last visits of the field season (dates shown in Table 2) as a measure of energy resources available in the streams. Due to the time consuming nature of processing invertebrate samples, we have not yet processed or analyzed the benthic samples from 2014.
In order to estimate habitat availability for juvenile O. mykiss, we measured physical habitat variables at each site during summer base flows (July 23-30), the period when impacts of water withdrawal were expected to be greatest. We established transects perpendicular to the channel five meters apart throughout the entire electrofishing reach, with the first transect 2.5 m above the lower end of the reach. We quantitatively measured wetted channel width and counted the number of large woody debris pieces (LWD; debris > 100 mm diameter and 1 m long) within 30 cm of each transect. Each transect was then split into five sections of equal width. We measured velocity using a Marsh McBirney flow meter (cm sec-1), depth (using a wading rod), substrate size (D50), and visually estimated whether there was overhanging cover with live vegetation 2 m or less above the water surface, or undercut banks in each of the five sections of each transect.
Fish were captured during three-pass depletion electrofishing surveys (described below); non-salmonids were identified to species (except for sculpin, which were identified to family), counted, and batch-weighed in order to determine average individual weight for each taxa and each pass.
Task 1: Capture, PIT tag, and collect data on juvenile O. mykiss
5
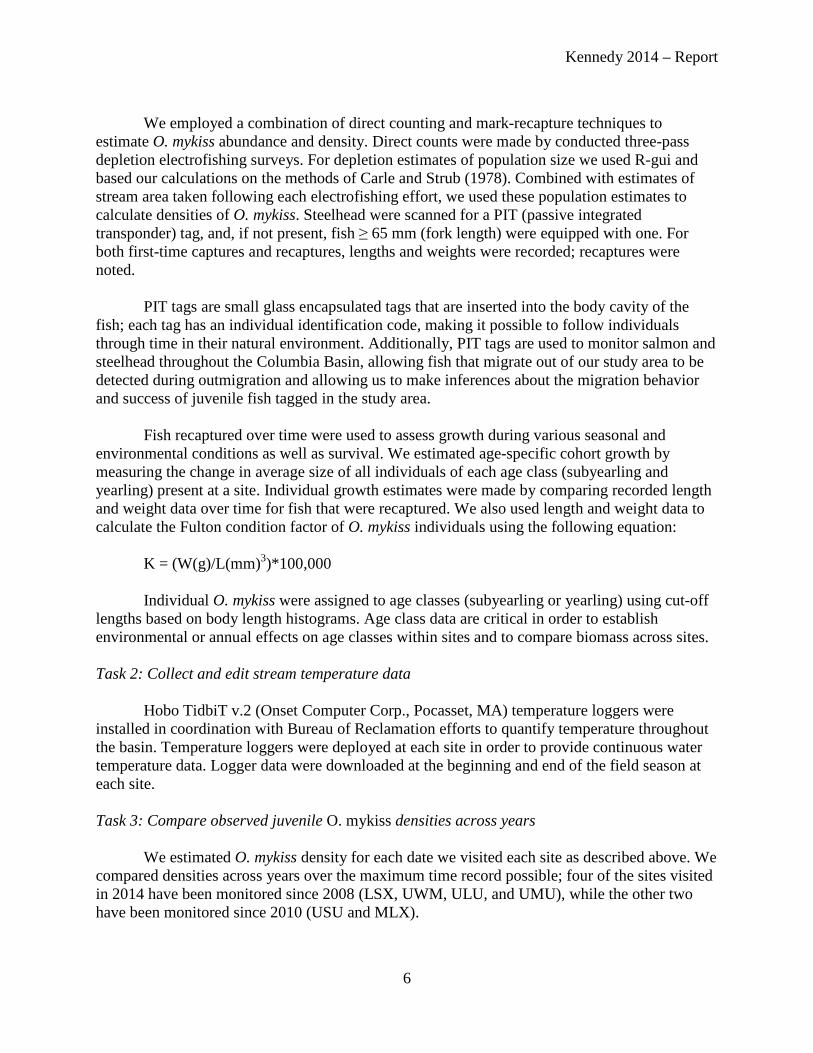
Kennedy 2014 – Report
We employed a combination of direct counting and mark-recapture techniques to estimate O. mykiss abundance and density. Direct counts were made by conducted three-pass depletion electrofishing surveys. For depletion estimates of population size we used R-gui and based our calculations on the methods of Carle and Strub (1978). Combined with estimates of stream area taken following each electrofishing effort, we used these population estimates to calculate densities of O. mykiss. Steelhead were scanned for a PIT (passive integrated transponder) tag, and, if not present, fish ≥ 65 mm (fork length) were equipped with one. For both first-time captures and recaptures, lengths and weights were recorded; recaptures were noted.
PIT tags are small glass encapsulated tags that are inserted into the body cavity of the fish; each tag has an individual identification code, making it possible to follow individuals through time in their natural environment. Additionally, PIT tags are used to monitor salmon and steelhead throughout the Columbia Basin, allowing fish that migrate out of our study area to be detected during outmigration and allowing us to make inferences about the migration behavior and success of juvenile fish tagged in the study area.
Fish recaptured over time were used to assess growth during various seasonal and environmental conditions as well as survival. We estimated age-specific cohort growth by measuring the change in average size of all individuals of each age class (subyearling and yearling) present at a site. Individual growth estimates were made by comparing recorded length and weight data over time for fish that were recaptured. We also used length and weight data to calculate the Fulton condition factor of O. mykiss individuals using the following equation:
K = (W(g)/L(mm)3)*100,000
Individual O. mykiss were assigned to age classes (subyearling or yearling) using cut-off lengths based on body length histograms. Age class data are critical in order to establish environmental or annual effects on age classes within sites and to compare biomass across sites.
Task 2: Collect and edit stream temperature data
Hobo TidbiT v.2 (Onset Computer Corp., Pocasset, MA) temperature loggers were installed in coordination with Bureau of Reclamation efforts to quantify temperature throughout the basin. Temperature loggers were deployed at each site in order to provide continuous water temperature data. Logger data were downloaded at the beginning and end of the field season at each site.
Task 3: Compare observed juvenile O. mykiss densities across years
We estimated O. mykiss density for each date we visited each site as described above. We compared densities across years over the maximum time record possible; four of the sites visited in 2014 have been monitored since 2008 (LSX, UWM, ULU, and UMU), while the other two have been monitored since 2010 (USU and MLX).
6

Kennedy 2014 – Report
Results from reporting period (July 2014 – December 2014)
We have reported annually on the previous year’s activities, and we refer to these reports for results from 2008 through 2013. Data from 2014 are presented here, and include demographic estimates (body size histograms, abundance, density, cohort growth, and condition factor) and their derivatives for juvenile O. mykiss, as well as temperature data and long-term O. mykiss density trends.
Task 1: Capture, PIT tag, and collect data on juvenile O. mykiss
We PIT tagged a total of 465 individual O. mykiss in the watershed and had 164 recapture events (any rehandled previously tagged fish – including multiple recaptures of some individuals) in 2014.
Histograms of abundance and size distributions describe the dominant patterns throughout the six study reaches (Figs. 2 – 7). In general, two size/age classes were distinguishable (i.e., sites tended to have bimodal size distributions), one composed of subyearling (0+) individuals that emerged in spring 2014 and a second composed of yearling or older fish (1+) that emerged in previous springs. During the first visit, yearling fish were usually more abundant than subyearling fish (with the exception of MLX, where we captured more subyearlings than yearlings at every visit). By the second visit in late August/early September, when we were able to more effectively collect subyearlings with our sampling gear, subyearlings were relatively more abundant than they had been earlier in the season (though the pattern was muted at UMU, where we only captured three subyearlings over the entire field season), and that pattern continued for the third and final visit of the sampling season in October. Subyearling body size at lower elevation sites (LSX and MLX) was larger on a given date compared to sites at higher elevations (USU, UWM, ULU, and UMU).
Notable abundance patterns this year included the high abundance of both subyearlings and yearlings at ULU relative to all other sites, the relatively high abundance of yearlings at UMU compared to the other sites (except ULU), and the high subyearling to yearling ratios observed at the sites lower in the watershed (LSX and MLX) compared to all other sites (Tables 3 – 5). There were no obvious differences in abundance or age structure between project affected area sites and control sites, though as mentioned above, ULU (a control site) had much higher abundances than the other sites.
In 2014, total densities of juvenile O. mykiss did not display the same temporal pattern across the six sampled sites. Over the course of the summer sampling season, total density increased slightly at three sites (USU, UWM, and UMU), changed little at two sites (LSX and MLX), and decreased at one site (ULU) (Fig. 8). Subyearling densities displayed the same temporal pattern as total densities (Fig. 9), suggesting that the relatively lower total densities early in the summer may have been due to our inability to sample small subyearlings during that time; the lack of variation in densities at lower elevation sites with larger subyearlings (i.e., LSX and MLX) further supports this idea. Subyearling densities did not appear to display consistent spatial variation (i.e., there was no consistent difference between sites low in the watershed and sites high in the watershed). There was no clear pattern between project affected sites and control
7

Kennedy 2014 – Report
sites in subyearling density, though ULU (a control site) had by far the highest subyearling densities throughout the sampling season.
The highest densities of both age classes were consistently observed at ULU (Figs. 9 – 10). Yearling densities were relatively constant over the summer at LSX and USU, decreased slightly at MLX, ULU, and UMU, and increased at UWM (Fig. 10). Yearling densities were lowest at lower elevation sites (LSX and MLX), and there was little difference in density between those two sites. At higher elevations, there appeared to be a difference in yearling density between project affected sites and control sites, with higher densities at control sites throughout the sampling season.
We calculated cohort growth rates for juvenile O. mykiss over two five-week growth periods (first period = late July to late August/early September; second period = late August/early September to early October) at each site. Subyearling cohort growth rates were uniformly positive; furthermore, they increased from the first period to the second, except at LSX, where subyearling cohort growth rate decreased (Fig. 11). There did not appear to be a consistent spatial pattern in subyearling cohort growth, nor a consistent pattern between project affected sites and control sites.
Yearling cohort growth rates were more variable, with most sites showing negative cohort growth during the first growth period (with the exceptions of UWM, where growth was positive, and ULU, where growth was near zero) and positive cohort growth during the second growth period (with the exceptions of USU and UMU, where growth was negative) (Fig. 12). During the first growth period, lower elevation sites (LSX and MLX) displayed the most negative cohort growth rates, but this pattern did not hold for the second growth period. There did not appear to be a consistent pattern in yearling cohort growth between project affected sites and control sites.
Condition factor for both subyearling and yearling fish (averaged across all individuals within an age class and site) tended to decline over the sampling season and reached a minimum at the end of the sampling season, though the pattern was variable at some sites (e.g. ULU) (Figs. 13-14). Subyearling fish had higher condition factors than yearling fish, particularly by the end of the sampling season. For both subyearling and yearling fish, sites lower in the watershed were not substantially different from sites higher in the watershed. In general, there also did not appear to be differences in condition factor based on hydrologic alteration, except during the second visit, when fish (both subyearlings and yearlings) caught at project affected sites tended to have higher condition factors than fish caught at control sites.
The overall mortality rate of O. mykiss that we handled over the course of the field season was 1.3% (Table 6), comparable to that of previous years. The majority of those mortalities (seven out of twelve) occurred during the first visit to ULU, when high temperatures and high fish density led to low oxygen conditions in a bucket being used to transport fish.
Task 2: Collect and edit stream temperature data
8
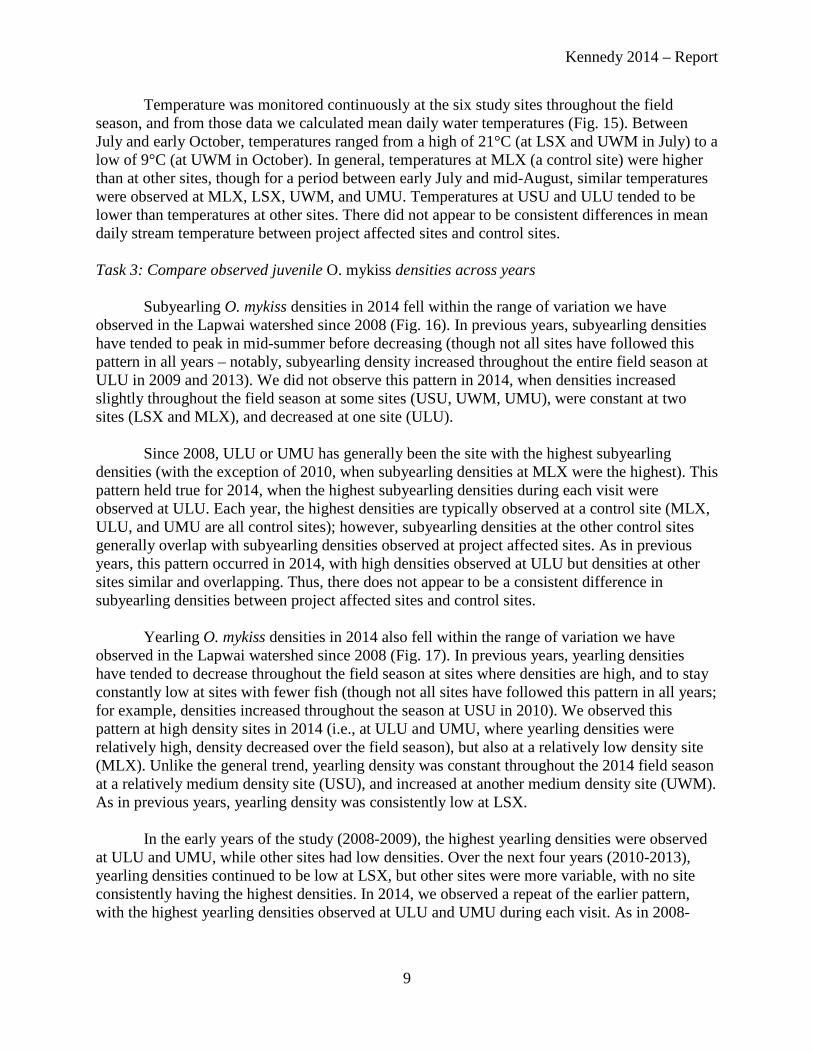
Kennedy 2014 – Report
Temperature was monitored continuously at the six study sites throughout the field season, and from those data we calculated mean daily water temperatures (Fig. 15). Between July and early October, temperatures ranged from a high of 21°C (at LSX and UWM in July) to a low of 9°C (at UWM in October). In general, temperatures at MLX (a control site) were higher than at other sites, though for a period between early July and mid-August, similar temperatures were observed at MLX, LSX, UWM, and UMU. Temperatures at USU and ULU tended to be lower than temperatures at other sites. There did not appear to be consistent differences in mean daily stream temperature between project affected sites and control sites.
Task 3: Compare observed juvenile O. mykiss densities across years
Subyearling O. mykiss densities in 2014 fell within the range of variation we have observed in the Lapwai watershed since 2008 (Fig. 16). In previous years, subyearling densities have tended to peak in mid-summer before decreasing (though not all sites have followed this pattern in all years – notably, subyearling density increased throughout the entire field season at ULU in 2009 and 2013). We did not observe this pattern in 2014, when densities increased slightly throughout the field season at some sites (USU, UWM, UMU), were constant at two sites (LSX and MLX), and decreased at one site (ULU).
Since 2008, ULU or UMU has generally been the site with the highest subyearling densities (with the exception of 2010, when subyearling densities at MLX were the highest). This pattern held true for 2014, when the highest subyearling densities during each visit were observed at ULU. Each year, the highest densities are typically observed at a control site (MLX, ULU, and UMU are all control sites); however, subyearling densities at the other control sites generally overlap with subyearling densities observed at project affected sites. As in previous years, this pattern occurred in 2014, with high densities observed at ULU but densities at other sites similar and overlapping. Thus, there does not appear to be a consistent difference in subyearling densities between project affected sites and control sites.
Yearling O. mykiss densities in 2014 also fell within the range of variation we have observed in the Lapwai watershed since 2008 (Fig. 17). In previous years, yearling densities have tended to decrease throughout the field season at sites where densities are high, and to stay constantly low at sites with fewer fish (though not all sites have followed this pattern in all years; for example, densities increased throughout the season at USU in 2010). We observed this pattern at high density sites in 2014 (i.e., at ULU and UMU, where yearling densities were relatively high, density decreased over the field season), but also at a relatively low density site (MLX). Unlike the general trend, yearling density was constant throughout the 2014 field season at a relatively medium density site (USU), and increased at another medium density site (UWM). As in previous years, yearling density was consistently low at LSX.
In the early years of the study (2008-2009), the highest yearling densities were observed at ULU and UMU, while other sites had low densities. Over the next four years (2010-2013), yearling densities continued to be low at LSX, but other sites were more variable, with no site consistently having the highest densities. In 2014, we observed a repeat of the earlier pattern, with the highest yearling densities observed at ULU and UMU during each visit. As in 2008
9

Kennedy 2014 – Report
2009, in 2014 it appeared that at higher elevations sites there were higher yearling densities at control sites (ULU and UMU) than at project affected sites (USU and UWM).
Additional Outreach and Educational Activities
M.S. student Jeff Caisman presented a talk entitled “Partial Migration of Yearling Oncorhynchus mykiss in Lapwai Creek, Idaho” at the American Fisheries Society national meeting in August 2014. Jeff is currently working on completing his master’s work and will be graduating in May 2015. Jeff is planning on submitting two manuscripts from his master’s work for publication.
Project manager Emily Benson continued her involvement with the project throughout 2014. She helped supervise and support field sampling efforts during the summer. Emily is also working on processing macroinvertebrate and other samples in the lab, and is continuing to analyze the data gathered from those samples.
Marius Myrvold was involved with the field effort in the summer and fall, and has worked with Brian Kennedy on publishing the manuscripts from his dissertation (which was completed in May 2014). His dissertation concerned mainly individual growth, population regulation, and steelhead distribution in relation to habitat factors in the Lapwai watershed. One manuscript has been published in 2014. Together with UI Water Resources faculty, Marius led a field trip that introduced new graduate students to the efforts undertaken in Lapwai, and to fish ecology in general.
At the end of the summer of 2014, Ph.D. student Natasha Wingerter joined the Kennedy lab. She is funded through an NSF – IGERT project in the Water Resources Program and in the summer of 2014, prior to her matriculation at UI, participated in an internship program at the US-BOR office in Boise, under the supervision of Dmitri Vidergar.
Current and Future Efforts
We are currently in the process of analyzing the following data:
- Fish community structure: spatiotemporal variation in composition, densities and the effects on O. mykiss
- Diet (stomach samples) and available food resources (drift and Surber samples) - Validation of age and analysis of maternal origin (of mortalities) - Assessing site fidelity of PIT tagged juvenile O. mykiss - Identifying drivers of population densities and the effects on growth rates and
movement - Relationships between habitat conditions and steelhead densities and individual
performance.
Future efforts will consist of completing the analyses listed above, as well as continuing to work on the scientific manuscripts currently in preparation. Project members also plan to
10

Kennedy 2014 – Report
attend professional meetings throughout the coming year, where they will present the findings of this project.
11

Kennedy 2014 – Report
Tables
Table 2. Names, three-letter codes, and dates for sites sampled in Lapwai watershed from late July to early October, 2014. Sampling effort in 2014 was reduced relative to previous years; gray rows indicate sites that were not sampled in 2014. Each site in white was sampled three times throughout the field season; sites were sampled five times throughout the season in previous years, except in 2008, when they were sampled four times.
Site name Site code
Date of first visit
Date of second
visit
Date of third visit
Lower Lapwai lower LLL Not sampled
Not sampled
Not sampled
Lower Lapwai upper LLU Not sampled
Not sampled
Not sampled
Lower Sweetwater LSX 7/25/14 8/29/14 10/3/14
Middle Lapwai MLX 7/30/14 9/3/14 10/8/14
Upper Lapwai lower ULL Not sampled
Not sampled
Not sampled
Upper Lapwai middle ULM Not sampled
Not sampled
Not sampled
Upper Lapwai upper ULU 7/29/14 9/2/14 10/7/14
Upper Mission lower UML Not sampled
Not sampled
Not sampled
Upper Mission middle UMM Not
sampled Not
sampled Not
sampled
Upper Mission upper UMU 7/23/14 8/27/14 10/1/14
Upper Sweetwater lower USL Not
sampled Not
sampled Not
sampled Upper Sweetwater
middle USM Not sampled
Not sampled
Not sampled
Upper Sweetwater upper USU 7/24/14 8/28/14 10/2/14
Upper Webb lower UWL Not sampled
Not sampled
Not sampled
Upper Webb middle UWM 7/28/14 9/1/14 10/6/14
Upper Webb upper UWU Not sampled
Not sampled
Not sampled
12

Kennedy 2014 – Report
Table 3. Number, population size estimated using methods of Carle and Strub (1978), and density (number m-2) of O. mykiss captured via electrofishing at six sites in Lapwai watershed (four of which have been sampled since 2008: LSX, UWM, ULU, UMU) in late July, 2014 (first visit to each site). Each site was approximately 100 meters in length. Original name refers to the site name used in calendar years 2008 and 2009 and associated Activities Reports, and new name refers to the site name used in calendar years 2010-2014. Original name
(2008-2009) New name (2010-2014) Number
O. mykiss captured
Population estimate
(standard error)
Density (number m-2)
Lower Sweetwater
Lower Sweetwater (LSX) 21 23(3.279) 0.039
(not sampled) Upper Sweetwater upper (USU) 35 36(1.697) 0.096
Lower Webb Upper Webb middle (UWM) 18 18(NA) 0.043
(Not sampled) Middle Lapwai (MLX) 26 26(0.957) 0.091
Upper Lapwai Upper Lapwai upper (ULU) 124 133(5.498) 0.377
Upper Mission Upper Mission upper (UMU) 51 52(1.591) 0.149
Table 4. Number, population size estimated using methods of Carle and Strub (1978), and density (number m-2) of O. mykiss captured via electrofishing at six sites in Lapwai watershed (four of which have been sampled since 2008: LSX, UWM, ULU, UMU) in late August/early September, 2014 (second visit to each site). Each site was approximately 100 meters in length. Original name refers to the site name used in calendar years 2008 and 2009 and associated Activities Reports, and new name refers to the site name used in calendar years 2010-2014. Original name
(2008-2009) New name (2010-2014) Number
O. mykiss captured
Population estimate
(standard error)
Density (number m-2)
Lower Sweetwater
Lower Sweetwater (LSX) 19 21(3.363) 0.036
(not sampled) Upper Sweetwater upper (USU) 24 31(8.623) 0.086
Lower Webb Upper Webb middle (UWM) 43 45(2.388) 0.114
(Not sampled) Middle Lapwai (MLX) 24 25(2.046) 0.068
Upper Lapwai Upper Lapwai upper (ULU) 151 161(5.291) 0.334
Upper Mission Upper Mission upper (UMU) 54 60(4.938) 0.162
13
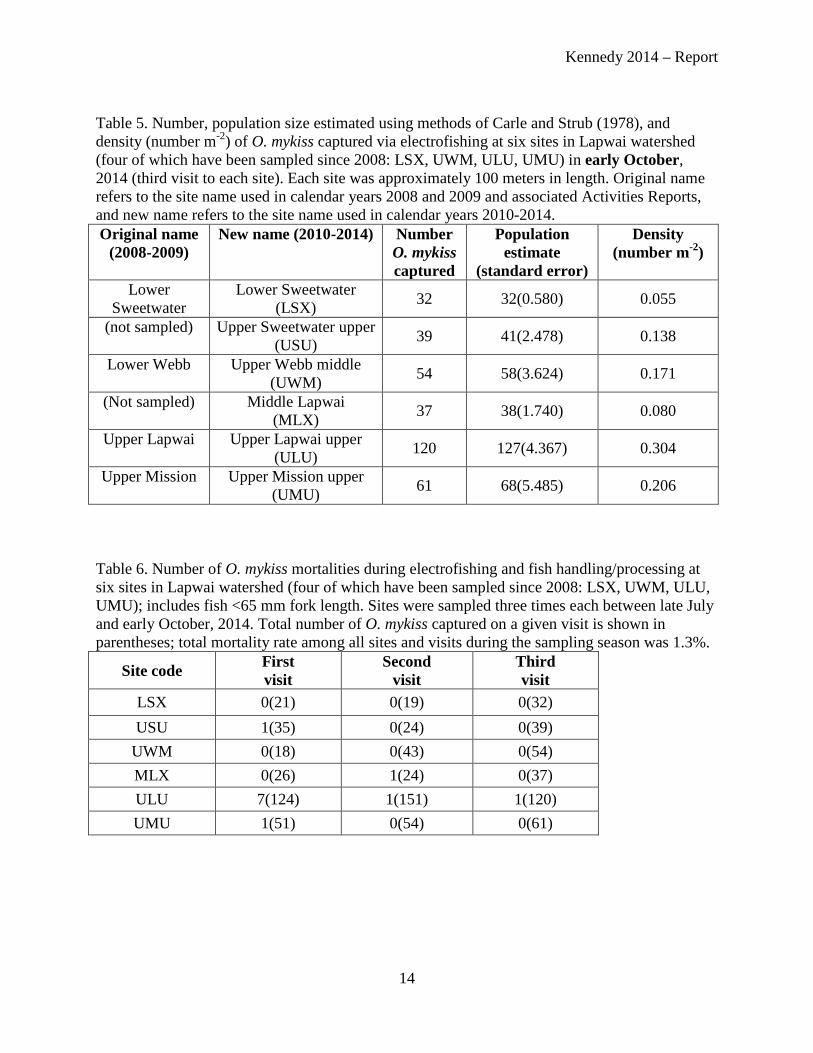
Kennedy 2014 – Report
Table 5. Number, population size estimated using methods of Carle and Strub (1978), and density (number m-2) of O. mykiss captured via electrofishing at six sites in Lapwai watershed (four of which have been sampled since 2008: LSX, UWM, ULU, UMU) in early October, 2014 (third visit to each site). Each site was approximately 100 meters in length. Original name refers to the site name used in calendar years 2008 and 2009 and associated Activities Reports, and new name refers to the site name used in calendar years 2010-2014. Original name
(2008-2009) New name (2010-2014) Number
O. mykiss captured
Population estimate
(standard error)
Density (number m-2)
Lower Sweetwater
Lower Sweetwater (LSX) 32 32(0.580) 0.055
(not sampled) Upper Sweetwater upper (USU) 39 41(2.478) 0.138
Lower Webb Upper Webb middle (UWM) 54 58(3.624) 0.171
(Not sampled) Middle Lapwai (MLX) 37 38(1.740) 0.080
Upper Lapwai Upper Lapwai upper (ULU) 120 127(4.367) 0.304
Upper Mission Upper Mission upper (UMU) 61 68(5.485) 0.206
Table 6. Number of O. mykiss mortalities during electrofishing and fish handling/processing at six sites in Lapwai watershed (four of which have been sampled since 2008: LSX, UWM, ULU, UMU); includes fish <65 mm fork length. Sites were sampled three times each between late July and early October, 2014. Total number of O. mykiss captured on a given visit is shown in parentheses; total mortality rate among all sites and visits during the sampling season was 1.3%.
Site code First visit
Second visit
Third visit
LSX 0(21) 0(19) 0(32) USU 1(35) 0(24) 0(39)
UWM 0(18) 0(43) 0(54) MLX 0(26) 1(24) 0(37) ULU 7(124) 1(151) 1(120) UMU 1(51) 0(54) 0(61)
14
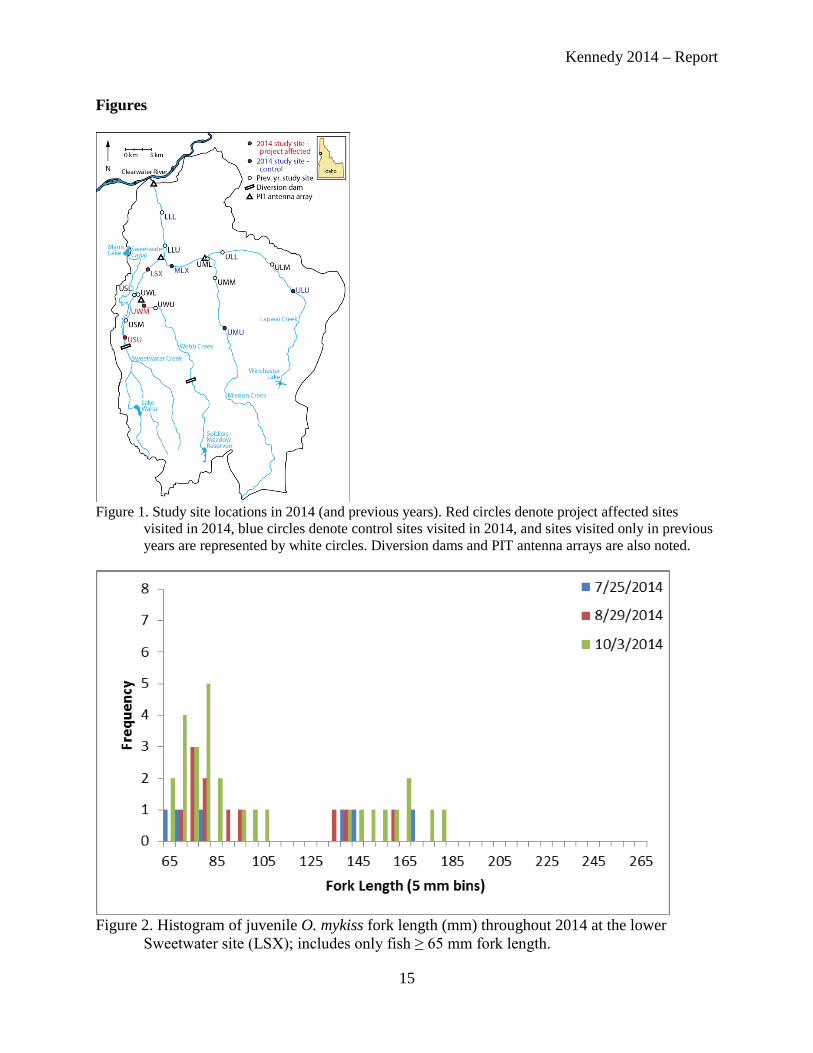
Kennedy 2014 – Report
Figures
Figure 1. Study site locations in 2014 (and previous years). Red circles denote project affected sites visited in 2014, blue circles denote control sites visited in 2014, and sites visited only in previous years are represented by white circles. Diversion dams and PIT antenna arrays are also noted.
Figure 2. Histogram of juvenile O. mykiss fork length (mm) throughout 2014 at the lower Sweetwater site (LSX); includes only fish ≥ 65 mm fork length.
15

Kennedy 2014 – Report
Figure 3. Histogram of juvenile O. mykiss fork length (mm) throughout 2014 at the upper Sweetwater upper site (USU); includes only fish ≥ 65 mm fork length.
Figure 4. Histogram of juvenile O. mykiss fork length (mm) throughout 2014 at the upper Webb middle site (UWM); includes only fish ≥ 65 mm fork length.
16

Kennedy 2014 – Report
Figure 5. Histogram of juvenile O. mykiss fork length (mm) throughout 2014 at the middle Lapwai site (MLX); includes only fish ≥ 65 mm fork length.
Figure 6. Histogram of juvenile O. mykiss fork length (mm) throughout 2014 at the upper Lapwai upper site (ULU); includes only fish ≥ 65 mm fork length. Note that y-axis scale is different from other histograms.
17
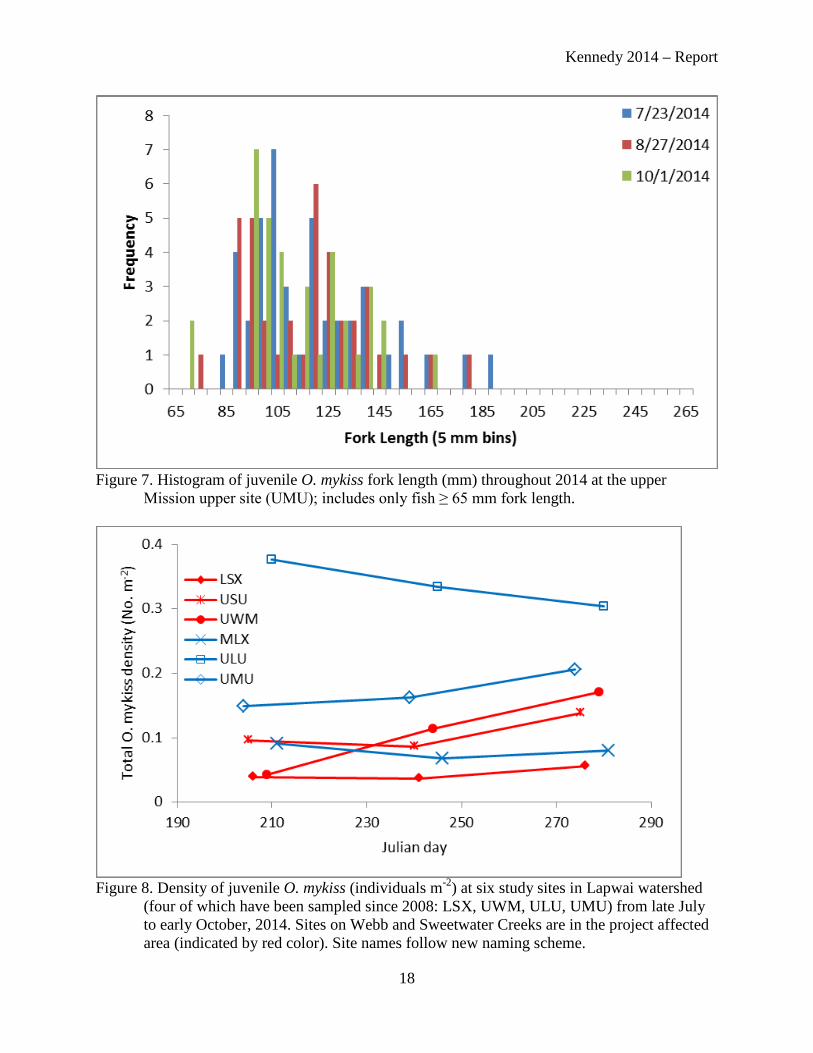
Kennedy 2014 – Report
Figure 7. Histogram of juvenile O. mykiss fork length (mm) throughout 2014 at the upper Mission upper site (UMU); includes only fish ≥ 65 mm fork length.
Figure 8. Density of juvenile O. mykiss (individuals m-2) at six study sites in Lapwai watershed (four of which have been sampled since 2008: LSX, UWM, ULU, UMU) from late July to early October, 2014. Sites on Webb and Sweetwater Creeks are in the project affected area (indicated by red color). Site names follow new naming scheme.
18

Kennedy 2014 – Report
Figure 9. Density of subyearling O. mykiss (individuals m-2) at six study sites in Lapwai watershed (four of which have been sampled since 2008: LSX, UWM, ULU, UMU) from late July to early October, 2014. Sites on Webb and Sweetwater Creeks are in the project affected area (indicated by red color). Site names follow new naming scheme.
Figure 10. Density of yearling O. mykiss (individuals m-2) at six study sites in Lapwai watershed (four of which have been sampled since 2008: LSX, UWM, ULU, UMU) from late July to early October, 2014. Sites on Webb and Sweetwater Creeks are in the project affected area (indicated by red color). Site names follow new naming scheme.
19
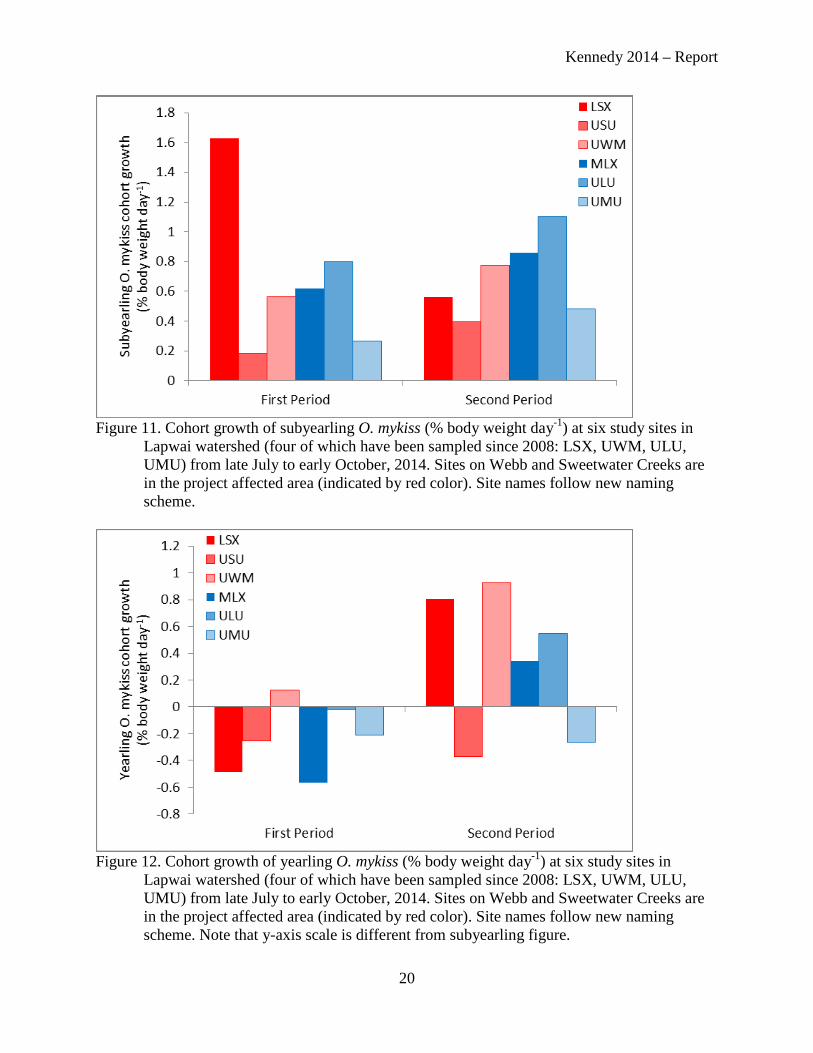
Kennedy 2014 – Report
Figure 11. Cohort growth of subyearling O. mykiss (% body weight day-1) at six study sites in Lapwai watershed (four of which have been sampled since 2008: LSX, UWM, ULU, UMU) from late July to early October, 2014. Sites on Webb and Sweetwater Creeks are in the project affected area (indicated by red color). Site names follow new naming scheme.
Figure 12. Cohort growth of yearling O. mykiss (% body weight day-1) at six study sites in Lapwai watershed (four of which have been sampled since 2008: LSX, UWM, ULU, UMU) from late July to early October, 2014. Sites on Webb and Sweetwater Creeks are in the project affected area (indicated by red color). Site names follow new naming scheme. Note that y-axis scale is different from subyearling figure.
20

Kennedy 2014 – Report
Figure 13. Condition factor of subyearling O. mykiss ≥ 65 mm fork length at six study sites in Lapwai watershed (four of which have been sampled since 2008: LSX, UWM, ULU, UMU) from late July to early October, 2014. Sites on Webb and Sweetwater Creeks are in the project affected area (indicated by red color). Error bars indicate +/- 1 standard error. Site names follow new naming scheme.
Figure 14. Condition factor of yearling O. mykiss at six study sites in Lapwai watershed (four of which have been sampled since 2008: LSX, UWM, ULU, UMU) from late July to early October, 2014. Sites on Webb and Sweetwater Creeks are in the project affected area (indicated by red color). Error bars indicate +/- 1 standard error. Site names follow new naming scheme.
21
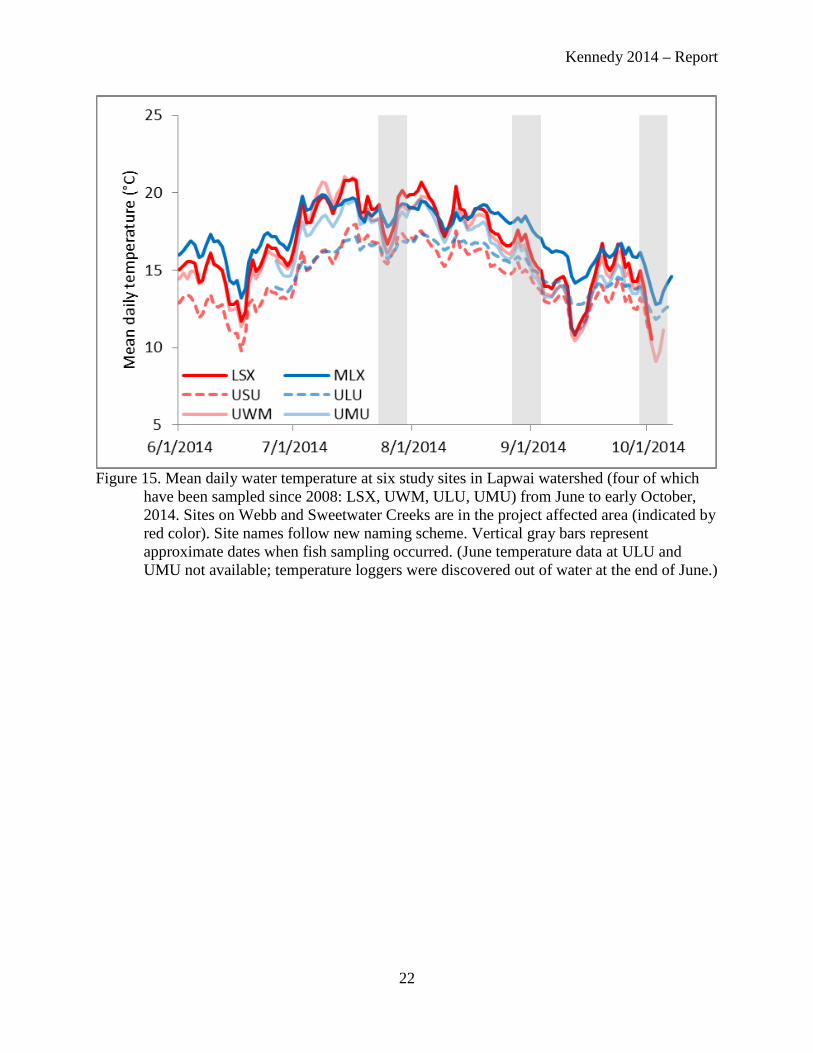
Kennedy 2014 – Report
Figure 15. Mean daily water temperature at six study sites in Lapwai watershed (four of which have been sampled since 2008: LSX, UWM, ULU, UMU) from June to early October, 2014. Sites on Webb and Sweetwater Creeks are in the project affected area (indicated by red color). Site names follow new naming scheme. Vertical gray bars represent approximate dates when fish sampling occurred. (June temperature data at ULU and UMU not available; temperature loggers were discovered out of water at the end of June.)
22

Kennedy 2014 – Report
Figure 16. Density of subyearling O. mykiss (individuals m-2) at six study sites in Lapwai watershed between 2008 and 2014 (note: USU and MLX were not sampled until 2010). Sites on Webb and Sweetwater Creeks are in the project affected area (indicated by red color). Site names follow new naming scheme.
Figure 17. Density of yearling O. mykiss (individuals m-2) at six study sites in Lapwai watershed between 2008 and 2014 (note: USU and MLX were not sampled until 2010). Sites on Webb and Sweetwater Creeks are in the project affected area (indicated by red color). Site names follow new naming scheme. Note that y-axis scale is different from subyearling figure.
23
Kennedy 2014 – Report
References and Literature Cited
ADAMS, S. M. and BRECK, J. E. (1990). Bioenergetics. In Methods for Fish Biology, editors C.B. Schreck and P. B. Moyle.
ALMODOVAR, A. and NICOLA, G. G. (1999). Effects of a small hydropower station upon brown trout Salmo trutta L. in the River Hoz Seca (Tagus basin, Spain) one year after regulation. Regulated Rivers-Research & Management, 15, 477-484.
ANDERSON, K. E. and 5 other authors. (2006). Instream flow needs in streams and rivers: the importance of understanding ecological dynamics. Frontiers in Ecology and Environment, 4, 309-318.
ARMSTRONG, J. D. (1997). Self-thinning in juvenile sea trout and other salmonid fishes revisited. Journal of Animal Ecology, 66, 519-526.
BAIN, M. B., HUGHES, T. C. and AREND, K. K. (1999). Trends in methods for assessing freshwater habitats. Fisheries, 24, 16-21.
BEECHER, H. A., JOHNSON, T.H., and CARLETON, J.P. (1993). Predicting microdistributions of steelhead (Oncorhynchus mykiss) parr from depth and velocity preference criteria – test of an assumption of the instream flow incremental methodology. Canadian Journal of Fisheries and Aquatic Sciences 50, 2380-2387.
BJORNN, T. C. and REISER, D. D. (1991). Habitat requirements of salmonids in streams. Pages 83-138 in W.R. Meehan, editor. Influences of Forest and Rangeland Management on Salmonid Fishes and Their Habitats. American Fisheries Society, Special Publication 19, Bethesda, Maryland.
BOHLIN, T., DELLEFORS, C., FAREMO, U. and JOHLANDER, A. (1994). The energetic equivalence hypothesis and the relation between population-density and body-size in stream-living salmonids. American Naturalist, 143, 478-493.
BRANDT, S. B. and HARTMAN, K. J. (1993). Innovative approaches with bioenergetics models: future applications to fish ecology and management. Transactions of the American Fisheries Society, 122, 731-735.
CARLE, F.L. and STRUB, M.R. (1978). A new method for estimating population size from removal data. Biometrics, 34, 621-630.
CHANDLER, C. AND PAROT, R. 2003. Fish distribution and relative abundance of big canyon creek, Lapwai creek, mission creek and Sweetwater creek. Nez Perce Tribe Department of Fisheries Resources Management. Lapwai, ID
CHANDLER, C. 2004. Fish distribution and relative abundance of Webb Creek and Little Canyon Creek. Nez Perce Tribe Department of Fisheries Resources Management. Lapwai, ID
24
Kennedy 2014 – Report
CUCHEROUSSET, J., ROUSSEL, J. M., KEELER, R., CUNJAK, R. A. and STUMP, R. (2005). The use of two new portable 12-mm PIT tag detectors to track small fish in shallow streams. North American Journal of Fisheries Management, 25, 270-274.
CUMMINS, K. W. (1962). An evaluation of some techniques for the collection and analysis of benthic samples with special emphasis on lotic waters. American Midland Naturalist, 67, 477-504.
DUNHAM, J. B. and VINYARD, G. L. (1997). Relationships between body mass, population density, and the self-thinning rule in stream-living salmonids. Canadian Journal of Fisheries and Aquatic Sciences, 54, 1025-1030.
ELLIOTT, J. M. (1993). The self-thinning rule applied to juvenile sea trout, Salmo trutta. Journal of Animal Ecology, 62, 371-379.
FAUSCH, K. D. (1984). Profitable stream positions for salmonids: relating specific growth rate to net energy gain. Canadian Journal of Zoology, 62, 441-451.
GRANT, J. W. A. (1993). Self-thinning in stream-dwelling salmonids. Special Publication of Fisheries and Aquatic Sciences, 118, 99-102.
GRANT, J. W. A., STEINGRIMSSON, S. O., KEELEY, E. R. and CUNJAK, R. A. (1998). Implications of territory size for the measurement and prediction of salmonid abundance in streams. Canadian Journal of Fisheries and Aquatic Sciences, 55, 181-190.
HARTSON, R. B. AND KENNEDY, B. P. (2014). Competitive release modifies the impacts of hydrologic alteration for a partially migratory stream predator. Ecology of Freshwater Fish.
HILL, M. S., ZYDLEWSKI, G. B. and GALE, W. L. (2006a). Comparisons between hatchery and wild steelhead trout (Oncorhynchus mykiss) smolts: physiology and habitat use. Canadian Journal of Fisheries and Aquatic Sciences, 63, 1627-1638.
HILL, M. S., ZYDLEWSKI, G. B., ZYDLEWSKI, J. D. and GASVODA, J. M. (2006b). Development and evaluation of portable PIT tag detection units: PITpacks. Fisheries Research, 77, 102-109.
HILLMAN, T. W., GRIFFITH, J. S. and PLATTS, W. S. (1987). Summer and winter habitat selection by juvenile Chinook salmon in a highly sedimented Idaho stream. Transactions of the American Fisheries Society, 116, 185-195.
HOLECEK D.E., SCARNECCHIA, D.L., and MILLER, S.E. 2012. Smoltification in an impounded adfluvial redband trout population upstream from an impassable dam: does it persist? Transactions of the North American Fisheries Society 141: 68-75.
25
Kennedy 2014 – Report
HORNE, B. D., RUTHERFORD, E. S. and WEHRLY, K. E. (2004). Simulating effects of hydro-dam alteration on thermal regime and wild steelhead recruitment in a stable-flow Lake Michigan tributary. River Research and Applications, 20, 185-203.
JACOBS, J. (1974). Quantitative measurement of food selection: modification of forage ratio and Ivlev’s electivity index. Oecologia, 14, 413-417.
JOWETT, I.G. (1997). Instream flow methods: a comparison of approaches. Regulated Rivers-Research and Management, 13, 115-127.
KENNEDY, B. P., KLAUE, B., BLUM, J. D. and FOLT, C. L. (2004). Integrative measures of consumption rates in fish: expansion and application of a trace element approach. Journal of Applied Ecology, 41, 1009-1020.
KENNEDY, B. P., NISLOW, K. H. and FOLT, C. L. (2008). Habitat-mediated foraging limitations drive survival bottleneck for juvenile salmon. Ecology, in press.
KUCERA, P.A., JOHNSON, J.H., AND BEAR, M.A. 1983. A biological and physical inventory of the streams within the Nez Perce Reservation. Nez Perce Tribe Fisheries Resource Management. Lapwai, ID
LOBON-CERVIA, J. and MORTENSEN, E. (2006). Two-phase self-thinning in stream-living juveniles of lake-migratory brown trout Salmo trutta L. Compatibility between linear and non-linear patterns across populations? Oikos, 113, 412-423.
LOPES, L. F. G., DO CARMO, J. S. A., CORTES, R. M. V. and OLIVEIRA, D. (2004). Hydrodynamics and water quality modeling in a regulated river segment: application on the instream flow definition. Ecological Modeling, 173, 197-218.
MERCHANT, A. Z., BENSON, E. R., HEGG, J. and KENNEDY, B. P. (2012) Presented at the 2012 Annual meeting for the Idaho Chapter AFS, Coeur d’Alene, Idaho. Determining the maternal origin of juvenile steelhead in Lapwai Basin, Idaho.
MUHLFELD, C. C., BENNETT, D. H. and MAROTZ, B. (2001a). Fall and winter habitat use and movement by Columbia River redband trout in a small stream in Montana. North American Journal of Fisheries Management, 21, 170-177.
MUHLFELD, C. C., BENNETT, D. H. and MAROTZ, B. (2001b). Summer habitat use by Columbia River redband trout in the Kootenai River drainage, Montana. North American Journal of Fisheries Management, 21, 223-235.
MUNDIE, J. H. (1969). Ecological implications of the diet of juvenile coho salmon in streams. Pages 135-152 in T.G. Northcote, editor. Symposium on salmon and trout in streams, University of British Columbia, Vancouver.
26

Kennedy 2014 – Report
MYRVOLD, K. M. and KENNEDY, B. P. (2014). Interactions between body mass and water temperature cause energetic bottlenecks in juvenile steelhead. Ecology of Freshwater Fish.
MYRVOLD, K. M. and KENNEDY, B. P. (In prep). Estimation of salmonid abundance based on single-pass electrofishing in small, wadeable streams.
MYRVOLD, K. M. and KENNEDY, B. P. (In prep). Differential effects of cohort density on individual growth in a stream salmonid.
MYRVOLD, K. M. and KENNEDY, B. P. (In prep). Relationship between in-stream habitat characteristics and juvenile steelhead densities.
NATIONAL OCEANIC AND ATMOSPHERIC ADMINISTRATION (NOAA). (2006). Biological Opinion to the Bureau of Reclamation for the Operation and Maintenance of the Lewiston Orchards Project.
NEY, J. J. (1993). Bioenergetics modeling today: growing pains on the cutting edge. Transactions of the American Fisheries Society, 122, 736-748.
NISLOW, K. H., FOLT, C. L. and PARRISH, D. L. (2000). A spatially-explicit bioenergetic analysis of habitat quality for age-0 Atlantic salmon. Transactions of the American Fisheries Society, 129, 1067-1081.
NISLOW, K. H., FOLT, C. L. and PARRISH, D. L. (1999). Favorable foraging locations for age-0 Atlantic salmon: application to the restoration of populations and habitats. Ecological Applications, 9, 1085-1099.
POLLOCK, K. H. (1982). A capture-recapture design robust to unequal probability of capture. Journal of Wildlife Management 46, 752-757.
RINCON, P. A. and LOBON-CERVIA, J. (2002). Nonlinear self-thinning in a stream-resident population of brown trout (Salmo trutta). Ecology, 83, 1808-1816.
ROUSSEL, J. M., CUNJAK, R. A., NEWBURY, R., CAISSIE, D. and HARO, A. (2004). Movements and habitat use by PIT-tagged Atlantic salmon parr in early winter: the influence of anchor ice. Freshwater Biology, 49, 1026-1035.
ROUSSEL, J. M., HARO, A. and CUNJAK, R. A. (2000). Field test of a new method for tracking small fishes in shallow rivers using passive integrated transponder (PIT) technology. Canadian Journal of Fisheries and Aquatic Sciences, 57, 1326-1329.
SIMONSON, T. D., LYONS, J. and KANEHL, P. D. (1994). Quantifying fish habitat in streams: transect spacing, sample size, and a proposed framework. North American Journal of Fisheries Management, 14, 607-615.
27
Kennedy 2014 – Report
STEINGRIMSSON, S. O. and GRANT, J. W. A. (1999). Allometry of territory size and metabolic rate as predictors of self-thinning in young-of-the-year Atlantic salmon. Journal of Animal Ecology, 68, 17-26.
THARME, R.E. (2003). A global perspective on environmental flow assessment: emerging trends in the development and application of environmental flow methodologies for rivers. River Research and Applications, 19, 397-441.
URABE, H. and NAKANO, S. (1999). Linking microhabitat availability and local density of rainbow trout in low-gradient Japanese streams. Ecological Research, 14, 341-349.
YODA, K., KIRA, T., OGAWA, H. and HOZUMI, K. (1963). Self-thinning in overcrowded pure stands under cultivated and natural conditions. Journal of the Institute of Polytechnics, Osaka City University, Series D, 14, 107-129.
WILZBACH, M.A., ASHENFELTER, M.J. and RICKER, S.J. (2012). Movement of Resident Rainbow Trout Transplanted below a Barrier to Anadromy. Transactions of the American Fisheries Society, 141:2, 294-304.
ZYDLEWSKI, G. B., HARO, A., WHALEN, K. G. and MCCORMICK, S. D. (2001). Performance of stationary and portable passive transponder detection systems for monitoring of fish movements. Journal of Fish Biology, 58, 1471-1475.
28
APPENDIX C
NEZ PERCE TRIBE 2014 LAPWAI CREEK
PIT TAG DETECTION SUMMARY


NEZ PERCE TRIBE Department of Fisheries Resources Management
Administration • Enforcement • Harvest • Production • Research • Resident Fish • Watershed
Joseph Field Office 500 N. Main St.. • Joseph, OR 97846
Phone: (541) 432-2503 • Fax: (541) 432-4820
Date: February 25, 2015
To: Jay Hesse, Director Research Division Lesa Stark, BOR ESA Planning Program Manager
From: Rick Orme NPT ISEMP Project Lead Cameron M. Albee NPT ISEMP Biologist
Subject: 2014 Lapwai Creek PIT Tag Detection Summary
The Nez Perce Tribe and Bureau of Reclamation entered into a Memorandum of Agreement (MOA) in 2012 to monitor adult steelhead escapement into Lapwai Creek via Passive Integrated Transponder (PIT) tag arrays (Reclamation Agreement NO: R12MA11706). This summary report provides preliminary results for the period of July 1, 2013 through July 1, 2014. Final results are pending the completion of a multi-entity collaborative report for Snake River Basin In-stream PIT Tag Detection System (IPTDS). The data summarized here and in the final report is the product of multiple projects and agencies and is generated from the PIT tagging and biological sampling of a known proportion of adult steelhead and Chinook salmon as they migrate through the Lower Granite Dam (LGR) fish ladder and the subsequent detection of those PIT tagged adults at the Lapwai Creek IPTDS. The Integrated Status and Effectiveness Monitoring Project (ISEMP; BPA Project 2003-017-00) spearhead PIT tagging of adults at LGR, have been integral in the development and maintenance of IPTDS infrastructure throughout the Snake River, and developed the Bayesian patchwork occupancy model to estimate population-level estimates of abundance. Idaho Steelhead Monitoring and Evaluation Studies (ISMES; BPA Project 1990-055-00) and the Idaho Natural Production Monitoring and Evaluation Program (NPM; BPA Project 1991-073-00) coordinate biological sampling of adults at LGR and provide length, age, and passage timing data. The Snake River Genetic Stock Identification (BPA Project 2010-026-00) provides SNP genotype data for population-level genetic diversity and structure analysis. Trapping at LGR is coordinated by National Marine Fisheries Service (NMFS; BPA Project 2005002-00; Harmon 2003; Ogden 2010, 2011). The Bureau of Reclamation and Lewiston
1

Orchards Irrigation District support the maintenance of PIT tag arrays in Lapwai, Mission, Sweetwater, and Webb creeks.
Adult Detections
Adult PIT tag detections at in-stream PIT tag arrays within Lapwai Creek were summarized for detections occurring July 1, 2013 through June 30, 2014. Adult detections included steelhead, fall Chinook salmon, and coho salmon (Table 1).
Table 1. First and last PIT tag observation date by species from in-stream arrays within Lapwai Creek during the period of July 1, 2013 through June 30, 2014.
Species First Observation Date Last Observation Date Coho 11/07/2013 12/17/2013 Fall Chinook 10/29/2013 12/03/2013 Steelhead 1/30/2014 5/21/2014
A total of 72 unique PIT tagged adults were detected between the Lapwai (LAP), Mission (MIS), Sweetwater (SWT), and Webb (WEB) creek in-stream arrays (Table 2). Both hatchery and wild/natural adults were detected within Lapwai Creek from 10 different release locations (Table 2). Of these, 57 were steelhead, four fall Chinook salmon, and 11 Coho salmon (Table 2). Based on the timing of detections at Lapwai Creek arrays, it was determined that 3 unique adult steelhead and 1 unique adult fall Chinook were detected but listed as orphans or disowned (no species or other information within the PTAGIS data base) (Table 2).
2

Table 2. Number of unique PIT tagged adults detected at Lapwai Creek in-stream arrays between July 1, 2013 through June 30, 2014 by species and rear type (W-wild, H-hatchery, U-unknown) and by release site.
Release Site Steelhead Steelhead Steelhead Wild Hatche ry Unknown
Fall Fall Chinook Chinook Hatche ry Unknown
Coho Hatche ry
Coho Unknown
Total
COLR3 4 1 5 DISOWN 3 1 4 GRAND1 1 1 LAPC 10 10
LGRLDR 41 3 44 LGRRRR 2 2 PLAP 1 1 PRDLD1 2 2
SNAKE3 1 1 SWEETC 1 1 WEBBC 1 1 Total 47 3 7 3 1 10 1 72
Steelhead Detections
A total of 44 adult steelhead that were PIT tagged as adults at Lower Granite Dam (LGRLDR) were detected within Lapwai Creek for spawn year 2014 (Table 2). Of these, 41 were wild/natural and 3 hatchery origin (Table 2). Under normal circumstances, PIT tags from Lower Granite Dam (LGRLDR) are a representative sample of wild/natural steelhead adults passing Lower Granite Dam and therefore can be used to assess the wild/natural run of steelhead into Lapwai Creek that includes arrival timing at Lower Granite Dam, arrival timing into Lapwai Creek, residency time, and dip-in behavior.
However, during the summer of 2013, the LGRLDR trap was not operational from July 11 through September 22. A preliminary analysis indicates that during the period of in-operation, approximately 7% of the PIT tagged adults destined for the Clearwater Basin were not sampled at LGRLDR. Therefore, the LGRLDR adult steelhead PIT tags may not fully represent the run timing of adults over Lower Granite Dam. The preliminary analysis also suggests that approximately 16% of the Clearwater adult steelhead were sampled at LGRLDR. Therefore, each LGRLDR PIT tagged adult represent approximately 6.25 adult steelhead.
Based on the LGRLDR adult PIT tags, the wild/natural adult steelhead that entered Lapwai creek arrived at Lower Granite Dam beginning in early-July 2013 through April of 2014 (Figure 1). Seventy percent of Lapwai Creek steelhead crossed Lower Granite Dam in October, 2013 with approximately twenty percent crossing Lower Granite Dam in the spring of 2014 (Figure 1). Arrival into Lapwai Creek began in February 2014 with the majority of the adults entering Lapwai Creek during March 2014 (Figure 1). Arrival of adults into Lapwai Creek coincided with the first large increase in stream discharge (Figure 2). Detections during the end of March and throughout May at the Lapwai Creek
3

array were dominated by downstream passages indicating post spawn adults (Figure 2). Post spawn adult steelhead were observed passing the Lapwai Creek array from mid-March through the end of April (Figure 3). In addition, one dip-in was observed, arriving and leaving on March 7 (Figure 3). Both post spawn adults and dip-ins were also observed at the Mission Creek array (Figure 4) and the Sweetwater Creek array (Figure 5). Four PIT tagged wild/natural adult steelhead were observed crossing the Webb Creek array.
The detection probability for all PIT tagged adult steelhead moving upstream at the Lapwai Creek was 0.944 and Mission creek arrays was 0.815 respectively. The detection probability for PIT tagged adult steelhead at the Sweetwater and Webb creek arrays was calculated to be 1.0. However, the operational status and operational time periods for the Sweetwater and Webb creek arrays were not assessed. It was assumed that the Sweetwater and Webb creek arrays operated normally and continuously over the entire time period of assessment. A violation of this assumption would result in an underestimate of PIT tagged adults entering Sweetwater and Webb creeks. The detection probability of downstream passages was not calculated but likely less than 1.0, therefore the number of dip-ins and post spawn adults may be underestimated. However, the available data suggest that 40 PIT tagged adults from the tagging effort at Lower Granite Dam entered and remained in Lapwai Creek for a preliminary estimated abundance of 250 wild/natural adults based on a 6.25 expansion factor (Table 3). The preliminary estimated abundance within Mission Creek was 81 wild/natural adults, 75 wild/natural adults within Sweetwater Creek, and 13 wild/natural adults within Webb Creek.
Table 3. The number of wild/natural Lower Granite Dam PIT tagged adult steelhead by array site detected moving upstream, the number leaving the site prior to spawning, the final number remaining upstream to spawn, and the approximate abundance by stream (6.25 expansion factor (1 / 0.16)).
S ite Ups tre am D ip-ins Final Ups tre am Approximate Abundance Lapwai Creek 41 1 40 250 Mission Creek 16 3 13 81
Sweetwater 14 2 12 75 Webb Creek 4 2 2 13
4

Cum
ulativ
e Pr
opor
tion
of P
IT T
ags
1.0
LGD ISEMP Steelhead PIT Tags (n=40)
0.8
0.6
Lower Granite Dam
0.4
LGRLDR trap not functioning
0.2 Lapwai Creek
0.0 Jul Sep Nov Jan Mar May
Date: 2013-2014 Figure 1. The cumulative proportion of Lower Granite Dam PIT tagged wild/natural adult steelhead by arrival date at the Lapwai Creek in-stream PIT tag array (dashed black line) and the date tagged and released at Lower Granite Dam (solid red line). The LGRLDR trap was not operational from mid-July through mid-September.
5

Figure 2. The number of observed upstream (positive blue bars) and downstream (negative red bars) daily passages of Lower Granite Dam PIT tagged wild/natural adult steelhead at the Lapwai Creek in-stream PIT tag array. Also shown is the Lapwai Creek discharge (cubic feet per second) (solid black line).
6

LGD ISEMP Steelhead PIT Tags at Lapwai Creek
Fina
l Obs
erve
d D
owns
tream
Pas
sage
Dat
e 20
14
02/03/14
02/17/14
03/03/14
03/17/14
03/31/14
04/14/14
04/28/14
02/03/14 02/17/14 03/03/14 03/17/14 03/31/14 04/14/14 04/28/14
Firs t Observed Upstream Passage Date 2014
Figure 3. The first observed upstream passage (x-axis) and the final observed downstream passage (y-axis) of Lower Granite Dam PIT tagged wild/natural adult steelhead at the Lapwai Creek in-stream PIT tag array showing post spawn adults (above 1:1 line) and dip-ins (on or near the 1:1 line).
7

LGD ISEMP Steelhead PIT Tags at Mission Creek Fi
na l O
bser
ved
Dow
nstre
am P
assa
ge D
ate
2014
2/3/14
2/17/14
3/3/14
3/17/14
3/31/14
4/14/14
4/28/14
2/3/14 2/17/14 3/3/14 3/17/14 3/31/14 4/14/14 4/28/14
Firs t Observed Downstream Passage Date 2014
Figure 4. The first observed upstream passage (x-axis) and the final observed downstream passage (y-axis) of Lower Granite Dam PIT tagged wild/natural adult steelhead at the Mission Creek in-stream PIT tag array showing post spawn adults (above 1:1 line) and dip-ins (on or near the 1:1 line).
8

LGD ISEMP Steelhead PIT Tags at Sweetwater
Fina
l Obs
erva
tion
Dow
nstre
am P
assa
ge D
ate
2014
2/17/14
3/3/14
3/17/14
3/31/14
4/14/14
4/28/14
2/17/14 3/3/14 3/17/14 3/31/14 4/14/14 4/28/14
Firs t Observed Downstream Passage Date 2014
Figure 5. The first observed upstream passage (x-axis) and the final observed downstream passage (y-axis) of Lower Granite Dam PIT tagged wild/natural adult steelhead at the Sweetwater Creek in-stream PIT tag array showing post spawn adults (above 1:1 line) and dip-ins (on or near the 1:1 line).
Array Maintenance
The Lapwai Creek PIT tag array (LAP) operated continuously without disruption during the period of July 2013 through June of 2014. The Mission Creek array had zero downtime during the same time period.
In early August, 2014 the lower antenna at Mission Creek (C2) was armored with small boulders, cobble, and gravel due to heavy scouring from spring flows. The scouring at Mission Creek is a re-occurring event for antenna C2. The antenna was moved upstream in 2013 because of scouring beneath the antenna. In addition, Lapwai Creek array was armored with large cobbles due to scouring and erosion of stream substrate along the downstream edges of all antennas. Armoring the downstream edge of the antennas with substrate is a short term solution for Mission and Lapwai Creek arrays and will likely need to occur annually. A longer term solution would require bringing in larger substrate for the downstream edge of the antennas or reinstalling the antennas deeper into the existing substrate.
9
