2013 - university of...
TRANSCRIPT

2013 Annual Report
March 6, 2014

1
University of Louisville Micro/Nano Technology Center Annual Report
FY2013
Dr. Kevin Walsh, Director Dr. Shamus McNamara, Associate Director
Dr. Julia Aebersold, Manager Wendy S. Metcalf, Administrative Associate
Don Yeager, Technical Staff and Facilities Coordinator Dr. Xiaojin Wang, Senior Process Engineer
Curtis McKenna, Research Engineer Scientist and Outreach Coordinator Dr. Evgeniya Moiseeva, Post Doc Scholar
Mary Watson, Administrative Assistant
INTRODUCTION The University of Louisville Micro/Nano Technology Center (MNTC) is a university-recognized recharge service center established in 2004. The MNTC consists of a $30M 10,000 ft
2 cleanroom facility for the fabrication of novel materials and
devices, a 1,000 ft2 packaging and characterization lab and a 300 ft
2 design, layout and simulation lab. This diverse multi-
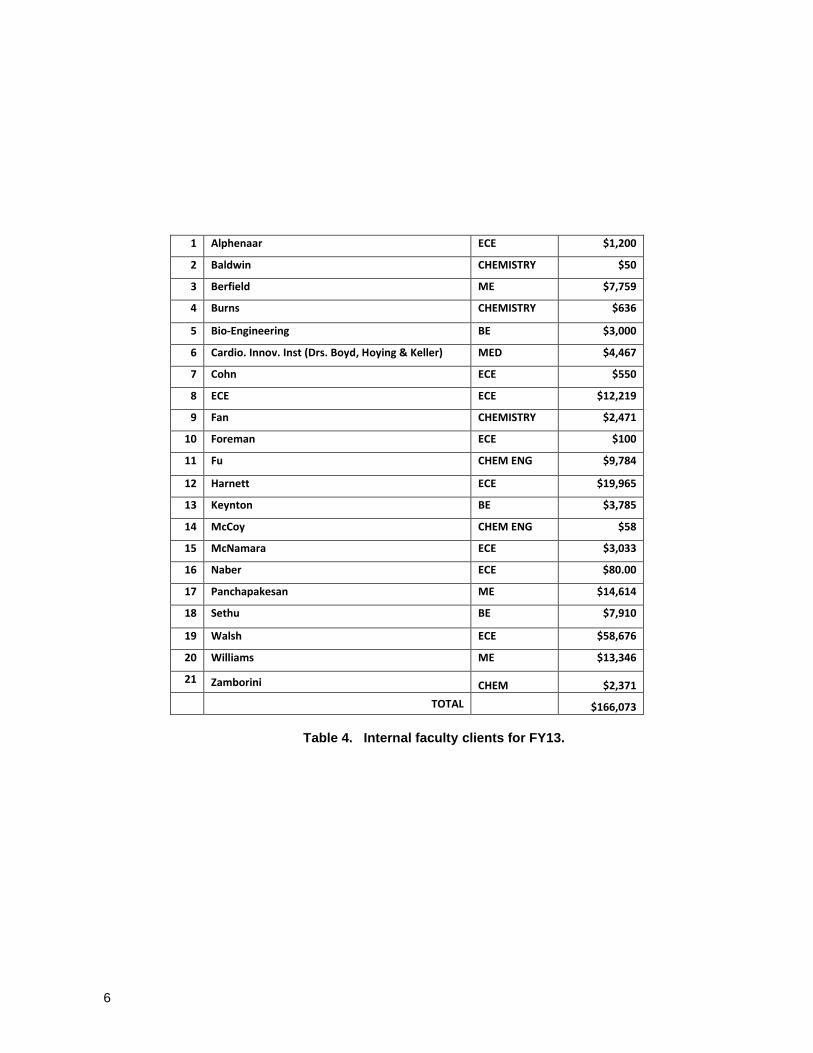
user core facility is utilized for research, teaching and to extend microfabrication services to internal and external clients in Kentucky and throughout the nation. This document serves as its official annual report for the fiscal year ending June 30, 2013. Below are the summarized financial and operational activities for the UofL MNTC during that period. FINANCIAL SUMMARY The MNTC ended FY13 with a surplus of $19,626 (Table 1) compared to a deficit of $16,498 in FY12. Details of the financial year are listed below. Table 1 presents the itemized breakout of expenditures and income for the MNTC for FYE 6/30/13. Expenditures for FY13 were $213,664 with revenues of $233,289 resulting in a $19,626 surplus. The largest expenditures consumed by the cleanroom were liquid nitrogen ($53K), laboratory supplies ($49K) and equipment maintenance ($31K). The university continues to charge an administrative fee of 10% of expenses which came to $16K for FY13. Not captured in the MNTC Balance Sheet from Table 1 is the “staff subsidy” or funds the UofL MNTC receives through the Speed School of Engineering (SSE) to support staff salaries. CAR funding (continuing annual resources or “hard money”) is provided by the SSE for an administrative position (Wendy Metcalf), three technical support positions (Don Yeager , Mike Martin, and Curt McKenna) and a managerial position (Julia Aebersold). In total, the 5 staff positions totals approximately $261k of salary support and fringe benefits (Table 2). Table 3 details unsubsidized salary and fringe benefits ($20,444) which are supported directly by MNTC revenues. All of this technical and administrative support is vital for the safe operation and financial success of the MNTC because, unlike most other multi-user core facilities, the UofL MNTC operates all of its ~$20M of capital equipment without any annual maintenance contracts. Instead, we rely on our trained technical staff to maintain tools and operations, ensure personal safety, provide ongoing training to all cleanroom clients and perform processing services for a majority of the MNTC’s external clients. Although the number of staff in the UofL MNTC is relatively low compared to other comparably-sized cleanroom facilities (for example, the University of Michigan cleanroom has a staff of over 20), we remain confident in our ability to deliver both safe operations and a high-quality research experience for our many users. Revenue for the MNTC generated by quarter for FY13 is shown in Figure 1, with a summary of internal and external income for the fiscal year in Figure 2. A breakdown of total revenue ($233,289) shows that 71% or $166,073 came from internal clients and 29% or $67,217 from external clients. A list of internal faculty along with their department affiliation and revenue contribution appears in Table 4 and Figure 3. For FY13, the MNTC had an impressive 21 faculty from 7 departments use the facility. Figure 4 presents a breakdown of internal revenue by department, showing the largest percentage was generated by ECE faculty at 39%. A list of our 25 external clients for FY13 appears in Table 5, combining for $67,217 of external revenue (Figure 5). Table 6 presents a comprehensive list of all 69 MNTC internal users for FY13 which consisted

2
of 21 faculty, 45 students/post-docs/engineers, and 3 teaching assistants (TAs). In total, an impressive 94 clients accessed the UofL MNTC in FY13. This number excludes the approximate 25 students enrolled in the 3 Microfab/MEMS classes which also utilized the cleanroom for teaching. Figure 6 presents a nice comparison of MNTC internal and external income for the last 10 years (from FY04 to FY13). In FY10 and FY11 MNTC revenues began to decline for the first time in part due to the difficulties of internal faculty winning federal grants as the government reduced spending. In FY12, the MNTC hired a new manager, Dr. Julia Aebersold, with the goal of increasing external business and re-engaging internal users. Consequently, revenues have increased steadily since that operational change. External revenue is up a dramatic 222% ($46,374) since FY11, and internal revenue is up 23% ($30,748). Figure 7 details MNTC operational expenses during that same time period, illustrating our overall revenue-neutral operation for the last 10 years. Figure 8 presents accumulative income from FY04 to FY13 for internal clients ($1,334.007). The top 6 faculty clients of the MNTC are Dr. Walsh of ECE ($342k), Dr. Keynton of BE ($100k), Dr. Cohn of ECE ($99k), Dr. Harnett of ECE ($89k), Dr. Alphenaar of ECE ($86k), and Dr. McNamara ($79k). Figure 9 presents total internal income ($1,334,090) by department since FY04. The dominant department continues to be ECE at $755,487 (57%), followed by BE (12%), ME (12%), Physics (8%), and Chemical Engineering (3%). Figure 10 shows the number of departments, faculty, students, post docs and researchers who have annually used the cleanroom since FY06. In the spring of 2012 a new fee structure was implemented that charged clients per process along with an access fee to cover costs of gowning. As a result, the number of FY13 users decreased slightly - 57 students/post-docs/researcher to 45, 22 faculty users to 21, 9 departments to 7 for FY13. While this trend was concerning, access data in FY14 indicates a reversal of this trend due to acceptance and approval of the new fee structure. With a more objective and concrete fee structure, we were also able to list our rates on the web, which has helped business. Figure 11 shows total grant revenue awarded to the University of Louisville that directly used the MNTC core facility since 2001. This amount is an impressive $59M with 33% originating from the Department of Defense and 23% from the University of Kentucky Research Foundation (i.e. KY NSF EPSCoR Program which is managed by UK). This produces an impressive 10 year average of approximately $6M/yr of income, which correlates to over 1/3 of SSE's overall research funding. A significant portion of this funding would not have been possible without the unique resources of the MNTC and its cleanroom facility. Table 7 highlights the tremendous leveraging ability of the MNTC core facility. In FY13, user fees of $125,277 were generated from 31 grants totaling $13.9M, resulting in a multiplication factor to the University of 111 to 1 for the MNTC core facility! In conclusion, on behalf of the entire MNTC personnel, we wish to thank all the individuals who have supported and continue to support the micro/nano initiative at the University of Louisville.

3
EXPENDITURES SALARIES AND BENEFITS (S&B) Student 858.00
Temp 18,069.94 Health Insurance 133.76 FICA 1,382.36
20,444.06 SUPPLIES AND EXPENSES (S&E) Out -Of-State Air 331.80
Out -Of-State Hotel 808.76 Out -Of-State Misc. 437.84 Employee Recruitment 1,994.20 Laboratory 49,815.75 Chemicals 12,900.06 Compressed Gas (cylinders) 367.87 Liquid Nitrogen 53,870.45 Demurrage 2,005.22 Office Supplies 648.35 Instructional & Training 90.08 Software 431.74 Stockroom 150.19 Meeting 436.41 Maintenance Supplies 6,294.87 Computer 854.97 Criminal Background Checks 40.10 Freight 571.16 Overnight and Grant Mailings 1,999.47 Postal Service 196.75 IT-iTech Xpress 38.00 IT-Printing Svcs 658.00 IT-Copy Finishing Svcs 96.00 IT-Color Copies 90.00 IT-Long Distance & Grnt Appr. 100.02 IT-Cellphone Charges 809.09 IT-Pre Print Design 40.00 Physical Plant Services 2,300.67 IT-Network Base Infrastructure 1,932.00 IT-Install -Network Base Infra 75.00 Equipment Maint 31,205.50 IT Internal Print/Copy Usage 33.90 Computer Maint 99.95 Registration 695.00 Dues & Memberships 69.60 Parking 3.50 Promotional Activities 3,713.04 Business Meals 34.00 Publicity & Promotion 250.00 Prizes & Awards 75.55 UL Administrative Fee 16,654.71
TOTAL EXPENDITURES 213,663.63 INCOME USER FEES External $67,216.48
Internal $166,072.85
$233,289.33 Surplus $19,625.70
Table 1. The MNTC balance sheet for FY13.

4
Julia W. Aebersold
01530
75,000.00
Michael D. Martin GB100477 IB111308 E1239 E0372 53,001.00
Curtis P. McKenna
CS120662A E1259
43,282.32
Wendy S. Metcalf
1026823 E1259 E0372 37,411.00
Donald H. Yeager
01530
53,136.96
TOTAL
261,831.28
Table 2. Salary subsidy from SSE for FY13.
Table 3. Salary expenses supported by the MNTC for FY12.
Payroll Detail For: S0083 FY13
Salary Fringe Total
Grothaus, Caitlin (Temp) 9,323.67 786.30 10,109.97
Moiseeva, Evgeniya (Temp) 3,849.62 307.62 4,157.24
Ratnayake, Dilan (Temp) 858.00 15.35 873.35
Watson, Mary (Temp) 4,896.65 406.85 5,303.50
TOTAL 18,927.94 1,516.12 20,444.06

5
Figure 1. Internal and external revenue generated each quarter for FY13.
Figure 2. Total internal and external revenue generated in FY13.
0
10,000
20,000
30,000
40,000
50,000
60,000
1st Qtr 2nd Qtr 3rd Qtr 4th Qtr
27,735 27,464
53,591 57,283
9,419 5,482
37,498
14,819
Internal
External
166,073, 71%
67,217, 29%
Internal
External
Total Amount of Revenue = $233,289
Total Amount of Internal Revenue = $166,073 Total Amount of External Revenue = $67,217
Total Amount of Revenue = $233,289
6
1 Alphenaar ECE $1,200
2 Baldwin CHEMISTRY $50
3 Berfield ME $7,759
4 Burns CHEMISTRY $636
5 Bio-Engineering BE $3,000
6 Cardio. Innov. Inst (Drs. Boyd, Hoying & Keller) MED $4,467
7 Cohn ECE $550
8 ECE ECE $12,219
9 Fan CHEMISTRY $2,471
10 Foreman ECE $100
11 Fu CHEM ENG $9,784
12 Harnett ECE $19,965
13 Keynton BE $3,785
14 McCoy CHEM ENG $58
15 McNamara ECE $3,033
16 Naber ECE $80.00
17 Panchapakesan ME $14,614
18 Sethu BE $7,910
19 Walsh ECE $58,676
20 Williams ME $13,346
21 Zamborini CHEM $2,371
TOTAL
$166,073
Table 4. Internal faculty clients for FY13.

7
Figure 3. Internal clients by amount and percentage for FY13.
Figure 4. Internal revenue from departments by amount and percentage for FY13.
Alphenaar, 1,200, 1%
Baldwin, 50, 0%
Berfield, 7,759, 5%
Bio-Engineering,
3,000, 2% Burns, 636, 0%
Cardio. Innov. Inst, 4,467, 3%
Cohn, 550, 0%
ECE, 12,219, 7%
Fan, 2,471, 1%
Foreman, 100, 0% Fu, 9,784, 6%
Harnett, 19,965, 12%
Keynton , 3,785, 2% McCoy, 58, 0% McNamara, 3,033,
2%
Naber, 80, 0%
Panchapakesan, 14,614, 9%
Sethu , 7,910, 5%
Walsh, 58,676, 35%
Williams, 13,346, 8%
Zamborini, 2,371, 1%
BE, 24,020, 15% CHEM, 2,800, 2%
CHEM ENG, 14,120, 9%
ECE, 61,432, 39%
GEOG, 640, 1%
ME, 37,845, 24%
MED, 2,167, 1% PHYSICS, 13,200, 8%
SPD RSCH, 1,733, 1%
Total Amount of Internal Revenue = $166,073

8
1. AC-Forensics, Inc. 566.00
2. Advanced Semiconductor 188.00
3. ALCAVIS HDC 210.00
4. Aslan, Mustafa 6,721.60
5. Birck Nanotechnology Center 362.00
6. Brockman-Hastings LLC 4,211.00
7. Ducommun 1,723.03
8. Hastings 138.52
9. Honeywell, Inc. 7,706.00
10. Lenox Laser 402.00
11. Matt Dieruf 250.00
12. Moxtek 19,123.50
13. Nauganeedles, LLC 9,456.00
14. Promerus, LLC 2,031.69
15. PureLight Labs, LLC 3,064.00
16. QuSwami, Inc. 4,409.16
17. Science Exchange 128.00
18. The MicroWerks, LLC 2,255.00
19. UK-Boyd 137.74
20. UK-Li 292.94
21. UK-May 453.72
22. UK-Shin 479.58
23. UK-Trinkle 774.07
24. University of Minnesota, NFC 877.75
25. Western Kentucky University 1,255.18
Table 5. External clients for FY13.
Total Amount of External Revenue = $67,217

9
Figure 5. External clients by amount and percentage in FY13.
Advanced Semiconductor,
188.00, 0%
ALCAVIS HDC,
210.00, 0%
Aslan, Mustafa,
6,721.60, 10%
Birck Nanotechnology
Center, 362.00, 1%
Brockman-Hastings
LLC, 4,211.00, 6% Ducommun,
1,723.03, 3%
Hastings, 138.52, 0%
Honeywell, Inc., 7,706.00,
12%
Lenox Laser, 402.00, 1%
Matt Dieruf, 250.00, 0%
Moxtek, 19,123.50, 29%
Nauganeedles, LLC,
9,456.00, 14%
Promerus, LLC,
2,031.69, 3%
PureLight Labs,
LLC, 3,064.00, 5%
QuSwami, Inc., 4,409.16, 7%
Science Exchange,
128.00, 0%
The Micro Werks,
LLC, 2,255.00, 3% UK-Boyd,
137.74, 0%
UK-Li,
292.94, 0%
UK-May, 453.72,
1%
UK-Shin,
479.58, 1%
UK-Trinkle,
774.07, 1%
Univerisity of
Minnesota, NFC,
877.75, 1%
Western
Kentucky
University, 1,255.18, 2%
Total Amount of External Revenue = $67,217

10
Faculty Advisors Department Students/Post Docs/Researchers Dr. Bruce Alphennar ECE Abeyweera Buddika K
Dr. Richard Baldwin CHEM Beharic Jasmin
Dr. Thomas Berfield ME Benken Alex
Dr. Chris Burns CHEM Boden Seth
Bioengineering BE Burkhead Thomas
*Cardiovascular Innovation Institute School of Med Chen Jubin
* Dr. Nolan Boyd School of Med Crain Mark
* Dr. James B. Hoying School of Med Cuba Garcia Vasili
* Dr. Brad Keller School of Med Estrada Rosendo
Dr. Robert Cohn ECE Faiz Abderrazzak
Electrical & Computer Engineering ECE Faul Andre
ECE 544 ECE Heacox Kurtis
Dr.Theresa Fan CHEM Hopkins K.
Dr. Chris Foreman ECE Khosravi Farhad
Dr. Xiaoan Fu CHEM ENG King Benjamin C.
Dr. Cindy Harnett ECE Li Mingxiao
Dr. Robert Keynton BE Lin Ji-Tzuoh (George)
Rodica McCoy CHEM ENG Long Juexuan
Dr. Shamus McNamara ECE Loomis Robert J.
Dr. John Naber ECE Lucas Thomas
Dr. Balaji Panchapakesan ME Marei Mohamed
Dr. Palaniappan Sethu BE Martin Michael D.
Dr. Kevin M. Walsh ECE Miller Kane J.
Dr. Stuart Williams ME Moiseeva Evgeniya V.
Dr. Francis Zamborini CHEM Nguyen Dung M.
Ogunwale Mumiye A,
Osborne Christopner
Pantibandla Phani Kumar
Parichehreh Vahidreza
Phelps Isaac J
Porter Daniel
Ratnayake Dilan
Rinehart Sean M
Senousy Yehya
Smith Daniel
Smith Scott
Snatchko Bryan R
Sun Xinghua
Trada Hiren V.
Velasco Vanessa
Wolf Rob
Wolsiefer Amanda I
Xu Peng
Yuan Hanwen
Zhu Li
Table 6. A summary all internal users for FY13.

11
Total Internal Income = $1,334,090 Total External Income = $373,054
Total Income = $1,707,144
Figure 6. Annual comparison of internal and external income from FY04 through FY13.
Total Other Expenses = $1,321,214
Total Salary = $367,917 Total Expenses = $1,689,131
Figure 7. Annual comparison of operational and salary expenses for FY04 through FY13.
0
50,000
100,000
150,000
200,000
250,000
300,000
FY04 FY05 FY06 FY07 FY08 FY09 FY10 FY11 FY12 FY13
24,000
117,915
49,755
168,833 170,628 177,232
166,362
135,325 157,957
166,073
48,474
18,047
69,681
87,615
16,428 15,661 5,316
20,843 23,772
67,217 72,474
135,962
119,436
256,448
187,056 192,893
171,678 156,168
181,729
233,290
Int. Income
Ext. Income
Total
0
50,000
100,000
150,000
200,000
250,000
300,000
FY 04 FY 05 FY 06 FY 07 FY 08 FY 09 FY 10 FY 11 FY 12 FY13
7,378
33,095
76,370
158,532
189,349
165,475
130,837
184,137 182,820 193,220
19,665
42,914 52,966
65,211
80,740
38,222
10,682 21,834
15,241 20,444 27,043
76,009
129,336
223,743
270,089
203,697
141,519
205,971 198,061
213,664
Non-salary Expenses
Salary
Total

12
Figure 8. Cumulative income for internal clients from FY04 through FY13.
Alphenaar , $86,300, 6%
Amini, $1,497, 0%
Baldwin, $11,060, 1%
Beachy, $2,274,
0%
Berfield , $31,694, 2%
Bertocci, $550, 0%
Bradshaw, $5,500, 0%
Brown, $102, 0%
Burns, $636, 0%
Cardio. Inn. Inst., $6,634, 0%
Cohn, $99,800, 7% Fan, $2,471, 0%
Foreman, $100, 0%
FU, $45,954, 3%
Gamini, $32,650, 2%
Giridharan, $896, 0%
Gobin, $1,650, 0%
Grapperhaus, $171, 0%
Gupta, $2,016, 0%
Hadizadeh, $1,240, 0%
Harnett, $89,476, 7%
Higashi, $4,219, 0%
Hnat, $25,553, 2%
Keynton, $100,918, 8%
Kielkopf, $11,566, 1%
Mashuta, $86, 0% McCoy, $58, 0%
McNamara, $79,238, 6%
Mendes, $68,705, 5%
Naber, $9,448, 1%
Panchapakesan , $51,849, 4%
Parola, $2,840,
0%
Prough, $20,000, 1%
Sethu, $57,010, 4%
S0030 Bal. Transf.,
$1,450, 0%
Spd - BioEngineering, $3,000, 0%
Spd - ECE, $34,754,
3%
Speed School, $27,812, 2%
Starr, $1,931, 0%
Stolowich , $314, 0%
UGIM, $11,014, 1%
Walsh, $342,575, 26%
Williams, $39,001, 3% Willing, $659, 0%
Yazadanpanah , $10,850, 1%
Zamborini , $6,571, 0%
Total Accumulative Internal Revenue since FY04 = $1,334,090

13
Figure 9. Cumulative internal income by department from FY04 through FY13.
BE, $163,474, 12%
BIOCHEM, $20,000, 1%
CHEM ENG., $46,671, 3%
CHEM, $25,527, 2%
ECE, $755,487, 57%
EDUC., $102, 0%
GEOGRAPHY, $1,240, 0%
MECH ENG., $154,147, 12%
MED, $6,634, 0%
PHARM, $2,016, 0%
PHYSICS, $112,921, 8%
SCH OF PUB HLTH, $2,274, 0%
STEAM INST., $2,840, 0%
SPD RESEARCH, $1,931, 0%
SPD SCHOOL, $27,812, 2%
UGIM, $11,014, 1%
Total Accumulative Internal Revenue since FY04 = $1,334,090

14
Students/Post Docs/Researchers Faculty/Advisors
Academic Depts.
FY 06 20 9 4
FY 07 38 14 7
FY 08 47 23 11
FY 09 54 15 5
FY 10 70 14 6
FY 11 51 12 7 FY 12 57 22 9
FY 13 45 21 7
Figure 10. Cleanroom access from FY06 through FY13.
20
38
47
54
70
51
57
45
9
14
23
15 14 12
22 21
4 7
11
5 6 7 9
7
0
10
20
30
40
50
60
70
80
FY06 FY07 FY08 FY09 FY10 FY11 FY12 FY13
Students/Post Docs/Researchers
Faculty/Advisors
Academic Depts.

15
Figure 11. Accumulative grant funding utilizing the MNTC from October 2001 through FY13.
US Air Force Research
Laboratory, $499,905, 1%
American Chemical Society, $200,000, 0% Bill & Melinda Gates
Foundation, $484,000, 1%
Department of Health & Human Services, $1,672,062, 3%
DOD, $19,537,226, 33%
DOE, $1,780,802, 3%
DOJ, $500,000, 1%
EPA, $1,341,200, 2%
Federal Contractor 1, $1,362,467, 2%
Honda Research Institute
United States, $532,240, 1%
Ky Council on Postsecondary Ed.,
$842,592, 1%
Ky Science & Engineering Foundation, $609,961, 1%
Ky Science & Technology Corp.,
$180,000, 0% KyEPSCor, $602,180, 1%
LECO Corporation, $71,939, 0%
NASA, $2,208,792, 4%
National Heart Association, $77,000, 0%
National Inst. For Hometown Sec., $1,610,350, 3%
NIH, $2,233,638, 4%
NSF, $7,542,707, 13%
Oregon State
University, $226,529,
0%
Purdue University/NIH,
$62,000, 0%
Startups, $678,252,
1%
S.W.R.I., $193,253,
0%
Universal Technology
Corporation, $18,025, 0%
University of Akron, $169,311, 0%
University of Arizona, $169,538, 0%
University of Kentucky Res. Fdn., $13,455,747, 23%
Wallace H. Coulter Foundation, $118,600, 0%
Western Ky University,
$21,000, 0%
Total Grant Dollars: $59,001,317

16
Table 7. U of L sponsored research utilizing the MNTC in FY13.
Speedtype Funding Source Grant Agency Fac. PI Dept Title Start Date End Date
Total Grant Dollar Amount
Total Amt. to Service Center
Alphenaar GB090532 Grant NSF Alphenaar Alphenaar ECE Enhancement of Exciton Dissociation in Organic Solar Cell 9/1/2009 8/31/2013 339,048.00 1,100.00
Alphenaar GB120197 Grant Kentucky Science & Technology Cor Alphenaar Alphenaar ECE Commercialization of the Ambi-Harv Energy Harvesting Mod 10/1/2011 9/30/2012 75,000.00 100.00
Berfield GB110924 Grant NSF Berfield Berfield ME Micro-Patterning Through Mechanics and Cracking of Drying 9/1/2011 8/31/2014 250,000.00 7,759.00
Burns GB100490 Grant American Chemical Society Burns Burns Chemistry Periodic MesoporousSilicas as Supports for Late Metal 8/1/2010 8/31/2013 100,000.00 456.00
Cohn GB080292 Grant National Inst. For Hometown Sec. Cohn Cohn ECE Optical Alarm for Defense of Critical Infrastructure 4/3/2009 6/30/2013 1,610,350.00 550.00
Fan GB130027B1 Grant Ky Council on Postsecondary ED Fan Miller MED KLCRP FY13 and FY14 Funding-Early Detection 10/1/2012 6/30/2014 842,592.47 2,471.00
Fu GB111304B Grant Bill & Melinda Gates Foundation Fu Graham Microbiology
Disposable sampling plate andf breath test to patients 10/13/2011
12/31/2013
48,400.00 8,419.00
Harnett GB090786 Grant Kentucky Science & Engineering Fdn. Harnett Harnett ECE Computer Aided Optimal Design of a MicroFluidic Coulter 7/1/2009 9/30/2012 99,943.00 4,306.00
Harnett GB101062 Grant Oregon State University Harnett Harnett ECE Characterizing the Phytoplankton Component of Oceanic Pa 9/1/2010 7/31/2013 226,529.00 835.00
Harnett GB110782 Grant Kentucky Science & Engineering Fdn.
Harnett Harnett ECE Emerging Ideas: Light-Powered Hybrid Microactuators for 7/1/2011 9/30/2014 90,000.00 4,048.00
Harnett GB120654 Grant University of KY Res Fdn Gobin Gobin BE Engineering Platforms for Exploring Cellular (Federal) 9/1/2008 8/31/2013 712,473.00 1,036.00
Harnett GB120654A Grant University of KY Res Fdn Harnett Gobin BE Engineering Platforms for Exploring Cellular (State) 9/3/2011 8/31/2013 196,062.00 2,014.00
Hoying GB101087 Grant University of Arizona Hoying Hoying CII Theoretical and Experimental Investigations of Architect 8/1/2010 7/31/2012 169,538.00 3,162.00
Keynton GB101259 Grant NASA Keynton Keynton BE Diagnosing & Mitigating Human Exposure to Radiation 9/1/2010 8/31/2012 2,000,000.00 435.00
McNamara GB110376 Grant NIH Panchapakesan Panchapakesan ME Nanotube Antibody for Profiling Circulating Disease 8/9/2011 7/31/2014 422,722.00 1,450.00
McNamara GB111027 Grant NSF McNamara McNamara ECE Nano-Porous Thermoelectric Based Knudsen Gas P 9/1/2011 8/31/2014 289,249.00 165.00
McNamara GB120654A Grant University of KY Res Fdn McNamara Gobin BE Engineering Plateforms for Exploring Cellular (State) 9/3/2011 8/31/2013 196,062.00 2,868.00
Panchapakesan GB110376 Grant NIH Panchapakesan Panchapakesan ME Nanotube Antibody for Profiling Circulating Disease 8/9/2011 7/31/2014 422,722.00 3,070.00
Panchapakesan GB120456 Grant NSF Panchapakesan Panchapakesan ME GOAL 1: High Aspect Ration Nano-Needle Integrated Standin 6/1/2012 5/31/2015 353,004.00 510.00
Panchapakesan GB121045 Grant NSF Panchapakesan Panchapakesan ME Scalable Nanomanufacturing of nano-carbon based composite
9/1/2012 8/31/2016 353,054.00 230.00
Sethu GB111336 Grant University of Akron Sethu Sethu BE A Novel, In vitro Platform for Correlating and Quantifying 5/1/2012 4/30/2015 169,311.00 895.00
Sethu GB120654A Grant University of KY Res Fdn Sethu Gobin BE Engineering Plateforms for Exploring Cellular (State) 9/3/2011 8/31/2013 196,062.00 7,910.00
Sunkara GB120700 Grant University of KY Res Fdn McCoy Sunkara Chem Eng DOE EPSCoR Renewal: Nanoscale Materials and Architecture 7/15/2011 7/14/2014 1,128,000.00 58.00
Walsh GB120662A Grant University of KY Res Fdn Walsh Walsh ECE (STATE) KY nanoNet: A Statewide Integrative Micro/Nano 9/1/2011 12/31/2013
125,475.00 125.00
Walsh IB111308 Contract Federal Contractor 1 Walsh Walsh ECE MEMS Sensor Research 1/9/2012 3/11/2014 1,362,467.00 55,380.50
Walsh IB130440 Contract Universal Technology Corporation Walsh Walsh ECE Photonic Heterodyne Detector 11/16/2012
8/15/2013 18,025.00 3,737.00
Williams GB110798 Grant Kentucky Science & Engineering Fdn.
Williams Williams ME Dielectrophoretic Nanoneedles for Trapping and Character 7/1/2011 6/30/2013 80,000.00 3,105.00
Zamborini GB090171 Grant National Science Fdn Zamborini Zamborini Chem Electrochemical Oxidation and Sensing/Molecular Electron 7/1/2009 2/28/2013 330,000.00 1,021.00
Zamborini GB110497 Grant American Chemical Society Zamborini Zamborini Chemistry Electrochemically Controlled Alkene Binding Affinity Of 8/1/2011 8/31/2014 100,000.00 1,349.00
Zhang GB081337 Grant NIH Zhang Zhang Chemistry Mass Informatics for Two Dimensional Gas Chromatography 5/1/2009 4/30/2014 1,388,194.00 228.00
Zhang IB120773 Contract LECO Corporation Zhang Zhang Chemistry Development of Peak Alignment Methods for High-Resolution
4/1/2012 3/31/2013 71,939.00 370.50
13,962,281.47 125,277.00