2013 q2 quarterly software market review - shea & company
TRANSCRIPT

Shea & Company, LLC
www.shea-co.com
Member FINRA & SIPC
Copyright ©2013
Boston
200 Clarendon Street, Floor 25
Boston, MA 02116
Michael H.M. Shea
Managing Director
617.896.2255
Christopher J. Pingpank
Principal
617.896.2218
Brad E. McCarthy
Vice President
617.896.2245
San Francisco
201 Mission Street, Suite 1850
San Francisco, CA 94105
Michael S. Barker
Managing Director
415.203.5286
Quarterly Enterprise Software Market Review 2Q 2013

Copyright ©2013 Shea & Company, LLC 1
Contents
M&A Activity
Software M&A Summary: 2Q 2013 p. 2
Software Acquisitions: Trend Analysis p. 3
Publicly-Available Software M&A Transaction Data: 2Q 2013 p. 4
Announced Software Acquisitions: 2Q 2013 p. 5
Most Active Software Acquirers: 2007 – 2013 p. 9
Public Equity Market Valuations
Relative Performance by Index p. 17
Price Performance and Valuation Metrics by Segment p. 18
Price Performance and Valuation Metrics of Notable Software Vendors p. 19
Equity Trading Multiples by Growth Tranche p. 20
Equity Trading Multiples by Segment p. 21
Equity Trading Multiples by Comparable Subset p. 27
Public & Private Equity Financing Activity
Software IPOs: Trailing Twelve Months p. 30
Software IPO Pricing & Performance Data p. 31
Software IPO Pipeline p. 32
Software Private Capital Raise Activity: 2Q 2013 p. 33

Copyright © 2013 Shea & Company, LLC 2
M&A Activity Software M&A Summary: 2Q 2013
Notable Announced Transactions: 2Q 2013 ($ millions)
Source: Company releases, Wall Street research
Acquirer
Target
Date 04/22/13 05/06/13 05/06/13 05/20/13 05/28/13 06/04/13 06/24/13 06/27/13
Enterprise Value $155 $6,900 $389 $903 $2,900 $2,399 $395 $600
EV / 2013 Rev n/a 3.1x n/a 2.5x n/a 6.3x 3.2x n/a
EV / 2014 Rev n/a 3.0x n/a 2.4x n/a 5.3x 3.0x n/a
NASDAQ
$1.5
$14.4
$4.4
$9.7
$4.8
$19.5 $19.2
$8.5
$2.5
$9.8
$23.1
$10.1
$6.7
$11.7
$6.3 $7.5
$2.6
$18.4
$-
$10
$20
$30
Q1 Q2 Q3 Q4 Q1 Q2 Q3 Q4 Q1 Q2 Q3 Q4 Q1 Q2 Q3 Q4 Q1 Q2
2009 2010 2011 2012 2013
An
no
un
ce
d D
ea
l V
alu
e (
$b
n)
Transaction Count by Deal Size
> $1bn 0 3 1 3 2 6 5 2 0 3 6 4 2 3 3 2 1 3
$500m - $1bn 1 1 1 2 0 4 3 3 0 1 1 1 1 2 0 3 0 5
$250m - $500m 1 0 1 2 1 6 3 3 2 8 4 2 5 3 3 1 0 3
< $250m 16 34 27 23 27 30 26 26 32 25 24 30 26 26 25 28 28 21
No Reported Value 70 51 62 37 79 59 93 45 68 49 47 92 85 94 93 105 103 118
Total 88 89 92 67 109 105 130 79 102 86 82 129 119 128 124 139 132 150
Copyright ©2013 Shea & Company, LLC 3
M&A Activity
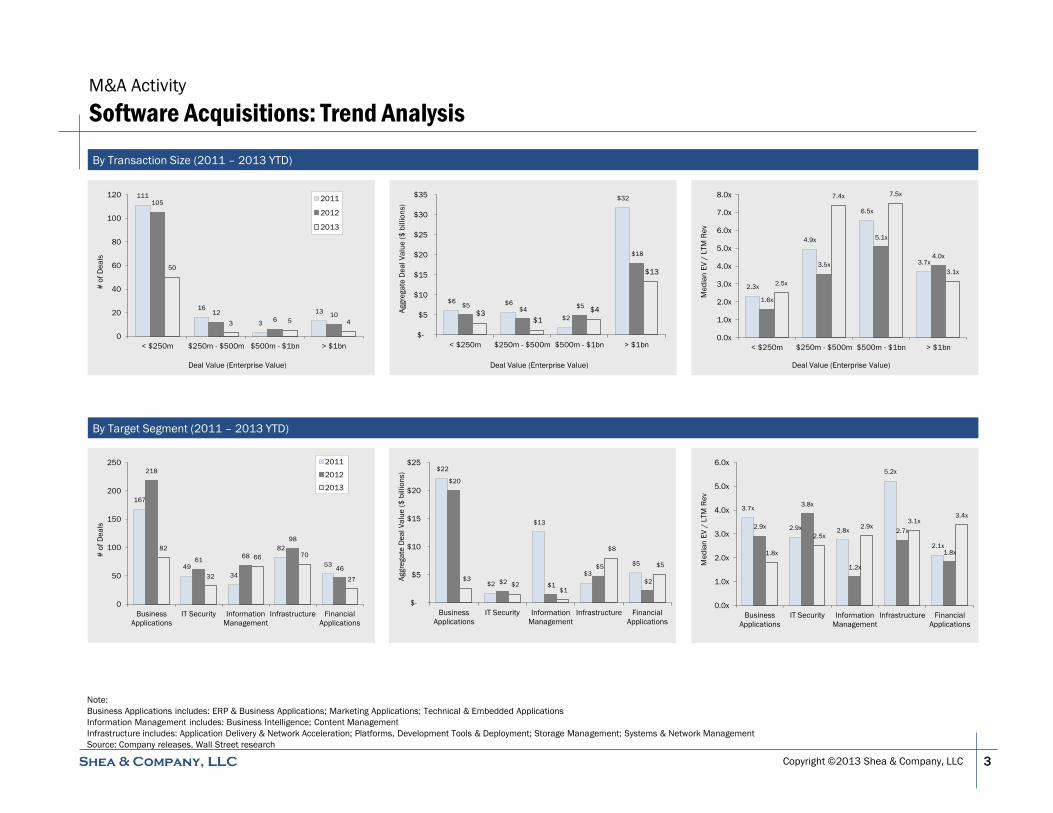
Software Acquisitions: Trend Analysis
By Transaction Size (2011 – 2013 YTD)
By Target Segment (2011 – 2013 YTD)
Note:
Business Applications includes: ERP & Business Applications; Marketing Applications; Technical & Embedded Applications
Information Management includes: Business Intelligence; Content Management
Infrastructure includes: Application Delivery & Network Acceleration; Platforms, Development Tools & Deployment; Storage Management; Systems & Network Management
Source: Company releases, Wall Street research
111
16
3
13
105
12 6
10
50
3 5 4
0
20
40
60
80
100
120
< $250m $250m - $500m $500m - $1bn > $1bn
# o
f D
ea
ls
Deal Value (Enterprise Value)
2011
2012
2013
$6 $6
$2
$32
$5 $4
$5
$18
$3 $1
$4
$13
$-
$5
$10
$15
$20
$25
$30
$35
< $250m $250m - $500m $500m - $1bn > $1bn
Aggre
ga
te D
ea
l V
alu
e (
$ b
illio
ns)
Deal Value (Enterprise Value)
2.3x
4.9x
6.5x
3.7x
1.6x
3.5x
5.1x
4.0x
2.5x
7.4x 7.5x
3.1x
0.0x
1.0x
2.0x
3.0x
4.0x
5.0x
6.0x
7.0x
8.0x
< $250m $250m - $500m $500m - $1bn > $1bn
Me
dia
n E
V /
LTM
Re
v
Deal Value (Enterprise Value)
167
49
34
82
53
218
61 68
98
46
82
32
66 70
27
0
50
100
150
200
250
Business
Applications
IT Security Information
Management
Infrastructure Financial
Applications
# o
f D
ea
ls
2011
2012
2013
$22
$2
$13
$3
$5
$20
$2 $1
$5
$2 $3 $2
$1
$8
$5
$-
$5
$10
$15
$20
$25
Business
Applications
IT Security Information
Management
Infrastructure Financial
Applications
Aggre
ga
te D
ea
l V
alu
e (
$ b
illio
ns)
3.7x
2.9x 2.8x
5.2x
2.1x
2.9x
3.8x
1.2x
2.7x
1.8x 1.8x
2.5x
2.9x 3.1x
3.4x
0.0x
1.0x
2.0x
3.0x
4.0x
5.0x
6.0x
Business
Applications
IT Security Information
Management
Infrastructure Financial
Applications
Me
dia
n E
V /
LTM
Re
v

Copyright ©2013 Shea & Company, LLC
M&A Activity
Publicly-Available Software M&A Transaction Data: 2Q 2013
4
Note:
Includes only transactions for which data was publicly available
P/E multiples in excess of 100x or less than 0x are considered to be not meaningful
Source: Company releases, Wall Street research
2Q 2013 ($ millions)
Consideration Equity Enterprise EV / Revenue P/E Ratio
Date Target Acquirer % Cash % Stock value value LTM Current yr Fwd yr Current yr Fwd yr
06/27/13 Neolane Adobe 100% - - $600 8.6x - - - -
06/24/13 Keynote Systems Thoma Bravo 100% - $369 $395 3.2x 3.2x 3.0x 32.4x -
06/20/13 Composite Software Cisco Systems 100% - - $180 - - - - -
06/17/13 Panopticon Software AB Datawatch - 100% - $31 - - - - -
06/17/13 Veramark Technologies Hubspoke 100% - - $11 0.7x - - - -
06/04/13 ExactTarget Salesforce.com 100% - $2,500 $2,399 7.5x 6.3x 5.3x nm nm
06/03/13 ISS Group P2 Energy Solutions 100% - - $43 2.0x - - - -
05/29/13 Apriso Dassault Systemes 100% - - $205 4.1x - - - -
05/29/13 JouleX Cisco Systems 100% - - $107 - - - - -
05/28/13 Lender Processing Services Fidelity National Financial 50% 50% - $2,900 1.5x - - - -
05/22/13 Solera Networks Blue Coat Systems 100% - - $225 - - - - -
05/21/13 N-able Technologies SolarWinds 100% - - $120 5.0x - - - -
05/20/13 Websense Vista Equity Partners 100% - - $903 2.5x 2.5x 2.4x - -
05/17/13 StreamOnce Jive Software 77% 23% - $6 - - - - -
05/14/13 BankLink (assets) MYOB Technology Pty - - - $113 - - - - -
05/14/13 FuGen Solutions 8K Miles - - - $8 - - - - -
05/13/13 AsiaInfo-Linkage CITIC Capital & Temasek 100% - - $890 - - - - -
05/08/13 Civica OMERS Capital Partners - - - $607 - - - - -
05/08/13 Epic Data International Sylogist 100% - - $5 - - - - -
05/08/13 Market Leader Trulia 54% 46% $304 $355 7.4x 6.2x 4.7x nm nm
05/07/13 Expert Systems AB ReadSoft AB - - - $6 3.1x - - - -
05/06/13 BMC Software Bain, Golden Gate, GIC & Insight 100% - - $6,900 3.1x 3.1x 3.0x - -
05/06/13 NComVA AB QlikTech 100% - - $8 - - - - -
05/06/13 Stonesoft Oyj Intel 100% - - $389 7.4x - - - -
05/02/13 KSD Software Norway AS Descartes Systems 100% - - $33 - - - - -
05/01/13 CLARA Jive Software 100% - - $7 - - - - -
04/29/13 Arkoon Network Security CASSIDIAN 100% - - $19 1.1x - - - -
04/22/13 Layer 7 Technologies CA Technologies 100% - - $155 - - - - -
04/18/13 Iter8 Quindell Portfolio 100% - - $4 - - - - -
04/11/13 Artesys International SA Idox 100% - - $3 0.8x - - - -
04/02/13 Infoglide Software Fair Isaac 100% - - $7 - - - - -
04/01/13 BGC Partners (assets) NASDAQ OMX 100% - - $750 7.5x - - - -

Copyright ©2013 Shea & Company, LLC
M&A Activity
Announced Software Acquisitions: 2Q 2013
5
Source: Company releases, Wall Street research
($ millions)
Announced Target Acquirer Target Segment & Description Price
06/27/13 Neolane Adobe Marketing Applications - Marketing automation software and SaaS $600
06/27/13 Noetix Silverback Enterprise Group Business Intelligence - Real-time data visualization and analytics n/a
06/27/13 Visual Analytics Raytheon Business Intelligence - Data visualization and analytics for government sector n/a
06/26/13 Bonaire Software Solutions Broadridge Financial Solutions Financial Applications - Revenue management, fee billing and analytics for the financial sector n/a
06/26/13 Liken Limited (SAM & ITAM divisions) IT Asset Management Solutions Systems & Network Management - Software and IT asset management for businesses in the UK n/a
06/26/13 Motorola Solutions (MSP assets) AirWatch Systems & Network Management - Mobile device provisioning and management n/a
06/25/13 Aruvio Virima Technologies IT Security - Governance, risk and compliance solutions n/a
06/25/13 Palisade Systems (assets) Absolute Software IT Security - Data loss prevention, anti-data leakage and website monitoring SaaS n/a
06/24/13 Adepto Solutions Minjar Cloud Solutions Pvt Platforms, Development Tools & Deployment - Social media application development and distribution SaaS n/a
06/24/13 Keynote Systems Thoma Bravo Platforms, Development Tools & Deployment - Application performance testing and monitoring SaaS $395
06/21/13 afterBOT (PoS reporting assets) Accelerated Analytics Business Intelligence - Point of sale analytics and inventory tracking SaaS n/a
06/21/13 Elastic Intelligence Intuit Platforms, Development Tools & Deployment - Data integration SaaS n/a
06/20/13 Composite Software Cisco Systems Systems & Network Management - Data virtualization, integration and analytics $180
06/20/13 Inventus Clearlake Capital Content Management - eDiscovery document collection, review and processing SaaS n/a
06/20/13 Perlego Systems Fixmo IT Security - Mobile security, file transfer and data protection n/a
06/20/13 Rivo Software Kennet Partners & Fidelity IT Security - Governance, risk and compliance SaaS n/a
06/20/13 xPeerient NET(net) ERP & Business Applications - IT project management SaaS n/a
06/20/13 ZeroVulnerabilityLabs Malwarebytes IT Security - Anti-malware software n/a
06/19/13 Oxial Suisse Phoenix Financial Services IT Security - Governance, risk and compliance software n/a
06/17/13 Panopticon Software AB Datawatch Business Intelligence - Real-time data visualization and analytics $31
06/17/13 Trendset AFS Logistics ERP & Business Applications - Freight audit, payment and logistics analysis SaaS n/a
06/17/13 Veramark Technologies Hubspoke ERP & Business Applications - Telecom expense management $11
06/14/13 AppFog CenturyLink Platforms, Development Tools & Deployment - Platform as a service for web-based applications n/a
06/14/13 Sarla Analytics Invensys Platforms, Development Tools & Deployment - Mobile database reporting n/a
06/13/13 Apama Software AG Business Intelligence - Complex event processing for the financial services sector n/a
06/13/13 TortoiseSVN.net WANdisco Systems & Network Management - Open source control software for Windows n/a
06/12/13 Advanced Productivity Software IntApp ERP & Business Applications - Workforce management SaaS for the legal sector n/a
06/12/13 Bitdeli AdRoll Business Intelligence - Data analytics and visualization SaaS n/a
06/12/13 HR Services Paychex ERP & Business Applications - Talent acquisition SaaS n/a
06/12/13 LPI Level Platforms AVG Technologies Systems & Network Management - Remote access SaaS for IT and managed service providers n/a
06/11/13 ALLiGAcom DiCentral Technical & Embedded Applications - EDI integration SaaS n/a
06/11/13 Sensemetric GmbH GFK Group Business Intelligence - Social media monitoring and analytics n/a
06/11/13 StreamBase Systems TIBCO Software Business Intelligence - Real-time data analytics and complex event processing n/a
06/10/13 Fox Technologies Parallax Capital Partners IT Security - Access management and governance n/a
06/10/13 Inkiru @WalmartLabs Business Intelligence - Customer analytics SaaS for the retail sector n/a
06/10/13 Seamless Technology Avnet Systems & Network Management - IT service management and process automation n/a
06/10/13 TimeManagement (assets) Agilysys ERP & Business Applications - Workforce management for the food industry n/a
06/07/13 EdgeSpring Salesforce.com Business Intelligence - Enterprise data analytics n/a
06/06/13 Incential Software IMS Health ERP & Business Applications - Sales performance management SaaS for the life sciences sector n/a
06/05/13 Jolly Giant Software Brandon Systems Platforms, Development Tools & Deployment - IBM terminal emulation software n/a
06/05/13 LearnSomething Xerox ERP & Business Applications - Employee training management SaaS n/a
06/05/13 MobileScope Evidon IT Security - Mobile application data security n/a
06/04/13 Appsecute ActiveState Platforms, Development Tools & Deployment - Software development project management platform as a service n/a
06/04/13 ExactTarget Salesforce.com Marketing Applications - Marketing campaign management SaaS $2,399
06/03/13 alfabet AG Software AG Systems & Network Management - Enterprise architecture and IT portfolio management n/a
Copyright ©2013 Shea & Company, LLC
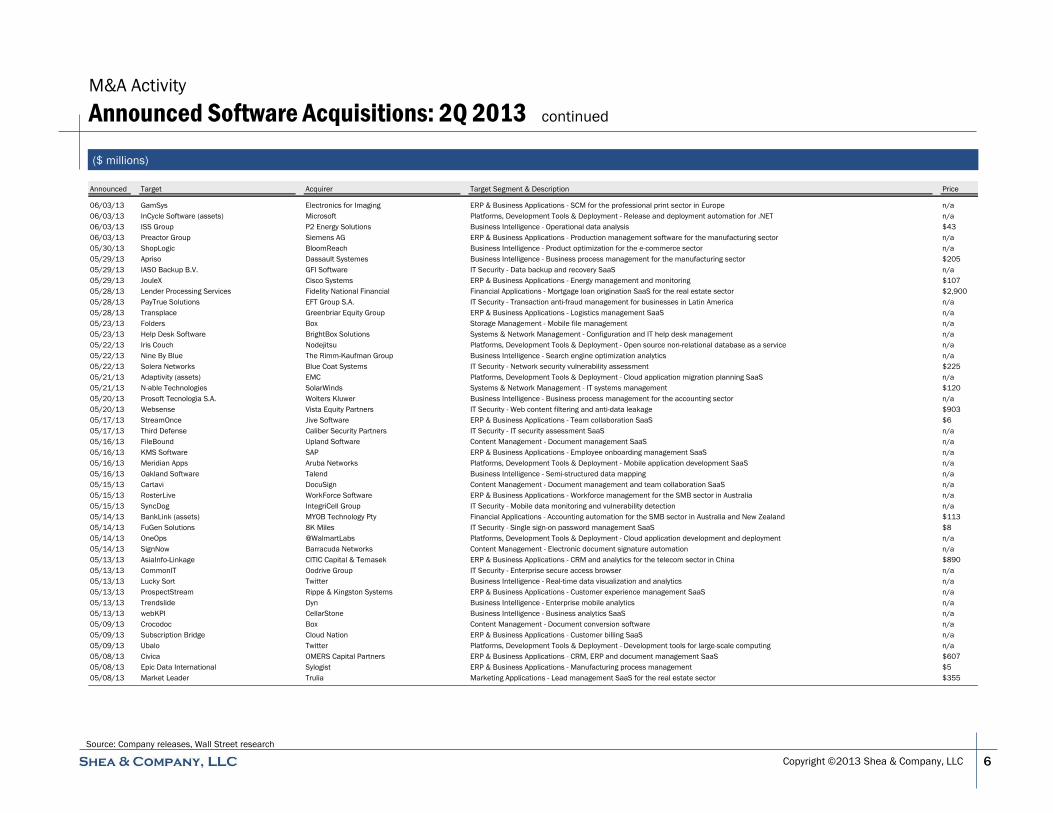
M&A Activity
Announced Software Acquisitions: 2Q 2013 continued
6
($ millions)
Source: Company releases, Wall Street research
Announced Target Acquirer Target Segment & Description Price
06/03/13 GamSys Electronics for Imaging ERP & Business Applications - SCM for the professional print sector in Europe n/a
06/03/13 InCycle Software (assets) Microsoft Platforms, Development Tools & Deployment - Release and deployment automation for .NET n/a
06/03/13 ISS Group P2 Energy Solutions Business Intelligence - Operational data analysis $43
06/03/13 Preactor Group Siemens AG ERP & Business Applications - Production management software for the manufacturing sector n/a
05/30/13 ShopLogic BloomReach Business Intelligence - Product optimization for the e-commerce sector n/a
05/29/13 Apriso Dassault Systemes Business Intelligence - Business process management for the manufacturing sector $205
05/29/13 IASO Backup B.V. GFI Software IT Security - Data backup and recovery SaaS n/a
05/29/13 JouleX Cisco Systems ERP & Business Applications - Energy management and monitoring $107
05/28/13 Lender Processing Services Fidelity National Financial Financial Applications - Mortgage loan origination SaaS for the real estate sector $2,900
05/28/13 PayTrue Solutions EFT Group S.A. IT Security - Transaction anti-fraud management for businesses in Latin America n/a
05/28/13 Transplace Greenbriar Equity Group ERP & Business Applications - Logistics management SaaS n/a
05/23/13 Folders Box Storage Management - Mobile file management n/a
05/23/13 Help Desk Software BrightBox Solutions Systems & Network Management - Configuration and IT help desk management n/a
05/22/13 Iris Couch Nodejitsu Platforms, Development Tools & Deployment - Open source non-relational database as a service n/a
05/22/13 Nine By Blue The Rimm-Kaufman Group Business Intelligence - Search engine optimization analytics n/a
05/22/13 Solera Networks Blue Coat Systems IT Security - Network security vulnerability assessment $225
05/21/13 Adaptivity (assets) EMC Platforms, Development Tools & Deployment - Cloud application migration planning SaaS n/a
05/21/13 N-able Technologies SolarWinds Systems & Network Management - IT systems management $120
05/20/13 Prosoft Tecnologia S.A. Wolters Kluwer Business Intelligence - Business process management for the accounting sector n/a
05/20/13 Websense Vista Equity Partners IT Security - Web content filtering and anti-data leakage $903
05/17/13 StreamOnce Jive Software ERP & Business Applications - Team collaboration SaaS $6
05/17/13 Third Defense Caliber Security Partners IT Security - IT security assessment SaaS n/a
05/16/13 FileBound Upland Software Content Management - Document management SaaS n/a
05/16/13 KMS Software SAP ERP & Business Applications - Employee onboarding management SaaS n/a
05/16/13 Meridian Apps Aruba Networks Platforms, Development Tools & Deployment - Mobile application development SaaS n/a
05/16/13 Oakland Software Talend Business Intelligence - Semi-structured data mapping n/a
05/15/13 Cartavi DocuSign Content Management - Document management and team collaboration SaaS n/a
05/15/13 RosterLive WorkForce Software ERP & Business Applications - Workforce management for the SMB sector in Australia n/a
05/15/13 SyncDog IntegriCell Group IT Security - Mobile data monitoring and vulnerability detection n/a
05/14/13 BankLink (assets) MYOB Technology Pty Financial Applications - Accounting automation for the SMB sector in Australia and New Zealand $113
05/14/13 FuGen Solutions 8K Miles IT Security - Single sign-on password management SaaS $8
05/14/13 OneOps @WalmartLabs Platforms, Development Tools & Deployment - Cloud application development and deployment n/a
05/14/13 SignNow Barracuda Networks Content Management - Electronic document signature automation n/a
05/13/13 AsiaInfo-Linkage CITIC Capital & Temasek ERP & Business Applications - CRM and analytics for the telecom sector in China $890
05/13/13 CommonIT Oodrive Group IT Security - Enterprise secure access browser n/a
05/13/13 Lucky Sort Twitter Business Intelligence - Real-time data visualization and analytics n/a
05/13/13 ProspectStream Rippe & Kingston Systems ERP & Business Applications - Customer experience management SaaS n/a
05/13/13 Trendslide Dyn Business Intelligence - Enterprise mobile analytics n/a
05/13/13 webKPI CellarStone Business Intelligence - Business analytics SaaS n/a
05/09/13 Crocodoc Box Content Management - Document conversion software n/a
05/09/13 Subscription Bridge Cloud Nation ERP & Business Applications - Customer billing SaaS n/a
05/09/13 Ubalo Twitter Platforms, Development Tools & Deployment - Development tools for large-scale computing n/a
05/08/13 Civica OMERS Capital Partners ERP & Business Applications - CRM, ERP and document management SaaS $607
05/08/13 Epic Data International Sylogist ERP & Business Applications - Manufacturing process management $5
05/08/13 Market Leader Trulia Marketing Applications - Lead management SaaS for the real estate sector $355

Copyright ©2013 Shea & Company, LLC
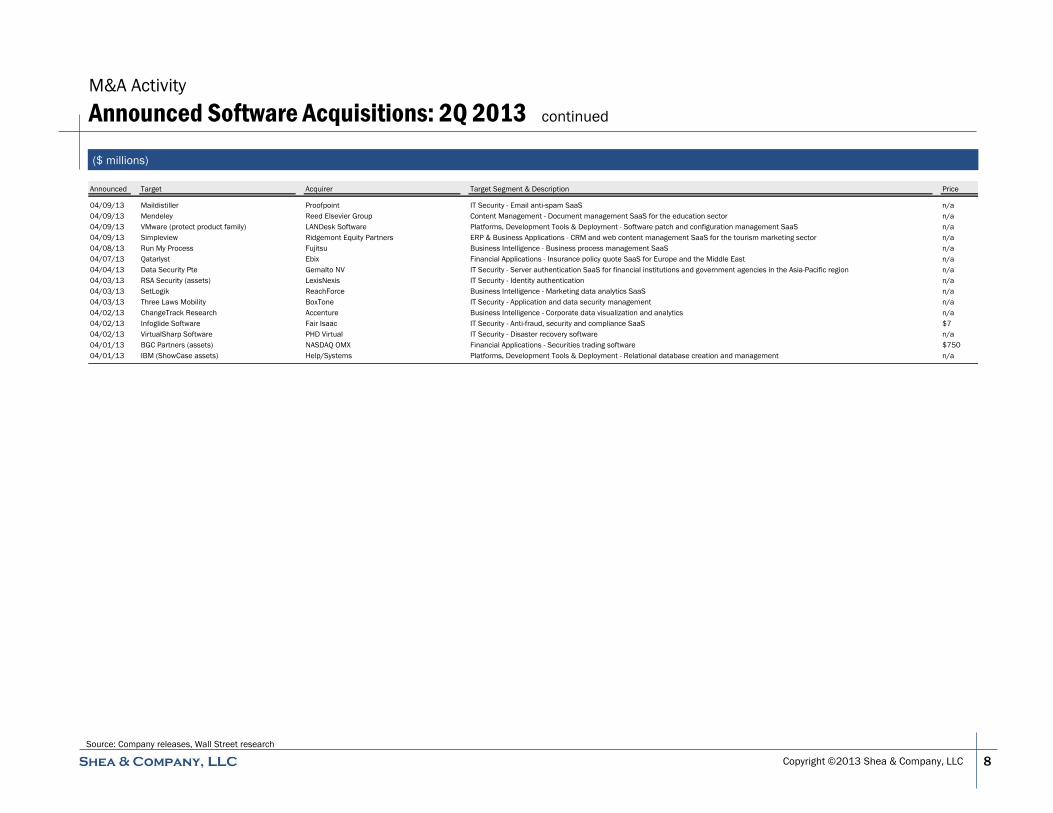
M&A Activity
Announced Software Acquisitions: 2Q 2013 continued
7
($ millions)
Source: Company releases, Wall Street research
Announced Target Acquirer Target Segment & Description Price
05/07/13 Dearborn Electronics Global Edge Software Technical & Embedded Applications - Embedded software in automotive electronics n/a
05/07/13 Expert Systems AB ReadSoft AB Financial Applications - Electronic invoice processing SaaS for businesses in Sweden $6
05/07/13 Haystak Digital Marketing VinSolutions Marketing Applications - Social media marketing management SaaS n/a
05/07/13 Proxomo Software Lucent Mobile Platforms, Development Tools & Deployment - Mobile application development SaaS n/a
05/06/13 BMC Software Bain, Golden Gate, GIC & Insight Systems & Network Management - Application, systems and database management $6,900
05/06/13 Enstratius Dell Platforms, Development Tools & Deployment - Cloud management and deployment SaaS n/a
05/06/13 NComVA AB QlikTech Business Intelligence - Website visitor visualization and analytics $8
05/06/13 NYLX Aklero Risk Analytics Financial Applications - Mortgage loan data analytics SaaS n/a
05/06/13 Stonesoft Oyj Intel IT Security - Network security management $389
05/06/13 Tweasy SA Swisscom AG Marketing Applications - Email and mobile marketing SaaS for businesses in Europe n/a
05/02/13 GemStone Systems (assets) GemTalk Systems Platforms, Development Tools & Deployment - Application server platform n/a
05/02/13 KSD Software Norway AS Descartes Systems ERP & Business Applications - Customs declaration logistics management for the shipping sector in Europe $33
05/01/13 CLARA Jive Software Business Intelligence - Online community analytics SaaS $7
05/01/13 Sage Group (construction assets) ISIS Equity Partners ERP & Business Applications - ERP and project management SaaS for the construction sector n/a
05/01/13 WaveMaker Pramati Technologies Platforms, Development Tools & Deployment - Web application development SaaS n/a
04/30/13 Best Case Solutions The CINgroup ERP & Business Applications - Bankruptcy document preparation for the legal sector n/a
04/30/13 Sage Group (debt collection assets) SIDETRADE.COM ERP & Business Applications - Customer debt collection management for businesses in France n/a
04/30/13 Semantelli IMS Health Business Intelligence - Social media monitoring SaaS for the life sciences sector n/a
04/29/13 Arkoon Network Security CASSIDIAN IT Security - Unified threat management $19
04/29/13 RecruitActive Konetic ERP & Business Applications - Employee recruitment management SaaS n/a
04/26/13 NewMindsets ClevrU ERP & Business Applications - Employee training management SaaS n/a
04/25/13 LongJump Software AG Platforms, Development Tools & Deployment - Software development, deployment and release management n/a
04/25/13 ParAccel Actian Business Intelligence - Big data warehousing analytics n/a
04/25/13 Parse Facebook Platforms, Development Tools & Deployment - Mobile application development SaaS n/a
04/24/13 Aepona Intel Platforms, Development Tools & Deployment - Mobile application distribution and development for wireless telecom service providers n/a
04/24/13 Workable Solutions Alegeus Technologies ERP & Business Applications - Health benefits management SaaS n/a
04/23/13 ManageRED Software Binary Tree Platforms, Development Tools & Deployment - Active Directory, password and server data migration n/a
04/23/13 Monty Program AB SkySQL AB Platforms, Development Tools & Deployment - Open source MySQL-based relational database server n/a
04/23/13 Socio Logiciels NP6 SA Business Intelligence - Customer analytics reporting n/a
04/23/13 TDCI Ltd. Infor ERP & Business Applications - Product configuration management for the manufacturing sector n/a
04/22/13 Facilita Software Development TestPlant Systems & Network Management - Software load and performance testing n/a
04/22/13 Layer 7 Technologies CA Technologies Platforms, Development Tools & Deployment - API management SaaS $155
04/22/13 UrbanCode IBM Platforms, Development Tools & Deployment - Software development deployment management n/a
04/22/13 Webdetails Pentaho Business Intelligence - Data analytics visualization n/a
04/18/13 Computershare (assets) Solium Capital Financial Applications - Stockholder plan management n/a
04/18/13 EnCompass Technologies Eka Software Solutions Pvt Financial Applications - Energy trade management for the financial services sector n/a
04/18/13 Innovative Automation SI Systems ERP & Business Applications - Warehouse and inventory management n/a
04/18/13 Iter8 Quindell Portfolio Financial Applications - Insurance policy administration and underwriting $4
04/18/13 TeamSeer Access Group ERP & Business Applications - Workforce management SaaS n/a
04/17/13 Mashery Intel Platforms, Development Tools & Deployment - API management SaaS n/a
04/16/13 Digital Sandbox Haystax Technology IT Security - Threat management analytics n/a
04/12/13 LonoCloud ViaSat Platforms, Development Tools & Deployment - Application migration and development platform as a service n/a
04/11/13 Artesys International SA Idox Content Management - Technical document management $3
04/11/13 IronPearl PayPal Business Intelligence - Customer acquisition and retention optimization n/a
04/10/13 Xpenser Coupa Software ERP & Business Applications - Expense management SaaS n/a
Copyright ©2013 Shea & Company, LLC
M&A Activity
Announced Software Acquisitions: 2Q 2013 continued
8
($ millions)
Source: Company releases, Wall Street research
Announced Target Acquirer Target Segment & Description Price
04/09/13 Maildistiller Proofpoint IT Security - Email anti-spam SaaS n/a
04/09/13 Mendeley Reed Elsevier Group Content Management - Document management SaaS for the education sector n/a
04/09/13 VMware (protect product family) LANDesk Software Platforms, Development Tools & Deployment - Software patch and configuration management SaaS n/a
04/09/13 Simpleview Ridgemont Equity Partners ERP & Business Applications - CRM and web content management SaaS for the tourism marketing sector n/a
04/08/13 Run My Process Fujitsu Business Intelligence - Business process management SaaS n/a
04/07/13 Qatarlyst Ebix Financial Applications - Insurance policy quote SaaS for Europe and the Middle East n/a
04/04/13 Data Security Pte Gemalto NV IT Security - Server authentication SaaS for financial institutions and government agencies in the Asia-Pacific region n/a
04/03/13 RSA Security (assets) LexisNexis IT Security - Identity authentication n/a
04/03/13 SetLogik ReachForce Business Intelligence - Marketing data analytics SaaS n/a
04/03/13 Three Laws Mobility BoxTone IT Security - Application and data security management n/a
04/02/13 ChangeTrack Research Accenture Business Intelligence - Corporate data visualization and analytics n/a
04/02/13 Infoglide Software Fair Isaac IT Security - Anti-fraud, security and compliance SaaS $7
04/02/13 VirtualSharp Software PHD Virtual IT Security - Disaster recovery software n/a
04/01/13 BGC Partners (assets) NASDAQ OMX Financial Applications - Securities trading software $750
04/01/13 IBM (ShowCase assets) Help/Systems Platforms, Development Tools & Deployment - Relational database creation and management n/a
Copyright ©2013 Shea & Company, LLC
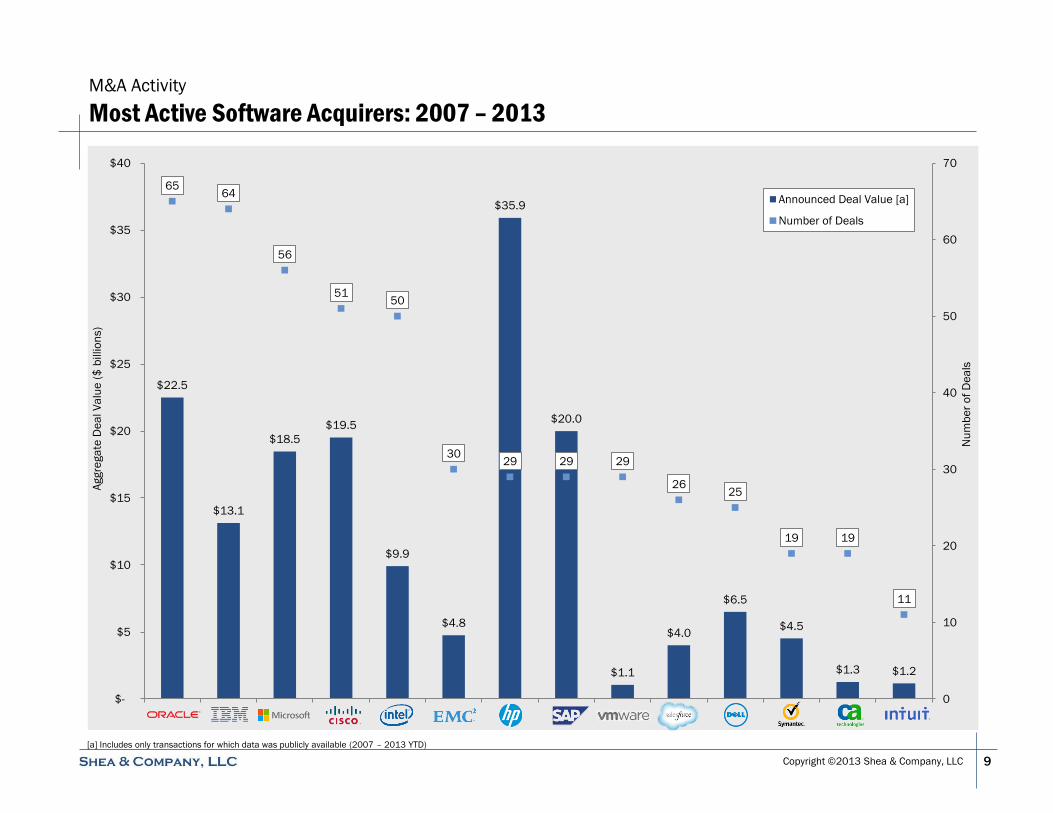
M&A Activity
Most Active Software Acquirers: 2007 – 2013
9
$22.5
$13.1
$18.5
$19.5
$9.9
$4.8
$35.9
$20.0
$1.1
$4.0
$6.5
$4.5
$1.3 $1.2
65 64
56
51 50
30 29 29 29
26 25
19 19
11
0
10
20
30
40
50
60
70
$-
$5
$10
$15
$20
$25
$30
$35
$40
Nu
mb
er
of
De
als
Aggre
ga
te D
ea
l V
alu
e (
$ b
illio
ns)
Announced Deal Value [a]
Number of Deals
[a] Includes only transactions for which data was publicly available (2007 – 2013 YTD)

Copyright ©2013 Shea & Company, LLC
M&A Activity
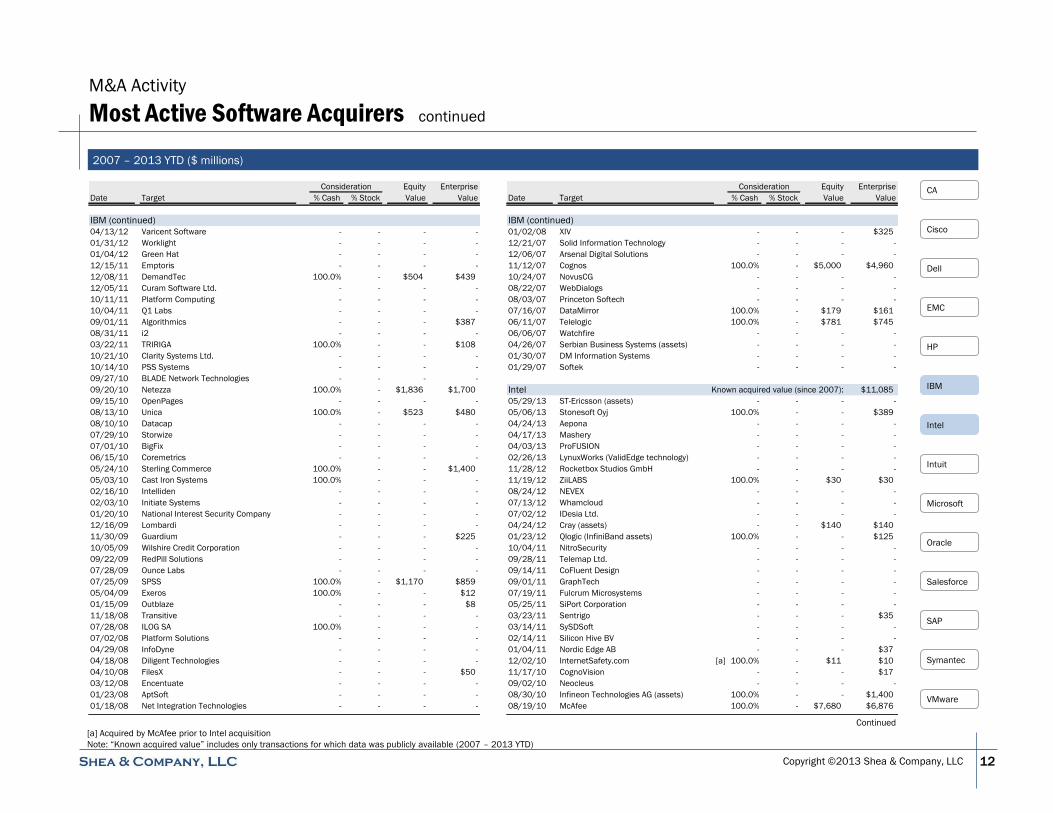
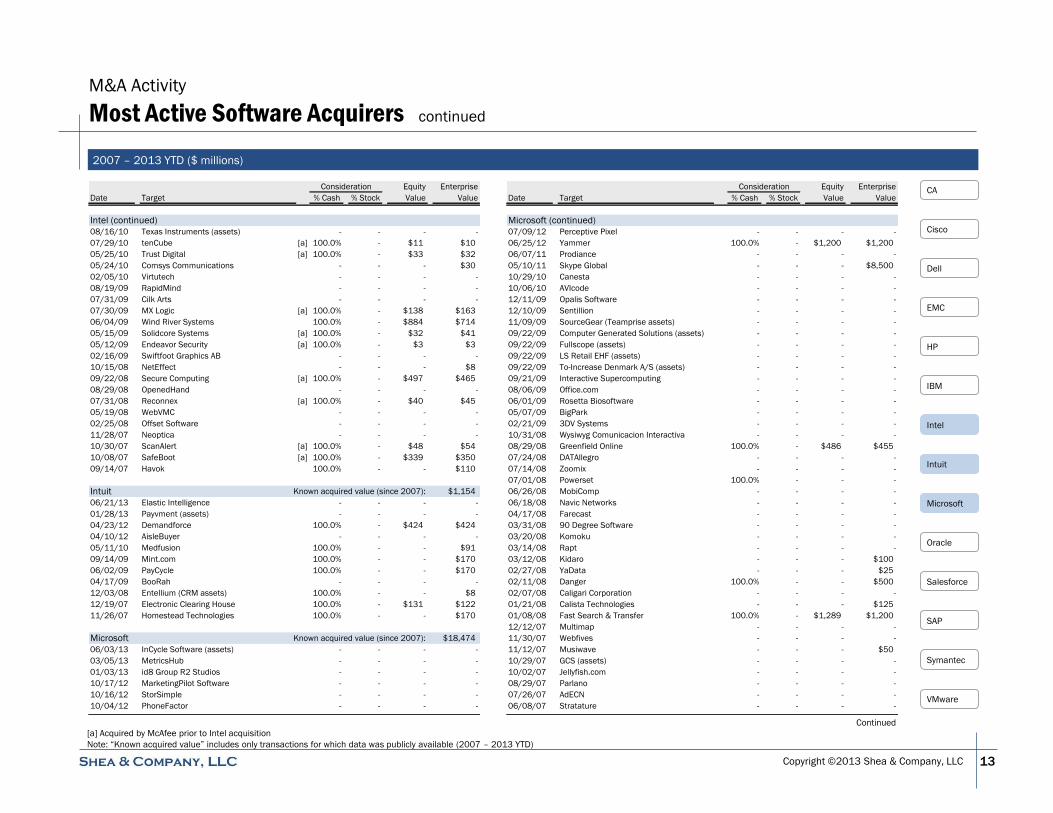
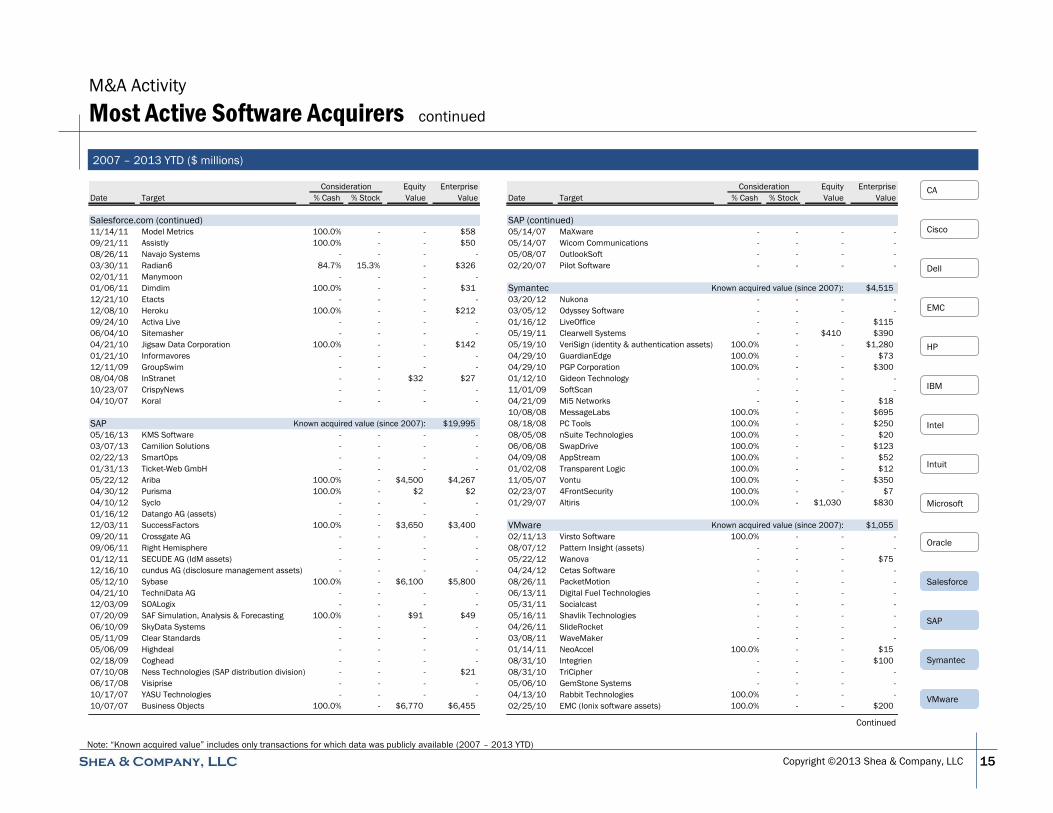
Most Active Software Acquirers continued
10
Note: “Known acquired value” includes only transactions for which data was publicly available (2007 – 2013 YTD)
2007 – 2013 YTD ($ millions)
Cisco
Dell
Salesforce
HP
IBM
Intel
Intuit
Microsoft
Oracle
SAP
Symantec
VMware
CA
EMC
Continued
Consideration Equity Enterprise
Date Target % Cash % Stock Value Value
CA Technologies Known acquired value (since 2007): $1,272
04/22/13 Layer 7 Technologies 100.0% - - $155
09/10/12 Paragon Global Technology - - - -
07/29/11 Watchmouse B.V. - - - -
06/29/11 Interactive TKO 100.0% - - $330
05/16/11 SE-Consulting GmbH - - - -
04/06/11 Base Technologies - - - -
01/25/11 Torokina Networks - - - -
09/28/10 Hyperformix - - - -
08/30/10 Arcot Systems 100.0% - - $200
08/12/10 4Base Technology - - - -
03/10/10 Nimsoft 100.0% - - $350
02/24/10 3Tera - - - -
01/11/10 Oblicore 100.0% - - $20
09/14/09 NetQoS 100.0% - $200 $200
06/02/09 Cassatt - - - -
01/05/09 Orchestria - - - -
11/13/08 Eurekify - - - $17
10/15/08 Optinuity - - - -
10/07/08 IDFocus - - - -
Cisco Systems Known acquired value (since 2007): $19,520
06/20/13 Composite Software 100.0% - - $180
05/29/13 JouleX 100.0% - - $107
04/03/13 Ubiquisys - - - $310
03/25/13 SolveDirect Service Management GmbH - - $21 $21
01/29/13 Cognitive Security sro - - - -
01/23/13 Intucell 100.0% - $475 $475
12/18/12 BroadHop - - - -
11/29/12 Cariden Technologies 100.0% - $141 $141
11/18/12 Meraki 100.0% - $1,200 $1,200
11/15/12 Cloupia 100.0% - $125 $125
10/04/12 vCider - - - -
07/13/12 Virtuata - - - -
05/03/12 Truviso - - - -
03/28/12 ClearAccess - - - -
03/15/12 NDS Group Ltd. - - $3,896 $5,000
10/20/11 BNI Video - - - $99
08/29/11 Versly - - - -
03/29/11 newScale - - - -
02/04/11 Inlet Technologies 100.0% - - $95
01/26/11 Pari Networks - - - -
12/01/10 LineSider Technologies - - - -
09/02/10 Arch Rock Corporation - - - -
Consideration Equity Enterprise
Date Target % Cash % Stock Value Value
Cisco Systems (continued)
08/26/10 ExtendMedia - - - -
05/20/10 CoreOptics 100.0% - - $99
05/18/10 MOTO Development Group - - - -
01/05/10 Rohati Systems - - - -
11/02/09 DVN Holdings (set-top box business) - - - $45
10/27/09 ScanSafe 100.0% - - $183
10/13/09 Starent Networks 100.0% - $2,900 $2,510
10/01/09 Tandberg 100.0% - $3,400 $3,400
04/09/09 Tidal Software 100.0% - - $105
03/19/09 Pure Digital Technologies - - - $590
01/27/09 Richards-Zeta Building Intelligence - - - -
09/19/08 Jabber - - - -
08/27/08 PostPath - - - $215
07/23/08 Pure Networks 100.0% - - $120
06/10/08 DiviTech A/S - - - -
11/01/07 Securent - - - -
10/23/07 Navini Networks - - - $330
09/27/07 Latigent - - - -
09/18/07 Cognio - - - -
07/23/07 GlooLabs - - - -
05/21/07 BroadWare Technologies - - - -
03/28/07 SpansLogic - - - -
03/15/07 WebEx 100.0% - $3,200 $3,145
03/13/07 NeoPath Networks - - - $60
03/05/07 Utah Street Networks (assets) - - - -
02/26/07 Qovia - - - -
02/21/07 Reactivity 100.0% - - $135
02/09/07 Five Across - - - -
01/04/07 IronPort Systems - - - $830
Dell Known acquired value (since 2007): $6,496
05/06/13 Enstratius 100.0% - - -
12/18/12 Credant Technologies - - - -
11/16/12 Gale Technologies - - - -
10/23/12 Kitenga - - - -
06/25/12 Quest Software 100.0% - $2,383 $2,408
04/05/12 MAKE Technologies - - - -
04/03/12 Clerity Solutions - - - -
04/02/12 Wyse Technology - - - -
03/13/12 SonicWALL - - - $1,250
02/24/12 AppAssure - - - -
06/20/11 RNA Networks - - - -
01/04/11 SecureWorks - - - -

Copyright ©2013 Shea & Company, LLC
M&A Activity
Most Active Software Acquirers continued
11
2007 – 2013 YTD ($ millions)
Continued
EMC
Cisco
Salesforce
HP
IBM
Intel
Intuit
Microsoft
Oracle
SAP
Symantec
VMware
CA
Note: “Known acquired value” includes only transactions for which data was publicly available (2007 – 2013 YTD)
Dell
Consideration Equity Enterprise
Date Target % Cash % Stock Value Value
Dell (continued)
12/22/10 InSite One - - - -
12/13/10 Compellent Technologies 100.0% - $960 $820
11/02/10 Boomi - - - -
07/19/10 Ocarina Networks - - - -
07/01/10 Scalent - - - -
02/11/10 Kace Networks 100.0% - - $123
02/12/08 MessageOne 100.0% - - $155
02/08/08 Exanet - - - -
11/15/07 Everdream - - - -
11/05/07 EqualLogic 100.0% - $1,418 $1,400
08/06/07 Zing Systems - - - -
08/02/07 ASAP Software - - - $340
07/18/07 SilverBack Technologies - - - -
EMC Known acquired value (since 2007): $4,754
05/21/13 Adaptivity (assets) - - - -
11/29/12 MoreVRP - - - -
10/30/12 Silver Tail Systems - - - -
05/31/12 Watch4Net Solutions - - - -
05/21/12 Syncplicity - - - -
05/10/12 XtremIO - - - -
03/20/12 Likewise Software - - - -
10/03/11 Zettapoint - - - -
04/04/11 NetWitness - - - -
11/15/10 Isilon 100.0% - $2,434 $2,250
07/06/10 Greenplum 100.0% - - -
01/04/10 Archer Technologies - - - -
09/01/09 Kazeon Systems - - - -
08/31/09 FastScale Technology - - - -
06/01/09 Data Domain 100.0% - $2,378 $2,100
05/27/09 Configuresoft - - - $87
01/02/09 SourceLabs - - - -
04/08/08 Iomega 100.0% - $213 $148
04/07/08 WysDM Software - - - -
04/01/08 Conchango plc 100.0% - - $84
03/10/08 Infra Corporation - - - -
02/21/08 Pi 100.0% - - -
12/27/07 Document Sciences 100.0% - $87 $85
10/30/07 Voyence - - - -
10/15/07 Illuminator - - - -
10/04/07 Berkeley Data Systems - - - -
08/30/07 BusinessEdge Solutions - - - -
08/09/07 Tablus - - - -
Consideration Equity Enterprise
Date Target % Cash % Stock Value Value
EMC (continued)
07/19/07 X-Hive Corporation - - - -
06/04/07 Verid - - - -
HP Known acquired value (since 2007): $35,915
12/03/12 Digital Risk 100.0% - $175 $175
12/06/11 Hiflex Software GmbH - - - -
08/18/11 Autonomy 100.0% - $11,560 $10,889
05/24/11 Printelligent - - - -
02/14/11 Vertica - - - -
09/13/10 ArcSight 100.0% - $1,651 $1,500
08/26/10 Stratavia - - - -
08/23/10 3PAR 100.0% - $2,400 $2,296
08/17/10 Fortify Software - - - -
06/10/10 Phoenix Technologies (HyperSpace assets) 100.0% - - $12
04/28/10 Palm 100.0% - $1,400 $1,199
11/11/09 3Com 100.0% - $3,131 $2,705
07/17/09 IBRIX - - - -
06/22/09 Excellerate HRO - - - -
10/01/08 LeftHand Networks 100.0% - - $360
08/11/08 Colubris Networks - - - -
05/13/08 Electronic Data Systems - - - $13,900
03/31/08 Tower Software - - - $100
01/22/08 Exstream Software - - - $720
12/10/07 NUR Macroprinters 100.0% - - $118
11/12/07 EYP Mission Critical Facilities - - - -
10/22/07 AOME - - - -
09/13/07 MacDermid ColorSpan - - - -
07/23/07 Neoware 100.0% - $328 $206
07/23/07 Opsware 100.0% - $1,673 $1,600
06/19/07 SPI Dynamics - - - $135
03/22/07 Tabblo - - - -
02/26/07 PolyServe - - - -
02/05/07 Bristol Technology - - - -
IBM Known acquired value (since 2007): $13,139
06/04/13 SoftLayer Technologies - - - -
04/22/13 UrbanCode - - - -
02/01/13 Star Analytics - - - -
12/19/12 StoredIQ - - - -
09/24/12 Butterfly Software Ltd. - - - -
08/27/12 Kenexa 100.0% - $1,307 $1,280
05/02/12 Tealeaf Technology - - - -
04/25/12 Vivisimo - - - -
Copyright ©2013 Shea & Company, LLC
M&A Activity
Most Active Software Acquirers continued
12
[a] Acquired by McAfee prior to Intel acquisition
Note: “Known acquired value” includes only transactions for which data was publicly available (2007 – 2013 YTD)
Continued
EMC
Cisco
Dell
Salesforce
HP
IBM
Intel
Microsoft
Oracle
SAP
Symantec
VMware
CA
Intuit
2007 – 2013 YTD ($ millions)
Consideration Equity Enterprise
Date Target % Cash % Stock Value Value
IBM (continued)
04/13/12 Varicent Software - - - -
01/31/12 Worklight - - - -
01/04/12 Green Hat - - - -
12/15/11 Emptoris - - - -
12/08/11 DemandTec 100.0% - $504 $439
12/05/11 Curam Software Ltd. - - - -
10/11/11 Platform Computing - - - -
10/04/11 Q1 Labs - - - -
09/01/11 Algorithmics - - - $387
08/31/11 i2 - - - -
03/22/11 TRIRIGA 100.0% - - $108
10/21/10 Clarity Systems Ltd. - - - -
10/14/10 PSS Systems - - - -
09/27/10 BLADE Network Technologies - - - -
09/20/10 Netezza 100.0% - $1,836 $1,700
09/15/10 OpenPages - - - -
08/13/10 Unica 100.0% - $523 $480
08/10/10 Datacap - - - -
07/29/10 Storwize - - - -
07/01/10 BigFix - - - -
06/15/10 Coremetrics - - - -
05/24/10 Sterling Commerce 100.0% - - $1,400
05/03/10 Cast Iron Systems 100.0% - - -
02/16/10 Intelliden - - - -
02/03/10 Initiate Systems - - - -
01/20/10 National Interest Security Company - - - -
12/16/09 Lombardi - - - -
11/30/09 Guardium - - - $225
10/05/09 Wilshire Credit Corporation - - - -
09/22/09 RedPill Solutions - - - -
07/28/09 Ounce Labs - - - -
07/25/09 SPSS 100.0% - $1,170 $859
05/04/09 Exeros 100.0% - - $12
01/15/09 Outblaze - - - $8
11/18/08 Transitive - - - -
07/28/08 ILOG SA 100.0% - - -
07/02/08 Platform Solutions - - - -
04/29/08 InfoDyne - - - -
04/18/08 Diligent Technologies - - - -
04/10/08 FilesX - - - $50
03/12/08 Encentuate - - - -
01/23/08 AptSoft - - - -
01/18/08 Net Integration Technologies - - - -
Consideration Equity Enterprise
Date Target % Cash % Stock Value Value
IBM (continued)
01/02/08 XIV - - - $325
12/21/07 Solid Information Technology - - - -
12/06/07 Arsenal Digital Solutions - - - -
11/12/07 Cognos 100.0% - $5,000 $4,960
10/24/07 NovusCG - - - -
08/22/07 WebDialogs - - - -
08/03/07 Princeton Softech - - - -
07/16/07 DataMirror 100.0% - $179 $161
06/11/07 Telelogic 100.0% - $781 $745
06/06/07 Watchfire - - - -
04/26/07 Serbian Business Systems (assets) - - - -
01/30/07 DM Information Systems - - - -
01/29/07 Softek - - - -
Intel Known acquired value (since 2007): $11,085
05/29/13 ST-Ericsson (assets) - - - -
05/06/13 Stonesoft Oyj 100.0% - - $389
04/24/13 Aepona - - - -
04/17/13 Mashery - - - -
04/03/13 ProFUSION - - - -
02/26/13 LynuxWorks (ValidEdge technology) - - - -
11/28/12 Rocketbox Studios GmbH - - - -
11/19/12 ZiiLABS 100.0% - $30 $30
08/24/12 NEVEX - - - -
07/13/12 Whamcloud - - - -
07/02/12 IDesia Ltd. - - - -
04/24/12 Cray (assets) - - $140 $140
01/23/12 Qlogic (InfiniBand assets) 100.0% - - $125
10/04/11 NitroSecurity - - - -
09/28/11 Telemap Ltd. - - - -
09/14/11 CoFluent Design - - - -
09/01/11 GraphTech - - - -
07/19/11 Fulcrum Microsystems - - - -
05/25/11 SiPort Corporation - - - -
03/23/11 Sentrigo - - - $35
03/14/11 SySDSoft - - - -
02/14/11 Silicon Hive BV - - - -
01/04/11 Nordic Edge AB - - - $37
12/02/10 InternetSafety.com [a] 100.0% - $11 $10
11/17/10 CognoVision - - - $17
09/02/10 Neocleus - - - -
08/30/10 Infineon Technologies AG (assets) 100.0% - - $1,400
08/19/10 McAfee 100.0% - $7,680 $6,876
Copyright ©2013 Shea & Company, LLC
M&A Activity
Most Active Software Acquirers continued
13
Continued
EMC
Cisco
Dell
Salesforce
HP
IBM
Microsoft
Oracle
SAP
Symantec
VMware
CA
Intuit
Intel
[a] Acquired by McAfee prior to Intel acquisition
Note: “Known acquired value” includes only transactions for which data was publicly available (2007 – 2013 YTD)
2007 – 2013 YTD ($ millions)
Consideration Equity Enterprise
Date Target % Cash % Stock Value Value
Intel (continued)
08/16/10 Texas Instruments (assets) - - - -
07/29/10 tenCube [a] 100.0% - $11 $10
05/25/10 Trust Digital [a] 100.0% - $33 $32
05/24/10 Comsys Communications - - - $30
02/05/10 Virtutech - - - -
08/19/09 RapidMind - - - -
07/31/09 Cilk Arts - - - -
07/30/09 MX Logic [a] 100.0% - $138 $163
06/04/09 Wind River Systems 100.0% - $884 $714
05/15/09 Solidcore Systems [a] 100.0% - $32 $41
05/12/09 Endeavor Security [a] 100.0% - $3 $3
02/16/09 Swiftfoot Graphics AB - - - -
10/15/08 NetEffect - - - $8
09/22/08 Secure Computing [a] 100.0% - $497 $465
08/29/08 OpenedHand - - - -
07/31/08 Reconnex [a] 100.0% - $40 $45
05/19/08 WebVMC - - - -
02/25/08 Offset Software - - - -
11/28/07 Neoptica - - - -
10/30/07 ScanAlert [a] 100.0% - $48 $54
10/08/07 SafeBoot [a] 100.0% - $339 $350
09/14/07 Havok 100.0% - - $110
Intuit Known acquired value (since 2007): $1,154
06/21/13 Elastic Intelligence - - - -
01/28/13 Payvment (assets) - - - -
04/23/12 Demandforce 100.0% - $424 $424
04/10/12 AisleBuyer - - - -
05/11/10 Medfusion 100.0% - - $91
09/14/09 Mint.com 100.0% - - $170
06/02/09 PayCycle 100.0% - - $170
04/17/09 BooRah - - - -
12/03/08 Entellium (CRM assets) 100.0% - - $8
12/19/07 Electronic Clearing House 100.0% - $131 $122
11/26/07 Homestead Technologies 100.0% - - $170
Microsoft Known acquired value (since 2007): $18,474
06/03/13 InCycle Software (assets) - - - -
03/05/13 MetricsHub - - - -
01/03/13 id8 Group R2 Studios - - - -
10/17/12 MarketingPilot Software - - - -
10/16/12 StorSimple - - - -
10/04/12 PhoneFactor - - - -
Consideration Equity Enterprise
Date Target % Cash % Stock Value Value
Microsoft (continued)
07/09/12 Perceptive Pixel - - - -
06/25/12 Yammer 100.0% - $1,200 $1,200
06/07/11 Prodiance - - - -
05/10/11 Skype Global - - - $8,500
10/29/10 Canesta - - - -
10/06/10 AVIcode - - - -
12/11/09 Opalis Software - - - -
12/10/09 Sentillion - - - -
11/09/09 SourceGear (Teamprise assets) - - - -
09/22/09 Computer Generated Solutions (assets) - - - -
09/22/09 Fullscope (assets) - - - -
09/22/09 LS Retail EHF (assets) - - - -
09/22/09 To-Increase Denmark A/S (assets) - - - -
09/21/09 Interactive Supercomputing - - - -
08/06/09 Office.com - - - -
06/01/09 Rosetta Biosoftware - - - -
05/07/09 BigPark - - - -
02/21/09 3DV Systems - - - -
10/31/08 Wysiwyg Comunicacion Interactiva - - - -
08/29/08 Greenfield Online 100.0% - $486 $455
07/24/08 DATAllegro - - - -
07/14/08 Zoomix - - - -
07/01/08 Powerset 100.0% - - -
06/26/08 MobiComp - - - -
06/18/08 Navic Networks - - - -
04/17/08 Farecast - - - -
03/31/08 90 Degree Software - - - -
03/20/08 Komoku - - - -
03/14/08 Rapt - - - -
03/12/08 Kidaro - - - $100
02/27/08 YaData - - - $25
02/11/08 Danger 100.0% - - $500
02/07/08 Caligari Corporation - - - -
01/21/08 Calista Technologies - - - $125
01/08/08 Fast Search & Transfer 100.0% - $1,289 $1,200
12/12/07 Multimap - - - -
11/30/07 Webfives - - - -
11/12/07 Musiwave - - - $50
10/29/07 GCS (assets) - - - -
10/02/07 Jellyfish.com - - - -
08/29/07 Parlano - - - -
07/26/07 AdECN - - - -
06/08/07 Stratature - - - -

Copyright ©2013 Shea & Company, LLC
M&A Activity
Most Active Software Acquirers continued
14
[a] Acquired by Sun Microsystems prior to Oracle acquisition
Note: “Known acquired value” includes only transactions for which data was publicly available (2007 – 2013 YTD)
EMC
Cisco
Dell
Salesforce
HP
IBM
Intel
Intuit
Microsoft
Oracle
VMware
CA
Symantec
SAP
2007 – 2013 YTD ($ millions)
Consideration Equity Enterprise
Date Target % Cash % Stock Value Value
Microsoft (continued)
06/05/07 Engyro - - - -
05/18/07 aQuantive 100.0% - $6,370 $6,319
05/03/07 ScreenTonic - - - -
03/28/07 devBiz Business Solutions - - - -
03/14/07 eBECS (assets) - - - -
03/14/07 Tellme Networks - - - -
02/26/07 Medstory - - - -
Oracle Known acquired value (since 2007): $22,502
12/20/12 Eloqua - - - $871
11/08/12 Instantis - - - -
09/17/12 SelectMinds - - - -
07/30/12 Xsigo Systems - - - -
07/19/12 Skire - - - -
07/10/12 Involver - - - -
06/05/12 Collective Intellect - - - -
05/23/12 Vitrue - - - -
02/09/12 Taleo 100.0% - $1,900 $2,010
10/24/11 RightNow Technologies 100.0% - $1,500 $1,434
10/18/11 Endeca Technologies - - - -
09/22/11 GoAhead Software - - - -
07/28/11 InQuira - - - -
07/21/11 Ksplice - - - -
06/30/11 Pillar Data Systems - - - -
06/21/11 FatWire Software - - - -
06/20/11 Datanomic - - - -
11/02/10 Art Technology Group 100.0% - $1,000 $817
10/05/10 Passlogix - - - -
05/26/10 eServGlobal (pre-paid software assets) - - - -
05/25/10 Market2Lead (assets) - - - -
05/20/10 Secerno - - - -
04/16/10 Phase Forward 100.0% - $755 $714
02/10/10 Convergin - - - -
02/08/10 AmberPoint - - - -
01/04/10 Silver Creek Systems - - - -
10/12/09 Sophoi - - - -
09/29/09 HyperRoll - - - -
07/23/09 GoldenGate Software - - - -
06/17/09 Conformia - - - -
05/13/09 Virtual Iron - - - -
04/20/09 Sun Microsystems 100.0% - $7,400 $5,667
03/23/09 Relsys International - - - -
02/04/09 mValent - - - -
Consideration Equity Enterprise
Date Target % Cash % Stock Value Value
Oracle (continued)
01/07/09 Q-layers [a] - - - -
11/03/08 Tacit Software - - - -
10/29/08 Haley Ltd. - - - $100
10/08/08 Primavera Systems - - - -
10/01/08 Advanced Visual Technology - - - $5
09/02/08 ClearApp - - - -
07/31/08 Global Knowledge Software - - - -
06/23/08 Skywire Software - - - -
05/13/08 AdminServer - - - -
04/25/08 Montalvo Systems [a] - - - $25
04/09/08 Auptyma - - - -
03/27/08 Empirix (e-TEST software) - - - -
02/12/08 innotek [a] - - - -
01/16/08 BEA Systems 100.0% - $8,352 $6,852
01/16/08 Captovation - - - -
01/16/08 MySQL [a] - - - $1,000
12/06/07 Moniforce - - - -
11/13/07 Vaau [a] - - - -
10/24/07 Interlace Systems - - - -
10/09/07 LogicalApps - - - -
09/12/07 Cluster File Systems [a] - - - -
09/02/07 Netsure Telecom - - - -
08/31/07 Bridgestream - - - -
07/18/07 Bharosa - - - -
05/15/07 Agile Software 100.0% - $495 $301
05/01/07 Revenue Technologies - - - -
04/24/07 Lodestar - - - -
04/18/07 AppForge - - - -
04/12/07 SavaJe Technologies [a] - - - -
03/23/07 Tangosol - - - -
03/01/07 Hyperion 100.0% - $3,192 $2,706
Salesforce.com Known acquired value (since 2007): $4,004
06/07/13 EdgeSpring - - - -
06/04/13 ExactTarget 100.0% - $2,500 $2,399
02/06/13 EntropySoft - - - -
09/11/12 BlueTail - - - -
07/09/12 GoInstant - - $70 $70
06/25/12 Thinkfuse - - - -
06/18/12 ChoicePass - - - -
06/04/12 Buddy Media - - - $689
05/01/12 Stypi - - - -
12/15/11 Rypple - - - -
Continued
Copyright ©2013 Shea & Company, LLC
M&A Activity
Most Active Software Acquirers continued
15
EMC
Cisco
Dell
HP
IBM
Intel
Intuit
Microsoft
SAP
CA
Salesforce
Oracle
Symantec
VMware
Note: “Known acquired value” includes only transactions for which data was publicly available (2007 – 2013 YTD)
2007 – 2013 YTD ($ millions)
Consideration Equity Enterprise
Date Target % Cash % Stock Value Value
SAP (continued)
05/14/07 MaXware - - - -
05/14/07 Wicom Communications - - - -
05/08/07 OutlookSoft - - - -
02/20/07 Pilot Software - - - -
Symantec Known acquired value (since 2007): $4,515
03/20/12 Nukona - - - -
03/05/12 Odyssey Software - - - -
01/16/12 LiveOffice - - - $115
05/19/11 Clearwell Systems - - $410 $390
05/19/10 VeriSign (identity & authentication assets) 100.0% - - $1,280
04/29/10 GuardianEdge 100.0% - - $73
04/29/10 PGP Corporation 100.0% - - $300
01/12/10 Gideon Technology - - - -
11/01/09 SoftScan - - - -
04/21/09 Mi5 Networks - - - $18
10/08/08 MessageLabs 100.0% - - $695
08/18/08 PC Tools 100.0% - - $250
08/05/08 nSuite Technologies 100.0% - - $20
06/06/08 SwapDrive 100.0% - - $123
04/09/08 AppStream 100.0% - - $52
01/02/08 Transparent Logic 100.0% - - $12
11/05/07 Vontu 100.0% - - $350
02/23/07 4FrontSecurity 100.0% - - $7
01/29/07 Altiris 100.0% - $1,030 $830
VMware Known acquired value (since 2007): $1,055
02/11/13 Virsto Software 100.0% - - -
08/07/12 Pattern Insight (assets) - - - -
05/22/12 Wanova - - - $75
04/24/12 Cetas Software - - - -
08/26/11 PacketMotion - - - -
06/13/11 Digital Fuel Technologies - - - -
05/31/11 Socialcast - - - -
05/16/11 Shavlik Technologies - - - -
04/26/11 SlideRocket - - - -
03/08/11 WaveMaker - - - -
01/14/11 NeoAccel 100.0% - - $15
08/31/10 Integrien - - - $100
08/31/10 TriCipher - - - -
05/06/10 GemStone Systems - - - -
04/13/10 Rabbit Technologies 100.0% - - -
02/25/10 EMC (Ionix software assets) 100.0% - - $200
Consideration Equity Enterprise
Date Target % Cash % Stock Value Value
Salesforce.com (continued)
11/14/11 Model Metrics 100.0% - - $58
09/21/11 Assistly 100.0% - - $50
08/26/11 Navajo Systems - - - -
03/30/11 Radian6 84.7% 15.3% - $326
02/01/11 Manymoon - - - -
01/06/11 Dimdim 100.0% - - $31
12/21/10 Etacts - - - -
12/08/10 Heroku 100.0% - - $212
09/24/10 Activa Live - - - -
06/04/10 Sitemasher - - - -
04/21/10 Jigsaw Data Corporation 100.0% - - $142
01/21/10 Informavores - - - -
12/11/09 GroupSwim - - - -
08/04/08 InStranet - - $32 $27
10/23/07 CrispyNews - - - -
04/10/07 Koral - - - -
SAP Known acquired value (since 2007): $19,995
05/16/13 KMS Software - - - -
03/07/13 Camilion Solutions - - - -
02/22/13 SmartOps - - - -
01/31/13 Ticket-Web GmbH - - - -
05/22/12 Ariba 100.0% - $4,500 $4,267
04/30/12 Purisma 100.0% - $2 $2
04/10/12 Syclo - - - -
01/16/12 Datango AG (assets) - - - -
12/03/11 SuccessFactors 100.0% - $3,650 $3,400
09/20/11 Crossgate AG - - - -
09/06/11 Right Hemisphere - - - -
01/12/11 SECUDE AG (IdM assets) - - - -
12/16/10 cundus AG (disclosure management assets) - - - -
05/12/10 Sybase 100.0% - $6,100 $5,800
04/21/10 TechniData AG - - - -
12/03/09 SOALogix - - - -
07/20/09 SAF Simulation, Analysis & Forecasting 100.0% - $91 $49
06/10/09 SkyData Systems - - - -
05/11/09 Clear Standards - - - -
05/06/09 Highdeal - - - -
02/18/09 Coghead - - - -
07/10/08 Ness Technologies (SAP distribution division) - - - $21
06/17/08 Visiprise - - - -
10/17/07 YASU Technologies - - - -
10/07/07 Business Objects 100.0% - $6,770 $6,455
Continued

Copyright ©2013 Shea & Company, LLC
M&A Activity
Most Active Software Acquirers continued
16
EMC
Cisco
Dell
HP
IBM
Intel
Intuit
Microsoft
SAP
CA
Salesforce
Oracle
Symantec
VMware
Note: “Known acquired value” includes only transactions for which data was publicly available (2007 – 2013 YTD)
2007 – 2013 YTD ($ millions)
Consideration Equity Enterprise
Date Target % Cash % Stock Value Value
VMware (continued)
02/23/10 RTO Software - - - -
01/12/10 Zimbra 100.0% - - $100
08/10/09 SpringSource 86.2% 13.8% $362 $420
11/26/08 Tungsten Graphics - - - -
11/10/08 Trango Virtual Processors - - - -
10/09/08 Blue Lane Technologies - - - -
05/28/08 B-hive Networks - - - $61
01/15/08 Thinstall - - - -
01/14/08 Foedus - - - -
10/01/07 Sciant - - - $9
09/11/07 Dunes Technologies 100.0% - - $45
08/07/07 Determina 100.0% - - $9
06/11/07 Propero 100.0% - - $21
Copyright © 2013 Shea & Company, LLC 17
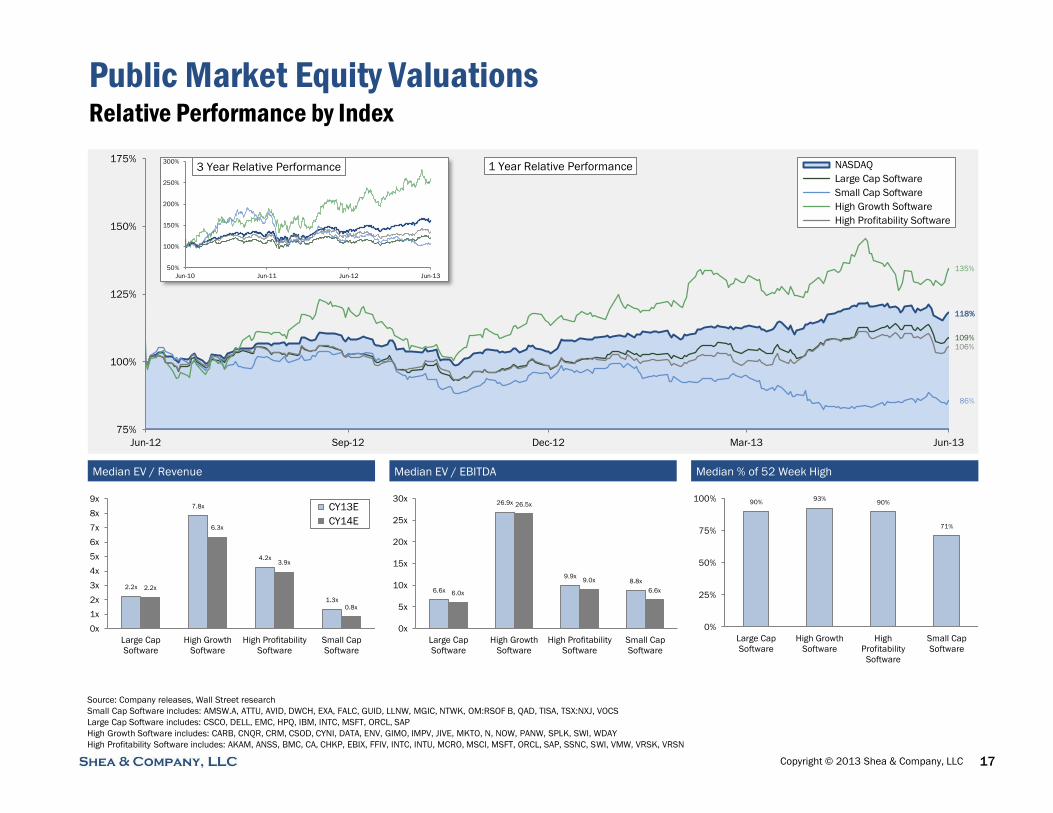
Public Market Equity Valuations Relative Performance by Index
Median EV / Revenue Median EV / EBITDA Median % of 52 Week High
Source: Company releases, Wall Street research
Small Cap Software includes: AMSW.A, ATTU, AVID, DWCH, EXA, FALC, GUID, LLNW, MGIC, NTWK, OM:RSOF B, QAD, TISA, TSX:NXJ, VOCS
Large Cap Software includes: CSCO, DELL, EMC, HPQ, IBM, INTC, MSFT, ORCL, SAP
High Growth Software includes: CARB, CNQR, CRM, CSOD, CYNI, DATA, ENV, GIMO, IMPV, JIVE, MKTO, N, NOW, PANW, SPLK, SWI, WDAY
High Profitability Software includes: AKAM, ANSS, BMC, CA, CHKP, EBIX, FFIV, INTC, INTU, MCRO, MSCI, MSFT, ORCL, SAP, SSNC, SWI, VMW, VRSK, VRSN
109%
86%
135%
106%
75%
100%
125%
150%
175%
Jun-12 Sep-12 Dec-12 Mar-13 Jun-13
1 Year Relative Performance NASDAQ
Large Cap Software
Small Cap Software
High Growth Software
High Profitability Software
50%
100%
150%
200%
250%
300%
Jun-10 Jun-11 Jun-12 Jun-13
3 Year Relative Performance
2.2x
7.8x
4.2x
1.3x
2.2x
6.3x
3.9x
0.8x
0x
1x
2x
3x
4x
5x
6x
7x
8x
9x
Large Cap
Software
High Growth
Software
High Profitability
Software
Small Cap
Software
CY13E
CY14E
6.6x
26.9x
9.9x 8.8x
6.0x
26.5x
9.0x
6.6x
0x
5x
10x
15x
20x
25x
30x
Large Cap
Software
High Growth
Software
High Profitability
Software
Small Cap
Software
90% 93%
90%
71%
0%
25%
50%
75%
100%
Large Cap
Software
High Growth
Software
High
Profitability
Software
Small Cap
Software
118%

Copyright ©2013 Shea & Company, LLC
Public Equity Market Valuations
Price Performance and Valuation Metrics by Segment
18
Source: Company releases, Wall Street research
Me
dia
n E
V /
Re
ve
nu
e
Me
dia
n E
V /
EB
ITD
A
Me
dia
n %
of
52
We
ek
Hig
h
nm
17.3x
23.7x
14.6x
9.0x
11.8x
17.3x
11.3x
9.9x
12.3x
15.8x
8.9x
6.6x
8.9x
11.6x
26.9x
18.7x
9.9x 8.8x
nm
18.0x 18.3x
12.5x
8.3x
10.7x 10.2x 10.3x
8.6x 9.2x
21.0x
8.2x
6.0x
9.3x 10.3x
26.5x
16.5x
9.0x
6.6x
0x
5x
10x
15x
20x
25x
30x
12.3x
4.7x
4.2x 4.0x 4.0x 3.6x 3.4x
3.1x 2.9x 2.7x 2.6x 2.5x
2.2x 2.2x 1.9x
7.8x
5.7x
4.2x
1.3x
8.8x
4.3x
3.5x 3.6x 3.4x 3.3x 2.8x 2.9x
2.5x 2.7x
2.1x 2.4x 2.2x 2.1x
1.8x
6.3x
4.8x
3.9x
0.8x
0x
2x
4x
6x
8x
10x
12x
14x CY13E CY14E
Median CY13E Median CY14E
94% 95% 91%
97% 94% 93%
84% 87%
70%
87% 92% 94%
90% 84%
97% 93% 94%
90%
71%
0%
25%
50%
75%
100%
125%
HCM ERP &
Gen.
Bus. Apps
Business
Intelligence
Supply
Chain
Mgmt
IT Security Financial
Apps
Marketing
Apps
Platforms,
Dev Tools
& Deployment
App
Delivery
&
Network
Acceleration
Sys. &
Network
Mgmt
Storage
Mgmt
Tech.
&
Embedded
Apps
Global
Diversified
Network
Infra.
Content
Mgmt
High
Growth
SaaS High
Profitability
Small Cap
% of 52-Wk High
Median % of 52-Wk High

Copyright ©2013 Shea & Company, LLC
Public Equity Market Valuations
Price Performance and Valuation Metrics of Notable Software Vendors
19
EV
/ R
eve
nu
e
EV
/ E
BIT
DA
%
of
52
We
ek
Hig
h
Source: Company releases, Wall Street research
6.7x
5.4x
5.0x 4.8x 4.7x
3.8x 3.6x 3.5x 3.4x
3.2x
2.8x 2.7x 2.6x
2.3x 2.2x 2.0x 2.0x
1.8x
1.4x
0.6x 0.3x
6.2x
4.3x
4.7x 4.4x
4.1x
3.5x 3.3x 3.3x
3.0x 3.1x
2.6x 2.6x 2.6x 2.2x 2.2x 2.0x
1.9x
1.7x
1.3x
0.6x 0.3x
0x
2x
4x
6x
8x CY13E CY14E
Median CY13E Median CY14E
14.8x
33.1x
17.2x
14.4x
12.0x 11.2x
9.2x
7.1x
10.6x 9.9x 9.1x
6.6x 6.9x 5.9x
8.2x
6.3x 6.3x
7.0x 6.4x
4.3x 5.4x
13.5x
24.9x
14.6x
12.8x
10.5x 9.9x 8.7x
6.5x
9.4x 9.3x 8.6x
6.0x 6.8x
5.5x
7.8x
5.3x 5.9x
6.2x 5.5x 4.3x 4.6x
0x
10x
20x
30x
40x
96%
80%
97% 96%
65%
87% 89%
84%
70%
96% 93%
97% 96%
90% 89%
89%
97%
84%
96% 96%
91%
0%
25%
50%
75%
100%
vrsk CRM ADBE DSY VMW SAP INTU ORCL CTXS FISV FIS MSFT CA intc IBM SYMC CSCO EMC NTAP
52-Wk High
Median % of 52-Wk High

Copyright ©2013 Shea & Company, LLC
Public Equity Market Valuations
Equity Trading Multiples by Growth Tranche
20
Market Valuations of Publicly-Traded Software Companies by Growth Tranche Forward Year Median EV / Revenue by Growth Tranche
Forward Year Median P/E by Growth Tranche
Source: Company releases, Wall Street research
EV / Revenue Price / Earnings
Revenue Current Year Forward Year Current Year Forward Year
Growth Date Mean Median Mean Median Mean Median Mean Median
< 5% 2Q 2013 2.3 x 2.3 x 2.2 x 2.2 x 17.0 x 13.2 x 14.3 x 11.5 x
1Q 2013 2.2 2.3 2.2 2.2 14.0 13.6 12.2 11.6
4Q 2012 1.8 2.0 1.9 2.0 15.6 14.7 15.3 13.2
3Q 2012 1.8 1.9 1.8 1.9 14.2 12.8 12.3 11.5
2Q 2012 1.8 1.9 1.7 1.8 13.4 12.2 11.4 10.9
1Q 2012 2.3 2.2 2.2 2.1 13.8 13.6 12.6 12.3
4Q 2011 2.1 2.0 2.0 1.9 14.0 13.7 13.1 12.1
3Q 2011 1.8 1.9 1.7 1.8 11.1 11.2 11.1 10.4
2Q 2011 2.4 2.6 2.3 2.5 12.9 13.9 11.7 12.4
1Q 2011 2.2 2.5 2.2 2.4 12.5 13.2 11.5 12.4
4Q 2010 2.6 2.4 2.7 2.4 19.9 18.7 18.7 16.2
3Q 2010 2.3 2.1 2.2 2.0 17.1 14.3 16.3 13.8
5 - 10% 2Q 2013 2.7 x 2.5 x 2.5 x 2.3 x 20.1 x 17.4 x 16.6 x 15.4 x
1Q 2013 2.9 2.6 2.7 2.5 20.1 18.1 16.7 15.1
4Q 2012 3.1 3.0 2.8 2.8 22.0 19.7 18.7 17.7
3Q 2012 2.7 2.4 2.5 2.2 21.6 18.0 16.9 15.2
2Q 2012 2.7 2.4 2.5 2.3 17.1 15.6 13.9 13.4
1Q 2012 3.0 2.5 2.7 2.3 16.9 17.3 14.6 15.1
4Q 2011 2.3 2.1 2.1 2.0 17.6 14.7 13.4 11.5
3Q 2011 2.2 2.1 2.0 1.9 15.9 13.0 12.3 11.2
2Q 2011 2.6 2.4 2.4 2.2 18.0 16.3 14.3 14.6
1Q 2011 2.9 2.5 2.6 2.3 20.2 18.6 16.5 15.6
4Q 2010 2.9 2.7 2.7 2.5 17.7 17.1 14.8 14.3
3Q 2010 2.6 2.5 2.4 2.4 17.3 15.8 14.4 14.3
10 - 20% 2Q 2013 3.5 x 3.1 x 3.1 x 2.8 x 33.2 x 24.3 x 29.2 x 22.2 x
1Q 2013 3.3 3.1 2.9 2.6 33.6 27.0 25.6 21.2
4Q 2012 3.6 3.2 3.2 2.9 31.8 25.0 27.4 22.0
3Q 2012 3.9 3.3 3.4 2.9 28.6 25.8 23.1 21.3
2Q 2012 3.6 2.7 3.1 2.4 25.7 22.7 20.9 19.4
1Q 2012 4.1 3.3 3.6 2.8 30.9 28.6 25.6 22.4
4Q 2011 3.4 2.9 3.0 2.6 27.1 24.5 21.2 20.3
3Q 2011 3.1 2.5 2.7 2.3 24.5 20.7 18.6 16.8
2Q 2011 4.3 3.7 3.7 3.3 33.0 27.9 26.0 22.3
1Q 2011 4.4 3.9 3.9 3.5 32.0 27.3 27.2 22.4
4Q 2010 3.8 3.7 3.3 3.2 32.3 26.6 26.9 22.4
3Q 2010 3.7 3.3 3.3 2.9 34.4 28.0 26.6 22.0
> 20% 2Q 2013 7.8 x 6.4 x 6.0 x 5.3 x 56.2 x 58.5 x 47.8 x 48.1 x
1Q 2013 6.9 6.2 5.4 5.0 59.2 62.5 52.3 49.0
4Q 2012 7.7 7.3 5.9 5.9 55.2 47.4 49.0 41.1
3Q 2012 7.9 6.7 6.0 5.3 54.9 52.8 52.1 49.9
2Q 2012 6.4 6.0 5.0 4.9 51.0 49.4 48.4 39.1
1Q 2012 6.4 6.1 5.0 5.0 46.8 37.2 38.2 31.1
4Q 2011 6.4 6.4 5.0 5.0 48.3 41.9 35.9 33.3
3Q 2011 5.2 4.8 4.1 3.9 47.0 43.3 79.8 33.0
2Q 2011 6.6 6.7 5.4 5.5 44.7 45.2 39.1 39.1
1Q 2011 6.6 7.2 5.4 5.9 58.2 54.2 45.4 42.1
4Q 2010 7.3 7.2 5.7 6.0 52.5 52.0 42.2 37.0
3Q 2010 6.5 7.2 5.2 5.7 48.9 49.7 38.1 36.1
-
1x
2x
3x
4x
5x
6x
7x
1Q 2Q 3Q 4Q 1Q 2Q 3Q 4Q 1Q 2Q 3Q 4Q 1Q 2Q 3Q 4Q 1Q 2Q
2009 2010 2011 2012 2013
> 20% growth
10 - 20% growth
5 - 10% growth
< 5% growth
-
10x
20x
30x
40x
50x
60x
1Q 2Q 3Q 4Q 1Q 2Q 3Q 4Q 1Q 2Q 3Q 4Q 1Q 2Q 3Q 4Q 1Q 2Q
2009 2010 2011 2012 2013
Copyright ©2013 Shea & Company, LLC
Public Equity Market Valuations
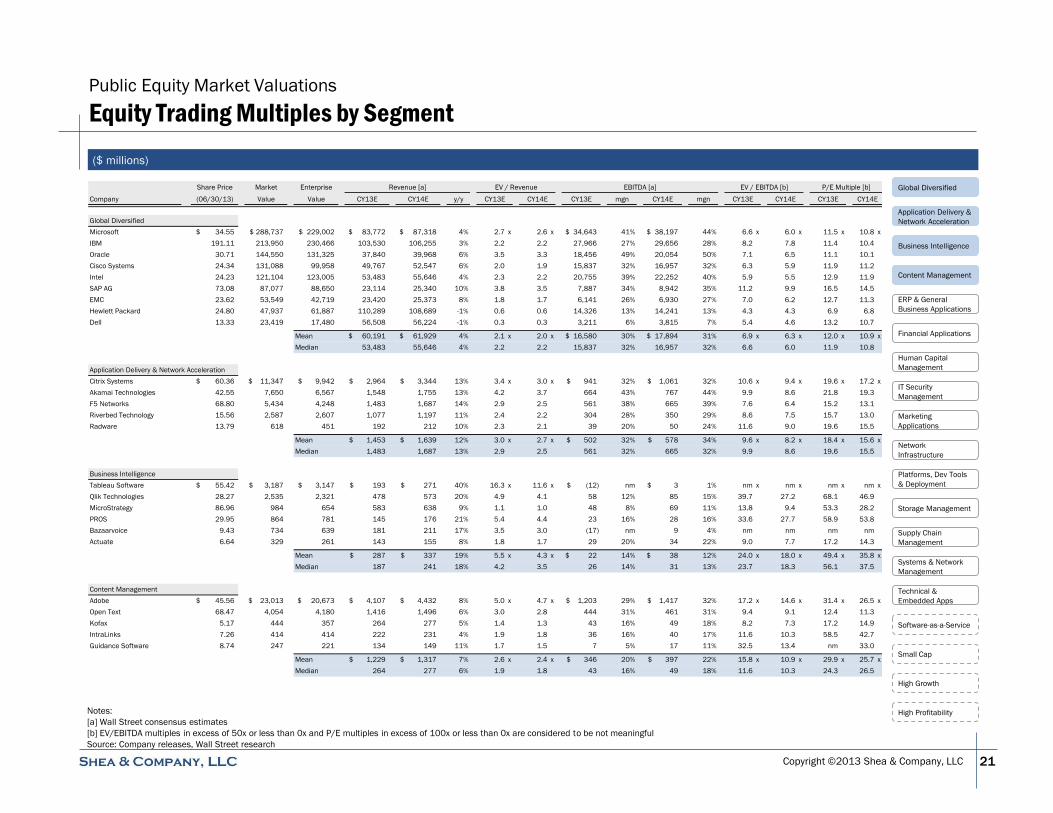
Equity Trading Multiples by Segment
21
Notes:
[a] Wall Street consensus estimates
[b] EV/EBITDA multiples in excess of 50x or less than 0x and P/E multiples in excess of 100x or less than 0x are considered to be not meaningful
Source: Company releases, Wall Street research
Business Intelligence
Global Diversified
ERP & General
Business Applications
Financial Applications
Human Capital
Management
IT Security
Management
Network
Infrastructure
Platforms, Dev Tools
& Deployment
Storage Management
Systems & Network
Management
Technical &
Embedded Apps
High Growth
High Profitability
Software-as-a-Service
Supply Chain
Management
Small Cap
Marketing
Applications
Application Delivery &
Network Acceleration
Content Management
($ millions)
Share Price Market Enterprise Revenue [a] EV / Revenue EBITDA [a] EV / EBITDA [b] P/E Multiple [b]
Company (06/30/13) Value Value CY13E CY14E y/y CY13E CY14E CY13E mgn CY14E mgn CY13E CY14E CY13E CY14E
Global Diversified
Microsoft 34.55$ 288,737$ 229,002$ 83,772$ 87,318$ 4% 2.7 x 2.6 x 34,643$ 41% 38,197$ 44% 6.6 x 6.0 x 11.5 x 10.8 x
IBM 191.11 213,950 230,466 103,530 106,255 3% 2.2 2.2 27,966 27% 29,656 28% 8.2 7.8 11.4 10.4
Oracle 30.71 144,550 131,325 37,840 39,968 6% 3.5 3.3 18,456 49% 20,054 50% 7.1 6.5 11.1 10.1
Cisco Systems 24.34 131,088 99,958 49,767 52,547 6% 2.0 1.9 15,837 32% 16,957 32% 6.3 5.9 11.9 11.2
Intel 24.23 121,104 123,005 53,483 55,646 4% 2.3 2.2 20,755 39% 22,252 40% 5.9 5.5 12.9 11.9
SAP AG 73.08 87,077 88,650 23,114 25,340 10% 3.8 3.5 7,887 34% 8,942 35% 11.2 9.9 16.5 14.5
EMC 23.62 53,549 42,719 23,420 25,373 8% 1.8 1.7 6,141 26% 6,930 27% 7.0 6.2 12.7 11.3
Hewlett Packard 24.80 47,937 61,887 110,289 108,689 -1% 0.6 0.6 14,326 13% 14,241 13% 4.3 4.3 6.9 6.8
Dell 13.33 23,419 17,480 56,508 56,224 -1% 0.3 0.3 3,211 6% 3,815 7% 5.4 4.6 13.2 10.7
Mean 60,191$ 61,929$ 4% 2.1 x 2.0 x 16,580$ 30% 17,894$ 31% 6.9 x 6.3 x 12.0 x 10.9 x
Median 53,483 55,646 4% 2.2 2.2 15,837 32% 16,957 32% 6.6 6.0 11.9 10.8
Application Delivery & Network Acceleration
Citrix Systems 60.36$ 11,347$ 9,942$ 2,964$ 3,344$ 13% 3.4 x 3.0 x 941$ 32% 1,061$ 32% 10.6 x 9.4 x 19.6 x 17.2 x
Akamai Technologies 42.55 7,650 6,567 1,548 1,755 13% 4.2 3.7 664 43% 767 44% 9.9 8.6 21.8 19.3
F5 Networks 68.80 5,434 4,248 1,483 1,687 14% 2.9 2.5 561 38% 665 39% 7.6 6.4 15.2 13.1
Riverbed Technology 15.56 2,587 2,607 1,077 1,197 11% 2.4 2.2 304 28% 350 29% 8.6 7.5 15.7 13.0
Radware 13.79 618 451 192 212 10% 2.3 2.1 39 20% 50 24% 11.6 9.0 19.6 15.5
Mean 1,453$ 1,639$ 12% 3.0 x 2.7 x 502$ 32% 578$ 34% 9.6 x 8.2 x 18.4 x 15.6 x
Median 1,483 1,687 13% 2.9 2.5 561 32% 665 32% 9.9 8.6 19.6 15.5
Business Intelligence
Tableau Software 55.42$ 3,187$ 3,147$ 193$ 271$ 40% 16.3 x 11.6 x (12)$ nm 3$ 1% nm x nm x nm x nm x
Qlik Technologies 28.27 2,535 2,321 478 573 20% 4.9 4.1 58 12% 85 15% 39.7 27.2 68.1 46.9
MicroStrategy 86.96 984 654 583 638 9% 1.1 1.0 48 8% 69 11% 13.8 9.4 53.3 28.2
PROS 29.95 864 781 145 176 21% 5.4 4.4 23 16% 28 16% 33.6 27.7 58.9 53.8
Bazaarvoice 9.43 734 639 181 211 17% 3.5 3.0 (17) nm 9 4% nm nm nm nm
Actuate 6.64 329 261 143 155 8% 1.8 1.7 29 20% 34 22% 9.0 7.7 17.2 14.3
Mean 287$ 337$ 19% 5.5 x 4.3 x 22$ 14% 38$ 12% 24.0 x 18.0 x 49.4 x 35.8 x
Median 187 241 18% 4.2 3.5 26 14% 31 13% 23.7 18.3 56.1 37.5
Content Management
Adobe 45.56$ 23,013$ 20,673$ 4,107$ 4,432$ 8% 5.0 x 4.7 x 1,203$ 29% 1,417$ 32% 17.2 x 14.6 x 31.4 x 26.5 x
Open Text 68.47 4,054 4,180 1,416 1,496 6% 3.0 2.8 444 31% 461 31% 9.4 9.1 12.4 11.3
Kofax 5.17 444 357 264 277 5% 1.4 1.3 43 16% 49 18% 8.2 7.3 17.2 14.9
IntraLinks 7.26 414 414 222 231 4% 1.9 1.8 36 16% 40 17% 11.6 10.3 58.5 42.7
Guidance Software 8.74 247 221 134 149 11% 1.7 1.5 7 5% 17 11% 32.5 13.4 nm 33.0
Mean 1,229$ 1,317$ 7% 2.6 x 2.4 x 346$ 20% 397$ 22% 15.8 x 10.9 x 29.9 x 25.7 x
Median 264 277 6% 1.9 1.8 43 16% 49 18% 11.6 10.3 24.3 26.5
Copyright ©2013 Shea & Company, LLC
Public Equity Market Valuations
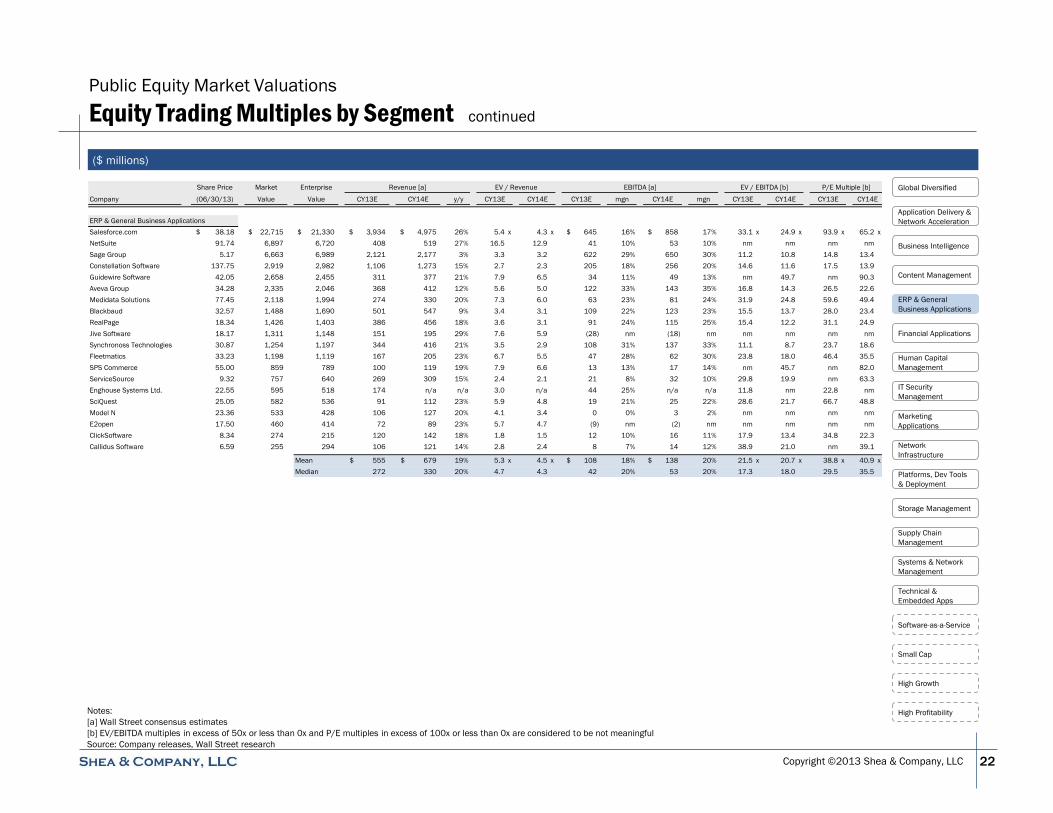
Equity Trading Multiples by Segment continued
22
($ millions)
Notes:
[a] Wall Street consensus estimates
[b] EV/EBITDA multiples in excess of 50x or less than 0x and P/E multiples in excess of 100x or less than 0x are considered to be not meaningful
Source: Company releases, Wall Street research
Share Price Market Enterprise Revenue [a] EV / Revenue EBITDA [a] EV / EBITDA [b] P/E Multiple [b]
Company (06/30/13) Value Value CY13E CY14E y/y CY13E CY14E CY13E mgn CY14E mgn CY13E CY14E CY13E CY14E
ERP & General Business Applications
Salesforce.com 38.18$ 22,715$ 21,330$ 3,934$ 4,975$ 26% 5.4 x 4.3 x 645$ 16% 858$ 17% 33.1 x 24.9 x 93.9 x 65.2 x
NetSuite 91.74 6,897 6,720 408 519 27% 16.5 12.9 41 10% 53 10% nm nm nm nm
Sage Group 5.17 6,663 6,989 2,121 2,177 3% 3.3 3.2 622 29% 650 30% 11.2 10.8 14.8 13.4
Constellation Software 137.75 2,919 2,982 1,106 1,273 15% 2.7 2.3 205 18% 256 20% 14.6 11.6 17.5 13.9
Guidewire Software 42.05 2,658 2,455 311 377 21% 7.9 6.5 34 11% 49 13% nm 49.7 nm 90.3
Aveva Group 34.28 2,335 2,046 368 412 12% 5.6 5.0 122 33% 143 35% 16.8 14.3 26.5 22.6
Medidata Solutions 77.45 2,118 1,994 274 330 20% 7.3 6.0 63 23% 81 24% 31.9 24.8 59.6 49.4
Blackbaud 32.57 1,488 1,690 501 547 9% 3.4 3.1 109 22% 123 23% 15.5 13.7 28.0 23.4
RealPage 18.34 1,426 1,403 386 456 18% 3.6 3.1 91 24% 115 25% 15.4 12.2 31.1 24.9
Jive Software 18.17 1,311 1,148 151 195 29% 7.6 5.9 (28) nm (18) nm nm nm nm nm
Synchronoss Technologies 30.87 1,254 1,197 344 416 21% 3.5 2.9 108 31% 137 33% 11.1 8.7 23.7 18.6
Fleetmatics 33.23 1,198 1,119 167 205 23% 6.7 5.5 47 28% 62 30% 23.8 18.0 46.4 35.5
SPS Commerce 55.00 859 789 100 119 19% 7.9 6.6 13 13% 17 14% nm 45.7 nm 82.0
ServiceSource 9.32 757 640 269 309 15% 2.4 2.1 21 8% 32 10% 29.8 19.9 nm 63.3
Enghouse Systems Ltd. 22.55 595 518 174 n/a n/a 3.0 n/a 44 25% n/a n/a 11.8 nm 22.8 nm
SciQuest 25.05 582 536 91 112 23% 5.9 4.8 19 21% 25 22% 28.6 21.7 66.7 48.8
Model N 23.36 533 428 106 127 20% 4.1 3.4 0 0% 3 2% nm nm nm nm
E2open 17.50 460 414 72 89 23% 5.7 4.7 (9) nm (2) nm nm nm nm nm
ClickSoftware 8.34 274 215 120 142 18% 1.8 1.5 12 10% 16 11% 17.9 13.4 34.8 22.3
Callidus Software 6.59 255 294 106 121 14% 2.8 2.4 8 7% 14 12% 38.9 21.0 nm 39.1
Mean 555$ 679$ 19% 5.3 x 4.5 x 108$ 18% 138$ 20% 21.5 x 20.7 x 38.8 x 40.9 x
Median 272 330 20% 4.7 4.3 42 20% 53 20% 17.3 18.0 29.5 35.5
Business Intelligence
Global Diversified
ERP & General
Business Applications
Financial Applications
Human Capital
Management
IT Security
Management
Network
Infrastructure
Platforms, Dev Tools
& Deployment
Storage Management
Systems & Network
Management
Technical &
Embedded Apps
High Growth
High Profitability
Software-as-a-Service
Supply Chain
Management
Small Cap
Marketing
Applications
Application Delivery &
Network Acceleration
Content Management

Copyright ©2013 Shea & Company, LLC
Public Equity Market Valuations
Equity Trading Multiples by Segment continued
23
($ millions)
Notes:
[a] Wall Street consensus estimates
[b] EV/EBITDA multiples in excess of 50x or less than 0x and P/E multiples in excess of 100x or less than 0x are considered to be not meaningful
Source: Company releases, Wall Street research
Share Price Market Enterprise Revenue [a] EV / Revenue EBITDA [a] EV / EBITDA [b] P/E Multiple [b]
Company (06/30/13) Value Value CY13E CY14E y/y CY13E CY14E CY13E mgn CY14E mgn CY13E CY14E CY13E CY14E
Financial Applications
Intuit 61.04$ 18,350$ 16,766$ 4,700$ 5,075$ 8% 3.6 x 3.3 x 1,818$ 39% 1,931$ 38% 9.2 x 8.7 x 17.3 x 16.4 x
FIS 42.84 12,786 16,957 6,097 6,415 5% 2.8 2.6 1,856 30% 1,973 31% 9.1 8.6 15.1 13.6
Fiserv 87.41 11,765 15,458 4,838 5,056 5% 3.2 3.1 1,555 32% 1,670 33% 9.9 9.3 14.7 13.2
Verisk Analytics 59.70 10,378 11,556 1,723 1,874 9% 6.7 6.2 782 45% 859 46% 14.8 13.5 25.9 22.9
Concur 81.38 5,033 4,486 573 707 23% 7.8 6.3 125 22% 159 22% 35.9 28.3 75.9 62.9
Jack Henry 47.13 4,063 4,013 1,165 1,257 8% 3.4 3.2 390 33% 421 34% 10.3 9.5 21.3 19.4
MSCI 33.27 4,052 4,618 1,018 1,065 5% 4.5 4.3 444 44% 461 43% 10.4 10.0 15.6 14.5
SS&C Technologies 32.90 2,876 3,775 718 776 8% 5.3 4.9 289 40% 322 42% 13.1 11.7 17.7 15.7
Advent Software 35.06 1,919 1,765 379 403 6% 4.7 4.4 89 24% 116 29% 19.8 15.2 29.1 26.9
Fair Isaac 45.83 1,666 2,022 777 817 5% 2.6 2.5 238 31% 238 29% 8.5 8.5 13.8 12.9
SimCorp 29.66 1,263 1,185 301 338 12% 3.9 3.5 78 26% 90 27% 15.2 13.1 23.4 19.3
Fidessa 29.32 1,094 977 429 449 5% 2.3 2.2 118 27% 124 28% 8.3 7.9 23.4 22.1
Bottomline Technologies 25.29 968 820 266 293 10% 3.1 2.8 52 19% 65 22% 15.9 12.5 20.7 17.8
IRESS Market Technology 6.85 881 823 194 205 6% 4.2 4.0 66 34% 73 35% 12.5 11.3 20.0 18.1
Envestnet 24.60 857 827 233 307 32% 3.6 2.7 40 17% 55 18% 20.7 14.9 43.0 29.8
Ellie Mae 23.08 641 528 131 159 21% 4.0 3.3 45 34% 58 36% 11.8 9.1 21.2 17.3
Ebix 9.26 361 396 210 n/a n/a 1.9 n/a 82 39% n/a n/a 4.8 nm 6.1 nm
Mean 1,397$ 1,575$ 11% 4.0 x 3.7 x 474$ 32% 538$ 32% 13.5 x 12.0 x 23.8 x 21.4 x
Median 573 741 8% 3.6 3.3 125 32% 198 32% 11.8 10.7 20.7 18.0
Human Capital Management
Workday 64.09$ 12,269$ 11,551$ 439$ 664$ 51% 26.3 x 17.4 x (96)$ nm (87)$ nm nm x nm x nm x nm x
Ultimate Software 117.29 3,366 3,298 409 500 22% 8.1 6.6 58 14% 107 21% nm 30.9 84.5 64.0
Cornerstone OnDemand 43.30 2,312 2,243 182 255 40% 12.3 8.8 (0) nm 11 4% nm nm nm nm
Mean 343$ 473$ 38% 15.6 x 10.9 x (13)$ 14% 10$ 13% nm x nm x nm x nm x
Median 409 500 40% 12.3 8.8 (0) nm 11 13% nm nm nm nm
Business Intelligence
Global Diversified
ERP & General
Business Applications
Financial Applications
Human Capital
Management
IT Security
Management
Network
Infrastructure
Platforms, Dev Tools
& Deployment
Storage Management
Systems & Network
Management
Technical &
Embedded Apps
High Growth
High Profitability
Software-as-a-Service
Supply Chain
Management
Small Cap
Marketing
Applications
Application Delivery &
Network Acceleration
Content Management
Copyright ©2013 Shea & Company, LLC
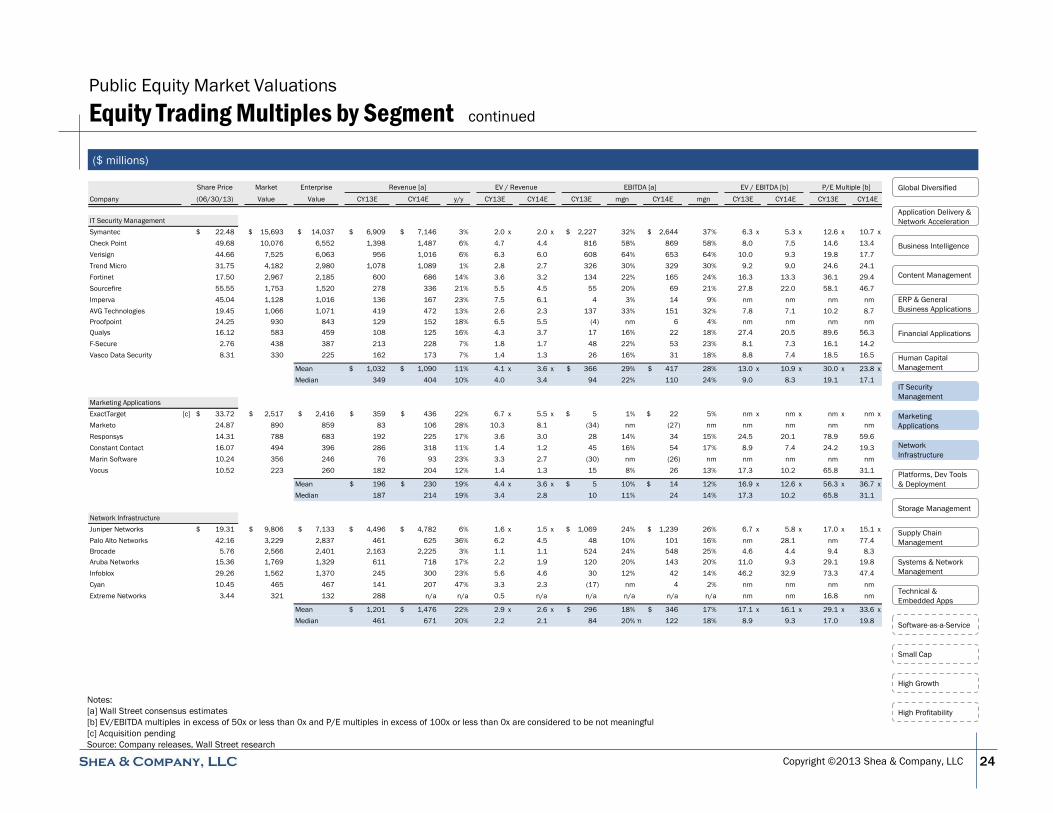
Public Equity Market Valuations
Equity Trading Multiples by Segment continued
24
($ millions)
Notes:
[a] Wall Street consensus estimates
[b] EV/EBITDA multiples in excess of 50x or less than 0x and P/E multiples in excess of 100x or less than 0x are considered to be not meaningful
[c] Acquisition pending
Source: Company releases, Wall Street research
Share Price Market Enterprise Revenue [a] EV / Revenue EBITDA [a] EV / EBITDA [b] P/E Multiple [b]
Company (06/30/13) Value Value CY13E CY14E y/y CY13E CY14E CY13E mgn CY14E mgn CY13E CY14E CY13E CY14E
IT Security Management
Symantec 22.48$ 15,693$ 14,037$ 6,909$ 7,146$ 3% 2.0 x 2.0 x 2,227$ 32% 2,644$ 37% 6.3 x 5.3 x 12.6 x 10.7 x
Check Point 49.68 10,076 6,552 1,398 1,487 6% 4.7 4.4 816 58% 869 58% 8.0 7.5 14.6 13.4
Verisign 44.66 7,525 6,063 956 1,016 6% 6.3 6.0 608 64% 653 64% 10.0 9.3 19.8 17.7
Trend Micro 31.75 4,182 2,980 1,078 1,089 1% 2.8 2.7 326 30% 329 30% 9.2 9.0 24.6 24.1
Fortinet 17.50 2,967 2,185 600 686 14% 3.6 3.2 134 22% 165 24% 16.3 13.3 36.1 29.4
Sourcefire 55.55 1,753 1,520 278 336 21% 5.5 4.5 55 20% 69 21% 27.8 22.0 58.1 46.7
Imperva 45.04 1,128 1,016 136 167 23% 7.5 6.1 4 3% 14 9% nm nm nm nm
AVG Technologies 19.45 1,066 1,071 419 472 13% 2.6 2.3 137 33% 151 32% 7.8 7.1 10.2 8.7
Proofpoint 24.25 930 843 129 152 18% 6.5 5.5 (4) nm 6 4% nm nm nm nm
Qualys 16.12 583 459 108 125 16% 4.3 3.7 17 16% 22 18% 27.4 20.5 89.6 56.3
F-Secure 2.76 438 387 213 228 7% 1.8 1.7 48 22% 53 23% 8.1 7.3 16.1 14.2
Vasco Data Security 8.31 330 225 162 173 7% 1.4 1.3 26 16% 31 18% 8.8 7.4 18.5 16.5
Mean 1,032$ 1,090$ 11% 4.1 x 3.6 x 366$ 29% 417$ 28% 13.0 x 10.9 x 30.0 x 23.8 x
Median 349 404 10% 4.0 3.4 94 22% 110 24% 9.0 8.3 19.1 17.1
Marketing Applications
ExactTarget [c] 33.72$ 2,517$ 2,416$ 359$ 436$ 22% 6.7 x 5.5 x 5$ 1% 22$ 5% nm x nm x nm x nm x
Marketo 24.87 890 859 83 106 28% 10.3 8.1 (34) nm (27) nm nm nm nm nm
Responsys 14.31 788 683 192 225 17% 3.6 3.0 28 14% 34 15% 24.5 20.1 78.9 59.6
Constant Contact 16.07 494 396 286 318 11% 1.4 1.2 45 16% 54 17% 8.9 7.4 24.2 19.3
Marin Software 10.24 356 246 76 93 23% 3.3 2.7 (30) nm (26) nm nm nm nm nm
Vocus 10.52 223 260 182 204 12% 1.4 1.3 15 8% 26 13% 17.3 10.2 65.8 31.1
Mean 196$ 230$ 19% 4.4 x 3.6 x 5$ 10% 14$ 12% 16.9 x 12.6 x 56.3 x 36.7 x
Median 187 214 19% 3.4 2.8 10 11% 24 14% 17.3 10.2 65.8 31.1
Network Infrastructure
Juniper Networks 19.31$ 9,806$ 7,133$ 4,496$ 4,782$ 6% 1.6 x 1.5 x 1,069$ 24% 1,239$ 26% 6.7 x 5.8 x 17.0 x 15.1 x
Palo Alto Networks 42.16 3,229 2,837 461 625 36% 6.2 4.5 48 10% 101 16% nm 28.1 nm 77.4
Brocade 5.76 2,566 2,401 2,163 2,225 3% 1.1 1.1 524 24% 548 25% 4.6 4.4 9.4 8.3
Aruba Networks 15.36 1,769 1,329 611 718 17% 2.2 1.9 120 20% 143 20% 11.0 9.3 29.1 19.8
Infoblox 29.26 1,562 1,370 245 300 23% 5.6 4.6 30 12% 42 14% 46.2 32.9 73.3 47.4
Cyan 10.45 465 467 141 207 47% 3.3 2.3 (17) nm 4 2% nm nm nm nm
Extreme Networks 3.44 321 132 288 n/a n/a 0.5 n/a n/a n/a n/a n/a nm nm 16.8 nm
Mean 1,201$ 1,476$ 22% 2.9 x 2.6 x 296$ 18% 346$ 17% 17.1 x 16.1 x 29.1 x 33.6 x
Median 461 671 20% 2.2 2.1 84 20%nm 122 18% 8.9 9.3 17.0 19.8
Business Intelligence
Global Diversified
ERP & General
Business Applications
Financial Applications
Human Capital
Management
IT Security
Management
Network
Infrastructure
Platforms, Dev Tools
& Deployment
Storage Management
Systems & Network
Management
Technical &
Embedded Apps
High Growth
High Profitability
Software-as-a-Service
Supply Chain
Management
Small Cap
Marketing
Applications
Application Delivery &
Network Acceleration
Content Management

Copyright ©2013 Shea & Company, LLC
Public Equity Market Valuations
Equity Trading Multiples by Segment continued
25
($ millions)
Notes:
[a] Wall Street consensus estimates
[b] EV/EBITDA multiples in excess of 50x or less than 0x and P/E multiples in excess of 100x or less than 0x are considered to be not meaningful
[c] Acquisition pending
Source: Company releases, Wall Street research
Business Intelligence
Global Diversified
ERP & General
Business Applications
Financial Applications
Human Capital
Management
IT Security
Management
Network
Infrastructure
Platforms, Dev Tools
& Deployment
Storage Management
Systems & Network
Management
Technical &
Embedded Apps
High Growth
High Profitability
Software-as-a-Service
Supply Chain
Management
Small Cap
Marketing
Applications
Application Delivery &
Network Acceleration
Content Management
Share Price Market Enterprise Revenue [a] EV / Revenue EBITDA [a] EV / EBITDA [b] P/E Multiple [b]
Company (06/30/13) Value Value CY13E CY14E y/y CY13E CY14E CY13E mgn CY14E mgn CY13E CY14E CY13E CY14E
Platforms, Development Tools & Deployment
Red Hat 47.82$ 9,146$ 8,323$ 1,475$ 1,691$ 15% 5.6 x 4.9 x 405$ 27% 495$ 29% 20.5 x 16.8 x 35.4 x 31.6 x
Informatica 34.98 3,910 3,319 913 1,022 12% 3.6 3.2 242 27% 283 28% 13.7 11.7 24.8 21.3
TIBCO Software 21.41 3,655 3,413 1,052 1,152 9% 3.2 3.0 272 26% 316 27% 12.5 10.8 22.0 17.8
Software AG 29.91 2,566 2,488 1,325 1,413 7% 1.9 1.8 347 26% 382 27% 7.2 6.5 11.8 10.5
Micro Focus 10.80 1,744 1,921 424 435 3% 4.5 4.4 191 45% 196 45% 10.0 9.8 11.6 10.9
Progress Software 23.01 1,299 978 333 343 3% 2.9 2.8 106 32% 125 36% 9.2 7.8 20.4 14.9
Pegasystems 33.12 1,290 1,109 504 556 10% 2.2 2.0 84 17% 95 17% 13.2 11.7 26.2 22.6
Axway Software 23.27 471 480 317 339 7% 1.5 1.4 53 17% 59 18% 9.1 8.1 12.0 11.0
Mean 793$ 869$ 8% 3.2 x 2.9 x 213$ 27% 244$ 28% 11.9 x 10.4 x 20.5 x 17.6 x
Median 709 789 8% 3.1 2.9 217 26% 240 28% 11.3 10.3 21.2 16.4
Storage Management
NetApp 37.78$ 13,770$ 9,069$ 6,569$ 6,974$ 6% 1.4 x 1.3 x 1,418$ 22% 1,659$ 24% 6.4 x 5.5 x 14.9 x 12.5 x
CommVault Systems 75.89 3,756 3,320 557 638 15% 6.0 5.2 131 24% 158 25% 25.3 21.0 47.8 41.9
Carbonite 12.39 328 271 105 130 23% 2.6 2.1 (0) nm 6 5% nm 45.1 nm nm
Mean 2,410$ 2,581$ 15% 3.3 x 2.9 x 516$ 23% 608$ 18% 15.8 x 23.9 x 31.4 x 27.2 x
Median 557 638 15% 2.6 2.1 131 23% 158 24% 15.8 21.0 31.4 27.2
Supply Chain Management
Manhattan Associates 77.16$ 1,517$ 1,408$ 413$ 452$ 9% 3.4 x 3.1 x 106$ 26% 121$ 27% 13.3 x 11.7 x 23.7 x 21.3 x
Descartes Systems 11.50 737 692 150 169 13% 4.6 4.1 44 29% 52 30% 15.8 13.4 16.5 14.2
Mean 282$ 311$ 11% 4.0 x 3.6 x 75$ 27% 86$ 29% 14.6 x 12.5 x 20.1 x 17.7 x
Median 282 311 11% 4.0 3.6 75 27% 86 29% 14.6 12.5 20.1 17.7
Systems & Network Management
VMware 66.99$ 28,916$ 24,429$ 5,175$ 5,931$ 15% 4.7 x 4.1 x 2,041$ 39% 2,332$ 39% 12.0 x 10.5 x 20.6 x 17.8 x
CA Technologies 28.62 13,037 11,551 4,503 4,508 0% 2.6 2.6 1,686 37% 1,704 38% 6.9 6.8 9.9 11.1
BMC Software [c] 45.13 6,546 6,270 2,261 2,326 3% 2.8 2.7 872 39% 878 38% 7.2 7.1 12.2 11.5
ServiceNow 40.39 5,783 5,444 398 578 45% 13.7 9.4 23 6% 70 12% nm nm nm nm
Splunk 46.36 5,278 4,947 274 364 33% 18.1 13.6 6 2% 21 6% nm nm nm nm
SolarWinds 38.81 2,969 2,695 337 420 25% 8.0 6.4 177 53% 216 51% 15.2 12.5 25.1 20.8
Compuware 10.34 2,230 2,159 967 1,033 7% 2.2 2.1 171 18% 235 23% 12.6 9.2 35.3 19.7
Netscout Systems 23.34 969 814 370 426 15% 2.2 1.9 101 27% 124 29% 8.1 6.6 17.7 14.3
LogMeIn 24.46 612 407 159 181 14% 2.6 2.2 29 18% 44 24% 14.3 9.3 49.6 31.5
Keynote Systems [c] 19.76 378 320 125 n/a n/a 2.6 n/a 17 14% n/a n/a 18.7 nm 33.3 nm
Mean 1,457$ 1,752$ 17% 5.9 x 5.0 x 512$ 25% 625$ 29% 11.9 x 8.9 x 25.5 x 18.1 x
Median 384 578 15% 2.7 2.7 136 23% 216 29% 12.3 9.2 22.8 17.8
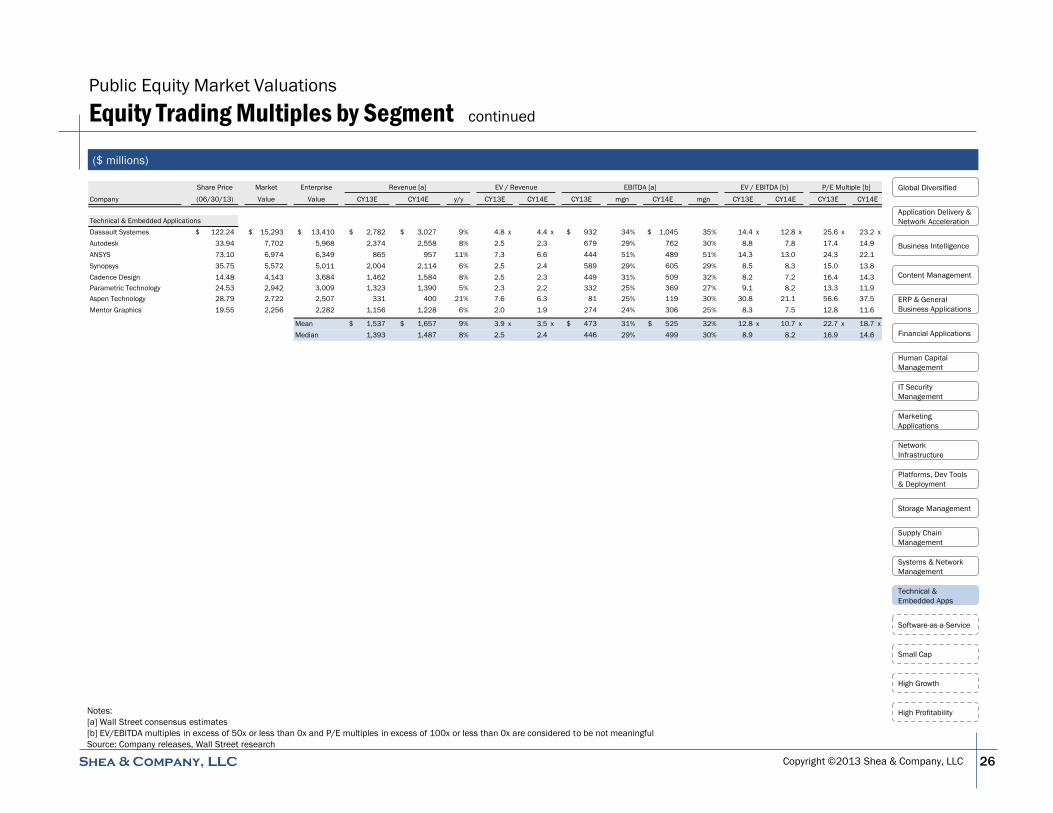
Copyright ©2013 Shea & Company, LLC 26
($ millions)
Share Price Market Enterprise Revenue [a] EV / Revenue EBITDA [a] EV / EBITDA [b] P/E Multiple [b]
Company (06/30/13) Value Value CY13E CY14E y/y CY13E CY14E CY13E mgn CY14E mgn CY13E CY14E CY13E CY14E
Technical & Embedded Applications
Dassault Systemes 122.24$ 15,293$ 13,410$ 2,782$ 3,027$ 9% 4.8 x 4.4 x 932$ 34% 1,045$ 35% 14.4 x 12.8 x 25.6 x 23.2 x
Autodesk 33.94 7,702 5,968 2,374 2,558 8% 2.5 2.3 679 29% 762 30% 8.8 7.8 17.4 14.9
ANSYS 73.10 6,974 6,349 865 957 11% 7.3 6.6 444 51% 489 51% 14.3 13.0 24.3 22.1
Synopsys 35.75 5,572 5,011 2,004 2,114 6% 2.5 2.4 589 29% 605 29% 8.5 8.3 15.0 13.8
Cadence Design 14.48 4,143 3,684 1,462 1,584 8% 2.5 2.3 449 31% 509 32% 8.2 7.2 16.4 14.3
Parametric Technology 24.53 2,942 3,009 1,323 1,390 5% 2.3 2.2 332 25% 369 27% 9.1 8.2 13.3 11.9
Aspen Technology 28.79 2,722 2,507 331 400 21% 7.6 6.3 81 25% 119 30% 30.8 21.1 56.6 37.5
Mentor Graphics 19.55 2,256 2,282 1,156 1,228 6% 2.0 1.9 274 24% 306 25% 8.3 7.5 12.8 11.6
Mean 1,537$ 1,657$ 9% 3.9 x 3.5 x 473$ 31% 525$ 32% 12.8 x 10.7 x 22.7 x 18.7 x
Median 1,393 1,487 8% 2.5 2.4 446 29% 499 30% 8.9 8.2 16.9 14.6
Business Intelligence
Global Diversified
ERP & General
Business Applications
Financial Applications
Human Capital
Management
IT Security
Management
Network
Infrastructure
Platforms, Dev Tools
& Deployment
Storage Management
Systems & Network
Management
Technical &
Embedded Apps
High Growth
High Profitability
Software-as-a-Service
Supply Chain
Management
Small Cap
Marketing
Applications
Application Delivery &
Network Acceleration
Content Management
Public Equity Market Valuations
Equity Trading Multiples by Segment continued
Notes:
[a] Wall Street consensus estimates
[b] EV/EBITDA multiples in excess of 50x or less than 0x and P/E multiples in excess of 100x or less than 0x are considered to be not meaningful
Source: Company releases, Wall Street research

Copyright ©2013 Shea & Company, LLC
Public Equity Market Valuations
Equity Trading Multiples by Comparable Subset
27
($ millions)
Share Price Market Enterprise Revenue [a] EV / Revenue EBITDA [a] EV / EBITDA [b] P/E Multiple [b]
Company (06/30/13) Value Value CY13E CY14E y/y CY13E CY14E CY13E mgn CY14E mgn CY13E CY14E CY13E CY14E
Software-as-a-Service
Salesforce.com 38.18$ 22,715$ 21,330$ 3,934$ 4,975$ 26% 5.4 x 4.3 x 645$ 16% 858$ 17% 33.1 x 24.9 x 93.9 x 65.2 x
Workday 64.09 12,269 11,551 439 664 51% 26.3 17.4 (96) nm (87) nm nm nm nm nm
NetSuite 91.74 6,897 6,720 408 519 27% 16.5 12.9 41 10% 53 10% nm nm nm nm
ServiceNow 40.39 5,783 5,444 398 578 45% 13.7 9.4 23 6% 70 12% nm nm nm nm
Splunk 46.36 5,278 4,947 274 364 33% 18.1 13.6 6 2% 21 6% nm nm nm nm
Concur 81.38 5,033 4,486 573 707 23% 7.8 6.3 125 22% 159 22% 35.9 28.3 75.9 62.9
Informatica 34.98 3,910 3,319 913 1,022 12% 3.6 3.2 242 27% 283 28% 13.7 11.7 24.8 21.3
Ultimate Software 117.29 3,366 3,298 409 500 22% 8.1 6.6 58 14% 107 21% nm 30.9 84.5 64.0
ExactTarget [c] 33.72 2,517 2,416 359 436 22% 6.7 5.5 5 1% 22 5% nm nm nm nm
Cornerstone OnDemand 43.30 2,312 2,243 182 255 40% 12.3 8.8 (0) nm 11 4% nm nm nm nm
RealPage 18.34 1,426 1,403 386 456 18% 3.6 3.1 91 24% 115 25% 15.4 12.2 31.1 24.9
Jive Software 18.17 1,311 1,148 151 195 29% 7.6 5.9 (28) nm (18) nm nm nm nm nm
Fleetmatics 33.23 1,198 1,119 167 205 23% 6.7 5.5 47 28% 62 30% 23.8 18.0 46.4 35.5
Marketo 24.87 890 859 83 106 28% 10.3 8.1 (34) nm (27) nm nm nm nm nm
SPS Commerce 55.00 859 789 100 119 19% 7.9 6.6 13 13% 17 14% nm 45.7 nm 82.0
Envestnet 24.60 857 827 233 307 32% 3.6 2.7 40 17% 55 18% 20.7 14.9 43.0 29.8
Responsys 14.31 788 683 192 225 17% 3.6 3.0 28 14% 34 15% 24.5 20.1 78.9 59.6
Bazaarvoice 9.43 734 639 181 211 17% 3.5 3.0 (17) nm 9 4% nm nm nm nm
LogMeIn 24.46 612 407 159 181 14% 2.6 2.2 29 18% 44 24% 14.3 9.3 49.6 31.5
Tangoe 15.43 597 563 191 226 19% 3.0 2.5 32 17% 40 18% 17.9 14.0 22.3 17.9
SciQuest 25.05 582 536 91 112 23% 5.9 4.8 19 21% 25 22% 28.6 21.7 66.7 48.8
Constant Contact 16.07 494 396 286 318 11% 1.4 1.2 45 16% 54 17% 8.9 7.4 24.2 19.3
IntraLinks 7.26 414 414 222 231 4% 1.9 1.8 36 16% 40 17% 11.6 10.3 58.5 42.7
Keynote Systems [c] 19.76 378 320 125 n/a n/a 2.6 n/a 17 14% n/a n/a 18.7 nm 33.3 nm
Callidus Software 6.59 255 294 106 121 14% 2.8 2.4 8 7% 14 12% 38.9 21.0 nm 39.1
Vocus 10.52 223 260 182 204 12% 1.4 1.3 15 8% 26 13% 17.3 10.2 65.8 31.1
Mean 413$ 530$ 23% 7.2 x 5.7 x 53$ 15% 79$ 16% 21.6 x 18.8 x 53.3 x 42.2 x
Median 207 255 22% 5.7 4.8 25 16% 40 17% 18.7 16.5 49.6 37.3
Business Intelligence
Global Diversified
ERP & General
Business Applications
Financial Applications
Human Capital
Management
IT Security
Management
Network
Infrastructure
Platforms, Dev Tools
& Deployment
Storage Management
Systems & Network
Management
Technical &
Embedded Apps
High Growth
High Profitability
Software-as-a-Service
Supply Chain
Management
Small Cap
Marketing
Applications
Application Delivery &
Network Acceleration
Content Management
Notes:
[a] Wall Street consensus estimates
[b] EV/EBITDA multiples in excess of 50x or less than 0x and P/E multiples in excess of 100x or less than 0x are considered to be not meaningful
[c] Acquisition pending
Source: Company releases, Wall Street research

Copyright ©2013 Shea & Company, LLC
Public Equity Market Valuations
Equity Trading Multiples by Comparable Subset continued
28
($ millions)
Share Price Market Enterprise Revenue [a] EV / Revenue EBITDA [a] EV / EBITDA [b] P/E Multiple [b]
Company (06/30/13) Value Value CY13E CY14E y/y CY13E CY14E CY13E mgn CY14E mgn CY13E CY14E CY13E CY14E
Small Cap (<$250m Market Value)
Guidance Software 8.74$ 247$ 221$ 134$ 149$ 11% 1.7 x 1.5 x 7$ 5% 17$ 11% 32.5 x 13.4 x nm x 33.0 x
American Software 8.69 241 174 104 114 10% 1.7 1.5 20 19% 24 21% 8.7 7.1 20.7 17.9
Avid Technology 5.88 228 156 546 555 2% 0.3 0.3 41 7% 52 9% 3.8 3.0 21.3 8.4
Vocus 10.52 223 260 182 204 12% 1.4 1.3 15 8% 26 13% 17.3 10.2 65.8 31.1
Limelight Networks 2.25 218 99 188 202 7% 0.5 0.5 12 6% 17 9% 8.6 5.8 nm nm
Magic Software 5.39 202 167 136 n/a n/a 1.2 n/a n/a n/a n/a n/a nm nm 10.8 nm
QAD 11.48 177 119 260 278 7% 0.5 0.4 14 5% 22 8% 8.8 5.3 26.7 16.5
Exa 10.30 151 116 56 64 16% 2.1 1.8 5 9% 9 13% 22.5 13.6 nm 47.4
ReadSoft 3.86 128 109 123 133 8% 0.9 0.8 14 11% 18 14% 8.0 6.1 15.2 11.2
Datawatch 18.04 120 115 31 n/a n/a 3.7 n/a 5 16% n/a n/a 23.9 nm nm nm
NetSol Technologies 10.06 90 106 53 n/a n/a 2.0 n/a 17 32% n/a n/a 6.3 nm 11.4 nm
Attunity 5.84 74 70 n/a n/a n/a n/a n/a n/a n/a n/a n/a nm nm nm nm
FalconStor Software 1.37 66 38 n/a n/a n/a n/a n/a n/a n/a n/a n/a nm nm nm nm
NexJ Systems 2.80 57 20 28 36 26% 0.7 0.6 (18) nm (12) nm nm nm nm nm
Top Image Systems 2.82 34 31 n/a n/a n/a n/a n/a n/a n/a n/a n/a nm nm nm nm
Mean 153$ 193$ 11% 1.4 x 1.0 x 12$ 12% 19$ 12% 14.0 x 8.0 x 24.5 x 23.6 x
Median 128 149 10% 1.3 0.8 14 9% 18 12% 8.8 6.6 20.7 17.9
High Growth (>23% CY14E Revenue Growth)
Workday 64.09$ 12,269$ 11,551$ 439$ 664$ 51% 26.3 x 17.4 x (96)$ nm (87)$ nm nm x nm x nm x nm x
Cyan 10.45 465 467 141 207 47% 3.3 2.3 (17) nm 4 2% nm nm nm nm
ServiceNow 40.39 5,783 5,444 398 578 45% 13.7 9.4 23 6% 70 12% nm nm nm nm
Tableau Software 55.42 3,187 3,147 193 271 40% 16.3 11.6 (12) nm 3 1% nm nm nm nm
Cornerstone OnDemand 43.30 2,312 2,243 182 255 40% 12.3 8.8 (0) nm 11 4% nm nm nm nm
Palo Alto Networks 42.16 3,229 2,837 461 625 36% 6.2 4.5 48 10% 101 16% nm 28.1 nm 77.4
Gigamon 27.56 818 794 150 200 33% 5.3 4.0 n/a n/a n/a n/a nm nm nm nm
Splunk 46.36 5,278 4,947 274 364 33% 18.1 13.6 6 2% 21 6% nm nm nm nm
Envestnet 24.60 857 827 233 307 32% 3.6 2.7 40 17% 55 18% 20.7 14.9 43.0 29.8
Jive Software 18.17 1,311 1,148 151 195 29% 7.6 5.9 (28) nm (18) nm nm nm nm nm
Marketo 24.87 890 859 83 106 28% 10.3 8.1 (34) nm (27) nm nm nm nm nm
NetSuite 91.74 6,897 6,720 408 519 27% 16.5 12.9 41 10% 53 10% nm nm nm nm
Salesforce.com 38.18 22,715 21,330 3,934 4,975 26% 5.4 4.3 645 16% 858 17% 33.1 24.9 93.9 65.2
SolarWinds 38.81 2,969 2,695 337 420 25% 8.0 6.4 177 53% 216 51% 15.2 12.5 25.1 20.8
Concur 81.38 5,033 4,486 573 707 23% 7.8 6.3 125 22% 159 22% 35.9 28.3 75.9 62.9
Imperva 45.04 1,128 1,016 136 167 23% 7.5 6.1 4 3% 14 9% nm nm nm nm
Carbonite 12.39 328 271 105 130 23% 2.6 2.1 (0) nm 6 5% nm 45.1 nm nm
Mean 482$ 629$ 33% 10.0 x 7.4 x 58$ 16% 90$ 13% 26.2 x 25.6 x 59.5 x 51.2 x
Median 233 307 32% 7.8 6.3 5 10% 18 10% 26.9 26.5 59.5 62.9
Business Intelligence
Global Diversified
ERP & General
Business Applications
Financial Applications
Human Capital
Management
IT Security
Management
Network
Infrastructure
Platforms, Dev Tools
& Deployment
Storage Management
Systems & Network
Management
Technical &
Embedded Apps
High Growth
High Profitability
Software-as-a-Service
Supply Chain
Management
Small Cap
Marketing
Applications
Application Delivery &
Network Acceleration
Content Management
Notes:
[a] Wall Street consensus estimates
[b] EV/EBITDA multiples in excess of 50x or less than 0x and P/E multiples in excess of 100x or less than 0x are considered to be not meaningful
Source: Company releases, Wall Street research

Copyright ©2013 Shea & Company, LLC
Public Equity Market Valuations
Equity Trading Multiples by Comparable Subset continued
29
Notes:
[a] Wall Street consensus estimates
[b] EV/EBITDA multiples in excess of 50x or less than 0x and P/E multiples in excess of 100x or less than 0x are considered to be not meaningful
[c] Acquisition pending
Source: Company releases, Wall Street research
($ millions)
Share Price Market Enterprise Revenue [a] EV / Revenue EBITDA [a] EV / EBITDA [b] P/E Multiple [b]
Company (06/30/13) Value Value CY13E CY14E y/y CY13E CY14E CY13E mgn CY14E mgn CY13E CY14E CY13E CY14E
High Profitability (>34% CY13E EBITDA Margin)
Verisign 44.66$ 7,525 6,063 956$ 1,016$ 6% 6.3 x 6.0 x 608$ 64% 653$ 64% 10.0 x 9.3 x 19.8 x 17.7 x
Check Point 49.68 10,076 6,552 1,398 1,487 6% 4.7 4.4 816 58% 869 58% 8.0 7.5 14.6 13.4
SolarWinds 38.81 2,969 2,695 337 420 25% 8.0 6.4 177 53% 216 51% 15.2 12.5 25.1 20.8
ANSYS 73.10 6,974 6,349 865 957 11% 7.3 6.6 444 51% 489 51% 14.3 13.0 24.3 22.1
Oracle 30.71 144,550 131,325 37,840 39,968 6% 3.5 3.3 18,456 49% 20,054 50% 7.1 6.5 11.1 10.1
Verisk Analytics 59.70 10,378 11,556 1,723 1,874 9% 6.7 6.2 782 45% 859 46% 14.8 13.5 25.9 22.9
Micro Focus 10.80 1,744 1,921 424 435 3% 4.5 4.4 191 45% 196 45% 10.0 9.8 11.6 10.9
MSCI 33.27 4,052 4,618 1,018 1,065 5% 4.5 4.3 444 44% 461 43% 10.4 10.0 15.6 14.5
Akamai Technologies 42.55 7,650 6,567 1,548 1,755 13% 4.2 3.7 664 43% 767 44% 9.9 8.6 21.8 19.3
Microsoft 34.55 288,737 229,002 83,772 87,318 4% 2.7 2.6 34,643 41% 38,197 44% 6.6 6.0 11.5 10.8
SS&C Technologies 32.90 2,876 3,775 718 776 8% 5.3 4.9 289 40% 322 42% 13.1 11.7 17.7 15.7
VMware 66.99 28,916 24,429 5,175 5,931 15% 4.7 4.1 2,041 39% 2,332 39% 12.0 10.5 20.6 17.8
Ebix 9.26 361 396 210 n/a n/a 1.9 n/a 82 39% n/a n/a 4.8 nm 6.1 nm
Intel 24.23 121,104 123,005 53,483 55,646 4% 2.3 2.2 20,755 39% 22,252 40% 5.9 5.5 12.9 11.9
Intuit 61.04 18,350 16,766 4,700 5,075 8% 3.6 3.3 1,818 39% 1,931 38% 9.2 8.7 17.3 16.4
BMC Software [c] 45.13 6,546 6,270 2,261 2,326 3% 2.8 2.7 872 39% 878 38% 7.2 7.1 12.2 11.5
F5 Networks 68.80 5,434 4,248 1,483 1,687 14% 2.9 2.5 561 38% 665 39% 7.6 6.4 15.2 13.1
CA Technologies 28.62 13,037 11,551 4,503 4,508 0% 2.6 2.6 1,686 37% 1,704 38% 6.9 6.8 9.9 11.1
SAP AG 73.08 87,077 88,650 23,114 25,340 10% 3.8 3.5 7,887 34% 8,942 35% 11.2 9.9 16.5 14.5
Mean 11,870$ 13,199$ 8% 4.3 x 4.1 x 4,906$ 44% 5,655$ 45% 9.7 x 9.1 x 16.3 x 15.2 x
Median 1,548 1,815 7% 4.2 3.9 782 41% 864 43% 9.9 9.0 15.6 14.5
Business Intelligence
Global Diversified
ERP & General
Business Applications
Financial Applications
Human Capital
Management
IT Security
Management
Network
Infrastructure
Platforms, Dev Tools
& Deployment
Storage Management
Systems & Network
Management
Technical &
Embedded Apps
High Growth
High Profitability
Software-as-a-Service
Supply Chain
Management
Small Cap
Marketing
Applications
Application Delivery &
Network Acceleration
Content Management

Copyright © 2013 Shea & Company, LLC 30
Public & Private Equity Financing Activity Software IPOs: Trailing Twelve Months
Source: Company releases, Wall Street research
Ma
rke
t V
alu
e (
$ m
illio
ns)
Fo
rwa
rd R
eve
nu
e M
ult
iple
$2,850
$374 $368 $361 $585
$4,488
$332 $433 $490 $465
$1,783
$560
$3,229
$460 $918
$583 $1,198
$12,269
$533 $356 $465 $890
$3,187
$818
$0
$2,000
$4,000
$6,000
$8,000
$10,000
$12,000
$14,000
At IPO
At 06/30/13
5.5x 3.9x
3.3x 3.1x 3.6x
10.8x
2.6x
4.7x
2.4x
4.1x
6.4x
2.7x
4.5x 4.7x
5.7x
3.7x
5.5x
17.4x
3.4x 2.7x 2.3x
8.1x
11.6x
4.0x
0x
2x
4x
6x
8x
10x
12x
14x
16x
18x
20x
Median at IPO
Median at 06/30/13
IPO Pricing
IPO Date 7/19/12 7/25/12 8/1/12 9/27/12 10/4/12 10/11/12 3/20/13 3/21/13 5/8/13 5/16/13 5/16/13 6/11/13
Original Range $34 - $37 $15 - $17 $9.5 - $11.5 $11 - $13 $15 - $17 $24 - $26 $13 - $15 $11 - $13 $10 - $12 $28 - $30 $11 - $13 $18 - $20
Pricing $42.00 $15.00 $11.50 $12.00 $17.00 $28.00 $15.50 $14.00 $11.00 $31.00 $13.00 $19.00
vs. Midpoint 18% (6%) 10% 0% 6% 12% 15% 17% 0% 7% 8% 0%
Current $42.16 $17.50 $23.50 $16.12 $33.23 $64.09 $23.36 $10.24 $10.45 $55.42 $24.87 $27.56
vs. Pricing 0% 17% 104% 34% 95% 129% 51% (27%) (5%) 79% 91% 45%
Operating Statistics at IPO ($ millions)
CY Revenue $311 $74 $91 $91 $126 $274 $104 $74 $141 $193 $83 $150
CY+1 Revenue $459 $85 $112 $109 $158 $405 $125 $91 $207 $271 $106 $200
Growth 47% 15% 23% 19% 25% 48% 20% 23% 47% 40% 28% 33%
Change from IPO 13% 23% 149% 62% 105% 173% 60% -18% -5% 91% 79% 46%
Change from IPO -18% 19% 74% 20% 52% 61% 31% -44% -4% 98% 81% 48%

Copyright ©2013 Shea & Company, LLC
Public & Private Equity Financing Activity
Software IPO Pricing & Performance Data
31
Initial Equity Issuances from 2011 – 2013 YTD ($ millions)
Notes:
[a] Primary shares only
[b] Price at acquisition
[c] Acquisition pending
Source: Company releases, Wall Street research
Current Trading Data Valuation at IPO
Share Price Market Enterprise EV / Revenue Performance Share Amount Market Enterprise EV / Revenue Revenue at IPO
Company (06/30/13) Value Value CY13E CY14E Since IPO IPO Date Price Raised [a] Value Value TTM CY CY +1 TTM
Gigamon $ 27.56 $ 818 $ 794 5.3 x 4.0 x 45.1 % 06/11/13 $ 19.00 $ 86 $ 560 $ 537 5.1 x 3.6 x 2.7 x
Marketo 24.87 890 859 10.3 8.1 91.3 05/16/13 13.00 75 465 434 6.6 5.2 4.1
Tableau Software 55.42 3,187 3,147 16.3 11.6 78.8 05/16/13 31.00 155 1,783 1,742 12.2 9.0 6.4
Cyan 10.45 465 467 3.3 2.3 -5.0 05/08/13 11.00 88 490 489 4.5 3.5 2.4
Marin Software 10.24 356 246 3.3 2.7 -26.9 03/21/13 14.00 105 433 433 7.3 5.8 4.7
Model N 23.36 533 428 4.1 3.4 50.7 03/20/13 15.50 93 332 325 6.4 3.1 2.6
Workday 64.09 12,269 11,551 26.3 17.4 128.9 10/11/12 28.00 637 4,488 4,382 22.0 16.0 10.8
Fleetmatics 33.23 1,198 1,119 6.7 5.5 95.5 10/04/12 17.00 106 585 569 5.3 4.5 3.6
Qualys 16.12 583 459 4.3 3.7 34.3 09/27/12 12.00 80 361 332 4.0 3.6 3.1
Eloqua 23.50 [b] 918 833 7.4 5.7 104.3 08/01/12 11.50 81 368 365 4.3 4.0 3.3
E2open 17.50 460 414 5.7 4.7 16.7 07/25/12 15.00 56 374 335 4.8 4.5 3.9
Palo Alto Networks 42.16 3,229 2,837 6.2 4.5 0.4 07/19/12 42.00 202 2,850 2,527 9.9 8.1 5.5
ServiceNow 40.39 5,783 5,444 13.7 9.4 124.4 06/29/12 18.00 162 2,218 2,129 10.8 9.1 5.9
Exa 10.30 151 116 2.1 1.8 3.0 06/28/12 10.00 42 132 127 2.7 2.4 2.0
Infoblox 29.26 1,562 1,370 5.6 4.6 82.9 04/19/12 16.00 92 844 794 5.2 4.5 3.7
Proofpoint 24.25 930 843 6.5 5.5 86.5 04/19/12 13.00 67 426 418 5.1 4.1 3.5
Splunk 46.36 5,278 4,947 18.1 13.6 172.7 04/18/12 17.00 213 1,740 1,711 19.4 9.7 7.0
ExactTarget 33.72 [c] 2,517 2,416 6.7 5.5 77.5 03/21/12 19.00 162 1,228 1,185 6.3 4.4 3.6
Demandware 42.41 1,344 1,243 12.5 9.3 165.1 03/14/12 16.00 88 449 438 7.8 5.9 4.4
Bazaarvoice 9.43 734 639 3.5 3.0 -21.4 02/23/12 12.00 108 682 670 9.1 5.4 4.2
AVG Technologies 19.45 1,066 1,071 2.6 2.3 21.6 02/07/12 16.00 64 768 920 3.4 2.9 2.5
Guidewire Software 42.05 2,658 2,455 7.9 6.5 223.5 01/24/12 13.00 115 521 483 2.4 2.0 1.7
Jive Software 18.17 1,311 1,148 7.6 5.9 51.4 12/14/11 12.00 121 709 558 8.0 7.2 5.0
Imperva 45.04 1,128 1,016 7.5 6.1 150.2 11/09/11 18.00 86 312 302 4.2 3.9 3.1
Carbonite 12.39 328 271 2.6 2.1 23.9 08/10/11 10.00 54 247 231 4.7 3.9 2.8
Responsys 14.31 788 683 3.6 3.0 19.3 04/20/11 12.00 66 638 624 6.6 4.9 4.1
ServiceSource 9.32 757 640 2.4 2.1 -6.8 03/25/11 10.00 80 710 689 4.1 3.9 3.3
Cornerstone OnDemand 43.30 2,312 2,243 12.3 8.8 233.1 03/17/11 13.00 98 651 652 12.4 9.1 6.1
Mean 7.7 x 5.8 x 72.2 % $ 121 $ 906 $ 872 7.3 x 5.5 x 4.1 x
Median 6.3 5.1 64.4 90 572 547 5.8 4.5 3.6
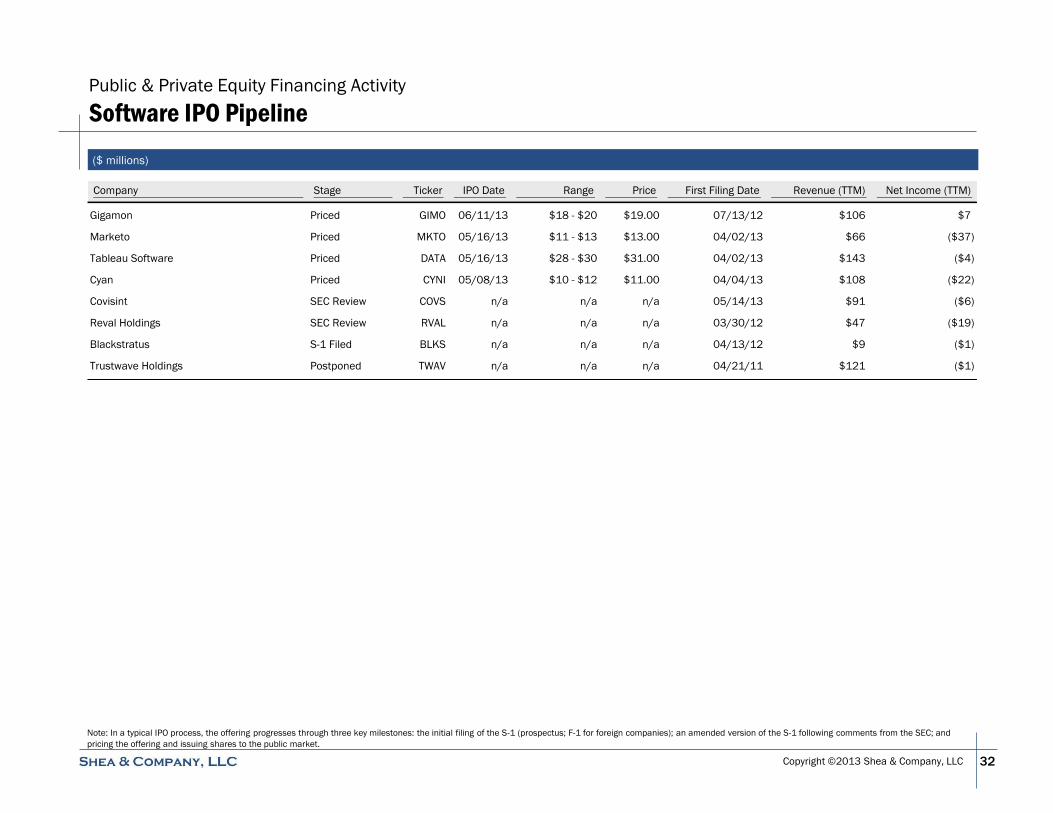
Copyright ©2013 Shea & Company, LLC
Public & Private Equity Financing Activity
Software IPO Pipeline
32
Note: In a typical IPO process, the offering progresses through three key milestones: the initial filing of the S-1 (prospectus; F-1 for foreign companies); an amended version of the S-1 following comments from the SEC; and
pricing the offering and issuing shares to the public market.
($ millions)
Company Stage Ticker IPO Date Range Price First Filing Date Revenue (TTM) Net Income (TTM)
Gigamon Priced GIMO 06/11/13 $18 - $20 $19.00 07/13/12 $106 $7
Marketo Priced MKTO 05/16/13 $11 - $13 $13.00 04/02/13 $66 ($37)
Tableau Software Priced DATA 05/16/13 $28 - $30 $31.00 04/02/13 $143 ($4)
Cyan Priced CYNI 05/08/13 $10 - $12 $11.00 04/04/13 $108 ($22)
Covisint SEC Review COVS n/a n/a n/a 05/14/13 $91 ($6)
Reval Holdings SEC Review RVAL n/a n/a n/a 03/30/12 $47 ($19)
Blackstratus S-1 Filed BLKS n/a n/a n/a 04/13/12 $9 ($1)
Trustwave Holdings Postponed TWAV n/a n/a n/a 04/21/11 $121 ($1)

Copyright ©2013 Shea & Company, LLC
Public & Private Equity Financing Activity
Software Private Capital Raise Activity: 2Q 2013
33
($ millions)
Source: Company releases, Wall Street research
Close Date Company Participating Investors Description Amount
06/28/13 Insightera Glilot Capital Partners, Lightspeed Venture Partners, Opus Capital B2B marketing management $7
06/26/13 Metacloud Canaan Partners, Storm Ventures OpenStack infrastructure as a service $10
06/25/13 Hortonworks Benchmark Capital, Index Ventures, Tenaya Capital, Yahoo! Scalable distributed processing and data management $50
06/25/13 Kony Solutions Telstra Ventures Mobile application development platform $18
06/25/13 MY1LOGIN Ltd. Scottish Enterprise, TRI Capital Ltd. Cloud-based password management $1
06/25/13 Neohapsis n/a Governance, risk and compliance applications $5
06/20/13 Firebase Flybridge Capital Partners, Union Square Ventures Cloud database for applications $6
06/19/13 Orion Security LSP Ben Franklin Technology Partners Fleet management and analytics n/a
06/13/13 Encap AS Alliance Venture, Proventure Seed Mobile authentication $2
06/12/13 GoodData Andreessen Horowitz, General Catalyst, Next World Capital, Tenaya Capital Big data analytics SaaS $22
06/11/13 BrightEdge Technologies Altos Ventures, Battery Ventures, Illuminate Ventures, Insight Venture Partners, Intel Capital Search engine optimization and analytics SaaS platform $43
06/11/13 Compass Quality Insight Bain Capital Ventures, X/Seed Quality assurance and testing $2
06/07/13 Dataminr Deep Fork Capital, GSV Capital, IVP, Venrock Real-time social media analytics $30
06/07/13 SpaceCurve Divergent Ventures, Reed Elsevier Ventures, Triage Ventures Real-time analytics for spatial and graph datasets $10
06/07/13 Zettics n/a Mobile carrier and market analytics $7
06/05/13 Namely Bullpen Capital, Lerer Ventures, True Ventures Talent management for the advertising sector $3
06/04/13 Digabit n/a Publication portal for technical documentation $2
06/04/13 Kenandy Kleiner Perkins, Lightspeed Venture Partners, Salesforce.com, Wilson Sonsini Social manufacturing management application for the cloud $33
06/03/13 Quarri Technologies n/a Content security application for data loss prevention $1
06/03/13 Zetta Foundation Capital, Industry Ventures, Sigma West Off-site enterprise data protection storage as a service $8
05/31/13 Certica Solutions n/a Compliance and regulatory reporting for the public sector $8
05/31/13 Health Care DataWorks MemorialCare Innovation, Cedars-Sinai Health System Business intelligence for the healthcare sector $5
05/30/13 Hotelerum Booking Services SL Caixa Capital Risc SGECR, Venturcap SCR SA Revenue management for the hotel sector $1
05/29/13 CloudByte Fidelity Growth Partners India, Kae Capital, Nexus Venture Partners Multi-tenant storage SaaS $4
05/29/13 LOC-AID Technologies Florida Growth Fund, H.I.G. Capital, Intersouth Partners Location-enabling mobile transaction platform $4
05/29/13 Numecent Holdings Ltd. T-Venture Holding GmbH Native application provisioning SaaS $14
05/27/13 Erply Ltd. 500 Startups, Index Ventures, Redpoint Ventures Point of sale and inventory management $2
05/17/13 WibiData Canaan Partners, New Enterprise Associates User data management and analytics $15
05/16/13 BonitaSoft SA Auriga Partners SA, CDC Entreprises, Serena Capital SAS, Ventech SA Open source business process management software $12
05/15/13 Atlantis Computing Adams Street Partners, Cisco Systems, El Dorado Ventures, Partech International Virtual desktop infrastucture and performance optimization $20
05/14/13 Cloudant Devonshire Investors Distributed database as a service $12
05/13/13 Radius Intelligence BBVA Ventures Sales and marketing analytics n/a
05/10/13 RJMetrics SoftTech VC, Trinity Ventures Business intelligence and data analytics $6
05/07/13 Axiomatics AB ALMI Invest, Coach & Capital Nordic 1 AB Identity and access management $7
05/07/13 Hedvig n/a Storage cloud infrastructure $10

Copyright ©2013 Shea & Company, LLC
Public & Private Equity Financing Activity
Software Private Capital Raise Activity: 2Q 2013 continued
34
($ millions)
Source: Company releases, Wall Street research
Close Date Company Participating Investors Description Amount
05/03/13 Apptio Andreessen Horowitz, Greylock, Janus, Madrona, Shasta Ventures, The Hillman Co. Management of the cost, quality and value of IT services $45
05/01/13 GridGain Systems n/a Java-based grid computing platform $9
05/01/13 LucidWorks Granite Ventures, Shasta Ventures, Walden International Embedded search development solutions $10
05/01/13 MetricStream Goldman Sachs Group Collaborative business process and compliance management n/a
04/30/13 Skytree Javelin Venture Partners, Osage Partners, United Parcel Service, USVP Big data analytics $18
04/26/13 Lex Machina Costanoa Venture Capital Partners, The Cue Ball Group, X/Seed, Yahoo! Intellectual property litigation analytics $5
04/25/13 Apigee In-Q-Tel APIs for secure cloud gateways n/a
04/23/13 Qubole Charles River Ventures, Lightspeed Venture Partners Big data integration and analytics SaaS $7
04/22/13 3scale Networks SL Costanoa Venture Capital Partners, Javelin Venture Partners API management SaaS $4
04/22/13 Gizmox Ltd. Atlas Venture, Citrix, IVC Venture Capital, Maayan Technology Ventures Cross-platform cloud and mobile application development tools $8
04/22/13 SERPs n/a Marketing management applications <$1
04/22/13 Translattice n/a Database as a service platform $10
04/18/13 DataLogix Holdings Costanoa Venture Capital Partners, General Catalyst, IVP, Sequel Venture Partners Advertising performance analytics $25
04/15/13 Good Technology n/a Mobile security and collaboration applications $50
04/09/13 Duda Mobile Pitango Venture Capital, Primera Capital Platform for automated mobile website conversion $10
04/05/13 MarketShare Partners Elevation Partners, FTV Management Company Enterprise market analysis applications $28
04/04/13 Kaazing New Enterprise Associates Development platform for browser-based communication applications $15

Copyright ©2013 Shea & Company, LLC
Advisory Services and Selected Transactions
Shea & Company Overview
35
Mergers & Acquisitions
Buy-side and sell-side M&A advisory
Divestitures
Restructuring
Private Placements & Capital Raising
Later-stage venture and growth equity
Recapitalizations
IPO advisory
Corporate Strategy
Strategic corporate development advisory
Fairness opinions
Selected Transactions Shea & Company has advised on billions of dollars of software transactions
Shea & Company is a software-focused investment bank that believes focus underpins success, and
success is measured by the outcomes we achieve with our clients
Shea & Company served as the exclusive
financial advisor to ProfitLogic
has been acquired by
Shea & Company served as the exclusive
financial advisor to Platform Computing
has been acquired by
Shea & Company served as the exclusive
financial advisor to VKernel
has been acquired by
Shea & Company served as the exclusive
financial advisor to Worklight
has been acquired by
Shea & Company served as the exclusive
financial advisor to Wavelink
has been acquired by
Shea & Company served as the exclusive
financial advisor to Mimecast
has received an investment from
Shea & Company served as the exclusive
financial advisor to Kashya
has been acquired by
Shea & Company served as the exclusive
financial advisor to Onaro
has been acquired by
Shea & Company served as the exclusive
financial advisor to Dimdim
has been acquired by
Shea & Company served as the exclusive
financial advisor to Pervasive
has been acquired by
(NASDAQ: PVSW)
Shea & Company served as the exclusive
financial advisor to Ping Identity
has received an investment from
Shea & Company served as the exclusive
financial advisor to SPL WorldGroup
has been acquired by

People ▪ Industry Expertise ▪ Process Excellence
Boston San Francisco
Shea & Company, LLC provides independent financial advice on mergers, acquisitions, financial restructurings, private capital raising and similar corporate finance matters. Shea & Company is not a retail broker-
dealer. The firm does not conduct underwriting activities, provide research or analyst reports or solicit or carry accounts for, or offer or sell securities products to retail customers. Shea & Company is regulated by
the Financial Industry Regulatory Authority, Inc. (”FINRA”) as a FINRA Member Firm. The information and services provided in this presentation are not provided to and may not be used by any person or entity in
any jurisdiction where the provision or use thereof would be contrary to applicable laws, rules or regulations of any governmental authority or regulatory or self-regulatory organization or where Shea & Company is
not authorized to provide such information or services.