2013 purdue agricultural economics report - department of
TRANSCRIPT
Purdue Agricultural Economics Report Page 1
In This Issue
Up Again: Indiana’s Farmland Market in 2013
Values & Rents: o Irrigated
Farmland o Pasture Rent o Hay Ground
Rent o Grain Bin
Rent
USDA: 2013 Cropland Value by State
Up Again: Indiana’s Farmland Market in 2013 Craig Dobbins, Professor and Kim Cook, Research Associate
While the 2012 Indiana crop suffered from the worst drought since 1988, the increase in farmland values did not bother to slow down. The drought-reduced corn and soybean supply lifted corn and soybean prices to all-time highs. The price increases more than offset lower yields. When insurance indemnities are included, farm income from the 2012 crops was much better than many expected. The 2013 U.S. net farm income is currently forecast to be $128.2 billion, the highest on record.
High net farm income combined with favorable interest rates, strong farmland demand, and a limited supply of farmland for sale pushed farmland values and cash rents higher. The June 2013 Purdue Farmland Value Survey
1 indicates the statewide
increase in farmland values ranged from 14.7% to 19.1% depending on the productivity of the farmland. Statewide cash rents increases ranged from 9.4% to 10.9%.
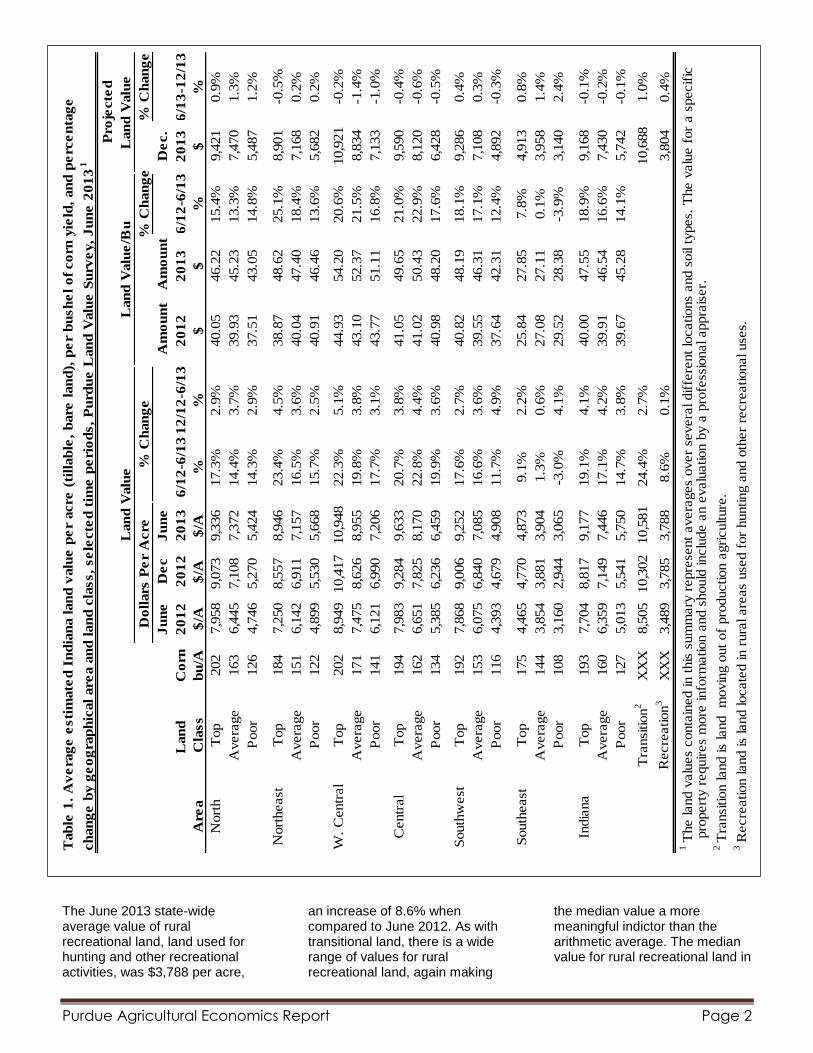
For the state as a whole, the largest change from 2012 to 2013 was top land, increasing 19.1% to $9,177 per acre. Average quality cropland increased 17.1% to a value of
1 The individuals surveyed include
rural appraisers, agricultural loan officers, FSA personnel, farm managers, and farmers. The results of the survey provide information about the general level and trend in farmland values.
$7,446 per acre. Poor quality land increased 14.7 % to a value of $5,750 per acre (Table 1).
To assess farmland productivity, survey respondents estimated long-term corn yields for poor, average, and top quality land. For the state, the average long-term corn yields for poor, average, and top quality land were 127, 160, and 193 bushels per acre, respectively.
The transitional land market, that is farmland moving out of agriculture, seems to have sprung back to life. The survey indicated a 24.4% increase in its average value, increasing from $8,505 to $10,581 per acre. This is a specialized market with transitional land value strongly influenced by the planned use and location. The estimated values from June 2013 respondents had a very wide range from $2,500 to $45,000 per acre. Because of the wide variation in transitional land values, the median value
2
may give a more meaningful picture than the arithmetic average. The median value of transitional land in June 2013 was $9,500 per acre, $1,500 per acre more than in 2012.
2
The median is the middle observation in data arranged in ascending or descending numerical order.
Purdue Agricultural Economics Report August 2013
Purdue Agricultural Economics Report Page 2
The June 2013 state-wide average value of rural recreational land, land used for hunting and other recreational activities, was $3,788 per acre,
an increase of 8.6% when compared to June 2012. As with transitional land, there is a wide range of values for rural recreational land, again making
the median value a more meaningful indictor than the arithmetic average. The median value for rural recreational land in
% C
han
ge
% C
han
ge
Ju
ne
De
cJ
un
e A
mo
un
t A
mo
un
tD
ec.
Lan
d
Co
rn2
01
22
01
22
01
36
/12
-6/1
31
2/1
2-6
/13
20
12
20
13
6/1
2-6
/13
20
13
6/1
3-1
2/1
3
Are
aC
lass
bu
/A$
/A$
/A$
/A%
%$
$%
$%
Nort
hT
op
202
7,9
58
9,0
73
9,3
36
17.3
%2.9
%40.0
546.2
215.4
%9,4
21
0.9
%
Avera
ge
163
6,4
45
7,1
08
7,3
72
14.4
%3.7
%39.9
345.2
313.3
%7,4
70
1.3
%
Poor
126
4,7
46
5,2
70
5,4
24
14.3
%2.9
%37.5
143.0
514.8
%5,4
87
1.2
%
Nort
heast
Top
184
7,2
50
8,5
57
8,9
46
23.4
%4.5
%38.8
748.6
225.1
%8,9
01
-0.5
%
Avera
ge
151
6,1
42
6,9
11
7,1
57
16.5
%3.6
%40.0
447.4
018.4
%7,1
68
0.2
%
Poor
122
4,8
99
5,5
30
5,6
68
15.7
%2.5
%40.9
146.4
613.6
%5,6
82
0.2
%
W.
Centr
al
Top
202
8,9
49
10,4
17
10,9
48
22.3
%5.1
%44.9
354.2
020.6
%10,9
21
-0.2
%
Avera
ge
171
7,4
75
8,6
26
8,9
55
19.8
%3.8
%43.1
052.3
721.5
%8,8
34
-1.4
%
Poor
141
6,1
21
6,9
90
7,2
06
17.7
%3.1
%43.7
751.1
116.8
%7,1
33
-1.0
%
Centr
al
Top
194
7,9
83
9,2
84
9,6
33
20.7
%3.8
%41.0
549.6
521.0
%9,5
90
-0.4
%
Avera
ge
162
6,6
51
7,8
25
8,1
70
22.8
%4.4
%41.0
250.4
322.9
%8,1
20
-0.6
%
Poor
134
5,3
85
6,2
36
6,4
59
19.9
%3.6
%40.9
848.2
017.6
%6,4
28
-0.5
%
South
west
Top
192
7,8
68
9,0
06
9,2
52
17.6
%2.7
%40.8
248.1
918.1
%9,2
86
0.4
%
Avera
ge
153
6,0
75
6,8
40
7,0
85
16.6
%3.6
%39.5
546.3
117.1
%7,1
08
0.3
%
Poor
116
4,3
93
4,6
79
4,9
08
11.7
%4.9
%37.6
442.3
112.4
%4,8
92
-0.3
%
South
east
Top
175
4,4
65
4,7
70
4,8
73
9.1
%2.2
%25.8
427.8
57.8
%4,9
13
0.8
%
Avera
ge
144
3,8
54
3,8
81
3,9
04
1.3
%0.6
%27.0
827.1
10.1
%3,9
58
1.4
%
Poor
108
3,1
60
2,9
44
3,0
65
-3.0
%4.1
%29.5
228.3
8-3
.9%
3,1
40
2.4
%
India
na
Top
193
7,7
04
8,8
17
9,1
77
19.1
%4.1
%40.0
047.5
518.9
%9,1
68
-0.1
%
Avera
ge
160
6,3
59
7,1
49
7,4
46
17.1
%4.2
%39.9
146.5
416.6
%7,4
30
-0.2
%
Poor
127
5,0
13
5,5
41
5,7
50
14.7
%3.8
%39.6
745.2
814.1
%5,7
42
-0.1
%
Tra
nsi
tion
2X
XX
8,5
05
10,3
02
10,5
81
24.4
%2.7
%10,6
88
1.0
%
Recre
ation
3X
XX
3,4
89
3,7
85
3,7
88
8.6
%0.1
%3,8
04
0.4
%
2 T
ransi
tion land is
land
movin
g o
ut
of
pro
duction a
gri
culture
.3 R
ecre
ation land is
land locate
d in r
ura
l are
as
use
d f
or
hunting a
nd o
ther
recre
ational use
s.
Tab
le 1
. A
ve
rag
e e
sti
mate
d I
nd
ian
a l
an
d v
alu
e p
er
acre
(ti
llab
le,
bare
lan
d),
pe
r b
ush
el
of
co
rn y
ield
, an
d p
erc
en
tag
e
ch
an
ge
by g
eo
gra
ph
ical
are
a a
nd
lan
d c
lass,
se
lecte
d t
ime
pe
rio
ds,
Pu
rdu
e L
an
d V
alu
e S
urv
ey,
Ju
ne
20
13
1
p
ropert
y r
equir
es
more
info
rmation a
nd s
hould
inclu
de a
n e
valu
ation b
y a
pro
fess
ional appra
iser.
1 T
he land v
alu
es
conta
ined in t
his
sum
mary
repre
sent
avera
ges
over
severa
l dif
fere
nt
locations
and s
oil
types.
The v
alu
e f
or
a s
pecif
ic
Lan
d V
alu
e
Pro
jecte
d
Do
llars
Pe
r A
cre
% C
han
ge
Lan
d V
alu
eL
an
d V
alu
e/B
u
Purdue Agricultural Economics Report Page 3
June 2013 was $3,150 per acre, the same as 2012.
State-wide Rents
For the second year there were also strong increases in cash rent. The largest increase in 2013 was for top quality land, up $29 per acre, or 10.9%. Rents for average and poor quality land increased $21 (10.1%) and $15 (9.4%) per acre, respectively. The estimated cash rent was $294 per acre on top quality land, $229 per acre on average quality land, and $174 per acre on poor quality land (Table 2). These cash rent estimates represent gross rent. To arrive at a net return for the landowner, expenses such as real estate taxes, drainage assessments, insurance and other maintenance expenses need to be subtracted. Cash rent per bushel of corn ranged from $1.37 to $1.52 per bushel.
For top quality farmland, cash rent as a percentage of farmland value was 3.2%. This was 0.2% below the 2012 level. For average and poor quality farmland, cash rent as a percentage of farmland value was 3.1% and 3.0 %, respectively. These percentages also declined 0.2%. These percentage values are the lowest in the 39-year history of the survey. Over the entire 39-year period cash rent as a percentage of farmland value has averaged 5.5%.
Area Land Values
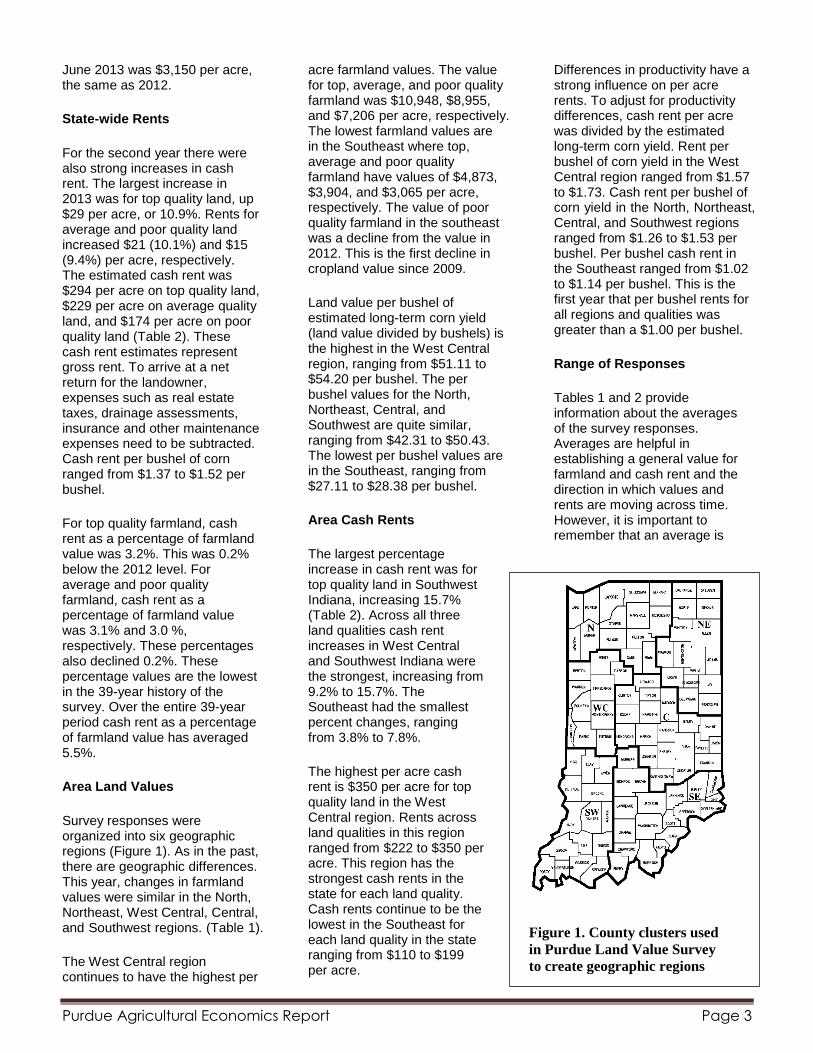
Survey responses were organized into six geographic regions (Figure 1). As in the past, there are geographic differences. This year, changes in farmland values were similar in the North, Northeast, West Central, Central, and Southwest regions. (Table 1).
The West Central region continues to have the highest per
acre farmland values. The value for top, average, and poor quality farmland was $10,948, $8,955, and $7,206 per acre, respectively. The lowest farmland values are in the Southeast where top, average and poor quality farmland have values of $4,873, $3,904, and $3,065 per acre, respectively. The value of poor quality farmland in the southeast was a decline from the value in 2012. This is the first decline in cropland value since 2009.
Land value per bushel of estimated long-term corn yield (land value divided by bushels) is the highest in the West Central region, ranging from $51.11 to $54.20 per bushel. The per bushel values for the North, Northeast, Central, and Southwest are quite similar, ranging from $42.31 to $50.43. The lowest per bushel values are in the Southeast, ranging from $27.11 to $28.38 per bushel.
Area Cash Rents
The largest percentage increase in cash rent was for top quality land in Southwest Indiana, increasing 15.7% (Table 2). Across all three land qualities cash rent increases in West Central and Southwest Indiana were the strongest, increasing from 9.2% to 15.7%. The Southeast had the smallest percent changes, ranging from 3.8% to 7.8%.
The highest per acre cash rent is $350 per acre for top quality land in the West Central region. Rents across land qualities in this region ranged from $222 to $350 per acre. This region has the strongest cash rents in the state for each land quality. Cash rents continue to be the lowest in the Southeast for each land quality in the state ranging from $110 to $199 per acre.
Differences in productivity have a strong influence on per acre rents. To adjust for productivity differences, cash rent per acre was divided by the estimated long-term corn yield. Rent per bushel of corn yield in the West Central region ranged from $1.57 to $1.73. Cash rent per bushel of corn yield in the North, Northeast, Central, and Southwest regions ranged from $1.26 to $1.53 per bushel. Per bushel cash rent in the Southeast ranged from $1.02 to $1.14 per bushel. This is the first year that per bushel rents for all regions and qualities was greater than a $1.00 per bushel.
Range of Responses
Tables 1 and 2 provide information about the averages of the survey responses. Averages are helpful in establishing a general value for farmland and cash rent and the direction in which values and rents are moving across time. However, it is important to remember that an average is
Figure 1. County clusters used
in Purdue Land Value Survey
to create geographic regions

Purdue Agricultural Economics Report Page 4
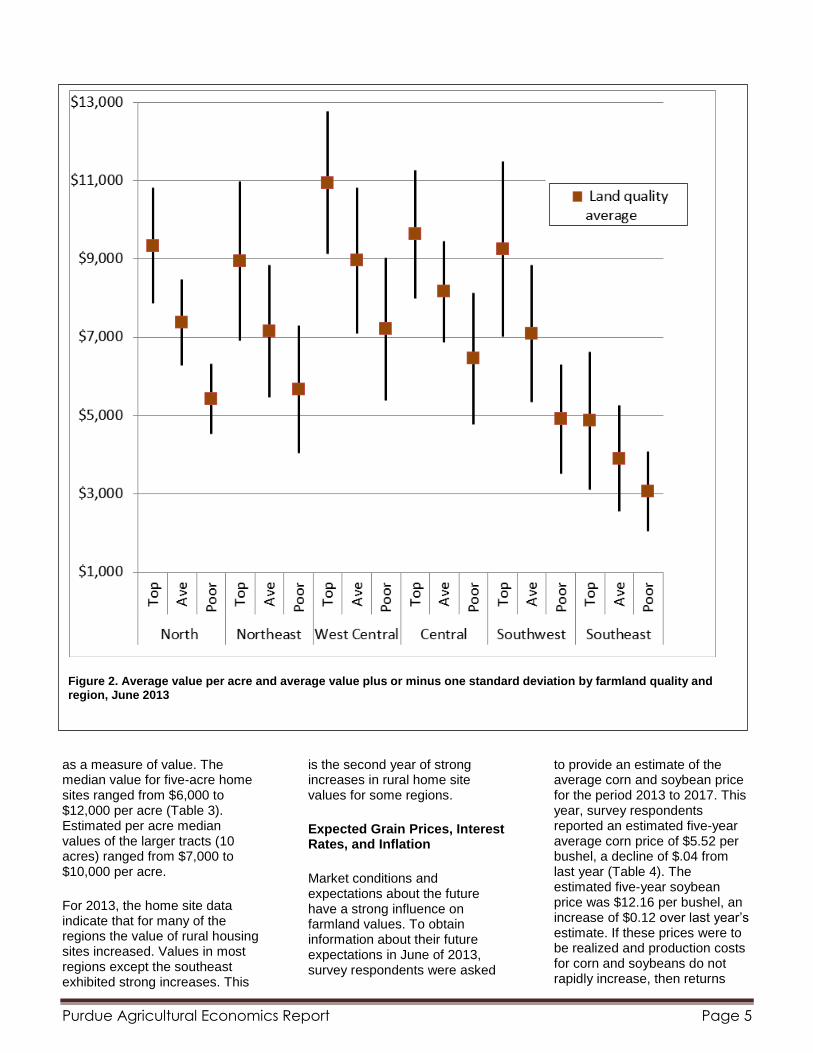
developed from several responses about perceived value and cash rent. In some cases, responses are closely clustered around the average and the range of survey responses will be narrow. In other cases, the responses are widely dispersed. It is possible to have the same or nearly the same average with either type of dispersion. Figure 2 illustrates these properties for farmland values in the 2013 survey results. The top of the dark line is the average plus one standard deviation. The bottom of the dark line indicates the
average minus one standard deviation. If farmland values are normally distributed, 66% of the values fall between the bottom and top value of the line.
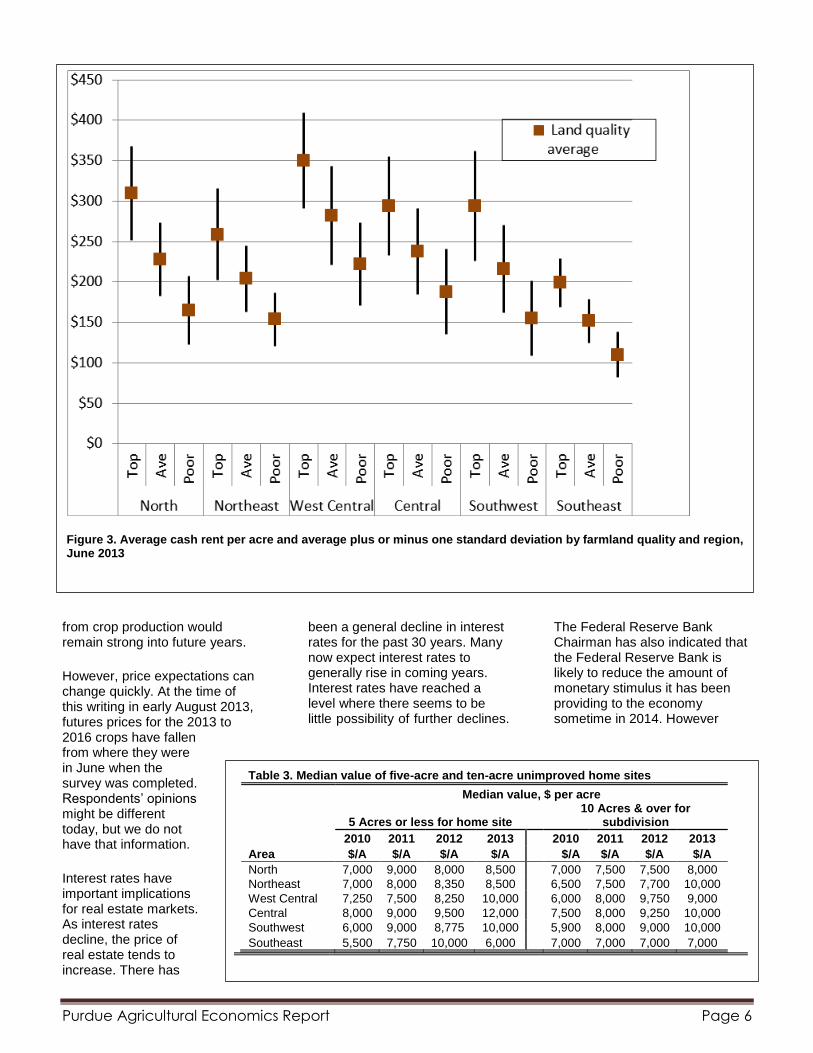
Figure 3 illustrates the same information for cash rents. In both the case of farmland value and cash rent, the survey provides a general guide to value or rent but does not indicate a farmland value or cash rent for a specific farm. There is wide dispersion which means there are wide differences of opinion on values. Arriving at a land
value or amount of cash rent for a specific farm requires additional research or assistance from a professional.
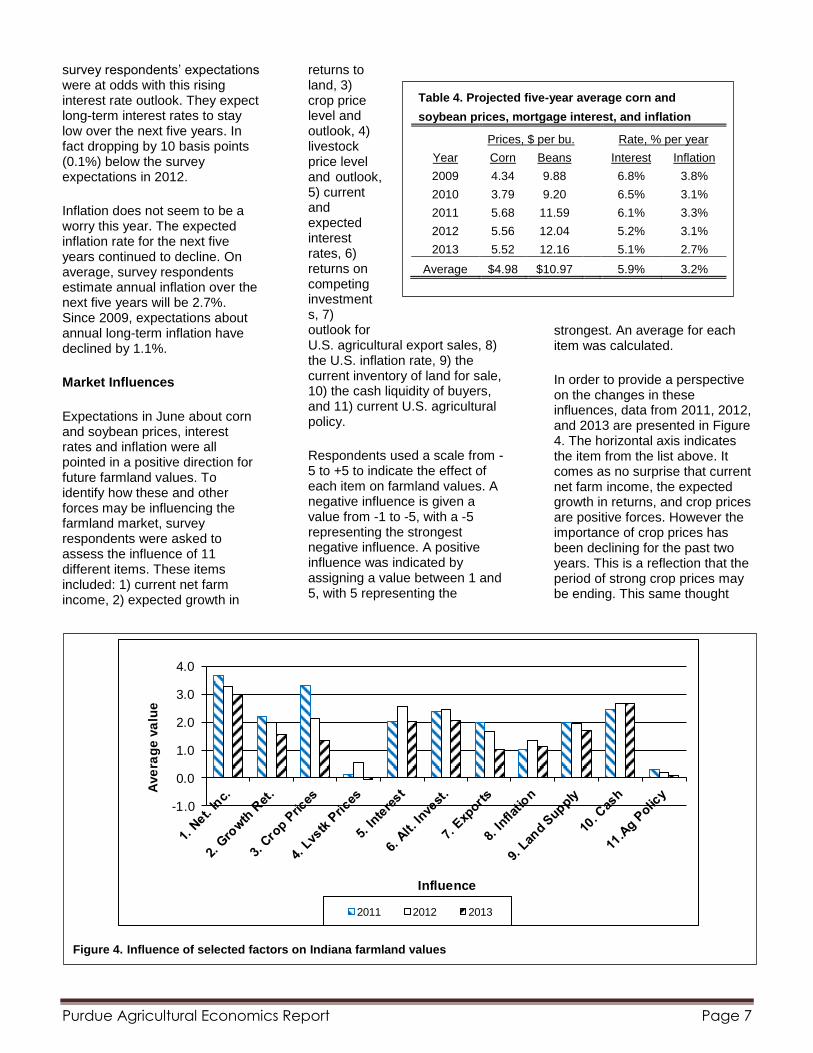
Rural Home Sites
Respondents were asked to estimate the value of rural home sites located on a blacktop or well-maintained gravel road with no accessible gas line or city utilities. These properties have a very wide range in value. Because of this wide range, median values (the value at the midpoint of the range) are used
Change
Land Corn 2012 2013 '12-'13 2012 2013 2012 2013
Area Class bu/A $/A $/A % $/bu. $/bu. % %
North Top 202 277 310 11.9% 1.37 1.53 3.5 3.3
Average 163 211 228 8.1% 1.29 1.40 3.3 3.1
Poor 126 154 165 7.1% 1.23 1.31 3.2 3.0
Northeast Top 184 238 259 8.8% 1.29 1.41 3.3 2.9
Average 151 187 204 9.1% 1.24 1.35 3.0 2.9
Poor 122 143 154 7.7% 1.17 1.26 2.9 2.7
W. Central Top 202 314 350 11.5% 1.55 1.73 3.5 3.2
Average 171 253 282 11.5% 1.48 1.65 3.4 3.1
Poor 141 195 222 13.8% 1.39 1.57 3.2 3.1
Central Top 194 271 294 8.5% 1.40 1.52 3.4 3.1
Average 162 214 238 11.2% 1.30 1.47 3.2 2.9
Poor 134 171 188 9.9% 1.27 1.40 3.2 2.9
Southwest Top 192 254 294 15.7% 1.32 1.53 3.2 3.2
Average 153 195 216 10.8% 1.27 1.41 3.2 3.0
Poor 116 142 155 9.2% 1.21 1.34 3.2 3.2
Southeast Top 175 186 199 7.0% 1.06 1.14 4.2 4.1
Average 144 141 152 7.8% 0.97 1.06 3.7 3.9
Poor 108 106 110 3.8% 0.97 1.02 3.4 3.6
Indiana Top 193 265 294 10.9% 1.37 1.52 3.4 3.2
Average 160 208 229 10.1% 1.30 1.43 3.3 3.1
Poor 127 159 174 9.4% 1.12 1.37 3.2 3.0
of Corn
Table 2. Average estimated Indiana cash rent per acre, (tillable, bare land)
2012 and 2013, Purdue Land Value Survey, June 2013
Rent as % of
June Land Value
Rent/bu.
Rent/Acre
Purdue Agricultural Economics Report Page 5
as a measure of value. The median value for five-acre home sites ranged from $6,000 to $12,000 per acre (Table 3). Estimated per acre median values of the larger tracts (10 acres) ranged from $7,000 to $10,000 per acre.
For 2013, the home site data indicate that for many of the regions the value of rural housing sites increased. Values in most regions except the southeast exhibited strong increases. This
is the second year of strong increases in rural home site values for some regions.
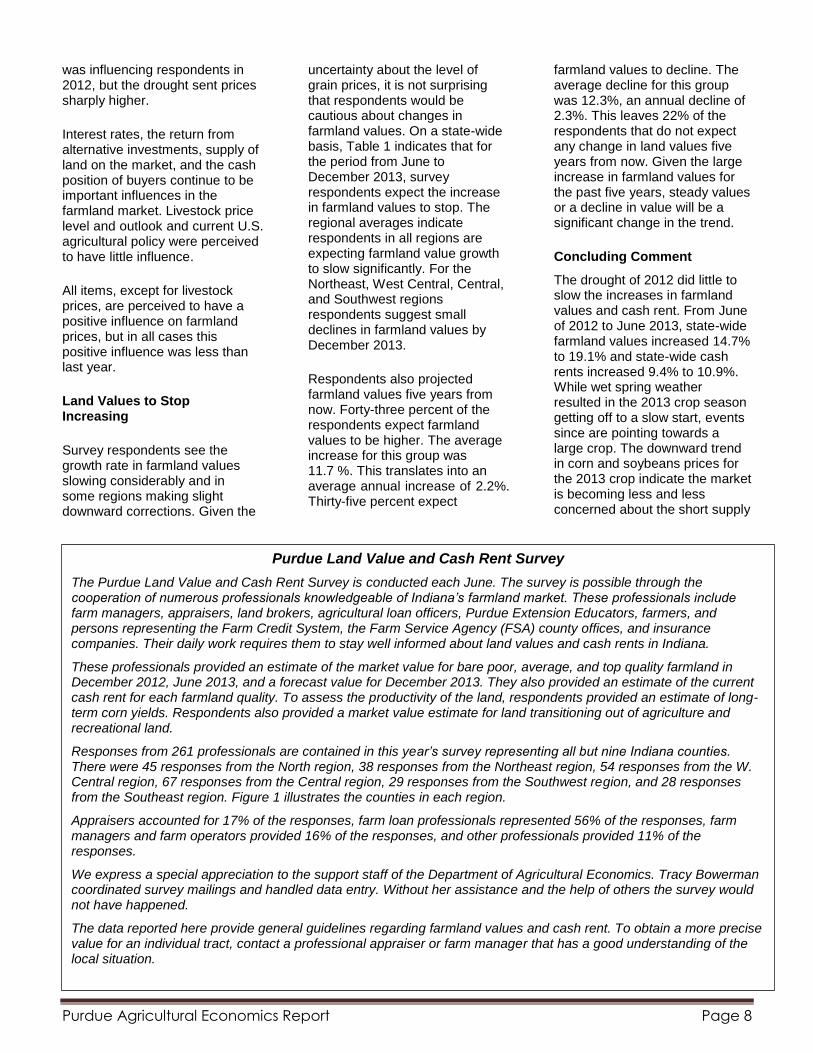
Expected Grain Prices, Interest Rates, and Inflation
Market conditions and expectations about the future have a strong influence on farmland values. To obtain information about their future expectations in June of 2013, survey respondents were asked
to provide an estimate of the average corn and soybean price for the period 2013 to 2017. This year, survey respondents reported an estimated five-year average corn price of $5.52 per bushel, a decline of $.04 from last year (Table 4). The estimated five-year soybean price was $12.16 per bushel, an increase of $0.12 over last year’s estimate. If these prices were to be realized and production costs for corn and soybeans do not rapidly increase, then returns
Figure 2. Average value per acre and average value plus or minus one standard deviation by farmland quality and region, June 2013
Purdue Agricultural Economics Report Page 6
from crop production would remain strong into future years.
However, price expectations can change quickly. At the time of this writing in early August 2013, futures prices for the 2013 to 2016 crops have fallen from where they were in June when the survey was completed. Respondents’ opinions might be different today, but we do not have that information.
Interest rates have important implications for real estate markets. As interest rates decline, the price of real estate tends to increase. There has
been a general decline in interest rates for the past 30 years. Many now expect interest rates to generally rise in coming years. Interest rates have reached a level where there seems to be little possibility of further declines.
The Federal Reserve Bank Chairman has also indicated that the Federal Reserve Bank is likely to reduce the amount of monetary stimulus it has been providing to the economy sometime in 2014. However
Figure 3. Average cash rent per acre and average plus or minus one standard deviation by farmland quality and region, June 2013
Table 3. Median value of five-acre and ten-acre unimproved home sites
Median value, $ per acre
5 Acres or less for home site
10 Acres & over for subdivision
2010 2011 2012 2013 2010 2011 2012 2013
Area $/A $/A $/A $/A $/A $/A $/A $/A
North 7,000 9,000 8,000 8,500 7,000 7,500 7,500 8,000
Northeast 7,000 8,000 8,350 8,500 6,500 7,500 7,700 10,000
West Central 7,250 7,500 8,250 10,000 6,000 8,000 9,750 9,000
Central 8,000 9,000 9,500 12,000 7,500 8,000 9,250 10,000
Southwest 6,000 9,000 8,775 10,000 5,900 8,000 9,000 10,000
Southeast 5,500 7,750 10,000 6,000 7,000 7,000 7,000 7,000
Purdue Agricultural Economics Report Page 7
survey respondents’ expectations were at odds with this rising interest rate outlook. They expect long-term interest rates to stay low over the next five years. In fact dropping by 10 basis points (0.1%) below the survey expectations in 2012.
Inflation does not seem to be a worry this year. The expected inflation rate for the next five years continued to decline. On average, survey respondents estimate annual inflation over the next five years will be 2.7%. Since 2009, expectations about annual long-term inflation have declined by 1.1%.
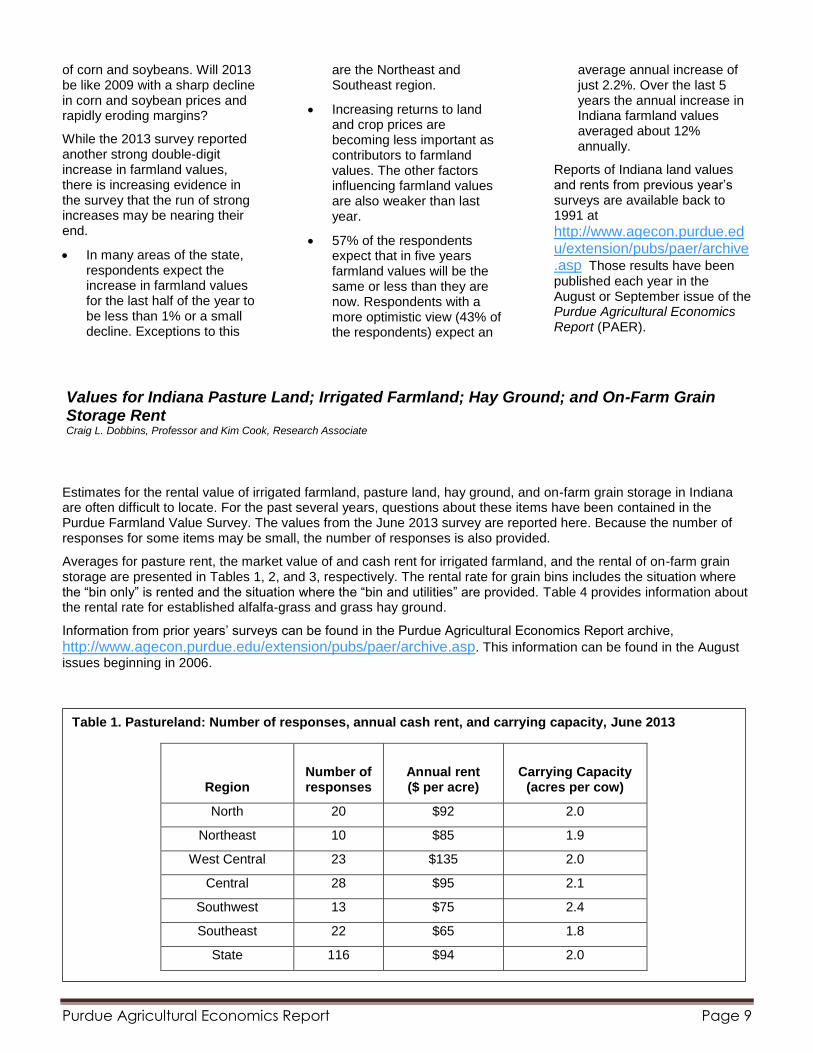
Market Influences
Expectations in June about corn and soybean prices, interest rates and inflation were all pointed in a positive direction for future farmland values. To identify how these and other forces may be influencing the farmland market, survey respondents were asked to assess the influence of 11 different items. These items included: 1) current net farm income, 2) expected growth in
returns to land, 3) crop price level and outlook, 4) livestock price level and outlook, 5) current and expected interest rates, 6) returns on competing investments, 7) outlook for U.S. agricultural export sales, 8) the U.S. inflation rate, 9) the current inventory of land for sale, 10) the cash liquidity of buyers, and 11) current U.S. agricultural policy.
Respondents used a scale from -5 to +5 to indicate the effect of each item on farmland values. A negative influence is given a value from -1 to -5, with a -5 representing the strongest negative influence. A positive influence was indicated by assigning a value between 1 and 5, with 5 representing the
strongest. An average for each item was calculated.
In order to provide a perspective on the changes in these influences, data from 2011, 2012, and 2013 are presented in Figure 4. The horizontal axis indicates the item from the list above. It comes as no surprise that current net farm income, the expected growth in returns, and crop prices are positive forces. However the importance of crop prices has been declining for the past two years. This is a reflection that the period of strong crop prices may be ending. This same thought
Table 4. Projected five-year average corn and
soybean prices, mortgage interest, and inflation
Prices, $ per bu.
Rate, % per year
Year Corn Beans
Interest Inflation
2009 4.34 9.88
6.8% 3.8%
2010 3.79 9.20
6.5% 3.1%
2011 5.68 11.59
6.1% 3.3%
2012 5.56 12.04
5.2% 3.1%
2013 5.52 12.16
5.1% 2.7%
Average $4.98 $10.97 5.9% 3.2%
Figure 4. Influence of selected factors on Indiana farmland values
-1.0
0.0
1.0
2.0
3.0
4.0
Ave
rag
e v
alu
e
Influence
2011 2012 2013
Purdue Agricultural Economics Report Page 8
was influencing respondents in 2012, but the drought sent prices sharply higher.
Interest rates, the return from alternative investments, supply of land on the market, and the cash position of buyers continue to be important influences in the farmland market. Livestock price level and outlook and current U.S. agricultural policy were perceived to have little influence.
All items, except for livestock prices, are perceived to have a positive influence on farmland prices, but in all cases this positive influence was less than last year.
Land Values to Stop Increasing
Survey respondents see the growth rate in farmland values slowing considerably and in some regions making slight downward corrections. Given the
uncertainty about the level of grain prices, it is not surprising that respondents would be cautious about changes in farmland values. On a state-wide basis, Table 1 indicates that for the period from June to December 2013, survey respondents expect the increase in farmland values to stop. The regional averages indicate respondents in all regions are expecting farmland value growth to slow significantly. For the Northeast, West Central, Central, and Southwest regions respondents suggest small declines in farmland values by December 2013.
Respondents also projected farmland values five years from now. Forty-three percent of the respondents expect farmland values to be higher. The average increase for this group was 11.7 %. This translates into an average annual increase of 2.2%. Thirty-five percent expect
farmland values to decline. The average decline for this group was 12.3%, an annual decline of 2.3%. This leaves 22% of the respondents that do not expect any change in land values five years from now. Given the large increase in farmland values for the past five years, steady values or a decline in value will be a significant change in the trend.
Concluding Comment
The drought of 2012 did little to slow the increases in farmland values and cash rent. From June of 2012 to June 2013, state-wide farmland values increased 14.7% to 19.1% and state-wide cash rents increased 9.4% to 10.9%. While wet spring weather resulted in the 2013 crop season getting off to a slow start, events since are pointing towards a large crop. The downward trend in corn and soybeans prices for the 2013 crop indicate the market is becoming less and less concerned about the short supply
Purdue Land Value and Cash Rent Survey
The Purdue Land Value and Cash Rent Survey is conducted each June. The survey is possible through the cooperation of numerous professionals knowledgeable of Indiana’s farmland market. These professionals include farm managers, appraisers, land brokers, agricultural loan officers, Purdue Extension Educators, farmers, and persons representing the Farm Credit System, the Farm Service Agency (FSA) county offices, and insurance companies. Their daily work requires them to stay well informed about land values and cash rents in Indiana.
These professionals provided an estimate of the market value for bare poor, average, and top quality farmland in December 2012, June 2013, and a forecast value for December 2013. They also provided an estimate of the current cash rent for each farmland quality. To assess the productivity of the land, respondents provided an estimate of long-term corn yields. Respondents also provided a market value estimate for land transitioning out of agriculture and recreational land.
Responses from 261 professionals are contained in this year’s survey representing all but nine Indiana counties. There were 45 responses from the North region, 38 responses from the Northeast region, 54 responses from the W. Central region, 67 responses from the Central region, 29 responses from the Southwest region, and 28 responses from the Southeast region. Figure 1 illustrates the counties in each region.
Appraisers accounted for 17% of the responses, farm loan professionals represented 56% of the responses, farm managers and farm operators provided 16% of the responses, and other professionals provided 11% of the responses.
We express a special appreciation to the support staff of the Department of Agricultural Economics. Tracy Bowerman coordinated survey mailings and handled data entry. Without her assistance and the help of others the survey would not have happened.
The data reported here provide general guidelines regarding farmland values and cash rent. To obtain a more precise value for an individual tract, contact a professional appraiser or farm manager that has a good understanding of the local situation.
Purdue Agricultural Economics Report Page 9
of corn and soybeans. Will 2013 be like 2009 with a sharp decline in corn and soybean prices and rapidly eroding margins?
While the 2013 survey reported another strong double-digit increase in farmland values, there is increasing evidence in the survey that the run of strong increases may be nearing their end.
In many areas of the state, respondents expect the increase in farmland values for the last half of the year to be less than 1% or a small decline. Exceptions to this
are the Northeast and Southeast region.
Increasing returns to land and crop prices are becoming less important as contributors to farmland values. The other factors influencing farmland values are also weaker than last year.
57% of the respondents expect that in five years farmland values will be the same or less than they are now. Respondents with a more optimistic view (43% of the respondents) expect an
average annual increase of just 2.2%. Over the last 5 years the annual increase in Indiana farmland values averaged about 12% annually.
Reports of Indiana land values and rents from previous year’s surveys are available back to 1991 at
http://www.agecon.purdue.edu/extension/pubs/paer/archive.asp Those results have been published each year in the August or September issue of the Purdue Agricultural Economics Report (PAER).
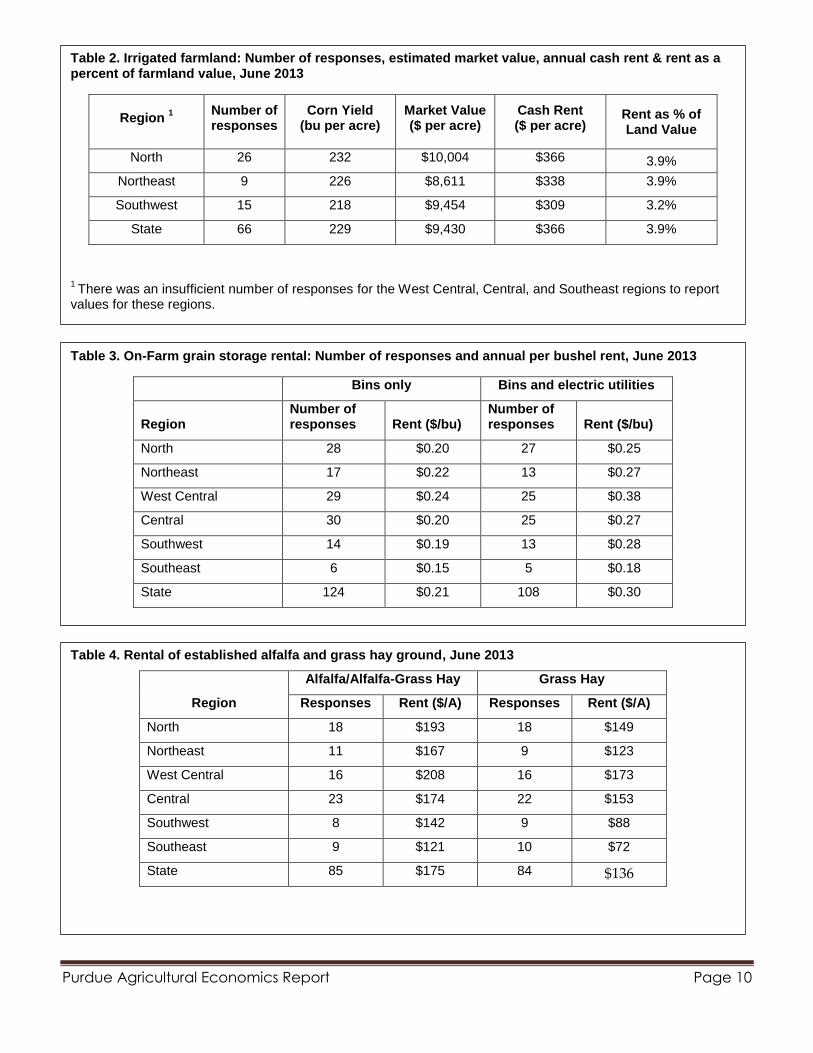
Estimates for the rental value of irrigated farmland, pasture land, hay ground, and on-farm grain storage in Indiana are often difficult to locate. For the past several years, questions about these items have been contained in the Purdue Farmland Value Survey. The values from the June 2013 survey are reported here. Because the number of responses for some items may be small, the number of responses is also provided.
Averages for pasture rent, the market value of and cash rent for irrigated farmland, and the rental of on-farm grain storage are presented in Tables 1, 2, and 3, respectively. The rental rate for grain bins includes the situation where the “bin only” is rented and the situation where the “bin and utilities” are provided. Table 4 provides information about the rental rate for established alfalfa-grass and grass hay ground.
Information from prior years’ surveys can be found in the Purdue Agricultural Economics Report archive,
http://www.agecon.purdue.edu/extension/pubs/paer/archive.asp. This information can be found in the August
issues beginning in 2006.
Values for Indiana Pasture Land; Irrigated Farmland; Hay Ground; and On-Farm Grain Storage Rent Craig L. Dobbins, Professor and Kim Cook, Research Associate
Table 1. Pastureland: Number of responses, annual cash rent, and carrying capacity, June 2013
Region Number of responses
Annual rent ($ per acre)
Carrying Capacity (acres per cow)
North 20 $92 2.0
Northeast 10 $85 1.9
West Central 23 $135 2.0
Central 28 $95 2.1
Southwest 13 $75 2.4
Southeast 22 $65 1.8
State 116 $94 2.0
Purdue Agricultural Economics Report Page 10
Table 2. Irrigated farmland: Number of responses, estimated market value, annual cash rent & rent as a percent of farmland value, June 2013
Region 1 Number of
responses Corn Yield
(bu per acre) Market Value ($ per acre)
Cash Rent ($ per acre)
Rent as % of Land Value
North 26 232 $10,004 $366 3.9%
Northeast 9 226 $8,611 $338 3.9%
Southwest 15 218 $9,454 $309 3.2%
State 66 229 $9,430 $366 3.9%
1 There was an insufficient number of responses for the West Central, Central, and Southeast regions to report
values for these regions.
Table 3. On-Farm grain storage rental: Number of responses and annual per bushel rent, June 2013
Bins only Bins and electric utilities
Region Number of responses Rent ($/bu)
Number of responses Rent ($/bu)
North 28 $0.20 27 $0.25
Northeast 17 $0.22 13 $0.27
West Central 29 $0.24 25 $0.38
Central 30 $0.20 25 $0.27
Southwest 14 $0.19 13 $0.28
Southeast 6 $0.15 5 $0.18
State 124 $0.21 108 $0.30
Table 4. Rental of established alfalfa and grass hay ground, June 2013
Region
Alfalfa/Alfalfa-Grass Hay Grass Hay
Responses Rent ($/A) Responses Rent ($/A)
North 18 $193 18 $149
Northeast 11 $167 9 $123
West Central 16 $208 16 $173
Central 23 $174 22 $153
Southwest 8 $142 9 $88
Southeast 9 $121 10 $72
State 85 $175 84 $136
Purdue Agricultural Economics Report Page 11
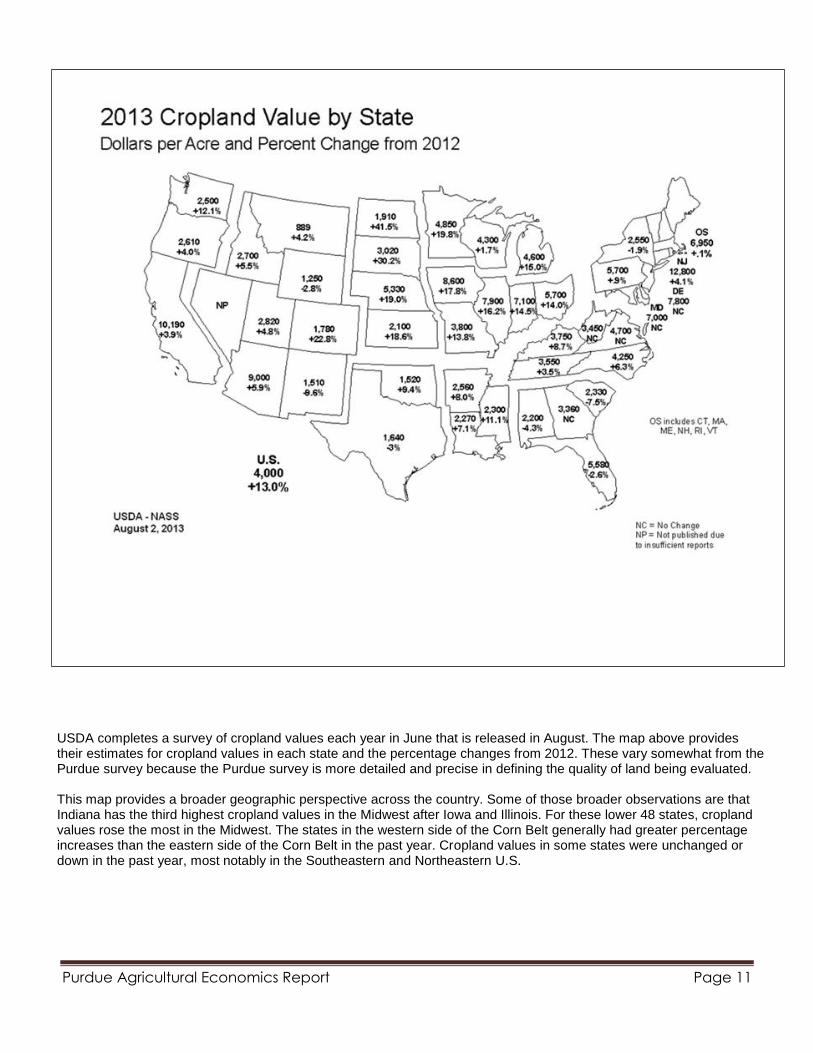
USDA completes a survey of cropland values each year in June that is released in August. The map above provides their estimates for cropland values in each state and the percentage changes from 2012. These vary somewhat from the Purdue survey because the Purdue survey is more detailed and precise in defining the quality of land being evaluated. This map provides a broader geographic perspective across the country. Some of those broader observations are that Indiana has the third highest cropland values in the Midwest after Iowa and Illinois. For these lower 48 states, cropland values rose the most in the Midwest. The states in the western side of the Corn Belt generally had greater percentage increases than the eastern side of the Corn Belt in the past year. Cropland values in some states were unchanged or down in the past year, most notably in the Southeastern and Northeastern U.S.
Purdue Agricultural Economics Report Page 12
Contributors to this issue from Agricultural Economics:
Production Staff: