2013-2014 finance/budget/budget_at_a...work at all grade levels. • sheltered instruction,...
TRANSCRIPT

Emporia USD #253
2013-2014 Profile Information

i
• Budget General Information (characteristics of district)
• Supplemental Information for Tables in Summary of Expenditures
• KSDE Website Information Available
• Summary of Expenditures (Sumexpen.xlsx)

1
2013-14 Budget General Information USD #: 253
Introduction
Superintendent's Message: Family-Friendly Schools Are Important
July 1, 2013 Release date: 2013-07-01T07:08:47-05:00
Superintendent Theresa Davidson
Each year it amazes me to watch one school year transition into the next. What is perceived by many to be our "slow time" finds district employees scrambling to complete annual cleaning and maintenance work, repair projects, order school supplies, stock up on food and other staples - all part of the summer routine in a school district. In the meantime, open library time, SummerScape, summer meal locations and extended school year activities keep things lively until the new school year rolls around.
Families are the heart of public schools and part of our mission is to make our schools safe and inviting for parents as well as for students. New to the district this year will be the Student and Family Resource Office located on the second floor at Mary Herbert Education Center. This office consolidates three existing programs - Migrant Services, the Emporia Mentoring Program and our prevention programs to help families - especially families new to Emporia - enroll their children and access the school and community services they need. Services are provided in both English and Spanish.
In addition to some new services, programs such as our youth mentoring program will continue to operate out of the Student and Family Services Office under a new name, the Emporia Mentoring Program. Last year, more than 250 students participated in the program with volunteer adult mentors spending more than 5,300 hours to support students in their academic and social development.
In three weeks, we will officially open online enrollment for the 2013-14 school year. Parents of returning students can expect to receive instructions by mail starting July 23, explaining how enrollment can be accomplished from anywhere in the world where internet access is available.

2
Our survey data from a year ago determined that a large majority of our families have internet access at home, work or at the home of a relative or friend. However, we understand that not all our families have convenient access or they may need assistance in filling out the forms. So computers and bilingual assistance are available for parents to enroll at the district office during regular business hours.
New students to the district are asked to contact the Community Relations Office (620-341-2200) to make arrangements for enrollment. We have also set aside a full day at Emporia High School on August 2 to assist new K-12 students in the online enrollment process.
This marks the second year for Emporia students to enroll online. We know that parents have busy schedules and so each year we have tried to simplify the process, streamline the paperwork required and minimize the need for duplicate forms. The Infosnap system utilizes the safe and secure technology available today.
Watch the district webpage for more information about the new school year. Parents of elementary students should take particular note of the new start and end times for elementary schools. Classes will start at 8:20 and the doors will open for breakfast at 7:35 AM. We hope the earlier schedule will be helpful to our working parents.
During the past school year, we empathized with families all over the nation when schools much like ours experienced the wrath of human violence and natural disaster. But even before the sadness in Newtown, Connecticut, and Moore, Oklahoma, we had begun taking a hard look at our safety and security procedures. We take quite seriously our charge to ensure parents that their children will be safe in our care. Last week, a number of recommendations - many of which resulted from the Department of Homeland Security safety audit conducted this spring - were presented to the Board of Education for consideration.
Many of the recommendations do not cost money but there is a "price" to pay. Lessons learned from recent tragic events suggest that we should not and cannot compromise the safety of our children for the convenience of open access that we have enjoyed for so many years in this great country. No matter whether the danger lurks in the form of an intruder or severe weather, it is important that we train our students, staff and parents about safety and attempt to control the environment to the extent possible.
So as we are trying to make our schools more inviting and welcoming to families, we will have to balance the practicality of additional security cameras, safe rooms and options for limiting free access into our schools. We'll be asking for your help in knowing "how much is enough.” Staff, students and parents will hear much more about safety and security plans over the months ahead.
Before we know it, the summer will come to an end and, once again, we'll look forward to the cheery chatter and smiling faces that represent a future that is bright for sure! Take a moment to enjoy those kids in the backyard or down the street. They grow up all too soon!

3
Board Members
Susan Brinkman, 1768 Trowman Way, Emporia, KS 66801, 620 342-2204 [email protected] Michael Crouch, 1908 Flint Road, Emporia, KS 66801, 620 342-8006 [email protected] Doug Epp, 1474 Road E, Emporia, KS 66801, 620 342-2817
[email protected] Michael Helbert, 2816 Lakeridge Road, Emporia, KS 66801, 620 343-2688 [email protected] Grant Riles, 1515 Williby Ave., Emporia, KS 66801, 620 343-3833 [email protected] Angie Schreiber, 1722 Yucca Lane, Emporia, KS 66801, 620 342-6954 [email protected] Brent Windsor, 2010 Briarcliff Lane, Emporia, KS 66801, 785 554-6056 [email protected]
Key District Staff
Superintendent: Theresa Davidson Clerk of the Board: Kristy Turner
Associate Superintendent for Human Resources: Dr. Andy Koenigs Assistant Superintendent for Business: Rob Scheib Assistant Superintendent for Teaching & Learning: Dr. George Abel Executive Director of Elementary Education: Vicki Schweinler
Executive Director of Secondary Education: Kristen Kuhlmann Executive Director of Special Services: Elena Rettiger-Lincoln Associate Executive Director – Assessments & Accountability: Ryan Karjala
Director of Budgets & Accounting: Karen Flood Director of Community Relations: Nancy Horst Director of Food Service: Jill Vincent
Director of Infrastructure & Security Chris Harvel Director of Maintenance: Bob Fancher Director of Network Operations Paul Beadles
Director of Transportation: Shelby Harvel
The District’s Accomplishments and Challenges Accomplishments:
• Much work was done last year on curriculum alignment and design; we will continue this work at all grade levels.
• Sheltered instruction, co-teaching and other research-based instructional tools are common in our classrooms.
• We are now ready to develop formative assessments to determine if our students are learning the curriculum components as they are being taught at each grade level. The Board of Education has approved the purchase of access to the 75,000 question ETS item

4
test bank which is aligned to the Kansas College and Career Ready Standards. Tests developed by teachers using this Pearson Schoolnet for PowerSchool system and the test generator will merge results to the PowerSchool dashboard.
• Measures of Academic Progress (MAP) assessments given multiple times a year provide teachers with valuable student data with which to monitor and adjust instruction.
• Literacy First will support instructional practices to span pre-school through 12th grade; this year our final group of teachers will begin training.
• Our teachers have time to meet in Professional Learning Communities (PLC) to understand the core curriculum, implement a continuum of instructional strategies, employ multiple measures of progress and analyze individual student data to make sound educational decisions.
• Multi-Tiered Systems of Support (MTSS) help teachers prescribe lessons and supports much like doctors use medical test data to make treatment plans for our health care. This system creates opportunities for better alignment and collaboration between regular and special education.
• Interventionists who specialize in special education, English language learning strategies, and instruction for reading and math support our core curriculum.
• A K-5 dual language program provides instruction in both English and Spanish for students whether their first language is Spanish or English.
• Starting at seventh grade, students can enroll in AVID – Advancement Via Individual Determination – a program that prepares them to enroll in advanced courses and to see college study as a real option. We are again proud to celebrate the graduation of a group of college bound AVID students in May.
• Technology Rich Classroom instruction is expanding to more students and grade levels through training and shared expertise of our staff.
• Career Pathways is coming into greater focus as we define the sequence and content of courses primarily at the middle and high schools.
• Turning Point Academy continues to provide options for students to learn through a project-based model that is uniquely different at K-5, 6-8 and 9-12 grade levels.
• Flint Hills Learning Center is poised to provide instructional services unique to each individual high school and adult student and to assure that each one is college and career ready.
• A unique staffing formula supports K-5 staffing ratios according to student needs in Emporia schools.
• Partnerships with Flint Hills Technical College and Emporia State University provide post-secondary coursework and credit to high school students.
• Collaboration with ESU for placing pre-service teachers in the classroom makes possible our contribution to a generation of teachers equipped to meet the challenges ahead and adds instructional support in our classrooms.
Challenges:
The Board of Education has set challenging goals for the district that cause us to look at student data in bold new ways that go beyond rising test scores.
The School Community:

5
The Emporia School district includes the City of Emporia and adjacent rural areas. We are located in east-central Kansas at the junction of U.S. 50 Highway, the Kansas Turnpike and Interstate 35, mid-way between Wichita and Topeka. Emporia, Kansas, has a population of approximately 25,700 people and a diverse economy supported by manufacturing, retail business, agriculture, and education. The city is home to the National Teacher’s Hall of Fame, Flint Hills Technical College and Emporia State University. The community’s largest employers are Emporia State University, Tyson Fresh Meats, Dolly Madison Bakery, Newman Regional Health and the Emporia Public Schools. The District Profile:
• The district has approximately 1,200 employees in district and federal programs preK-12, including the Flint Hills Special Education Cooperative (FHSEC).
• The district employs highly qualified teachers, administrators and professional support staff to serve the approximately 4,600 students in grades preK-12. Forty-eight percent of our teachers have advanced degrees and many have been recognized at the state and national level for their professional achievements and contributions to public education.
• The school district consists of 11 school buildings: one high school (9-12), one middle school (6-8), six elementary schools (K-5), one early childhood center for three and four-year olds, one alternative high school and a charter school (K-12). All are fully accredited. They are:
• Emporia High School • Emporia Middle School • Logan Avenue Elementary • Timmerman Elementary • Riverside Elementary • Village Elementary • Walnut Elementary • William Allen White Elementary • Maynard Early Childhood Center • Flint Hills Learning Center • Turning Point Academy
• The district organization has self-contained classrooms in the elementary schools. • A transitional organization has been established at the middle school with a combination of departmentalization and teaming. • A departmental organization with a block schedule has been established at the high school level. The high school offers over 350 courses annually. • USD 253 serves as the sponsoring district for the Flint Hills Special Education Cooperative,
which provides special services in seven school districts for children birth to age 21. • The charter school offers virtual and on-site instruction for students in grades K-12. • Six elementary schools offer unique learning environments by which all students can excel. Our schools have neighborhood boundaries, but transfer policies give parents choices. • The Emporia schools offer accelerated and advanced-placement classes, as well as, assistance for
students at risk of failing. Test scores on state and national assessments are consistent with state and national averages and showing improvement. Emporia students continue to score well on the ACT exam and there are more Emporia students taking this challenging exam. More than two-thirds of the graduating seniors go on to post-high school training at universities, colleges and technical schools. (See the Kansas State Department of Education web site for achievement data and demographic information about the district and individual schools.)
• The district’s curricular program offers instruction in the areas of art, business, driver’s education, health, family and consumer science, industrial technology, language arts, mathematics, music, physical education, science, social studies, special education, and technology. Career education, wellness, social/emotional learning and human sexuality are integrated into appropriate

6
curricular programs. Emporia High School and Emporia Middle School are developing career pathways in several fields of interest to students.
• The district has a comprehensive vocational education program. Students begin exploring career interests in middle school and are afforded the opportunity for technically advanced courses throughout high school and at the Flint Hills Technical College. • The district has an extensive high school co-curricular program, which provides many
opportunities for social, physical, and intellectual growth. This program includes activities in forensics, debate, music, intramural activities, special interest clubs, interscholastic athletics, and organized class and student government.
• The district provides a well-balanced program for students with special needs. With emphasis on inclusion, this program includes classes for the gifted, the mentally and physically handicapped, at-risk students, and those requiring homebound instruction, bilingual, remedial reading, or educational enhancement.
• The district provides student support programs in addition to the academic program. These include guidance and counseling, standardized testing, field trips, health services, centralized media centers, after-school care/activities and alternative school choices.
• The district’s operational services include business, technology, nutrition, maintenance, central supply and transportation services. • The school district consists of approximately 135 square miles. • The district contracts with the Flint Hills Technical College to provide adult basic education
classes and other adult education courses on a demand basis. • The district food service department provides hot breakfast and lunch at all schools each day with
the food prepared at a central kitchen and delivered to the schools. Approximately 4,200 meals are served each day. The department is an active partner in the District Wellness Policy and Action Plan, which focuses on nutrition and nutrition education. The district also participates in the Federal summer meals program serving breakfast and lunch at five school sites for children age 18 and under.
• The district has an approved state professional development plan which allows for teacher recertification. • The district provides transportation to and from school for all students who live 2.5 miles or more from school in addition to areas identified for safety considerations. • The schools benefit from partnerships with parents, businesses and community groups. Parent
organizations are active from the elementary to the high school level. Businesses, community foundations, just to name a few.
• Emporia teachers support teacher training by supervising teacher education students as observers, student teachers and teacher interns. Emporia teachers also are frequent speakers in university classrooms. University faculty members serve as resources for our teachers as well. • Emporia USD 253 does not discriminate on the basis of race, color, national origin, sex, religion, handicap/disability or age. Persons having inquiries may contact the school district's coordinator, 1700 West 7th Avenue, Emporia, KS 66801, 620-341-2222.

7
Supplemental Information for the Following Tables 1. Summary of Total Expenditures by Function (All Funds) 2. Summary of General Fund Expenditures by Function 3. Summary of Supplemental General Fund Expenditures by Function
a. We have increased our supplemental general fund amount by the same
amount of our adult education levy that we are no longer assessing. 4. Summary of General and Supplemental General Fund Expenditures by Function 5. Summary of Special Education Fund by Function 6. Instruction Expenditures (1000) 7. Student and Instructional Support Expenditures (2100 & 2200) 8. General Administration Expenditures (2300) 9. School Administration Expenditures (2400) 10. Operations and Maintenance Expenditures (2600) 11. Other Costs (2500 & 2900: Other Supplemental Services) (3000: Non-Instruction
Services) 12. Capital Improvements (4000) 13. Debt Services (5000) 14. Miscellaneous Information - Transfers 15. Miscellaneous Information Unencumbered Cash Balance by Fund 16. Reserve Funds Unencumbered Cash Balance 17. Other Information - FTE 18. Miscellaneous Information Mill Rates by Fund 19. Other Information – Assessed Valuation and Bonded Indebtedness Note: The FTE (full time equivalency) used in this report to calculate the “Amount Per Pupil” is defined as following: Enrollment (FTE) includes the enrollment of the district used for state aid and budget authority, and all other preschool enrollment and kindergarten students attending full time.

8
KSDE Website Information Available K-12 Statistics (Building, District or State Totals) http://svapp15586.ksde.org/k12/k12.aspx
• Attendance / Enrollment Reports • Staff Reports • Graduates / Dropouts Reports • Crime / Violence Reports
School Finance Reports and Publications http://www.ksde.org/Default.aspx?tabid=1870
• Certified Personnel • Enrollment • Dropouts • Graduates • Salary Reports
Kansas Building Report Card http://svapp15586.ksde.org/rcard/
• Attendance Rate • Graduation Rate • Dropout Rate • School Violence • Assessments
o Reading o Mathematics o Writing
• Graduates Passing Adv. Science Courses • Graduates Passing Adv. Math Courses

USD# 253
Summary of Total Expenditures By Function (All Funds)
% % % % %
2011-2012 of 2012-2013 of inc/ 2013-2014 of inc/
Actual Tot Actual Tot dec Budget Tot dec
Instruction 35,033,269 60% 34,135,294 59% -3% 39,283,376 60% 15%
Student Support Services 3,734,105 6% 3,663,443 6% -2% 4,100,423 6% 12%
Instructional Support Services 3,146,259 5% 3,780,844 7% 20% 4,259,865 6% 13%
General Administration 1,508,193 3% 1,308,284 2% -13% 1,773,284 3% 36%
School Administration (Building) 2,394,473 4% 2,436,476 4% 2% 2,492,184 4% 2%
Operations & Maintenance 3,941,846 7% 4,099,833 7% 4% 3,947,454 6% -4%
Transportation 1,950,479 3% 1,909,321 3% -2% 2,152,283 3% 13%
Food Services 2,243,313 4% 2,372,220 4% 6% 2,632,927 4% 11%
Capital Improvements 364,531 1% 48,964 0% -87% 1,000,216 2% 1943%
Debt Services 4,038,973 7% 3,843,289 7% -5% 3,555,364 5% -7%
Other Costs 468,178 1% 565,198 1% 21% 604,386 1% 7%
Total Expenditures* 58,823,619 100% 58,163,166 100% -1% 65,801,762 100% 13%
Amount per Pupil $12,664 $12,522 -1% $14,197 13%
Current Expenditures** 53,794,567 100% 54,056,711 100% 0% 59,691,182 100% 10%
Amount per Pupil $11,581 $11,638 0% $12,878 11%
Instruction*** (Total Expenditures) 34,619,208 59% 34,007,957 58% -1% 38,083,376 58% 0%
Instruction*** (Current Expenditures) 34,619,208 64% 34,007,957 63% -1% 38,083,376 64% 1%
Note: Percentages on charts are within +-1% due to rounding used. Pie graph percentages may differ from charts for this reason also.
Further definition of what goes into each category:
Instruction - 1000 Transportation - 2700
Student Support Services - 2100 Food Service - 3100
Instructional Support Services - 2200 Other Costs - 2500/2900 and 3300
General Administration - 2300 Capital Improvements - 4000
School Administration (Building) - 2400 Debt Services - 5100
Operations & Maintenance - 2600 Transfers - 5200
Percent of Expenditures
* The funds that are included in the categories above are: General, Supplemental General, Bilingual Education, At Risk(4yr Old), At Risk(K-12), Virtual Education, Capital
Outlay, Driver Education, Extraordinary School Program, Summer School, Special Education, Vocational Education, Professional Development, Bond & Interest #1, Bond &
Interest #2, No-Fund Warrant, Special Assessment, Parent Education, School Retirement, Student Materials Revolving & Textbook Rental, Tuition Reimbursement,
Gifts/Grants, KPERS Special Retirement Contribution, Contingency, Special Liability Expense, Federal Funds, Adult Education, Adult Supplemental Education, Activity Fund
and Special Education Coop Fund.
*** Instruction excludes Capital Outlay and Bond Debt expenditures (Code 16, Code 62, Code 63)
** Current Spending excludes Capital Outlay and Bond Debt expenditures (Code 16, Code 62, Code 63)
0
5,000,000
10,000,000
15,000,000
20,000,000
25,000,000
30,000,000
35,000,000
40,000,00039,283,376
4,100,423 4,259,865
1,773,284 2,492,184 3,947,454
2,152,283 2,632,927
1,000,216 3,555,364
604,386
Summary of Total Expenditures by Function (All Funds)
2011-2012
2012-2013
2013-2014
Instruction 60%
Student Support Services 6%
Instructional Support 6%
General Administration 3%
School Administration (Building)
4%
Operations & Maintenance
6%
Transportation 3%
Food Services 4%
Capital Improvements 2%
Debt Services 5%
Other Costs 1%
2013-14 Summary of Total Expenditures by Function
Instruction
Student Support Services
Instructional Support
General Administration
School Administration (Building)
Operations & Maintenance
Transportation
Food Services
Capital Improvements
Debt Services
Other Costs
9/10/2013 1:24 PM Sumexpen.xlsx Page 1 of 24

USD# 253
Summary of General Fund Expenditures
by Function
% % % % %
2011-2012 of 2012-2013 of inc/ 2013-2014 of inc/
Actual Tot Actual Tot dec Budget Tot dec
Instruction 9,220,466 55% 9,069,608 56% -2% 9,745,451 57% 7%
Student Support 34,536 0% 14,804 0% -57% 18,380 0% 24%
Instructional Support 597,935 4% 595,446 4% 0% 673,091 4% 13%
General Administration 880,549 5% 833,139 5% -5% 890,991 5% 7%
School Administration (Building) 2,114,832 13% 1,638,362 10% -23% 1,682,095 10% 3%
Operations & Maintenance 2,755,641 16% 2,917,841 18% 6% 2,862,140 17% -2%
Transportation 1,191,495 7% 1,238,700 8% 4% 1,144,061 7% -8%
Capital Improvements 0 0% 0 0% 0% 0 0% 0%
Other Costs 0 0% 0 0% 0% 0 0% 0%
Total Expenditures 16,795,454 100% 16,307,900 100% -3% 17,016,209 100% 4%
Amount per Pupil $3,616 $3,511 -3% $3,671 5%
The Summary of General Fund Expenditures chart information comes from pages 6-13 and only uses the 'General Fund' line items.
0
1,000,000
2,000,000
3,000,000
4,000,000
5,000,000
6,000,000
7,000,000
8,000,000
9,000,000
10,000,0009,745,451
18,380
673,091 890,991
1,682,095
2,862,140
1,144,061
0 0
Summary of General Fund Expenditures
2011-2012
2012-2013
2013-2014
Instruction 57%
Instructional Support 4%
General Administration 5%
School Administration (Building)
10%
Operations & Maintenance 17%
Transportation 7%
2013-14 Summary of General Fund Expenditures by Function
Instruction
Student Support
Instructional Support
General Administration
School Administration (Building)
Operations & Maintenance
Transportation
Capital Improvements
Other Costs
9/10/2013 1:24 PM Sumexpen.xlsx Page 2 of 24

USD# 253
Summary of Supplemental General Fund Expenditures
by Function
% % % % %
2011-2012 of 2012-2013 of inc/ 2013-2014 of inc/
Actual Tot Actual Tot dec Budget Tot dec
Instruction 3,667,453 48% 3,833,062 46% 5% 4,000,900 46% 4%
Student Support 1,474,835 19% 1,582,384 19% 7% 1,620,048 18% 2%
Instructional Support 1,077,206 14% 1,018,451 12% -5% 1,060,814 12% 4%
General Administration 132,531 2% 40,287 0% -70% 216,723 2% 438%
School Administration (Building) 0 0% 512,089 6% 0% 517,196 6% 1%
Operations & Maintenance 873,351 11% 740,114 9% -15% 813,600 9% 10%
Transportation 0 0% 0 0% 0% 0 0% 0%
Capital Improvements 14,678 0% 7,040 0% -52% 0 0% -100%
Other Costs 414,225 5% 523,168 6% 26% 540,261 6% 3%
Total Expenditures 7,654,279 100% 8,256,595 100% 8% 8,769,542 100% 6%
Amount per Pupil $1,648 $1,778 8% $1,892 6%
The Summary of Supplemental General Fund Expenditures chart information comes from pages 6-13 and only uses the 'Supplemental
General Fund' line items.
0
500,000
1,000,000
1,500,000
2,000,000
2,500,000
3,000,000
3,500,000
4,000,000
4,500,0004,000,900
1,620,048
1,060,814
216,723
517,196
813,600
0 0
540,261
Summary of Supplemental General Expenditures by Function
2011-2012
2012-2013
2013-2014
Instruction 46%
Student Support 19% Instructional Support
12%
General Administration 2%
School Administration (Building)
6%
Operations & Maintenance 9%
Other Costs 6%
2013-14 Summary of Supplemental General Fund Expenditures by Function
Instruction
Student Support
Instructional Support
General Administration
School Administration (Building)
Operations & Maintenance
Transportation
Capital Improvements
Other Costs
9/10/2013 1:24 PM Sumexpen.xlsx Page 3 of 24
USD# 253
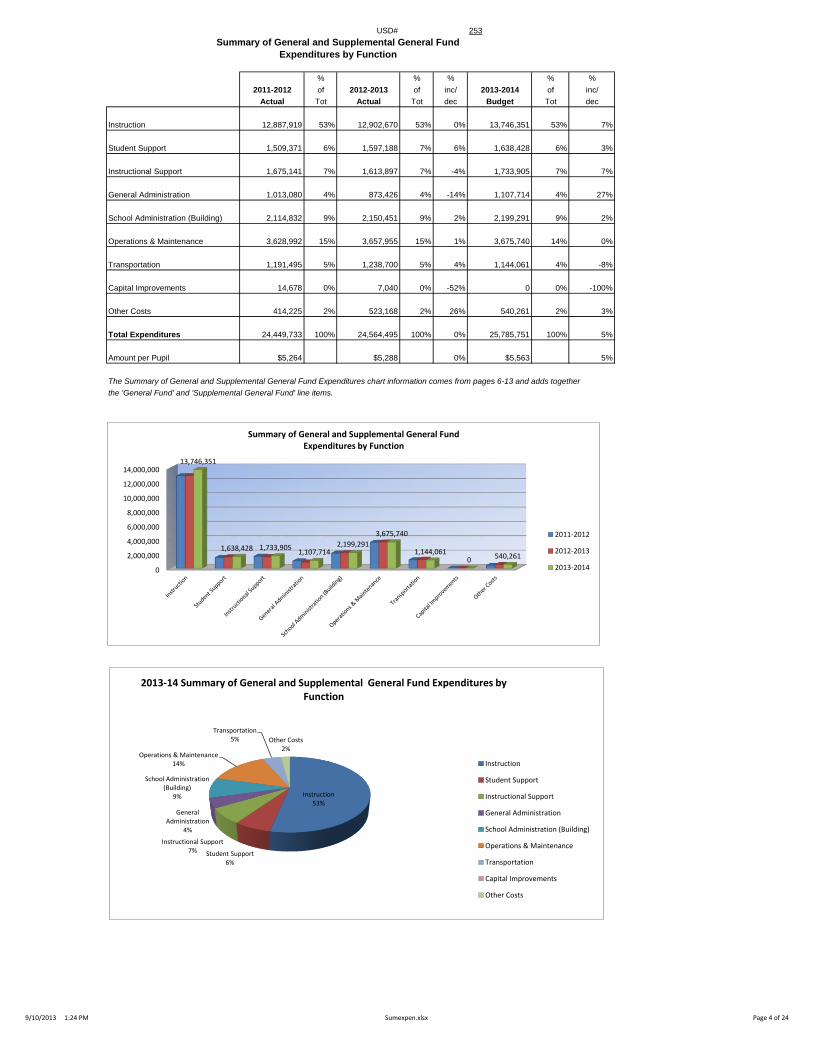
Summary of General and Supplemental General Fund
Expenditures by Function
% % % % %
2011-2012 of 2012-2013 of inc/ 2013-2014 of inc/
Actual Tot Actual Tot dec Budget Tot dec
Instruction 12,887,919 53% 12,902,670 53% 0% 13,746,351 53% 7%
Student Support 1,509,371 6% 1,597,188 7% 6% 1,638,428 6% 3%
Instructional Support 1,675,141 7% 1,613,897 7% -4% 1,733,905 7% 7%
General Administration 1,013,080 4% 873,426 4% -14% 1,107,714 4% 27%
School Administration (Building) 2,114,832 9% 2,150,451 9% 2% 2,199,291 9% 2%
Operations & Maintenance 3,628,992 15% 3,657,955 15% 1% 3,675,740 14% 0%
Transportation 1,191,495 5% 1,238,700 5% 4% 1,144,061 4% -8%
Capital Improvements 14,678 0% 7,040 0% -52% 0 0% -100%
Other Costs 414,225 2% 523,168 2% 26% 540,261 2% 3%
Total Expenditures 24,449,733 100% 24,564,495 100% 0% 25,785,751 100% 5%
Amount per Pupil $5,264 $5,288 0% $5,563 5%
The Summary of General and Supplemental General Fund Expenditures chart information comes from pages 6-13 and adds together
the 'General Fund' and 'Supplemental General Fund' line items.
0
2,000,000
4,000,000
6,000,000
8,000,000
10,000,000
12,000,000
14,000,00013,746,351
1,638,428 1,733,905 1,107,714
2,199,291
3,675,740
1,144,061 0 540,261
Summary of General and Supplemental General Fund Expenditures by Function
2011-2012
2012-2013
2013-2014
Instruction 53%
Student Support 6%
Instructional Support 7%
General Administration
4%
School Administration (Building)
9%
Operations & Maintenance 14%
Transportation 5% Other Costs
2%
2013-14 Summary of General and Supplemental General Fund Expenditures by Function
Instruction
Student Support
Instructional Support
General Administration
School Administration (Building)
Operations & Maintenance
Transportation
Capital Improvements
Other Costs
9/10/2013 1:24 PM Sumexpen.xlsx Page 4 of 24

USD# 253
Summary of Special Education Fund
by Function
% % % % %
2011-2012 of 2012-2013 of inc/ 2013-2014 of inc/
Actual Tot Actual Tot dec Budget Tot dec
Instruction 3,596,578 93% 3,609,102 91% 0% 4,643,563 90% 29%
Student Support 0 0% 0 0% 0% 0 0% 0%
Instructional Support 0 0% 0 0% 0% 0 0% 0%
General Administration 0 0% 0 0% 0% 0 0% 0%
School Administration (Building) 0 0% 0 0% 0% 0 0% 0%
Operations & Maintenance 0 0% 0 0% 0% 0 0% 0%
Transportation 280,224 7% 347,019 9% 24% 542,000 10% 56%
Capital Improvements 0 0% 0 0% 0% 0 0% 0%
Other Costs 0 0% 0 0% 0% 0 0% 0%
Total Expenditures 3,876,802 100% 3,956,121 100% 2% 5,185,563 100% 31%
Amount per Pupil $835 $852 2% $1,119 31%
The Summary of Special Education Fund Expenditures chart information comes from pages 6-13 and only uses the 'Special Education Fund'
line items. (Total expenditures excludes Special Ed Coop Fund because it would include expenditures for all schools participating in the Coop.)
0
500,000
1,000,000
1,500,000
2,000,000
2,500,000
3,000,000
3,500,000
4,000,000
4,500,000
5,000,000
3,5
96
,57
8
0
0
0
0
0
28
0,2
24
0
0
3,6
09
,10
2
0
0
0
0
0
34
7,0
19
0
0
4,6
43
,56
3
0
0
0
0
0
54
2,0
00
0
0
Summary of Special Education Fund Expenditures by Function
2011-2012
2012-2013
2013-2014
Instruction 90%
Transportation 10%
2013-14 Summary of Special Education Fund by Function
Instruction
Student Support
Instructional Support
General Administration
School Administration (Building)
Operations & Maintenance
Transportation
Capital Improvements
Other Costs
9/10/2013 1:24 PM Sumexpen.xlsx Page 5 of 24
USD# 253
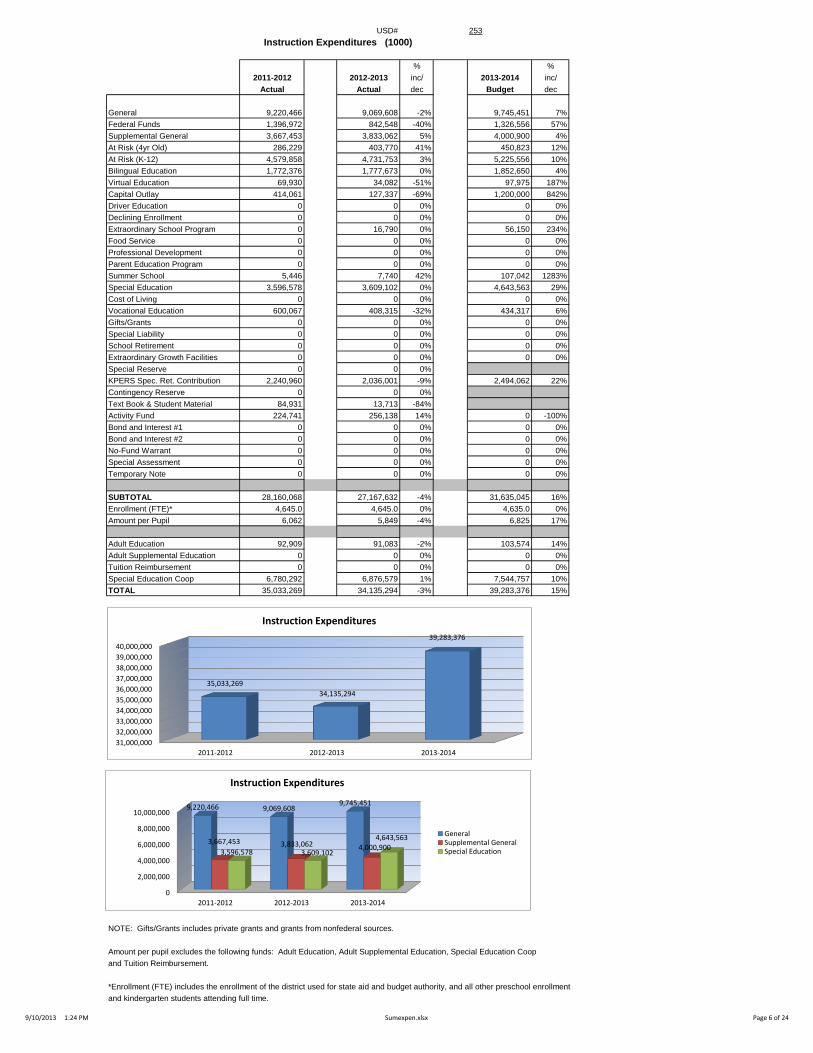
Instruction Expenditures (1000)
% %
2011-2012 2012-2013 inc/ 2013-2014 inc/
Actual Actual dec Budget dec
General 9,220,466 9,069,608 -2% 9,745,451 7%
Federal Funds 1,396,972 842,548 -40% 1,326,556 57%
Supplemental General 3,667,453 3,833,062 5% 4,000,900 4%
At Risk (4yr Old) 286,229 403,770 41% 450,823 12%
At Risk (K-12) 4,579,858 4,731,753 3% 5,225,556 10%
Bilingual Education 1,772,376 1,777,673 0% 1,852,650 4%
Virtual Education 69,930 34,082 -51% 97,975 187%
Capital Outlay 414,061 127,337 -69% 1,200,000 842%
Driver Education 0 0 0% 0 0%
Declining Enrollment 0 0 0% 0 0%
Extraordinary School Program 0 16,790 0% 56,150 234%
Food Service 0 0 0% 0 0%
Professional Development 0 0 0% 0 0%
Parent Education Program 0 0 0% 0 0%
Summer School 5,446 7,740 42% 107,042 1283%
Special Education 3,596,578 3,609,102 0% 4,643,563 29%
Cost of Living 0 0 0% 0 0%
Vocational Education 600,067 408,315 -32% 434,317 6%
Gifts/Grants 0 0 0% 0 0%
Special Liability 0 0 0% 0 0%
School Retirement 0 0 0% 0 0%
Extraordinary Growth Facilities 0 0 0% 0 0%
Special Reserve 0 0 0%
KPERS Spec. Ret. Contribution 2,240,960 2,036,001 -9% 2,494,062 22%
Contingency Reserve 0 0 0%
Text Book & Student Material 84,931 13,713 -84%
Activity Fund 224,741 256,138 14% 0 -100%
Bond and Interest #1 0 0 0% 0 0%
Bond and Interest #2 0 0 0% 0 0%
No-Fund Warrant 0 0 0% 0 0%
Special Assessment 0 0 0% 0 0%
Temporary Note 0 0 0% 0 0%
SUBTOTAL 28,160,068 27,167,632 -4% 31,635,045 16%
Enrollment (FTE)* 4,645.0 4,645.0 0% 4,635.0 0%
Amount per Pupil 6,062 5,849 -4% 6,825 17%
Adult Education 92,909 91,083 -2% 103,574 14%
Adult Supplemental Education 0 0 0% 0 0%
Tuition Reimbursement 0 0 0% 0 0%
Special Education Coop 6,780,292 6,876,579 1% 7,544,757 10%
TOTAL 35,033,269 34,135,294 -3% 39,283,376 15%
NOTE: Gifts/Grants includes private grants and grants from nonfederal sources.
Amount per pupil excludes the following funds: Adult Education, Adult Supplemental Education, Special Education Coop
and Tuition Reimbursement.
*Enrollment (FTE) includes the enrollment of the district used for state aid and budget authority, and all other preschool enrollment
and kindergarten students attending full time.
0
2,000,000
4,000,000
6,000,000
8,000,000
10,000,000
2011-2012 2012-2013 2013-2014
9,220,466 9,069,608 9,745,451
3,667,453 3,833,062 4,000,900 3,596,578 3,609,102
4,643,563
Instruction Expenditures
GeneralSupplemental GeneralSpecial Education
31,000,000
32,000,000
33,000,000
34,000,000
35,000,000
36,000,000
37,000,000
38,000,000
39,000,000
40,000,000
2011-2012 2012-2013 2013-2014
35,033,269
34,135,294
39,283,376
Instruction Expenditures
9/10/2013 1:24 PM Sumexpen.xlsx Page 6 of 24
USD# 253
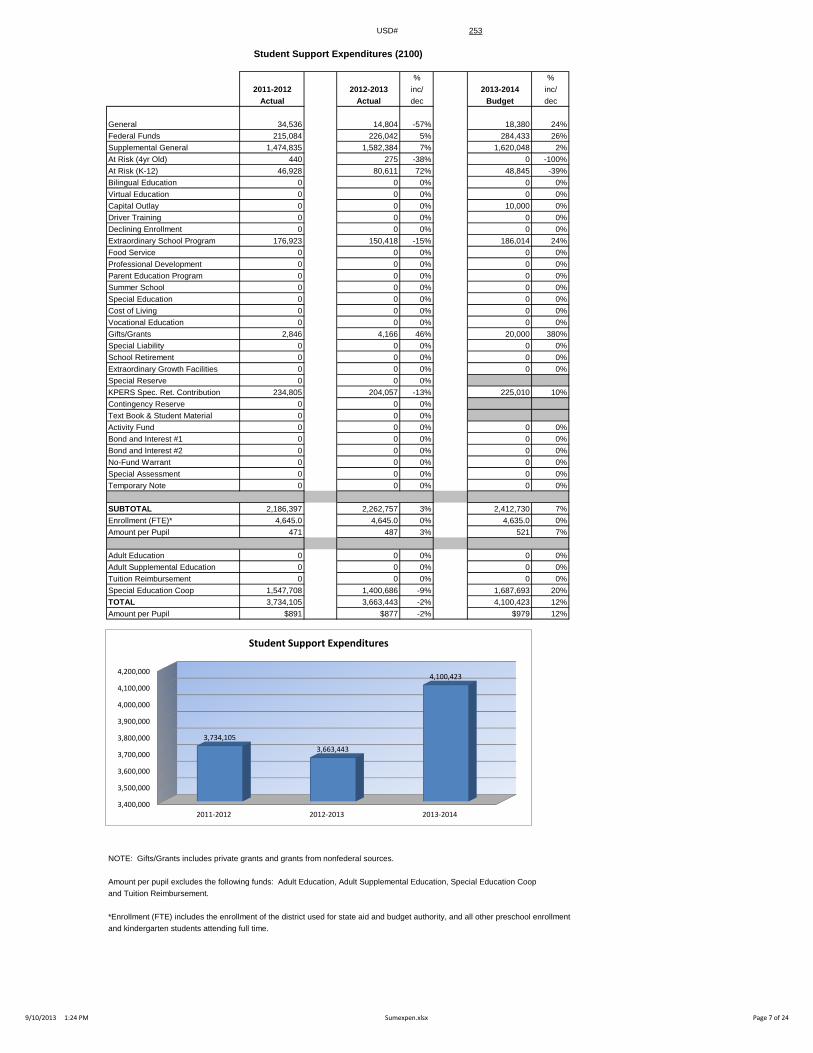
Student Support Expenditures (2100)
% %
2011-2012 2012-2013 inc/ 2013-2014 inc/
Actual Actual dec Budget dec
General 34,536 14,804 -57% 18,380 24%
Federal Funds 215,084 226,042 5% 284,433 26%
Supplemental General 1,474,835 1,582,384 7% 1,620,048 2%
At Risk (4yr Old) 440 275 -38% 0 -100%
At Risk (K-12) 46,928 80,611 72% 48,845 -39%
Bilingual Education 0 0 0% 0 0%
Virtual Education 0 0 0% 0 0%
Capital Outlay 0 0 0% 10,000 0%
Driver Training 0 0 0% 0 0%
Declining Enrollment 0 0 0% 0 0%
Extraordinary School Program 176,923 150,418 -15% 186,014 24%
Food Service 0 0 0% 0 0%
Professional Development 0 0 0% 0 0%
Parent Education Program 0 0 0% 0 0%
Summer School 0 0 0% 0 0%
Special Education 0 0 0% 0 0%
Cost of Living 0 0 0% 0 0%
Vocational Education 0 0 0% 0 0%
Gifts/Grants 2,846 4,166 46% 20,000 380%
Special Liability 0 0 0% 0 0%
School Retirement 0 0 0% 0 0%
Extraordinary Growth Facilities 0 0 0% 0 0%
Special Reserve 0 0 0%
KPERS Spec. Ret. Contribution 234,805 204,057 -13% 225,010 10%
Contingency Reserve 0 0 0%
Text Book & Student Material 0 0 0%
Activity Fund 0 0 0% 0 0%
Bond and Interest #1 0 0 0% 0 0%
Bond and Interest #2 0 0 0% 0 0%
No-Fund Warrant 0 0 0% 0 0%
Special Assessment 0 0 0% 0 0%
Temporary Note 0 0 0% 0 0%
SUBTOTAL 2,186,397 2,262,757 3% 2,412,730 7%
Enrollment (FTE)* 4,645.0 4,645.0 0% 4,635.0 0%
Amount per Pupil 471 487 3% 521 7%
Adult Education 0 0 0% 0 0%
Adult Supplemental Education 0 0 0% 0 0%
Tuition Reimbursement 0 0 0% 0 0%
Special Education Coop 1,547,708 1,400,686 -9% 1,687,693 20%
TOTAL 3,734,105 3,663,443 -2% 4,100,423 12%
Amount per Pupil $891 $877 -2% $979 12%
NOTE: Gifts/Grants includes private grants and grants from nonfederal sources.
Amount per pupil excludes the following funds: Adult Education, Adult Supplemental Education, Special Education Coop
and Tuition Reimbursement.
*Enrollment (FTE) includes the enrollment of the district used for state aid and budget authority, and all other preschool enrollment
and kindergarten students attending full time.
3,400,000
3,500,000
3,600,000
3,700,000
3,800,000
3,900,000
4,000,000
4,100,000
4,200,000
2011-2012 2012-2013 2013-2014
3,734,105
3,663,443
4,100,423
Student Support Expenditures
9/10/2013 1:24 PM Sumexpen.xlsx Page 7 of 24

USD# 253
Instructional Support Expenditures (2200)
% %
2011-2012 2012-2013 inc/ 2013-2014 inc/
Actual Actual dec Budget dec
General 597,935 595,446 0% 673,091 13%
Federal Funds 591,268 892,267 51% 846,826 -5%
Supplemental General 1,077,206 1,018,451 -5% 1,060,814 4%
At Risk (4yr Old) 0 0 0% 0 0%
At Risk (K-12) 94,035 207,717 121% 239,417 15%
Bilingual Education 0 0 0% 0 0%
Virtual Education 0 0 0% 0 0%
Capital Outlay 0 0 0% 50,000 0%
Driver Training 0 0 0% 0 0%
Declining Enrollment 0 0 0% 0 0%
Extraordinary School Program 0 0 0% 0 0%
Food Service 0 0 0% 0 0%
Professional Development 42,817 279,214 552% 450,969 62%
Parent Education Program 0 0 0% 0 0%
Summer School 0 0 0% 0 0%
Special Education 0 0 0% 0 0%
Cost of Living 0 0 0% 0 0%
Vocational Education 15,087 17,200 14% 14,676 -15%
Gifts/Grants 22,780 38,248 68% 99,454 160%
Special Liability 0 0 0% 0 0%
School Retirement 0 0 0% 0 0%
Extraordinary Growth Facilities 0 0 0% 0 0%
Special Reserve 0 0 0%
KPERS Spec. Ret. Contribution 201,232 202,863 1% 204,576 1%
Contingency Reserve 0 0 0%
Text Book & Student Material 0 0 0%
Activity Fund 0 0 0% 0 0%
Bond and Interest #1 0 0 0% 0 0%
Bond and Interest #2 0 0 0% 0 0%
No-Fund Warrant 0 0 0% 0 0%
Special Assessment 0 0 0% 0 0%
Temporary Note 0 0 0% 0 0%
SUBTOTAL 2,642,360 3,251,406 23% 3,639,823 12%
Enrollment (FTE)* 4,645.0 4,645.0 0% 4,635.0 0%
Amount per Pupil 569 700 23% 785 12%
Adult Education 0 0 0% 0 0%
Adult Supplemental Education 0 0 0% 0 0%
Tuition Reimbursement 0 0 0% 0 0%
Special Education Coop 503,899 529,438 5% 620,042 17%
TOTAL 3,146,259 3,780,844 20% 4,259,865 13%
Amount per Pupil $677 $814 20% $919 13%
NOTE: Gifts/Grants includes private grants and grants from nonfederal sources.
Amount per pupil excludes the following funds: Adult Education, Adult Supplemental Education, Special Education Coop
and Tuition Reimbursement.
*Enrollment (FTE) includes the enrollment of the district used for state aid and budget authority, and all other preschool enrollment
and kindergarten students attending full time.
0
500,000
1,000,000
1,500,000
2,000,000
2,500,000
3,000,000
3,500,000
4,000,000
4,500,000
2011-2012 2012-2013 2013-2014
3,146,259
3,780,844
4,259,865
Instructional Support Expenditures
9/10/2013 1:24 PM Sumexpen.xlsx Page 8 of 24

USD# 253
General Administration Expenditures (2300)
% %
2011-2012 2012-2013 inc/ 2013-2014 inc/
Actual Actual dec Budget dec
General 880,549 833,139 -5% 890,991 7%
Federal Funds 92,636 92,115 -1% 111,488 21%
Supplemental General 132,531 40,287 -70% 216,723 438%
At Risk (4yr Old) 0 0 0% 0 0%
At Risk (K-12) 0 0 0% 0 0%
Bilingual Education 0 0 0% 0 0%
Virtual Education 0 0 0% 0 0%
Capital Outlay 0 8,246 0% 50,000 506%
Driver Training 0 0 0% 0 0%
Declining Enrollment 0 0 0% 0 0%
Extraordinary School Program 0 0 0% 0 0%
Food Service 0 0 0% 0 0%
Professional Development 0 0 0% 0 0%
Parent Education Program 0 0 0% 0 0%
Summer School 0 0 0% 0 0%
Special Education 0 0 0% 0 0%
Cost of Living 0 0 0% 0 0%
Vocational Education 0 0 0% 0 0%
Gifts/Grants 0 0 0% 0 0%
Special Liability Expense 0 0 0% 0 0%
School Retirement 0 0 0% 0 0%
Extraordinary Growth Facilities 0 0 0% 0 0%
Special Reserve 0 0 0%
KPERS Spec. Ret. Contribution 104,008 80,683 -22% 76,798 -5%
Contingency Reserve 0 0 0%
Text Book & Student Material 0 0 0%
Activity Fund 0 0 0% 0 0%
Bond and Interest #1 0 0 0% 0 0%
Bond and Interest #2 0 0 0% 0 0%
No-Fund Warrant 0 0 0% 0 0%
Special Assessment 0 0 0% 0 0%
Temporary Note 0 0 0% 0 0%
SUBTOTAL 1,209,724 1,054,470 -13% 1,346,000 28%
Enrollment (FTE)* 4,645.0 4,645.0 0% 4,635.0 0%
Amount per Pupil 260 227 -13% 290 28%
Adult Education 0 0 0% 0 0%
Adult Supplemental Education 0 0 0% 0 0%
Tuition Reimbursement 0 0 0% 0 0%
Special Education Coop 298,469 253,814 0% 427,284 68%
TOTAL 1,508,193 1,308,284 -13% 1,773,284 36%
NOTE: Gifts/Grants includes private grants and grants from nonfederal sources.
Amount per pupil excludes the following funds: Adult Education, Adult Supplemental Education, Special Education Coop
and Tuition Reimbursement.
*Enrollment (FTE) includes the enrollment of the district used for state aid and budget authority, and all other preschool enrollment
and kindergarten students attending full time.
0
200,000
400,000
600,000
800,000
1,000,000
1,200,000
1,400,000
1,600,000
1,800,000
2011-2012 2012-2013 2013-2014
1,508,193
1,308,284
1,773,284
General Administration Expenditures
9/10/2013 1:24 PM Sumexpen.xlsx Page 9 of 24

USD# 253
School Administration Expenditures (2400)
% %
2011-2012 2012-2013 inc/ 2013-2014 inc/
Actual Actual dec Budget dec
General 2,114,832 1,638,362 -23% 1,682,095 3%
Federal Funds 0 0 0% 0 0%
Supplemental General 0 512,089 0% 517,196 1%
At Risk (4yr Old) 1,216 20,922 1621% 0 -100%
At Risk (K-12) 27,963 29,818 7% 30,445 2%
Bilingual Education 0 0 0% 0 0%
Virtual Education 0 0 0% 0 0%
Capital Outlay 0 0 0% 25,000 0%
Driver Training 0 0 0% 0 0%
Declining Enrollment 0 0 0% 0 0%
Extraordinary School Program 0 0 0% 0 0%
Food Service 0 0 0% 0 0%
Professional Development 0 0 0% 0 0%
Parent Education Program 0 0 0% 0 0%
Summer School 0 0 0% 0 0%
Special Education 0 0 0% 0 0%
Cost of Living 0 0 0% 0 0%
Vocational Education 1,546 2,098 36% 340 -84%
Gifts/Grants 0 0 0% 0 0%
Special Liability Expense 0 0 0% 0 0%
School Retirement 0 0 0% 0 0%
Extraordinary Growth Facilities 0 0 0% 0 0%
Special Reserve 0 0 0%
KPERS Spec. Ret. Contribution 248,916 197,487 -21% 195,659 -1%
Contingency Reserve 0 0 0%
Text Book & Student Material 0 0 0%
Activity Fund 0 0 0% 0 0%
Bond and Interest #1 0 0 0% 0 0%
Bond and Interest #2 0 0 0% 0 0%
No-Fund Warrant 0 0 0% 0 0%
Special Assessment 0 0 0% 0 0%
Temporary Note 0 0 0% 0 0%
SUBTOTAL 2,394,473 2,400,776 0% 2,450,735 2%
Enrollment (FTE)* 4,645.0 4,645.0 0% 4,635.0 0%
Amount per Pupil 515 517 0% 529 2%
Adult Education 0 0 0% 0 0%
Adult Supplemental Education 0 0 0% 0 0%
Tuition Reimbursement 0 0 0% 0 0%
Special Education Coop 0 35,700 0% 41,449 16%
TOTAL 2,394,473 2,436,476 2% 2,492,184 2%
NOTE: Gifts/Grants includes private grants and grants from nonfederal sources.
Amount per pupil excludes the following funds: Adult Education, Adult Supplemental Education, Special Education Coop
and Tuition Reimbursement.
*Enrollment (FTE) includes the enrollment of the district used for state aid and budget authority, and all other preschool enrollment
and kindergarten students attending full time.
2,340,000
2,360,000
2,380,000
2,400,000
2,420,000
2,440,000
2,460,000
2,480,000
2,500,000
2011-2012 2012-2013 2013-2014
2,394,473
2,436,476
2,492,184
School Administration Expenditures
9/10/2013 1:24 PM Sumexpen.xlsx Page 10 of 24
USD# 253
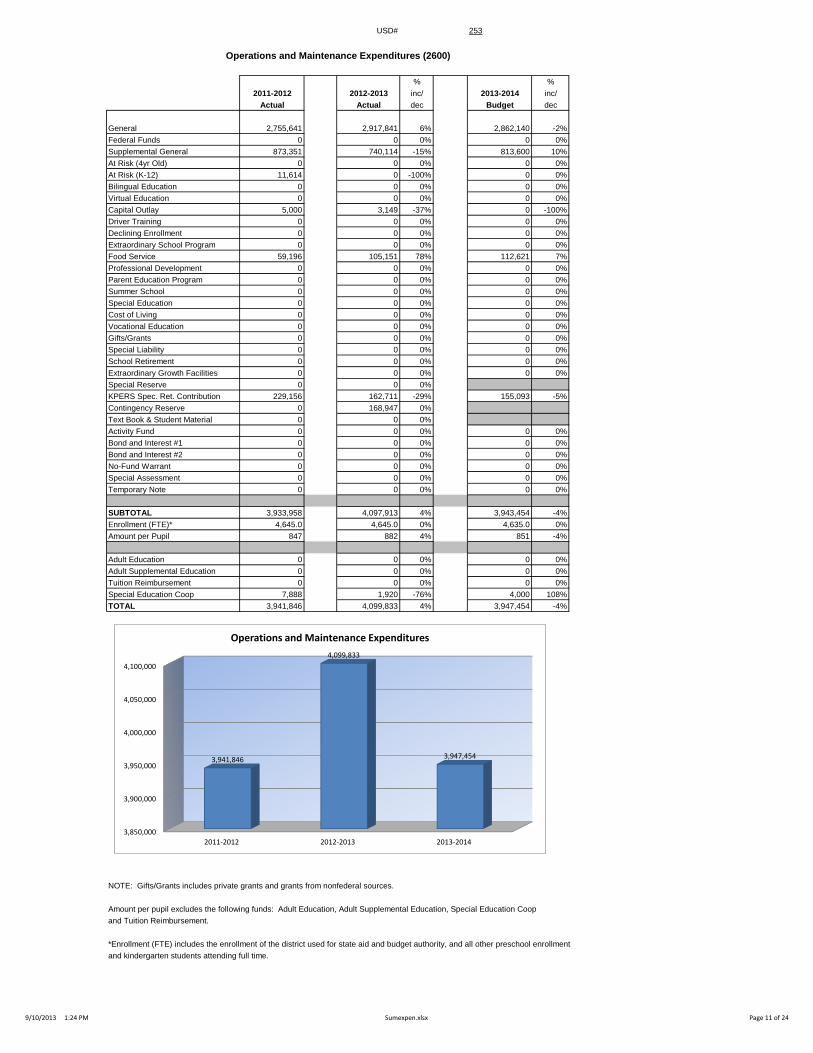
Operations and Maintenance Expenditures (2600)
% %
2011-2012 2012-2013 inc/ 2013-2014 inc/
Actual Actual dec Budget dec
General 2,755,641 2,917,841 6% 2,862,140 -2%
Federal Funds 0 0 0% 0 0%
Supplemental General 873,351 740,114 -15% 813,600 10%
At Risk (4yr Old) 0 0 0% 0 0%
At Risk (K-12) 11,614 0 -100% 0 0%
Bilingual Education 0 0 0% 0 0%
Virtual Education 0 0 0% 0 0%
Capital Outlay 5,000 3,149 -37% 0 -100%
Driver Training 0 0 0% 0 0%
Declining Enrollment 0 0 0% 0 0%
Extraordinary School Program 0 0 0% 0 0%
Food Service 59,196 105,151 78% 112,621 7%
Professional Development 0 0 0% 0 0%
Parent Education Program 0 0 0% 0 0%
Summer School 0 0 0% 0 0%
Special Education 0 0 0% 0 0%
Cost of Living 0 0 0% 0 0%
Vocational Education 0 0 0% 0 0%
Gifts/Grants 0 0 0% 0 0%
Special Liability 0 0 0% 0 0%
School Retirement 0 0 0% 0 0%
Extraordinary Growth Facilities 0 0 0% 0 0%
Special Reserve 0 0 0%
KPERS Spec. Ret. Contribution 229,156 162,711 -29% 155,093 -5%
Contingency Reserve 0 168,947 0%
Text Book & Student Material 0 0 0%
Activity Fund 0 0 0% 0 0%
Bond and Interest #1 0 0 0% 0 0%
Bond and Interest #2 0 0 0% 0 0%
No-Fund Warrant 0 0 0% 0 0%
Special Assessment 0 0 0% 0 0%
Temporary Note 0 0 0% 0 0%
SUBTOTAL 3,933,958 4,097,913 4% 3,943,454 -4%
Enrollment (FTE)* 4,645.0 4,645.0 0% 4,635.0 0%
Amount per Pupil 847 882 4% 851 -4%
Adult Education 0 0 0% 0 0%
Adult Supplemental Education 0 0 0% 0 0%
Tuition Reimbursement 0 0 0% 0 0%
Special Education Coop 7,888 1,920 -76% 4,000 108%
TOTAL 3,941,846 4,099,833 4% 3,947,454 -4%
NOTE: Gifts/Grants includes private grants and grants from nonfederal sources.
Amount per pupil excludes the following funds: Adult Education, Adult Supplemental Education, Special Education Coop
and Tuition Reimbursement.
*Enrollment (FTE) includes the enrollment of the district used for state aid and budget authority, and all other preschool enrollment
and kindergarten students attending full time.
3,850,000
3,900,000
3,950,000
4,000,000
4,050,000
4,100,000
2011-2012 2012-2013 2013-2014
3,941,846
4,099,833
3,947,454
Operations and Maintenance Expenditures
9/10/2013 1:24 PM Sumexpen.xlsx Page 11 of 24

USD# 253
Transportation Expenditures (2700)
% %
2011-2012 2012-2013 inc/ 2013-2014 inc/
Actual Actual dec Budget dec
General 1,191,495 1,238,700 4% 1,144,061 -8%
Federal Funds 9,120 2,319 -75% 2,500 8%
Supplemental General 0 0 0% 0 0%
At Risk (4yr Old) 128,432 0 -100% 140,950 0%
At Risk (K-12) 0 128,749 0% 0 -100%
Bilingual Education 0 0 0% 0 0%
Virtual Education 0 0 0% 0 0%
Capital Outlay 217,500 82,510 -62% 200,000 142%
Driver Training 0 0 0% 0 0%
Declining Enrollment 0 0 0% 0 0%
Extraordinary School Program 0 0 0% 0 0%
Food Service 0 0 0% 0 0%
Professional Development 0 0 0% 0 0%
Parent Education Program 0 0 0% 0 0%
Summer School 0 0 0% 0 0%
Special Education 280,224 347,019 24% 542,000 56%
Cost of Living 0 0 0% 0 0%
Vocational Education 0 0 0% 0 0%
Gifts/Grants 0 0 0% 0 0%
Special Liability 0 0 0% 0 0%
School Retirement 0 0 0% 0 0%
Extraordinary Growth Facilities 0 0 0% 0 0%
Special Reserve 0 0 0%
KPERS Spec. Ret. Contribution 123,232 107,647 -13% 120,272 12%
Contingency Reserve 0 0 0%
Text Book & Student Material 0 0 0%
Activity Fund 0 1,972 0%
Bond and Interest #1 0 0 0% 0 0%
Bond and Interest #2 0 0 0% 0 0%
No-Fund Warrant 0 0 0% 0 0%
Special Assessment 0 0 0% 0 0%
Temporary Note 0 0 0% 0 0%
SUBTOTAL 1,950,003 1,908,916 -2% 2,149,783 13%
Enrollment (FTE)* 4,645.0 4,645.0 0% 4,635.0 0%
Amount per Pupil 420 411 -2% 464 13%
Adult Education 0 0 0% 0 0%
Adult Supplemental Education 0 0 0% 0 0%
Tuition Reimbursement 0 0 0% 0 0%
Special Education Coop 476 405 -15% 2,500 517%
TOTAL 1,950,479 1,909,321 -2% 2,152,283 13%
NOTE: Gifts/Grants includes private grants and grants from nonfederal sources.
Amount per pupil excludes the following funds: Adult Education, Adult Supplemental Education, Special Education Coop
and Tuition Reimbursement.
*Enrollment (FTE) includes the enrollment of the district used for state aid and budget authority, and all other preschool enrollment
and kindergarten students attending full time.
1,750,000
1,800,000
1,850,000
1,900,000
1,950,000
2,000,000
2,050,000
2,100,000
2,150,000
2,200,000
2011-2012 2012-2013 2013-2014
1,950,479
1,909,321
2,152,283
Transportation Expenditures
9/10/2013 1:24 PM Sumexpen.xlsx Page 12 of 24

USD# 253
Food Services Expenditures (3100)
% %
2011-2012 2012-2013 inc/ 2013-2014 inc/
Actual Actual dec Budget dec
General 0 0 0% 0 0%
Federal Funds 0 0 0% 0 0%
Supplemental General 0 0 0% 0 0%
At Risk (4yr Old) 0 0 0% 0 0%
At Risk (K-12) 0 0 0% 0 0%
Bilingual Education 0 0 0% 0 0%
Virtual Education 0 0 0% 0 0%
Capital Outlay 0 0 0% 0 0%
Driver Training 0 0 0% 0 0%
Declining Enrollment 0 0 0% 0 0%
Extraordinary School Program 0 0 0% 0 0%
Food Service 2,150,178 2,287,921 6% 2,531,899 11%
Professional Development 0 0 0% 0 0%
Parent Education Program 0 0 0% 0 0%
Summer School 0 0 0% 0 0%
Special Education 0 0 0% 0 0%
Cost of Living 0 0 0% 0 0%
Vocational Education 0 0 0% 0 0%
Gifts/Grants 0 0 0% 0 0%
Special Liability 0 0 0% 0 0%
School Retirement 0 0 0% 0 0%
Extraordinary Growth Facilities 0 0 0% 0 0%
Special Reserve 0 0 0%
KPERS Spec. Ret. Contribution 93,135 84,299 -9% 101,028 20%
Contingency Reserve 0 0 0%
Text Book & Student Material 0 0 0%
Activity Fund 0 0 0%
Bond and Interest #1 0 0 0% 0 0%
Bond and Interest #2 0 0 0% 0 0%
No-Fund Warrant 0 0 0% 0 0%
Special Assessment 0 0 0% 0 0%
Temporary Note 0 0 0% 0 0%
SUBTOTAL 2,243,313 2,372,220 6% 2,632,927 11%
Enrollment (FTE)* 4,645.0 4,645.0 0% 4,635.0 0%
Amount per Pupil 483 511 6% 568 11%
Adult Education 0 0 0% 0 0%
Adult Supplemental Education 0 0 0% 0 0%
Tuition Reimbursement 0 0 0% 0 0%
Special Education Coop 0 0 0% 0 0%
TOTAL 2,243,313 2,372,220 6% 2,632,927 11%
NOTE: Gifts/Grants includes private grants and grants from nonfederal sources.
Amount per pupil excludes the following funds: Adult Education, Adult Supplemental Education, Special Education Coop
and Tuition Reimbursement.
*Enrollment (FTE) includes the enrollment of the district used for state aid and budget authority, and all other preschool enrollment
and kindergarten students attending full time.
2,000,000
2,100,000
2,200,000
2,300,000
2,400,000
2,500,000
2,600,000
2,700,000
2011-2012 2012-2013 2013-2014
2,243,313
2,372,220
2,632,927
Food Service Expenditures
9/10/2013 1:24 PM Sumexpen.xlsx Page 13 of 24

USD# 253
Other Costs
(2500 & 2900: Other Supplemental Services)
(3300: Community Services Operations)
% %
2011-2012 2012-2013 inc/ 2013-2014 inc/
Actual Actual dec Budget dec
General 0 0 0% 0 0%
Federal Funds 0 0 0% 0 0%
Supplemental General 414,225 523,168 26% 540,261 3%
At Risk (4yr Old) 0 0 0% 0 0%
At Risk (K-12) 0 0 0% 0 0%
Bilingual Education 0 0 0% 0 0%
Virtual Education 0 0 0% 0 0%
Capital Outlay 3,665 0 -100% 20,000 0%
Driver Training 0 0 0% 0 0%
Declining Enrollment 0 0 0% 0 0%
Extraordinary School Program 0 0 0% 0 0%
Food Service 0 0 0% 0 0%
Professional Development 0 0 0% 0 0%
Parent Education Program 0 0 0% 0 0%
Summer School 0 0 0% 0 0%
Special Education 0 0 0% 0 0%
Cost of Living 0 0 0% 0 0%
Vocational Education 0 0 0% 0 0%
Gifts/Grants 0 0 0% 0 0%
Special Liability 0 0 0% 0 0%
School Retirement 0 0 0% 0 0%
Extraordinary Growth Facilities 0 0 0% 0 0%
Special Reserve 0 0 0%
KPERS Spec. Ret. Contribution 50,288 42,030 -16% 44,125 5%
Contingency Reserve 0 0 0%
Text Book & Student Material 0 0 0%
Activity Fund 0 0 0% 0 0%
Bond and Interest #1 0 0 0% 0 0%
Bond and Interest #2 0 0 0% 0 0%
No-Fund Warrant 0 0 0% 0 0%
Special Assessment 0 0 0% 0 0%
Temporary Note 0 0 0% 0 0%
SUBTOTAL 468,178 565,198 21% 604,386 7%
Enrollment (FTE)* 4,645.0 4,645.0 0% 4,635.0 0%
Amount per Pupil 101 122 21% 130 7%
Adult Education 0 0 0% 0 0%
Adult Supplemental Education 0 0 0% 0 0%
Tuition Reimbursement 0 0 0% 0 0%
Special Education Coop 0 0 0% 0 0%
TOTAL 468,178 565,198 21% 604,386 7%
NOTE: Gifts/Grants includes private grants and grants from nonfederal sources.
Amount per pupil excludes the following funds: Adult Education, Adult Supplemental Education, Special Education Coop
and Tuition Reimbursement.
*Enrollment (FTE) includes the enrollment of the district used for state aid and budget authority, and all other preschool enrollment
and kindergarten students attending full time.
0
100,000
200,000
300,000
400,000
500,000
600,000
700,000
2011-2012 2012-2013 2013-2014
468,178
565,198 604,386
Other Costs
9/10/2013 1:24 PM Sumexpen.xlsx Page 14 of 24

USD# 253
Capital Improvements Expenditures (4000)
% %
2011-2012 2012-2013 inc/ 2013-2014 inc/
Actual Actual dec Budget dec
General 0 0 0% 0 0%
Federal Funds 0 0 0% 0 0%
Supplemental General 14,678 7,040 -52% 0 -100%
At Risk (4yr Old) 0 0 0% 0 0%
At Risk (K-12) 0 0 0% 0 0%
Bilingual Education 0 0 0% 0 0%
Virtual Education 0 0 0% 0 0%
Capital Outlay 349,853 41,924 -88% 1,000,216 2286%
Driver Training 0 0 0% 0 0%
Declining Enrollment 0 0 0% 0 0%
Extraordinary School Program 0 0 0% 0 0%
Food Service 0 0 0% 0 0%
Professional Development 0 0 0% 0 0%
Parent Education Program 0 0 0% 0 0%
Summer School 0 0 0% 0 0%
Special Education 0 0 0% 0 0%
Cost of Living 0 0 0% 0 0%
Vocational Education 0 0 0% 0 0%
Gifts/Grants 0 0 0% 0 0%
Special Liability 0 0 0% 0 0%
School Retirement 0 0 0% 0 0%
Extraordinary Growth Facilities 0 0 0% 0 0%
Special Reserve 0 0 0%
KPERS Spec. Ret. Contribution 0 0 0% 0 0%
Contingency Reserve 0 0 0%
Text Book & Student Material 0 0 0%
Activity Fund 0 0 0% 0 0%
Bond and Interest #1 0 0 0% 0 0%
Bond and Interest #2 0 0 0% 0 0%
No-Fund Warrant 0 0 0% 0 0%
Special Assessment 0 0 0% 0 0%
Temporary Note 0 0 0% 0 0%
SUBTOTAL 364,531 48,964 -87% 1,000,216 1943%
Enrollment (FTE)* 4,645.0 4,645.0 0% 4,635.0 0%
Amount per Pupil 78 11 -87% 216 1947%
Adult Education 0 0 0% 0 0%
Adult Supplemental Education 0 0 0% 0 0%
Tuition Reimbursement 0 0 0% 0 0%
Special Education Coop 0 0 0% 0 0%
TOTAL 364,531 48,964 -87% 1,000,216 1943%
NOTE: Gifts/Grants includes private grants and grants from nonfederal sources.
Amount per pupil excludes the following funds: Adult Education, Adult Supplemental Education, Special Education Coop
and Tuition Reimbursement.
*Enrollment (FTE) includes the enrollment of the district used for state aid and budget authority, and all other preschool enrollment
and kindergarten students attending full time.
0
200,000
400,000
600,000
800,000
1,000,000
1,200,000
2011-2012 2012-2013 2013-2014
364,531
48,964
1,000,216
Capital Improvements (4000)
9/10/2013 1:24 PM Sumexpen.xlsx Page 15 of 24

USD# 253
Debt Services Expenditures (5100)
% %
2011-2012 2012-2013 inc/ 2013-2014 inc/
Actual Actual dec Budget dec
General 0 0 0% 0 0%
Federal Funds 0 0 0% 0 0%
Supplemental General 0 0 0% 0 0%
At Risk (4yr Old) 0 0 0% 0 0%
At Risk (K-12) 0 0 0% 0 0%
Bilingual Education 0 0 0% 0 0%
Virtual Education 0 0 0% 0 0%
Capital Outlay 653,350 497,946 -24% 600,000 20%
Driver Training 0 0 0% 0 0%
Declining Enrollment 0 0 0% 0 0%
Extraordinary School Program 0 0 0% 0 0%
Food Service 0 0 0% 0 0%
Professional Development 0 0 0% 0 0%
Parent Education Program 0 0 0% 0 0%
Summer School 0 0 0% 0 0%
Special Education 0 0 0% 0 0%
Cost of Living 0 0 0% 0 0%
Vocational Education 0 0 0% 0 0%
Gifts/Grants 0 0 0% 0 0%
Special Liability 0 0 0% 0 0%
School Retirement 0 0 0% 0 0%
Extraordinary Growth Facilities 0 0 0% 0 0%
Special Reserve 0 0 0%
KPERS Spec. Ret. Contribution 0 0 0% 0 0%
Contingency Reserve 0 0 0%
Text Book & Student Material 0 0 0%
Activity Fund 0 0 0% 0 0%
Bond and Interest #1 3,385,623 3,345,343 -1% 2,955,364 -12%
Bond and Interest #2 0 0 0% 0 0%
No-Fund Warrant 0 0 0% 0 0%
Special Assessment 0 0 0% 0 0%
Temporary Note 0 0 0% 0 0%
SUBTOTAL 4,038,973 3,843,289 -5% 3,555,364 -7%
Enrollment (FTE)* 4,645.0 4,645.0 0% 4,635.0 0%
Amount per Pupil 870 827 -5% 767 -7%
Adult Education 0 0 0% 0 0%
Adult Supplemental Education 0 0 0% 0 0%
Tuition Reimbursement 0 0 0% 0 0%
Special Education Coop 0 0 0% 0 0%
TOTAL 4,038,973 3,843,289 -5% 3,555,364 -7%
NOTE: Gifts/Grants includes private grants and grants from nonfederal sources.
Amount per pupil excludes the following funds: Adult Education, Adult Supplemental Education, Special Education Coop
and Tuition Reimbursement.
*Enrollment (FTE) includes the enrollment of the district used for state aid and budget authority, and all other preschool enrollment
and kindergarten students attending full time.
3,300,000
3,400,000
3,500,000
3,600,000
3,700,000
3,800,000
3,900,000
4,000,000
4,100,000
2011-2012 2012-2013 2013-2014
4,038,973
3,843,289
3,555,364
Deb Services (5100)
9/10/2013 1:24 PM Sumexpen.xlsx Page 16 of 24

USD# 253
Transfers (5200)
% %
2011-2012 2012-2013 inc/ 2013-2014 inc/
Actual Actual dec Budget dec
General 11,366,406 12,564,796 11% 12,211,312 -3%
Federal Funds 0 0 0% 0 0%
Supplemental General 1,115,263 512,946 -54% 85,518 -83%
At Risk (4yr Old) 0 0 0% 0 0%
At Risk (K-12) 0 0 0% 0 0%
Bilingual Education 0 0 0% 0 0%
Virtual Education 0 0 0% 0 0%
Capital Outlay
Driver Training 24,170 0 -100% 0 0%
Declining Enrollment 0 0 0% 0 0%
Extraordinary School Program 0 0 0% 0 0%
Food Service 0 0 0% 0 0%
Professional Development 0 0 0% 0 0%
Parent Education Program 0 0 0% 0 0%
Summer School 0 100,000 0% 0 -100%
Special Education 0 0 0% 0 0%
Cost of Living 0 0 0% 0 0%
Vocational Education 0 0 0% 0 0%
Gifts/Grants 0 0 0% 0 0%
Special Liability 0 0 0% 0 0%
School Retirement 0 0 0% 0 0%
Extraordinary Growth Facilities 0 0 0% 0 0%
Special Reserve 0 0 0%
KPERS Spec. Ret. Contribution 0 0 0% 0 0%
Contingency Reserve 0 0 0% 0 0%
Text Book & Student Material 0 0 0% 0 0%
Activity Fund 0 0 0% 0 0%
Bond and Interest #1 0 0 0% 0 0%
Bond and Interest #2 0 0 0% 0 0%
No-Fund Warrant 0 0 0% 0 0%
Special Assessment 0 0 0% 0 0%
Temporary Note 0 0 0% 0 0%
SUBTOTAL 12,505,839 13,177,742 5% 12,296,830 -7%
Enrollment (FTE)* 4,645.0 4,645.0 0% 4,635.0 0%
Amount per Pupil 2,692 2,837 5% 2,653 -6%
Adult Education 0 0 0% 0 0%
Adult Supplemental Education 0 0 0% 0 0%
Tuition Reimbursement 0 0 0% 0 0%
Special Education Coop 0 0 0% 0 0%
TOTAL 12,505,839 13,177,742 5% 12,296,830 -7%
NOTE: Gifts/Grants includes private grants and grants from nonfederal sources.
Amount per pupil excludes the following funds: Adult Education, Adult Supplemental Education, Special Education Coop
and Tuition Reimbursement.
*Enrollment (FTE) includes the enrollment of the district used for state aid and budget authority, and all other preschool enrollment
and kindergarten students attending full time.
11,800,000
12,000,000
12,200,000
12,400,000
12,600,000
12,800,000
13,000,000
13,200,000
2011-2012 2012-2013 2013-2014
12,505,839
13,177,742
12,296,830
Transfers (5200)
9/10/2013 1:24 PM Sumexpen.xlsx Page 17 of 24

USD# 253
Miscellaneous Information
Unencumbered Cash Balance by Fund
July 1, 2011 July 1, 2012 July 1, 2013
General 0 0 0
Federal Funds -184,224 -193,322 -211,950
Supplemental General 88,325 239,596 115,929
At Risk (4yr Old) 100,000 100,000 100,000
At Risk (K-12) 100,000 100,000 100,000
Bilingual Education 100,000 100,000 100,000
Virtual Education 0 0 50,000
Capital Outlay 2,686,606 2,309,867 2,468,936
Driver Training 24,170 0 0
Declining Enrollment 0 0 0
Extraordinary School Program 240,000 243,077 242,164
Food Service 206,482 324,481 254,080
Professional Development 450,000 450,183 450,969
Parent Education Program 0 0 0
Summer School 216,708 211,277 105,042
Special Education 1,520,321 1,640,762 1,679,225
Cost of Living 0 0 0
Vocational Education 100,000 100,000 105,060
Gifts/Grants 64,746 97,236 69,454
Special Liability 0 0 0
School Retirement 0 0 0
Extraordinary Growth Facilities 0 0 0
Special Reserve 0 0 0
KPERS Spec. Ret. Contribution 0 0 0
Contingency Reserve 2,106,814 2,106,814 1,937,867
Text Book & Student Material 302,342 272,681 407,682
Activity Fund 19,641 41,381 34,214
Bond and Interest #1 2,538,816 2,132,437 2,112,896
Bond and Interest #2 0 0 0
No Fund Warrant 0 0 0
Special Assessment 0 0 0
Temporary Note 0 0 0
SUBTOTAL 10,680,747 10,276,470 10,121,568
Enrollment (FTE)* 4,645.0 4,645.0 4,635.0
Amount per Pupil 2,299 2,212 2,184
Adult Education 361 0 1,591
Adult Supplemental Education 0 0 0
Tuition Reimbursement 0 0 0
Special Education Coop 2,045,399 881,870 516,608
TOTAL 12,726,507 11,158,340 10,639,767
NOTE: Gifts/Grants includes private grants and grants from nonfederal sources.
Amount per pupil excludes the following funds: Adult Education, Adult Supplemental Education, Special Education Coop
and Tuition Reimbursement.
*Enrollment (FTE) includes the enrollment of the district used for state aid and budget authority, and all other preschool enrollment
and kindergarten students attending full time.
0
2,000,000
4,000,000
6,000,000
8,000,000
10,000,000
12,000,000
14,000,000
July 1, 2011 July 1, 2012 July 1, 2013
12,726,507
11,158,340 10,639,767
Unencumbered Cash Balances by Fund
9/10/2013 1:24 PM Sumexpen.xlsx Page 18 of 24

USD# 253
Reserve Funds
Unencumbered Cash Balance
July 1, 2011 July 1, 2012 July 1, 2013
Special Reserve 0 0 0
TOTAL OTHER 0 0 0
Amount per Pupil $0 $0 $0
*School districts are authorized by law to self insure rather than purchase insurance for the following categories: Worker's Comp,
Health Insurance, Life Insurance, Property and Casualty (Risk Management) and Disability Income Insurance. Monies are placed
in the Self Insured Fund to pay for claims which may arise from the categories listed above.
0
0
0
0
0
1
1
1
1
1
1
July 1, 2011 July 1, 2012 July 1, 2013
0 0 0
Unencumbered Cash Balances by Fund (Reserve Funds Only)
9/10/2013 1:24 PM Sumexpen.xlsx Page 19 of 24

USD# 253
2009-2010 2010-2011 % 2011-2012 % 2012-2013 % 2013-2014 %
Actual Actual inc/ Actual inc/ Actual inc/ Budget inc/
dec dec dec dec
Enrollment (FTE)* 4,180.8 4,196.5 0% 4,191.1 0% 4,179.6 0% 4,190.0 0%
Enrollment (FTE)** 4,650.0 4,629.0 0% 4,645.0 0% 4,645.0 0% 4,635.0 0%
Number of Students -
Free Meals 2,445 2,569 5% 2,664 4% 2,665 0% 2,680 1%
Number of Students -
Reduced Meals 482 485 1% 535 10% 497 -7% 465 -6%
*FTE for state aid and budget authority purposes for general fund (excludes 4 yr old at-risk).
** FTE includes 9/20 enrollment used for state aid purposes and adding the additional FTE for preschool programs, headstart, and all-day
kindergarten. For example, preschool students attending half days on September 20th would be counted as .5 FTE. Kindergarten
students attending full time every day would be counted as 1.0 FTE.
Enrollment Information
4615.0
4620.0
4625.0
4630.0
4635.0
4640.0
4645.0
4650.0
2009-2010 2010-2011 2011-2012 2012-2013 2013-2014
4650.0
4629.0
4645.0 4645.0
4635.0
Enrollment (FTE)** Used for Calculating "Amount per Pupil"
0
500
1000
1500
2000
2500
3000
2009-2010 2010-2011 2011-2012 2012-2013 2013-2014
2445 2569 2664 2665 2680
482 485 535 497 465
Low Income Students
Free Meals
Reduced Meals
4170.0
4175.0
4180.0
4185.0
4190.0
4195.0
4200.0
2009-2010 2010-2011 2011-2012 2012-2013 2013-2014
4180.8
4196.5
4191.1
4179.6
4190.0
FTE Enrollment for Budget Authority
9/10/2013 1:24 PM Sumexpen.xlsx Page 20 of 24

USD# 253
Miscellaneous Information
Mill Rates by Fund
2011-2012 2012-2013 2013-2014
Actual Actual Budget
General 20.000 20.000 20.000
Supplemental General 23.446 22.480 24.023
Adult Education 0.498 0.500 0.000
Capital Outlay 0.000 0.000 0.000
Declining Enrollment 0.000 0.000 0.000
Cost of Living 0.000 0.000 0.000
Special Liability 0.000 0.000 0.000
School Retirement 0.000 0.000 0.000
Extraordinary Growth Facilities 0.000 0.000 0.000
Bond and Interest #1 9.112 10.033 9.585
Bond and Interest #2 0.000 0.000 0.000
No Fund Warrant 0.000 0.000 0.000
Special Assessment 0.000 0.000 0.000
Temporary Note 0.000 0.000 0.000
TOTAL USD 53.056 53.013 53.608
Historical Museum 0.000 0.000 0.000
Public Library Board 0.000 0.000 0.000
Public Library Brd & Emp Benf 0.000 0.000 0.000
Recreation Commission 6.471 6.500 6.500
Rec Comm Employee Bnfts 0.890 0.890 1.273
TOTAL OTHER 7.361 7.390 7.773
0.000
10.000
20.000
30.000
40.000
50.000
60.000
70.000
80.000
2011-2012 2012-2013 2013-2014
53.056 53.013 53.608
Total USD Mill Rates
General 37%
Supplemental General 45%
Bond and Interest #1 18%
2013-14 Miscellaneous Information Mill Rates by Fund (Total USD)
General
Supplemental General
Adult Education
Capital Outlay
Special Liability
School Retirement
Declining Enrollment
Cost of Living
Bond and Interest #1
Bond and Interest #2
Extraordinary Growth Facilities
No Fund Warrant
Special Assessment
Temporary Note
9/10/2013 1:24 PM Sumexpen.xlsx Page 21 of 24

USD# 253
Other Information
2011-2012 2012-2013 2013-2014
Actual Actual Budget
Assessed Valuation $166,738,005 $167,747,311 $171,036,302
Bonded Indebtedness $27,695,000 $25,275,000 $22,800,000
$164,000,000
$165,000,000
$166,000,000
$167,000,000
$168,000,000
$169,000,000
$170,000,000
$171,000,000
$172,000,000
2011-2012 2012-2013 2013-2014
$166,738,005
$167,747,311
$171,036,302
Assessed Valuation
$0
$5,000,000
$10,000,000
$15,000,000
$20,000,000
$25,000,000
$30,000,000
2011-2012 2012-2013 2013-2014
$27,695,000
$25,275,000
$22,800,000
Bonded Indebtedness
9/10/2013 1:24 PM Sumexpen.xlsx Page 22 of 24

USD 253
2013-14 Estimated Sources of Revenue--2013-14 Estimated
Amount July 1, 2013 State Federal Local July 1, 2014
Fund Budgeted Cash Balance Interest Transfers Other Cash Balance
General 29,227,521 0 26,332,628 0 0 2,894,893 XXXXXXXX
Supplemental General 8,855,060 115,929 4,432,878 4,306,253 XXXXXXXX
Adult Education 103,574 1,591 0 0 0 85518 16,465 0
At Risk (4yr Old) 591,773 100,000 0 0 491,773 0 0
Adult Supplemental Education 0 0 0 0 0 0
At Risk (K-12) 5,544,263 100,000 0 0 5,444,263 0 0
Bilingual Education 1,852,650 100,000 0 0 1,752,650 0 0
Virtual Education 97,975 50,000 0 47,975 0 0
Capital Outlay 3,155,216 2,468,936 0 19,000 667,280 0 0
Driver Training 0 0 0 0 0 0 0 0
Declining Enrollment 0 0 0 0 XXXXXXXX
Extraordinary School Program 242,164 242,164 0 0 0 0 0
Food Service 2,644,520 254,080 22,960 1,811,332 0 0 556,148 0
Professional Development 450,969 450,969 0 0 0 0 0
Parent Education Program 0 0 0 0 0 0 0 0
Summer School 107,042 105,042 0 0 0 2,000 0
Special Education 5,185,563 1,679,225 0 0 0 3,506,338 0 0
Vocational Education 449,333 105,060 0 43,240 0 301,033 0 0
Special Liability Expense Fund 0 0 0 0 0
Special Reserve Fund 0 XXXXXXXX
Gifts and Grants 119,454 69,454 50,000 0
Textbook & Student Materials Revolving 407,682 XXXXXXXX
School Retirement 0 0 0 0 0
Extraordinary Growth Facilities 0 0 0 0 XXXXXXXXX
KPERS Special Retirement Contribution 3,616,623 0 3,616,623 XXXXXXXXX
Contingency Reserve 1,937,867 XXXXXXXXX
Activity Funds 34,214 XXXXXXXXX
Tuition Reimbursement 0 0 0 0 0
Bond and Interest #1 2,955,364 2,112,896 1,477,657 0 0 1,776,702 2,411,891
Bond and Interest #2 0 0 0 0 0 0 0
No Fund Warrant 0 0 0 0
Special Assessment 0 0 0 0
Temporary Note 0 0 0 0 0
Coop Special Education 10,327,725 516,608 0 2,800,000 0 7,011,117 0
Federal Funds 2,571,803 -211,950 xxxxxxxxxxx 2,783,753 xxxxxxxxxxxx xxxxxxxxxxxx xxxxxxxxxxx 0
Cost of Living 0 0 xxxxxxxxxxx xxxxxxxxxxx xxxxxxxxxxxx 0 0 XXXXXXXXX
SUBTOTAL 78,098,592 10,639,767 35,882,746 7,438,325 19,000 12,296,830 16,613,578 2,411,891
Less Transfers 12,296,830
TOTAL Budget Expenditures $65,801,762
2011-2012 2012-2013 2013-2014
State Revenues 34,485,895 34,794,914 35,882,746
Federal Revenues 5,356,423 6,081,875 7,438,325
Local Revenues 29,876,625 29,945,211 28,929,408
Total Revenues 69,718,943 70,822,000 72,250,479
Revenues Per Pupil 15,009 15,247 15,588
Sources of Revenue and Proposed Budget for 2013-14
Sources of Revenue - - State, Federal, Local

Intentionally left blank