2013 cornerstone mapping,...
TRANSCRIPT

© 2013 Cornerstone Mapping, Inc.

© 2013 Cornerstone Mapping, Inc.
What are the Available Sensor Platforms?
What do I need to know about Imagery?

© 2013 Cornerstone Mapping, Inc.
Sensor Platforms

© 2013 Cornerstone Mapping, Inc.
Approach to UAS
“Look‐and‐See”
Integrated Mapping

© 2013 Cornerstone Mapping, Inc.
Point‐and‐Shoot Camera
“Look‐and‐See”

© 2013 Cornerstone Mapping, Inc.
Point‐and‐Shoot Camera
“Warp‐and‐See”
• Lens distortion issues
• Oblique viewing issues
• Features can easily be 50‐100 feet off
• Should not be used for reliable mapping

© 2013 Cornerstone Mapping, Inc.
What can we Mount on a UAS ?
Color
Near‐Infrared (CIR)
Hyperspectral
Multispectral
Thermal
Easy to do.
Conversion kits available.
Limited camera options, generally low resolution.
Some options available. Best suited for research applications.
Several options. Low resolution.

© 2013 Cornerstone Mapping, Inc.
Utilize UAS for Field Mapping?
FAA regulations pending
Due sometime in 2015
Paid‐for‐ServiceLegally… NOT YET
Can fly Radio Control (RC) aircraft under “hobbyist” rules

© 2013 Cornerstone Mapping, Inc.
Are UAS Practical for Precision Ag Mapping?FAA Regulations
Maintain Line‐of‐Sight 400‐feet
300
200
100
Ground
Current RC Hobbyist Rules
* Refer to FAA rules for complete details

© 2013 Cornerstone Mapping, Inc.
High‐End UAS Systems Exist
Utilize UAS for Field Mapping?
Very Expensive
• Flying at 30 mph, ~19 min + turns• Swap battery packs (2‐3 times)• Flight time to/from landing site• Setup and teardown time
ONSITE TIME ~1‐hour per field
Drive time to each field??Post‐Processing Time??
Overhead Cost of Operation??
400‐Feet AGL6.6‐cm resolution19 Flight Lines
9.5 miles of Flying620 Images
160‐acre fieldFlight Plan
Are UAS always Practical?

© 2013 Cornerstone Mapping, Inc.
Limitations
• Hundreds of images to stitch together
• What is the final mosaic quality?
Utilize UAS for Field Mapping?
Pros
• Very high image resolution
• Use imagery for near instant visualization
© 2013 Cornerstone Mapping, Inc.
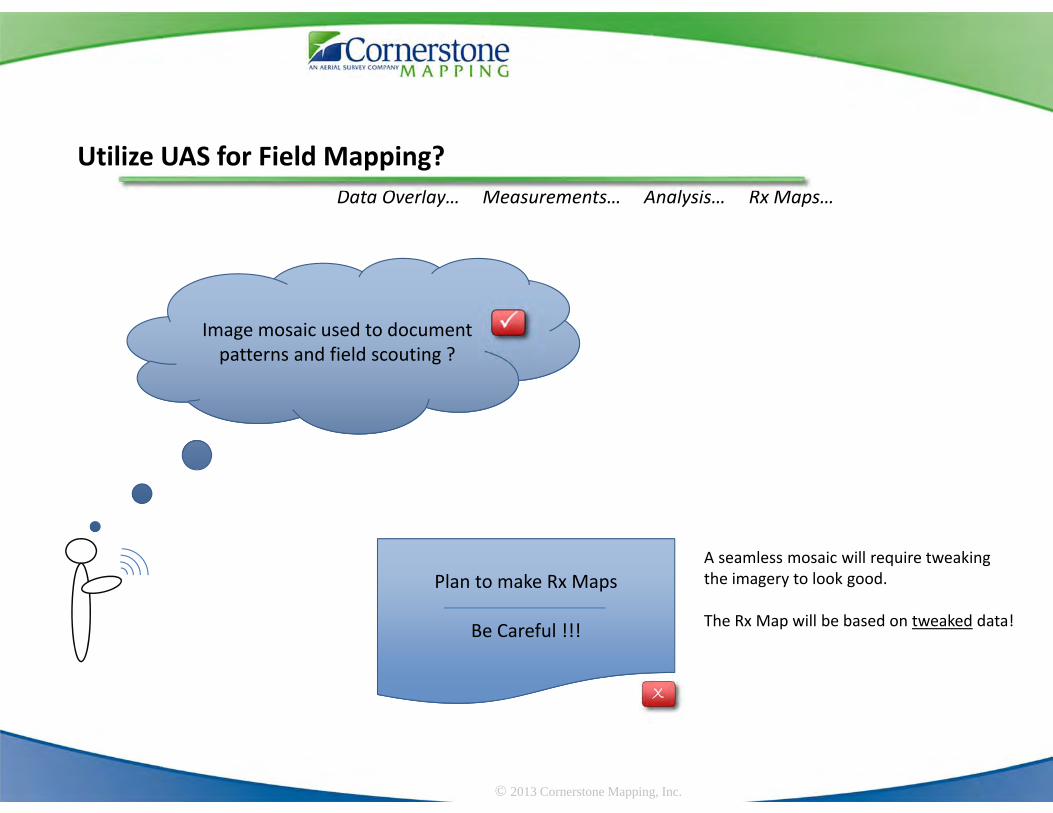
Data Overlay… Measurements… Analysis… Rx Maps…
Utilize UAS for Field Mapping?
Image mosaic used to document patterns and field scouting ?
X
Plan to make Rx Maps
Be Careful !!!
A seamless mosaic will require tweaking the imagery to look good.
The Rx Map will be based on tweaked data!

© 2013 Cornerstone Mapping, Inc.
Images line up well, but . . .
Mosaic quality is poor !
Uneven lighting and camera effects
Brighter in the middle
Darker around the edges
Low QualityUAS Mosaic
Quality of Camera & Software
Affect usability of Imagery

© 2013 Cornerstone Mapping, Inc.
Spatial Resolution
Pixel
Each pixel represents a defined size on the ground
6‐inch
1‐meter
5‐meter

© 2013 Cornerstone Mapping, Inc.
5‐meter 100% Zoom
Image Resolution is Important
1‐meter 100% Zoom 25‐cm 100% Zoom
1‐meter 4x Zoom5‐meter 20x Zoom

© 2013 Cornerstone Mapping, Inc.
Localized Operations . . . Good Potential to be Discovered
Regional Flexibility . . . Good Fit
Global Coverage . . . Some Viable Options
Manned Aircraft
UAS / UAV
Satellite
What are the Options?
Eye in the Sky

© 2013 Cornerstone Mapping, Inc.
Imagery for Precision Ag ?
What is the Science behind . . .

© 2013 Cornerstone Mapping, Inc.
Data Overlay… Measurements… Analysis… Rx Maps…
Precision Agriculture
Precision Agriculture is really about Problem Solving
Reduce inputs to increase savings
Increase yields to increase ROI
Profit

© 2013 Cornerstone Mapping, Inc.
When Should you Acquire Imagery ?problem solving
Depends on Purpose. . .
Natural VariabilitySoil Fertility, landscape position
Man-Made IssuesFarming Practices
Seasonal-Variable IssuesWind & Hail Damage, Insect Pressure, Disease

© 2013 Cornerstone Mapping, Inc.
Evaporative Cooling (heat transfer)
Remote Sensing in Agriculture
• Water Stress
• Nutrient Stress
• Tissue Damage (insects, disease, wind, hail)
Leaf Structure
Stomata OxygenWater
CO2

© 2013 Cornerstone Mapping, Inc.
Vegetation Response
Stressed Vegetation
400 500 600 700 nm 1100
Healthy Vegetation
ChlorophyllAbsorption
ChlorophyllAbsorption
Leaf StructureBiomass Indicator
Refle
ctan
ce
Plant Temperature
Blue RedGreen Near Infrared
3,000 5,000 8,000 14,000 nm
Radian
ce
ThermalThermal

© 2013 Cornerstone Mapping, Inc.
What is Infrared Aerial Photography?
400 500 600 700 nm 1100
Color Image
Color Infrared Image
Infrared Imagery is
RED in color
Blue RedGreen Near Infrared

© 2013 Cornerstone Mapping, Inc.
What is Thermal‐Infrared Imaging ?
It is a way to look at the heat signature of an object
Detection of thermal infrared energy (heat)

© 2013 Cornerstone Mapping, Inc.
Understand your needs
What Kind of Imagery Should I Use?
Be ready to use it
What is Your Application
Image Type / Quality Needs
Precision Ag Ready

© 2013 Cornerstone Mapping, Inc.
What Kind of Imagery to Use ?
Nutrients
Plant Color
Color Imagery
Cell Structure
Biomass / Nutrients / Water Stress
CIRImagery
Plant Temperature (stresses)
ThermalImagery

© 2013 Cornerstone Mapping, Inc.
0 20 40 60 80 100 120 140
0.3
0.2
0.1
0
Emergence
Tasseling Silking
Early Dent
Black LayerKnee High
Days After Planting
Daily W
ater Use (inche
s)
Corn Water Use
V‐Stage VT R‐Stage

© 2013 Cornerstone Mapping, Inc.
Temperatureand
Water StressCriticalGrowth
Corn Nitrogen Use
High
Low
N Uptake
Planting Silking Harvest
V‐Stage VT R‐Stage
Crop is too small to detectproblems from the air

© 2013 Cornerstone Mapping, Inc.
VT
Bare Soil
Weeds
Nitrogen Stress
Water Stress
Summary of Stresses
May June July 4th Aug Sept Oct
HarvestPlanting Irrigation Starts
Thermal
MSI MSI
MSI
MSI
ThermalMSI
When to Acquire Imagery

© 2013 Cornerstone Mapping, Inc.
Boost the Value of Imagery
Select the Right Image Type
Proper Timing of Acquisition
Enhance Imagery with Ratios

© 2013 Cornerstone Mapping, Inc.
Band Ratios
NDVI – Normalized Difference Vegetation Index
RedNIR
‐
+NDVI =
‐1 ‐0.5 0 0.5 1Data Range
Indicates Non‐Vegetative Features
RedNIR

© 2013 Cornerstone Mapping, Inc.
NDVI
Enhance crop vigor differences within a crop
Research Plots
Real‐World Field

© 2013 Cornerstone Mapping, Inc.
Color
Near‐Infrared (CIR)
NDVI
NIR, Red, Green
Red, Green, Blue4‐Ba
nd Im
agery
Thermal‐Infrared
Early Detectionof
Water Stress

© 2013 Cornerstone Mapping, Inc.
Thermal‐Infrared
100 300 bu/APivot nozzle issue fixed before permanent yield loss occurred
Yield Map
Yield Loss Prevented
Image taken mid‐July
7.6‐acres
1.5‐acres
Acres: 1.5 + 7.6 = 9.1Yield Loss per Acre: 25 bu/acTotal Yield Loss: 227 bushels
Potential Economic Loss @ $6 corn: $1,362

© 2013 Cornerstone Mapping, Inc.
Yield Map
Field Average156.1 bu/ac
Acres: 8.7Ave Yield: 18.2 bu/acYield Loss: 137.6 bu/acre
1,197 total bushelsEconomic Loss:@ $6 corn
Acres: 9.3Ave Yield: 128.8 bu/acYield Loss: 27.2 bu/ac
253 total bushelsEconomic Loss:@ $6 corn
$7,182
$1,518
Yield LossWater Stress

© 2013 Cornerstone Mapping, Inc.
Yield CorrelationWater Stress
Thermal image acquired 3 weeksafter irrigation season started
R2 = 0.91
Yield Map
high
low

© 2013 Cornerstone Mapping, Inc.
The Power to Visualize Patterns
Summary
To Increase Profits
Remote Sensing
Cornerstone MappingAaron Schepers8118 S 23rd CT
Lincoln, NE 68512(402) 450‐3194