2013 annual report of the investment …€¦ · · 2014-04-09$8,382 . 1) university of texas...
TRANSCRIPT

2013 ANNUAL REPORT OF THE INVESTMENT COMMITTEE
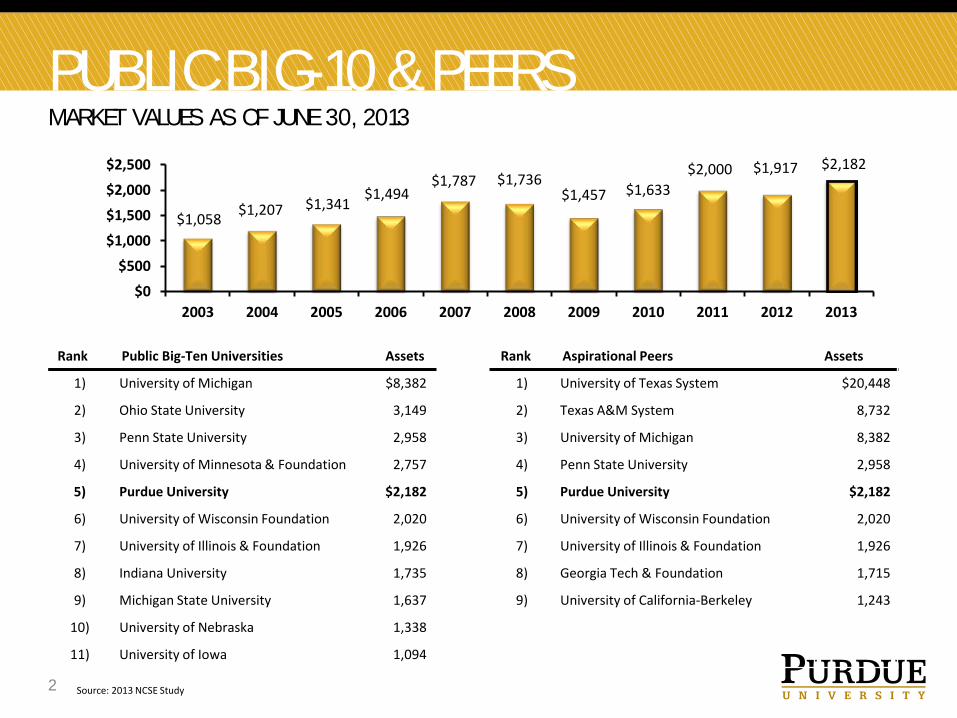
PUBLIC BIG-10 & PEERS MARKET VALUES AS OF JUNE 30, 2013
Source: 2013 NCSE Study 2
$1,058 $1,207 $1,341 $1,494
$1,787 $1,736 $1,457 $1,633
$2,000 $1,917 $2,182
$0
$500
$1,000
$1,500
$2,000
$2,500
2003 2004 2005 2006 2007 2008 2009 2010 2011 2012 2013
Rank Public Big-Ten Universities Assets Rank Aspirational Peers Assets
1) University of Michigan $8,382 1) University of Texas System $20,448
2) Ohio State University 3,149 2) Texas A&M System 8,732
3) Penn State University 2,958 3) University of Michigan 8,382
4) University of Minnesota & Foundation 2,757 4) Penn State University 2,958
5) Purdue University $2,182 5) Purdue University $2,182
6) University of Wisconsin Foundation 2,020 6) University of Wisconsin Foundation 2,020
7) University of Illinois & Foundation 1,926 7) University of Illinois & Foundation 1,926
8) Indiana University 1,735 8) Georgia Tech & Foundation 1,715
9) Michigan State University 1,637 9) University of California-Berkeley 1,243
10) University of Nebraska 1,338
11) University of Iowa 1,094
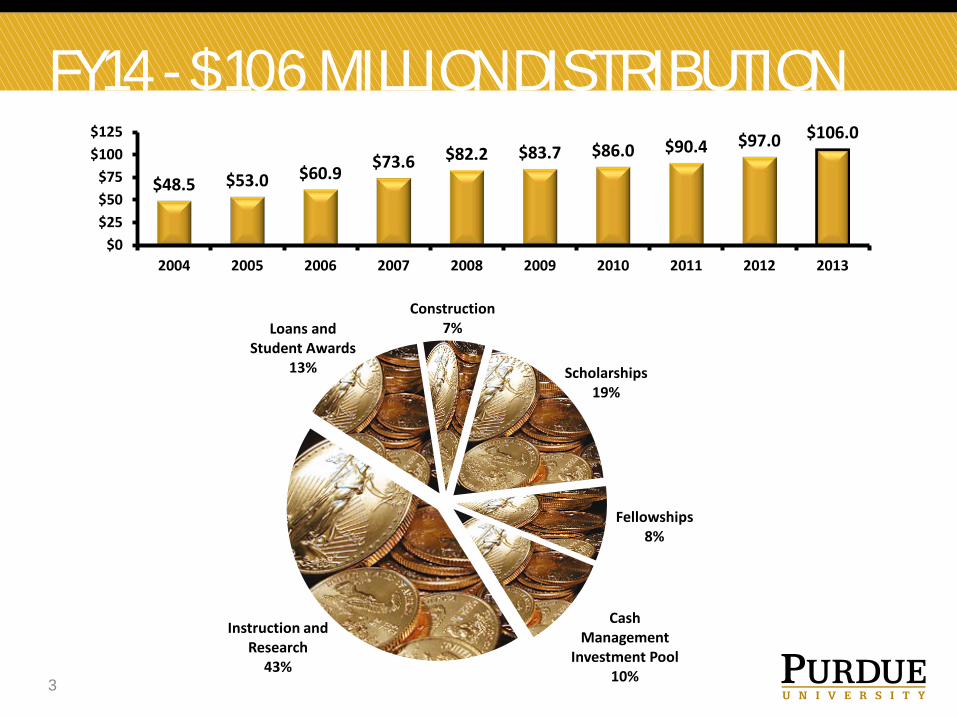
FY14 - $106 MILLION DISTRIBUTION
Instruction and Research
43%
Loans and Student Awards
13%
Construction 7%
Scholarships 19%
Fellowships 8%
Cash Management
Investment Pool 10% 3
$48.5 $53.0 $60.9 $73.6 $82.2 $83.7 $86.0 $90.4 $97.0 $106.0
$0$25$50$75
$100$125
2004 2005 2006 2007 2008 2009 2010 2011 2012 2013

FY 13 - INVESTMENT POLICY GOAL “PERFORMANCE BETTER THAN INFLATION PLUS SPENDING OF 5.0 PERCENT”
4
For Fiscal Years Ended June 30, 2013
6.4% 6.6% 6.2% 6.9% 6.4%
12.2% 10.6%
4.3%
7.7% 8.8%
0.0%
2.0%
4.0%
6.0%
8.0%
10.0%
12.0%
14.0%1-year 3-Years 5-Years 10-Years 20-Years
Inflation Plus Spending Purdue
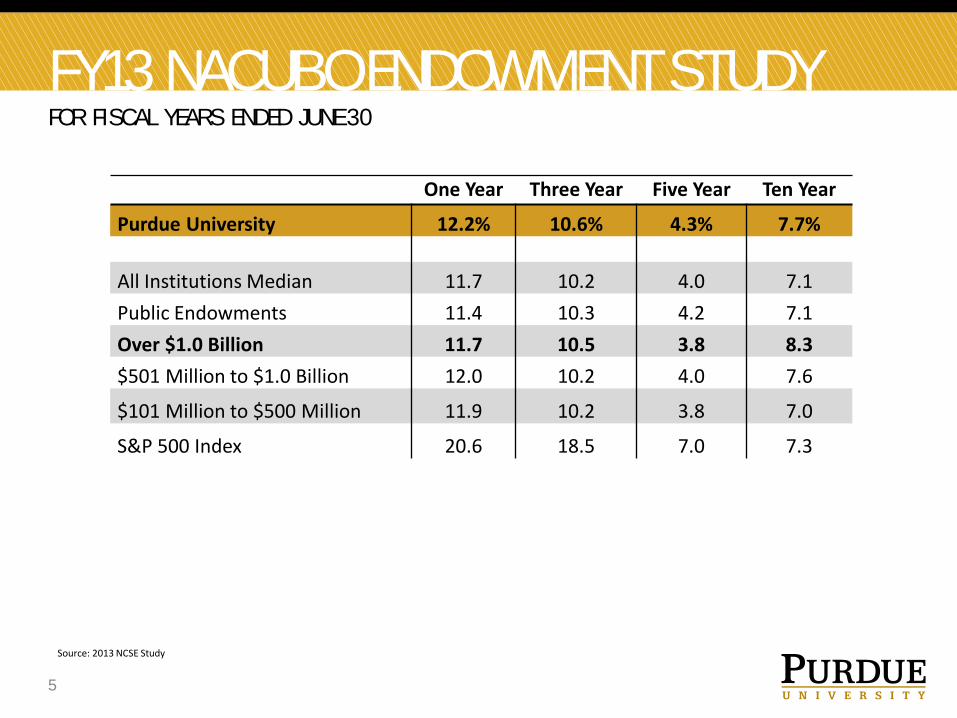
FY13 NACUBO ENDOWMENT STUDY FOR FISCAL YEARS ENDED JUNE 30
5
Source: 2013 NCSE Study
One Year Three Year Five Year Ten Year
Purdue University 12.2% 10.6% 4.3% 7.7%
All Institutions Median 11.7 10.2 4.0 7.1 Public Endowments 11.4 10.3 4.2 7.1 Over $1.0 Billion 11.7 10.5 3.8 8.3 $501 Million to $1.0 Billion 12.0 10.2 4.0 7.6
$101 Million to $500 Million 11.9 10.2 3.8 7.0
S&P 500 Index 20.6 18.5 7.0 7.3
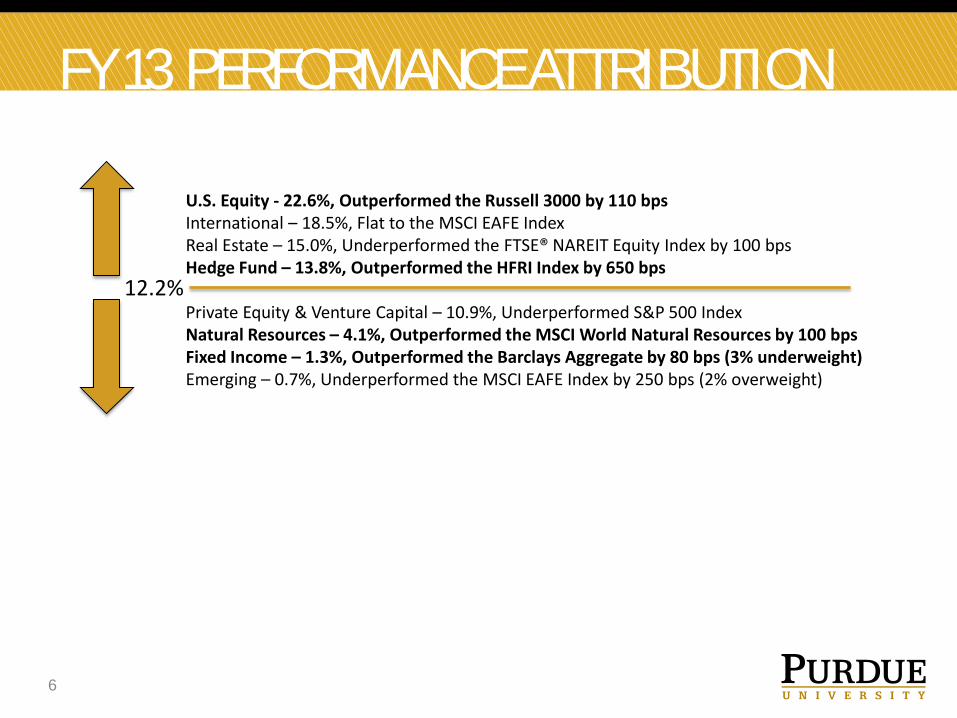
FY 13 PERFORMANCE ATTRIBUTION
U.S. Equity - 22.6%, Outperformed the Russell 3000 by 110 bps International – 18.5%, Flat to the MSCI EAFE Index Real Estate – 15.0%, Underperformed the FTSE® NAREIT Equity Index by 100 bps Hedge Fund – 13.8%, Outperformed the HFRI Index by 650 bps Private Equity & Venture Capital – 10.9%, Underperformed S&P 500 Index Natural Resources – 4.1%, Outperformed the MSCI World Natural Resources by 100 bps Fixed Income – 1.3%, Outperformed the Barclays Aggregate by 80 bps (3% underweight) Emerging – 0.7%, Underperformed the MSCI EAFE Index by 250 bps (2% overweight)
6
12.2%

FY 13 ASSET ALLOCATION Asset Class Policy
Targets Policy Range
Purdue Actual
Over $1.0 Billion
Over $1.0 Variance
U.S. Equity 18.0% 10-35% 21.7% 13.0% 8.7% Non-U.S. Equity 13.0 5-20% 12.5 10.0 2.5 Emerging Markets 5.0 0-10% 6.7 7.0 (0.3) Total Equities (18) 36.0 15-65% 40.9 30.0 10.9 Private Equity (13) 5.0 2.5-7.5% 5.8 15.0 (9.2) Venture Capital (8) 5.0 2.5-7.5% 3.7 4.0 (0.3) Hedge Funds (20) 25.0 10-30% 22.0 26.0 (4.0) Real Estate (5) 7.0 2-10% 5.3 8.0 (2.7) Natural Resources (8) 7.0 0-10% 7.1 6.0 1.1 Total Alternatives (54) 49.0 17-65% 43.9 59.0 (15.1) Fixed Income/Cash (4) 15.0 10-20% 15.2 11.0 4.2 TOTAL (76) 100.0% 100% 100.0%
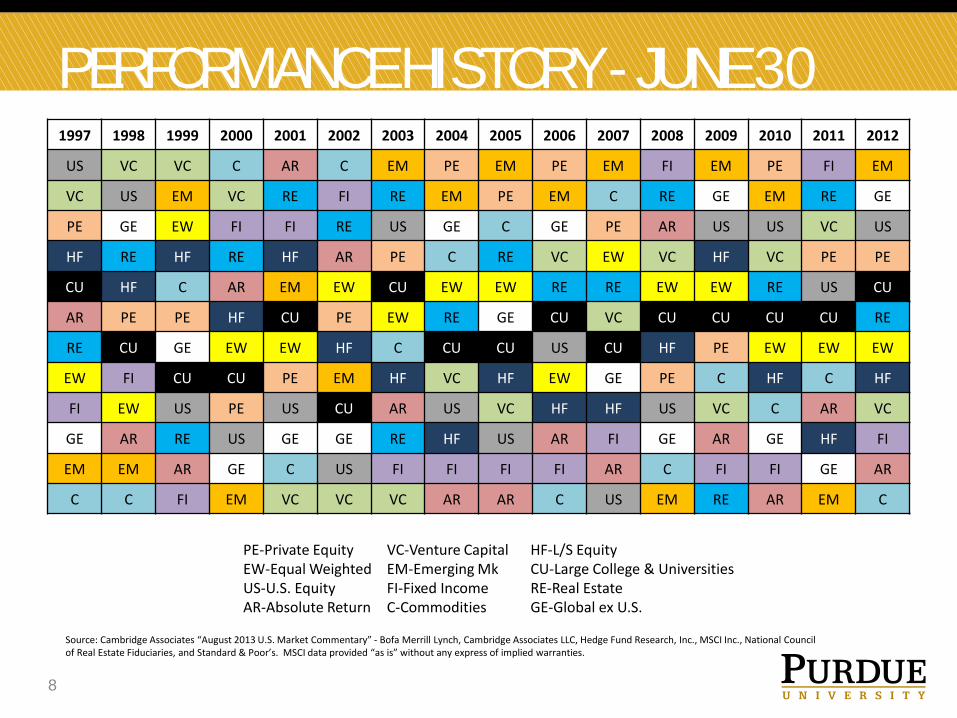
PERFORMANCE HISTORY - JUNE 30 1997 1998 1999 2000 2001 2002 2003 2004 2005 2006 2007 2008 2009 2010 2011 2012
US VC VC C AR C EM PE EM PE EM FI EM PE FI EM
VC US EM VC RE FI RE EM PE EM C RE GE EM RE GE
PE GE EW FI FI RE US GE C GE PE AR US US VC US
HF RE HF RE HF AR PE C RE VC EW VC HF VC PE PE
CU HF C AR EM EW CU EW EW RE RE EW EW RE US CU
AR PE PE HF CU PE EW RE GE CU VC CU CU CU CU RE
RE CU GE EW EW HF C CU CU US CU HF PE EW EW EW
EW FI CU CU PE EM HF VC HF EW GE PE C HF C HF
FI EW US PE US CU AR US VC HF HF US VC C AR VC
GE AR RE US GE GE RE HF US AR FI GE AR GE HF FI
EM EM AR GE C US FI FI FI FI AR C FI FI GE AR
C C FI EM VC VC VC AR AR C US EM RE AR EM C
PE-Private Equity VC-Venture Capital HF-L/S Equity EW-Equal Weighted EM-Emerging Mk CU-Large College & Universities US-U.S. Equity FI-Fixed Income RE-Real Estate AR-Absolute Return C-Commodities GE-Global ex U.S.
Source: Cambridge Associates “August 2013 U.S. Market Commentary” - Bofa Merrill Lynch, Cambridge Associates LLC, Hedge Fund Research, Inc., MSCI Inc., National Council of Real Estate Fiduciaries, and Standard & Poor’s. MSCI data provided “as is” without any express of implied warranties.
8
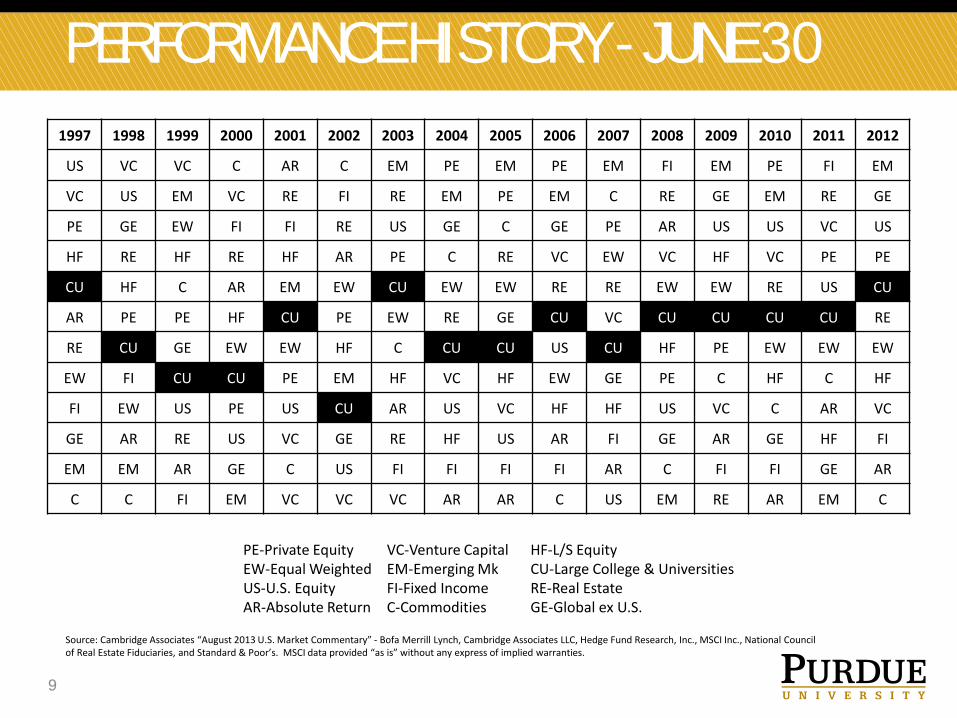
PERFORMANCE HISTORY - JUNE 30 1997 1998 1999 2000 2001 2002 2003 2004 2005 2006 2007 2008 2009 2010 2011 2012
US VC VC C AR C EM PE EM PE EM FI EM PE FI EM
VC US EM VC RE FI RE EM PE EM C RE GE EM RE GE
PE GE EW FI FI RE US GE C GE PE AR US US VC US
HF RE HF RE HF AR PE C RE VC EW VC HF VC PE PE
CU HF C AR EM EW CU EW EW RE RE EW EW RE US CU
AR PE PE HF CU PE EW RE GE CU VC CU CU CU CU RE
RE CU GE EW EW HF C CU CU US CU HF PE EW EW EW
EW FI CU CU PE EM HF VC HF EW GE PE C HF C HF
FI EW US PE US CU AR US VC HF HF US VC C AR VC
GE AR RE US VC GE RE HF US AR FI GE AR GE HF FI
EM EM AR GE C US FI FI FI FI AR C FI FI GE AR
C C FI EM VC VC VC AR AR C US EM RE AR EM C
PE-Private Equity VC-Venture Capital HF-L/S Equity EW-Equal Weighted EM-Emerging Mk CU-Large College & Universities US-U.S. Equity FI-Fixed Income RE-Real Estate AR-Absolute Return C-Commodities GE-Global ex U.S.
Source: Cambridge Associates “August 2013 U.S. Market Commentary” - Bofa Merrill Lynch, Cambridge Associates LLC, Hedge Fund Research, Inc., MSCI Inc., National Council of Real Estate Fiduciaries, and Standard & Poor’s. MSCI data provided “as is” without any express of implied warranties.
9
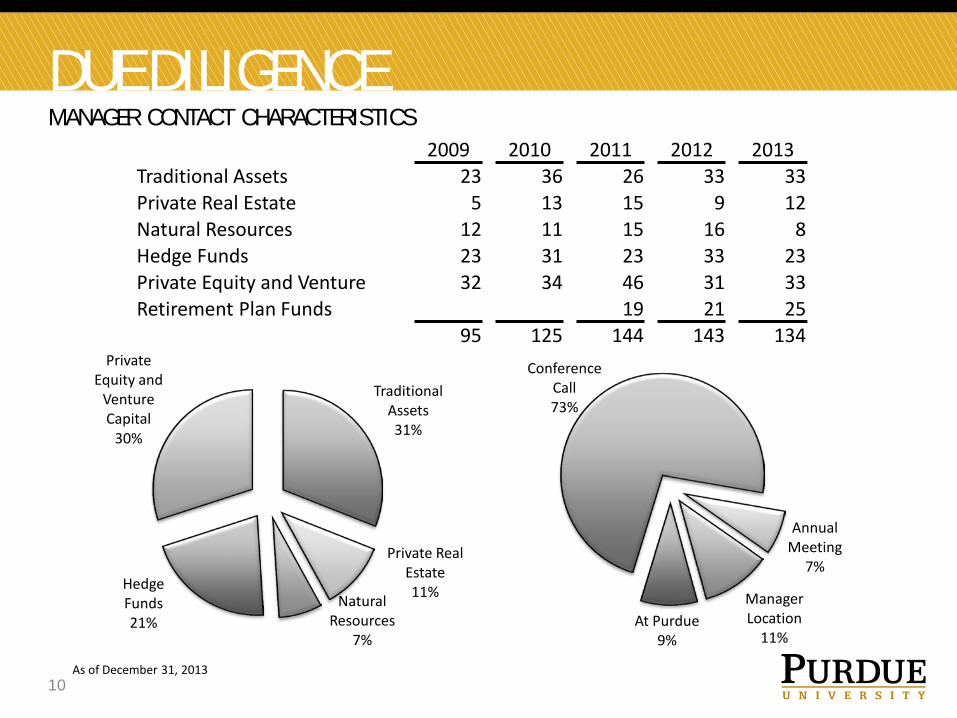
DUE DILIGENCE MANAGER CONTACT CHARACTERISTICS
2009 2010 2011 2012 2013 Traditional Assets 23 36 26 33 33 Private Real Estate 5 13 15 9 12 Natural Resources 12 11 15 16 8 Hedge Funds 23 31 23 33 23 Private Equity and Venture 32 34 46 31 33 Retirement Plan Funds 19 21 25
95 125 144 143 134
Traditional Assets 31%
Private Real Estate 11% Natural
Resources 7%
Hedge Funds 21%
Private Equity and
Venture Capital
30%
Conference Call 73%
Annual Meeting
7%
Manager Location
11% At Purdue
9%
10 As of December 31, 2013

CASH MANAGEMENT INVESTMENT POOL

CMIP CHARACTERISTICS
12
$926 $906 $928 $933 $998 $1,062 $992 $1,030 $1,110 $1,277 $1,217
$0
$250
$500
$750
$1,000
$1,250
$1,500
2003 2004 2005 2006 2007 2008 2009 2010 2011 2012 2013
CMIP Market Value
• Fixed income investment portfolio • Collects and invests operating funds
• Daily liquidity needs of the University • Dollar in dollar out - no risk to the participant
• Student fee and state appropriations restricted to fixed income by state statutes
• Internal loan program to match revenue and expenditures
• Self liquidity support for variable rate debt • General Fund Budget Support
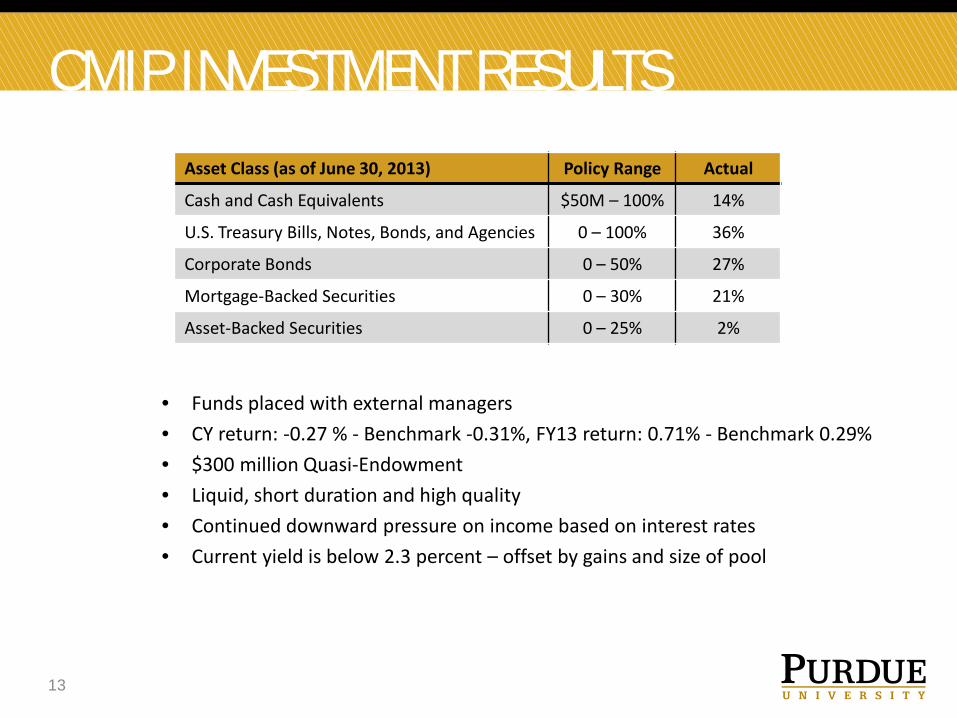
CMIP INVESTMENT RESULTS
• Funds placed with external managers • CY return: -0.27 % - Benchmark -0.31%, FY13 return: 0.71% - Benchmark 0.29% • $300 million Quasi-Endowment • Liquid, short duration and high quality • Continued downward pressure on income based on interest rates • Current yield is below 2.3 percent – offset by gains and size of pool
13
Asset Class (as of June 30, 2013) Policy Range Actual
Cash and Cash Equivalents $50M – 100% 14%
U.S. Treasury Bills, Notes, Bonds, and Agencies 0 – 100% 36%
Corporate Bonds 0 – 50% 27%
Mortgage-Backed Securities 0 – 30% 21%
Asset-Backed Securities 0 – 25% 2%